Embed Size (px)
Citation preview
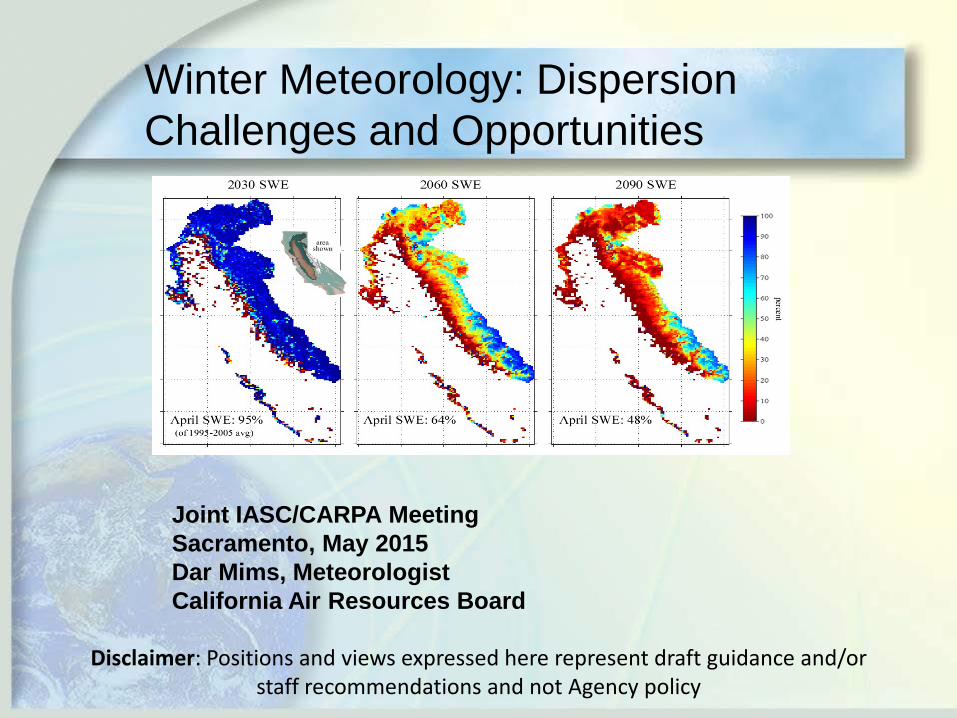
Winter Meteorology: Dispersion Challenges and Opportunities
Disclaimer: Positions and views expressed here represent draft guidance and/or staff recommendations and not Agency policy
Joint IASC/CARPA Meeting Sacramento, May 2015 Dar Mims, Meteorologist California Air Resources Board
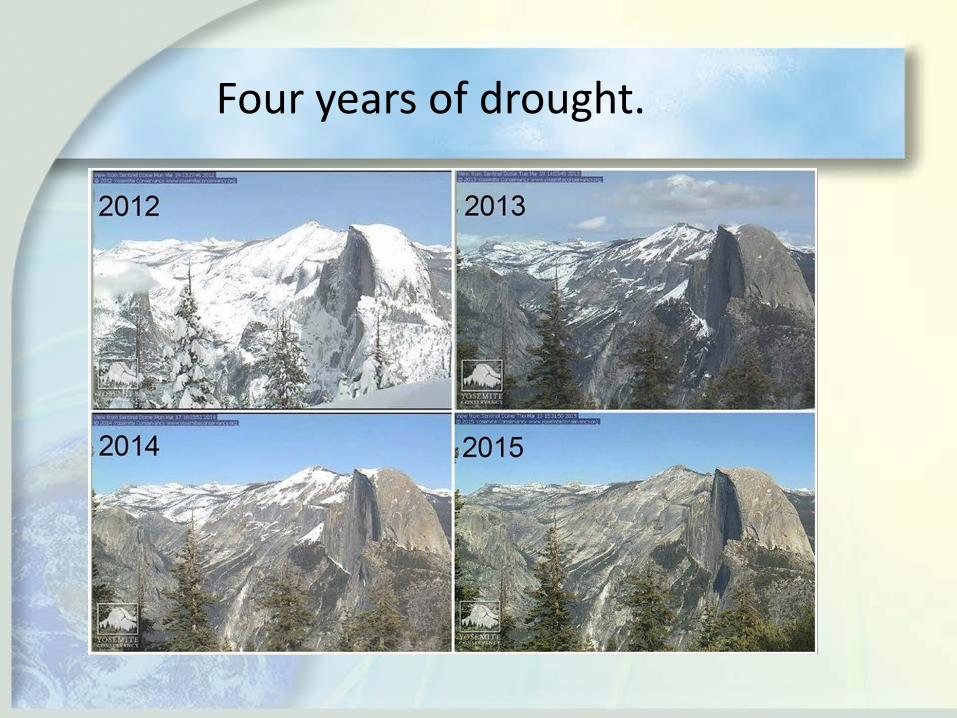
Four years of drought.
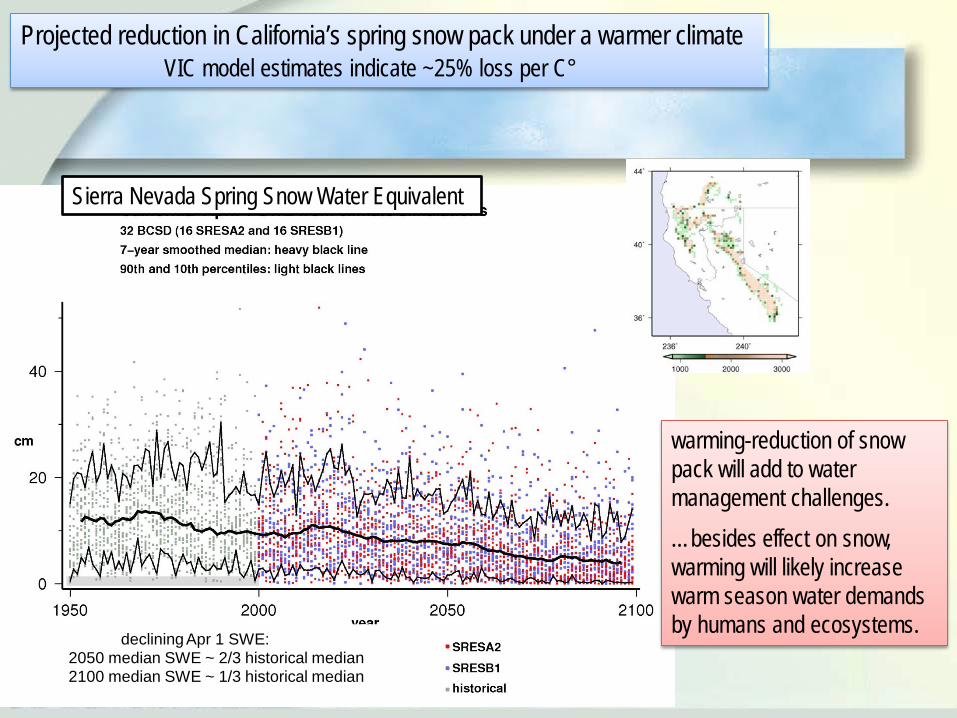
Projected reduction in California’s spring snow pack under a warmer climate VIC model estimates indicate ~25% loss per C°
declining Apr 1 SWE: 2050 median SWE ~ 2/3 historical median 2100 median SWE ~ 1/3 historical median
Sierra Nevada Spring Snow Water Equivalent
warming-reduction of snow pack will add to water management challenges.
…besides effect on snow, warming will likely increase warm season water demands by humans and ecosystems.
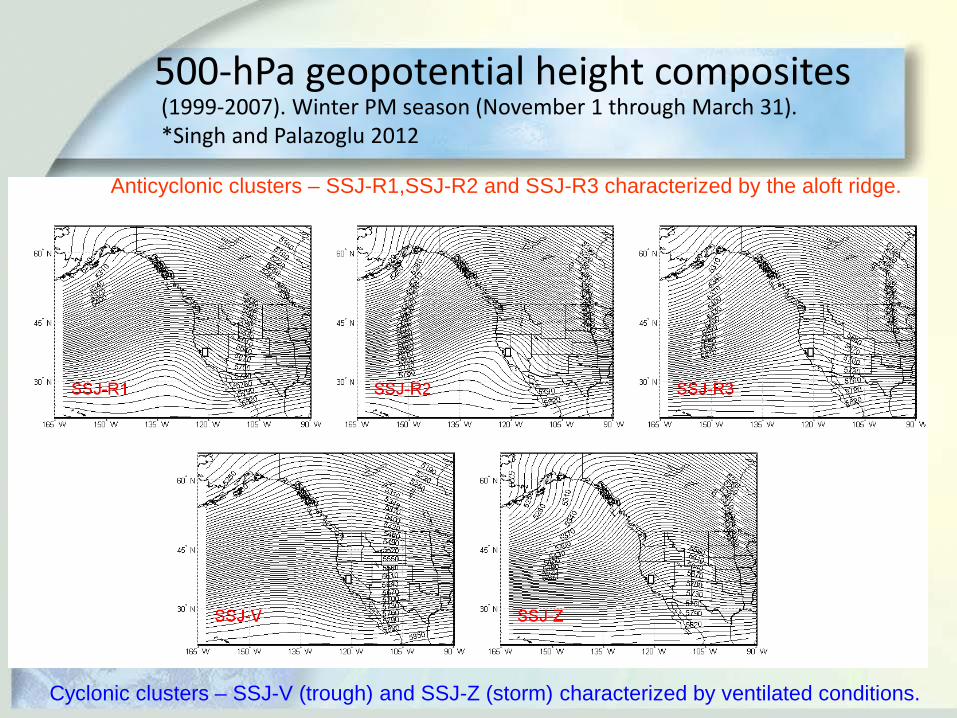
500-hPa geopotential height composites
Anticyclonic clusters – SSJ-R1,SSJ-R2 and SSJ-R3 characterized by the aloft ridge.
Cyclonic clusters – SSJ-V (trough) and SSJ-Z (storm) characterized by ventilated conditions.
(1999-2007). Winter PM season (November 1 through March 31). *Singh and Palazoglu 2012
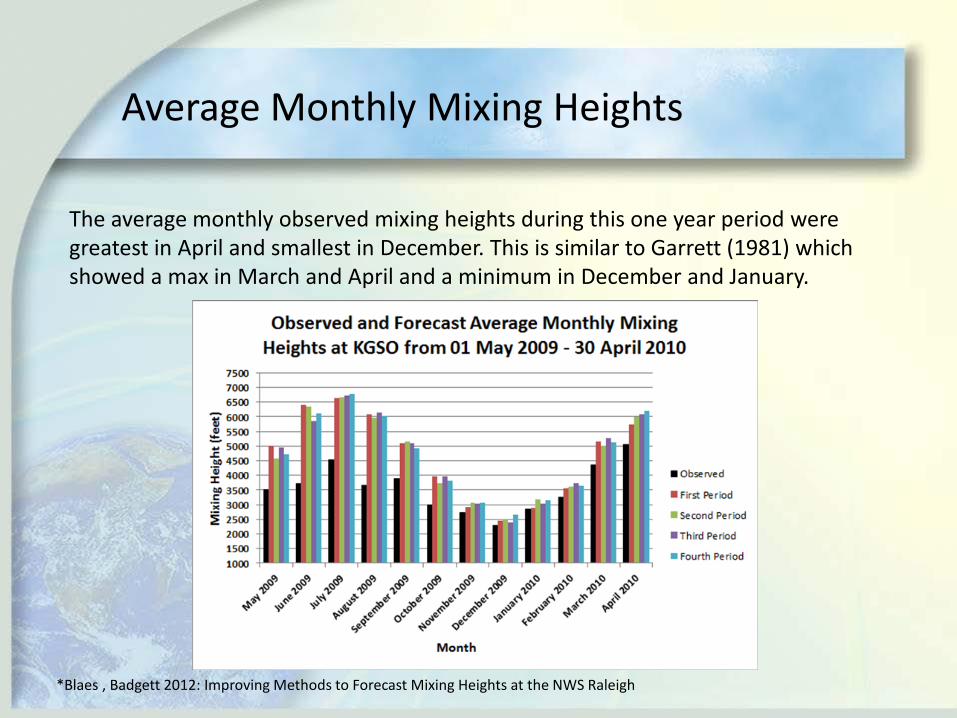
Average Monthly Mixing Heights
The average monthly observed mixing heights during this one year period were greatest in April and smallest in December. This is similar to Garrett (1981) which showed a max in March and April and a minimum in December and January.
*Blaes , Badgett 2012: Improving Methods to Forecast Mixing Heights at the NWS Raleigh
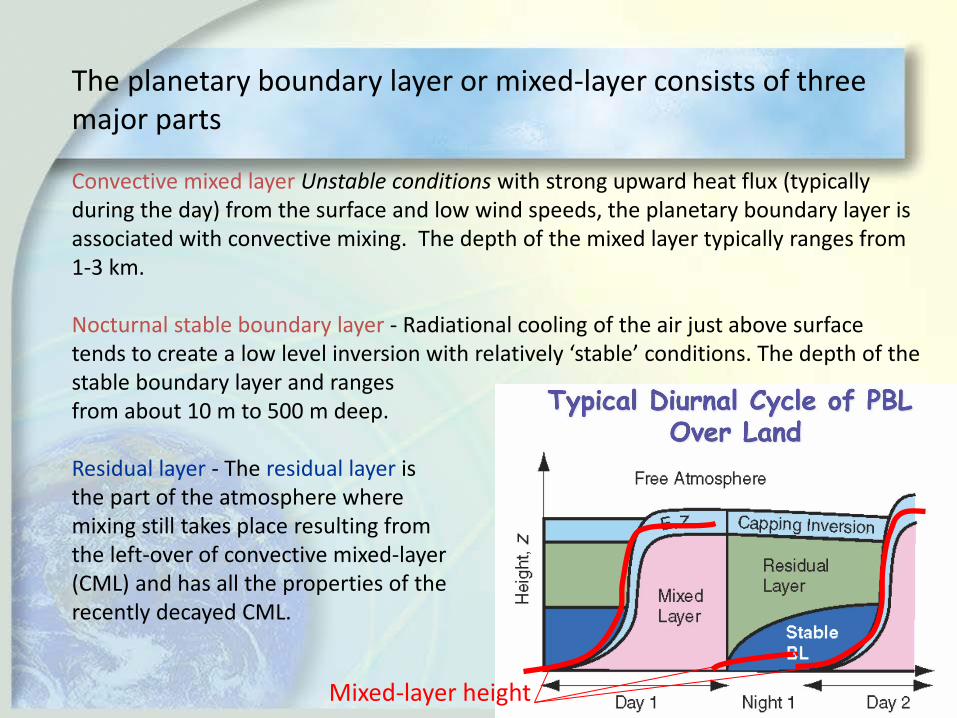
The planetary boundary layer or mixed-layer consists of three major parts Convective mixed layer Unstable conditions with strong upward heat flux (typically during the day) from the surface and low wind speeds, the planetary boundary layer is associated with convective mixing. The depth of the mixed layer typically ranges from 1-3 km. Nocturnal stable boundary layer - Radiational cooling of the air just above surface tends to create a low level inversion with relatively ‘stable’ conditions. The depth of the stable boundary layer and ranges from about 10 m to 500 m deep. Residual layer - The residual layer is the part of the atmosphere where mixing still takes place resulting from the left-over of convective mixed-layer (CML) and has all the properties of the recently decayed CML.
Mixed-layer height
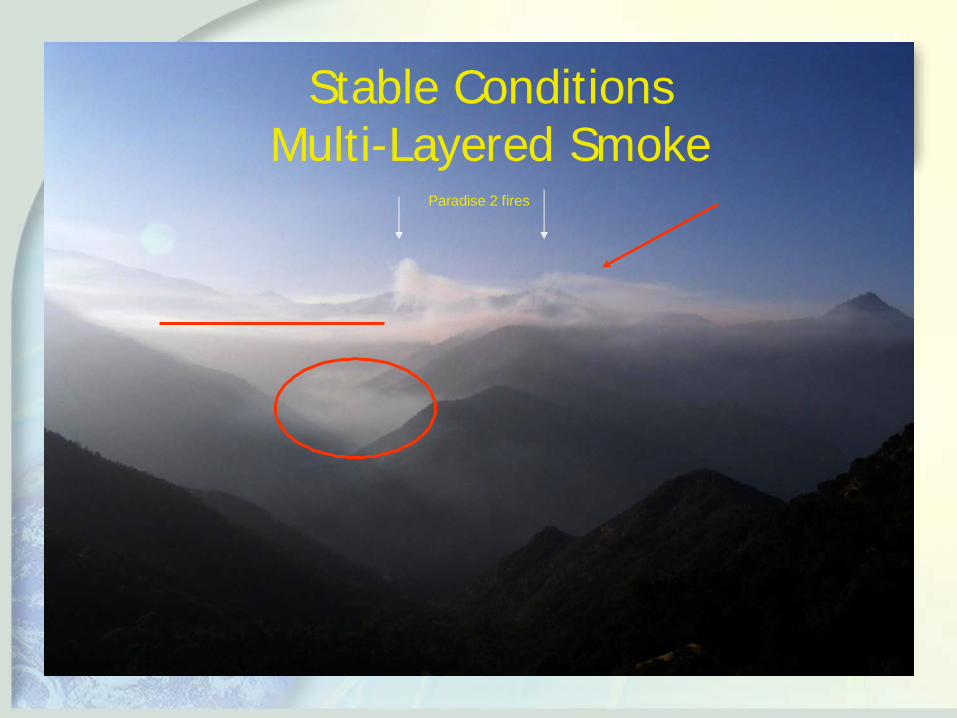
Stable Conditions Multi-Layered Smoke
Paradise 2 fires
●●●●● ● ●●● ●● ● ● ● ● ●
● ●
● ●
● ●●●●● ● ●
● ● ●
●●●●●●●●●
●
●● ●
● ●
● ● ● ●
●
●
●
●
●
●●●●●●●● ●●
●
● ●●
● ●
● ●●
●
●
●
●
● ●●●●●●●●●
● ● ● ●
●
●
● ●
●
●
● ●
● ● ●●●●● ● ● ● ●●●●●●●●●● ● ●●
●
●● ●● ● ● ● ● ●●
●
●
● ●
●● ●● ●
●● ●●● ● ● ● ●● ● ●●●●● ● ●
● ●● ● ● ●●●
● ● ●● ●●●
● ●
● ●
● ● ●
● ●●●● ● ● ● ● ●● ●●●●●●●●
●● ●●●●●●●●● ●● ● ●● ●●●●●
●●●●●●●●●●●●● ● ●●● ●● ● ● ●●●●●●●
● ● ●●●●●●●
●● ●●
●
●
● ●●
●
●
● ●
● ●
●
●
● ● ●
●
● ●
●
●
● ●
● ● ●
● ● ●●
●
●
● ● ● ● ●
●●●● ●
● ●
●●● ● ●
●
●
●
● ● ●● ● ● ●●●● ●
● ●●●
●● ●
●
●
● ●●● ● ●
●●●●●
● ●● ● ● ● ●
●
●
● ● ● ● ●● ●● ● ●
● ●● ●
● ●
●●
●
●
●
● ●●
● ● ● ●● ●● ●
● ●
●●● ●●
● ●
● ●
●● ●● ●●●
● ●
● ●
●● ●●●
●
●● ●●●●●●●●
●
●
● ●●
● ● ● ●●
●
●●●● ●●●● ●●
● ●
● ●●●●●
● ● ●
●
●
●●●●● ●● ●●● ●
● ●●● ●●●
● ● ●
●
●
● ●●●● ● ● ●●● ●●
● ●● ●● ● ●
● ● ● ●
●
●
● ●● ●●●● ●●●
● ●
● ●
●
●●● ●
● ●
●
●
●●● ●●●●● ●● ● ● ●●● ●●●
● ●●
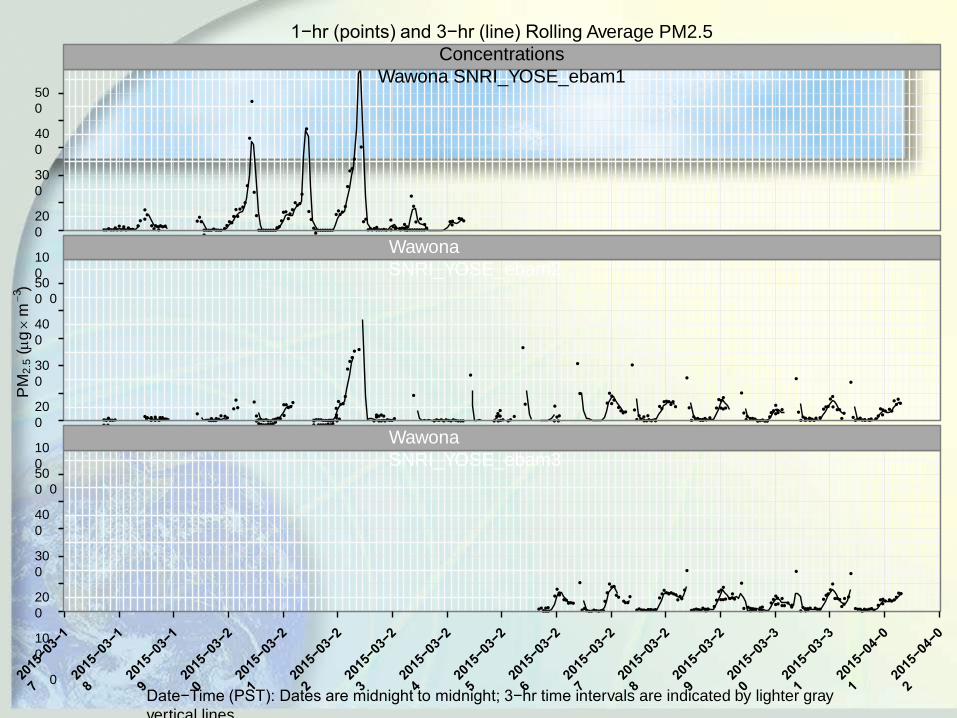
Wawona SNRI_YOSE_ebam2
Wawona SNRI_YOSE_ebam3
500
400
300
200
100
0 500
400
300
200
100
0 500
400
300
200
100
0
1−hr (points) and 3−hr (line) Rolling Average PM2.5 Concentrations
Wawona SNRI_YOSE_ebam1
Date−Time (PST): Dates are midnight to midnight; 3−hr time intervals are indicated by lighter gray vertical lines
PM
2.5
(µg ×
m
) −3
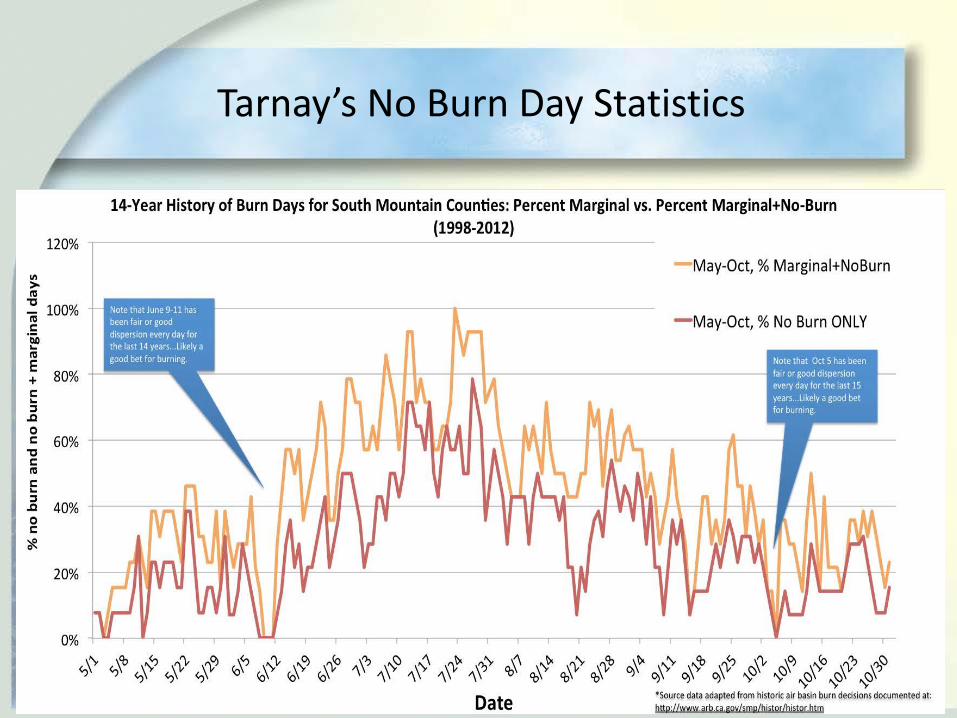
Tarnay’s No Burn Day Statistics
0
0.2
0.4
0.6
0.8
1
1.2
1-Ja
n9-
Jan
17-Ja
n25
-Jan
2-Fe
b10
-Feb
18-F
eb26
-Feb
5-M
ar13
-Mar
21-M
ar29
-Mar
6-Ap
r14
-Apr
22-A
pr30
-Apr
8-M
ay16
-May
24-M
ay1-
Jun
9-Ju
n17
-Jun
25-Ju
n3-
Jul
11-Ju
l19
-Jul
27-Ju
l4-
Aug
12-A
ug20
-Aug
28-A
ug5-
Sep
13-S
ep21
-Sep
29-S
ep7-
Oct
15-O
ct23
-Oct
31-O
ct8-
Nov
16-N
ov24
-Nov
2-De
c10
-Dec
18-D
ec26
-Dec
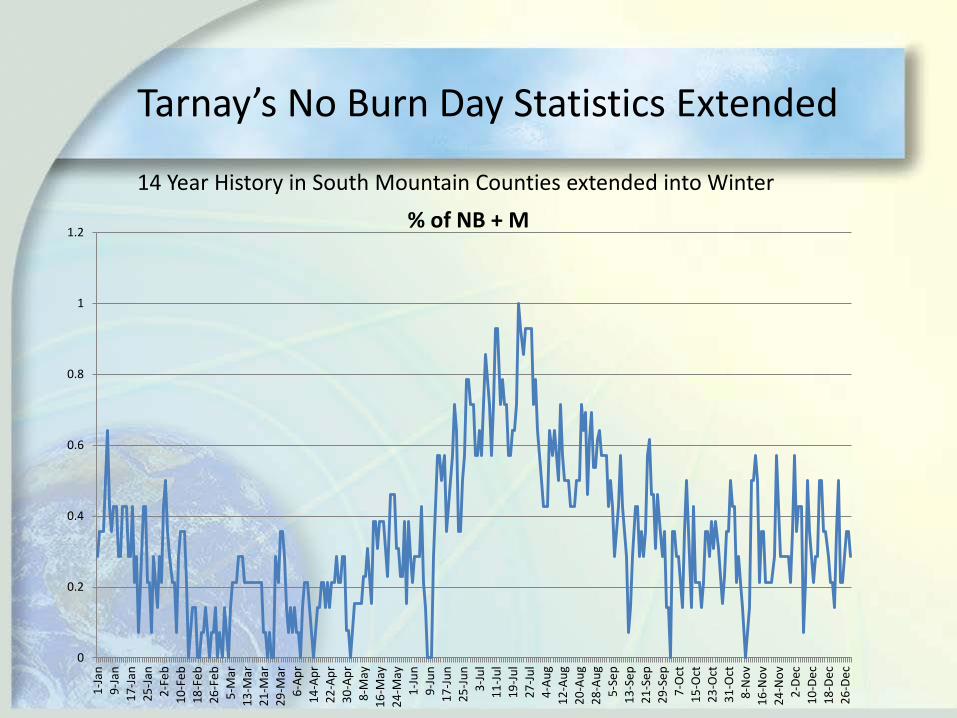
% of NB + M
Tarnay’s No Burn Day Statistics Extended
14 Year History in South Mountain Counties extended into Winter
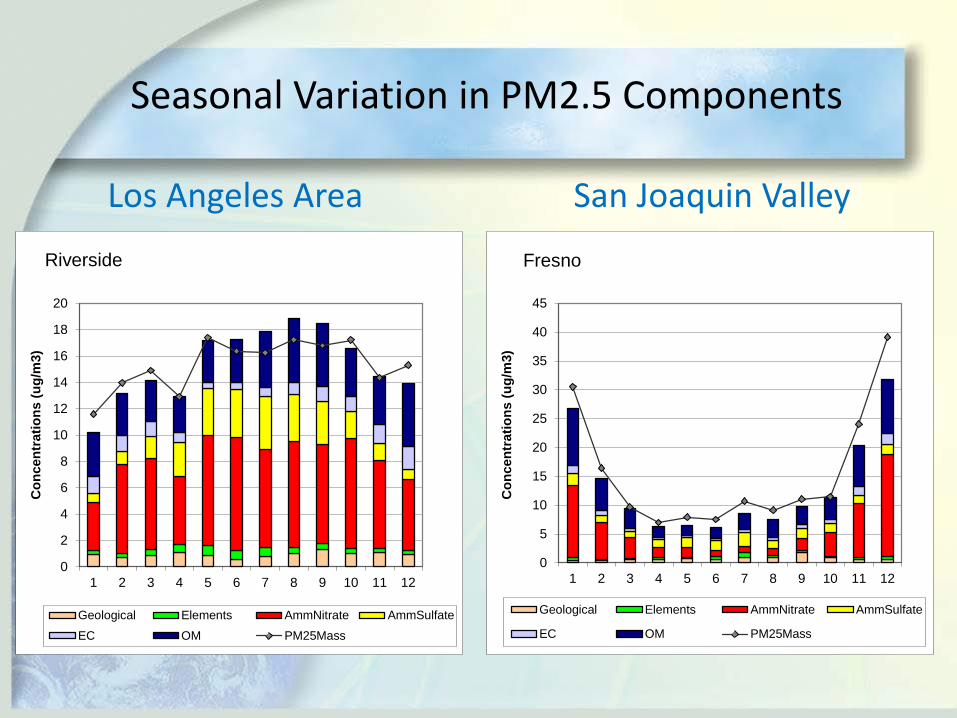
Seasonal Variation in PM2.5 Components
0
5
10
15
20
25
30
35
40
45
1 2 3 4 5 6 7 8 9 10 11 12
Con
cent
ratio
ns (u
g/m
3)
Fresno
Geological Elements AmmNitrate AmmSulfate
EC OM PM25Mass
0
2
4
6
8
10
12
14
16
18
20
1 2 3 4 5 6 7 8 9 10 11 12
Con
cent
ratio
ns (u
g/m
3)
Riverside
Geological Elements AmmNitrate AmmSulfate
EC OM PM25Mass
Los Angeles Area San Joaquin Valley
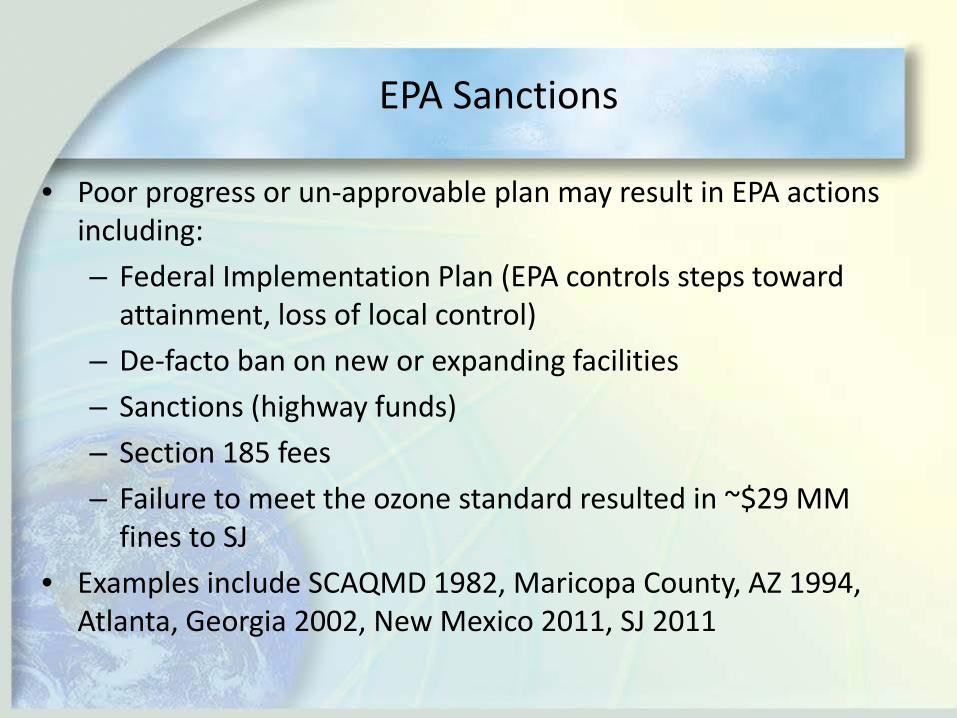
EPA Sanctions
• Poor progress or un-approvable plan may result in EPA actions including: – Federal Implementation Plan (EPA controls steps toward
attainment, loss of local control) – De-facto ban on new or expanding facilities – Sanctions (highway funds) – Section 185 fees – Failure to meet the ozone standard resulted in ~$29 MM
fines to SJ • Examples include SCAQMD 1982, Maricopa County, AZ 1994,
Atlanta, Georgia 2002, New Mexico 2011, SJ 2011
Important Considerations
• Slope, Aspect and Fuels – Matter even more in winter • How much – Limit the amount proportional to the dispersion • Why – How important is this burn? • More reliance on technical tools (Bluesky, CANSAC, etc) • Need to work together to avoid the impacts - SMP