Embed Size (px)
Citation preview
ORIGINAL PAPER
Winter mean temperature variability in Turkey associatedwith the North Atlantic Oscillation
Murat Turkes Æ Ecmel Erlat
Received: 4 August 2008 / Accepted: 7 September 2009 / Published online: 22 September 2009
� Springer-Verlag 2009
Abstract Changes and variability in seasonal average
mean and monthly mean winter (DJF) air temperature
series at 70 stations of Turkey and the circulation types at
500-hPa geopotential height level were investigated to
explain atmospheric controls of temperature variations
during the extreme (weak and strong) phases and normal
(negative and positive) phases of the North Atlantic
Oscillation (i.e., Ponta Delgada–Reykjavik and the
Gibraltar–Reykjavik) indices. During the positive phases of
the North Atlantic Oscillation indices (NAOIs), northeast-
erly circulation increased, and thus spatially coherent and
significant cold signals dominate over the majority of
Turkey. This pattern is closely linked to anomalously low
500-hPa heights over the region of the Icelandic Low, and
anomalously high geopotential heights over the regions of
the Azores High, the western Mediterranean basin and the
Europe, in general including the Balkans and northwest
Turkey. Contrarily, during the negative phases of the
NAOIs, prevailing westerly winds that originate from the
subtropical northeast Atlantic increase, and thus spatially
coherent and significant warm signals over the Anatolian
peninsula appear. This pattern is closely linked to the
increased cyclonic activity and associated increased wes-
terly and southwesterly circulation causing warm maritime
air advection over the Mediterranean basin toward Turkey.
1 Introduction
The atmospheric circulation is the principal control that
determines the climate variability. Atmospheric circulation
and teleconnection patterns can be characterized by using
circulation indices, such as the indices developed for El
Nino–Southern Oscillation (ENSO), the North Atlantic
Oscillation (NAO), the Arctic Oscillation (AO) or the
North Sea–Caspian Pattern (NCP). Among them, the NAO
is one of the most important circulation sources for short
and/or long-term climatic variability in the North Atlantic,
the Europe, and the Mediterranean regions, because of its
importance in transporting heat and moisture to these
regions or from them.
The NAO is closely connected to the interannual vari-
ability of climatic conditions, mainly during winter across
wide regions of the North Atlantic Ocean, the North
America, the Arctic, the Eurasia and the Mediterranean,
including storminess and precipitation, ocean heat content,
ocean currents and their related heat transport, and sea ice
cover (Wallace et al. 1996; Hurrell and van Loon 1997;
Hurrell et al. 2003). The NAO also has a strong effect on
the European temperature variability. For instance, Hurrell
(1996) revealed that the NAO accounted for 31% of the
wintertime interannual variance of the Northern Hemi-
sphere (NH) extratropical temperatures over the second
half of the twentieth century. Pozo-Vazquez et al. (2001)
revealed that in British Isles and southern Scandinavia,
relationship between the NAO and temperatures seemed to
be linear to highest degree. Influence of the NAO was
greater over the Central Europe in extremely positive
phase, but only small changes were in temperatures when
the NAOI moderately or extremely negative. Ben-Gai et al.
(2001) found high correlations between the winter mode of
the NAO and temperature, and sea level pressure (SLP) in
M. Turkes (&)
Department of Geography, Faculty of Sciences and Arts,
Canakkale Onsekiz Mart University,
Terzioglu Campus, 17020 Canakkale, Turkey
e-mail: [email protected]
E. Erlat
Department of Geography, University of Ege,
Bornova, _Izmir, Turkey
123
Meteorol Atmos Phys (2009) 105:211–225
DOI 10.1007/s00703-009-0046-3
Israel. Werner and Schonwiese (2002) revealed that the
NAOI and temperature relationships were approximately
linear and most pronounced in winter over Europe. The
spatial correlation patterns depicted a correlation decreas-
ing from the northwest to the southeast in winter. Xoplaki
(2002) analyzed winter (DJFM) air temperatures over the
Mediterranean for the period 1950–1999. She showed that
the winter NAO and AO were significantly negative cor-
related with winter air temperatures over a large area,
mainly in the southeastern part including mid-Algeria,
Libya and Egypt, southern Italy, Greece, Turkey, Cyprus,
and the entire Near East countries. Esteban-Parra et al.
(2003) explained that the relationships between extreme
temperatures and the NAOI increased only for winter in the
Iberian Peninsula; for other seasons, no significant corre-
lations were found. In winter, correlations were significant,
positive for maximum temperature, and negative for min-
imum temperature. Matyasovszky (2003) revealed that
‘‘variability over the southern Europe is more complex than
over the central and northern Europe, being extremely
sensitive to the location of SLP anomaly centers’’. Hasa-
nean (2004) found that a statistically significant negative
relationship between winter temperatures and winter NAOI
in Egypt. He also showed that the NAO was more domi-
nant in wintertime temperature than the El Nino-Southern
Oscillation (ENSO). Feidas et al. (2004) analyzed winter
(JFM) air temperatures in Greece for the period 1955–
2001. They found that temperature trends and changes
linked to circulation indices, such as the NAOI, Mediter-
ranean Circulation Index (MCI) and Mediterranean Oscil-
lation Index (MOI). They concluded that most appropriate
index for understanding temperature variability in Greece
was the MCI. On the other hand, their results showed that
PD-R NAOI has not an important effect on winter tem-
perature variability.
Changes of the strength and character of correlations
between the NAO and the NHTs seem to be modulated by
a phase of the solar activity cycle. For solar maximum
phases, the NAO and NHTs are positively correlated;
however, for solar minimum phases, correlations are not
significant or even negative (Gimeno et al. 2003). Some
studies showed that the relationship between the NAO and
the NH winter surface temperatures (NHTs) are not sta-
tionary, changing considerably in time (Pozo-Vazquez
et al. 2001; Beranova and Huth 2008). Beranova and Huth
(2008) also identified five modes of variability, which
affect the surface climate elements in the Europe, using
winter monthly mean 500-hPa heights over the Euro-
Atlantic sector. Their results showed that the relationships
between the modes and the surface climate elements vary
in time and space.
A number of studies were also performed for variations
and trends in surface air mean temperatures in Turkey. For
instance, Turkes et al. (2002) found slightly increasing
trends for annual, winter and spring mean temperatures
particularly over the southern regions of Turkey, and
slightly decreasing trends for summer and particularly
autumn mean temperatures over the continental inner and
northern regions for the period 1929–1999. Winter mean
temperature series in Turkey are mostly random against
any significant secular trend. Tatlı et al. (2005) investigated
statistical linkages between monthly mean near-surface
temperature series over Turkey and large-scale upper air
circulations by using a particular downscaling approach.
Their results showed that effects of the large-scale upper
air circulations on monthly maximum, minimum, and mean
temperatures produce similar patterns in winter, and large-
scale circulation features of winter are more effective than
other seasons. Recent studies indicated that the NAO is
also one of the major atmospheric sources for the spatial
and temporal variability of the precipitation conditions in
Turkey including significant wet periods and meteorolog-
ical droughts (Turkes and Erlat 2003, 2005).
Nevertheless, relationships between winter mean tem-
peratures of Turkey and the NAOIs, and winter tempera-
ture changes corresponding to the various phases of the
NAOIs and associated upper-air circulations have not been
studied yet. Consequently, this study aims to: (a) detect
statistical relationships between variability of the winter
(December, January, and February) mean and monthly
mean air temperature anomaly series of 70 stations in
Turkey and variability of the NAOIs during the period
1950–2003; (b) determine the spatial and temporal patterns
of the composite temperature anomalies and averages
linked to the negative and positive extreme NAOI phases
(i.e., weak and strong phases, respectively), and all nega-
tive and positive index years of the NAOIs (i.e., negative
and positive phases, respectively); (c) reveal anomalous
circulation patterns and centers of action at 500-hPa geo-
potential level during the extreme and normal NAOI pha-
ses in order to explain the dynamic causes of responses of
winter mean air temperatures to the various phases of these
atmospheric oscillations.
2 Materials and methods
2.1 Surface and upper-air data
The temperature dataset used in the study was originally
developed by Turkes et al. (2002) for 70 stations of Turkey
operated during the period 1929–1999. We have updated
the dataset to 2003 for the present study. The dataset
consists of monthly mean temperatures recorded at stations
of the Turkish State Meteorological Service (TSMS), most
of which are principal climatology stations. The 70 stations
212 M. Turkes, E. Erlat
123
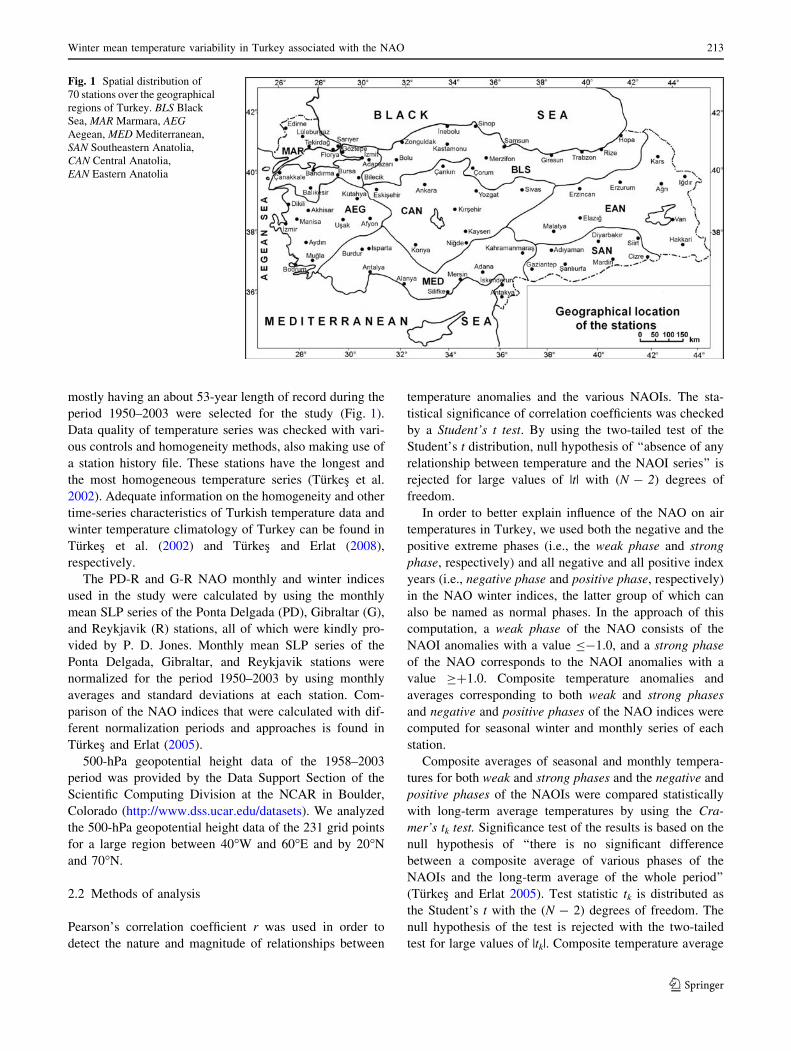
mostly having an about 53-year length of record during the
period 1950–2003 were selected for the study (Fig. 1).
Data quality of temperature series was checked with vari-
ous controls and homogeneity methods, also making use of
a station history file. These stations have the longest and
the most homogeneous temperature series (Turkes et al.
2002). Adequate information on the homogeneity and other
time-series characteristics of Turkish temperature data and
winter temperature climatology of Turkey can be found in
Turkes et al. (2002) and Turkes and Erlat (2008),
respectively.
The PD-R and G-R NAO monthly and winter indices
used in the study were calculated by using the monthly
mean SLP series of the Ponta Delgada (PD), Gibraltar (G),
and Reykjavik (R) stations, all of which were kindly pro-
vided by P. D. Jones. Monthly mean SLP series of the
Ponta Delgada, Gibraltar, and Reykjavik stations were
normalized for the period 1950–2003 by using monthly
averages and standard deviations at each station. Com-
parison of the NAO indices that were calculated with dif-
ferent normalization periods and approaches is found in
Turkes and Erlat (2005).
500-hPa geopotential height data of the 1958–2003
period was provided by the Data Support Section of the
Scientific Computing Division at the NCAR in Boulder,
Colorado (http://www.dss.ucar.edu/datasets). We analyzed
the 500-hPa geopotential height data of the 231 grid points
for a large region between 40�W and 60�E and by 20�N
and 70�N.
2.2 Methods of analysis
Pearson’s correlation coefficient r was used in order to
detect the nature and magnitude of relationships between
temperature anomalies and the various NAOIs. The sta-
tistical significance of correlation coefficients was checked
by a Student’s t test. By using the two-tailed test of the
Student’s t distribution, null hypothesis of ‘‘absence of any
relationship between temperature and the NAOI series’’ is
rejected for large values of |t| with (N - 2) degrees of
freedom.
In order to better explain influence of the NAO on air
temperatures in Turkey, we used both the negative and the
positive extreme phases (i.e., the weak phase and strong
phase, respectively) and all negative and all positive index
years (i.e., negative phase and positive phase, respectively)
in the NAO winter indices, the latter group of which can
also be named as normal phases. In the approach of this
computation, a weak phase of the NAO consists of the
NAOI anomalies with a value B-1.0, and a strong phase
of the NAO corresponds to the NAOI anomalies with a
value C?1.0. Composite temperature anomalies and
averages corresponding to both weak and strong phases
and negative and positive phases of the NAO indices were
computed for seasonal winter and monthly series of each
station.
Composite averages of seasonal and monthly tempera-
tures for both weak and strong phases and the negative and
positive phases of the NAOIs were compared statistically
with long-term average temperatures by using the Cra-
mer’s tk test. Significance test of the results is based on the
null hypothesis of ‘‘there is no significant difference
between a composite average of various phases of the
NAOIs and the long-term average of the whole period’’
(Turkes and Erlat 2005). Test statistic tk is distributed as
the Student’s t with the (N - 2) degrees of freedom. The
null hypothesis of the test is rejected with the two-tailed
test for large values of |tk|. Composite temperature average
Fig. 1 Spatial distribution of
70 stations over the geographical
regions of Turkey. BLS Black
Sea, MAR Marmara, AEGAegean, MED Mediterranean,
SAN Southeastern Anatolia,
CAN Central Anatolia,
EAN Eastern Anatolia
Winter mean temperature variability in Turkey associated with the NAO 213
123
of a station is considered as warm (cold) ‘signal’, only if
the test statistic of tk computed for that station is statisti-
cally significant.
An analysis for the consistency of temperature anoma-
lies was also performed in order to determine whether the
signal of a composite anomaly is dominated by a few large
anomalies during a negative or a positive phase of the
NAOI variability or not. This was done with calculation of
the percentage of consistent signals (PCS), defined as the
percentage of events having values with the same sign as
the average of the anomalies (here the composite anomaly).
The significance of difference between the 500-hPa
anomaly circulation pattern controlled by the negative
phase of the NAOI and the 500-hPa anomaly circulation
pattern driven by the positive phase of the NAOI was
checked by the one-tailed Student’s t test for equality of
means with the (n1 ? n2 - 2) degrees of freedom. The test
of significance considers the null hypothesis of ‘‘500-hPa
anomaly circulation patterns do not differ between the
negative phase and the positive phase of the NAO vari-
ability.’’ The independent samples t test of the differences
between the series of 500-hPa anomalies corresponding the
negative and positive index years of the NAO winter index
was repeated with both pooled variance (equal variances)
t test and separate-variance (equal variances not assumed)
t test. We used the results of the significance test arising
from the pooled variance t test for mapping the statistically
significant results (Figs. 10c, 11c), because variances of the
series are mostly equal, and the resultant t statistics from
both tests are very similar.
Any signal from the tests of significance performed for
all statistical methods used in the present study is taken into
consideration if it is significant at the 5% significance level
of the t distribution, although both 5 and 1% levels of
significance are considered for the tests of hypothesis in the
study.
3 Results and discussion
3.1 Temporal variability related with the NAO winter
indices
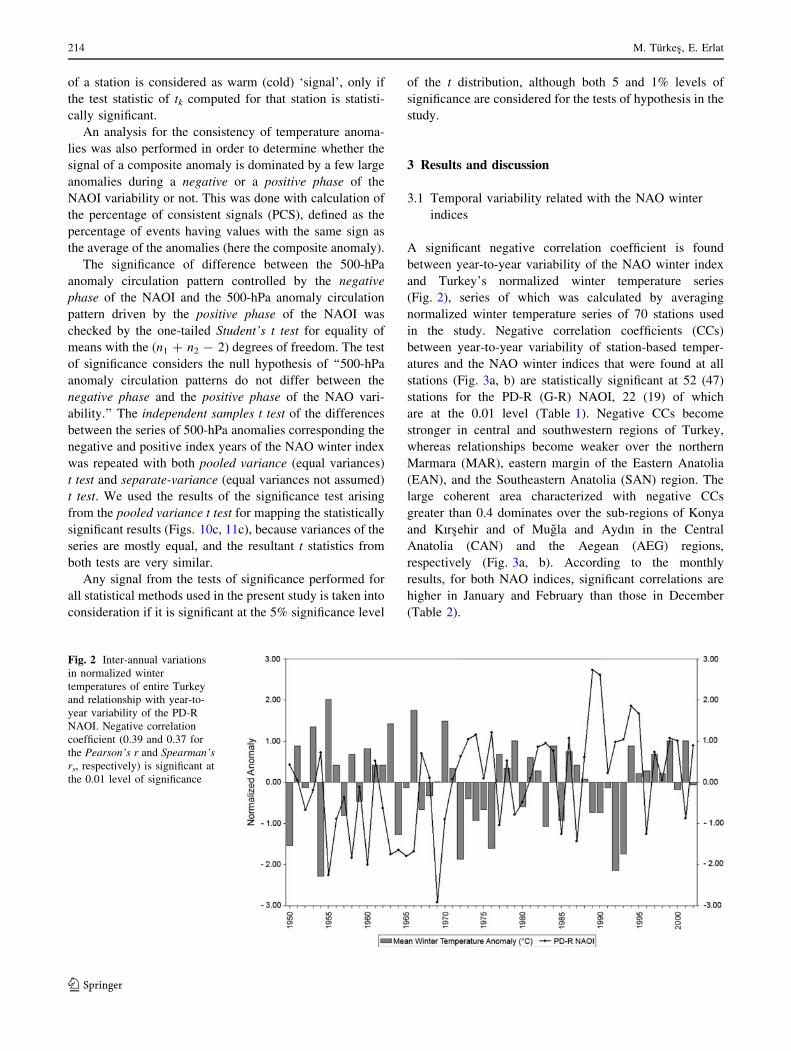
A significant negative correlation coefficient is found
between year-to-year variability of the NAO winter index
and Turkey’s normalized winter temperature series
(Fig. 2), series of which was calculated by averaging
normalized winter temperature series of 70 stations used
in the study. Negative correlation coefficients (CCs)
between year-to-year variability of station-based temper-
atures and the NAO winter indices that were found at all
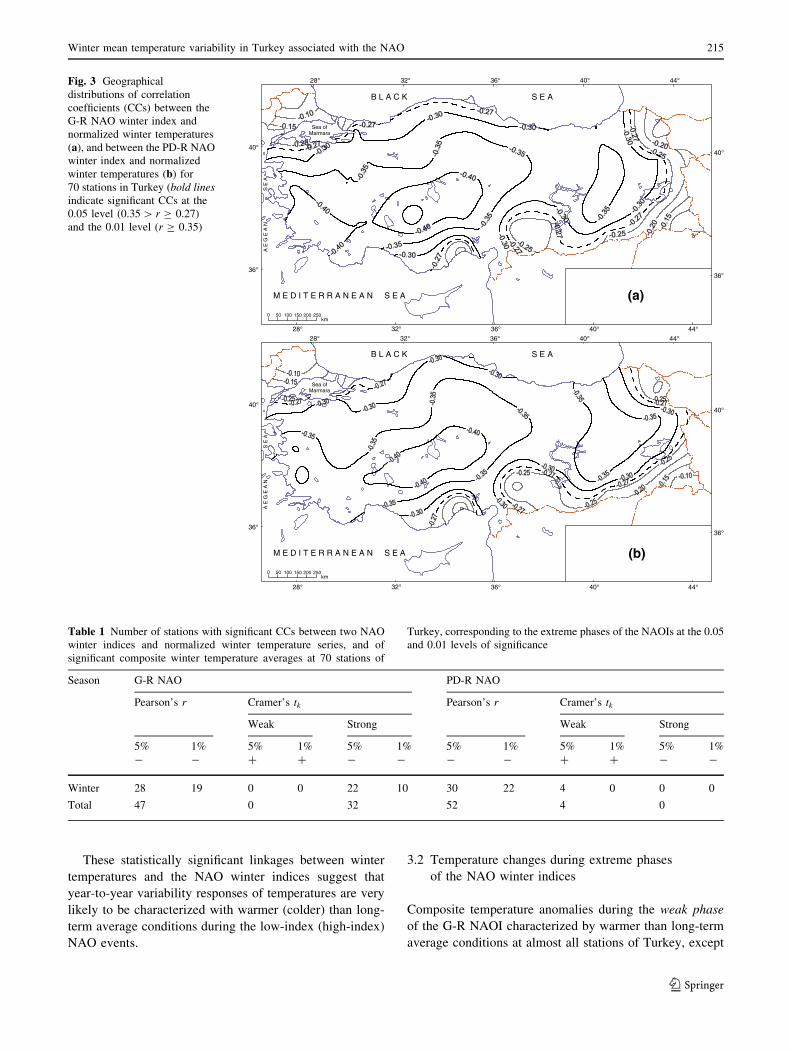
stations (Fig. 3a, b) are statistically significant at 52 (47)
stations for the PD-R (G-R) NAOI, 22 (19) of which
are at the 0.01 level (Table 1). Negative CCs become
stronger in central and southwestern regions of Turkey,
whereas relationships become weaker over the northern
Marmara (MAR), eastern margin of the Eastern Anatolia
(EAN), and the Southeastern Anatolia (SAN) region. The
large coherent area characterized with negative CCs
greater than 0.4 dominates over the sub-regions of Konya
and Kırsehir and of Mugla and Aydın in the Central
Anatolia (CAN) and the Aegean (AEG) regions,
respectively (Fig. 3a, b). According to the monthly
results, for both NAO indices, significant correlations are
higher in January and February than those in December
(Table 2).
Fig. 2 Inter-annual variations
in normalized winter
temperatures of entire Turkey
and relationship with year-to-
year variability of the PD-R
NAOI. Negative correlation
coefficient (0.39 and 0.37 for
the Pearson’s r and Spearman’srs, respectively) is significant at
the 0.01 level of significance
214 M. Turkes, E. Erlat
123
These statistically significant linkages between winter
temperatures and the NAO winter indices suggest that
year-to-year variability responses of temperatures are very
likely to be characterized with warmer (colder) than long-
term average conditions during the low-index (high-index)
NAO events.
3.2 Temperature changes during extreme phases
of the NAO winter indices
Composite temperature anomalies during the weak phase
of the G-R NAOI characterized by warmer than long-term
average conditions at almost all stations of Turkey, except
28° 32° 36° 40° 44°
40°
36°
44°40°36°32°28°
0 50 100 150 200 250km
36°
40°
B L A C K S E A
M E D I T E R R A N E A N S E A
A E
G E
A N
S
E A
Sea ofMarmara
(a)
28° 32° 36° 40° 44°
40°
36°
44°40°36°32°28°
0 50 100 150 200 250km
36°
40°
B L A C K S E A
M E D I T E R R A N E A N S E A
A E
G E
A N
S
E A
Sea ofMarmara
(b)
Fig. 3 Geographical
distributions of correlation
coefficients (CCs) between the
G-R NAO winter index and
normalized winter temperatures
(a), and between the PD-R NAO
winter index and normalized
winter temperatures (b) for
70 stations in Turkey (bold linesindicate significant CCs at the
0.05 level (0.35 [ r C 0.27)
and the 0.01 level (r C 0.35)
Table 1 Number of stations with significant CCs between two NAO
winter indices and normalized winter temperature series, and of
significant composite winter temperature averages at 70 stations of
Turkey, corresponding to the extreme phases of the NAOIs at the 0.05
and 0.01 levels of significance
Season G-R NAO PD-R NAO
Pearson’s r Cramer’s tk Pearson’s r Cramer’s tk
Weak Strong Weak Strong
5%
-
1%
-
5%
?
1%
?
5%
-
1%
-
5%
-
1%
-
5%
?
1%
?
5%
-
1%
-
Winter 28 19 0 0 22 10 30 22 4 0 0 0
Total 47 0 32 52 4 0
Winter mean temperature variability in Turkey associated with the NAO 215
123
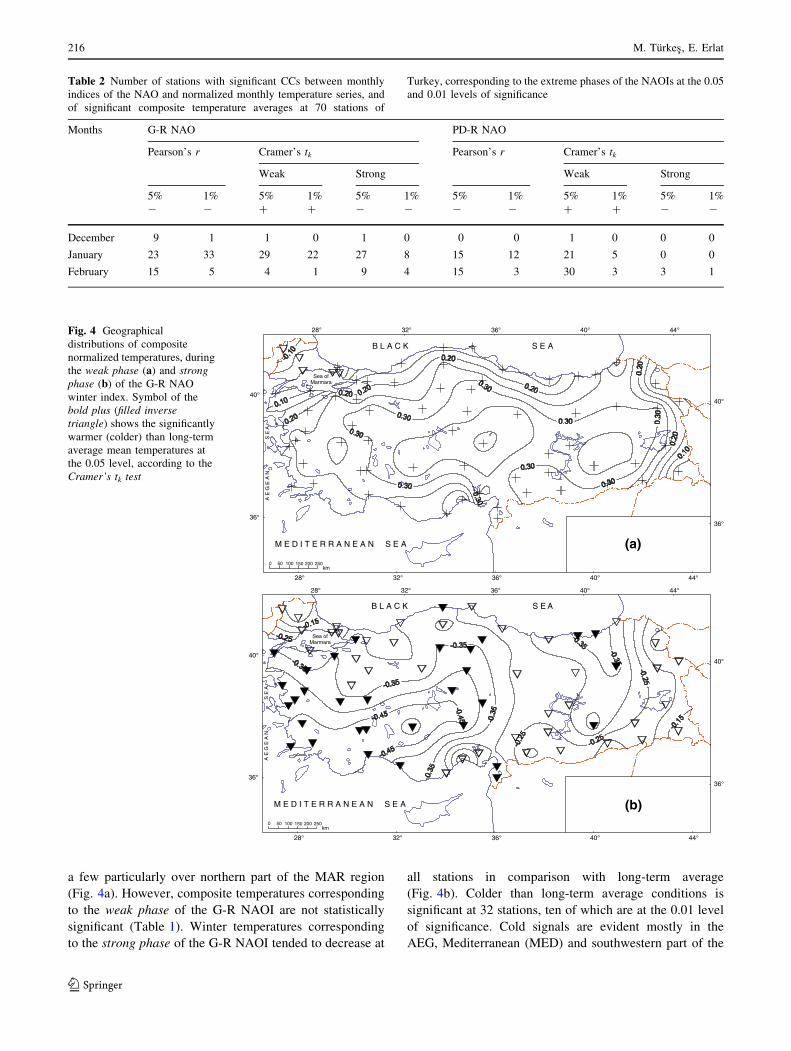
a few particularly over northern part of the MAR region
(Fig. 4a). However, composite temperatures corresponding
to the weak phase of the G-R NAOI are not statistically
significant (Table 1). Winter temperatures corresponding
to the strong phase of the G-R NAOI tended to decrease at
all stations in comparison with long-term average
(Fig. 4b). Colder than long-term average conditions is
significant at 32 stations, ten of which are at the 0.01 level
of significance. Cold signals are evident mostly in the
AEG, Mediterranean (MED) and southwestern part of the
Table 2 Number of stations with significant CCs between monthly
indices of the NAO and normalized monthly temperature series, and
of significant composite temperature averages at 70 stations of
Turkey, corresponding to the extreme phases of the NAOIs at the 0.05
and 0.01 levels of significance
Months G-R NAO PD-R NAO
Pearson’s r Cramer’s tk Pearson’s r Cramer’s tk
Weak Strong Weak Strong
5%
-
1%
-
5%
?
1%
?
5%
-
1%
-
5%
-
1%
-
5%
?
1%
?
5%
-
1%
-
December 9 1 1 0 1 0 0 0 1 0 0 0
January 23 33 29 22 27 8 15 12 21 5 0 0
February 15 5 4 1 9 4 15 3 30 3 3 1
28° 32° 36° 40° 44°
40°
36°
44°40°36°32°28°
0 50 100 150 200 250km
36°
40°
B L A C K S E A
M E D I T E R R A N E A N S E A
A E
G E
A N
S
E A
Sea ofMarmara
(a)
28° 32° 36° 40° 44°
40°
36°
44°40°36°32°28°
0 50 100 150 200 250km
36°
40°
B L A C K S E A
M E D I T E R R A N E A N S E A
A E
G E
A N
S
E A
Sea ofMarmara
(b)
Fig. 4 Geographical
distributions of composite
normalized temperatures, during
the weak phase (a) and strongphase (b) of the G-R NAO
winter index. Symbol of the
bold plus (filled inversetriangle) shows the significantly
warmer (colder) than long-term
average mean temperatures at
the 0.05 level, according to the
Cramer’s tk test
216 M. Turkes, E. Erlat
123
CAN, and at a few station of the eastern Black Sea (BLS)
sub-region.
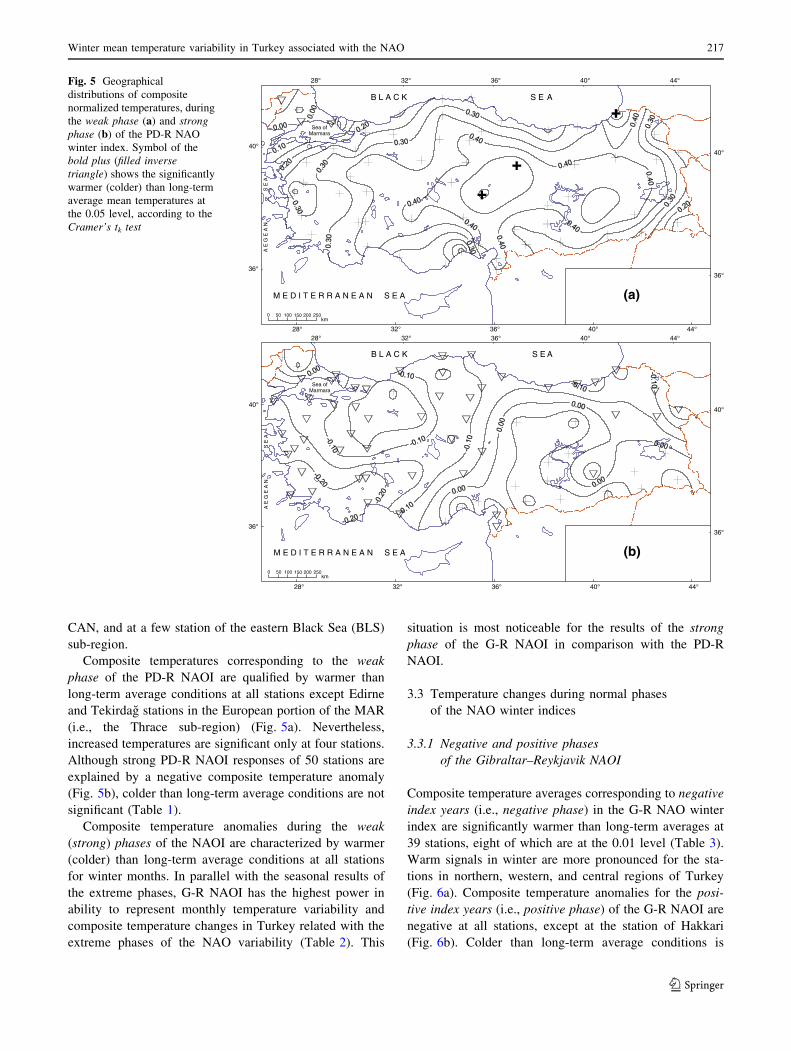
Composite temperatures corresponding to the weak
phase of the PD-R NAOI are qualified by warmer than
long-term average conditions at all stations except Edirne
and Tekirdag stations in the European portion of the MAR
(i.e., the Thrace sub-region) (Fig. 5a). Nevertheless,
increased temperatures are significant only at four stations.
Although strong PD-R NAOI responses of 50 stations are
explained by a negative composite temperature anomaly
(Fig. 5b), colder than long-term average conditions are not
significant (Table 1).
Composite temperature anomalies during the weak
(strong) phases of the NAOI are characterized by warmer
(colder) than long-term average conditions at all stations
for winter months. In parallel with the seasonal results of
the extreme phases, G-R NAOI has the highest power in
ability to represent monthly temperature variability and
composite temperature changes in Turkey related with the
extreme phases of the NAO variability (Table 2). This
situation is most noticeable for the results of the strong
phase of the G-R NAOI in comparison with the PD-R
NAOI.
3.3 Temperature changes during normal phases
of the NAO winter indices
3.3.1 Negative and positive phases
of the Gibraltar–Reykjavik NAOI
Composite temperature averages corresponding to negative
index years (i.e., negative phase) in the G-R NAO winter
index are significantly warmer than long-term averages at
39 stations, eight of which are at the 0.01 level (Table 3).
Warm signals in winter are more pronounced for the sta-
tions in northern, western, and central regions of Turkey
(Fig. 6a). Composite temperature anomalies for the posi-
tive index years (i.e., positive phase) of the G-R NAOI are
negative at all stations, except at the station of Hakkari
(Fig. 6b). Colder than long-term average conditions is
28° 32° 36° 40° 44°
40°
36°
0 50 100 150 200 250km
36°
40°
B L A C K S E A
M E D I T E R R A N E A N S E A
A E
G E
A N
S
E A
Sea ofMarmara
(a)
28° 32° 36° 40° 44°
40°
36°
44°40°36°32°28°
44°40°36°32°28°
0 50 100 150 200 250km
36°
40°
B L A C K S E A
M E D I T E R R A N E A N S E A
A E
G E
A N
S
E A
Sea ofMarmara
(b)
Fig. 5 Geographical
distributions of composite
normalized temperatures, during
the weak phase (a) and strongphase (b) of the PD-R NAO
winter index. Symbol of the
bold plus (filled inversetriangle) shows the significantly
warmer (colder) than long-term
average mean temperatures at
the 0.05 level, according to the
Cramer’s tk test
Winter mean temperature variability in Turkey associated with the NAO 217
123
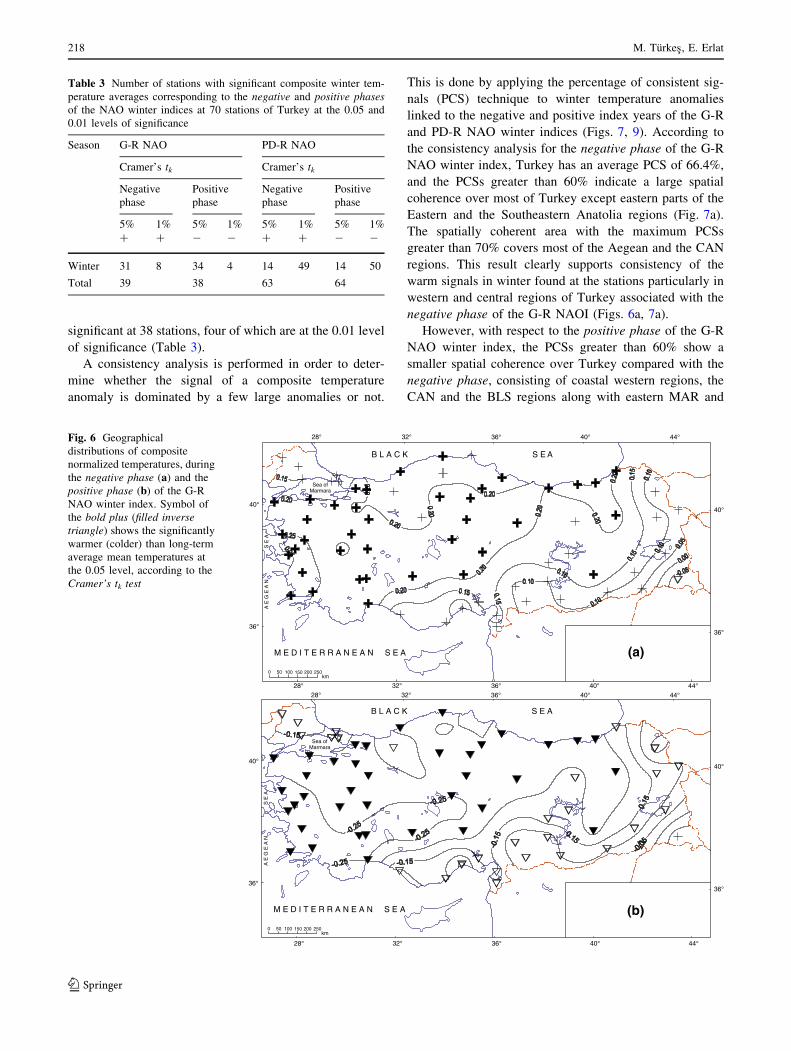
significant at 38 stations, four of which are at the 0.01 level
of significance (Table 3).
A consistency analysis is performed in order to deter-
mine whether the signal of a composite temperature
anomaly is dominated by a few large anomalies or not.
This is done by applying the percentage of consistent sig-
nals (PCS) technique to winter temperature anomalies
linked to the negative and positive index years of the G-R
and PD-R NAO winter indices (Figs. 7, 9). According to
the consistency analysis for the negative phase of the G-R
NAO winter index, Turkey has an average PCS of 66.4%,
and the PCSs greater than 60% indicate a large spatial
coherence over most of Turkey except eastern parts of the
Eastern and the Southeastern Anatolia regions (Fig. 7a).
The spatially coherent area with the maximum PCSs
greater than 70% covers most of the Aegean and the CAN
regions. This result clearly supports consistency of the
warm signals in winter found at the stations particularly in
western and central regions of Turkey associated with the
negative phase of the G-R NAOI (Figs. 6a, 7a).
However, with respect to the positive phase of the G-R
NAO winter index, the PCSs greater than 60% show a
smaller spatial coherence over Turkey compared with the
negative phase, consisting of coastal western regions, the
CAN and the BLS regions along with eastern MAR and
Table 3 Number of stations with significant composite winter tem-
perature averages corresponding to the negative and positive phasesof the NAO winter indices at 70 stations of Turkey at the 0.05 and
0.01 levels of significance
Season G-R NAO PD-R NAO
Cramer’s tk Cramer’s tk
Negative
phase
Positive
phase
Negative
phase
Positive
phase
5%
?
1%
?
5%
-
1%
-
5%
?
1%
?
5%
-
1%
-
Winter 31 8 34 4 14 49 14 50
Total 39 38 63 64
28° 32° 36° 40° 44°
40°
36°
0 50 100 150 200 250km
36°
40°
B L A C K S E A
M E D I T E R R A N E A N S E A
A E
G E
A N
S
E A
Sea ofMarmara
(a)
28° 32° 36° 40° 44°
40°
36°
44°40°36°32°28°
44°40°36°32°28°
0 50 100 150 200 250km
36°
40°
B L A C K S E A
M E D I T E R R A N E A N S E A
A E
G E
A N
S
E A
Sea ofMarmara
(b)
Fig. 6 Geographical
distributions of composite
normalized temperatures, during
the negative phase (a) and the
positive phase (b) of the G-R
NAO winter index. Symbol of
the bold plus (filled inversetriangle) shows the significantly
warmer (colder) than long-term
average mean temperatures at
the 0.05 level, according to the
Cramer’s tk test
218 M. Turkes, E. Erlat
123
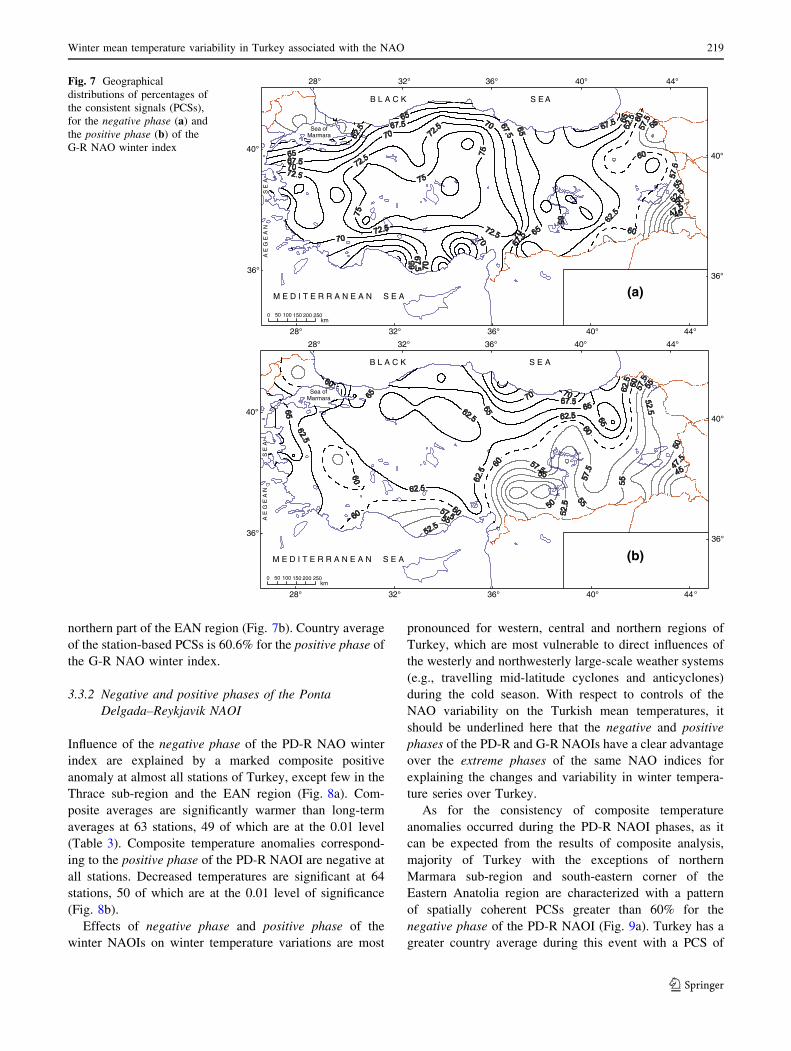
northern part of the EAN region (Fig. 7b). Country average
of the station-based PCSs is 60.6% for the positive phase of
the G-R NAO winter index.
3.3.2 Negative and positive phases of the Ponta
Delgada–Reykjavik NAOI
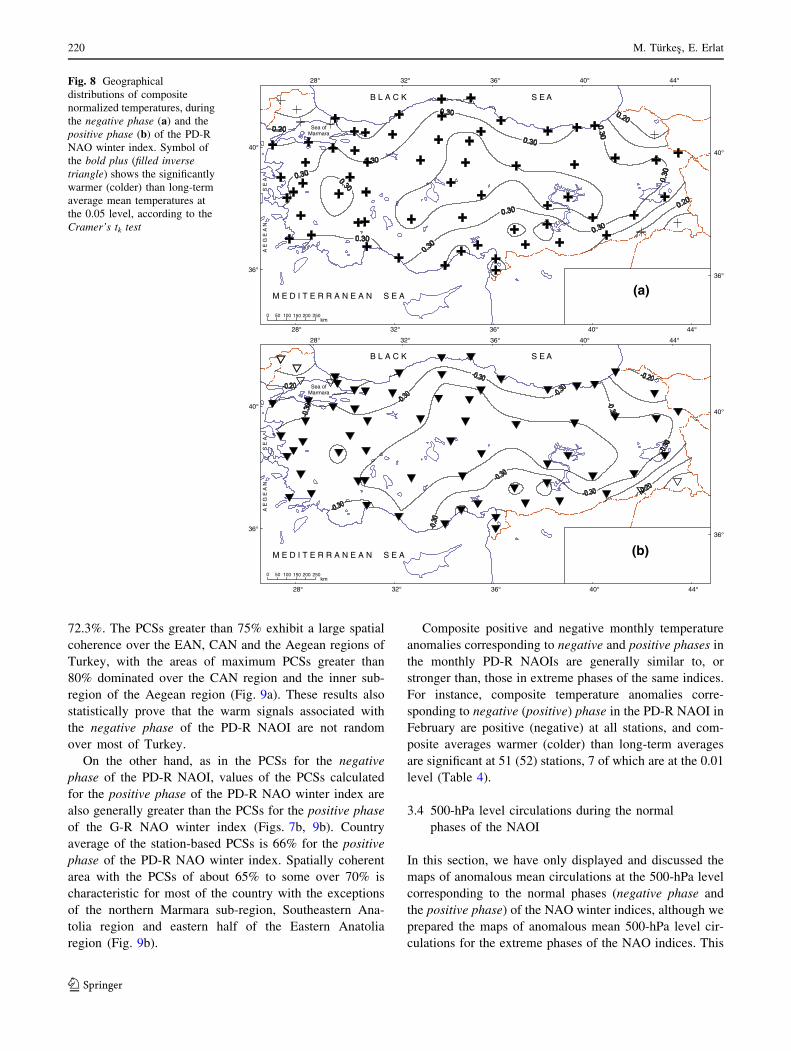
Influence of the negative phase of the PD-R NAO winter
index are explained by a marked composite positive
anomaly at almost all stations of Turkey, except few in the
Thrace sub-region and the EAN region (Fig. 8a). Com-
posite averages are significantly warmer than long-term
averages at 63 stations, 49 of which are at the 0.01 level
(Table 3). Composite temperature anomalies correspond-
ing to the positive phase of the PD-R NAOI are negative at
all stations. Decreased temperatures are significant at 64
stations, 50 of which are at the 0.01 level of significance
(Fig. 8b).
Effects of negative phase and positive phase of the
winter NAOIs on winter temperature variations are most
pronounced for western, central and northern regions of
Turkey, which are most vulnerable to direct influences of
the westerly and northwesterly large-scale weather systems
(e.g., travelling mid-latitude cyclones and anticyclones)
during the cold season. With respect to controls of the
NAO variability on the Turkish mean temperatures, it
should be underlined here that the negative and positive
phases of the PD-R and G-R NAOIs have a clear advantage
over the extreme phases of the same NAO indices for
explaining the changes and variability in winter tempera-
ture series over Turkey.
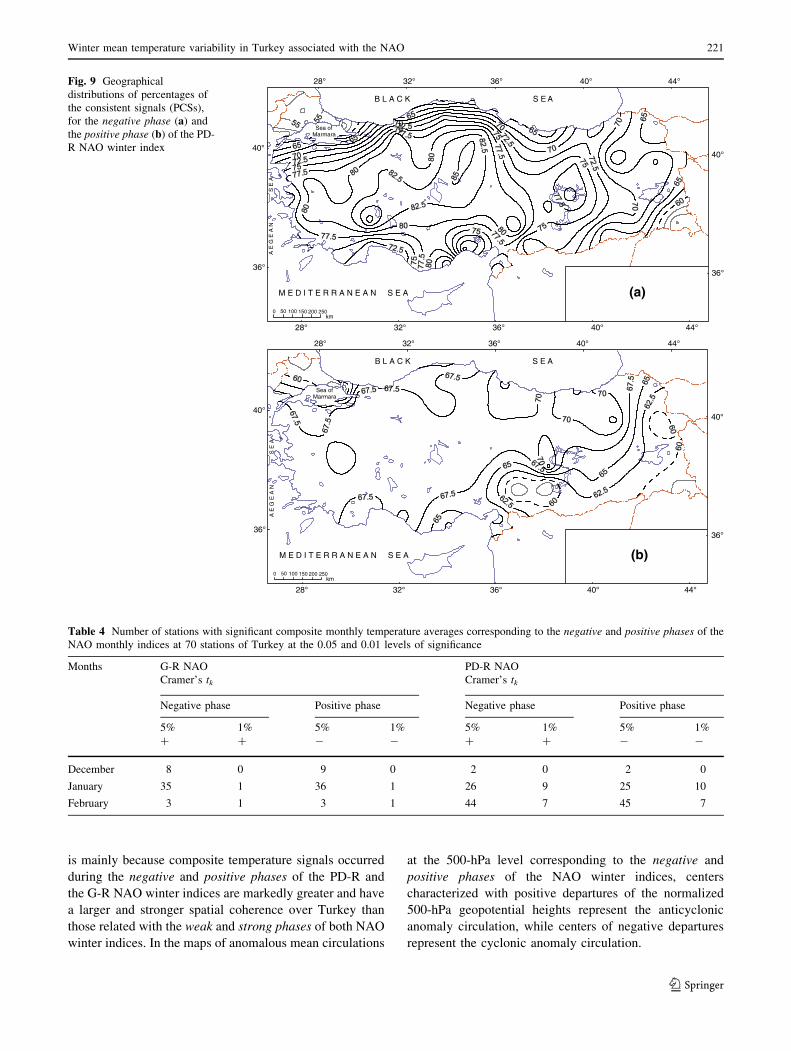
As for the consistency of composite temperature
anomalies occurred during the PD-R NAOI phases, as it
can be expected from the results of composite analysis,
majority of Turkey with the exceptions of northern
Marmara sub-region and south-eastern corner of the
Eastern Anatolia region are characterized with a pattern
of spatially coherent PCSs greater than 60% for the
negative phase of the PD-R NAOI (Fig. 9a). Turkey has a
greater country average during this event with a PCS of
0 50 100 150 200 250km
36°
40°
B L A C K S E A
M E D I T E R R A N E A N S E A
A E
G E
A N
S E
A
Sea ofMarmara
28° 32° 36° 40° 44°
28° 32° 36° 40° 44°
40°
36°
(a)
0 50 100 150 200 250km
36°
40°
B L A C K S E A
M E D I T E R R A N E A N S E A
A E
G E
A N
S E
A
Sea ofMarmara
28° 32° 36° 40° 44°
28° 32° 36° 40° 44°
40°
36°
(b)
Fig. 7 Geographical
distributions of percentages of
the consistent signals (PCSs),
for the negative phase (a) and
the positive phase (b) of the
G-R NAO winter index
Winter mean temperature variability in Turkey associated with the NAO 219
123
72.3%. The PCSs greater than 75% exhibit a large spatial
coherence over the EAN, CAN and the Aegean regions of
Turkey, with the areas of maximum PCSs greater than
80% dominated over the CAN region and the inner sub-
region of the Aegean region (Fig. 9a). These results also
statistically prove that the warm signals associated with
the negative phase of the PD-R NAOI are not random
over most of Turkey.
On the other hand, as in the PCSs for the negative
phase of the PD-R NAOI, values of the PCSs calculated
for the positive phase of the PD-R NAO winter index are
also generally greater than the PCSs for the positive phase
of the G-R NAO winter index (Figs. 7b, 9b). Country
average of the station-based PCSs is 66% for the positive
phase of the PD-R NAO winter index. Spatially coherent
area with the PCSs of about 65% to some over 70% is
characteristic for most of the country with the exceptions
of the northern Marmara sub-region, Southeastern Ana-
tolia region and eastern half of the Eastern Anatolia
region (Fig. 9b).
Composite positive and negative monthly temperature
anomalies corresponding to negative and positive phases in
the monthly PD-R NAOIs are generally similar to, or
stronger than, those in extreme phases of the same indices.
For instance, composite temperature anomalies corre-
sponding to negative (positive) phase in the PD-R NAOI in
February are positive (negative) at all stations, and com-
posite averages warmer (colder) than long-term averages
are significant at 51 (52) stations, 7 of which are at the 0.01
level (Table 4).
3.4 500-hPa level circulations during the normal
phases of the NAOI
In this section, we have only displayed and discussed the
maps of anomalous mean circulations at the 500-hPa level
corresponding to the normal phases (negative phase and
the positive phase) of the NAO winter indices, although we
prepared the maps of anomalous mean 500-hPa level cir-
culations for the extreme phases of the NAO indices. This
28° 32° 36° 40° 44°
40°
36°
0 50 100 150 200 250km
36°
40°
B L A C K S E A
M E D I T E R R A N E A N S E A
A E
G E
A N
S
E A
Sea ofMarmara
(a)
28° 32° 36° 40° 44°
40°
36°
44°40°36°32°28°
44°40°36°32°28°
0 50 100 150 200 250km
36°
40°
B L A C K S E A
M E D I T E R R A N E A N S E A
A E
G E
A N
S
E A
Sea ofMarmara
(b)
Fig. 8 Geographical
distributions of composite
normalized temperatures, during
the negative phase (a) and the
positive phase (b) of the PD-R
NAO winter index. Symbol of
the bold plus (filled inversetriangle) shows the significantly
warmer (colder) than long-term
average mean temperatures at
the 0.05 level, according to the
Cramer’s tk test
220 M. Turkes, E. Erlat
123
is mainly because composite temperature signals occurred
during the negative and positive phases of the PD-R and
the G-R NAO winter indices are markedly greater and have
a larger and stronger spatial coherence over Turkey than
those related with the weak and strong phases of both NAO
winter indices. In the maps of anomalous mean circulations
at the 500-hPa level corresponding to the negative and
positive phases of the NAO winter indices, centers
characterized with positive departures of the normalized
500-hPa geopotential heights represent the anticyclonic
anomaly circulation, while centers of negative departures
represent the cyclonic anomaly circulation.
0 50 100 150 200 250km
36°
40°
B L A C K S E A
M E D I T E R R A N E A N S E A
A E
G E
A N
S E
A
Sea ofMarmara
28° 32° 36° 40° 44°
28° 32° 36° 40° 44°
40°
36°
(a)
0 50 100 150 200 250km
36°
40°
B L A C K S E A
M E D I T E R R A N E A N S E A
A E
G E
A N
S E
A
Sea ofMarmara
28° 32° 36° 40° 44°
28° 32° 36° 40° 44°
40°
36°
(b)
Fig. 9 Geographical
distributions of percentages of
the consistent signals (PCSs),
for the negative phase (a) and
the positive phase (b) of the PD-
R NAO winter index
Table 4 Number of stations with significant composite monthly temperature averages corresponding to the negative and positive phases of the
NAO monthly indices at 70 stations of Turkey at the 0.05 and 0.01 levels of significance
Months G-R NAO
Cramer’s tk
PD-R NAO
Cramer’s tk
Negative phase Positive phase Negative phase Positive phase
5%
?
1%
?
5%
-
1%
-
5%
?
1%
?
5%
-
1%
-
December 8 0 9 0 2 0 2 0
January 35 1 36 1 26 9 25 10
February 3 1 3 1 44 7 45 7
Winter mean temperature variability in Turkey associated with the NAO 221
123
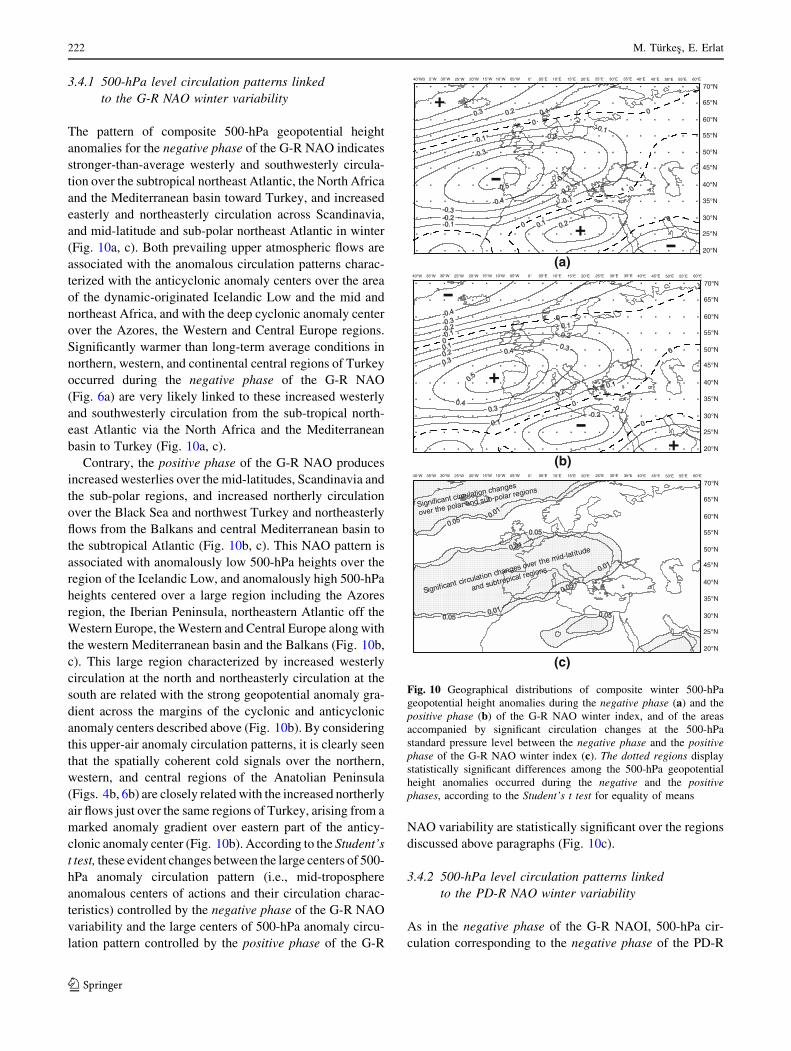
3.4.1 500-hPa level circulation patterns linked
to the G-R NAO winter variability
The pattern of composite 500-hPa geopotential height
anomalies for the negative phase of the G-R NAO indicates
stronger-than-average westerly and southwesterly circula-
tion over the subtropical northeast Atlantic, the North Africa
and the Mediterranean basin toward Turkey, and increased
easterly and northeasterly circulation across Scandinavia,
and mid-latitude and sub-polar northeast Atlantic in winter
(Fig. 10a, c). Both prevailing upper atmospheric flows are
associated with the anomalous circulation patterns charac-
terized with the anticyclonic anomaly centers over the area
of the dynamic-originated Icelandic Low and the mid and
northeast Africa, and with the deep cyclonic anomaly center
over the Azores, the Western and Central Europe regions.
Significantly warmer than long-term average conditions in
northern, western, and continental central regions of Turkey
occurred during the negative phase of the G-R NAO
(Fig. 6a) are very likely linked to these increased westerly
and southwesterly circulation from the sub-tropical north-
east Atlantic via the North Africa and the Mediterranean
basin to Turkey (Fig. 10a, c).
Contrary, the positive phase of the G-R NAO produces
increased westerlies over the mid-latitudes, Scandinavia and
the sub-polar regions, and increased northerly circulation
over the Black Sea and northwest Turkey and northeasterly
flows from the Balkans and central Mediterranean basin to
the subtropical Atlantic (Fig. 10b, c). This NAO pattern is
associated with anomalously low 500-hPa heights over the
region of the Icelandic Low, and anomalously high 500-hPa
heights centered over a large region including the Azores
region, the Iberian Peninsula, northeastern Atlantic off the
Western Europe, the Western and Central Europe along with
the western Mediterranean basin and the Balkans (Fig. 10b,
c). This large region characterized by increased westerly
circulation at the north and northeasterly circulation at the
south are related with the strong geopotential anomaly gra-
dient across the margins of the cyclonic and anticyclonic
anomaly centers described above (Fig. 10b). By considering
this upper-air anomaly circulation patterns, it is clearly seen
that the spatially coherent cold signals over the northern,
western, and central regions of the Anatolian Peninsula
(Figs. 4b, 6b) are closely related with the increased northerly
air flows just over the same regions of Turkey, arising from a
marked anomaly gradient over eastern part of the anticy-
clonic anomaly center (Fig. 10b). According to the Student’s
t test, these evident changes between the large centers of 500-
hPa anomaly circulation pattern (i.e., mid-troposphere
anomalous centers of actions and their circulation charac-
teristics) controlled by the negative phase of the G-R NAO
variability and the large centers of 500-hPa anomaly circu-
lation pattern controlled by the positive phase of the G-R
NAO variability are statistically significant over the regions
discussed above paragraphs (Fig. 10c).
3.4.2 500-hPa level circulation patterns linked
to the PD-R NAO winter variability
As in the negative phase of the G-R NAOI, 500-hPa cir-
culation corresponding to the negative phase of the PD-R
40°W3 5°W 30°W 25°W 20°W 15°W 10°W 05°W 0° 05°E 10°E 15°E 20°E 25°E 30°E 35°E 40°E 45°E 50°E 55°E 60°E
70°N
65°N
50°N
45°N
40°N
35°N
30°N
25°N
20°N
55°N
60°N
(a)
+
+
-
-40°W 35°W 30°W 25°W 20°W 15°W 10°W 05°W 0° 05°E 10°E 15°E 20°E 25°E 30°E 35°E 40°E 45°E 50°E 55°E 60°E
70°N
65°N
50°N
45°N
40°N
35°N
30°N
25°N
20°N
55°N
60°N
+
-
-+
(b) 40°W 35°W 30°W 25°W 20°W 15°W 10°W 05°W 0° 05°E 10°E 15°E 20°E 25°E 30°E 35°E 40°E 45°E 50°E 55°E 60°E
70°N
65°N
50°N
45°N
40°N
35°N
30°N
25°N
20°N
55°N
60°N
(c)
Significant circulation changes over the mid-latitude
and subtropical regions
Significant circulation changes
over the polar and sub-polar regions
Fig. 10 Geographical distributions of composite winter 500-hPa
geopotential height anomalies during the negative phase (a) and the
positive phase (b) of the G-R NAO winter index, and of the areas
accompanied by significant circulation changes at the 500-hPa
standard pressure level between the negative phase and the positivephase of the G-R NAO winter index (c). The dotted regions display
statistically significant differences among the 500-hPa geopotential
height anomalies occurred during the negative and the positivephases, according to the Student’s t test for equality of means
222 M. Turkes, E. Erlat
123
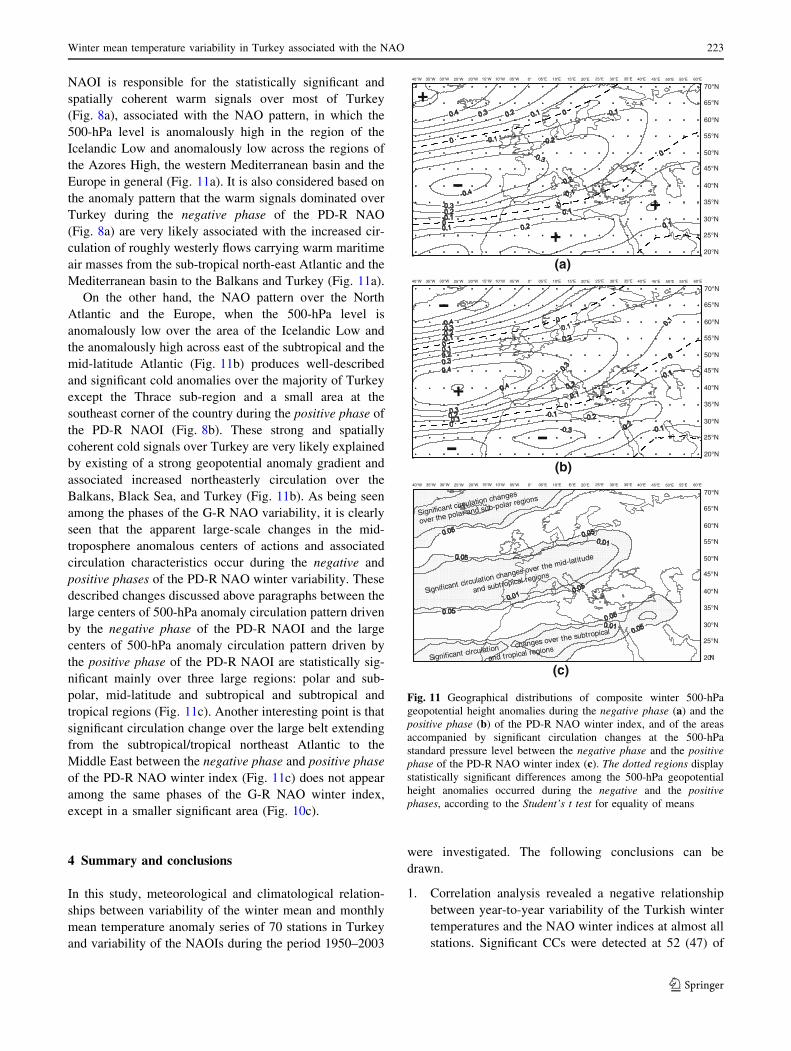
NAOI is responsible for the statistically significant and
spatially coherent warm signals over most of Turkey
(Fig. 8a), associated with the NAO pattern, in which the
500-hPa level is anomalously high in the region of the
Icelandic Low and anomalously low across the regions of
the Azores High, the western Mediterranean basin and the
Europe in general (Fig. 11a). It is also considered based on
the anomaly pattern that the warm signals dominated over
Turkey during the negative phase of the PD-R NAO
(Fig. 8a) are very likely associated with the increased cir-
culation of roughly westerly flows carrying warm maritime
air masses from the sub-tropical north-east Atlantic and the
Mediterranean basin to the Balkans and Turkey (Fig. 11a).
On the other hand, the NAO pattern over the North
Atlantic and the Europe, when the 500-hPa level is
anomalously low over the area of the Icelandic Low and
the anomalously high across east of the subtropical and the
mid-latitude Atlantic (Fig. 11b) produces well-described
and significant cold anomalies over the majority of Turkey
except the Thrace sub-region and a small area at the
southeast corner of the country during the positive phase of
the PD-R NAOI (Fig. 8b). These strong and spatially
coherent cold signals over Turkey are very likely explained
by existing of a strong geopotential anomaly gradient and
associated increased northeasterly circulation over the
Balkans, Black Sea, and Turkey (Fig. 11b). As being seen
among the phases of the G-R NAO variability, it is clearly
seen that the apparent large-scale changes in the mid-
troposphere anomalous centers of actions and associated
circulation characteristics occur during the negative and
positive phases of the PD-R NAO winter variability. These
described changes discussed above paragraphs between the
large centers of 500-hPa anomaly circulation pattern driven
by the negative phase of the PD-R NAOI and the large
centers of 500-hPa anomaly circulation pattern driven by
the positive phase of the PD-R NAOI are statistically sig-
nificant mainly over three large regions: polar and sub-
polar, mid-latitude and subtropical and subtropical and
tropical regions (Fig. 11c). Another interesting point is that
significant circulation change over the large belt extending
from the subtropical/tropical northeast Atlantic to the
Middle East between the negative phase and positive phase
of the PD-R NAO winter index (Fig. 11c) does not appear
among the same phases of the G-R NAO winter index,
except in a smaller significant area (Fig. 10c).
4 Summary and conclusions
In this study, meteorological and climatological relation-
ships between variability of the winter mean and monthly
mean temperature anomaly series of 70 stations in Turkey
and variability of the NAOIs during the period 1950–2003
were investigated. The following conclusions can be
drawn.
1. Correlation analysis revealed a negative relationship
between year-to-year variability of the Turkish winter
temperatures and the NAO winter indices at almost all
stations. Significant CCs were detected at 52 (47) of
40°W 35°W 30°W 25°W 20°W 15°W 10°W 05°W 0° 05°E 10°E 15°E 20°E 25°E 30°E 35°E 40°E 45°E 50°E 55°E 60°E
70°N
65°N
50°N
45°N
40°N
35°N
30°N
25°N
20°N
55°N
60°N
(a)
+
+
-+
40°W 35°W 30°W 25°W 20°W 15°W 10°W 05°W 0° 05°E 10°E 15°E 20°E 25°E 30°E 35°E 40°E 45°E 50°E 55°E 60°E
70°N
65°N
50°N
45°N
40°N
35°N
30°N
25°N
20°N
55°N
60°N
(b)
+
-
- -
40°W 35°W 30°W 25°W 20°W 15°W 10°W 05°W 0° 05°E 10°E 15°E 20°E 25°E 30°E 35°E 40°E 45°E 50°E 55°E 60°E
70°N
65°N
50°N
45°N
40°N
35°N
30°N
25°N
20°N
55°N
60°N
(c)
Significant circulation changes over the mid-latitude
and subtropical regions
Significant circulation changes over the subtropical
and tropical regions
Significant circulation changes
over the polar and sub-polar regions
Fig. 11 Geographical distributions of composite winter 500-hPa
geopotential height anomalies during the negative phase (a) and the
positive phase (b) of the PD-R NAO winter index, and of the areas
accompanied by significant circulation changes at the 500-hPa
standard pressure level between the negative phase and the positivephase of the PD-R NAO winter index (c). The dotted regions display
statistically significant differences among the 500-hPa geopotential
height anomalies occurred during the negative and the positivephases, according to the Student’s t test for equality of means
Winter mean temperature variability in Turkey associated with the NAO 223
123
70 stations for the PD-R (G-R) NAOI. On the other
hand, CC between the country average of normalized
winter mean temperatures and the NAOIs is of -0.37
for the G-R NOAI and of -0.39 for the PD-R NAOI.
This result reveals a good agreement with the correla-
tion results between winter NAOIs and the winter mean
temperatures of Greece as a whole (Feidas et al. 2004).
2. Winter composite temperatures mostly increased dur-
ing the weak phases of the NAOIs and decreased
during the strong phases of the NAOIs. Increased
temperature conditions are not significant during the
weak phase. On the other hand, negative anomalies are
greater particularly during the strong phase of the G-R
NAOI compared with the strong phase of the PD-R
NAOI. Most of the cold signals during the strong
phase of the G-R NAOI are found in the western and
central regions of the Anatolian Peninsula. These
results mostly coincide with the study carried out by
Pozo-Vazquez et al. (2001), indicating the relationship
between the NAO and temperatures has different
characteristics in different parts of the Europe, espe-
cially in the case of weak phase. Our results are also in
a good agreement with the study by Castro-Diez et al.
(2002) on the linkages between the NAO and winter
temperature variability in the southern Europe. Their
studies indicated that influence of the NAO on
temperature variability over the southern Europe is
much more complex than those over the Central and
Northern Europe, being closely sensitive to the loca-
tion of the SLP anomaly centers.
3. Because Turkey is also less influenced by the extreme
NAOI variability especially during extremely negative
events, we further investigated the likely influences of
the normal phases of the NAO winter indices on
temperature variability in Turkey. In this frame, we
found that winter temperature signals associated with
the normal phases of the NAO indices are significantly
stronger than those computed for the extreme phases of
the NAOIs, and have a much larger spatial coherence
over Turkey. Significantly, increased and decreased
temperature conditions are more evident for the
negative and positive phases of the PD-R NAO
variability. For instance, warmer (colder) than long-
term average conditions occurred during the negative
phase (positive phase) of the PD-R NAOI is statisti-
cally significant at 63 (64) stations, 49 (50) of which
are at the 0.01 level of significance, while statistically
significant warm (cold) signals related with the
negative phase (positive phase) of the G-R NAOI are
detected at 39 (38) stations, 8 (4) of which are at the
0.01 level.
4. In parallel with the significant and spatially coherent
temperature signals of the normal phases of the PD-R
NAOI, percentages of the consistent signals for the
positive and particularly the negative phases of the PD-
R NAOI exhibit the largest spatial distribution with the
greatest PCS values over Turkey in comparison with
the PCSs for the normal phases of the G-R NAOI.
During the negative phase of the PD-R NAOI, Turkey
also has the greatest country average PCS with a value
of 72.3%, and the PCSs greater than 75% have a large
spatial coherence over the Eastern Anatolia, Central
Anatolia and the Aegean regions of Turkey.
5. Spatially coherent and significantly higher tempera-
tures occurred during the negative phases of both NAO
winter indices over most of Turkey are very likely
linked to the increased cyclonic activity and associated
increased westerly and southwesterly circulation pro-
ducing warm air advection over the Mediterranean
basin toward Turkey. Patterns of the positive phases of
the NAO variability are associated with anomalously
low 500-hPa heights distributed over the region of the
Icelandic Low, and anomalously high 500-hPa heights
centered across the subtropical northeast Atlantic, the
western Mediterranean basin and the Europe in
general. Spatially coherent cold signals over the
majority of the Anatolia Peninsula are very likely
linked to the increased northerly and northeasterly
airflows over the Black Sea, Balkans, and northwest
Turkey, causing a cold air advection from the Eastern
Europe and the Russian plains to Turkey and the
central Mediterranean basin.
6. The results of correlation, composite average, and PCS
analyses clearly revealed that the normal phases of the
PD-R NAO winter index accounts the best for spatial
and temporal patterns of winter temperature changes
and variability in Turkey in comparison with the
normal phases of the G-R NAOIs.
7. We also realized, based on comparisons of our results
with the previous findings by Kutiel et al. (2002) and
Kutiel and Turkes (2005), and more recently by
Turkes and Erlat (2008), that extreme phases of the
North Sea–Caspian Pattern Index (NCPI) and the
Arctic Oscillation Index (AOI) are more capable than
the extreme phases of both NAOIs for explaining the
nature and magnitude of corresponding year-to-year
variability and composite changes in winter mean
temperatures in Turkey. This could be attributed to the
fact that both the NCP and the AO teleconnections
represent atmospheric oscillation patterns sourced and
originated from further northern latitudes. Particularly,
the NCP represents eastern regions over the Caspian
Sea and its surrounding regions that are also linked the
thermally originated semi-permanent Asiatic pressure
centers (i.e., very likely the Siberian high in winter,
and the Asiatic low (monsoon) in summer).
224 M. Turkes, E. Erlat
123
Acknowledgments We would like to thank the Data Support Sec-
tion of the NCAR (Boulder, Colorado, USA) for providing the 500-
hPa geopotential height data, and P. D. Jones (Climatic Research
Unit, School of Environmental Sciences, University of East Anglia,
Norwich, UK) for providing monthly mean SLP data for the Rey-
kjavik, Ponta Delgada, and Gibraltar stations. We also explain our
appreciation to the anonymous reviewers for their helpful comments
and suggestions on the manuscript.
References
Ben-Gai T, Bitan A, Manes A, Alpert P, Kushnir Y (2001)
Temperature and surface pressure anomalies in Israel and the
North Atlantic Oscillation. Theor Appl Climatol 69:171–177
Beranova R, Huth R (2008) Time variations of the effects of
circulation variability modes on European temperature and
precipitation in winter. Int J Climatol 28:139–158
Castro-Diez Y, Pozo-Vazquez D, Rodrigo FS, Esteban-Parra MJ
(2002) NAO and winter temperature variability in southern
Europe. Geophys Res Lett 29:1–4
Esteban-Parra MJ, Pozo-Vazquez D, Castro-Dıez Y, Trigo R (2003)
NAO influence on maximum and minimum temperature of the
Iberian Peninsula. In: Proceedings ‘‘14th symposium on global
change and climate variations’’. American Meteorological
Society, USA, CD-ROM
Feidas H, Makrogiannis T, Bora-Senta E (2004) Trend analysis of air
temperature time series in Greece and their relationship with
circulation using surface and satellite data: 1955–2001. Theor
Appl Climatol 79:185–208
Geopotential Height Data. The Data Support Section of the NCAR
(2006) Accessed 17 Apr. http://www.dss.ucar.edu/datasets
Gimeno L, de la Torre L, Nieto R, Garcıa-Herrera R, Hernandez E,
Ribera P (2003) Changes in the relationship NAO–Northern
Hemisphere temperature due to solar activity. Earth Planet Sci
Lett 206:15–20
Hasanean HM (2004) Wintertime surface temperature in Egypt in
relation to the associated atmospheric circulation. Int J Climatol
24:985–999
Hurrell JW (1996) Influence of variations in extratropical wintertime
teleconnections on Northern Hemisphere temperature. Geophys
Res Lett 23:665–668
Hurrell JW, van Loon H (1997) Decadal variations in climate
associated with the North Atlantic Oscillation. Clim Change
36:301–326
Hurrell JW, Kushnir Y, Ottersen G, Visbeck M (2003) An overview
of the North Atlantic Oscillation. Geophys Monogr 134:1–35
Kutiel H, Turkes M (2005) New evidence for the role of the North
Sea—Caspian Pattern on the temperature and precipitation
regimes in continental central Turkey. Geografiska Annaler Ser
A Phys Geogr 87:501–513
Kutiel H, Maheras P, Turkes M, Paz S (2002) North Sea—Caspian
Pattern (NCP)—an upper level atmospheric teleconnection
affecting the eastern Mediterranean–implications on the regional
climate. Theor Appl Climatol 72:173–192
Matyasovszky I (2003) The relationship between NAO and temper-
ature in Hungary and its nonlinear connection with ENSO. Theor
Appl Climatol 74:69–75
Pozo-Vazquez D, Esteban-Parra MJ, Rodrigo FS, Castro-Diez Y
(2001) A study of NAO variability and its possible non-linear
influences on European surface temperature. Clim Dyn 17:701–
715
Tatlı H, Dalfes N, Mentes S (2005) Surface air temperature variability
over Turkey and its connection to large-scale upper air
circulation via multivariate techniques. Int J Climatol 25:331–
350
Turkes M, Erlat E (2003) Precipitation changes and variability in
Turkey linked to the North Atlantic Oscillation during the period
1930–2000. Int J Climatol 23:1771–1796
Turkes M, Erlat E (2005) Climatological responses of winter
precipitation in Turkey to variability of the North Atlantic
Oscillation during the period 1930–2001. Theor Appl Climatol
81:45–69
Turkes M, Erlat E (2008) Influences of the Arctic Oscillation on the
variability of winter mean temperatures in Turkey. Theor Appl
Climatol 92:75–85
Turkes M, Sumer UM, Demir _I (2002) Re-evaluation of trends and
changes in mean, maximum and minimum temperatures of
Turkey for the period 1929–1999. Int J Climatol 22:947–977
Wallace JM, Zhang Y, Bajuk L (1996) Interpretation of interdecadal
climate trends in Northern Hemisphere surface air temperature. J
Clim 9:249–259
Werner A, Schonwiese CD (2002) A statistical analysis of the North
Atlantic Oscillation and its impact on European temperature.
Glob Atmos Ocean Syst 8:293–306
Xoplaki E (2002) Climate variability over the Mediterranean. PhD
dissertation, University of Bern, Switzerland
Winter mean temperature variability in Turkey associated with the NAO 225
123