Embed Size (px)
Citation preview

Winter 2017
Journal of Health Care Finance www.HealthFinanceJournal.com
Hospitals with Higher Direct Cost Ratios Have Lower Readmission Rates
Ge Bai, PhD, CPA
Assistant Professor of Accounting
The Johns Hopkins Carey Business School
Tim Xu, MPP
The Johns Hopkins School of Medicine
Andrew T. Rogers, BS
The Johns Hopkins School of Medicine
Gerard F. Anderson, PhD
The Johns Hopkins Bloomberg School of Public Health

2
Hospitals with Higher Direct Cost Ratios Have Lower Readmission Rates
ABSTRACT
Utilizing limited resources to generate the best quality of care for patients is one of the most
pressing challenges faced by hospital executives. In this study, we examine how a hospital’s
direct cost ratio, defined as the cost directly related to patient care divided by the total cost of
patient care, is associated with an important quality metric, the Medicare 30-day unplanned
readmission rate. Using the 2014 Medicare Cost Report, Hospital Compare, and Final Rule Data
from the Center for Medicare & Medicaid Services (CMS), we find that one standard deviation
increase in the direct cost ratio is associated with fifteen fewer readmissions per 10,000
discharges, holding total patient care cost per adjusted discharge constant. Supplementary
analyses show that the direct (indirect) cost per adjusted discharge is negatively (positively)
associated with readmission rates. Our study recognizes the implication of cost structure on one
important measure of hospital quality of care. The results provide hospital executives with useful
guidance for making budgetary decisions.
I. Introduction
One of the goals of cost accounting research is to analyze how cost allocation affects
organizational outcomes and to propose the most appropriate course of action based on cost
efficiency and capability. For hospitals, perhaps no other organizational outcome is more critical
than the quality of care (American Hospital Association 2016).1 In this study, we examine
whether hospital cost allocation, specifically the relation between the cost of direct patient care
and the total cost of patient care, affects the quality of care.
The hospital industry is experiencing significant reforms in which new initiatives that link
hospital payments with quality of care are being tested and can impact hospital profitability
considerably (Bai and Anderson 2016). For example, in 2012, Medicare started the Hospital
Readmissions Reduction Program (HRRP), which penalizes hospitals for up to 3% of their
Medicare payments if the hospital’s readmission rates for certain medical conditions are higher
than expected based on its patient population characteristics.2
HRRP and other payment
initiatives provide financial incentives for hospitals to reduce readmission rates as well as to
improve on other quality metrics, such as nosocomial infection rates and the level of care
coordination.3 Hospital executives, therefore, are under pressure to improve care quality in the
face of budgetary constraints. It is necessary for them to make informed resource allocation
decisions that lead to improved quality by knowing how cost allocation affects quality.
1 In 2014, the United States spent $972 billion or 6 percent of its gross domestic product (GDP) on hospital care and
the proportion of hospital spending relative to GDP is projected to keep increasing (CMS 2014; World Bank 2015;
Keehan et al. 2016). 2 For more information on HRRP, please refer to https://www.cms.gov/medicare/medicare-fee-for-service-
payment/acuteinpatientpps/readmissions-reduction-program.html. 3 For more information on CMS’ hospital quality initiatives, please refer to ttps://www.cms.gov/Medicare/Quality-
Initiatives-Patient-Assessment-Instruments/HospitalQualityInits/index.html.

3
Most cost accounting studies regarding hospital cost behaviors examined hospitals’ response to a
changing regulatory environment (Eldenburg and Soderstrom 1996; Eldenburg and Kallapur
1997; Eldenburg and Kallapur 2000; Kallapur and Eldenburg 2005; Holzhacker, Krishnan, and
Mahlendorf 2015) Our paper extends this literature by examining how the cost structure can
influence hospital quality of care. Specifically, we focus on the relationship between direct
patient care cost and total patient care cost, an aspect of cost structure that has received relatively
little attention.
The clinical literature has suggested a positive link between the overall hospital spending and
care quality. Joynt, Orav, and Jha (2011) showed that high-volume hospitals incurred higher
costs, but had lower readmission rates for patients with congestive heart failure. Stukel et al.
(2012) found that hospital spending is positively associated with care quality, as measured by
mortality, readmissions, and cardiac event rates. Jha, Orav and Epstein (2011) documented that
high-cost hospitals provided better care and generated greater patient satisfaction than low-cost
hospitals. Romley, Jena, and Goldman (2011) concluded that higher spending was associated
lower mortality for six common medical conditions. Silber et al. (2010) suggest that surgical
patients in hospitals with higher costs had lower mortality. Romley et al. (2014) found that for
children undergoing congenital heart disease surgery, hospital cost is negatively associated with
mortality. While these clinical studies provide important insights into the positive link between
hospital cost and quality, they all measure costs at the aggregate level and thus have limited
ability to inform hospital executives of which specific types of spending are more effective for
improving quality of care.
Hospital patient care cost (or operating cost) can be categorized into the direct cost and the
indirect cost, based on whether a cost item is traceable to patient care services. Direct costs are
traceable to patient care, such as operating room and radiology costs. Indirect costs are related to
but not directly traceable to patient care, such as cafeteria and administrative costs. Since direct
costs are more closely linked to patient care services than indirect costs, a greater percentage of
spending on direct cost items might have a more beneficial effect on care quality than spending
on indirect cost items. We hypothesize, therefore, that a higher direct cost ratio, defined as the
direct cost divided by the total cost of patient care, will be positively associated with care quality.
We use the 2014 Medicare Cost Report, released in spring 2016 by the Center for Medicare &
Medicaid Services (CMS), combined with data from the 2014 CMS Hospital Compare, the 2014
CMS Final Rule Data, and the 2014 U.S. Census Model-based Small Area Health Insurance
Estimate (SAHIE) to create our sample for hypothesis testing. We measured hospital care quality
using Medicare 30-day unplanned readmission rates, which are calculated by CMS after
adjusting for patient case mix. Our findings are threefold. First, holding the total patient care cost
per adjusted discharge constant, a one standard deviation increase in the direct cost ratio (0.08) is
associated with a fifteen-basis-point decrease in the readmission rate; (ii) for most hospitals,
holding the indirect cost per adjusted discharge constant, a $1,000 increase in the direct cost per
adjusted discharge is associated with a three-basis-point decrease in readmission rates; (iii) for
most hospitals, holding direct cost per adjusted discharge constant, a $1,000 increase in the
indirect cost per adjusted discharge is associated with a four-basis-point increase in readmission
rates. These findings are consistent with H1 that the direct cost ratio is positively associated with
readmission rates.

4
Our study demonstrates that cost allocation has a tangible effect on hospital care quality. This
study is also the first to focus on the direct cost ratio, an understudied aspect of hospital cost
structure. By differentiating direct cost from indirect cost, our results can be of significant value
to hospital executives attempting to improve outcomes under budgetary constraints.
The paper is organized as follows. The next section develops the hypothesis. We then discuss
data and research methods. The following section presents study results. The final section
concludes the paper and suggests directions for future research.
II. HYPOTHESIS DEVELOPMENT
Health care quality is affected by the clinical aspects of health care settings and processes
(Donabedian 1988; Calvillo–King, et al. 2013; Rogers et al. 2016). Picone, Sloan, Chou, and
Taylor (2003) documented that higher hospital input use and longer length of stay improve care
outcomes. A number of studies have found that clinical interventions, such as medication
reconciliation, nursing staffing, discharge planning, care transitions, patient education, and post-
discharge care, can improve care quality (Bradley et al. 2013; McHugh and Ma 2013;
Dharmarajan and Krumholz, 2014; Kripalani et al. 2014; Horwitz et al. 2015). Recently, Rogers
et al. (2016) showed that hospital spending on occupational therapy is positively associated with
the quality of care. These studies imply that improving clinical processes can benefit the quality
of care.
The costs of hospital patient care can be categorized into two groups based on the traceability of
the cost items —the direct patient care cost (hereafter, direct cost) and the indirect general
service cost (hereafter, indirect cost).4 Direct costs include those generated from inpatient
services, outpatient services, and other clinical services. The indirect cost includes general
services that are not directly traceable to patient care, such as cafeteria costs. The objective of
this study is to understand how hospitals can allocate their budget efficiently in order to improve
care quality. Based on the services provided for direct and indirect costs and using the clinical
literature on care quality as a guide, we hypothesize that the association between costs and the
quality of care will vary depending on whether the cost is direct or indirect. We hypothesize that
greater allocation to direct cost will be associated with higher quality of care than allocation to
indirect costs. In other words, holding the total patient care cost constant, a higher proportion of
direct costs (i.e., a higher direct cost ratio) will lead to higher quality of care. We state our
hypothesis formally as follows.
H1: Holding total patient care cost constant, hospitals with higher direct cost ratios have higher
quality of care.
4 Hospitals also incur costs unrelated to patient care, such as gift shops.

5
III. Data & Methods
Sample Selection
We obtain data from four sources. The 2014 Medicare cost reports were published by the Center
for Medicare and Medicaid Services (CMS).5 The cost reports contain financial and operational
information for all Medicare-certified hospitals in the nation in their fiscal years beginning
between October 1, 2013 and September 30, 2014. The 2014 CMS Hospital Compare database
provides case-mix adjusted readmission rates for Medicare patients of all conditions as a part of
its rating of hospitals. The 2014 CMS Final Rule Data provides a case mix index and wage index
for all acute care hospitals that received Medicare inpatient reimbursement based on the Inpatient
Prospective Payment System (IPPS). The 2014 U.S. Census Model-based Small Area Health
Insurance Estimate (SAHIE) for counties includes annual estimated median household income
for each county in the nation. The merged dataset from the four sources contains 3,004 acute care
hospitals that do not have missing values on the variables required for our statistical analysis. We
excluded one hospital that reported higher direct costs than the total cost, three hospitals that
reported over $100,000 direct cost per adjusted discharge and one hospital that reported over
$100,000 indirect cost per adjusted discharge. The final dataset had 2,999 acute care hospitals.
Readmission Rates
We use the thirty-day readmission rates from all medical conditions for Medicare patients
published by CMS Hospital Compare program as a measure of quality of care. The Hospital
Compare program provides data on the overall readmission rate for each hospital. It is calculated
as unplanned admissions to hospitals within 30 days of discharge from the initial hospitalization,
regardless of the readmission reason.6 Readmission rates have widely been used in the clinical
literature as a quality care indicator (e.g., Taylor, Whellan, and Sloan 1999; Patrick and Conway
2014). Readmission rates are also used by Medicare’s Hospital Readmissions Reduction
Program (HRRP), which is a quality-improvement initiative that penalizes hospitals when their
30-day readmission rates for common medical conditions (i.e., heart attack, heart failure,
pneumonia, hip/knee replacement, and chronic obstructive pulmonary disease) are higher than
what would be expected based on their patient population characteristics (Gilman et al., 2015).
Direct Cost Ratio
The CMS cost reports have detailed category information for each Medicare-certified hospital’s
cost. The direct cost ratio is measured as direct costs divided by the total cost of patient care. The
total cost of patient care refers to the cost determined by the CMS to be associated with care for
patient care and includes both direct patient care cost and indirect general service cost and
excludes items unrelated to the patient care provided by the hospital, such as services of the gift
shop and private physicians’ offices. The direct cost include cost items generated from inpatient
services (e.g., intensive care units and nursery), ancillary services (e.g., operating room and
anesthesiology), outpatient services costs (e.g., clinic and emergency), and other clinical services
(e.g., ambulance services and organ acquisition). The indirect cost includes cost items incurred
for general services, which are indirectly linked with patient care: building and equipment,
5 CMS is operated by the U.S. Department of Health and Human Services.
6 For more information about the measure, please visit https://www.medicare.gov/hospitalcompare/Data/30-day-
measures.html and http://kff.org/medicare/issue-brief/aiming-for-fewer-hospital-u-turns-the-medicare-hospital-
readmission-reduction-program/.

6
employee benefits, administrative and general, maintenance and repairs, plant operations,
laundry and linen services, housekeeping, dietary, cafeteria, personnel maintenance, nursing
administration, central services and supply, pharmacy, medical records, social service, and other
general services.
While the direct cost ratio captures the proportion of resources invested in clinical services, it
might be argued that since our quality of care measure—the readmission rate—pertains to
inpatient care only, the inpatient cost ratio (i.e., the inpatient care cost divided by the total cost of
patient care) instead of the direct cost ratio should be used in the analyses. The process of
inpatient care, however, is directly linked to ancillary services, such as anesthesiology and
radiology, and outpatient services, such as emergency and observation beds. It is difficult, if not
impossible, to quantify the proportion of inpatient usage of ancillary and outpatient services from
the data provided in CMS cost reports, a feature that prevents us from generating an accurate
proxy to measure the cost incurred only for inpatient services in relation to the total cost of
patient care.
Empirical Analysis
We use the model specified in Equation (1) to test H1. A positive coefficient on Direct cost
ratio would provide evidence consistent with H1. Given that this study’s focus is on how quality
of care varies in relation to the direct cost ratio when the total cost is held constant, we include
the total patient care cost per adjusted discharge as a control variable in the model. We use the
number of adjusted discharges as the scaling variable for cost because hospitals differ widely in
their inpatient visits and outpatient discharges. The number of adjusted discharge is calculated as
the number of inpatient discharges multiplied by the ratio of total gross revenue to inpatient
gross revenue, based on the assumption that outpatient output can be converted to “equivalent
inpatient discharges” according to the gross revenue (White and Wu 2014; Bai and Anderson
2016). Besides output volume, clinical complexity and labor wage level also vary significantly
across hospitals. As a result, we include each hospital’s case mix index and wage index in the
denominator to make cost per adjusted discharge more comparable across hospitals, consistent
with previous literature (Bai and Anderson 2016; Bai 2016). Case mix index measures the
relative clinical complexity of the mix of Medicare patients treated at a given hospital, with a
higher value indicating a more seriously ill patient population.7 Wage index measures the
geographic differences in the price of labor that each hospital faces within its labor market.8
We include a set of hospital characteristics as control variables, which have been identified as
factors influencing hospital behaviors and outcomes by the accounting and health economics
7 For more information on Medicare case mix index, please refer to https://www.cms.gov/Medicare/Medicare-Fee-
for-Service-Payment/AcuteInpatientPPS/Acute-Inpatient-Files-for-Download-Items/CMS022630.html 8 For more information on Medicare case mix index, please refer to https://www.cms.gov/Medicare/Medicare-Fee-
for-Service-Payment/AcuteInpatientPPS/wageindex.html

7
literature (Eldenburg and Kallapur 2000; Bai et al. 2010; Holzhacker et al. 2015; Bai and
Anderson 2016). Nonprofit (For-profit) is a dummy variables that takes the value of 1 if a
hospital’s ownership type is nonprofit (for-profit) and 0 otherwise, respectively. System is a
dummy variable that takes the value of 1 if a hospital is affiliated with a health system and 0
otherwise. Rural is a dummy variable that takes the value of 1 if a hospital is located in a rural
area and 0 if otherwise. Teaching is a dummy variable that takes the value of 1 if a hospital is
involved in approved graduate medical education programs and 0 if otherwise. Beds measures
the number of beds in a hospital. Average length of stay is calculated as the total inpatient days
of all patients divided by the number of discharges. Medicare% and Medicaid% measure the
percentages of discharges covered by Medicare or Medicaid, respectively. Besides these hospital
characteristics, we control for the median household income for the county where a hospital is
located in the model, because it has been shown that the socioeconomic status of patients is
associated with care quality (Fiscella et al. 2000). Variable definitions are listed in Table 1.
[Insert Table 1 Here]
IV. Results
Descriptive Statistics
In Table 2, we present descriptive statistics of the variables used in the empirical analyses. On
average, 16% of Medicare inpatient discharges lead to readmission, with a standard deviation of
1.06%. Hospitals on average have 52% of total patient care cost incurred for direct patient care
services, with a standard deviation of 8%. The average cost per adjusted discharge is $7,931. In
the sample, 60% are nonprofit, 24% are for-profit, and the remaining 16% are government
hospitals. 61% of hospitals are affiliated with a health system, 28% of hospitals are located in
rural areas, and 34% are teaching hospitals. Hospitals on average had 203 beds, with a mean
length of stay of 4.4 days. On average, Medicare insures 36% of all discharges and Medicaid 12%
The average median household income across the counties where hospitals located is $52,097.
[Insert Table 2 Here]
Regression Analysis
In Table 3 Column (1), we report the estimation result for Equation (1). The coefficient of Direct
cost ratio is -1.814 (p<0.001), suggesting that, ceteris paribus, a one standard deviation increase
in direct cost ratio (0.08) is associated with fifteen fewer readmission per 10,000 discharges,
consistent with H1 that hospital direct cost ratio is associated with lower readmission rates.9 To
examine the possible nonlinear relationship between the direct cost ratio and readmission rates,
we include the square of the direct cost ratio in the model and report the estimation result in
Table 3 Column (2). Neither the coefficient of the direct cost ratio nor the coefficient of its
square is statistically significant.10
9 The coefficient on Direct cost ratio, -1.814, multiplied by 0.08.
10 These results, however, do not necessarily suggest that readmission rates are always positively associated with the
direct cost ratio regardless of how large the ratio is. The median ratio in the sample is 0.52 and 95% of hospitals
have their ratios below 64%. The negative association between direct cost ratios and readmission rates is unlikely to
exist beyond a certain relative range.
8
In column (1), a higher total patient care cost per adjusted discharge is associated with lower
readmission rates, consistent with previous findings that higher spending is linked to higher
quality (Joynt, Orav, and Jha 2011; Stukel et al. 2012). In both columns, for-profit and teaching
hospitals have higher readmission rates than government and non-teaching hospitals,
respectively. System-affiliated hospitals have lower readmission rates than independent hospitals.
Larger hospitals and hospitals with patients having longer periods of stay have higher
readmission rates. Finally, hospitals having more Medicaid patients are associated with higher
readmission rates. These findings are consistent with previous health service literature on
hospital care quality (Keeler et al. 1992; Sloan 2000; Tsai et al. 2013; Gohil et al. 2015; Kim et
al. 2016). [Insert Table 3 Here]
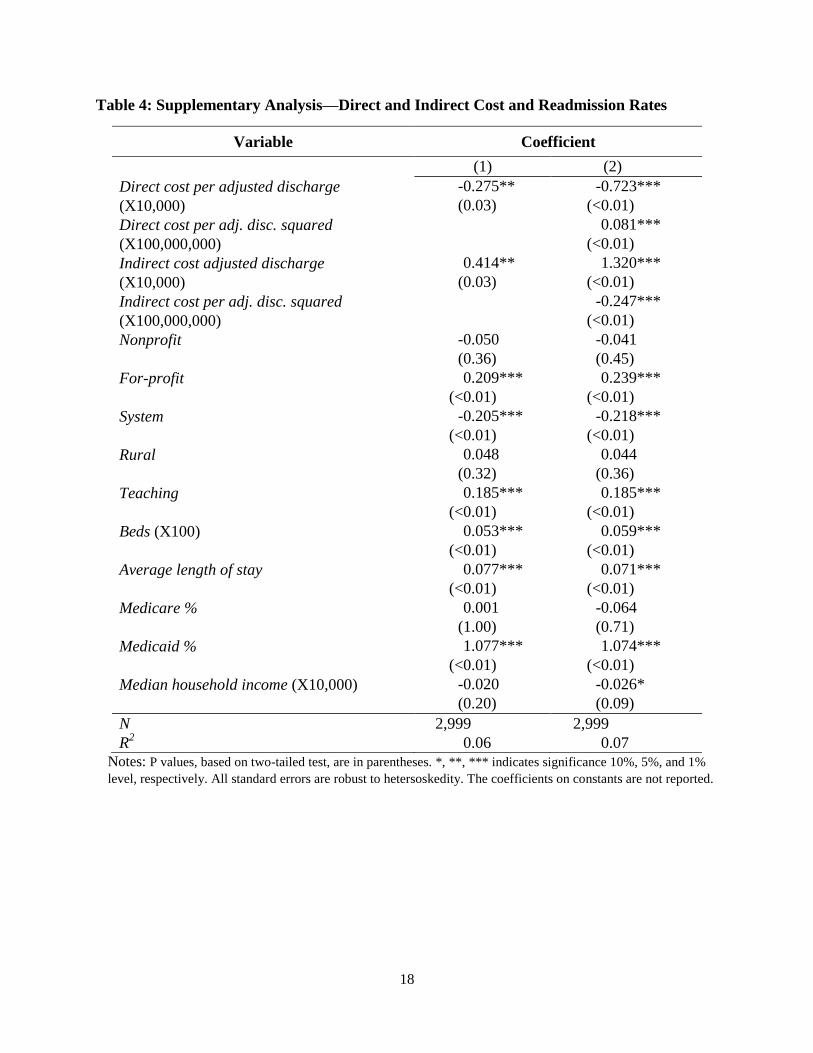
Supplementary Analysis
The negative association between direct cost ratios and readmission rates suggests that holding
total cost per adjusted discharge constant, a larger proportion of direct costs incurred is
associated with fewer readmissions. In other words, every dollar spent directly on patient care is
more effective on lowering readmission rates than one dollar spent indirectly on patient care. To
further illustrate this relationship, we regress readmission rates on the direct cost per adjusted
discharge (i.e., direct cost divided by adjusted discharge, case mix index, and wage index) and
the indirect cost per adjusted discharge (i.e., indirect cost divided by adjusted discharge, case mix
index, and wage index), while including all control variables listed in Equation (1). This model
tests how the spending on direct (indirect) cost affects readmission rates when the spending on
indirect (direct) remains constant. The estimation results are reported in Table (4). [Insert Table 4
Here]
As shown in Column (1), the coefficient of direct cost per adjusted discharge is -0.275 (p=0.03)
while the coefficient of indirect cost per adjusted discharge is 0.414 (p=0.03), suggesting that the
cost-quality association has opposite directions for the direct cost versus the indirect cost. A
$1,000 increase in the direct cost per adjusted discharge is associated with three fewer
readmissions per 10,000 discharges, while a $1,000 increase in the indirect cost per adjusted
discharge is associated with a four more readmissions per 10,000 discharges. These findings are
consistent with the results in Table (3) that higher direct cost ratios are negatively associated
with readmission rates, because an increase in the direct cost when holding the indirect cost
constant or a decrease in the indirect cost when holding the direct cost constant has the effect of
raising the direct cost ratio.11
When the squares of the direct and indirect cost per adjusted discharge are included in the model
(Column 2), a significant nonlinear relationship is observed for both the direct and the indirect
cost. However, the results have little practical application. First, holding the indirect cost per
adjusted discharge constant, an increase in the direct cost per adjusted discharge is negatively
associated with readmission rates until the direct cost reaches above $40,000, an amount that is
higher than almost all observations in our sample.12
Second, holding the direct cost per adjusted
11
If we increase a and keep b constant, then the value of a/(a+b) will increase; similarly, if we keep a constant and
decrease b, then the ratio a/(a+b) will increase as well. 12
[0.723/(2*0.081)]*10,000 = $44,630. Only four observations have direct cost per adjusted discharge higher than
this value.

9
discharge constant, an increase in the indirect cost per adjusted discharge is positively associated
with readmission rates until the indirect cost reaches above $25,000, an amount that is higher
than almost all observations in our sample.13
These findings imply that the direct (indirect) costs
have a concave (convex) association with readmissions when holding the other cost category
constant. It is only within a relative range that an increase in the direct costs or a decrease in the
indirect cost can have a positive association with readmissions.
V. CONCLUSION
In this study, we found that higher direct cost ratios are associated with lower readmission rates,
holding the total patient care cost per adjusted discharge constant. Additional analyses show that
the direct cost per adjusted discharge is associated with lower readmission rates. There are at
least three possible reasons why hospitals with relatively low direct cost ratios had high
readmission rates. First, these hospitals might have an insufficient focus on clinical aspects.
Second, they might have cost inefficiency for non-clinical aspects caused by poor cost control.
Third, indirect costs might have been incurred due to the agency problem. For example,
executives in these hospitals might receive relatively high compensation.
Our study recognizes the important implications of cost structure on hospital care quality and
extending the scope of cost structure to the relationship between the direct and the total cost. In
addition, our results have the potential to facilitate hospital executives in making informed
resource allocation decisions to improve care quality—an upward adjustment of the direct cost
ratio might lead to reductions in readmission rates. Such adjustments might require an increase
of resources committed to clinical aspects, more efficient cost control on indirect costs, more
effective governance to reduce the agency problem, or a combination of these actions.
Several limitations of this study need to be considered. First, the data from CMS are based on
administrative records submitted by hospitals, so the data may contain inaccuracies. Second,
although 30-day unplanned readmission rate is a commonly used quality metric, there are many
other measures that evaluate different aspects of hospital quality. Future research is needed to
examine whether the results of this study can be generalized to other quality metrics. In addition,
in this paper we did not examine spending at individual departments, but it is important for
future research to examine whether specific components of direct patient care are primarily
responsible for the lower readmission rates. Finally, our analyses cannot establish a causal link
between the direct cost ratio and the quality of care. Future studies may explore potential events
or discontinuity to identify causality and examine other aspects of cost structure and behavior,
such as cost stickiness and the relationship between variable and fixed costs, to further our
understanding on the mechanism of how hospital costs affect the quality of care.
13
[1.320/(2*0.247)]*10,000 = $26,721. Only two observations have direct cost per adjusted discharge higher than
this value.

10
Authors’ Contact Information
Ge Bai, PhD, CPA*
Assistant Professor of Accounting
The Johns Hopkins Carey Business School
Bernstein-Offit Building 353
1717 Massachusetts Ave NW
Washington, DC 20036
Phone: (202) 580-7573
Email: [email protected]
Tim Xu, MPP
The Johns Hopkins School of Medicine
Andrew T. Rogers, BS
The Johns Hopkins School of Medicine
Gerard F. Anderson, PhD
The Johns Hopkins Bloomberg School of Public Health
*: Corresponding author
11
REFERENCES
American Hospital Association (AHA), 2016. Quality and patient safety. Available at
http://www.aha.org/advocacy-issues/quality/index.shtml
Bai, G. 2016. Applying variance analysis to understand California hospitals' expense recovery
status by patient groups. Accounting Horizons 30 (2): 211-223.
Bai, G., and G. F. Anderson. 2016. A more detailed understanding of factors associated with
hospital profitability. Health Affairs 35 (5): 889-897.
Bai, G., F. Coronado, and R. Krishnan. 2010. The role of performance measure noise in
mediating the relation between task complexity and outsourcing. Journal of Management
Accounting Research 22 (1): 75-102.
Bradley, E. H., L. A. Curry, L. I. Horwitz, H. Sipsma, … and H. M. Krumholz. 2013. Hospital
strategies associated with 30-day readmission rates for patients with heart failure. Circulation.
Cardiovascular Quality and Outcomes 6 (4): 444–450.
Calvillo–King, L., D. Arnold, K. J. Eubank, M. Lo, P. Yunyongying, H. Stieglitz, and E. A.
Halm. 2013. Impact of social factors on risk of readmission or mortality in pneumonia and
heart failure: systematic review. Journal of General Internal Medicine 28 (2): 269–282.
The Centers for Medicare and Medicaid Services (CMS). 2016. National Health Expenditure
2014 Highlights. Available from: https://www.cms.gov/research-statistics-data-and-
systems/statistics-trends-and-reports/nationalhealthexpenddata/downloads/highlights.pdf
Deily, M. E., and N. L. McKay. 2006. Cost inefficiency and mortality rates in Florida
hospitals. Health Economics 15 (4): 419-431.
Dharmarajan, K., and H. M. Krumholz. 2014. Strategies to reduce 30-day readmissions in older
patients hospitalized with heart failure and acute myocardial infarction. Current Geriatrics
Reports 3 (4): 306–315.
Donabedian A. 1988. The quality of care: how can it be assessed? JAMA: The Journal of the
American Medical Association 260 (12): 1743–1748.
Eldenburg, L., and N. Soderstrom. 1996. Accounting system management by hospitals operating
in a changing regulatory environment. The Accounting Review 71 (1): 23–42.
Eldenburg, L., and S. Kallapur. 1997. Changes in hospital service mix and cost allocations in
response to changes in Medicare reimbursement schemes. Journal of Accounting and
Economics 23: 31–51.

12
Eldenburg, L., and S. Kallapur. 2000. The effects of changes in cost allocations on the
assessment of cost containment regulation in hospitals. Journal of Accounting and Public
Policy 19: 97–112.
Fiscella, K., P. Franks, M. R. Gold, and C. M. Clancy. 2000. Inequality in quality: addressing
socioeconomic, racial, and ethnic disparities in health care. JAMA: The Journal of the
American Medical Association 283 (19): 2579-2584.
Gilman, M., J. M. Hockenberry, E. K. Adams, A. S. Milstein, I. B. Wilson, and E. R. Becker.
2015. The financial effect of value-based purchasing and the hospital readmissions reduction
program on safety-net hospitals in 2014: a cohort study. Annals of Internal Medicine 163:
427‒436.
Gohil, S. K., R. Datta, C. Cao, M. J. Phelan, V. Nguyen…and S. S. Huang. 2015. Impact of
hospital population case-mix, including poverty, on hospital all-cause and infection-related
30-day readmission rates. Clinical Infectious Diseases 61 (8): 1235-1243.
Horwitz, L. I., Z. Lin, J. Herrin, S. Bernheim, E. E. Drye, H. M. Krumholz, and J. S. Ross. 2015.
Association of hospital volume with readmission rates: a retrospective cross-sectional study.
The British Medical Journal 350: h447.
Holzhacker, M., R. Krishnan, and M. D. Mahlendorf. 2015. The impact of changes in regulation
on cost behavior. Contemporary Accounting Research 32 (2): 534–566.
Joynt, K. E., and A. K. Jha. 2011. Who has higher readmission rates for heart failure, and why?
implications for efforts to improve care using financial incentives. Circulation.
Cardiovascular Quality and Outcomes 4 (1): 53–59.
Jha, A. K., E. J. Orav, and A. M. Epstein. 2011. Low-quality, high-cost hospitals, mainly in
South, care for sharply higher shares of elderly black, Hispanic, and Medicaid patients. Health
Affairs, 30(10), 1904-1911.
Joynt, K. E., E. J. Orav, and A. K. Jha. 2011. The association between hospital volume and
processes, outcomes, and costs of care for congestive heart failure. Annals of Internal
Medicine 154 (2): 94-102.
Kallapur, S., and L. Eldenburg. 2005. Uncertainty, real options, and cost behavior: Evidence
from Washington state hospitals. Journal of Accounting Research 43 (5): 735–752.
Keehan, S. P., J. A. Poisal, G. A. Cuckler, A. M. Sisko, S. D. Smith, ... and J. M. Lizonitz. 2016.
National health expenditure projections, 2015–25: economy, prices, and aging expected to
shape spending and enrollment. Health Affairs:10-1377.

13
Kripalani, S., C. N. Theobald, B. Anctil, and E. E. Vasilevskis. 2014. Reducing hospital
readmission: current strategies and future directions. Annual Review of Medicine 65: 471–485.
Keeler, E. B., L. V. Rubenstein, K. L. Kahn, D. Draper, E. R. Harrison ... and R. H. Brook. 1992.
Hospital characteristics and quality of care. JAMA: The Journal of the American Medical
Association 268 (13): 1709-1714.
Kim, S. J., K. T. Han, H. J. Lee, J. A. Kwon, and E. C. Park. 2016. Positive effects of medical
staffing on readmission within 30 days after discharge: a retrospective analysis of obstetrics
and gynecology data. The European Journal of Public Health ckw102.
McHugh, M. D., and C. Ma. 2013. Hospital nursing and 30-day readmissions among Medicare
patients with heart failure, acute myocardial infarction, and pneumonia. Medical Care 51 (1):
52-59.
Patrick, H., and M. D. Conway. 2014. Quality improvement of care transitions and the trend of
composite hospital care. JAMA: The Journal of the American Medical Association 311 (10):
1013-1014.
Picone, G. A., F. A. Sloan, S. Y. Chou, and D. H. Taylor Jr. 2003. Does higher hospital cost
imply higher quality of care? Review of Economics and Statistics 85 (1): 51-62.
Rogers, A., G. Bai, R. Lavin, and G. F. Anderson. 2016. Higher hospital spending on
occupational therapy is associated with lower readmission rates. Medical Care Research and
Review forthcoming.
Romley, J. A., A. Y. Chen, D. P. Goldman, and R. Williams. 2014. Hospital costs and inpatient
mortality among children undergoing surgery for congenital heart disease. Health Services
Research 49 (2): 588-608.
Romley, J. A., A. B. Jena, and D. P. Goldman. 2011. Hospital spending and inpatient mortality:
evidence from California: an observational study. Annals of Internal Medicine 154 (3): 160-
167.
Silber, J. H., R. Kaestner, O. Even-Shoshan, Y Wang, and L. J. Bressler. 2010. Aggressive
treatment style and surgical outcomes. Health Services Research 45: 1872–1892.
Sloan, F. A. 2000. Not-for-profit ownership and hospital behavior. Handbook of Health
Economics 1: 1141-1174.
Stukel, T. A., E. S. Fisher, D. A. Alter, A. Guttmann, D. T. Ko,... and D. S. Lee. 2012.
Association of hospital spending intensity with mortality and readmission rates in Ontario
hospitals. JAMA: The Journal of the American Medical Association 307 (10): 1037-1045.

14
Taylor Jr, D. H., D. J. Whellan, and F. A. Sloan. 1999. Effects of admission to a teaching
hospital on the cost and quality of care for Medicare beneficiaries. New England Journal of
Medicine 340 (4): 293-299.
Tsai, T. C., K. E. Joynt, E. J. Orav, A. A. Gawande, and A. K. Jha. 2013. Variation in surgical-
readmission rates and quality of hospital care. New England Journal of Medicine 369 (12):
1134-1142.
The World Bank. 2015. United States GDP. Available at:
http://data.worldbank.org/country/united-states

15
Table 1: Variable Definitions
Variable Definition
Readmission rate Thirty-day readmission rate from all medical conditions for Medicare patients
Direct cost ratio Direct cost of patient care / Total cost of patient care
Cost per adjusted discharge Total cost of patient care/ (adjusted discharge * case mix index * wage index)
Direct Cost per adjusted discharge Direct cost of patient care/ (adjusted discharge * case mix index * wage index)
Indirect Cost per adjusted discharge Indirect cost of patient care/ (adjusted discharge * case mix index * wage index)
Nonprofit Dummy variable that takes the value of 1 if a hospital is nonprofit
For-profit Dummy variable that takes the value of 1 if a hospital is for-profit
System Dummy variable that takes the value of 1 if a hospital is affiliated with a health system
Rural Dummy variable that takes the value of 1 if a hospital is located in a rural area
Teaching Dummy variable that takes the value of 1 if a hospital is a teaching hospital
Beds (X100) Number of hospital beds
Average length of stay Total inpatient stay / total discharges
Medicare% Number of Medicare discharges / Number of total discharges
Medicaid% Number of Medicaid discharges / Number of total discharges
Median household income Estimated median household income for the county where a hospital is located

16
Table 2: Descriptive Statistics
Variable Mean Median Std 1Q 3Q
Readmission rate 15.63 15.50 1.06 15.00 16.20
direct cost ratio 0.52 0.52 0.08 0.47 0.57
Cost per adjusted discharge (X10,000) 0.79 0.71 0.50 0.60 0.87
Direct Cost per adjusted discharge (X10,000) 0.48 0.43 0.34 0.35 0.53
Indirect Cost per adjusted discharge (X10,000) 0.31 0.28 0.20 0.23 0.34
Nonprofit 0.60 1 0.49 0 1
For-profit 0.24 0 0.43 0 0
System 0.61 1 0.49 0 1
Rural 0.28 0 0.45 0 1
Teaching 0.34 0 0.47 0 1
Beds (X100) 2.03 1.46 1.93 0.72 2.68
Average length of stay 4.37 4.29 1.27 3.74 4.85
Medicare% 0.36 0.36 0.12 0.29 0.44
Medicaid% 0.12 0.09 0.10 0.04 0.18
Median household income (X10,000) 5.21 5.00 1.40 4.27 5.74

17
Table 3: Regression Estimation Results—Direct Cost Ratio and Readmission Rates
Variable Coefficient
(1) (2)
Direct cost ratio (H1) -1.814*** 0.790
(<0.01) (0.76)
Direct ratio squared -2.596
(0.30)
Cost per adjusted discharge (X10,000) -0.056* -0.053
(0.09) (0.11)
Nonprofit -0.068 -0.071
(0.21) (0.19)
For-profit 0.212*** 0.211***
(<0.01) (<0.01)
System -0.206*** -0.208***
(<0.01) (<0.01)
Rural 0.016 0.014
(0.74) (0.76)
Teaching 0.170*** 0.172***
(<0.01) (<0.01)
Beds (X100) 0.058*** 0.058***
(<0.01) (<0.01)
Average length of stay 0.085*** 0.085***
(<0.01) (<0.01)
Medicare % -0.059 -0.064
(0.73) (0.71)
Medicaid % 0.900*** 0.900***
(<0.01) (<0.01)
Median household income (X10,000) -0.026* -0.026*
(0.09) (0.09)
N 2,999 2,999
R2 0.08 0.08
Notes: P values, based on two-tailed test, are in parentheses. *, **, *** indicates significance 10%, 5%, and 1%
level, respectively. All standard errors are robust to hetersoskedity. The coefficients on constants are not
reported.
18
Table 4: Supplementary Analysis—Direct and Indirect Cost and Readmission Rates
Variable Coefficient
(1) (2)
Direct cost per adjusted discharge -0.275** -0.723***
(X10,000) (0.03) (<0.01)
Direct cost per adj. disc. squared 0.081***
(X100,000,000) (<0.01)
Indirect cost adjusted discharge 0.414** 1.320***
(X10,000) (0.03) (<0.01)
Indirect cost per adj. disc. squared -0.247***
(X100,000,000) (<0.01)
Nonprofit -0.050 -0.041
(0.36) (0.45)
For-profit 0.209*** 0.239***
(<0.01) (<0.01)
System -0.205*** -0.218***
(<0.01) (<0.01)
Rural 0.048 0.044
(0.32) (0.36)
Teaching 0.185*** 0.185***
(<0.01) (<0.01)
Beds (X100) 0.053*** 0.059***
(<0.01) (<0.01)
Average length of stay 0.077*** 0.071***
(<0.01) (<0.01)
Medicare % 0.001 -0.064
(1.00) (0.71)
Medicaid % 1.077*** 1.074***
(<0.01) (<0.01)
Median household income (X10,000) -0.020 -0.026*
(0.20) (0.09)
N 2,999 2,999
R2 0.06 0.07
Notes: P values, based on two-tailed test, are in parentheses. *, **, *** indicates significance 10%, 5%, and 1%
level, respectively. All standard errors are robust to hetersoskedity. The coefficients on constants are not reported.