Embed Size (px)
Citation preview

R M SWinter 2011
R e l i a b i l i t y , M a i n t a i n a b i l i t y , S u p p o r t a b i l i t y
I n S y s t e m s E n g i n e e r i n g
T h e J o u r n a l O f

Winter 20112The Journal of RMS in Systems Engineering
Table of Contents
Introduction ................................................................................................................................. 3
James Rodenkirch
Decision Maker Perceptions of Alternative Trade Study Approaches ......... 5
Paul J. Componation, Ph.D. & Gillian M. Nicholls, Ph.D.
Reliability Topics in the Systems Engineering Body of Knowledge (SEBOK) ....................................................................................... 14
John R. Snoderly, Ph.D.
Reliability Engineering: Beyond Developing Standards ............................... 20
Marc Banghart
Use of Global Supply Chain Management in Commerce & by U.S. Forces .................................................................................................................................25
Russell A. Vacante, Ph.D.

Winter 201114The Journal of RMS in Systems Engineering
John R. Snoderly, Ph.D.
are referred to the IEEE Recommended Practice on Software Reliability.” Version 0.50 of the SEBOK is the first of many as the content is expected to coalesce and grow over time.
Reliability is “the probability of a system or system element performing its intended function under stated conditions without failure for a given period of time (ASQ 2011). A precise definition must include a detailed description of the function and what constitutes a failure, the environment, and a definition of the time scale—that can be a surprisingly difficult definition to “nail down” and different failure mechanisms, referred to as failure modes, can be modeled separately or aggregated into a single failure model where T is a random time to failure. Reliability can be thought of as the complement of the cumulative distribution function (CDF) for T for a given set e of environmental conditions:
R(t | e) = 1 – F(t | e) = P(T > t | e)
Maintainability is defined as the probability that a system or system element can be repaired in a defined environment within a specified period of time. Increased maintainability implies shorter repair times.
Availability is the probability that a repairable system or system element is operational at a given point in time, under a given set of environmental conditions. Availability depends on reliability and maintainability, and is discussed in detail later in this topic.
Each of these probability models is usually specified by a continuous, non-negative distribution. Typical distributions used in practice include exponential (possibly with a threshold parameter), Weibull (possibly with a threshold parameter), log-normal, and generalized gamma.
Maintainability models present some interesting challenges. The time to repair an item is the sum of the time required for evacuation, diagnosis, assembly of resources (parts, bays, tools, and mechanics), repair, inspection, and return. Administrative delay (such as holidays) can also affect repair times. Often these sub-processes have a minimum time to complete that is not zero, resulting in the
AbstrAct
The Department of Defense acquisition policy today is focused on the “Better Buying Power Initiative.” This initiative, started in February 2011, focuses on doing more without more via a 23 point strategy that is aimed at restoring affordability in defense procurement and improving defense industry productivity. This focus will require the understanding and use of sound Systems Engineering practice where success is realized through efforts to back up and review the drivers of system design. In this article I hope to show that this focus can’t be achieved without an emphasis on reliability.
IntroductIon
In parallel with the “Better Buying Power Initiative” the system engineering community has began exploring the idea of a Systems Engineering Body of Knowledge (SEBOK). For the past two years a group of system engineering experts (65 primary authors from around the world) have met and developed a WIKI in a project called the Body of Knowledge and Curriculum to Advance Systems Engineering (BKCASE). This project was funded by the Department of Defense and led by the Naval Postgraduate School, Stevens Institute of Technology and the University of Southern California, members of the Systems Engineering Research Consortium. The Systems Engineering Body Of Knowledge (SEBOK), along with a Graduate Reference Curriculum for Systems Engineering (GRCSE), has released SEBOK Version 0.5 for comment worldwide and, yes, they include reliability, maintainability and availability (RMA) as one of the topics.
the focus on rMASEBOK highlights RMA as: “Reliability, availability, and
maintainability are three system attributes of tremendous interest to systems engineers, logisticians, and users alike. Collectively, they affect economic life-cycle costs of a system and its utility.”
The focus of SEBOK is, primarily, on the reliability of physical system elements; software reliability is treated as a separate discipline and readers, interested in software reliability,
Reliability Topics in the Systems Engineering Body of Knowledge (SEBOK)

15The Journal of RMS in Systems Engineering Winter 2011
are modeling issues associated with redundancy, including switching between components, warm-up, and increased failure rates for surviving units under increased load when another load-sharing unit fails. Redundancy can be an expensive strategy as there are penalties, e.g., cost, weight, volume and power associated with stand-by components.
Fault avoidance seeks to improve individual components so that they are more reliable. This too can be an expensive strategy, but it avoids the power, weight, and volume penalties associated with using redundant components, as well as the switching issues.
A third strategy is to repair or replace a component following a preventive maintenance schedule. This usually requires the assumption that the repair returns the component to “good as new” status, or possibly to an earlier age-equivalent. These assumptions can cause difficulties—for example, an oil change on a vehicle does not return the engine to “good as new” status. Scheduled replacement can return a unit to good as new, but at the cost of wasting potential life for the replaced unit. As a result, the selection of a replacement period is a non-linear optimization problem that minimizes total expected life-cycle costs. These costs are the sum of the expected costs of planned and unplanned maintenance actions.
A fourth strategy is to control the environment so that a system is not operated under conditions that accelerate the aging of its components.
Any or all of the above strategies (fault tolerance, fault avoidance, preventive maintenance, and environmental control) may be applied to improve the designed reliability of a system.
Post-ProductIon MAnAgeMent systeMs
Once a system is fielded, its reliability and availability should be tracked. Doing so allows the producer/owner to verify that the design has met its RAM objectives, identify unexpected failure modes, record fixes, assess the utilization of maintenance resources and assess the operating environment.
One such tracking system—known generically as a FRACAS system (Failure Reporting and Corrective Action System)—captures data on failures and improvements to failure corrections. The resultant database is separate from a warranty database, which is typically run by the financial function of an organization and tracks costs only.
A FRACAS system supports system analyses and, thus, imposes data requirements. If there is a lack of careful consideration for the backward flow of data—from decision to analysis to model to gathered data—inadequate data is collected or missing. Proper planning prevents this type of poor performance and, thus, a FRACAS system should be designed and implemented through strong adherence to systems engineering principles.
distribution used to model maintainability having a threshold parameter. A threshold parameter is defined as the minimum time to repair that has positive probability. Estimation of the maintainability can be further complicated by queuing effects, resulting in times to repair that are not independent. This dependency frequently makes analytical solution of problems involving maintainability intractable and promotes the use of simulation to support analysis.
dAtA concerns
True RAM models for a system are generally never known. Data on a given system is assumed or collected, used to select a distribution for a model and then fit into the parameters of the distribution. This process differs significantly from the one usually taught in an introductory statistics course. First, the normal distribution is seldom used as a life distribution, since it is defined for all negative times. Second, and more importantly, reliability data is different from classic experimental data. Reliability data is often censored, biased, observational and/or missing information about covariates such as environmental conditions. Additionally, data from testing events are often expensive, thus sample sizes, often times are small; one consequence of small data size is that estimates, when based on limited data can be imprecise. These vagaries and imprecision can require sophisticated strategies and processes to mitigate them.
ProbleMs In systeM(s) desIgn
System requirements should include specifications for reliability, maintainability, and availability, and each should be conditioned on the projected operating environments.
A proposed design should be analyzed prior to development to estimate if it meets those specifications. This is usually done by assuming historical data on actual or similar components represents the future performance of the components for the proposed system. If no data is available, conservative engineering judgment is often applied. The system dependency on the reliability of its components can be captured in several ways, including reliability block diagrams, fault trees, and failure mode effects and criticality analyses.
If a proposed design does not meet the preliminary RAM specifications, it can be adjusted. Critical failures are mitigated so that the overall risk is reduced to acceptable levels. This can be done in several ways.
Fault tolerance is a strategy that seeks to make the system robust against the failure of a component. This can be done by introducing redundancy. Redundant units can operate in a ‘stand-by’ mode. A second tolerance strategy is to have the redundant components share the load, so that one or more of them may fail yet the system continues to operate. There
16The Journal of RMS in Systems Engineering Winter 2011
a major source of downtime for a repairable system and a logistical support model allows one to explore the trade space between resources and availability.
All these models are abstractions of reality and, at best, provide approximations to reality. To the extent they provide useful insights, they are still very valuable. The more complicated the model, the more data required to estimate it precisely. The greater the extrapolation required for a prediction, the greater the imprecision. Extrapolation is often unavoidable, because high reliability equipment typically can have long life, and the amount of time required to observe failures may exceed test times. This requires that strong assumptions be made about future life (such as the absence of masked failure modes). These assumptions increase uncertainty about predictions—uncertainty introduced by strong model assumptions is often not quantified—and presents a risk to the system engineer.
systeM MeAsures of MerIt
Probabilistic metrics describe system performance for RAM; quantiles, means, and probability distribution modes used to model RAM are also useful.
Availability has some additional definitions, characterizing what downtime is counted against a system. For inherent availability, only downtime associated with corrective maintenance counts against the system. For achieved availability, downtime associated with both corrective and preventive maintenance counts against a system. Finally, operational availability counts all sources of downtime, including logistical and administrative, against a system.
Availability can also be calculated instantaneously, averaged over an interval or reported as an asymptotic value. Asymptotic availability can be calculated easily, however, care must be taken to analyze whether or not a system settles down or settles up to the asymptotic value and how long it takes until the system approaches that asymptotic value.
Reliability importance measures the effect on the system reliability of a small improvement in a component’s reliability. It is defined as the partial derivative of the system reliability with respect to the reliability of a component.
Criticality is the product of a component’s reliability, the consequences of a component failure and the frequency with which a component failure results in a system failure. Criticality is a guide to prioritizing reliability improvement efforts.
Many of these measures cannot be calculated directly because the integrals involved are intractable; they are estimated, usually, using simulation.
systeM Models
There are many ways to characterize the reliability of a
Of particular importance is a plan to track data on units that have not failed. Units whose precise times of failure are unknown are referred to as censored units. Inexperienced analysts frequently do not know how to analyze censored data and, as a result, omit the censored units; this will bias an analysis negatively.
An organization should have an integrated data system that allows reliability data to be considered with logistical data—parts, personnel, tools, bays, transportation and evacuation, queues, and costs—allowing an awareness of the interplay between logistical and RAM issues. For an organization to reap the benefits from a complete situational awareness with respect to RAM, these issues must be integrated with management and operational systems.
Models
There is a wide range of models that estimate and predict reliability. Simple models, such as the exponential distribution, can be useful for “back of the envelope” calculations. There are more sophisticated probability models used for life data analysis. These are best characterized by their failure rate behavior, defined as the probability that a unit, given it has lived until the beginning of the interval and divided by the length of the interval, fails in the next interval of time.
Models can be considered for a fixed environmental condition or they can be extended to include the effect of environmental conditions on system life. Such extended models can in turn be used for accelerated life testing (ALT), where a system is deliberately and carefully overstressed to induce failures more quickly, and the data extrapolated to usual use conditions. This is often the only way to obtain estimates of the life of highly reliable products in a reasonable amount of time.
Also useful are degradation models where some characteristic of the system is associated with the propensity of the unit to fail. As that characteristic degrades we can estimate times of failure before they occur. The initial developmental units of a system often do not meet their RAM specifications. Reliability growth models allow estimation of the necessary resources (particularly testing time) required before a system will mature to meet those goals.
Maintainability models describe the time necessary to return a failed repairable system to service. They are, usually, the sum of a set of models describing different aspects of the maintenance process—for example, diagnosis, repair, inspection, reporting, and evacuation. These models often have threshold parameters that are the minimal time(s) until an event can occur.
Logistical support models attempt to describe the process flow(s) through a logistics system, quantifying the interaction between maintenance activities and the resources available to support those activities. Queue delays, in particular, are
17The Journal of RMS in Systems Engineering Winter 2011
system, including fault trees, reliability block diagrams, and failure mode effects analysis.
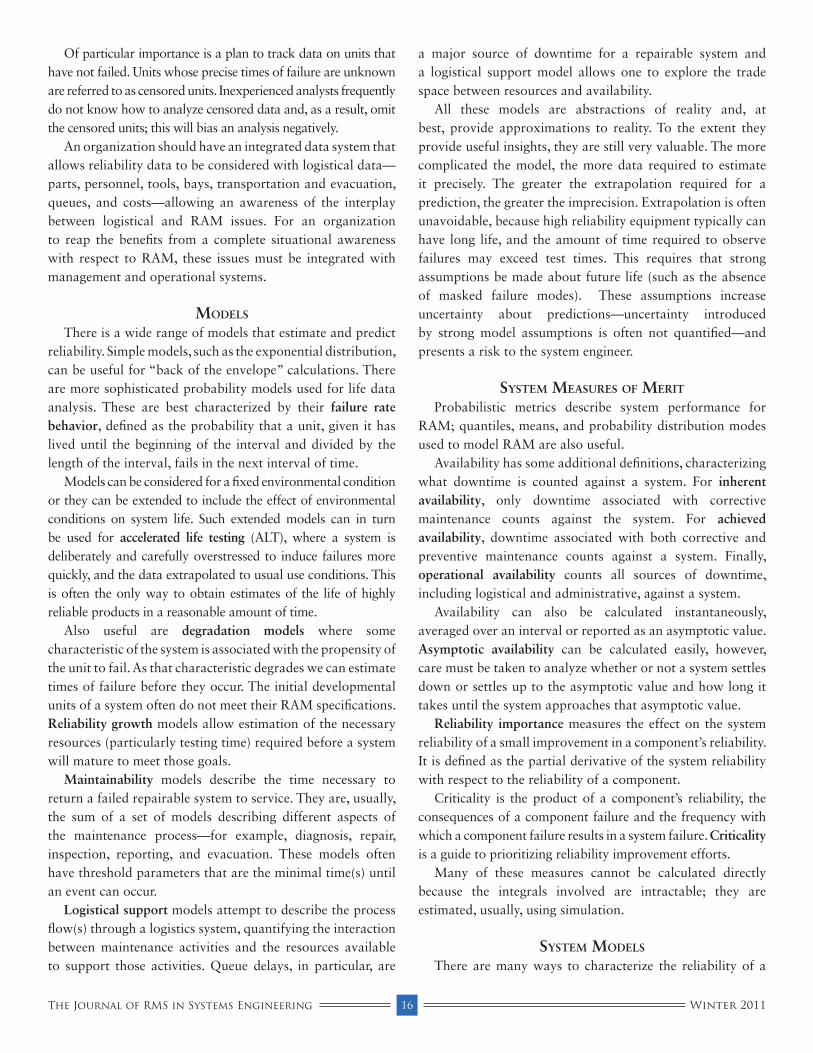
A Fault Tree (Kececioglu 1991) is a graphical representation of the failure modes of a system. It is constructed using logical gates, with AND, OR, NOT, and K of N gates predominating. Fault trees can be complete or partial; a partial fault tree focuses on a failure mode or modes of interest. Fault trees provide an analyst the ability to 'drill down' and see the dependencies amongst systems, nested systems and system elements. Fault trees date back to the 1960s and were pioneered by Bell Labs.
Figure 1. Fault Tree (Figure Developed for BKCASE).
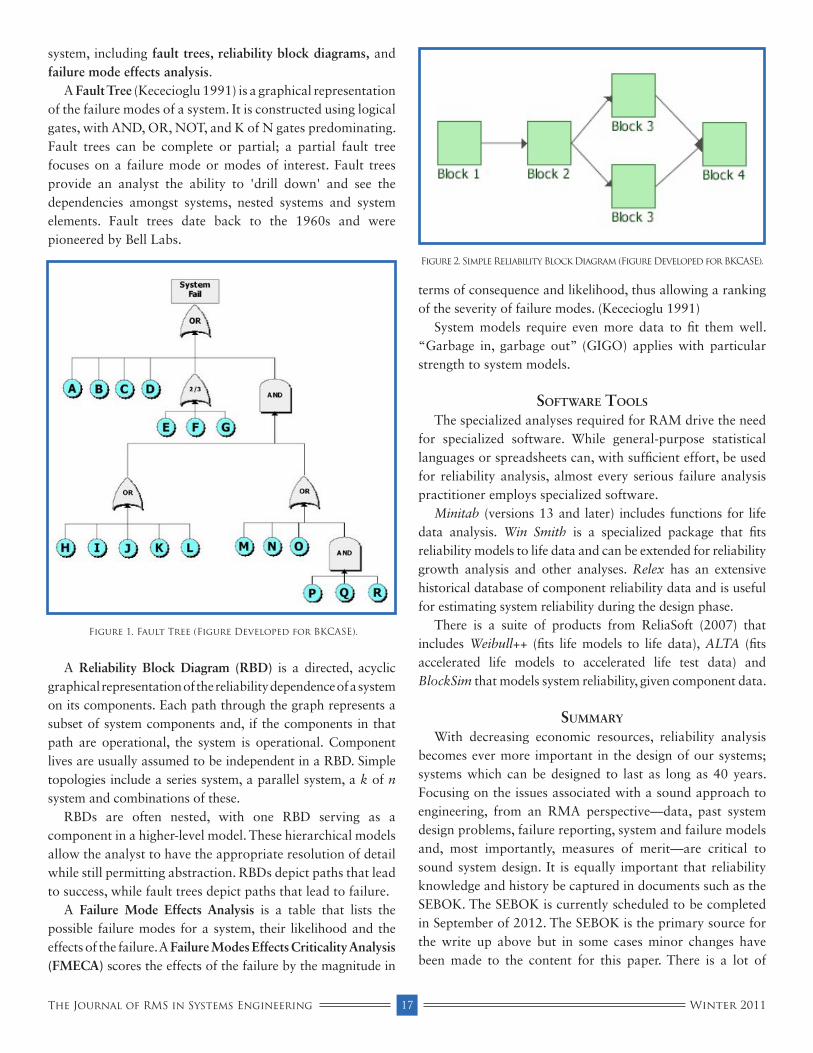
A Reliability Block Diagram (RBD) is a directed, acyclic graphical representation of the reliability dependence of a system on its components. Each path through the graph represents a subset of system components and, if the components in that path are operational, the system is operational. Component lives are usually assumed to be independent in a RBD. Simple topologies include a series system, a parallel system, a k of n system and combinations of these.
RBDs are often nested, with one RBD serving as a component in a higher-level model. These hierarchical models allow the analyst to have the appropriate resolution of detail while still permitting abstraction. RBDs depict paths that lead to success, while fault trees depict paths that lead to failure.
A Failure Mode Effects Analysis is a table that lists the possible failure modes for a system, their likelihood and the effects of the failure. A Failure Modes Effects Criticality Analysis (FMECA) scores the effects of the failure by the magnitude in
terms of consequence and likelihood, thus allowing a ranking of the severity of failure modes. (Kececioglu 1991)
System models require even more data to fit them well. “Garbage in, garbage out” (GIGO) applies with particular strength to system models.
softwAre tools
The specialized analyses required for RAM drive the need for specialized software. While general-purpose statistical languages or spreadsheets can, with sufficient effort, be used for reliability analysis, almost every serious failure analysis practitioner employs specialized software.
Minitab (versions 13 and later) includes functions for life data analysis. Win Smith is a specialized package that fits reliability models to life data and can be extended for reliability growth analysis and other analyses. Relex has an extensive historical database of component reliability data and is useful for estimating system reliability during the design phase.
There is a suite of products from ReliaSoft (2007) that includes Weibull++ (fits life models to life data), ALTA (fits accelerated life models to accelerated life test data) and BlockSim that models system reliability, given component data.
suMMAry
With decreasing economic resources, reliability analysis becomes ever more important in the design of our systems; systems which can be designed to last as long as 40 years. Focusing on the issues associated with a sound approach to engineering, from an RMA perspective—data, past system design problems, failure reporting, system and failure models and, most importantly, measures of merit—are critical to sound system design. It is equally important that reliability knowledge and history be captured in documents such as the SEBOK. The SEBOK is currently scheduled to be completed in September of 2012. The SEBOK is the primary source for the write up above but in some cases minor changes have been made to the content for this paper. There is a lot of
Figure 2. Simple Reliability Block Diagram (Figure Developed for BKCASE).

18The Journal of RMS in Systems Engineering Winter 2011
About the Author
Dr. John R. Snoderly was the President of International Council on Systems Engineering (INCOSE) from 2002-2004. He is the current 2011 Chairman of the INCOSE Foundation. In March of 2008 he received the recognition as an INCOSE Certified Systems Engineering Professional (CSEP). He is Co-Author of the 1994 IEEE 1220 Systems Engineering Standard. He received a Doctor of Public Administration Degree from USC in December of 1996. He received a Masters Degree in Public Administration from USC in May 1995. He also holds a Master Degree in Systems Management from USC in 1973 and a Bachelor of Science in Aerospace Engineering from WVU in 1963.
From 2001 to 2003, Dr. Snoderly was a part time Associate Professor at George Mason University School of Management. He conducted an executive postgraduate level seminar for Chief Information Officers and a course on Program Management for the GMU Masters of Technology Management program’s 2003 fall semester.
Dr. Snoderly is currently the Program Learning Director of Systems Engineering at the Defense Acquisition University. He is responsible for the development of SE courses as well as providing instruction on management of the Systems Engineering aspects of the Department of Defense systems acquisition process.
Prior to joining DSMC (now DAU) in 1979, Professor Snoderly was the Deputy Program Manager for the U.S. Navy LAMPS MK III Program at the Naval Air Systems Command. Professor Snoderly has 16 years of engineering and management experience working for the U.S. Navy as a civilian engineer. His recommendations were instrumental in the development and fielding of the Navy LAMPS MK III weapons system.
detail that could be added, but the purpose of the SEBOK is to be a guide to the Body of Knowledge and not all-inclusive in its coverage. The references are important and the web links from the WIKI to those documents will be a key element in efforts to deliver the broadest coverage on/of Reliability. If there are any references that are missing and should have been included send them to the author so inputs can be made to the SEBOK writing team. ◆

19The Journal of RMS in Systems Engineering Winter 2011
12. SAE. 2000b. Surface Vehicle Recommended Practice J1739: (R) Potential Failure Mode and Effects Analysis in Design (Design FMEA), Potential Failure Mode and Effects Analysis in Manufacturing and Assembly Processes (Process FMEA), and Potential Failure Mode and Effects Analysis for Machinery (Machinery FMEA). Warrendale, PA, USA: Society of Automotive Engineers (SAE) International.
Citation13. Pyster, A., D. Olwell, A. Squires, N. Hutchison, S. Enck,
eds. Released for limited review 2010. A Guide to the Systems Engineering Body of Knowledge (SEBoK) version 0.50. Body of Knowledge and Curriculum to Advance Systems Engineering (BKCASE). Hoboken, NJ, USA: Stevens Institute of Technology.
references
Citations1. American Society for Quality (ASQ). 2011. Glossary:
Reliability. Accessed on September 11, 2011. Available at http://asq.org/glossary/r.html.
2. Kececioglu, D. 1991. Reliability Engineering Handbook, Volume 2. Upper Saddle River, NJ, USA: Prentice Hall.
3. ReliaSoft. 2007. Failure Modes and Effects Analysis (FMEA) and Failure Modes, Effects and Criticality Analysis (FMECA). Accessed on September 11, 2011. Available at http://www.weibull.com/basics/fmea.htm.
Primary References4. Blischke, W.R. and D.N. Prabhakar Murthy. 2000.
Reliability Modeling, Prediction, and Optimization. New York, NY, USA: Wiley and Sons.
5. DoD. 2005. DoD Guide for Achieving Reliability, Availability, and Maintainability. Arlington, VA, USA: U.S. Department of Defense (DoD). Accessed on September 11, 2011. Available at: http://www.acq.osd.mil/se/docs/RAM_Guide_080305.pdf
6. Kececioglu, D. 1991. Reliability Engineering Handbook, Volume 2. Upper Saddle River, NJ, USA: Prentice Hall.
7. Lawless, J.F. 1982. Statistical Models and Methods for Lifetime Data. New York, NY, USA: Wiley and Sons.
8. Martz, H.F. and R.A. Waller. 1991. Bayesian Reliability Analysis. Malabar, FL, USA: Kreiger.
9. Meeker, W.O. and L.A. Escobar. 1998. Statistical Methods for Reliability Data. New York, NY, USA: Wiley and Sons.
Additional References10. ReliaSoft. 2007. "Availability." Accessed on September
11, 2011. Available at: http://www.weibull.com/SystemRelWeb/availability.htm.
11. SAE. 2000a. Aerospace Recommended Practice ARP5580: Recommended Failure Modes and Effects Analysis (FMEA) Practices for Non-Automobile Applications. Warrendale, PA, USA: Society of Automotive Engineers (SAE) International.


![Ronen Avraham* and Anthony Sebok**...3See, e.g.Drew Hasselback, The Gavel Gamble: Litigation Emerges As An Asset Class, Financial Post, April 29, 2016 (In Canada, “[l]awsuits are](https://img.pdfslide.us/doc/110x75/604af67733dc8565f6472db3/ronen-avraham-and-anthony-sebok-3see-egdrew-hasselback-the-gavel-gamble.jpg)