Embed Size (px)
Citation preview
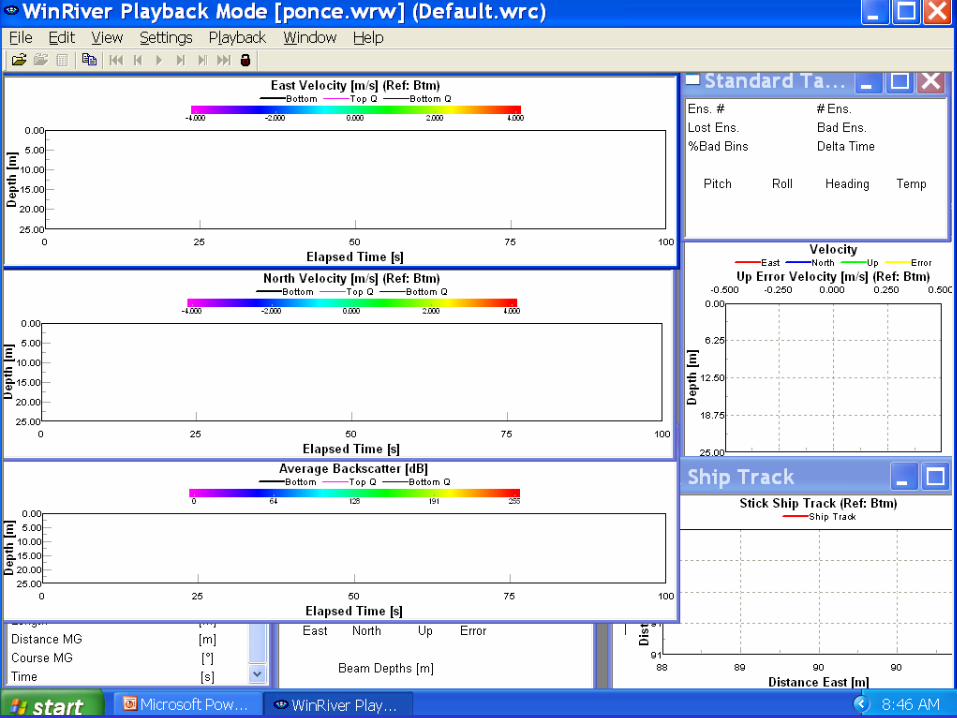
WinRiver
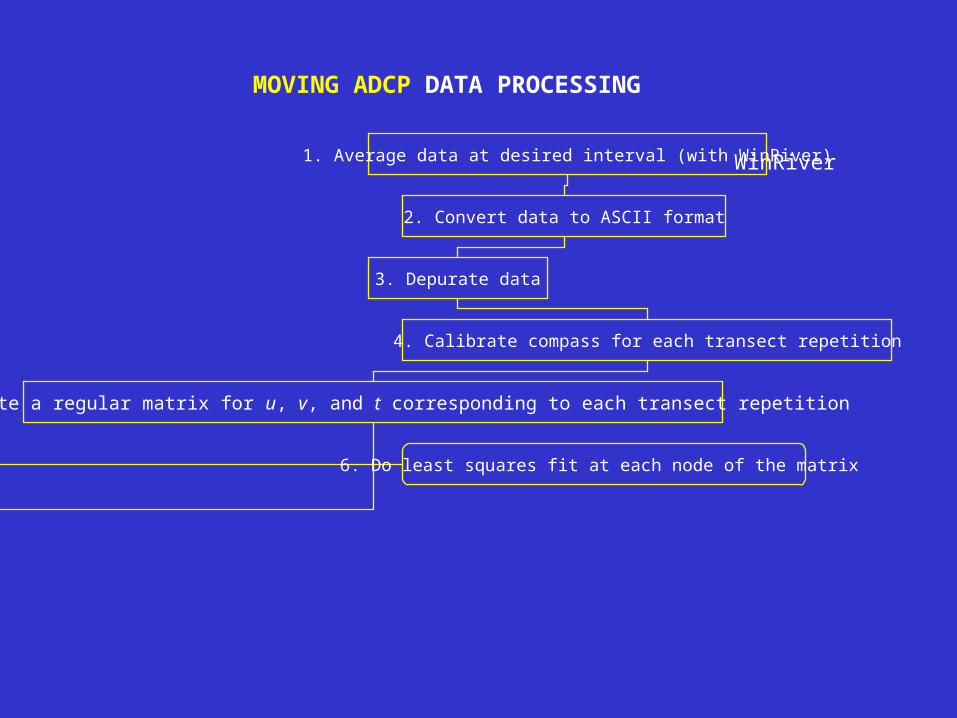
MOVING ADCP DATA PROCESSING
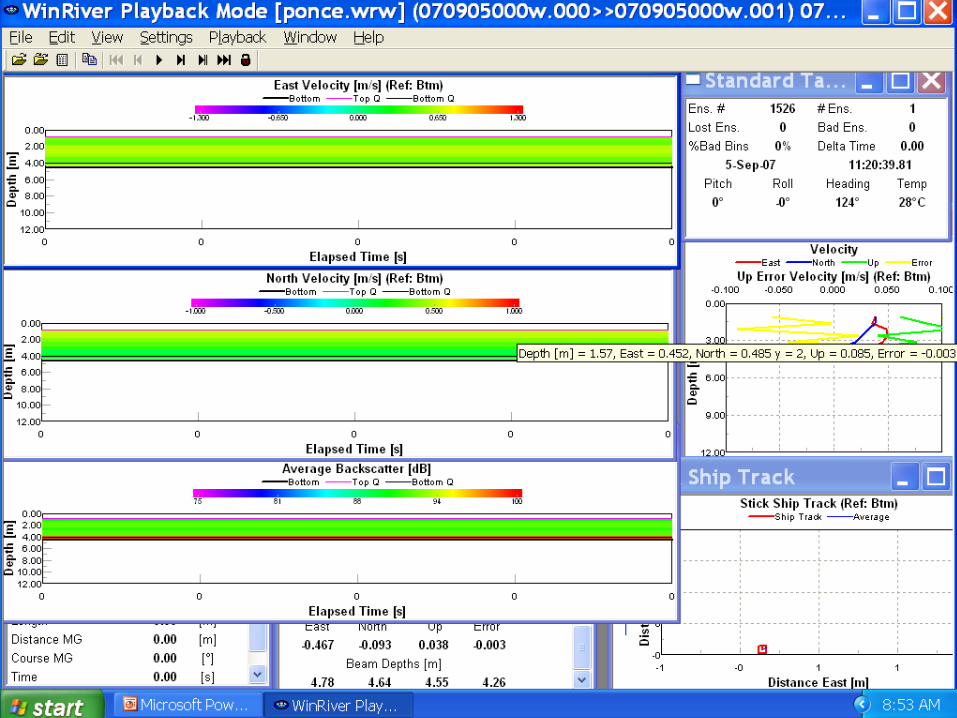
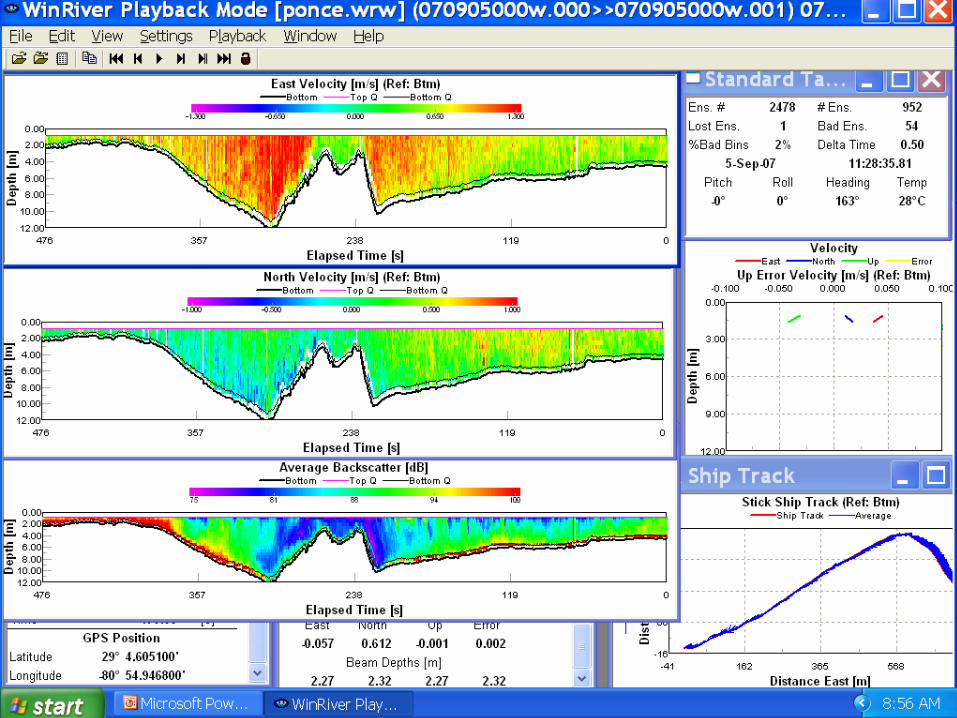
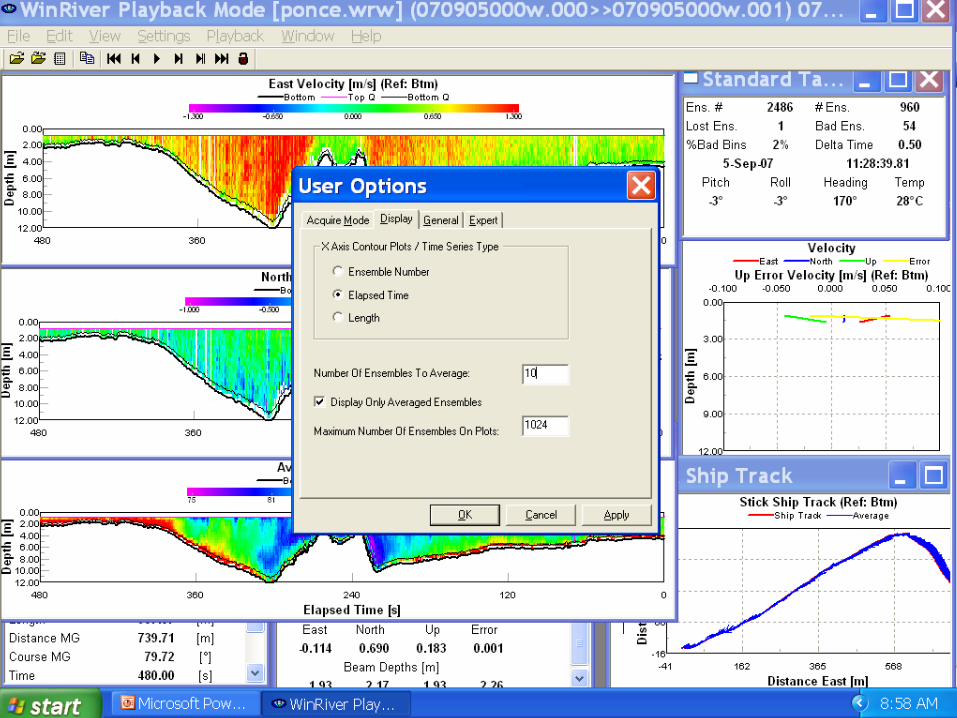
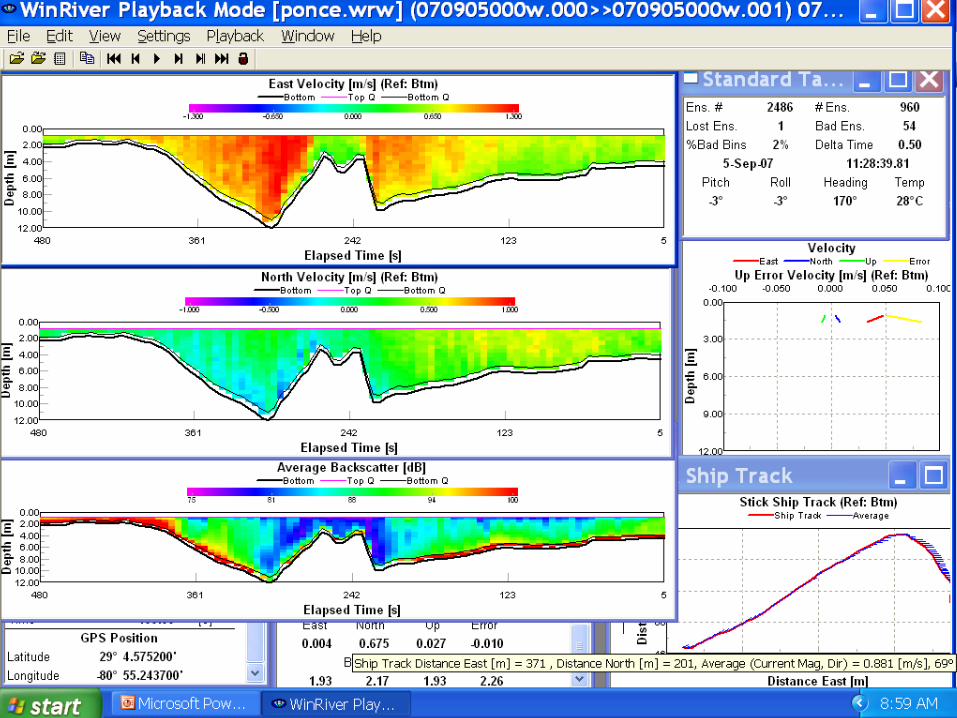
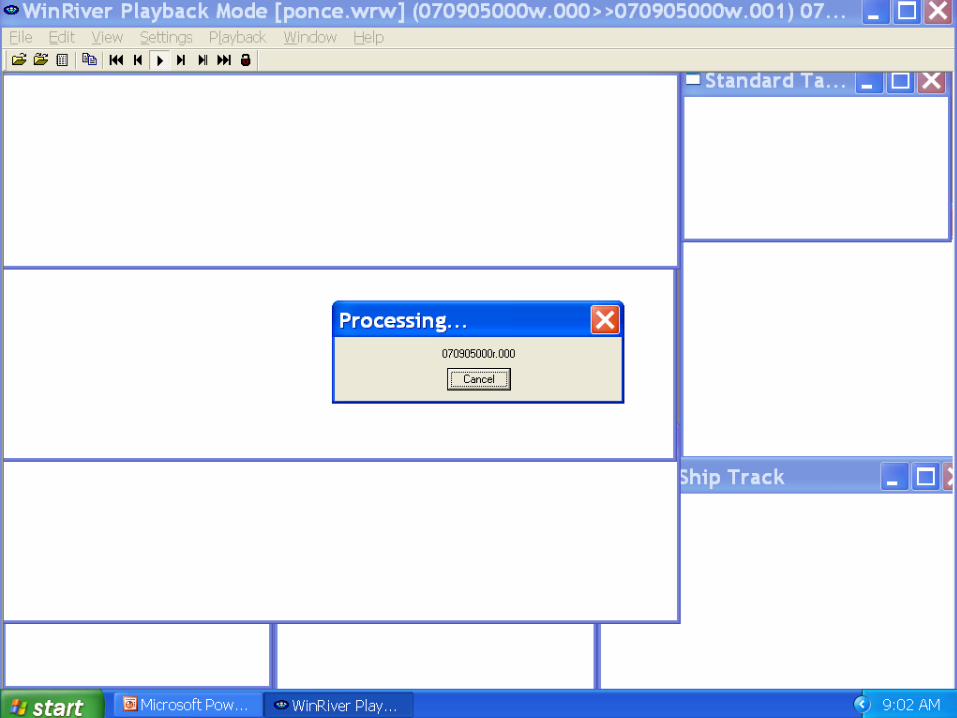
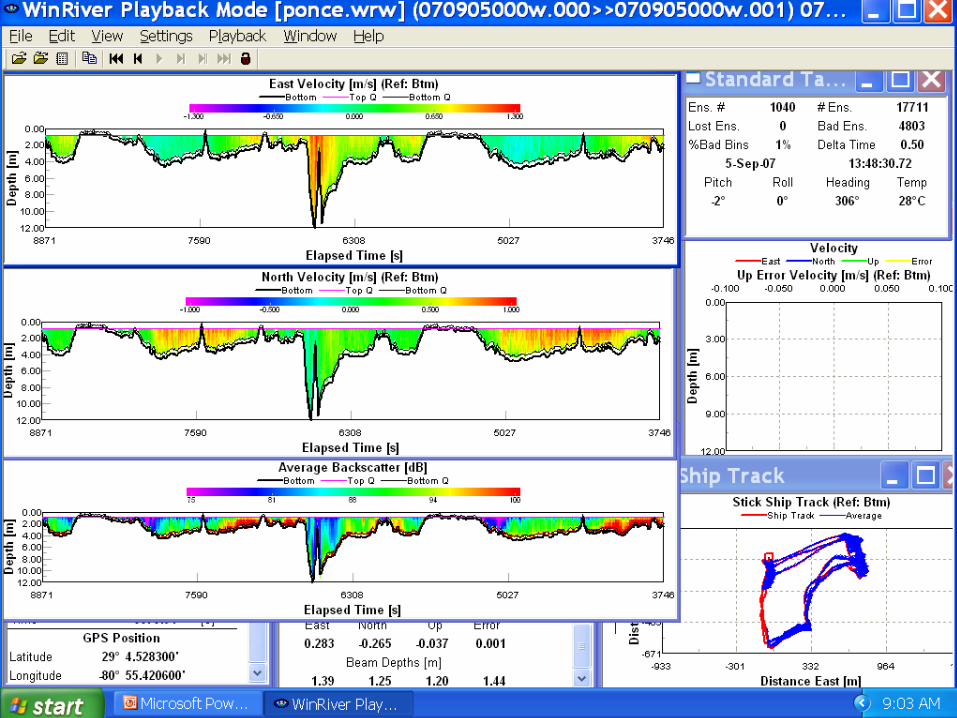
1. Average data at desired interval (with WinRiver)
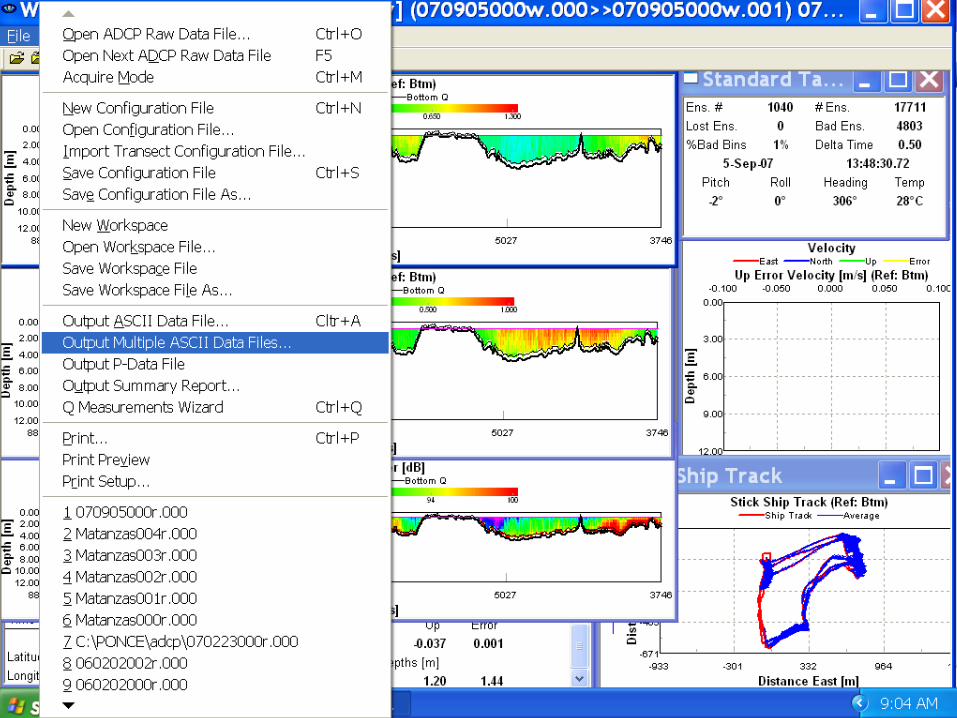
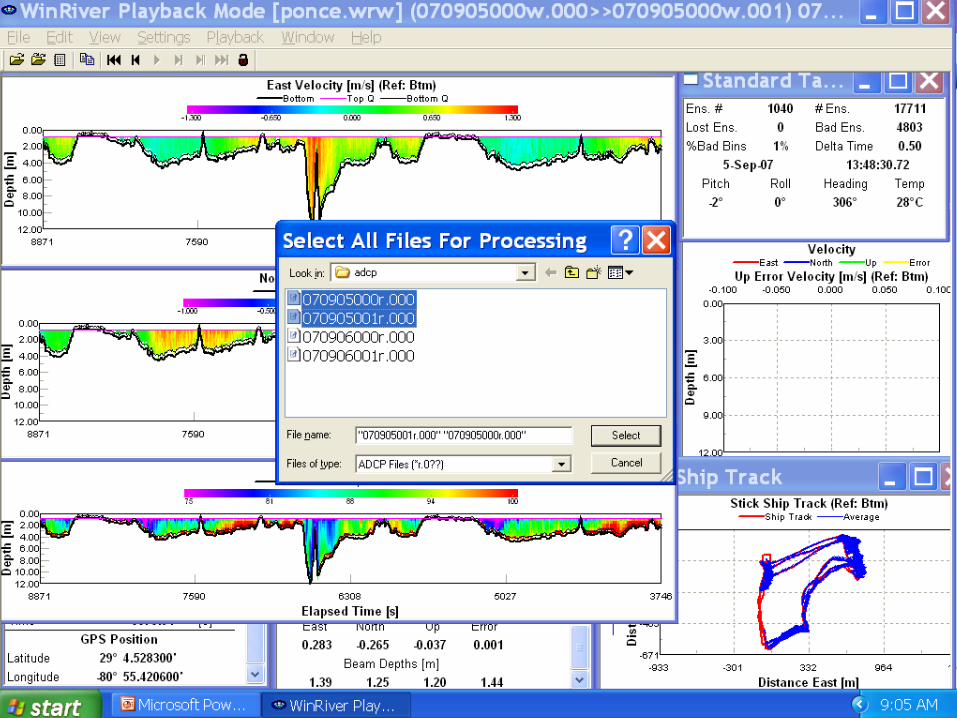
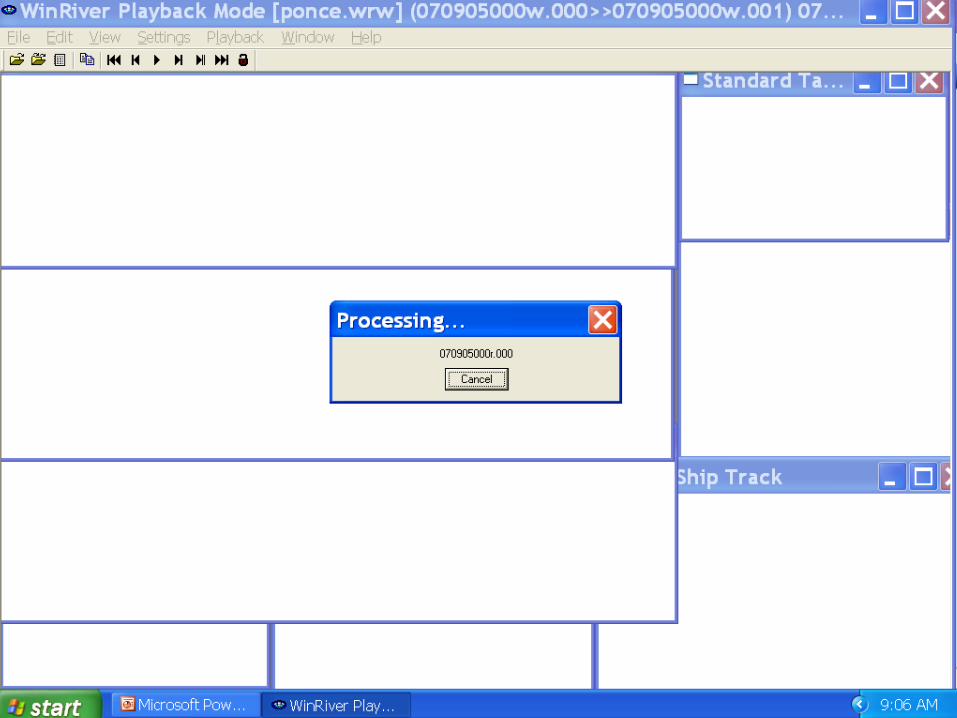
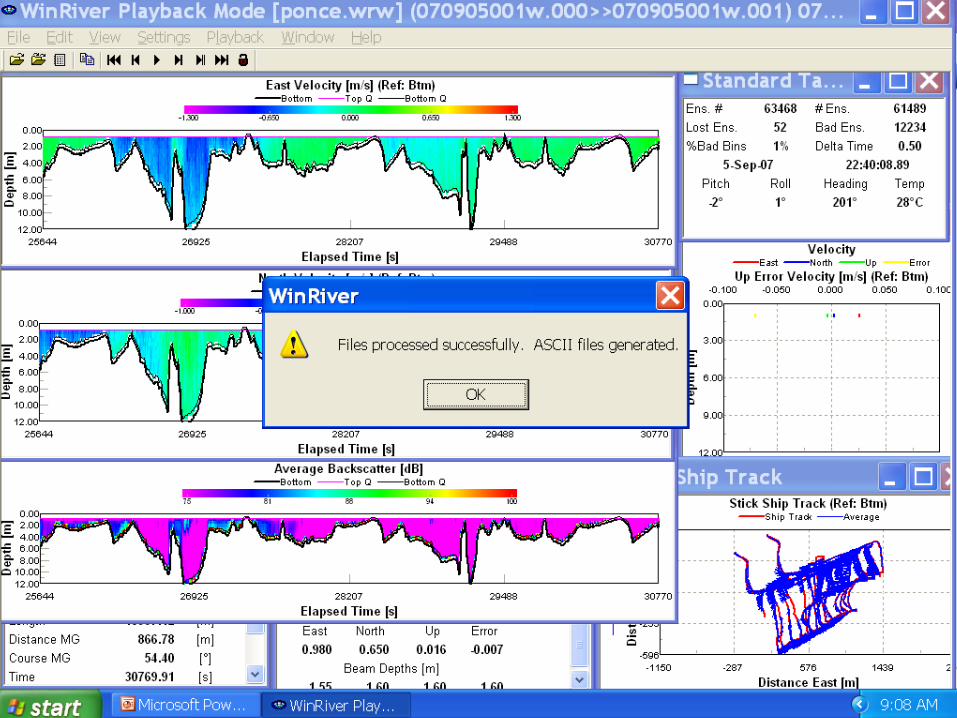
2. Convert data to ASCII format
3. Depurate data
4. Calibrate compass for each transect repetition
5. Generate a regular matrix for u, v, and t corresponding to each transect repetition
6. Do least squares fit at each node of the matrix
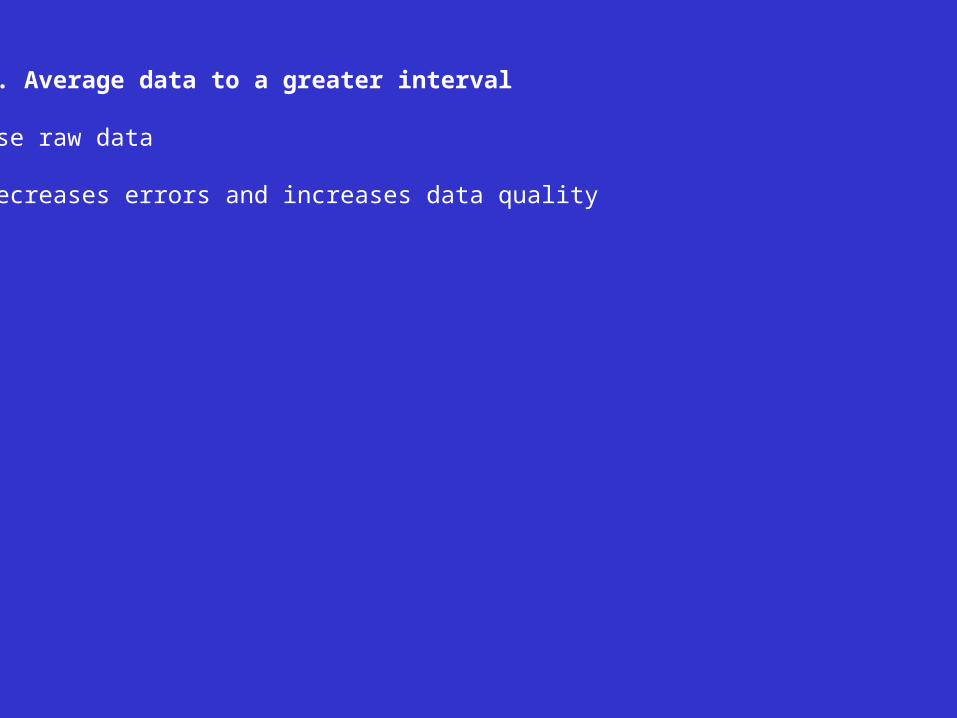
1. Average data to a greater interval
Use raw data
Decreases errors and increases data quality
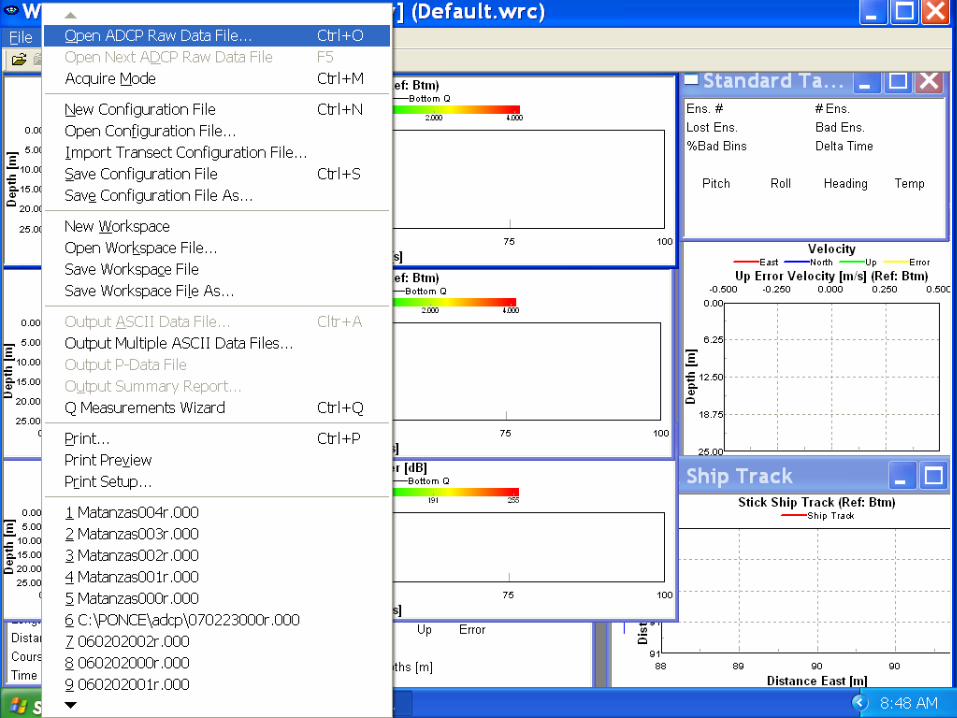
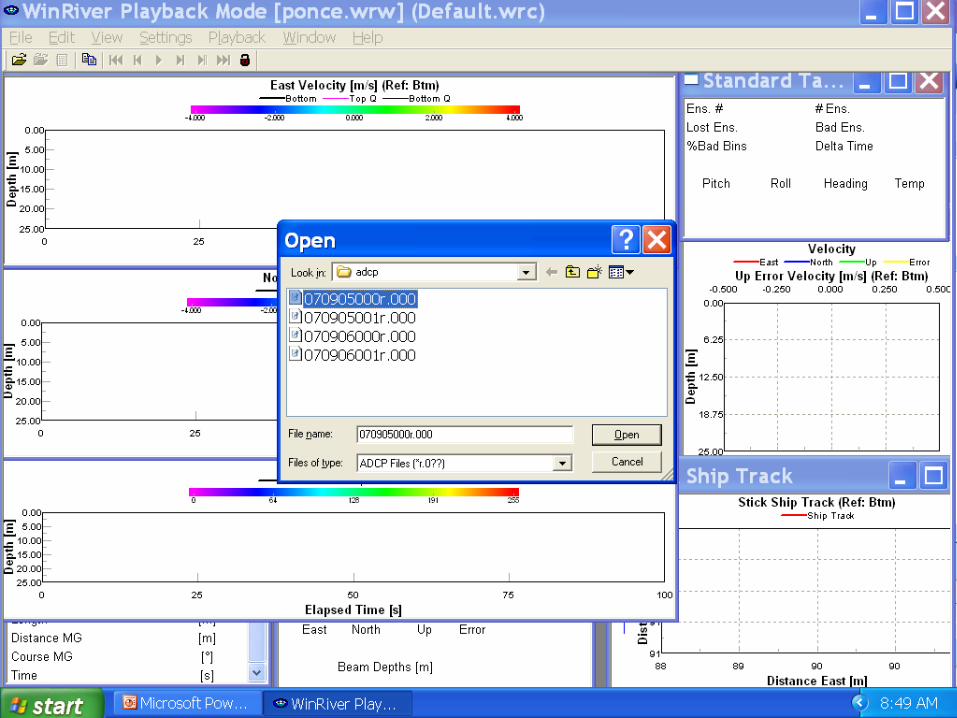
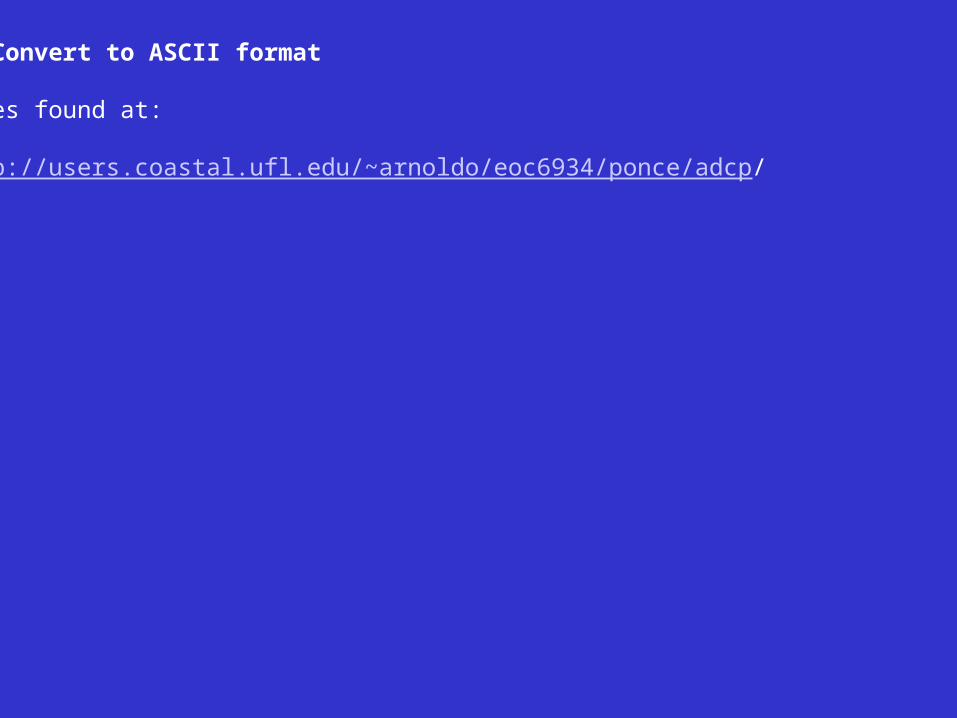
2. Convert to ASCII format
Files found at:
http://users.coastal.ufl.edu/~arnoldo/eoc6934/ponce/adcp/
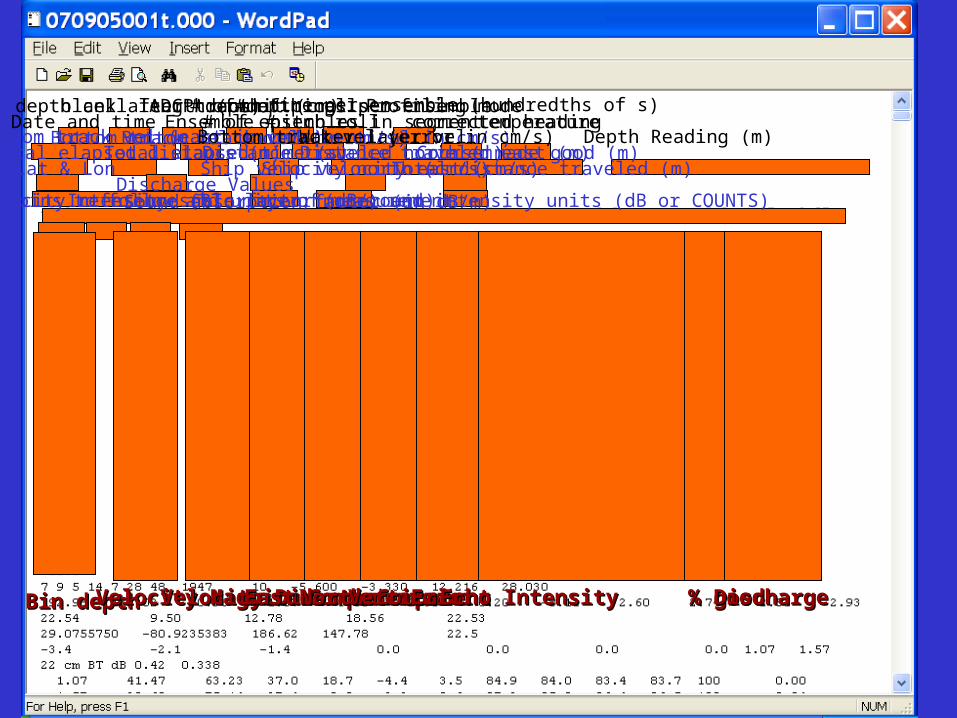
depth cell length (cm)blank after transmit (cm)ADCP depth # of pings per ensemble# of depth cellstime per ensemble (hundredths of s)Profiling modeDate and time Ensemble ## of ensembles in segmentpitch roll corrected headingtemperatureBottom track vel (east in cm/s)Bottom track vel (north in cm/s)Bottom track vel (vertical in cm/s)Bottom track vel (error in cm/s)Water layer vel Depth Reading (m)Total elapsed distance (m)Total elapsed time (s)Distance traveled north (m)Distance traveled east (m)Course made good (m)Lat & Lon Ship velocity north (cm/s)Ship velocity east (cm/s)Total distance traveled (m)
Discharge Values# of bins to follow and units of measurementVelocity reference (BT, layer, none) and intensity units (dB or COUNTS)Intensity scale factor (dB/count)Sound absorption factor (in dB/m)
Bin depthBin depthVelocity MagnitudeVelocity MagnitudeVelocity DirectionVelocity DirectionEast ComponentEast ComponentNorth ComponentNorth ComponentVerticalVerticalErrorErrorEcho IntensityEcho Intensity % good% goodDischargeDischarge
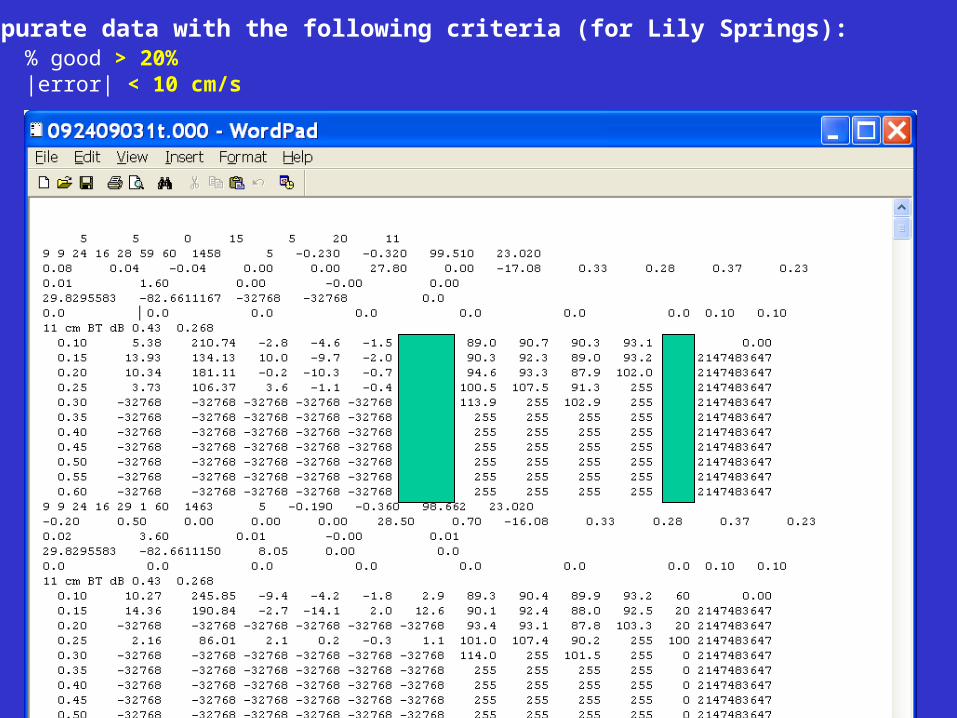
3. Depurate data with the following criteria (for Lily Springs):% good > 20%|error| < 10 cm/s
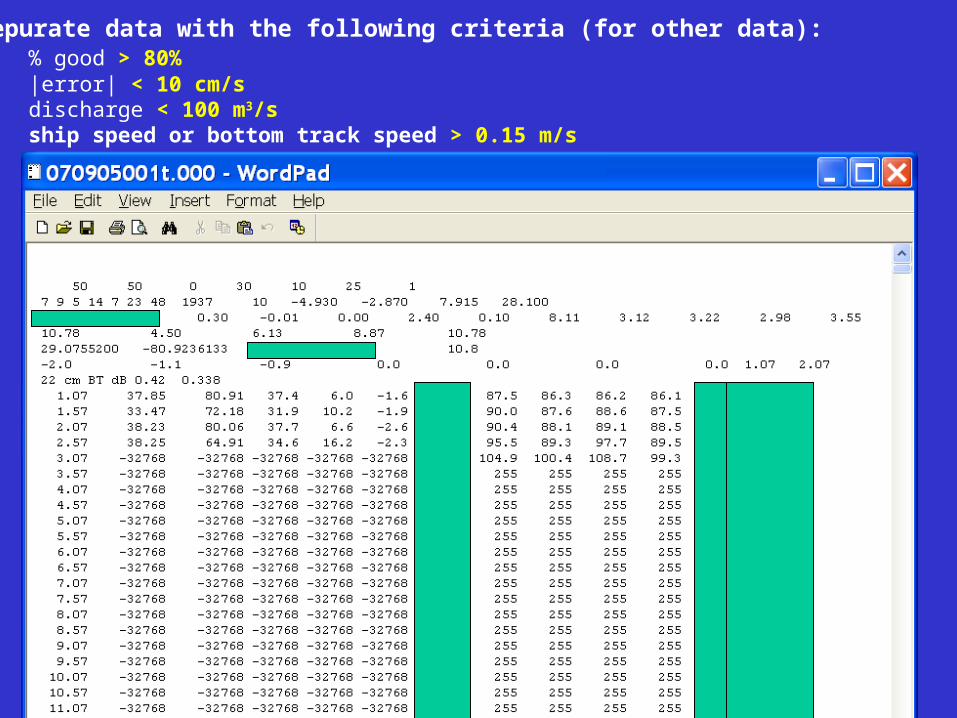
3. Depurate data with the following criteria (for other data):% good > 80%|error| < 10 cm/sdischarge < 100 m3/sship speed or bottom track speed > 0.15 m/s
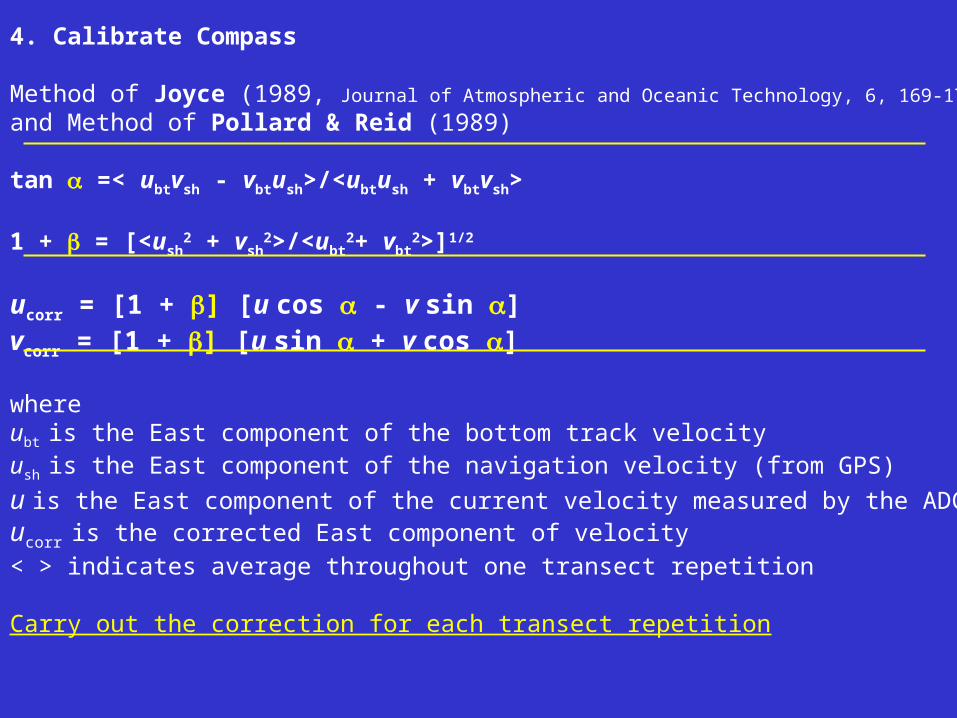
4. Calibrate Compass
Method of Joyce (1989, Journal of Atmospheric and Oceanic Technology, 6, 169-172) and Method of Pollard & Reid (1989)
tan =< ubtvsh - vbtush>/<ubtush + vbtvsh>
1 + = [<ush2 + vsh
2>/<ubt2+ vbt
2>]1/2
ucorr = [1 + ] [u cos - v sin ]vcorr = [1 + ] [u sin + v cos ]
whereubt is the East component of the bottom track velocityush is the East component of the navigation velocity (from GPS)
u is the East component of the current velocity measured by the ADCPucorr is the corrected East component of velocity
< > indicates average throughout one transect repetition
Carry out the correction for each transect repetition
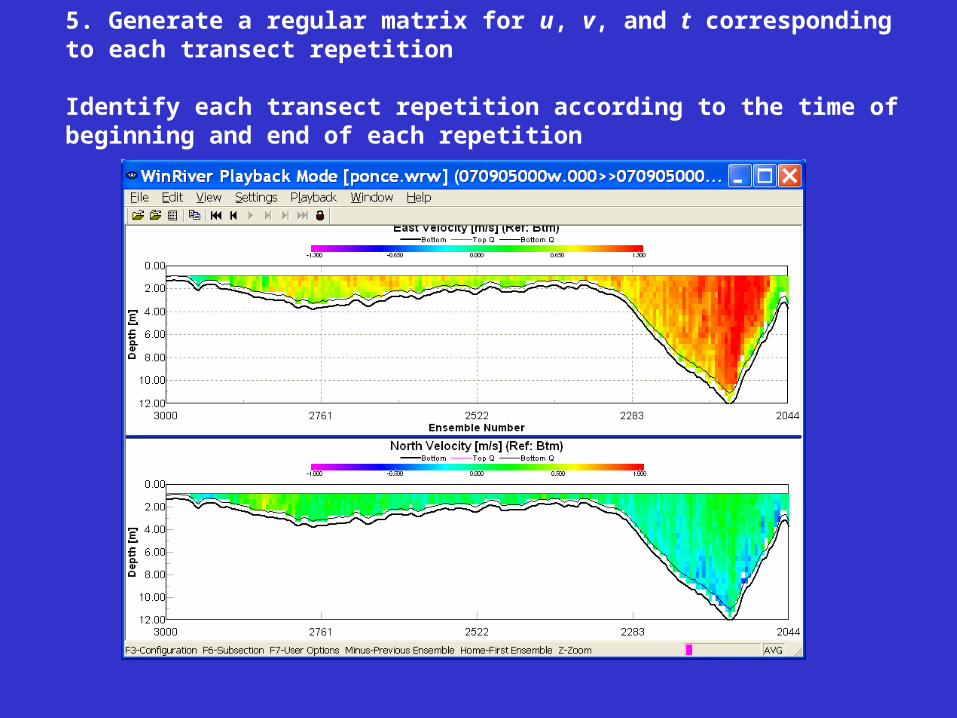
5. Generate a regular matrix for u, v, and t corresponding to each transect repetition
Identify each transect repetition according to the time of beginning and end of each repetition
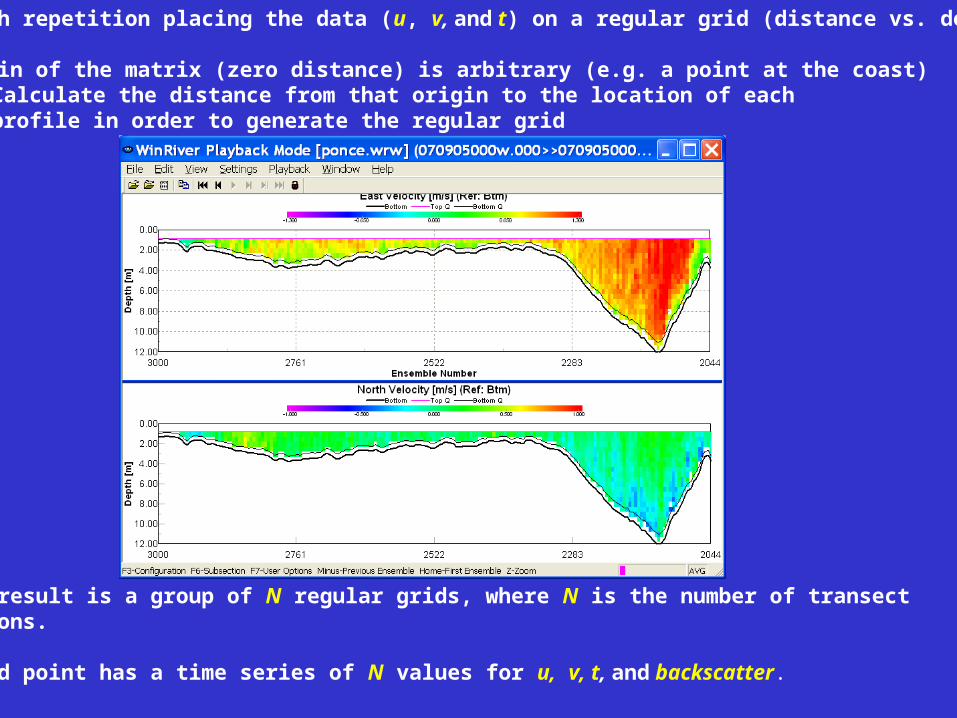
Draw each repetition placing the data (u, v, and t) on a regular grid (distance vs. depth)
The origin of the matrix (zero distance) is arbitrary (e.g. a point at the coast)Calculate the distance from that origin to the location of each
profile in order to generate the regular grid
The end result is a group of N regular grids, where N is the number of transect repetitions.
Each grid point has a time series of N values for u, v, t, and backscatter.