Embed Size (px)
DESCRIPTION
Winona Area Public Schools (WAPS) Staff Health Program. Samantha Adams, Andrew Weiers, Nicole Wilhelm. Outline. Background Information Statement of Problems/ Statistics Goals and Objectives Resources Constraints Intervention/Activities Evaluation Timeline Budget Conclusion. - PowerPoint PPT Presentation
Citation preview
Winona Area Public Schools (WAPS) Staff Health
Program
Samantha Adams, Andrew Weiers, Nicole Wilhelm
Outline
• Background Information• Statement of Problems/ Statistics• Goals and Objectives• Resources• Constraints• Intervention/Activities• Evaluation• Timeline• Budget• Conclusion
Background Information
• Staff members of WAPS
• Number Employed- 640
• Majority of faculty are
between the ages of 41-
70
• Majority of WAPS faculty
are female
Methodology
• Survey Questionnaire
• Multiple Choice
• Survey delivered through
Qualtrix
• Link sent out through staff e-
• Reminder posters placed in
busy areas
Statement of Problems
• Stress Levels
– 85% of participants reported their stress level
medium to high.
– 74% of participants’ stress was work-related
Statement of Problems
• Weight Management/Nutrition– 89% of participants were interested in losing
weight- 1% increase from 2008
Statement of Problems
• Physical Activity– 54% of participants rated their physical fitness
level between good and excellent.

Goals
• To decrease the stress among Winona Area Public Schools faculty.
• To increase knowledge of weight management strategies among Winona Area Public Schools faculty.
• To increase physical activity among Winona Area Public School faculty.
Impact Objectives
• When asked, the percentage of faculty that say their stress is medium to high will have decreased from 85% to 75% by Fall 2010.
• When asked, the percentage of faculty that say their knowledge of stress management is good to excellent will increase from 84% to 90% by Fall 2010.
Impact Objectives
• When asked, the percentage of faculty that say their physical fitness level is good to excellent will have increased from 54% to 70% by Fall 2010.
• By Fall 2010, 25% will be exercising 3 to 5 days a week for 30 to 60 minutes a time.

Outcome Objectives
• 70% of faculty will report using exercise as a way to reduce stress by Fall 2010.
• 90% of faculty will report having good to excellent weight management knowledge.
• By Fall 2010, the percentage of Winona Area Public School faculty that are attending nutritional and dietary activities will increase from 21% to 35%.
Resources
• Middle School Weight Room
• WSU students to facilitate circuit training
• District printing of flyers
• Tech school massage therapy students
• Winona area paths

Constraints: Internal Weaknesses
• Very set in ways • Busy Schedule
Constraints: External Threats
• Other Commitments that take up time– Family– Coaching/Clubs– Teaching Extra Classes
• Fast Food
Intervention/Activities
• Massage Therapy– Flyers
• Circuit Training Program– Demonstrate– Guidance
• Walking Program– Flyers– Grouped by school
Massage Therapy
• Target group: High stress staff
• When: Before the holidays
• Where: Available at several times and locations
• Facilitator: Put on by Southeast Tech Students
• Marketing: Flyers and Emails
Circuit Training
• Target Group: All staff
• When: Wednesdays- 3:30-5:30 (flexible)
• Where: At Winona Middle School Fitness Center
• Facilitator: WSU Exercise Science Student
• Marketing: Flyers and Emails
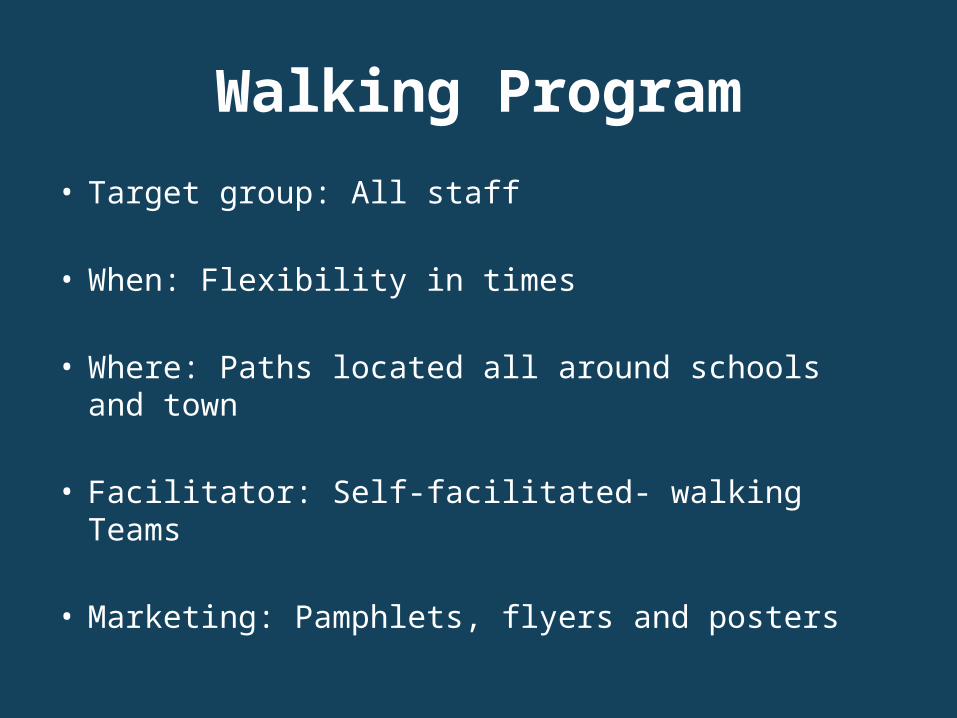
Walking Program
• Target group: All staff
• When: Flexibility in times
• Where: Paths located all around schools and town
• Facilitator: Self-facilitated- walking Teams
• Marketing: Pamphlets, flyers and posters
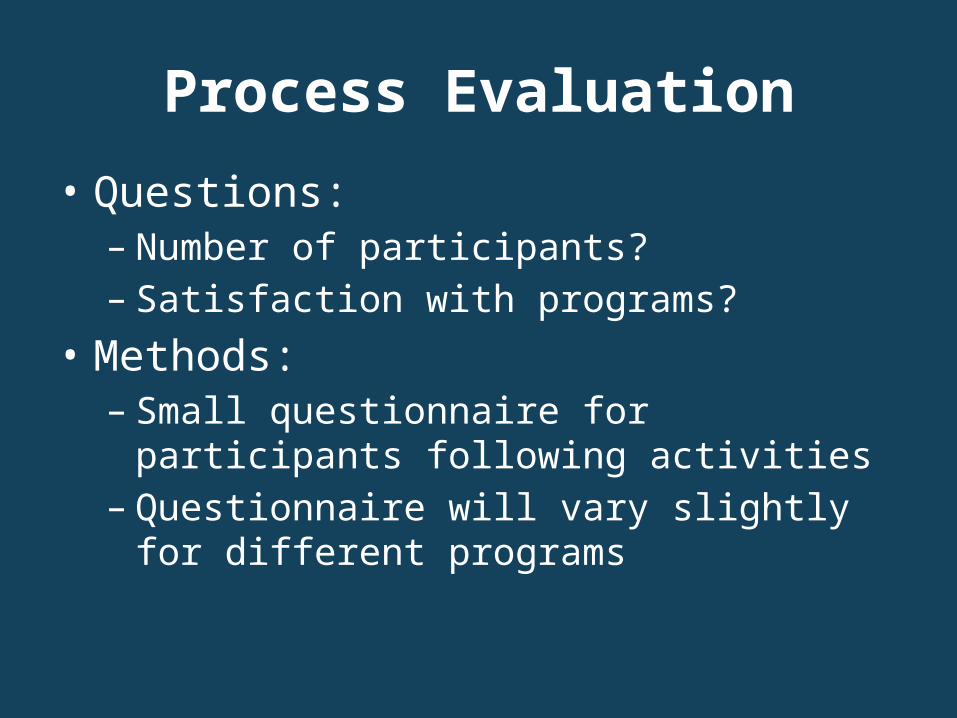
Process Evaluation
• Questions:– Number of participants?– Satisfaction with programs?
• Methods:– Small questionnaire for participants following
activities– Questionnaire will vary slightly for different
programs
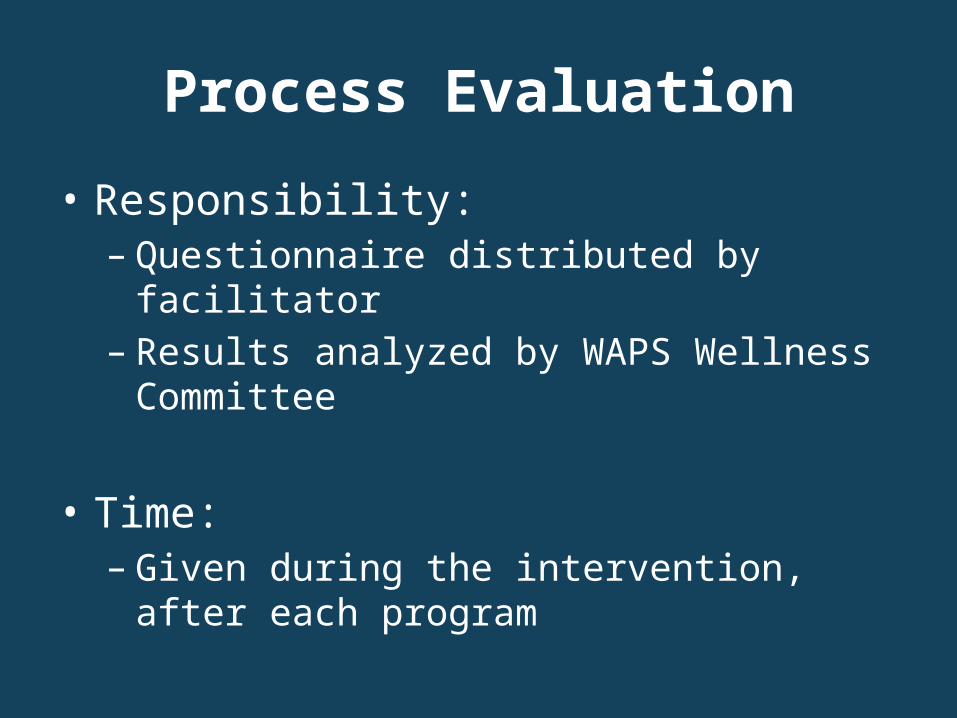
Process Evaluation
• Responsibility:– Questionnaire distributed by facilitator– Results analyzed by WAPS Wellness Committee
• Time:– Given during the intervention, after each program
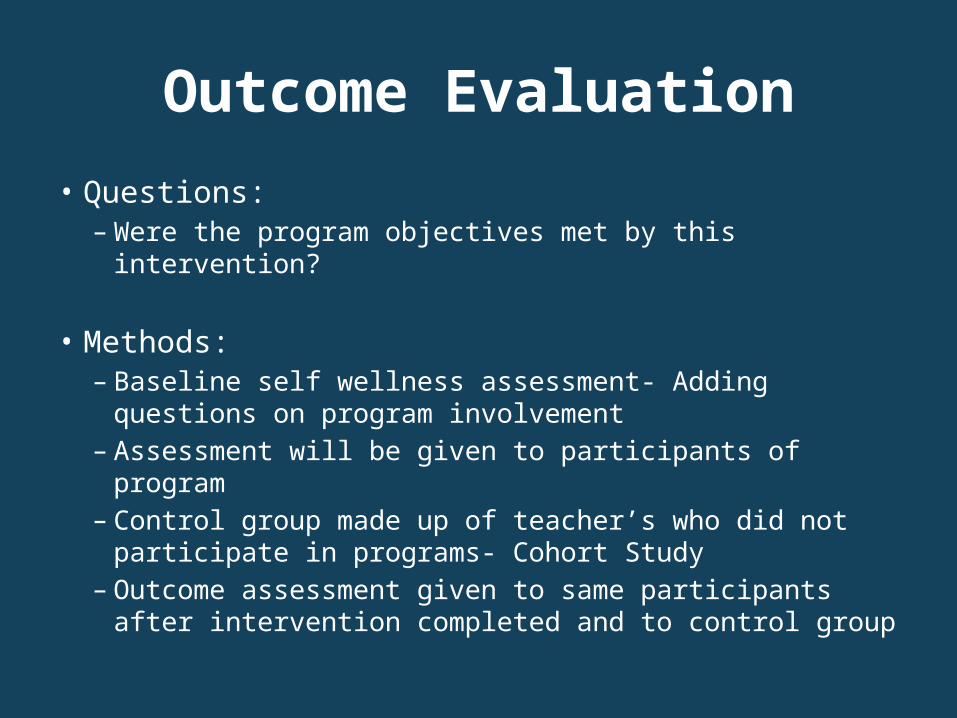
Outcome Evaluation
• Questions:– Were the program objectives met by this intervention?
• Methods:– Baseline self wellness assessment- Adding questions on
program involvement– Assessment will be given to participants of program– Control group made up of teacher’s who did not
participate in programs- Cohort Study– Outcome assessment given to same participants after
intervention completed and to control group
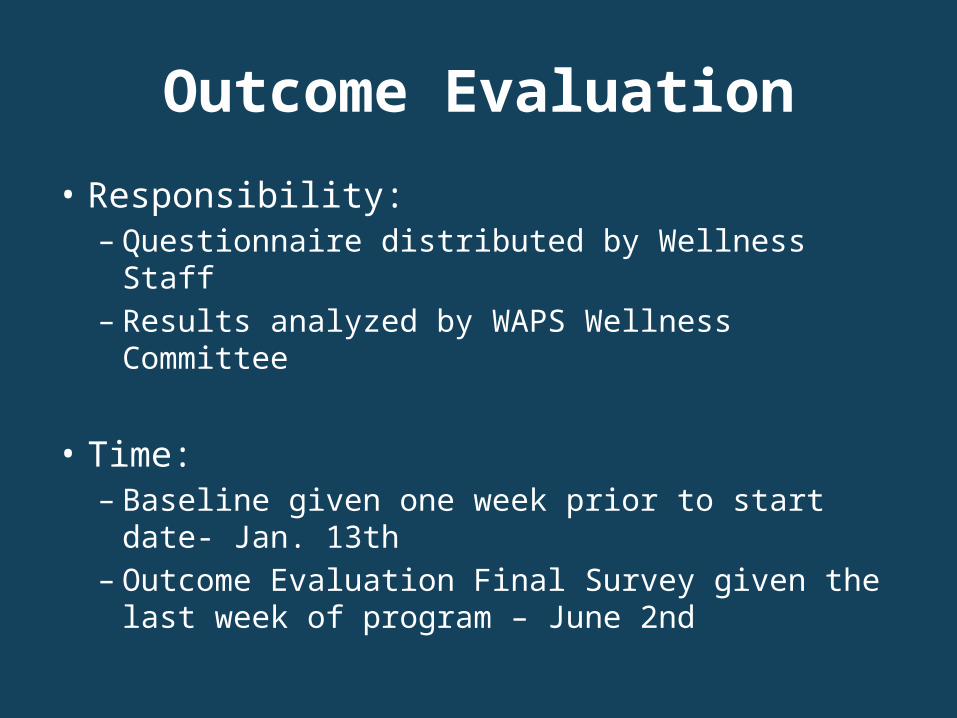
Outcome Evaluation
• Responsibility:– Questionnaire distributed by Wellness Staff– Results analyzed by WAPS Wellness Committee
• Time:– Baseline given one week prior to start date- Jan.
13th– Outcome Evaluation Final Survey given the last
week of program – June 2nd
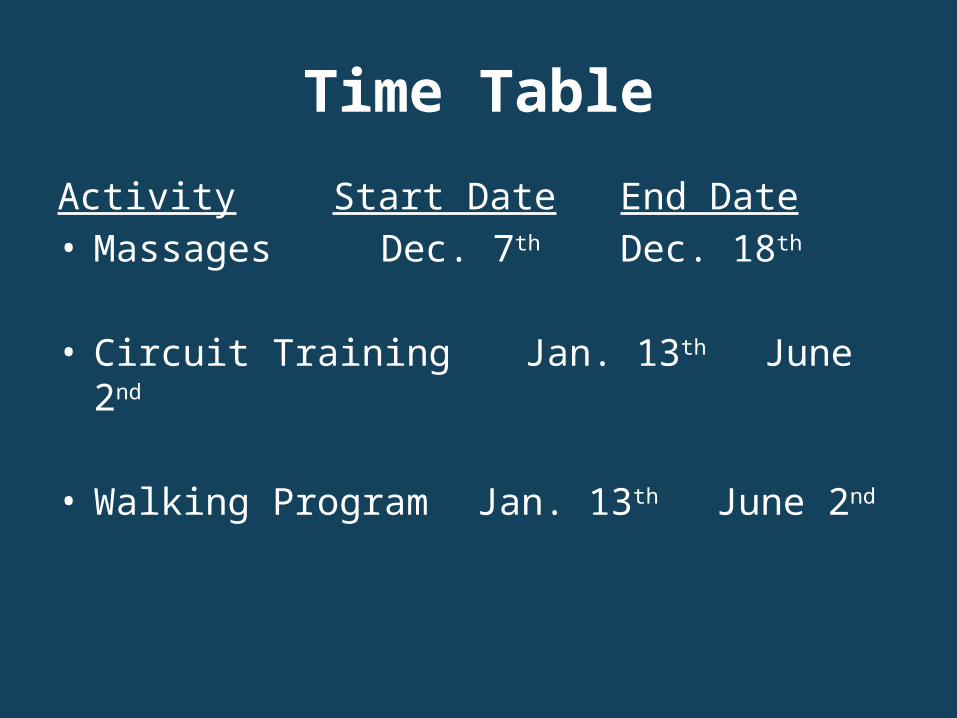
Time Table
Activity Start Date End Date• Massages Dec. 7th Dec. 18th
• Circuit Training Jan. 13th June 2nd
• Walking Program Jan. 13th June 2nd
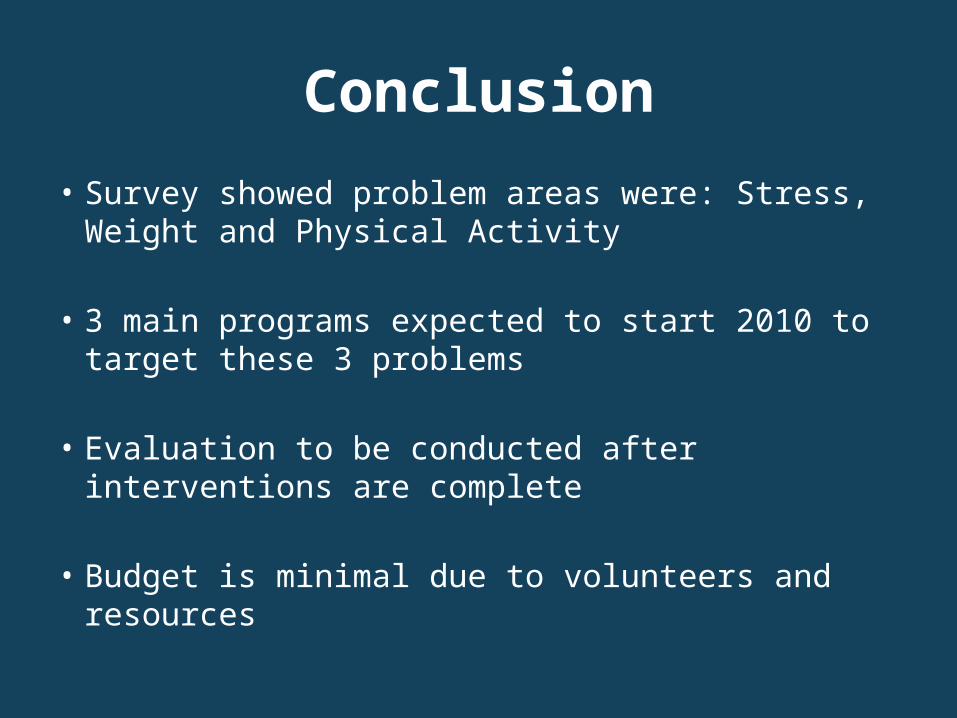
Conclusion
• Survey showed problem areas were: Stress, Weight and Physical Activity
• 3 main programs expected to start 2010 to target these 3 problems
• Evaluation to be conducted after interventions are complete
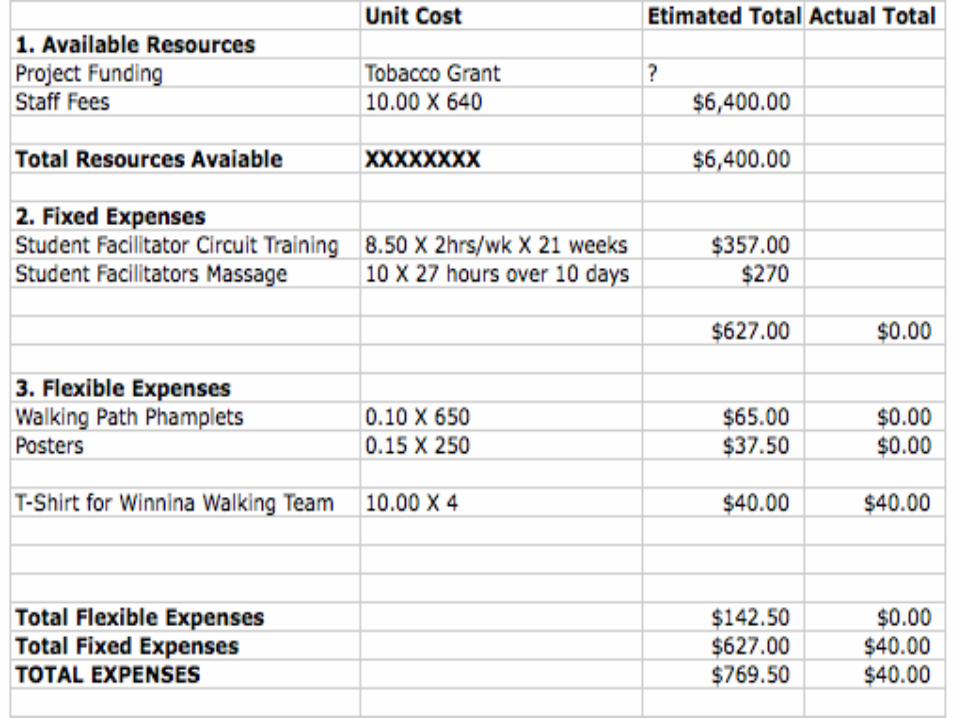
• Budget is minimal due to volunteers and resources

Qu
estio
ns