Embed Size (px)
Citation preview
WINOGRADSKY REVIEW
Colorful niches of phototrophicmicroorganisms shaped by vibrationsof the water molecule
Maayke Stomp1,3, Jef Huisman1,2,3, Lucas J Stal1,2 and Hans CP Matthijs1
1Aquatic Microbiology, Institute for Biodiversity and Ecosystem Dynamics, University of Amsterdam,Amsterdam, The Netherlands and 2Marine Microbiology, Netherlands Institute of Ecology (NIOO-KNAW),Centre for Estuarine and Marine Ecology, Yerseke, The Netherlands
The photosynthetic pigments of phototrophic microorganisms cover different regions of the solarlight spectrum. Utilization of the light spectrum can be interpreted in terms of classical niche theory,as the light spectrum offers opportunities for niche differentiation and allows coexistence of speciesabsorbing different colors of light. However, which spectral niches are available for phototrophicmicroorganisms? Here, we show that the answer is hidden in the vibrations of the water molecule.Water molecules absorb light at specific wavebands that match the energy required for theirstretching and bending vibrations. Although light absorption at these specific wavelengths appearsonly as subtle shoulders in the absorption spectrum of pure water, these subtle shoulders createlarge gaps in the underwater light spectrum due to the exponential nature of light attenuation. Modelcalculations show that the wavebands between these gaps define a series of distinct niches in theunderwater light spectrum. Strikingly, these distinct spectral niches match the light absorptionspectra of the major photosynthetic pigments on our planet. This suggests that vibrations of thewater molecule have played a major role in the ecology and evolution of phototrophic micro-organisms.The ISME Journal (2007) 1, 271–282; doi:10.1038/ismej.2007.59; published online 12 July 2007Subject Category: microbial population and community ecologyKeywords: microbial evolution; molecular vibrations; niche differentiation; photosynthesis; phyto-plankton competition; spectral irradiance
Introduction
In the late 19th century, Professor Theodor WEngelmann was the first to demonstrate that photo-trophic organisms utilize specific parts of the lightspectrum. He produced a ‘living action spectrum’,by illuminating filaments of the green alga Spirogyrawith a light spectrum created by a prism glass. Thisrevealed that oxygen-dependent bacteria accumu-lated near those parts of the algal filaments illumi-nated with red and blue light, thus demonstratingthat the pigment chlorophyll absorbs red and bluelight for photosynthesis (Engelmann, 1882). One yearlater, in 1883, Engelmann discovered the utilizationof infrared wavelengths by purple bacteria (Engel-mann, 1883). Since then, many photosyntheticpigments have been identified, each with its own
characteristic absorption spectrum (Pfennig, 1967;Falkowski and Raven, 1997; Des Marais, 2000; Xionget al., 2000; Beja et al., 2001; Falkowski et al., 2004).How can we explain the specific set of pigments thathave evolved on planet Earth? Why is there not asingle black pigment that absorbs all wavelengths?
Utilization of the light spectrum can be inter-preted in terms of classical ecological theory. Lightoffers a spectrum of resources. According toecological theory, niche differentiation along aresource spectrum reduces competition betweenspecies, and thereby promotes their coexistence(Gause, 1934; MacArthur and Levins, 1967; Mayand MacArthur, 1972; Rueffler et al., 2006).Darwin’s finches on the Galapagos islands providea famous example. Niche differentiation along aspectrum of different seed sizes allows a variety offinch species to coexist (Darwin, 1859; Lack, 1974;Grant and Grant, 2002). Likewise, differences inlight absorption spectra of species result in nichedifferentiation along the light spectrum. Indeed,competition models and experiments have shownthat red and green picocyanobacteria can coexist byabsorbing different parts of the light spectrum(Stomp et al., 2004).
Received 12 May 2007; revised and accepted 15 June 2007;published online 12 July 2007
Correspondence: Professor J Huisman, Aquatic Microbiology,Institute for Biodiversity and Ecosystem Dynamics, Universityof Amsterdam, Nieuwe Achtergracht 127, 1018 WS Amsterdam,The Netherlands.E-mail: [email protected] authors contributed equally to this work.
The ISME Journal (2007) 1, 271–282& 2007 International Society for Microbial Ecology All rights reserved 1751-7362/07 $30.00
www.nature.com/ismej
Niche differentiation along the light spectrum isprobably a common phenomenon in aquatic ecosys-tems. For instance, a recent field survey confirmedthat the relative abundances of red and greenpicocyanobacteria in lakes and seas are related tothe underwater light color (Stomp et al., 2007). Redpicocyanobacteria dominate in relatively clearwaters, where green light penetrates the deepest,while green picocyanobacteria dominate in turbidwaters, where red light penetrates the deepest.Coexistence of red and green picocyanobacteria iswidespread in waters of intermediate coloration.Likewise, many other studies have revealed a closecorrespondence between the absorption spectra ofphototrophic microorganisms and the prevailingunderwater light spectrum (for example, Piersonet al., 1990; Wood et al., 1998; Beja et al., 2001; Vilaand Abella, 2001; Rocap et al., 2003; Kuhl et al.,2005; Bouman et al., 2006; Sabehi et al., 2007).
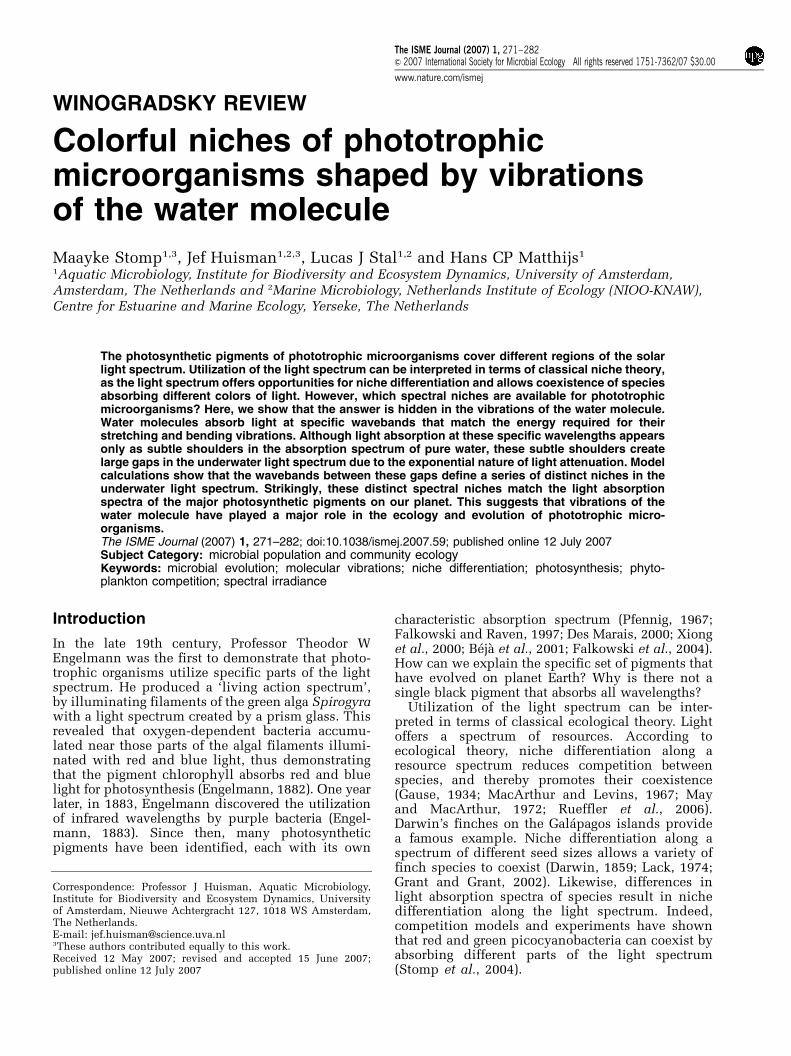
Which spectral niches are available for photo-trophic microorganisms? If our planet would offer acontinuum of spectral niches, then one wouldexpect a free distribution of light absorption spectraalong this continuum (as in Figure 1a). Alterna-tively, it might be that environmental conditionsconstrain part of the resource spectrum, such thatonly a few distinct niches are available (Figure 1b).In this paper, we show that vibrations of the watermolecule create gaps in the underwater lightspectrum. As a result, not all wavebands are equallyavailable for photosynthesis. This yields a series ofdistinct spectral niches for phototrophic micro-organisms.
Vibrations of water molecules
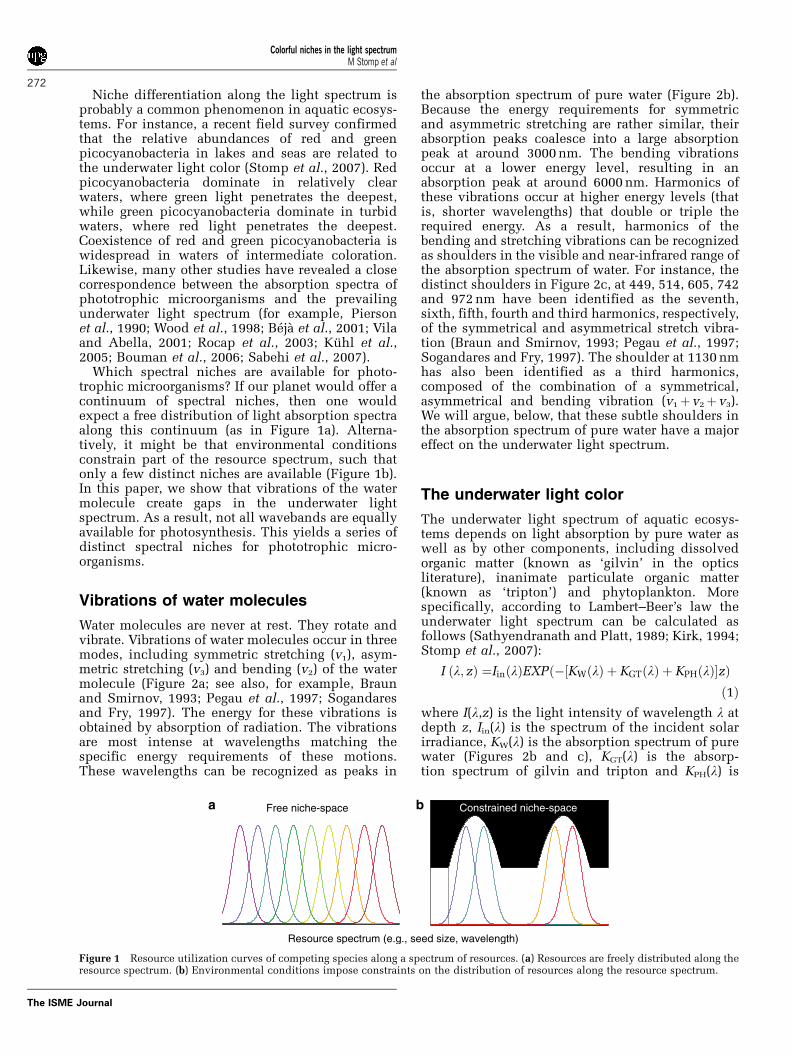
Water molecules are never at rest. They rotate andvibrate. Vibrations of water molecules occur in threemodes, including symmetric stretching (v1), asym-metric stretching (v3) and bending (v2) of the watermolecule (Figure 2a; see also, for example, Braunand Smirnov, 1993; Pegau et al., 1997; Sogandaresand Fry, 1997). The energy for these vibrations isobtained by absorption of radiation. The vibrationsare most intense at wavelengths matching thespecific energy requirements of these motions.These wavelengths can be recognized as peaks in
the absorption spectrum of pure water (Figure 2b).Because the energy requirements for symmetricand asymmetric stretching are rather similar, theirabsorption peaks coalesce into a large absorptionpeak at around 3000 nm. The bending vibrationsoccur at a lower energy level, resulting in anabsorption peak at around 6000 nm. Harmonics ofthese vibrations occur at higher energy levels (thatis, shorter wavelengths) that double or triple therequired energy. As a result, harmonics of thebending and stretching vibrations can be recognizedas shoulders in the visible and near-infrared range ofthe absorption spectrum of water. For instance, thedistinct shoulders in Figure 2c, at 449, 514, 605, 742and 972 nm have been identified as the seventh,sixth, fifth, fourth and third harmonics, respectively,of the symmetrical and asymmetrical stretch vibra-tion (Braun and Smirnov, 1993; Pegau et al., 1997;Sogandares and Fry, 1997). The shoulder at 1130 nmhas also been identified as a third harmonics,composed of the combination of a symmetrical,asymmetrical and bending vibration (v1þ v2þ v3).We will argue, below, that these subtle shoulders inthe absorption spectrum of pure water have a majoreffect on the underwater light spectrum.
The underwater light color
The underwater light spectrum of aquatic ecosys-tems depends on light absorption by pure water aswell as by other components, including dissolvedorganic matter (known as ‘gilvin’ in the opticsliterature), inanimate particulate organic matter(known as ‘tripton’) and phytoplankton. Morespecifically, according to Lambert–Beer’s law theunderwater light spectrum can be calculated asfollows (Sathyendranath and Platt, 1989; Kirk, 1994;Stomp et al., 2007):
I ðl; zÞ ¼IinðlÞEXPð�½KWðlÞ þ KGTðlÞ þ KPHðlÞ�zÞð1Þ
where I(l,z) is the light intensity of wavelength l atdepth z, Iin(l) is the spectrum of the incident solarirradiance, KW(l) is the absorption spectrum of purewater (Figures 2b and c), KGT(l) is the absorp-tion spectrum of gilvin and tripton and KPH(l) is
Resource spectrum (e.g., seed size, wavelength)
Constrained niche-spacea Free niche-space b
Figure 1 Resource utilization curves of competing species along a spectrum of resources. (a) Resources are freely distributed along theresource spectrum. (b) Environmental conditions impose constraints on the distribution of resources along the resource spectrum.
Colorful niches in the light spectrumM Stomp et al
272
The ISME Journal
the absorption spectrum of the phytoplanktoncommunity.
The incident solar irradiance has essentially awhite spectrum with a few small dips from 450 to900 nm, and two large gaps in the infrared at 950 and1120 nm. These dips in the incident solar spectrumare due to light absorption by oxygen and watermolecules in the atmosphere (Kirk, 1994). Purewater mainly absorbs red and infrared light, withseveral distinct shoulders (Figure 2c). In contrast,gilvin and tripton absorb strongly in the blue region
of the spectrum (Figures 3a–c). More specifically,the absorption spectrum of gilvin and tripton is adecreasing function of wavelength, which can bedescribed by a smoothly declining exponentialcurve (Bricaud et al., 1981; Kirk, 1994):
KGTðlÞ ¼ KGTð440ÞEXP �Sðl� 440Þð Þ ð2Þwhere KGT(440) is the attenuation coefficient ofgilvin and tripton at a reference wavelength of440 nm, and S is the slope of the exponentialdecline. The attenuation coefficient KGT(440) is
Wavelength (nm)100 1000 10000
Abs
orpt
ion
(m-1
)
10-3
10-2
10-1
100
101
102
103
104
105
106
107
108
Frequency (cm-1)
103104105
symmetric stretch 1= 3280 cm-1
asymmetric stretch 3 = 3490 cm-1
bend 2 = 1654 cm-1
3
+
Wavelength (nm)400 500 600 700 800 900 1000 1100
Abs
orpt
ion
(m-1
)
10-3
10-2
10-1
100
101
102
103
a+b=4
a+b=5
a+b=6
harmonics
a + b
a+b=7
7th
6th
5th
4th
3rd 3rd
a+b=3
12
2 3
+1
1
3
+1 2 + 3
3
+1 2 + 3
Figure 2 (a) The three vibrational modes of the water molecule and their fundamental frequencies in liquid water: symmetric stretching(v1), bending (v2) and asymmetric stretching (v3). The atoms move in the directions indicated by arrows. (b) Absorption spectrum of purewater (Hale and Querry, 1973; Segelstein, 1981; Pope and Fry, 1997). Peaks in the absorption spectrum correspond to the fundamentalfrequencies and higher harmonics of the vibrations of the water molecules. (c) Absorption spectrum of pure water in the visible andinfrared region. Shoulders in the absorption spectrum correspond to the third, fourth, fifth, sixth and seventh harmonics of thesymmetric and asymmetric stretch vibrations, as indicated.
Colorful niches in the light spectrumM Stomp et al
273
The ISME Journal
proportional to the concentration of gilvin andtripton.
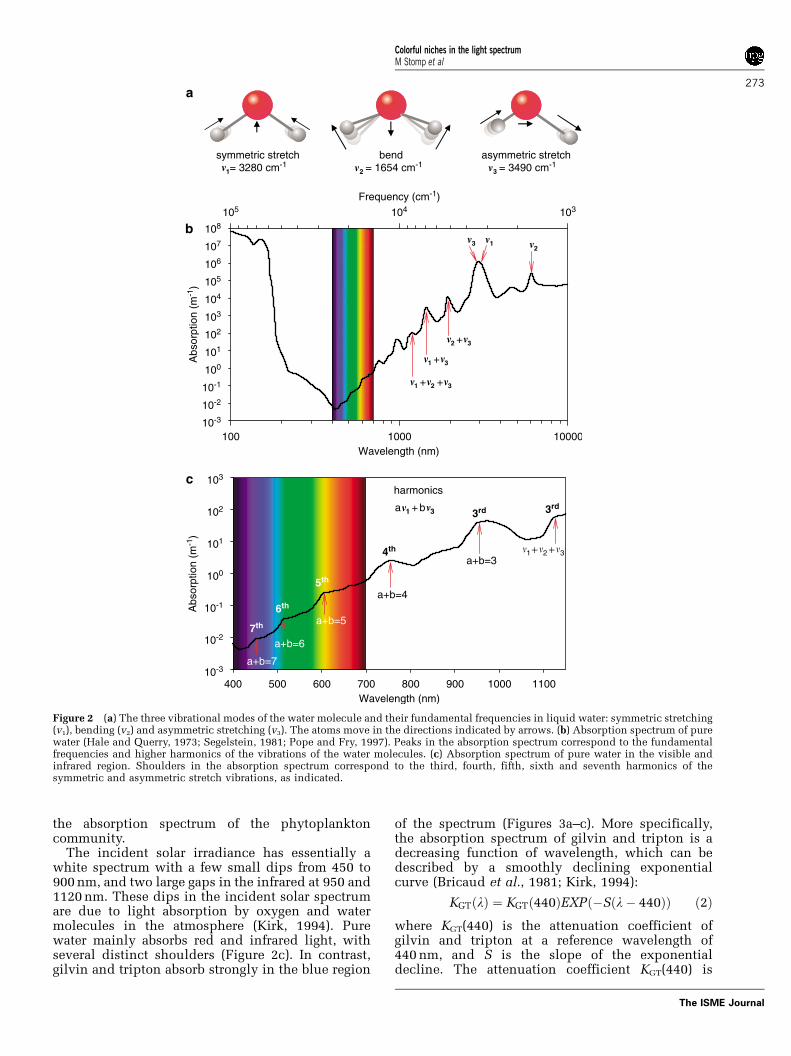
In waters with low concentrations of gilvin andtripton and low phytoplankton concentrations, lightabsorption by pure water dominates (for example,Kirk, 1994; Morel et al., 2007). This applies, forinstance, to the oligotrophic waters of the subtropi-cal Pacific Ocean (Figure 3a). Here, red light isabsorbed by water within the upper 10 m, whereasblue light penetrates much deeper (Figure 3d).Indeed, selective absorption of red light is respon-sible for the blue color of the oceans of our planet. Incoastal waters, like the Baltic Sea, gilvin and triptonconcentrations are higher, and their light absorptionis often of a similar magnitude as light absorption bywater itself (Figure 3b). As a result, green lightpenetrates the deepest (Figure 3e). In peat lakes,gilvin and tripton concentrations are extremelyhigh, such that blue and green lights are rapidly
absorbed (Figure 3c). As a result, red light penetratesthe deepest (Figure 3f). Hence, with increasinggilvin and tripton concentrations, the underwaterlight color is shifted from the blue part towards thegreen and red part of the spectrum.
To investigate in further detail how gilvin con-centrations affect the underwater light spectrum, wemeasured the underwater light spectrum in a varietyof different aquatic ecosystems, ranging from bluewaters of the Pacific Ocean to brown waters of veryhumic lakes. In addition, we searched the literaturefor light spectra measured in microbial mats, andfound a beautiful spectrum from the murky micro-bial mats surrounding Rabbit Creek Spouter inYellowstone National Park (Boomer et al., 2000).Figure 4 shows graphical plots of the underwaterlight spectra measured at the euphotic depth. Theeuphotic depth is here defined as the depth at whichthe irradiance over the entire photosynthetically
Wavelength (nm)
400 500 600 700 400 500 600 700
Surface
1 m
3 m
6 m
9 m17 m
Coastal waterClear ocean
Abs
orpt
ion
(m-1
)
0.0
0.2
0.4
0.6
0.8
1.0
Irra
dian
ce
(sca
led
to m
axim
um)
0
1
400 500 600 700
irrad
ianc
e an
d ab
sorp
tion
(sca
led
to m
axim
um)
0
1
Gilvin +
tripton
Surface
100 m
Prochlorococcus
Red cyanobacteria
Irradiance 120 m
a
e
b
d
Peat lake
0
1
2
3
4
5c
Water
1 m3 m
9 m
50 m
Surface
5 cm
25 cm
45 cm
75 cm
Irradiance 12 m
Irradiance 75 cm
Green cyanobacteria
WaterWaterGilvin
+ tripton
Gilvin
+ tripton
g h
f
i
Figure 3 Underwater light spectra measured in the subtropical Pacific Ocean (station ALOHA), the coastal waters of the Baltic Sea(stations near the Gulf of Finland), and a peat lake in The Netherlands (Lake Groote Moost). (a–c) Light absorption spectra of pure water(blue line) and gilvin plus tripton (brown line). Note that light absorption by gilvin plus tripton is low in the Pacific Ocean, intermediatein the Baltic Sea and extremely high in Lake Groote Moost. (d–f) Underwater light spectra show that blue light penetrates very deep intothe subtropical Pacific Ocean, green light penetrates deep into the Baltic Sea, while red light prevails in Lake Groote Moost. (g) Thephytoplankton community sampled at 120 m depth in the subtropical Pacific Ocean was dominated by low-light adaptedProchlorococcus, which strongly absorb the available blue light using the pigments divinyl-chlorophyll a and b (absorption band at450–500 nm). (h) The phytoplankton community sampled at 12 m depth in the Baltic Sea was dominated by red-colored Synechococcusstrains, which strongly absorb the available green light using the pigment phycoerythrin. (i) The phytoplankton community sampled at75 cm depth in Lake Groote Moost was dominated by green cyanobacteria and green algae, which strongly absorb the available red light(absorption peaks of phycocyanin at 635 nm and chlorophyll a at 680 nm). Materials and methods for these measurements are describedin the Supplementary Information.
Colorful niches in the light spectrumM Stomp et al
274
The ISME Journal
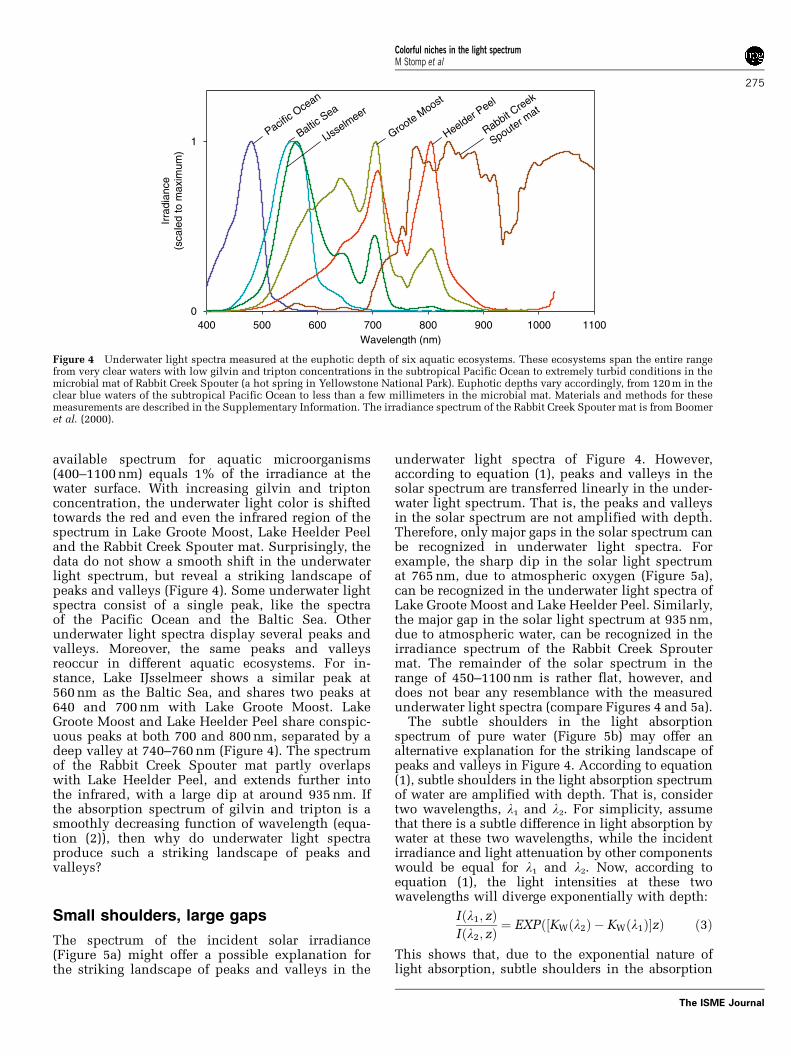
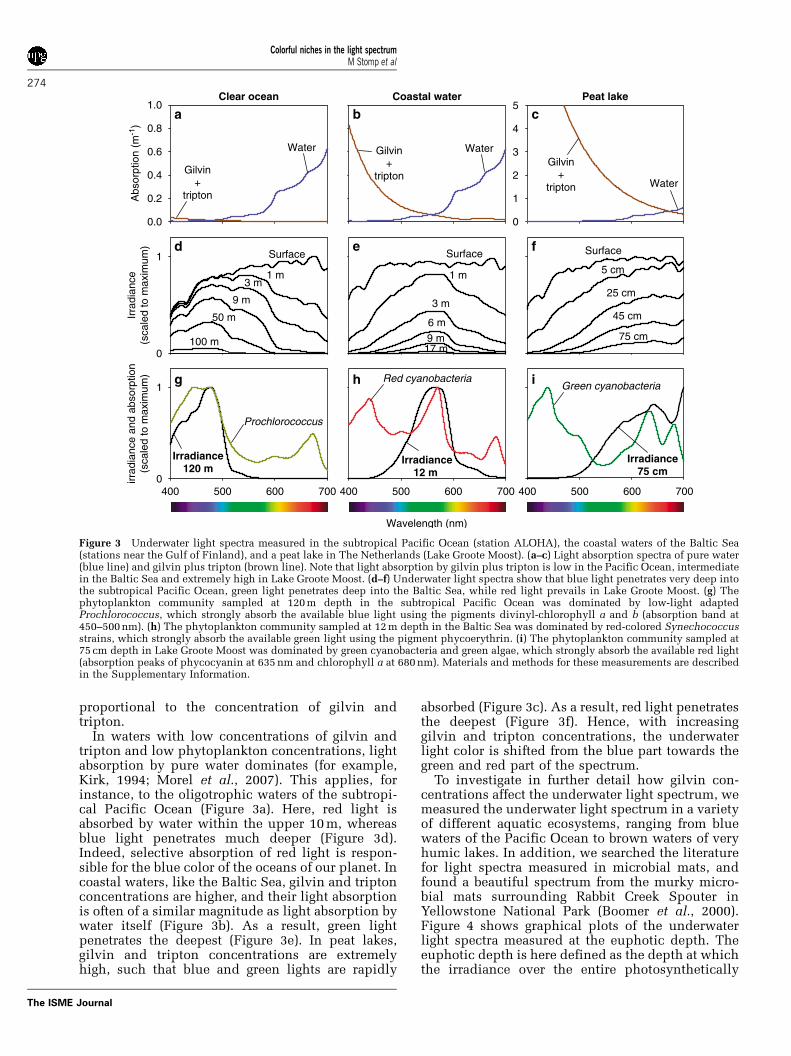
available spectrum for aquatic microorganisms(400–1100 nm) equals 1% of the irradiance at thewater surface. With increasing gilvin and triptonconcentration, the underwater light color is shiftedtowards the red and even the infrared region of thespectrum in Lake Groote Moost, Lake Heelder Peeland the Rabbit Creek Spouter mat. Surprisingly, thedata do not show a smooth shift in the underwaterlight spectrum, but reveal a striking landscape ofpeaks and valleys (Figure 4). Some underwater lightspectra consist of a single peak, like the spectraof the Pacific Ocean and the Baltic Sea. Otherunderwater light spectra display several peaks andvalleys. Moreover, the same peaks and valleysreoccur in different aquatic ecosystems. For in-stance, Lake IJsselmeer shows a similar peak at560 nm as the Baltic Sea, and shares two peaks at640 and 700 nm with Lake Groote Moost. LakeGroote Moost and Lake Heelder Peel share conspic-uous peaks at both 700 and 800 nm, separated by adeep valley at 740–760 nm (Figure 4). The spectrumof the Rabbit Creek Spouter mat partly overlapswith Lake Heelder Peel, and extends further intothe infrared, with a large dip at around 935 nm. Ifthe absorption spectrum of gilvin and tripton is asmoothly decreasing function of wavelength (equa-tion (2)), then why do underwater light spectraproduce such a striking landscape of peaks andvalleys?
Small shoulders, large gaps
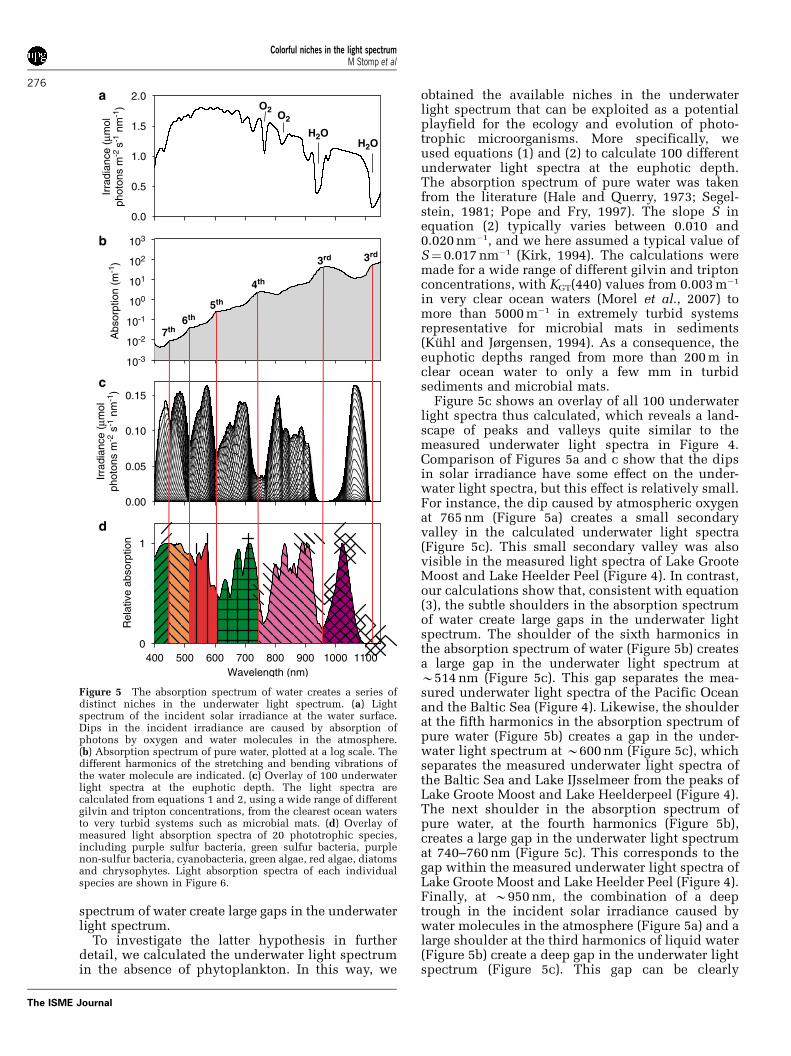
The spectrum of the incident solar irradiance(Figure 5a) might offer a possible explanation forthe striking landscape of peaks and valleys in the
underwater light spectra of Figure 4. However,according to equation (1), peaks and valleys in thesolar spectrum are transferred linearly in the under-water light spectrum. That is, the peaks and valleysin the solar spectrum are not amplified with depth.Therefore, only major gaps in the solar spectrum canbe recognized in underwater light spectra. Forexample, the sharp dip in the solar light spectrumat 765 nm, due to atmospheric oxygen (Figure 5a),can be recognized in the underwater light spectra ofLake Groote Moost and Lake Heelder Peel. Similarly,the major gap in the solar light spectrum at 935 nm,due to atmospheric water, can be recognized in theirradiance spectrum of the Rabbit Creek Sproutermat. The remainder of the solar spectrum in therange of 450–1100 nm is rather flat, however, anddoes not bear any resemblance with the measuredunderwater light spectra (compare Figures 4 and 5a).
The subtle shoulders in the light absorptionspectrum of pure water (Figure 5b) may offer analternative explanation for the striking landscape ofpeaks and valleys in Figure 4. According to equation(1), subtle shoulders in the light absorption spectrumof water are amplified with depth. That is, considertwo wavelengths, l1 and l2. For simplicity, assumethat there is a subtle difference in light absorption bywater at these two wavelengths, while the incidentirradiance and light attenuation by other componentswould be equal for l1 and l2. Now, according toequation (1), the light intensities at these twowavelengths will diverge exponentially with depth:
Iðl1; zÞIðl2; zÞ
¼ EXPð KWðl2Þ � KWðl1Þ½ �zÞ ð3Þ
This shows that, due to the exponential nature oflight absorption, subtle shoulders in the absorption
Wavelength (nm)400 500 600 700 800 900 1000 1100
Irra
dian
ce(s
cale
d to
max
imum
)
0
1Pacifi
c Oce
an
Baltic Sea
IJsse
lmeer
Groote Moost
Heelder Peel
Rabbit Creek
Spouter mat
Figure 4 Underwater light spectra measured at the euphotic depth of six aquatic ecosystems. These ecosystems span the entire rangefrom very clear waters with low gilvin and tripton concentrations in the subtropical Pacific Ocean to extremely turbid conditions in themicrobial mat of Rabbit Creek Spouter (a hot spring in Yellowstone National Park). Euphotic depths vary accordingly, from 120 m in theclear blue waters of the subtropical Pacific Ocean to less than a few millimeters in the microbial mat. Materials and methods for thesemeasurements are described in the Supplementary Information. The irradiance spectrum of the Rabbit Creek Spouter mat is from Boomeret al. (2000).
Colorful niches in the light spectrumM Stomp et al
275
The ISME Journal
spectrum of water create large gaps in the underwaterlight spectrum.
To investigate the latter hypothesis in furtherdetail, we calculated the underwater light spectrumin the absence of phytoplankton. In this way, we
obtained the available niches in the underwaterlight spectrum that can be exploited as a potentialplayfield for the ecology and evolution of photo-trophic microorganisms. More specifically, weused equations (1) and (2) to calculate 100 differentunderwater light spectra at the euphotic depth.The absorption spectrum of pure water was takenfrom the literature (Hale and Querry, 1973; Segel-stein, 1981; Pope and Fry, 1997). The slope S inequation (2) typically varies between 0.010 and0.020 nm�1, and we here assumed a typical value ofS¼ 0.017 nm�1 (Kirk, 1994). The calculations weremade for a wide range of different gilvin and triptonconcentrations, with KGT(440) values from 0.003 m�1
in very clear ocean waters (Morel et al., 2007) tomore than 5000 m�1 in extremely turbid systemsrepresentative for microbial mats in sediments(Kuhl and Jørgensen, 1994). As a consequence, theeuphotic depths ranged from more than 200 m inclear ocean water to only a few mm in turbidsediments and microbial mats.
Figure 5c shows an overlay of all 100 underwaterlight spectra thus calculated, which reveals a land-scape of peaks and valleys quite similar to themeasured underwater light spectra in Figure 4.Comparison of Figures 5a and c show that the dipsin solar irradiance have some effect on the under-water light spectra, but this effect is relatively small.For instance, the dip caused by atmospheric oxygenat 765 nm (Figure 5a) creates a small secondaryvalley in the calculated underwater light spectra(Figure 5c). This small secondary valley was alsovisible in the measured light spectra of Lake GrooteMoost and Lake Heelder Peel (Figure 4). In contrast,our calculations show that, consistent with equation(3), the subtle shoulders in the absorption spectrumof water create large gaps in the underwater lightspectrum. The shoulder of the sixth harmonics inthe absorption spectrum of water (Figure 5b) createsa large gap in the underwater light spectrum atB514 nm (Figure 5c). This gap separates the mea-sured underwater light spectra of the Pacific Oceanand the Baltic Sea (Figure 4). Likewise, the shoulderat the fifth harmonics in the absorption spectrum ofpure water (Figure 5b) creates a gap in the under-water light spectrum at B600 nm (Figure 5c), whichseparates the measured underwater light spectra ofthe Baltic Sea and Lake IJsselmeer from the peaks ofLake Groote Moost and Lake Heelderpeel (Figure 4).The next shoulder in the absorption spectrum ofpure water, at the fourth harmonics (Figure 5b),creates a large gap in the underwater light spectrumat 740–760 nm (Figure 5c). This corresponds to thegap within the measured underwater light spectra ofLake Groote Moost and Lake Heelder Peel (Figure 4).Finally, at B950 nm, the combination of a deeptrough in the incident solar irradiance caused bywater molecules in the atmosphere (Figure 5a) and alarge shoulder at the third harmonics of liquid water(Figure 5b) create a deep gap in the underwater lightspectrum (Figure 5c). This gap can be clearly
Abs
orpt
ion
(m-1
)
10-3
10-2
10-1
100
101
102
103
Wavelength (nm)400 500 600 700 800 900 1000 1100
Rel
ativ
e ab
sorp
tion
0
1
Irra
dian
ce (
µmol
phot
ons
m-2
s-1
nm
-1)
0.0
0.5
1.0
1.5
2.0Ir
radi
ance
(µm
olph
oton
s m
-2 s
-1 n
m-1
)
0.00
0.05
0.10
0.15
7th
4th
6th5th
H2O
O2
3rd
O2
H2O
3rd
Figure 5 The absorption spectrum of water creates a series ofdistinct niches in the underwater light spectrum. (a) Lightspectrum of the incident solar irradiance at the water surface.Dips in the incident irradiance are caused by absorption ofphotons by oxygen and water molecules in the atmosphere.(b) Absorption spectrum of pure water, plotted at a log scale. Thedifferent harmonics of the stretching and bending vibrations ofthe water molecule are indicated. (c) Overlay of 100 underwaterlight spectra at the euphotic depth. The light spectra arecalculated from equations 1 and 2, using a wide range of differentgilvin and tripton concentrations, from the clearest ocean watersto very turbid systems such as microbial mats. (d) Overlay ofmeasured light absorption spectra of 20 phototrophic species,including purple sulfur bacteria, green sulfur bacteria, purplenon-sulfur bacteria, cyanobacteria, green algae, red algae, diatomsand chrysophytes. Light absorption spectra of each individualspecies are shown in Figure 6.
Colorful niches in the light spectrumM Stomp et al
276
The ISME Journal
recognized in the irradiance spectra of microbialmats (Pierson et al., 1990; Boomer et al., 2000), asexemplified by the Rabbit Creek Spouter mat(Figure 4). In other words, this exercise shows thatthe underwater light spectrum does not present ahomogeneous playfield for the ecology and evolu-tion of phototrophic microorganisms. Instead, theunderwater light spectrum offers a number ofdistinct niches at specific wavebands, separated bydeep gaps created by the shoulders in the lightabsorption spectrum of the water molecule.
Filling the niches
Have phototrophic microorganisms adapted theabsorption spectra of their pigments to these distinctniches in the underwater light spectrum? Threeexamples are provided in Figure 3. The phytoplank-ton community in the subtropical Pacific Ocean isdominated by picocyanobacteria of the genus Pro-chlorococcus (Chisholm et al., 1988; Letelier et al.,1993). Prochlorococcus effectively absorbs the avail-able blue light with its pigments divinyl-chloro-phyll a and b (Figure 3g). In the Baltic Sea, the
phytoplankton community at the euphotic depth isdominated by red-colored picocyanobacteria of theSynechococcus group (Stomp et al., 2007), whicheffectively absorb the available green light with theirpigment phycoerythrin (Figure 3h). In peat lakes,the phytoplankton community is often dominatedby green-colored phytoplankton species, like greencyanobacteria and green algae, which absorb theavailable red light with pigments such as phycocya-nin and chlorophylls a and b (Figure 3i). This is afirst indication that the light absorption spectra ofphytoplankton communities are often well tuned totheir underwater light environment.
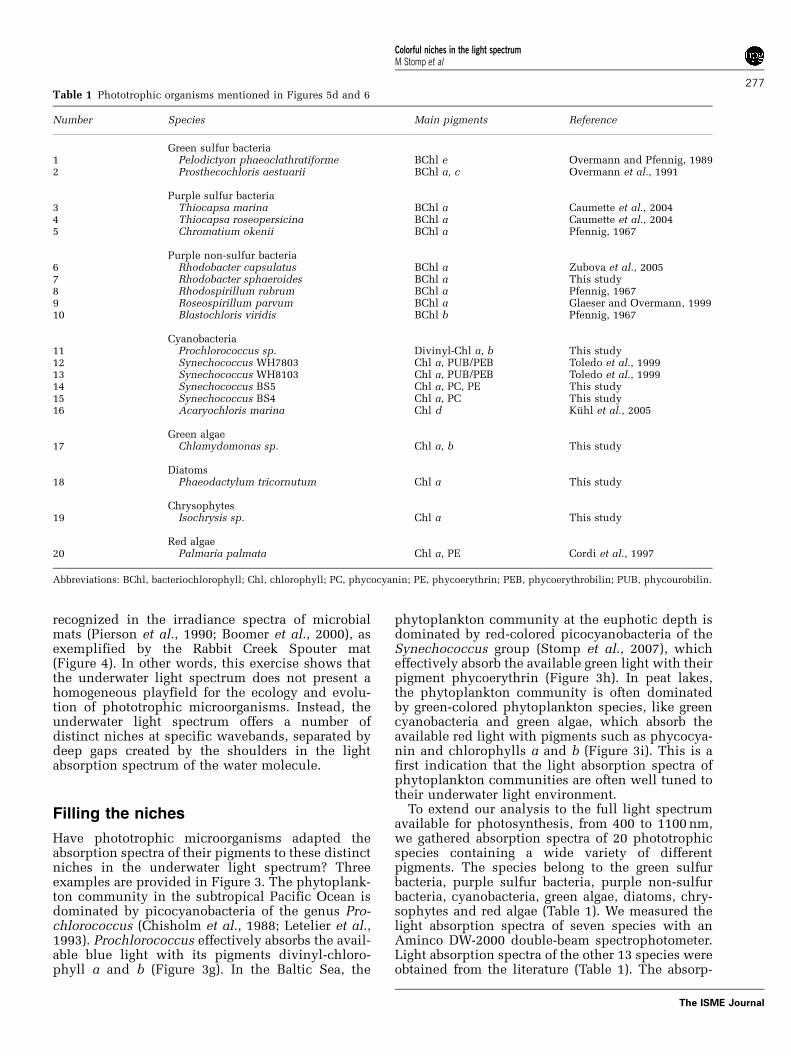
To extend our analysis to the full light spectrumavailable for photosynthesis, from 400 to 1100 nm,we gathered absorption spectra of 20 phototrophicspecies containing a wide variety of differentpigments. The species belong to the green sulfurbacteria, purple sulfur bacteria, purple non-sulfurbacteria, cyanobacteria, green algae, diatoms, chry-sophytes and red algae (Table 1). We measured thelight absorption spectra of seven species with anAminco DW-2000 double-beam spectrophotometer.Light absorption spectra of the other 13 species wereobtained from the literature (Table 1). The absorp-
Table 1 Phototrophic organisms mentioned in Figures 5d and 6
Number Species Main pigments Reference
Green sulfur bacteria1 Pelodictyon phaeoclathratiforme BChl e Overmann and Pfennig, 19892 Prosthecochloris aestuarii BChl a, c Overmann et al., 1991
Purple sulfur bacteria3 Thiocapsa marina BChl a Caumette et al., 20044 Thiocapsa roseopersicina BChl a Caumette et al., 20045 Chromatium okenii BChl a Pfennig, 1967
Purple non-sulfur bacteria6 Rhodobacter capsulatus BChl a Zubova et al., 20057 Rhodobacter sphaeroides BChl a This study8 Rhodospirillum rubrum BChl a Pfennig, 19679 Roseospirillum parvum BChl a Glaeser and Overmann, 199910 Blastochloris viridis BChl b Pfennig, 1967
Cyanobacteria11 Prochlorococcus sp. Divinyl-Chl a, b This study12 Synechococcus WH7803 Chl a, PUB/PEB Toledo et al., 199913 Synechococcus WH8103 Chl a, PUB/PEB Toledo et al., 199914 Synechococcus BS5 Chl a, PC, PE This study15 Synechococcus BS4 Chl a, PC This study16 Acaryochloris marina Chl d Kuhl et al., 2005
Green algae17 Chlamydomonas sp. Chl a, b This study
Diatoms18 Phaeodactylum tricornutum Chl a This study
Chrysophytes19 Isochrysis sp. Chl a This study
Red algae20 Palmaria palmata Chl a, PE Cordi et al., 1997
Abbreviations: BChl, bacteriochlorophyll; Chl, chlorophyll; PC, phycocyanin; PE, phycoerythrin; PEB, phycoerythrobilin; PUB, phycourobilin.
Colorful niches in the light spectrumM Stomp et al
277
The ISME Journal
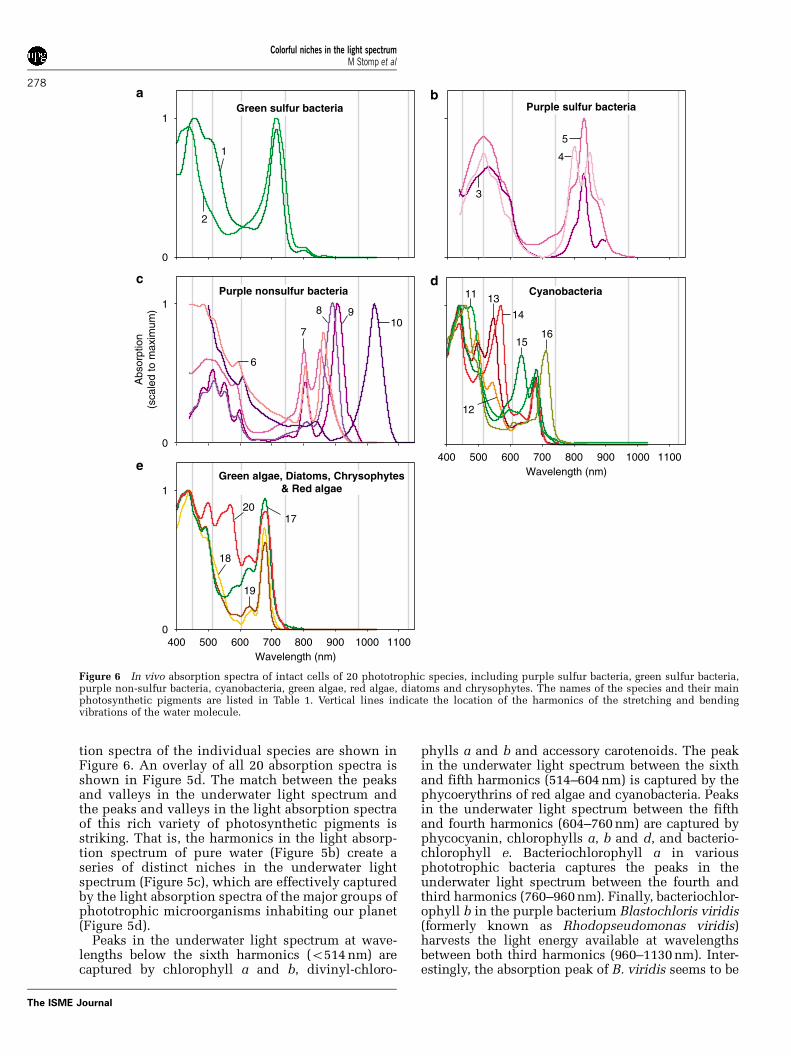
tion spectra of the individual species are shown inFigure 6. An overlay of all 20 absorption spectra isshown in Figure 5d. The match between the peaksand valleys in the underwater light spectrum andthe peaks and valleys in the light absorption spectraof this rich variety of photosynthetic pigments isstriking. That is, the harmonics in the light absorp-tion spectrum of pure water (Figure 5b) create aseries of distinct niches in the underwater lightspectrum (Figure 5c), which are effectively capturedby the light absorption spectra of the major groups ofphototrophic microorganisms inhabiting our planet(Figure 5d).
Peaks in the underwater light spectrum at wave-lengths below the sixth harmonics (o514 nm) arecaptured by chlorophyll a and b, divinyl-chloro-
phylls a and b and accessory carotenoids. The peakin the underwater light spectrum between the sixthand fifth harmonics (514–604 nm) is captured by thephycoerythrins of red algae and cyanobacteria. Peaksin the underwater light spectrum between the fifthand fourth harmonics (604–760 nm) are captured byphycocyanin, chlorophylls a, b and d, and bacterio-chlorophyll e. Bacteriochlorophyll a in variousphototrophic bacteria captures the peaks in theunderwater light spectrum between the fourth andthird harmonics (760–960 nm). Finally, bacteriochlor-ophyll b in the purple bacterium Blastochloris viridis(formerly known as Rhodopseudomonas viridis)harvests the light energy available at wavelengthsbetween both third harmonics (960–1130 nm). Inter-estingly, the absorption peak of B. viridis seems to be
0
1
Purple nonsulfur bacteria
Abs
orpt
ion
(sca
led
to m
axim
um)
0
1
Wavelength (nm)400 500 600 700 800 900 1000 1100
Wavelength (nm)400 500 600 700 800 900 1000 1100
0
1
1
2
5
3
4
7
9810
11
12
13
14
1516
18
1720
19
6
Purple sulfur bacteriaGreen sulfur bacteria
Cyanobacteria
Green algae, Diatoms, Chrysophytes& Red algae
Figure 6 In vivo absorption spectra of intact cells of 20 phototrophic species, including purple sulfur bacteria, green sulfur bacteria,purple non-sulfur bacteria, cyanobacteria, green algae, red algae, diatoms and chrysophytes. The names of the species and their mainphotosynthetic pigments are listed in Table 1. Vertical lines indicate the location of the harmonics of the stretching and bendingvibrations of the water molecule.
Colorful niches in the light spectrumM Stomp et al
278
The ISME Journal
shifted a bit towards shorter wavelengths comparedto its spectral niche (compare Figures 5c and d).Perhaps our model calculations do not provide a veryaccurate description of spectral niches in microbialmats, where scattering of light can play an importantrole (Pierson et al., 1990). Furthermore, the infraredpart of the light absorption spectrum of water issensitive to temperature (Collins, 1925; Braun andSmirnov, 1993), which may shift this spectral nicheto slightly shorter wavelengths at high temperatures.Also, the exact location of the light absorption peakof B. viridis is probably sensitive to temperature,and the range of measurements on lab cultures maynot be exactly the same as in the bacterium’snative environment (Kiang et al., 2007). It would beinteresting to investigate these issues further. Perhapsother species containing bacteriochlorophyll b arecapable to harvest light at even longer wavelengths,and therefore match this infrared niche more closely.
Discussion
In this paper, we have developed the hypothesis thatvibrations of the water molecule generate a series ofdistinct niches in the underwater light spectrum,which are effectively utilized by the differentphototrophic microorganisms inhabiting our planet.
Our hypothesis implicitly assumes that the under-water light spectrum is an important selective factorfor the ecology and evolution of phototrophicmicroorganisms. This hypothesis is supported byseveral lines of evidence. Many physiologicalstudies have shown that light color affects photo-synthesis and growth rates of phototrophic micro-organisms, as has been demonstrated for, forexample, green sulfur bacteria (Montesinos et al.,1983; Vila and Abella, 1994), cyanobacteria (Wymanand Fay, 1986; Hauschild et al., 1991; Callieri et al.,1996) and eukaryotic phytoplankton (Holdsworth,1985; Glover et al., 1987). Furthermore, laboratorycompetition experiments have shown that lightcolor can act as a selective factor. For instance,Parkin and Brock (1980) studied competition be-tween green and purple sulfur bacteria isolated fromthe sulfide containing waters of three stratified lakeswith different underwater light spectra. They ob-served that green sulfur bacteria became dominantin flasks exposed to red light, whereas purple sulfurbacteria became dominant in flasks exposed to greenlight. Likewise, Stomp et al. (2004) studied competi-tion between red and green picocyanobacteriaisolated from the Baltic Sea. They developed acompetition model that predicts that red picocya-nobacteria should become dominant in green light,green picocyanobacteria should become dominantin red light, whereas red and green picocyanobac-teria can coexist in the full spectrum provided bywhite light. The results of their competition experi-ments were consistent with these predictions. Thesestudies demonstrated that light color plays a
decisive role in the species composition of photo-trophic communities, at least in controlled labora-tory experiments.
Numerous field studies have confirmed that thespecies composition of phototrophic microorgan-isms is related to the underwater light spectrum. Forinstance, Figure 3 shows that Prochlorococcus in thesubtropical Pacific Ocean is well tuned to theprevailing blue light, red picocyanobacteria in theBaltic Sea are well tuned to the prevailing greenlight, and green cyanobacteria and green algae inturbid waters are well tuned to the prevailing redlight. Recent work has shown that the relativeabundances of red and green picocyanobacteriashow a clear link with the underwater lightspectrum across many ecosystems (Stomp et al.,2007). Likewise, the relative abundances of proteo-rhodopsin containing bacteria absorbing either blueor green light have been explained by prevailingspectral light conditions (Beja et al., 2001; Sabehiet al., 2007). Similar observations have shown agood correspondence between the absorption spec-tra of phototrophic microorganisms and the under-water light spectrum in clear oceans (Ting et al.,2002; Rocap et al., 2003; Bouman et al., 2006),coastal waters (Olson et al., 1990; Wood et al., 1998;Katano et al., 2007), lakes (Pick, 1991; Voros et al.,1998; Vila and Abella, 2001) and microbial mats(Pfennig, 1967; Pierson et al., 1990; Kuhl et al.,2005). Thus, there is overwhelming evidence fromtheory, laboratory experiments and field data thatthe underwater light spectrum is a major determi-nant of the species composition of phototrophiccommunities.
The novel part of our hypothesis is that theunderwater light spectrum does not offer a conti-nuum of niches (as in Figure 1a), but consists of aseries of distinct niches (as in Figure 1b) created byvibrations of the water molecule. This rather un-expected prediction is supported by the strikingsimilarity between the calculated peaks and valleysin the underwater light spectra (Figure 5c) and theobserved peaks and valleys in the absorption spectraof phototrophic microorganisms (Figure 5d). That is,the absorption spectra of the major photosyntheticpigments fit the available niches in the underwaterlight spectrum. Moreover, each spectral niche can beoccupied by several pigments, with slightly differentabsorption peaks. For example, the niche betweenthe sixth and fifth harmonics is occupied by twotypes of phycoerythrin, known as phycourobilin(PUB; peak at 494 nm) and phycoerythrobilin (PEB;peak at 545 nm) (Toledo et al., 1999). Likewise,several variants of bacteriochlorophyll a cover theniche between the fourth and third harmonics. Thisindicates that, within each spectral niche, absorptionpeaks of phototrophic organisms may diverge, possi-bly driven by the evolutionary process of adaptiveradiation (Schluter, 2000; Rueffler et al., 2006).
Yet, this part of our hypothesis is clearly open forfurther testing. For instance, laboratory competition
Colorful niches in the light spectrumM Stomp et al
279
The ISME Journal
experiments could simulate light environments thatdeviate from the underwater light niches predictedby our model. As a first test, mixtures of photo-trophic microorganisms could be exposed to wave-bands that are less available in underwater lightspectra. For example, wavelengths around 600 nmare relatively less available due to strong absorptionby the fifth harmonics of water (Figure 5c), andcurrently few microorganisms have their absorptionpeak at 600 nm (Figure 6). If this waveband becomesthe prevailing light color in a long-term laboratoryselection experiment, will selection favor newmutants that shift their absorption peak to 600 nm?
Another interesting test could be based on selec-tion experiments in artificial water that lacks thecharacteristic absorption peaks of normal water(H2O). In so-called heavy water (D2O), the hydrogenatoms are replaced by heavier deuterium atoms. As aconsequence, molecular vibrations of D2O occur atother frequencies, and the harmonics of heavy watermolecules are shifted to the far-red compared toH2O. Hence, the absorption spectrum of D2O iscompletely different from that of H2O (Tam andPatel, 1979; Braun and Smirnov, 1993). Our hypo-thesis therefore predicts that, in light-limitedsystems, selection experiments in D2O will lead tophototrophic communities with other light absorp-tion spectra than selection experiments in H2O.
In conclusion, our findings point at a strikingcausal relationship between the stretching andbending vibrations of the water molecule, theunderwater light spectra of aquatic ecosystems andthe ecology and evolution of phototrophic micro-organisms.
Acknowledgements
We thank M Laamanen and DM Karl for the opportunity tojoin cruise Cyano-04 on the Baltic Sea and HOT cruise 174on the Pacific Ocean, and the crew of research vesselsAranda and Kilo Moana for their great help duringsampling. We also thank B Pex, H van Overzee, R Poutsmaand students of the MSc program Limnology & Oceano-graphy 2005 for their help in the Dutch lakes, and HJ Gonsand JC Kromkamp for the underwater light spectrum of LakeIJsselmeer, and their help with the filterpad method. Specialthanks to O Beja and the anonymous referee for theirhelpful comments on the manuscript. The research of MSand JH was supported by the Earth and Life SciencesFoundation (ALW), which is subsidized by the NetherlandsOrganization for Scientific Research (NWO). LJS acknowl-edges support from the European Commission through theproject MIRACLE (EVK3-CT-2002-00087).
References
Beja O, Spudich EN, Spudich JL, Leclerc M, DeLong EF.(2001). Proteorhodopsin phototrophy in the ocean.Nature 411: 786–789.
Boomer SM, Pierson BK, Austinhirst R, Castenholz RW.(2000). Characterization of novel bacteriochlorophyll-
a-containing red filaments from alkaline hot springsin Yellowstone National Park. Arch Microbiol 174:152–161.
Bouman HA, Ulloa O, Scanlan DJ, Zwirglmaier K, LiWKW, Platt T et al. (2006). Oceanographic basis ofthe global surface distribution of Prochlorococcusecotypes. Science 312: 918–921.
Braun CH, Smirnov SN. (1993). Why is water blue? J ChemEdu 70: 612–614.
Bricaud A, Morel A, Prieur L. (1981). Absorption bydissolved organic matter of the sea (yellow substance)in the UV and visible domains. Limnol Oceanogr 26:43–53.
Callieri C, Amicucci E, Bertoni R, Voros L. (1996).Fluorometric characterization of two picocyano-bacteria strains from lakes of different under-water light quality. Int Revue Ges Hydrobiol 81:13–23.
Caumette P, Guyoneaud R, Imhoff JF, Suling J, Gorenko V.(2004). Thiocapsa marina sp. nov. a novel, okenone-containing, purple sulfur bacterium isolated frombrackish coastal and marine environments. Int J SystEvol Microbiol 54: 1031–1036.
Chisholm SW, Olson RJ, Zettler ER, Goericke R, WaterburyJB, Welschmeyer NA. (1988). A novel free-livingprochlorophyte abundant in the oceanic euphoticzone. Nature 334: 340–343.
Collins JR. (1925). Change in the infra-red absorptionspectrum of water with temperature. Phys Rev 26:771–779.
Cordi B, Depledge MH, Price DN, Salter LF, Donkin ME.(1997). Evaluation of chlorophyll fluorescence, in vivospectrophotometric pigment absorption and ion leak-age as biomarkers of UV-B exposure in marinemacroalgae. Mar Biol 130: 41–49.
Darwin CR. (1859). On the Origin of Species by Means ofNatural Selection. John Murray: London.
Des Marais DJ. (2000). Evolution—when did photosyn-thesis emerge on earth? Science 289: 1703–1705.
Engelmann TW. (1882). Uber Sauerstoffausscheidungvon Pflanzenzellen im Mikrospectrum. Bot Zeit 40:419–426.
Engelmann TW. (1883). Bacterium photometricum: einBeitrag zur vergleichenden Physiologie des Licht- undFarbensinnes. Archiv Physiol 30: 95–124.
Falkowski PG, Katz ME, Knoll AH, Quigg A, Raven JA,Schofield O et al. (2004). The evolution of moderneukaryotic phytoplankton. Science 305: 354–360.
Falkowski PG, Raven JA. (1997). Aquatic Photosynthesis,2nd edn. Blackwell Science: London, UK.
Gause GF. (1934). The Struggle for Existence. Williams andWilkins: Baltimore, MD.
Glaeser J, Overmann J. (1999). Selective enrichment andcharacterization of Roseospirillum parvum, gen. nov.and sp. nov., a new purple nonsulfur bacterium withunusual light absorption properties. Arch Microbiol171: 405–416.
Glover HE, Keller MD, Spinrad RW. (1987). The effectsof light quality and intensity on photosynthesisand growth of marine eukaryotic and prokaryoticphytoplankton clones. J Exp Mar Biol Ecol 105:137–159.
Grant PR, Grant BR. (2002). Adaptive radiation of Darwin’sfinches. Am Sci 90: 130–139.
Hale GM, Querry MR. (1973). Optical constants of waterin the 200-nm to 200-mm wavelength region. Appl Opt12: 555–563.
Colorful niches in the light spectrumM Stomp et al
280
The ISME Journal
Hauschild CA, McMurter HJG, Pick FR. (1991). Effect ofspectral quality on growth and pigmentation ofpicocyanobacteria. J Phycol 27: 698–702.
Holdsworth ES. (1985). Effects of growth factors andlight quality on the growth, pigmentation andphotosynthesis of two diatoms, Thalassiosira gravidaand Phaeodactylum tricornutum. Mar Biol 86:253–262.
Katano T, Kaneda A, Kanzaki N, Obayashi Y, Morimoto A,Onitsuka G et al. (2007). Distribution of prokaryoticpicophytoplankton from Seto Inland Sea to theKuroshio region, with special reference to ‘Kyucho’events. Aquat Microb Ecol 46: 191–201.
Kiang NY, Siefert J, Govindjee, Blankenship RE. (2007).Spectral signatures of photosynthesis. I. Review ofEarth organisms. Astrobiology 7: 222–251.
Kirk JTO. (1994). Light and Photosynthesis in AquaticEcosystems, 2nd edn. Cambridge University Press:Cambridge, UK.
Kuhl M, Chen M, Ralph PJ, Schreiber U, Larkum AWD.(2005). A niche for cyanobacteria containing chloro-phyll d. Nature 433: 820.
Kuhl M, Jørgensen BB. (1994). The light field of micro-benthic communities: radiance distribution andmicroscale optics of sandy coastal sediments. LimnolOceanogr 39: 1368–1398.
Lack D. (1974). Darwin’s Finches. Cambridge UniversityPress: Cambridge, UK.
Letelier RM, Bidigare RR, Hebel DV, Ondrusek M,Winn CD, Karl DM. (1993). Temporal variability ofphytoplankton community structure based onpigment analysis. Limnol Oceanogr 38: 1420–1437.
MacArthur R, Levins R. (1967). The limiting similarity,convergence, and divergence of coexisting species.Am Nat 101: 377–385.
May RM, MacArthur RH. (1972). Niche overlap as afunction of environmental variability. Proc Natl AcadSci USA 69: 1109–1113.
Montesinos E, Guerrero R, Abella C, Esteve I. (1983).Ecology and physiology of the competition forlight between Chlorobium limicola and Chlorobiumphaeobacteroides in natural habitats. Appl EnvironMicrobiol 46: 1007–1016.
Morel A, Gentili B, Claustre H, Babin M, Bricaud A, Ras Jet al. (2007). Optical properties of the ‘clearest’ naturalwaters. Limnol Oceanogr 52: 217–229.
Olson RJ, Chisholm SW, Zettler ER, Armbrust EV. (1990).Pigments, size and distribution of Synechococcusin the North Atlantic and Pacific Oceans. LimnolOceanogr 35: 45–58.
Overmann J, Beatty T, Hall KJ, Pfennig N, Northcote TG.(1991). Characterization of a dense, purple sulfurbacterial layer in a meromictic salt lake. LimnolOceanogr 36: 846–859.
Overmann J, Pfennig N. (1989). Pelodictyon phaeoclathra-tiforme sp. nov., a new brown colored member of theChlorobiaceae forming net-like colonies. Arch Micro-biol 152: 401–406.
Parkin TB, Brock TD. (1980). The effects of light quality onthe growth of phototrophic bacteria in lakes. ArchMicrobiol 125: 19–27.
Pegau WS, Gray D, Zaneveld JRV. (1997). Absorption andattenuation of visible and near-infrared light in water:dependence on temperature and salinity. Appl Opt 36:6035–6046.
Pfennig N. (1967). Photosynthetic bacteria. Annu RevMicrobiol 21: 285–324.
Pick FR. (1991). The abundance and composition of fresh-water picocyanobacteria in relation to light penetra-tion. Limnol Oceanogr 36: 1457–1462.
Pierson BK, Sands VM, Frederick JL. (1990). Spectralirradiance and distribution of pigments in a highlylayered marine microbial mat. Appl Environ Microbiol56: 2327–2340.
Pope RM, Fry ES. (1997). Absorption spectrum (380–700 nm) of pure water. II. Integrating cavity measure-ments. Appl Opt 36: 8710–8723.
Rocap G, Larimer FW, Lamerdin J, Malfatti S, Chain P,Ahlgren NA et al. (2003). Genome divergence in twoProchlorococcus ecotypes reflects oceanic niche dif-ferentiation. Nature 424: 1042–1047.
Rueffler C, Van Dooren TJM, Leimar O, Abrams PA. (2006).Disruptive selection and then what? Trends Ecol Evol21: 238–245.
Sabehi G, Kirkup BC, Rozenberg M, Stambler N, Polz MF,Beja O. (2007). Adaptation and spectral tuning indivergent marine proteorhodopsins from the easternMediterranean and the Sargasso Seas. ISME J 1: 48–55.
Sathyendranath S, Platt T. (1989). Computation of aquaticprimary production: extended formalism to includeeffect of angular and spectral distribution of light.Limnol Oceanogr 34: 188–198.
Schluter D. (2000). Ecological character displacement inadaptive radiation. Am Nat 156: S4–S16.
Segelstein DJ. (1981). The Complex Refractive Index OfWater, PhD thesis, University of Missouri: Kansas City,USA.
Sogandares FM, Fry ES. (1997). Absorption spectrum(340–640 nm) of pure water. I. Photothermal measure-ments. Appl Opt 33: 8699–8709.
Stomp M, Huisman J, de Jongh F, Veraart AJ, Gerla D,Rijkeboer M et al. (2004). Adaptive divergence inpigment composition promotes phytoplankton biodi-versity. Nature 432: 104–107.
Stomp M, Huisman J, Voros L, Pick FR, Laamanen M,Haverkamp T et al. (2007). Colourful coexistence ofred and green picocyanobacteria in lakes and seas.Ecol Lett 10: 290–298.
Tam AC, Patel CKN. (1979). Optical absorptions of lightand heavy water by laser optoacoustic spectroscopy.Appl Opt 18: 3348–3358.
Ting CS, Rocap G, King J, Chisholm SW. (2002). Cyano-bacterial photosynthesis in the oceans: the origins andsignificance of divergent light-harvesting strategies.Trends Microbiol 10: 134–142.
Toledo G, Palenik B, Brahamsha B. (1999). Swimmingmarine Synechococcus strains with widely differentphotosynthetic pigment ratios from a monophyleticgroup. Appl Environ Microbiol 65: 5247–5251.
Vila X, Abella CA. (1994). Effects of light quality on thephysiology and the ecology of planktonic green sulfurbacteria in lakes. Photosynth Res 41: 53–65.
Vila X, Abella CA. (2001). Light-harvesting adaptations ofplanktonic phototrophic micro-organisms to differentlight quality conditions. Hydrobiologia 452: 15–30.
Voros L, Callieri C, Balogh KV, Bertoni R. (1998). Fresh-water picocyanobacteria along a trophic gradient andlight quality range. Hydrobiologia 370: 117–125.
Wood AM, Phinney DA, Yentsch CS. (1998). Watercolumn transparency and the distribution of spectrallydistinct forms of phycoerythrin-containing organisms.Mar Ecol Prog Ser 162: 25–31.
Wyman M, Fay P. (1986). Underwater light climate and thegrowth and pigmentation of planktonic blue-green
Colorful niches in the light spectrumM Stomp et al
281
The ISME Journal
algae (cyanobacteria). II. The influence of light quality.Proc R Soc Lond B Biol Sci 227: 381–393.
Xiong J, Fischer WM, Inoue K, Nakahara M, Bauer CE.(2000). Molecular evidence for the early evolution ofphotosynthesis. Science 289: 1724–1730.
Zubova SV, Melzer M, Prokhorenko IR. (2005). Effectof environmental factors on the compositionof lipopolysaccharides released from the Rhodo-bacter capsulatus cell wall. Biol Bull 32:168–173.
Supplementary Information accompanies the paper on The ISME Journal website (http://www.nature.com/ismej)
Colorful niches in the light spectrumM Stomp et al
282
The ISME Journal