Embed Size (px)
Citation preview
“ WinningTrading Strategies
How To Finally Attain the Results You Want In Trading and Build Your Wealth and Income with Proven Strategies that Work
“
By TradersGPS
In this chapter, I will share with you some of my favourite winning
strategies I personally use. As discussed earlier, it is important to adopt a
strategy that has a winning probability of more than 0.5 (50%) and a payoff
ratio of at least 1 to be profitable in the long run. These strategies I am
going to share had been through extensive back-testing and provided me
with good returns in live trading all these years. I am sharing them with you
so that you can focus on trading well rather than engaging in an endless
search for the holy grail.
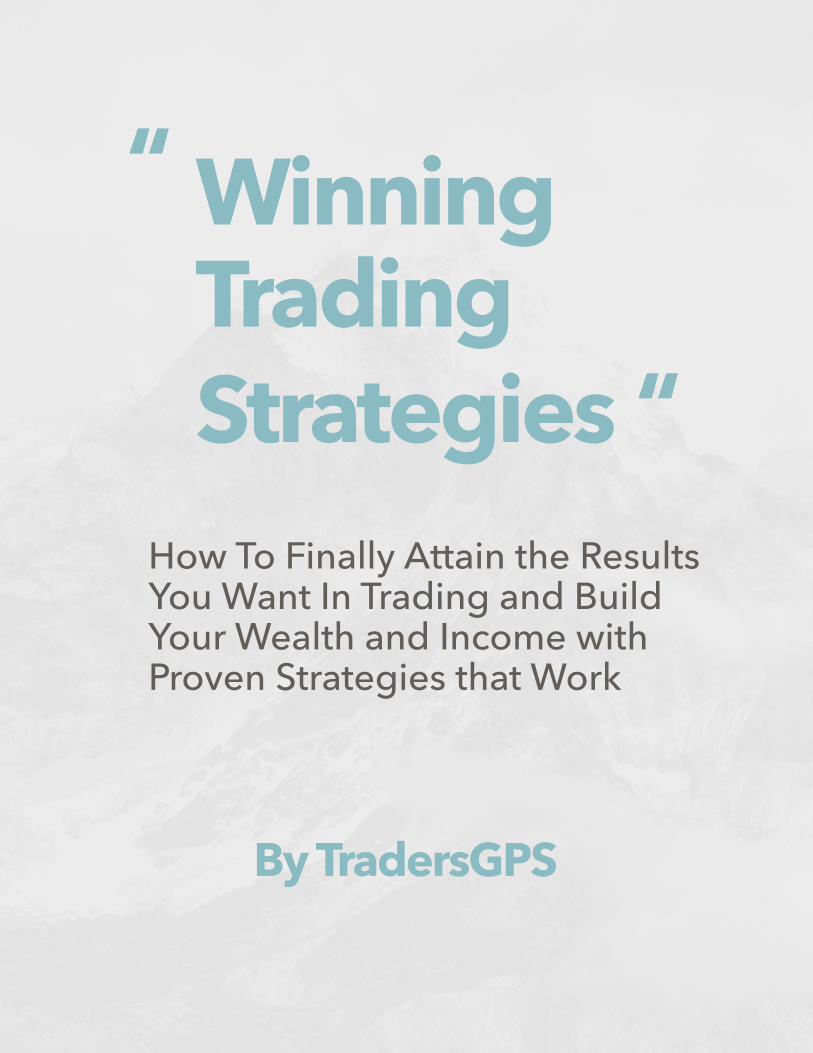
Different strategies are suited for different time-frames. I believe there is
no one size fits all strategy. Below is how I define my time-frames:
• Intra-day Trade – Position opened and closed within the same
trading day
• Swing Trade – Position opened and closed within 5 trading days
• Position Trade – Position opened and closed for 2 weeks or longer
Position trade: riding on big moves
Swing trade: Selling at peaks in downtrend
Swing trade: Buying at dips in uptrend
illustration of position and swing trading
The Swing Trading Strategy
For swing trading, the intention is to identify, follow and trade the trend.
Swing traders look to make profits within 5 trading days. Daily candles are
frequently used for Technical Analysis, which determines the key entry and
exit decisions in swing trading. For swing trades, traders generally buy the
dips in an uptrend or sell the peaks in a downtrend.
Remember the famous quote “The trend is your friend”? By trading the
trend, you are riding the momentum of the market, which gives an edge to
traders. It is like swimming alongside with the sea current rather than
against it. You should know how tough it is to swim against the current and
eventually you will choose to give up due to exhaustion. Remember that
as a trader, we must always have an edge over the market to be successful.
This is just like a casino having an edge over the punters.
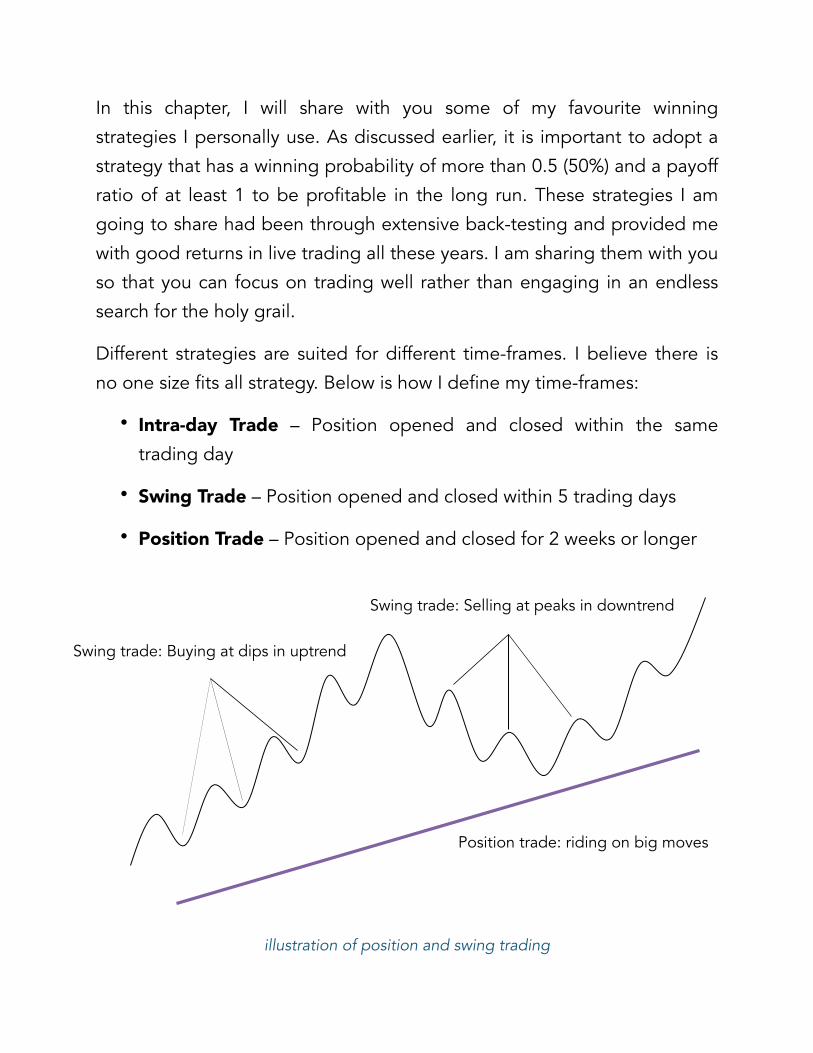
For new traders, you may not understand exactly what is an up or down
trend. To qualify an uptrend, we are looking for higher highs and higher
lows.
!
illustration of a market in an uptrend
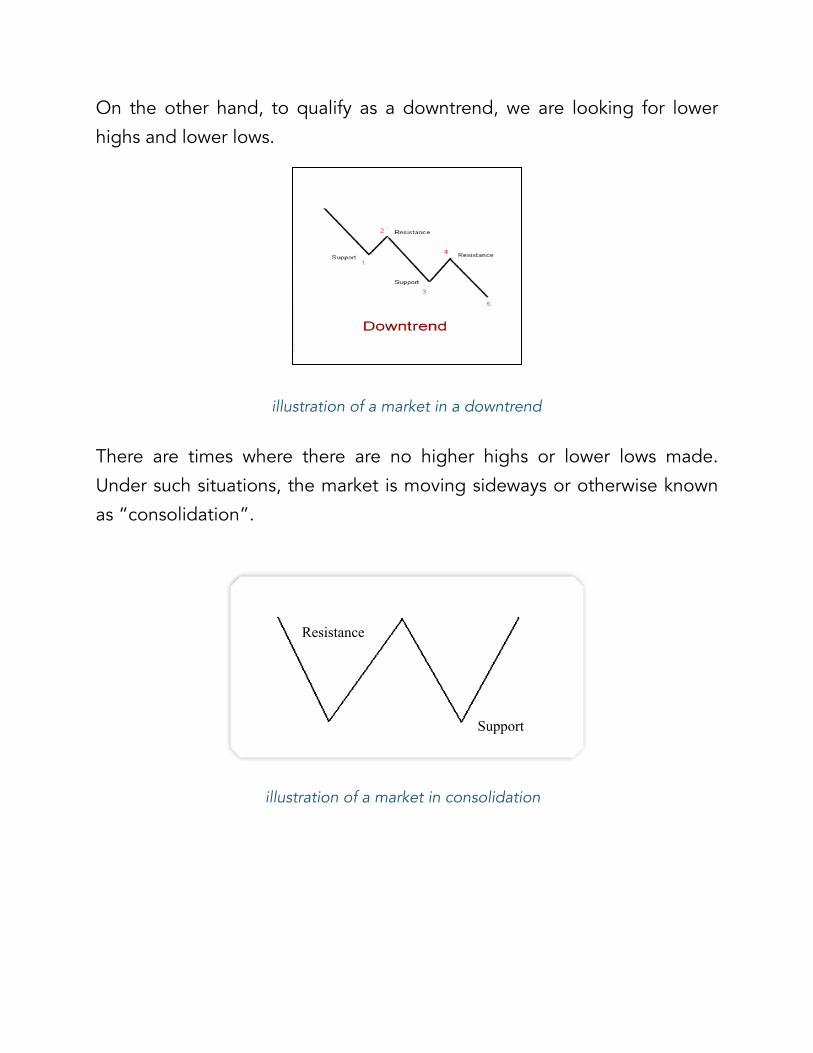
On the other hand, to qualify as a downtrend, we are looking for lower
highs and lower lows.
!
There are times where there are no higher highs or lower lows made.
Under such situations, the market is moving sideways or otherwise known
as “consolidation”.
!
Resistance
Support
illustration of a market in a downtrend
illustration of a market in consolidation
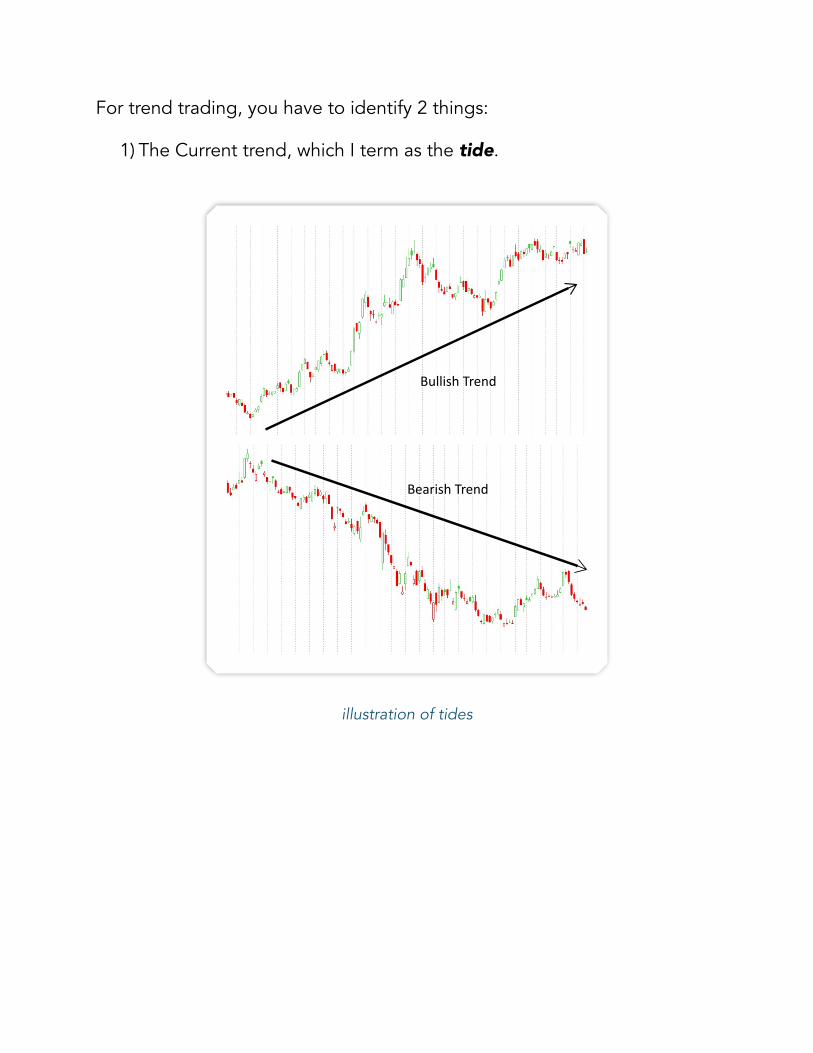
For trend trading, you have to identify 2 things:
1) The Current trend, which I term as the tide.
illustration of tides
Bullish Trend
Bearish Trend
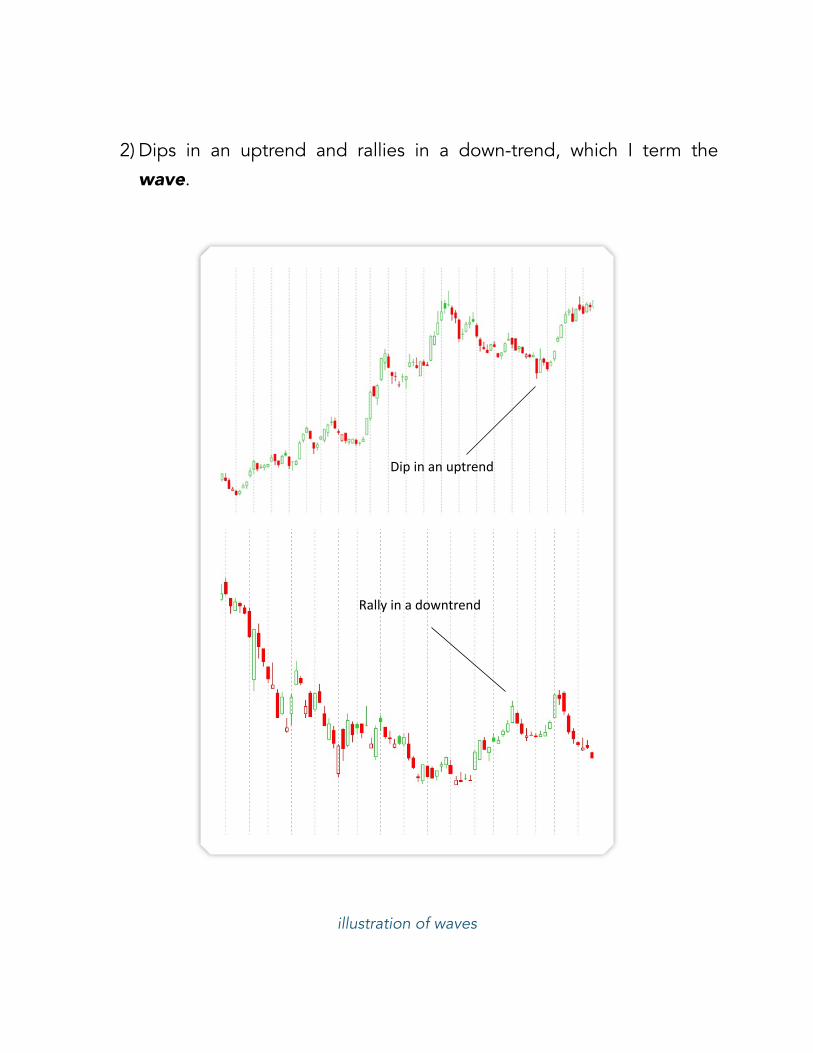
2) Dips in an uptrend and rallies in a down-trend, which I term the
wave.
illustration of waves
Rally in a downtrend
Dip in an uptrend
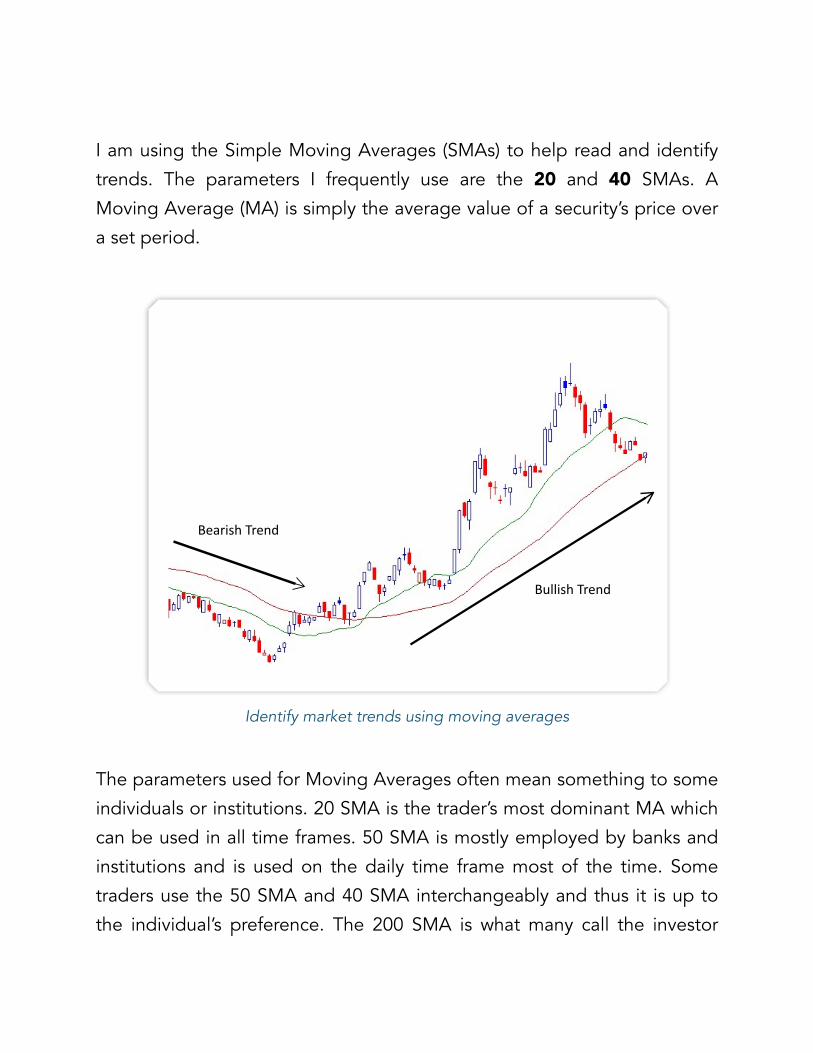
I am using the Simple Moving Averages (SMAs) to help read and identify
trends. The parameters I frequently use are the 20 and 40 SMAs. A
Moving Average (MA) is simply the average value of a security’s price over
a set period.
!
Identify market trends using moving averages
The parameters used for Moving Averages often mean something to some
individuals or institutions. 20 SMA is the trader’s most dominant MA which
can be used in all time frames. 50 SMA is mostly employed by banks and
institutions and is used on the daily time frame most of the time. Some
traders use the 50 SMA and 40 SMA interchangeably and thus it is up to
the individual’s preference. The 200 SMA is what many call the investor
Bearish Trend
Bullish Trend
line and serves as a good support and resistance especially on the 15mins
charts.
• 10 or 20 SMA – Traders’ Line
• 40 or 50 SMA – Banks and Institutions’ Line
• 200 SMA – Investors’ Line
Based on my experience, it is not so much about the number or parameter
you are using on your charts. Rather, it is what the numbers mean and how
you use or perceive it in accordance to your overall trading strategy. Some
traders like to use the 21 SMA as 21 is a Fibonacci number. To them, they
may have a good understanding of Fibonacci numbers and thus believe
that the number 21 means something in the equity market. To me, it does
not really matter if the number is 20, 21 or 19. Once again, it is how I
interpret the number, what it means to me and how I use it to define my
setups. Thus, do not be too overly concerned with exactly which number
to use and dwell into the endless research for the “HOLY NUMBER”.
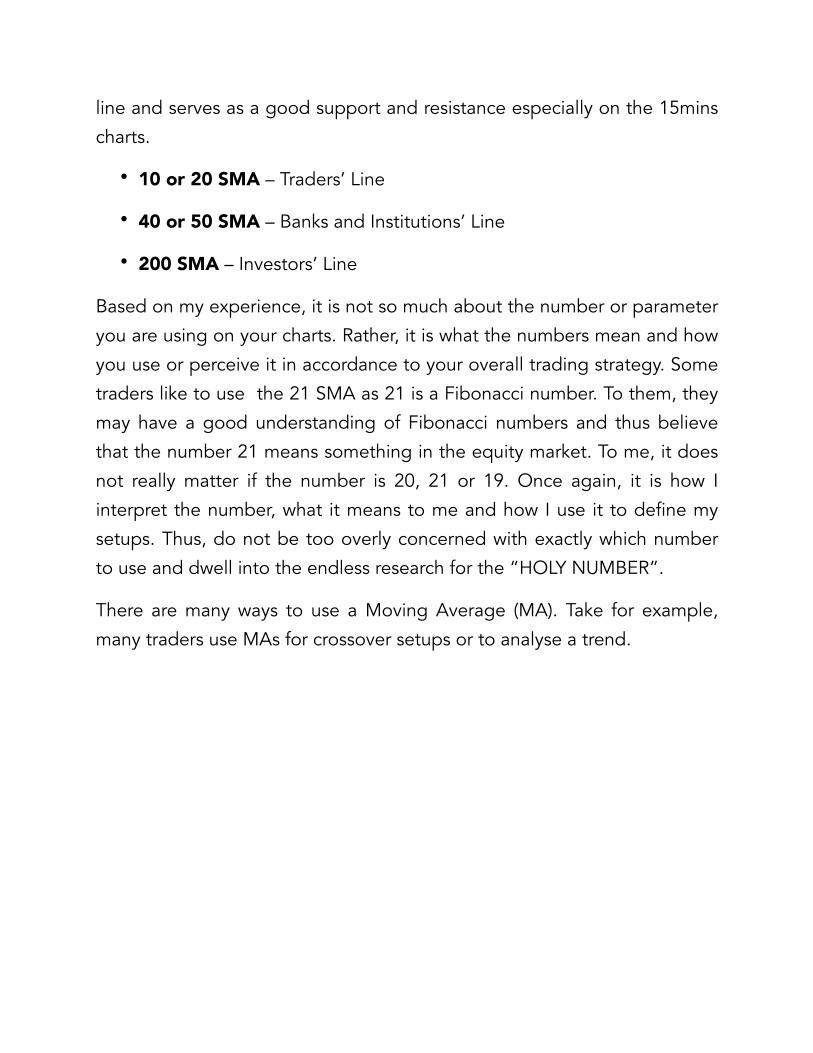
There are many ways to use a Moving Average (MA). Take for example,
many traders use MAs for crossover setups or to analyse a trend.
!
Crossover set-ups
However for me, I don’t really use it as a signal to buy or sell. Instead I will
read the gradient of the MA to analyse the strength of a trend. If the 200
SMA is sloping up, it is telling me that the long term investors are bullish
about that particular stock. With the 20 SMA sloping up, it is telling me
that the short-term traders are bullish about the stock. If the 20 SMA is
sloping up, 50 SMA is flat while the 200 SMA is sloping down, it is telling
me that the short-term traders are bullish; the banks are neutral while the
investors are bearish about the stock. The chart must be able to tell us a
story and the story told will help traders like us make a better decision.
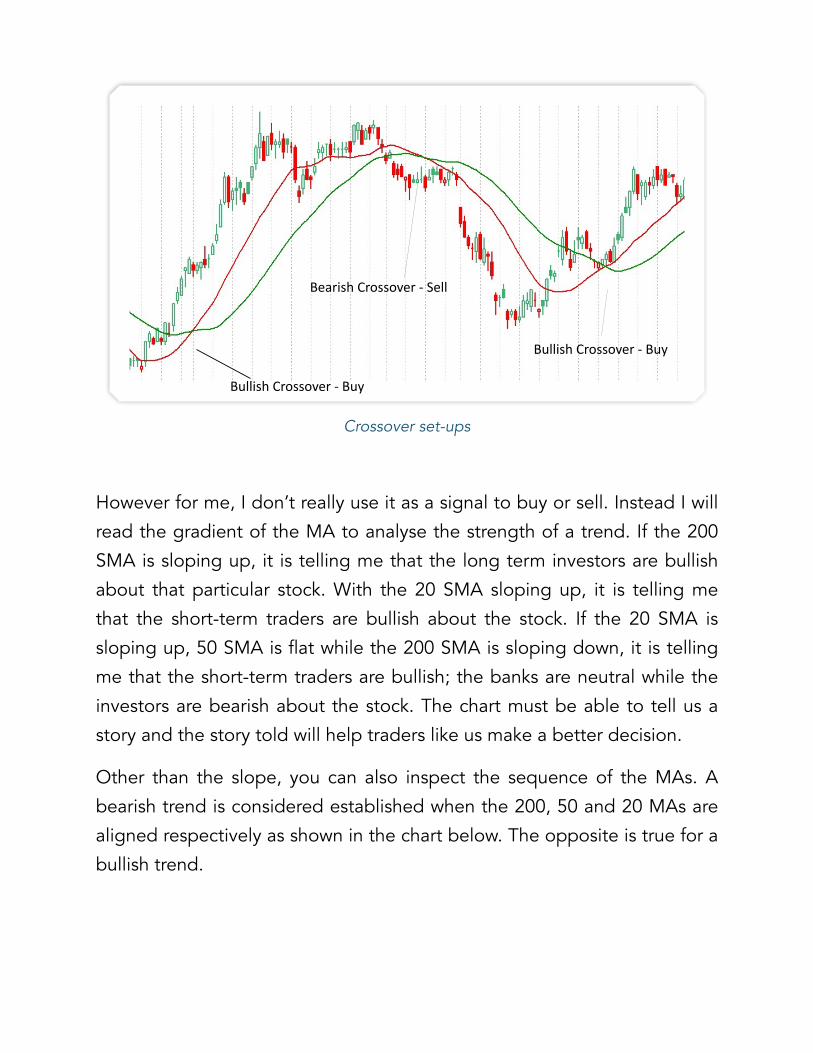
Other than the slope, you can also inspect the sequence of the MAs. A
bearish trend is considered established when the 200, 50 and 20 MAs are
aligned respectively as shown in the chart below. The opposite is true for a
bullish trend.
Bullish Crossover -‐ Buy
Bearish Crossover -‐ Sell
Bullish Crossover -‐ Buy
!
Alignment of Moving Averages to determine market trend
If the sequence of the MAs are 50, 20 and 200 respectively, a trend is yet
to be established and you may wish to stay on the sidelines while waiting
for an opportunity. Do not be too eager to enter a trade when the signal
to enter is not shown.
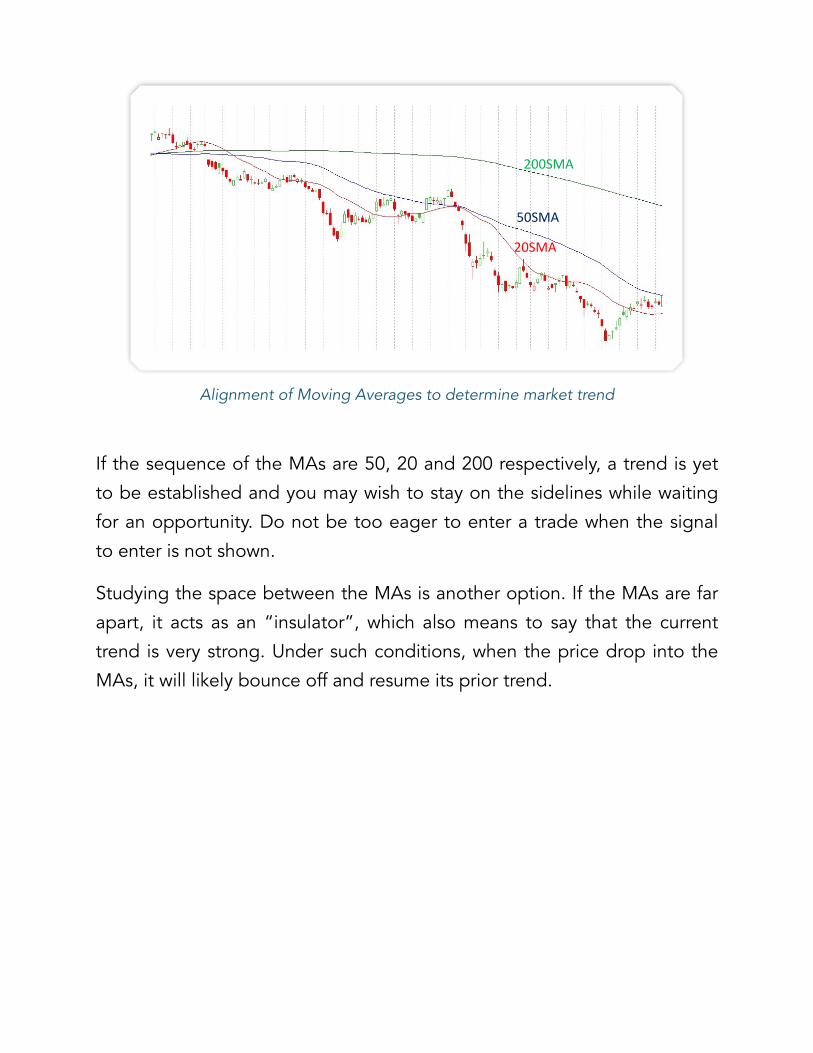
Studying the space between the MAs is another option. If the MAs are far
apart, it acts as an “insulator”, which also means to say that the current
trend is very strong. Under such conditions, when the price drop into the
MAs, it will likely bounce off and resume its prior trend.
200SMA
50SMA
20SMA
!
Determine strong market strength using Moving Averages
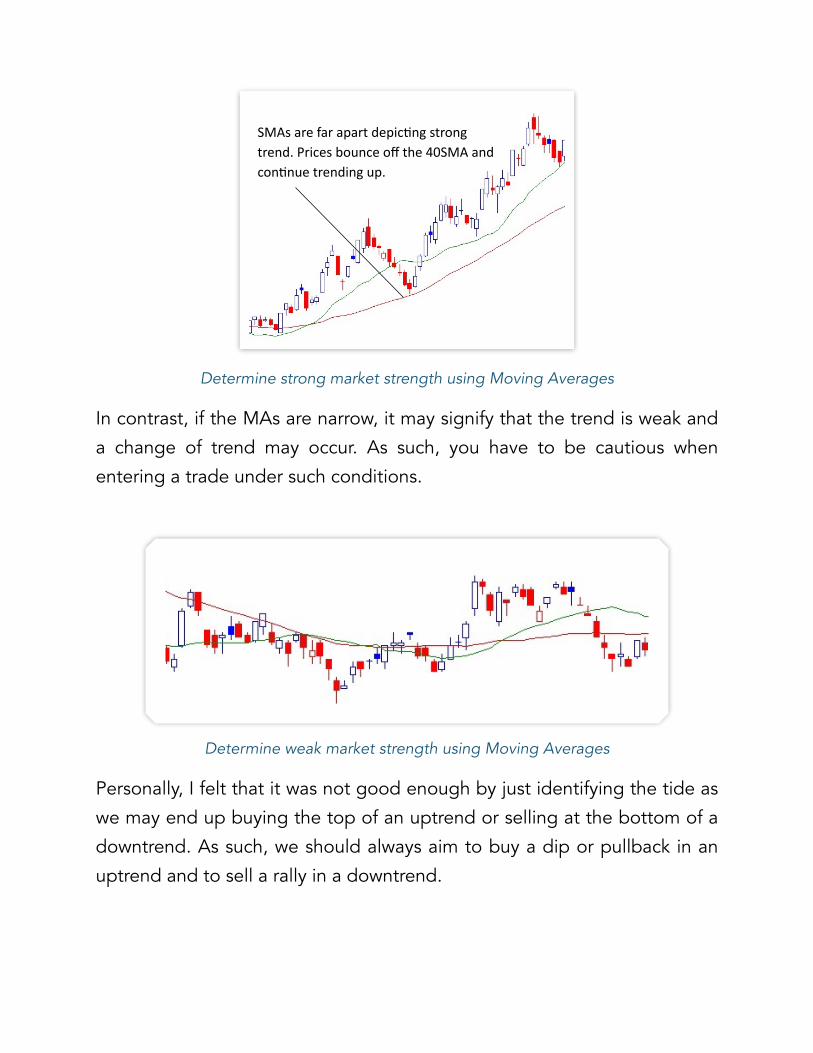
In contrast, if the MAs are narrow, it may signify that the trend is weak and
a change of trend may occur. As such, you have to be cautious when
entering a trade under such conditions.
!
Determine weak market strength using Moving Averages
Personally, I felt that it was not good enough by just identifying the tide as
we may end up buying the top of an uptrend or selling at the bottom of a
downtrend. As such, we should always aim to buy a dip or pullback in an
uptrend and to sell a rally in a downtrend.
SMAs are far apart depic@ng strong trend. Prices bounce off the 40SMA and con@nue trending up.
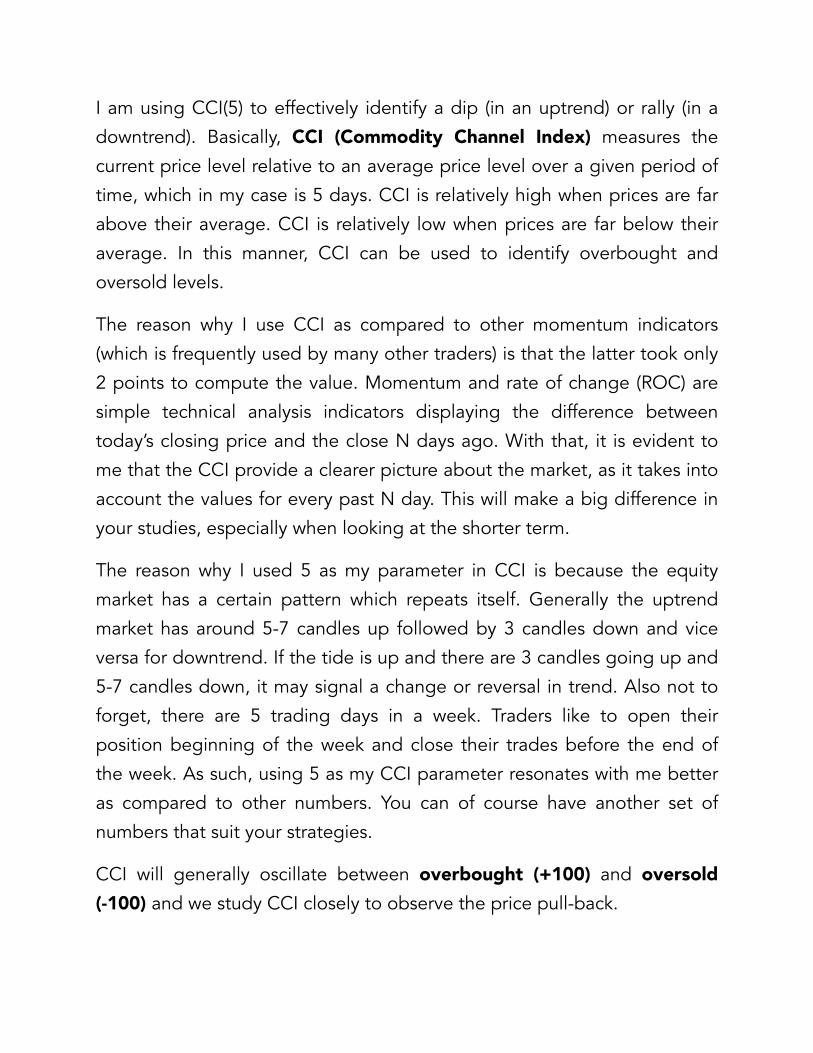
I am using CCI(5) to effectively identify a dip (in an uptrend) or rally (in a
downtrend). Basically, CCI (Commodity Channel Index) measures the
current price level relative to an average price level over a given period of
time, which in my case is 5 days. CCI is relatively high when prices are far
above their average. CCI is relatively low when prices are far below their
average. In this manner, CCI can be used to identify overbought and
oversold levels.
The reason why I use CCI as compared to other momentum indicators
(which is frequently used by many other traders) is that the latter took only
2 points to compute the value. Momentum and rate of change (ROC) are
simple technical analysis indicators displaying the difference between
today’s closing price and the close N days ago. With that, it is evident to
me that the CCI provide a clearer picture about the market, as it takes into
account the values for every past N day. This will make a big difference in
your studies, especially when looking at the shorter term.
The reason why I used 5 as my parameter in CCI is because the equity
market has a certain pattern which repeats itself. Generally the uptrend
market has around 5-7 candles up followed by 3 candles down and vice
versa for downtrend. If the tide is up and there are 3 candles going up and
5-7 candles down, it may signal a change or reversal in trend. Also not to
forget, there are 5 trading days in a week. Traders like to open their
position beginning of the week and close their trades before the end of
the week. As such, using 5 as my CCI parameter resonates with me better
as compared to other numbers. You can of course have another set of
numbers that suit your strategies.
CCI will generally oscillate between overbought (+100) and oversold (-100) and we study CCI closely to observe the price pull-back.
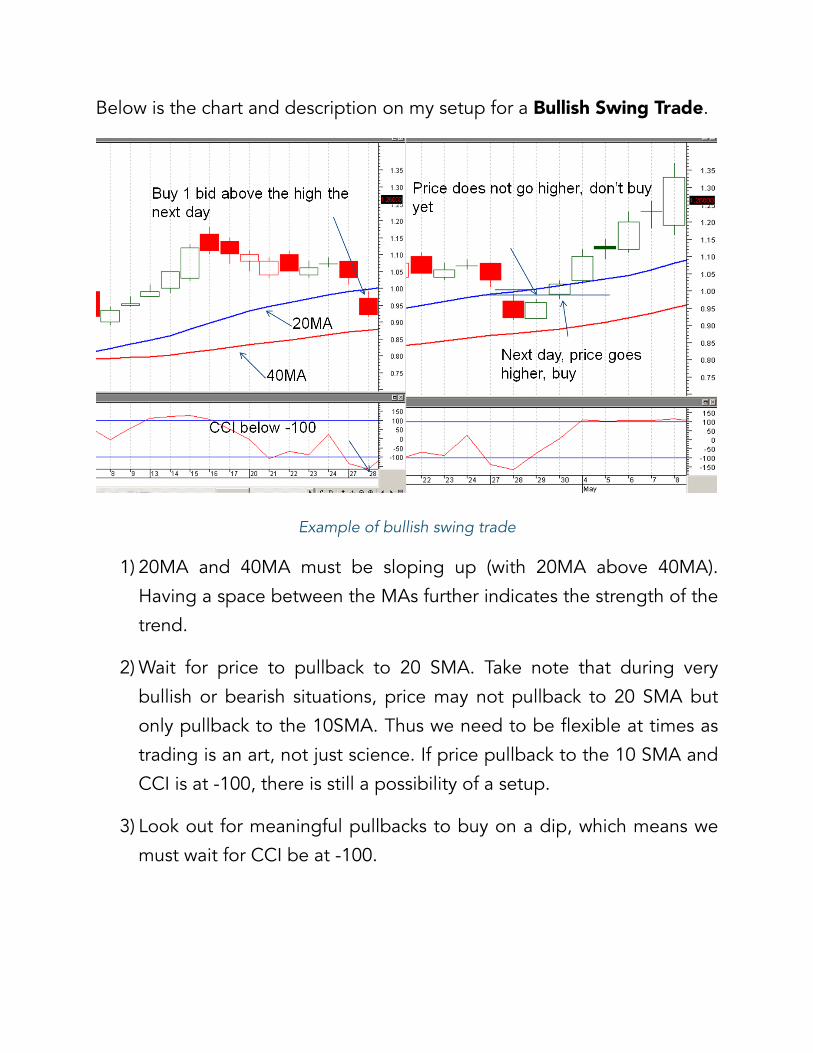
Below is the chart and description on my setup for a Bullish Swing Trade.
!
Example of bullish swing trade
1) 20MA and 40MA must be sloping up (with 20MA above 40MA).
Having a space between the MAs further indicates the strength of the
trend.
2) Wait for price to pullback to 20 SMA. Take note that during very
bullish or bearish situations, price may not pullback to 20 SMA but
only pullback to the 10SMA. Thus we need to be flexible at times as
trading is an art, not just science. If price pullback to the 10 SMA and
CCI is at -100, there is still a possibility of a setup.
3) Look out for meaningful pullbacks to buy on a dip, which means we
must wait for CCI be at -100.
4) Next look for the buy zone, which is the region between the 20 SMA
and 40 SMA. When price is inside this zone, get ready to enter a
trade. It is important that we do not anticipate.
5) Buy when price trades 1 bid above the previous day’s high. The high
of the previous candle is the most bullish point for the previous day. If
today’s high can conquer the previous day’s high, it means that today
is more bullish than the previous day. (At this time, your CCI may not
necessary be at -100, but it should have visited the -100 reading
before)
6) Stop loss at 1 bid below the previous day’s low or today’s low,
whichever is lower.
For any strategy, traders must always be looking out for a Payoff Ratio of
more than 1 before entering a trade. That means to say that the amount of
potential profit made will generally be more than what you would
potentially lose if the trade went sour. More on the Payoff Ratio will be
shared in a later chapter.
For this particular swing trading strategy, we always buy at the point where
prices have made a pullback after a bull run and we believe that the trend
will continue thereafter. Before taking the trade, we identify the previous
high as our profit target and the previous day’s or today’s low as our risk
(stop-loss). With that, we calculate the Payoff Ratio. The general rule of
thumb is to have the Payoff Ratio to be 2, or at least 1. Having a Payoff
Ratio of 2 simply means that if the trade is a winning one, we will make
$100 (for example) and if it happens to be a losing trade, we will lose $50.
In general, ensure that what you will gain is going to be more than what
you will lose if the trade happens to be a losing one. Coupling this
concept with a strategy that has a win rate of at least 0.5 (50%); and you
will be profitable in the long run as it is just pure mathematics.
Sometimes, prices can be so bullish that the CCI did not pullback to the
oversold region, but to the neutral region (at 0). You can still enter such
trades under such circumstances. It is optional and you can still make the
trade depending on your comfort level and/or experience. I know that we
are always looking for the ideal setup condition to be sure that the trade
will make money. But to be honest, you do not always see ideal or
textbook situations in the stock market. Even if the setup is ideal, it does
not mean the trade will definitely be a winning one. Whatever your
decision is, you must never fail to ask yourself what is the Payoff Ratio
before making a trade.
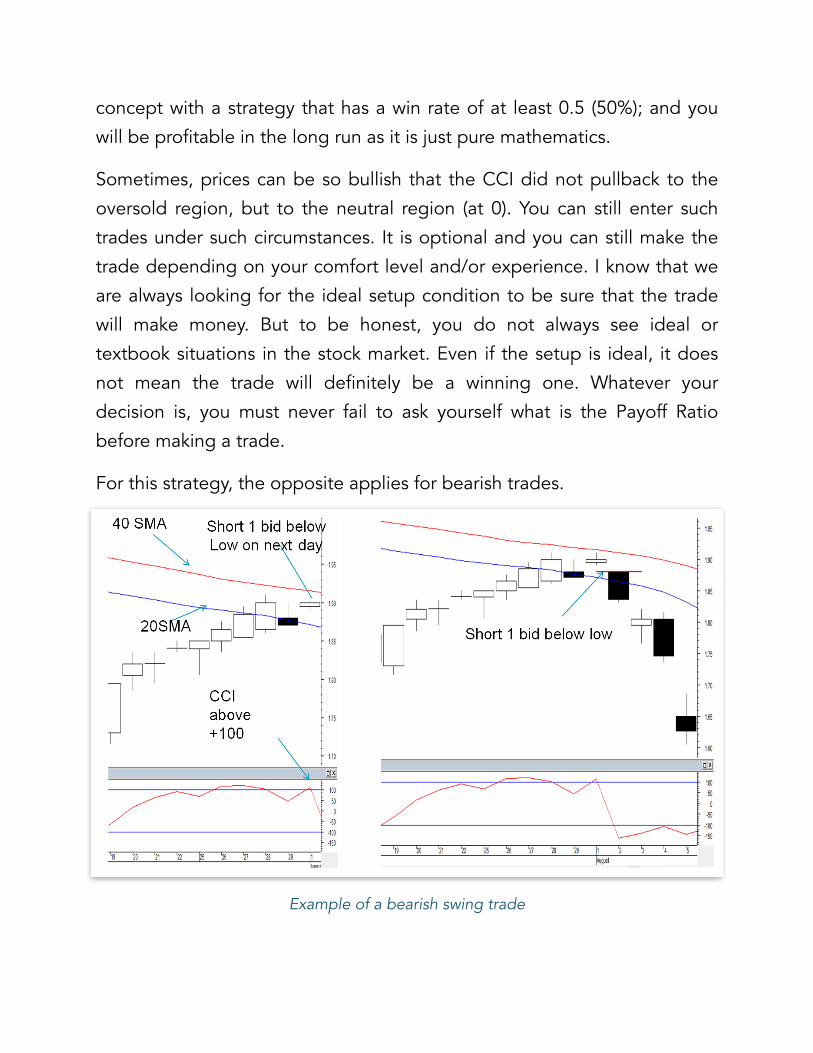
For this strategy, the opposite applies for bearish trades.
!
Example of a bearish swing trade
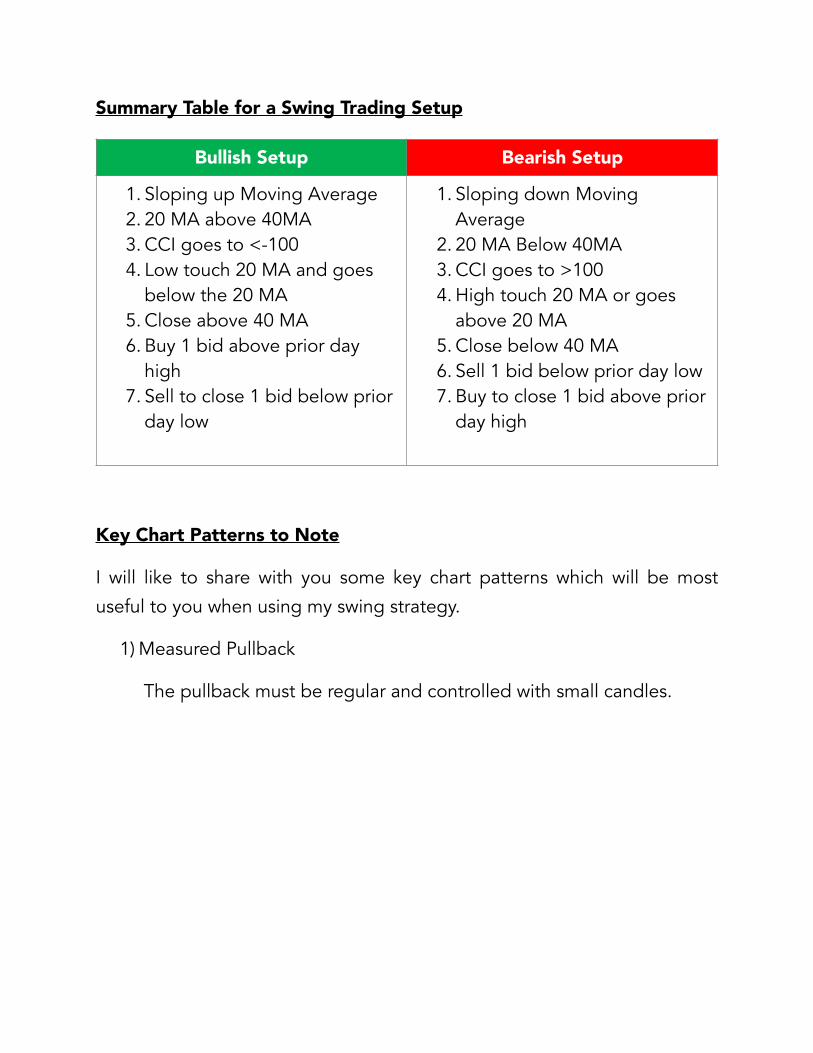
Summary Table for a Swing Trading Setup
Key Chart Patterns to Note
I will like to share with you some key chart patterns which will be most
useful to you when using my swing strategy.
1) Measured Pullback
The pullback must be regular and controlled with small candles.
Bullish Setup Bearish Setup
1. Sloping up Moving Average 2. 20 MA above 40MA 3. CCI goes to <-100 4. Low touch 20 MA and goes
below the 20 MA 5. Close above 40 MA 6. Buy 1 bid above prior day
high 7. Sell to close 1 bid below prior
day low
1. Sloping down Moving Average
2. 20 MA Below 40MA 3. CCI goes to >100 4. High touch 20 MA or goes
above 20 MA 5. Close below 40 MA 6. Sell 1 bid below prior day low 7. Buy to close 1 bid above prior
day high
!
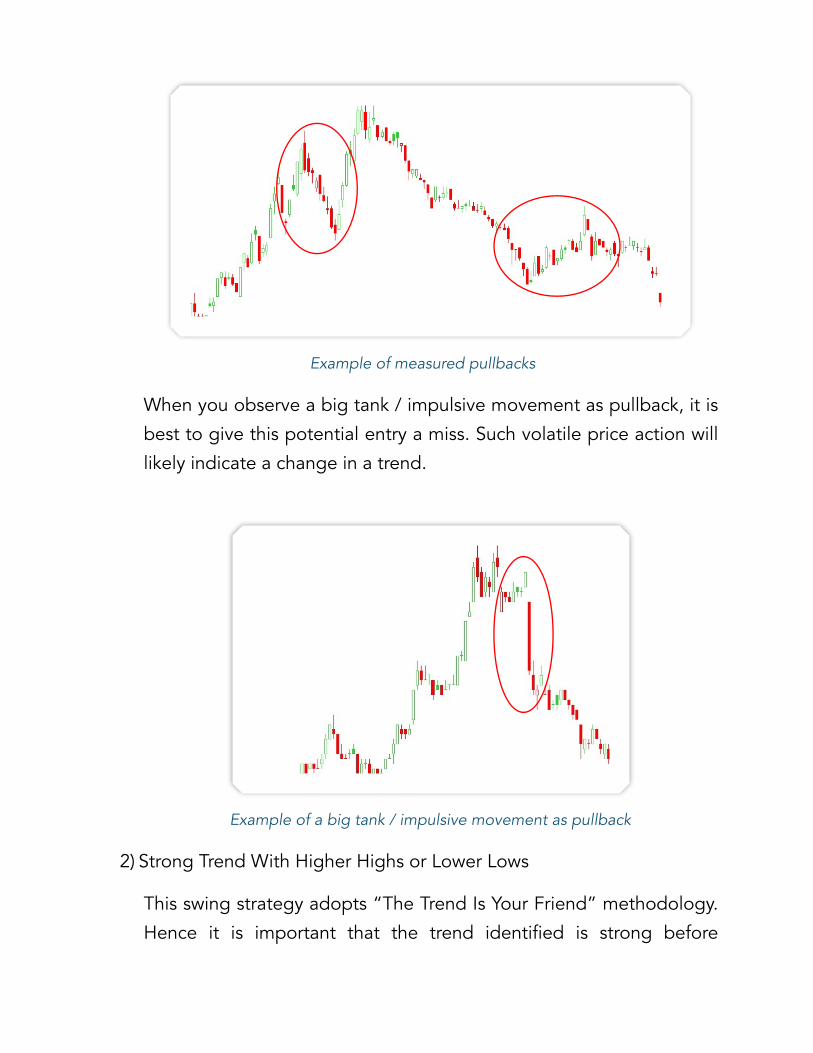
Example of measured pullbacks
When you observe a big tank / impulsive movement as pullback, it is
best to give this potential entry a miss. Such volatile price action will
likely indicate a change in a trend.
!
Example of a big tank / impulsive movement as pullback
2) Strong Trend With Higher Highs or Lower Lows
This swing strategy adopts “The Trend Is Your Friend” methodology.
Hence it is important that the trend identified is strong before
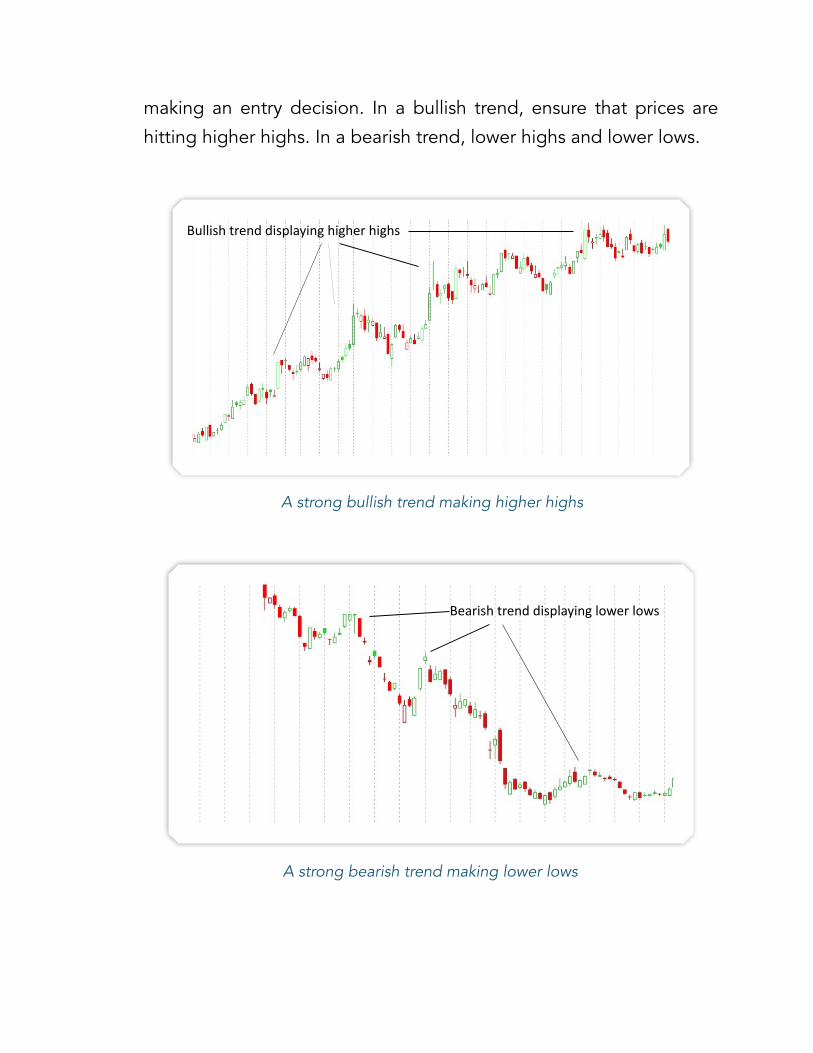
making an entry decision. In a bullish trend, ensure that prices are
hitting higher highs. In a bearish trend, lower highs and lower lows.
!
A strong bullish trend making higher highs
!
A strong bearish trend making lower lows
Bullish trend displaying higher highs
Bearish trend displaying lower lows
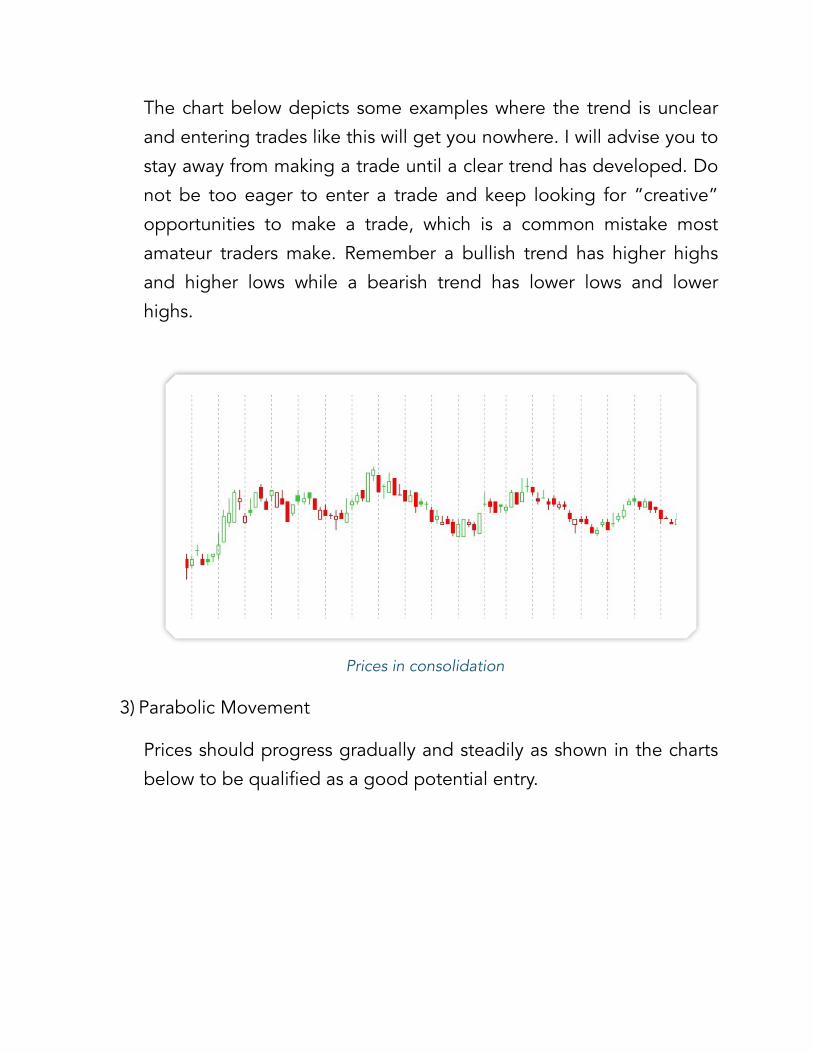
The chart below depicts some examples where the trend is unclear
and entering trades like this will get you nowhere. I will advise you to
stay away from making a trade until a clear trend has developed. Do
not be too eager to enter a trade and keep looking for “creative”
opportunities to make a trade, which is a common mistake most
amateur traders make. Remember a bullish trend has higher highs
and higher lows while a bearish trend has lower lows and lower
highs.
!
Prices in consolidation
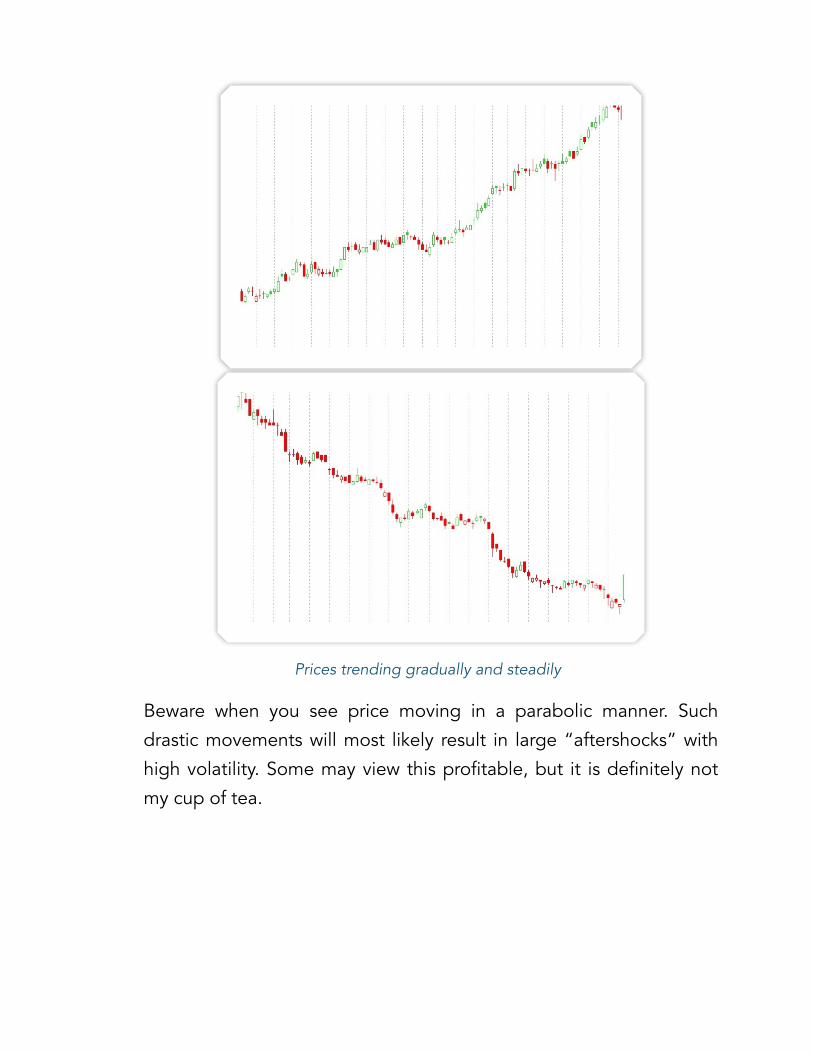
3) Parabolic Movement
Prices should progress gradually and steadily as shown in the charts
below to be qualified as a good potential entry.
!
!
Prices trending gradually and steadily
Beware when you see price moving in a parabolic manner. Such
drastic movements will most likely result in large “aftershocks” with
high volatility. Some may view this profitable, but it is definitely not
my cup of tea.
!
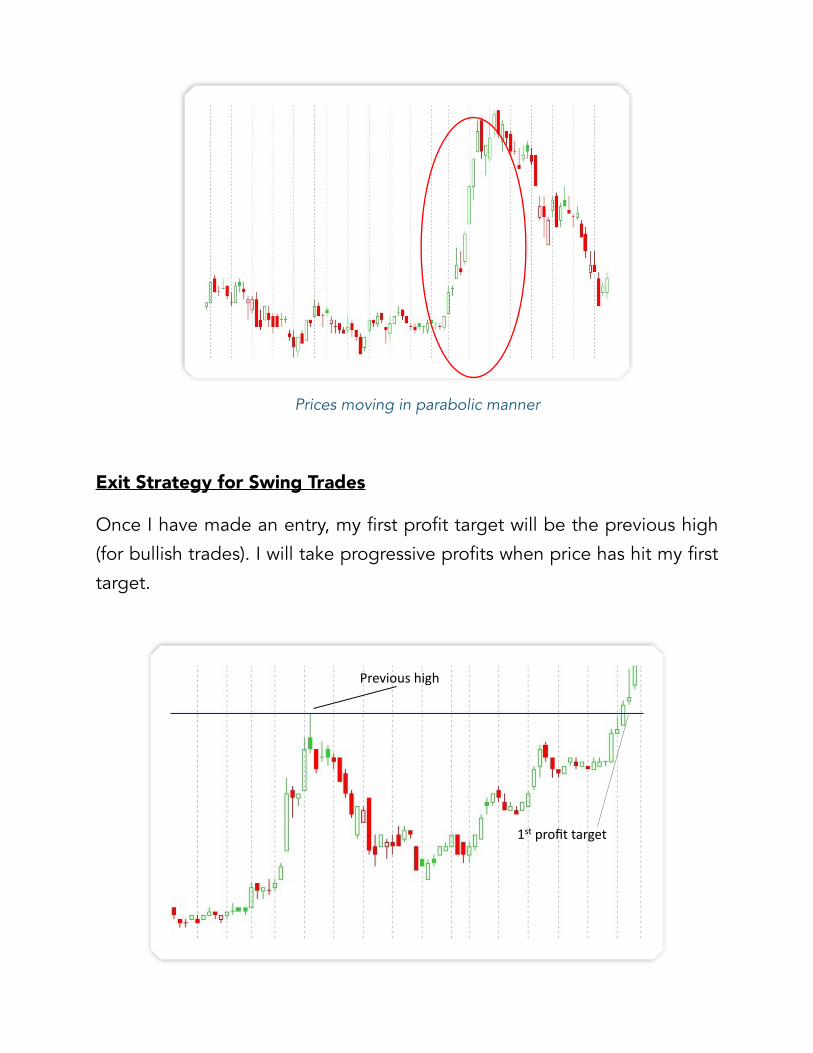
Prices moving in parabolic manner
Exit Strategy for Swing Trades
Once I have made an entry, my first profit target will be the previous high
(for bullish trades). I will take progressive profits when price has hit my first
target.
!
1st profit target
Previous high
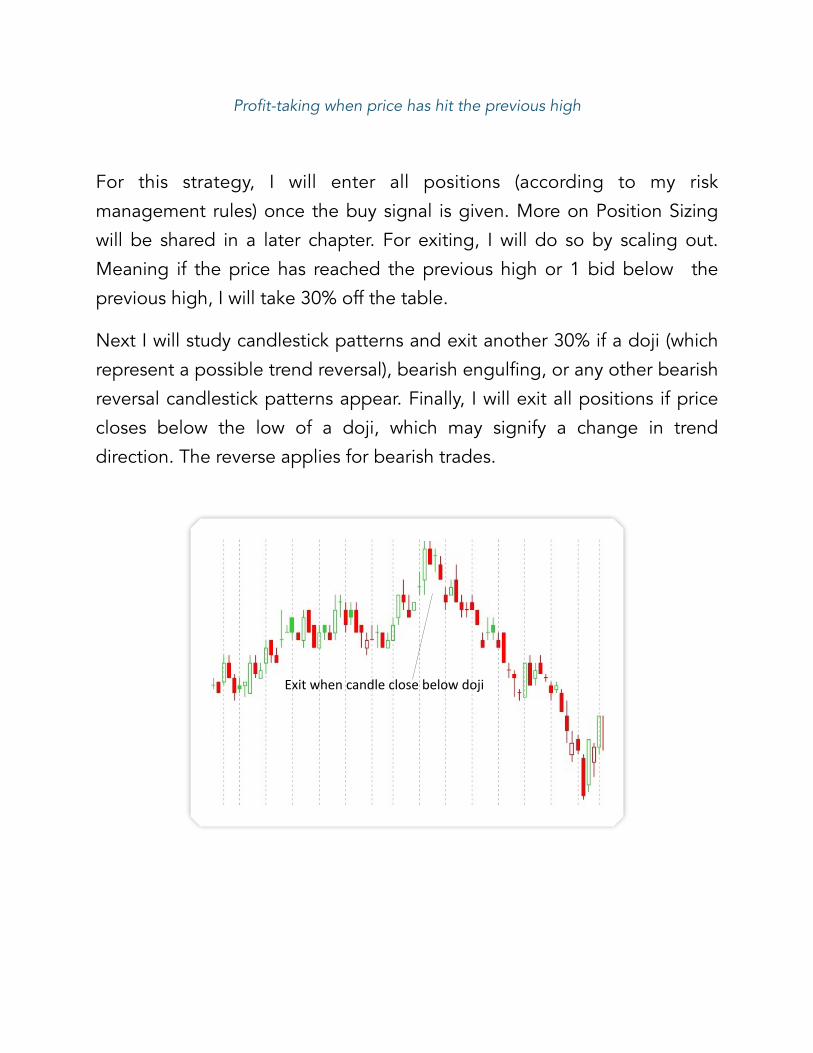
Profit-taking when price has hit the previous high
For this strategy, I will enter all positions (according to my risk
management rules) once the buy signal is given. More on Position Sizing
will be shared in a later chapter. For exiting, I will do so by scaling out.
Meaning if the price has reached the previous high or 1 bid below the
previous high, I will take 30% off the table.
Next I will study candlestick patterns and exit another 30% if a doji (which
represent a possible trend reversal), bearish engulfing, or any other bearish
reversal candlestick patterns appear. Finally, I will exit all positions if price
closes below the low of a doji, which may signify a change in trend
direction. The reverse applies for bearish trades.
!
Exit when candle close below doji
!
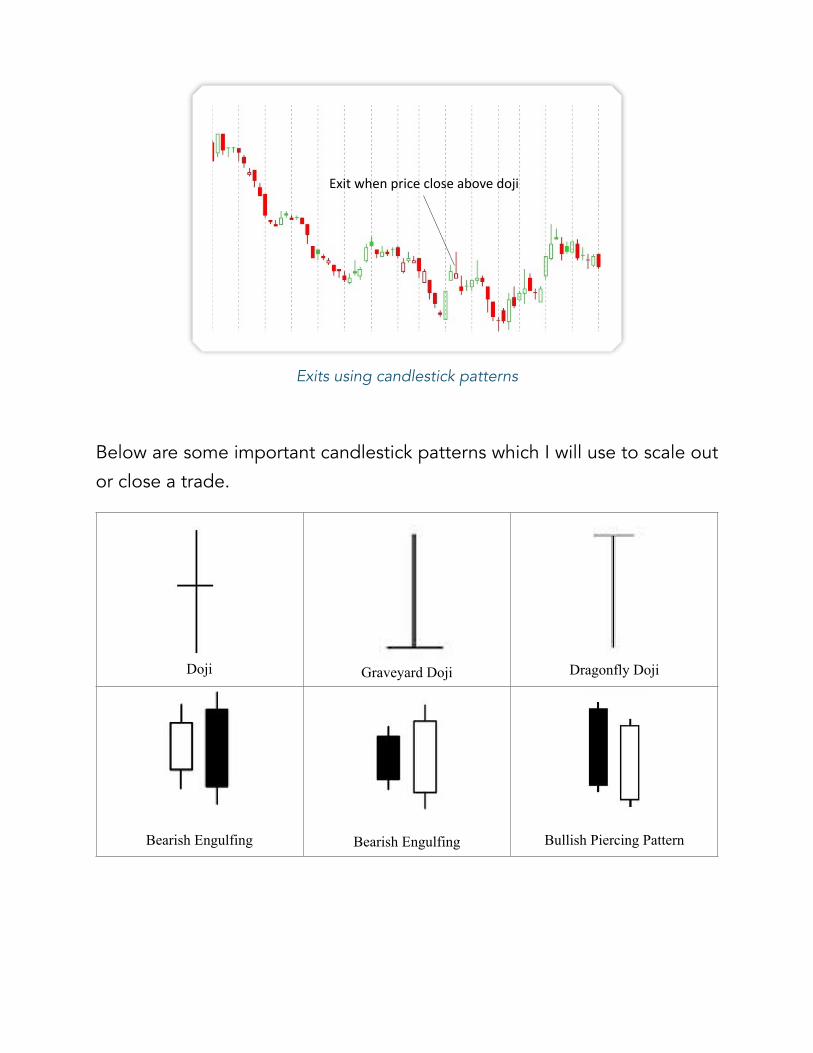
Exits using candlestick patterns
Below are some important candlestick patterns which I will use to scale out
or close a trade.
! Doji
�
Bearish Engulfing
� Dragonfly Doji
�
Bearish Engulfing
� Graveyard Doji
�
Bullish Piercing Pattern
Exit when price close above doji
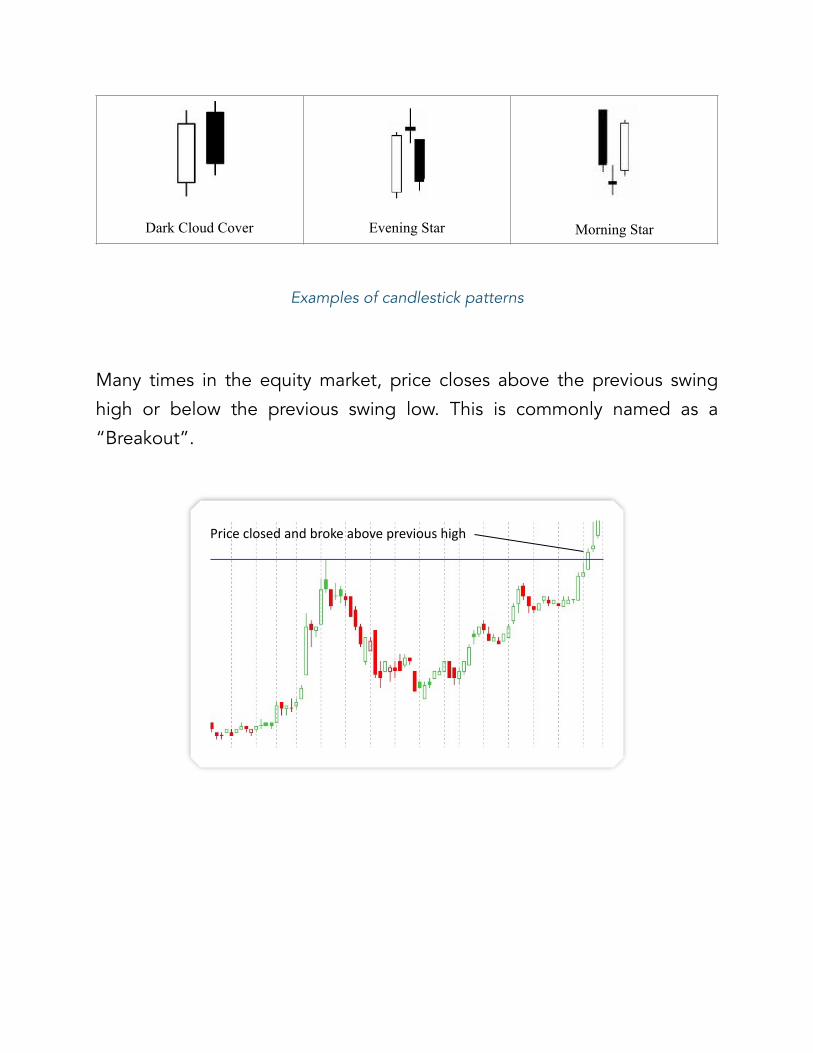
Examples of candlestick patterns
Many times in the equity market, price closes above the previous swing
high or below the previous swing low. This is commonly named as a
“Breakout”.
!
�
Evening Star
�
Morning Star
�
Dark Cloud Cover
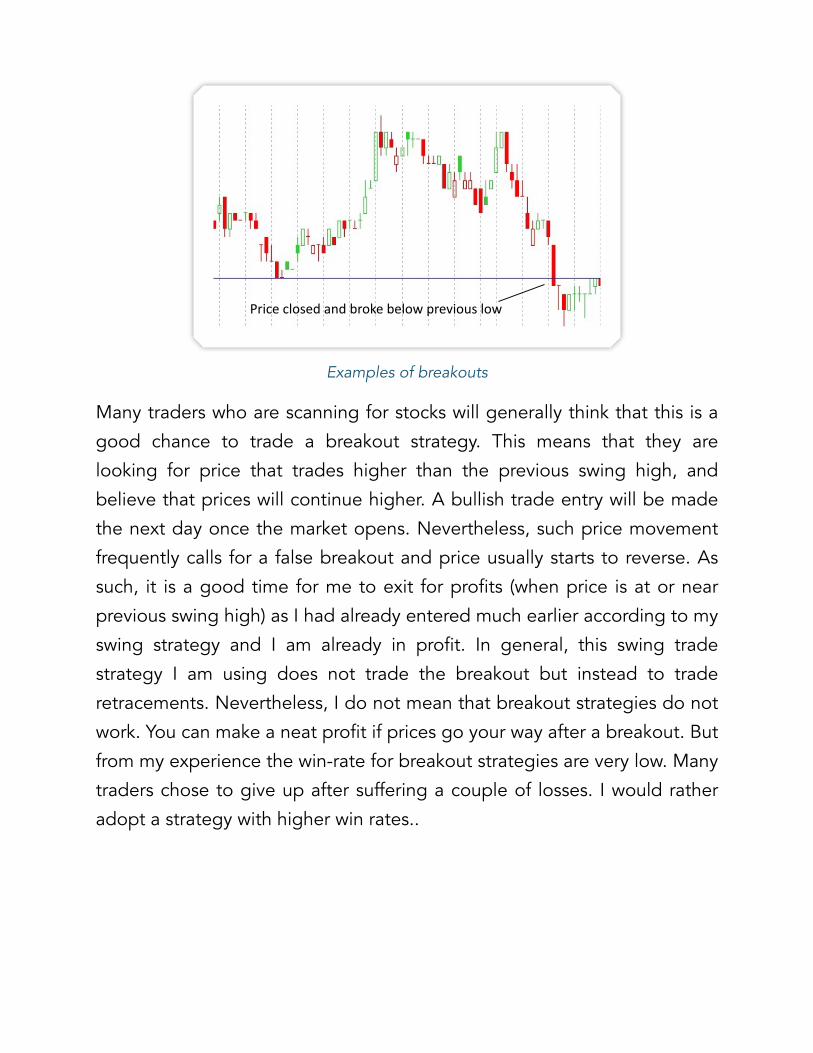
Price closed and broke above previous high
!
Examples of breakouts
Many traders who are scanning for stocks will generally think that this is a
good chance to trade a breakout strategy. This means that they are
looking for price that trades higher than the previous swing high, and
believe that prices will continue higher. A bullish trade entry will be made
the next day once the market opens. Nevertheless, such price movement
frequently calls for a false breakout and price usually starts to reverse. As
such, it is a good time for me to exit for profits (when price is at or near
previous swing high) as I had already entered much earlier according to my
swing strategy and I am already in profit. In general, this swing trade
strategy I am using does not trade the breakout but instead to trade
retracements. Nevertheless, I do not mean that breakout strategies do not
work. You can make a neat profit if prices go your way after a breakout. But
from my experience the win-rate for breakout strategies are very low. Many
traders chose to give up after suffering a couple of losses. I would rather
adopt a strategy with higher win rates..
Price closed and broke below previous low
!
!
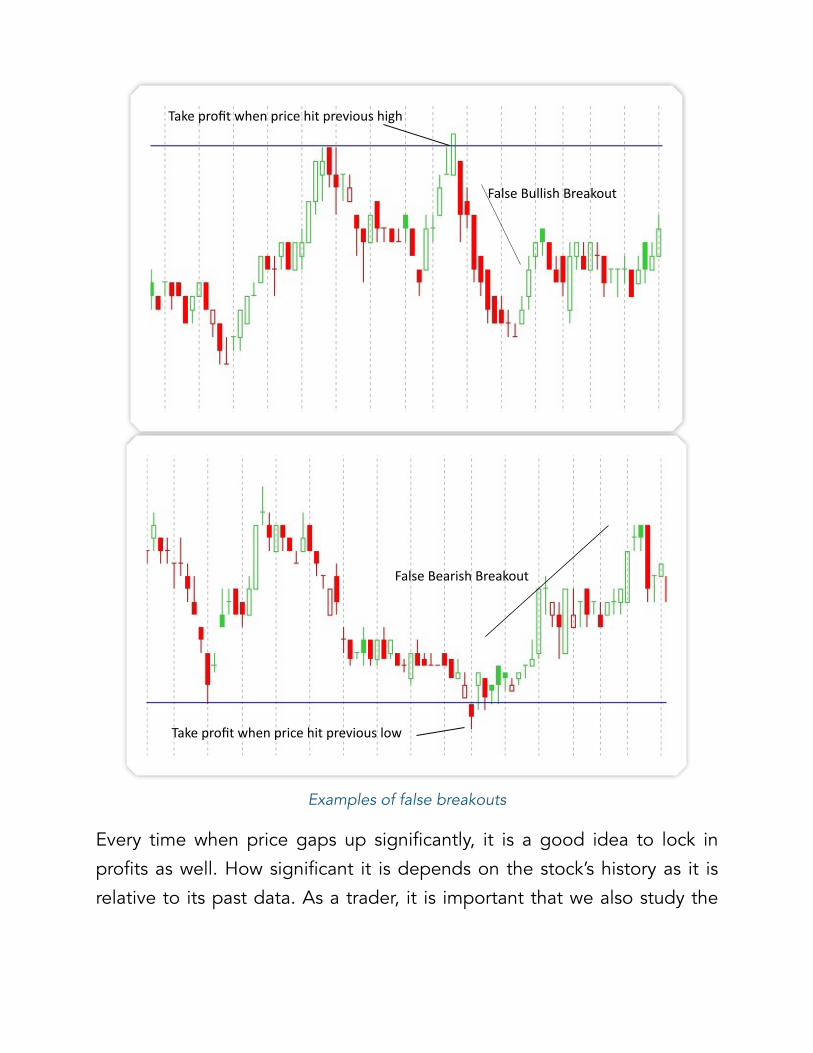
Examples of false breakouts
Every time when price gaps up significantly, it is a good idea to lock in
profits as well. How significant it is depends on the stock’s history as it is
relative to its past data. As a trader, it is important that we also study the
Take profit when price hit previous high
False Bullish Breakout
Take profit when price hit previous low
False Bearish Breakout
pattern and movement of the stock that we are trading. Understand it’s
behaviour so that we will not be taken by surprise.
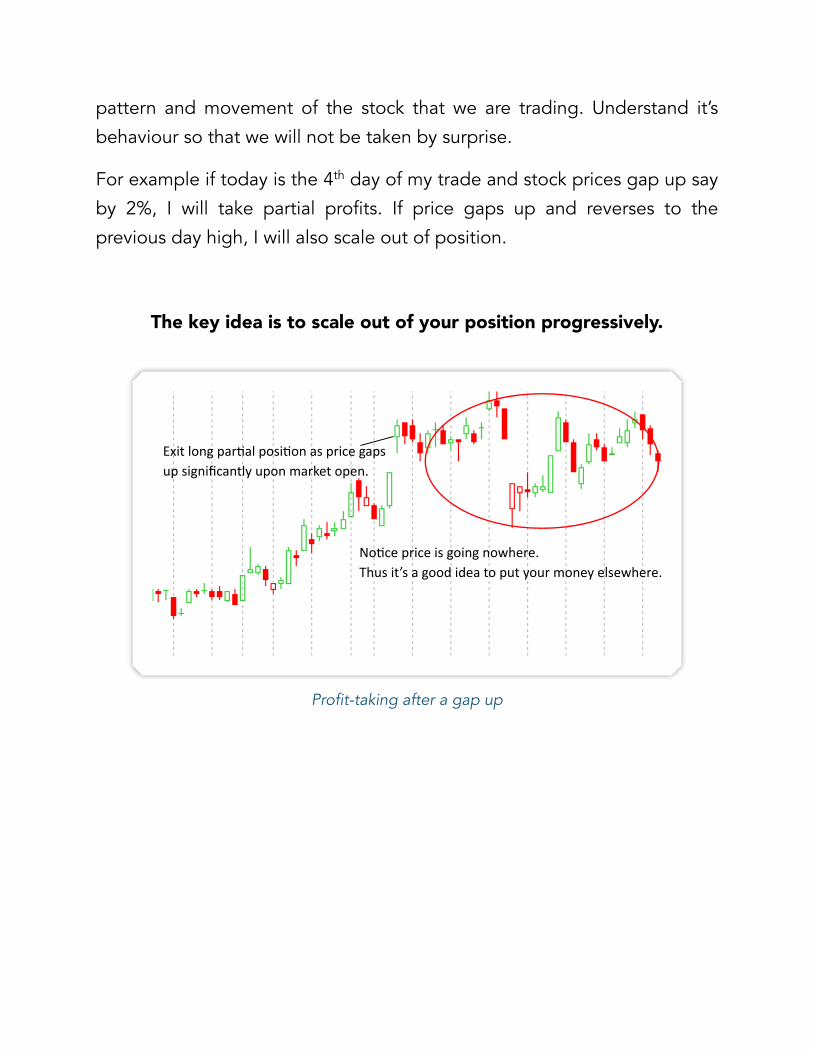
For example if today is the 4th day of my trade and stock prices gap up say
by 2%, I will take partial profits. If price gaps up and reverses to the
previous day high, I will also scale out of position.
The key idea is to scale out of your position progressively.
!
Profit-taking after a gap up
Exit long par@al posi@on as price gaps up significantly upon market open.
No@ce price is going nowhere. Thus it’s a good idea to put your money elsewhere.
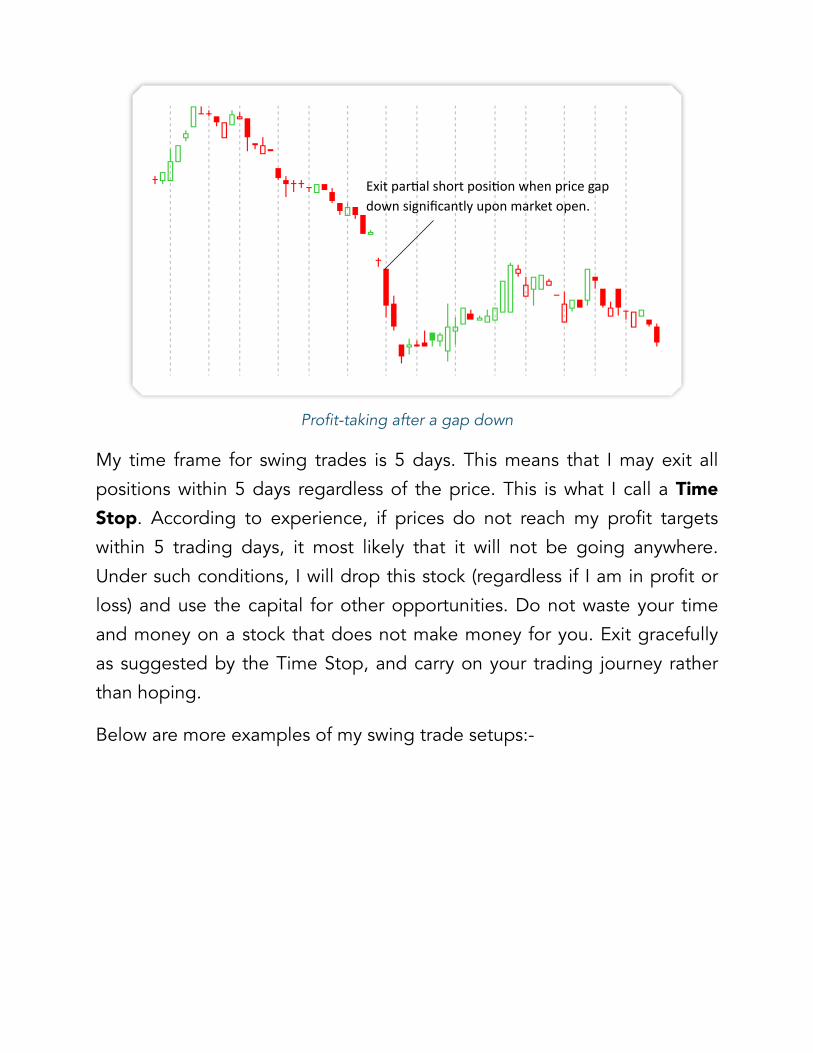
!
Profit-taking after a gap down
My time frame for swing trades is 5 days. This means that I may exit all
positions within 5 days regardless of the price. This is what I call a Time Stop. According to experience, if prices do not reach my profit targets
within 5 trading days, it most likely that it will not be going anywhere.
Under such conditions, I will drop this stock (regardless if I am in profit or
loss) and use the capital for other opportunities. Do not waste your time
and money on a stock that does not make money for you. Exit gracefully
as suggested by the Time Stop, and carry on your trading journey rather
than hoping.
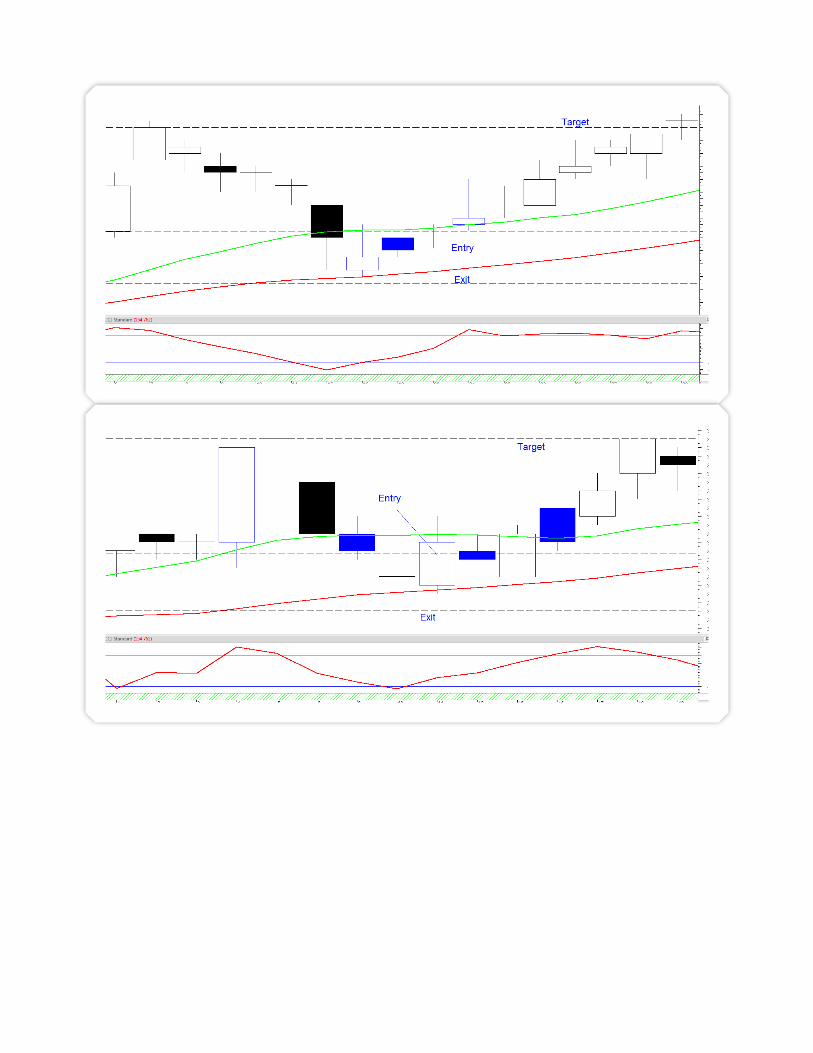
Below are more examples of my swing trade setups:-
Exit par@al short posi@on when price gap down significantly upon market open.
!
!
!
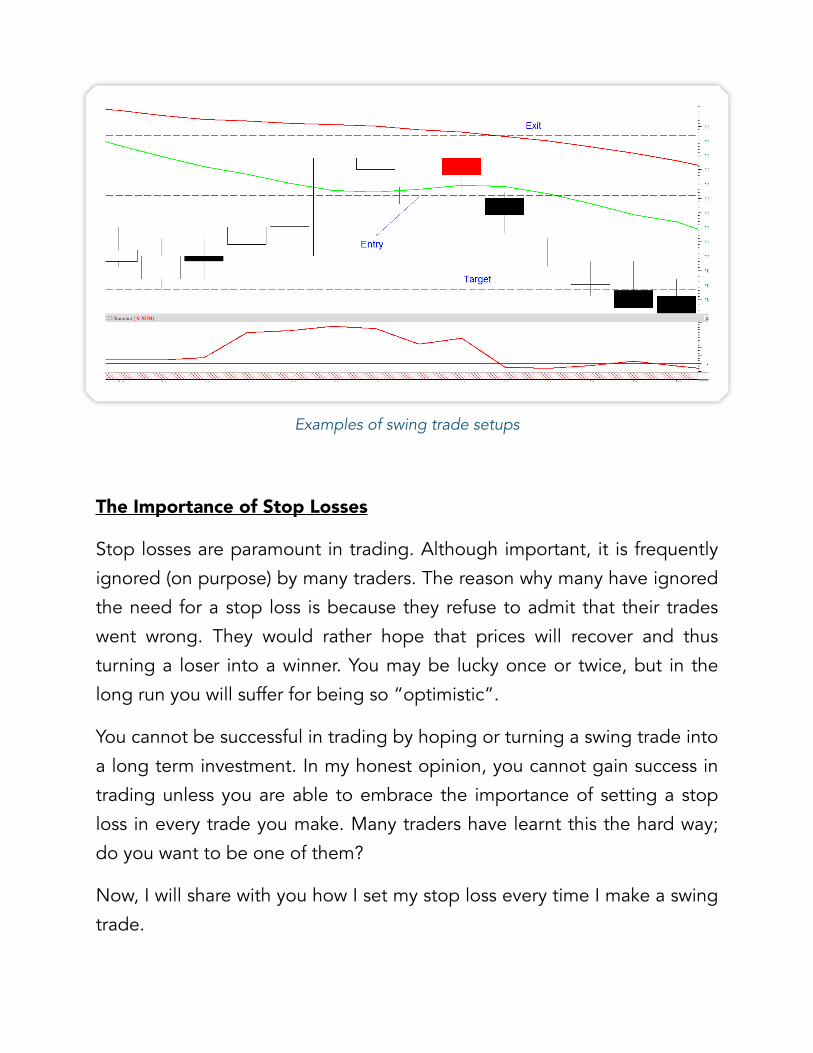
Examples of swing trade setups
The Importance of Stop Losses
Stop losses are paramount in trading. Although important, it is frequently
ignored (on purpose) by many traders. The reason why many have ignored
the need for a stop loss is because they refuse to admit that their trades
went wrong. They would rather hope that prices will recover and thus
turning a loser into a winner. You may be lucky once or twice, but in the
long run you will suffer for being so “optimistic”.
You cannot be successful in trading by hoping or turning a swing trade into
a long term investment. In my honest opinion, you cannot gain success in
trading unless you are able to embrace the importance of setting a stop
loss in every trade you make. Many traders have learnt this the hard way;
do you want to be one of them?
Now, I will share with you how I set my stop loss every time I make a swing
trade.
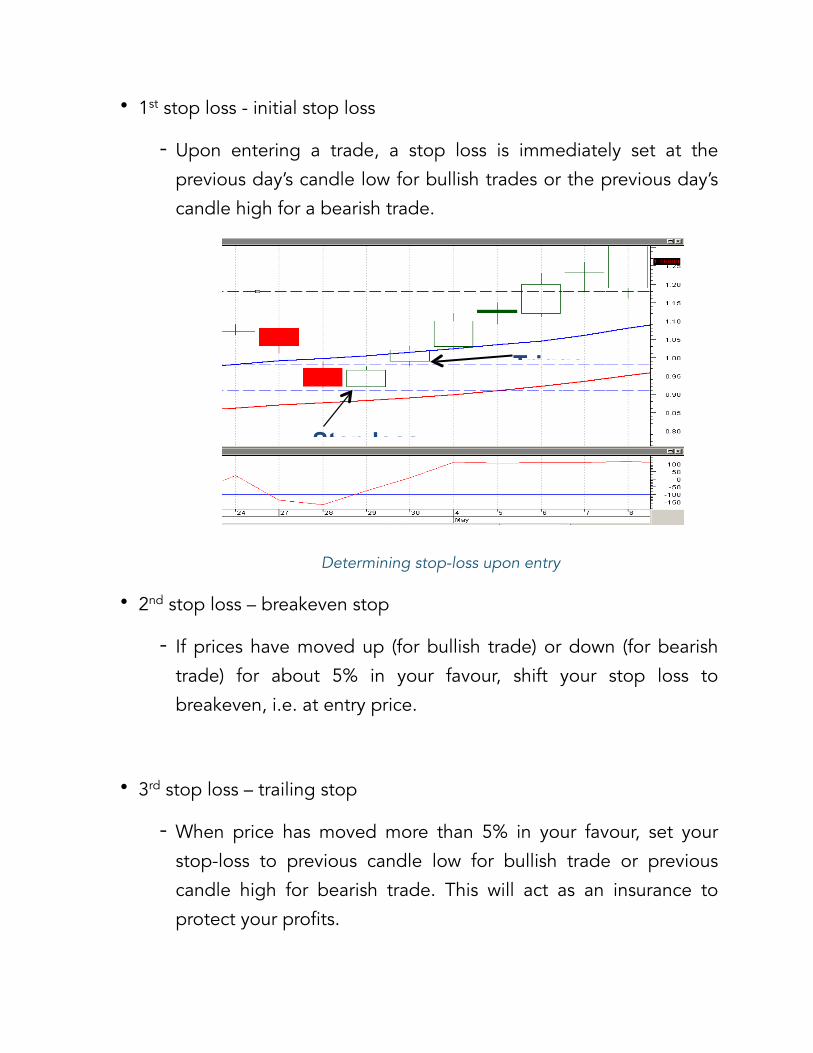
• 1st stop loss - initial stop loss
- Upon entering a trade, a stop loss is immediately set at the
previous day’s candle low for bullish trades or the previous day’s
candle high for a bearish trade.
!
Determining stop-loss upon entry
• 2nd stop loss – breakeven stop
- If prices have moved up (for bullish trade) or down (for bearish
trade) for about 5% in your favour, shift your stop loss to
breakeven, i.e. at entry price.
• 3rd stop loss – trailing stop
- When price has moved more than 5% in your favour, set your
stop-loss to previous candle low for bullish trade or previous
candle high for bearish trade. This will act as an insurance to
protect your profits.
63
Stop loss
Trigge
• 4th stop loss – time stop
- Close all positions after 5 trading days (excluding entry day),
even if prices have yet to hit our target or stop loss.
Can you see how structured my stop losses are and how it has fused into
my swing trading strategy seamlessly? For whatever strategies you are
using, always have a stop loss plan in place, BEFORE making a trade!
More often than not, traders choose to cut loss only when the loss amount
is too much for them to bear. Do get your trading psychology right before
making any trades.
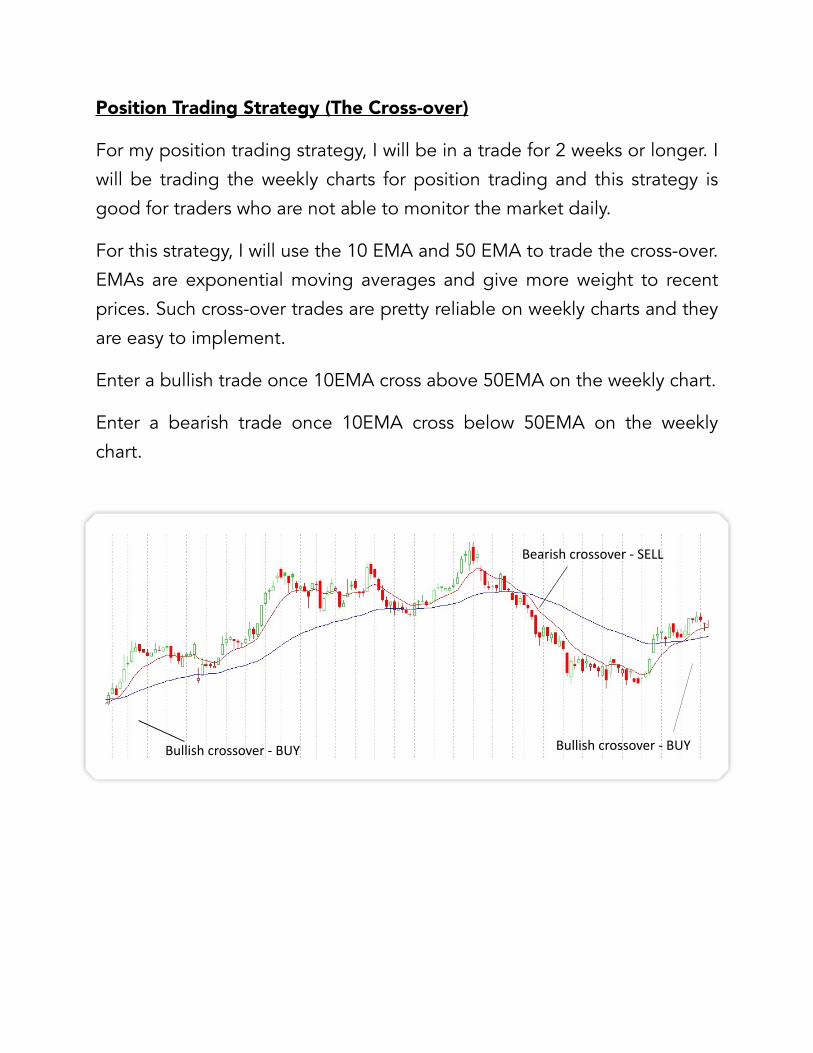
Position Trading Strategy (The Cross-over)
For my position trading strategy, I will be in a trade for 2 weeks or longer. I
will be trading the weekly charts for position trading and this strategy is
good for traders who are not able to monitor the market daily.
For this strategy, I will use the 10 EMA and 50 EMA to trade the cross-over.
EMAs are exponential moving averages and give more weight to recent
prices. Such cross-over trades are pretty reliable on weekly charts and they
are easy to implement.
Enter a bullish trade once 10EMA cross above 50EMA on the weekly chart.
Enter a bearish trade once 10EMA cross below 50EMA on the weekly
chart.
! Bullish crossover -‐ BUY
Bearish crossover -‐ SELL
Bullish crossover -‐ BUY
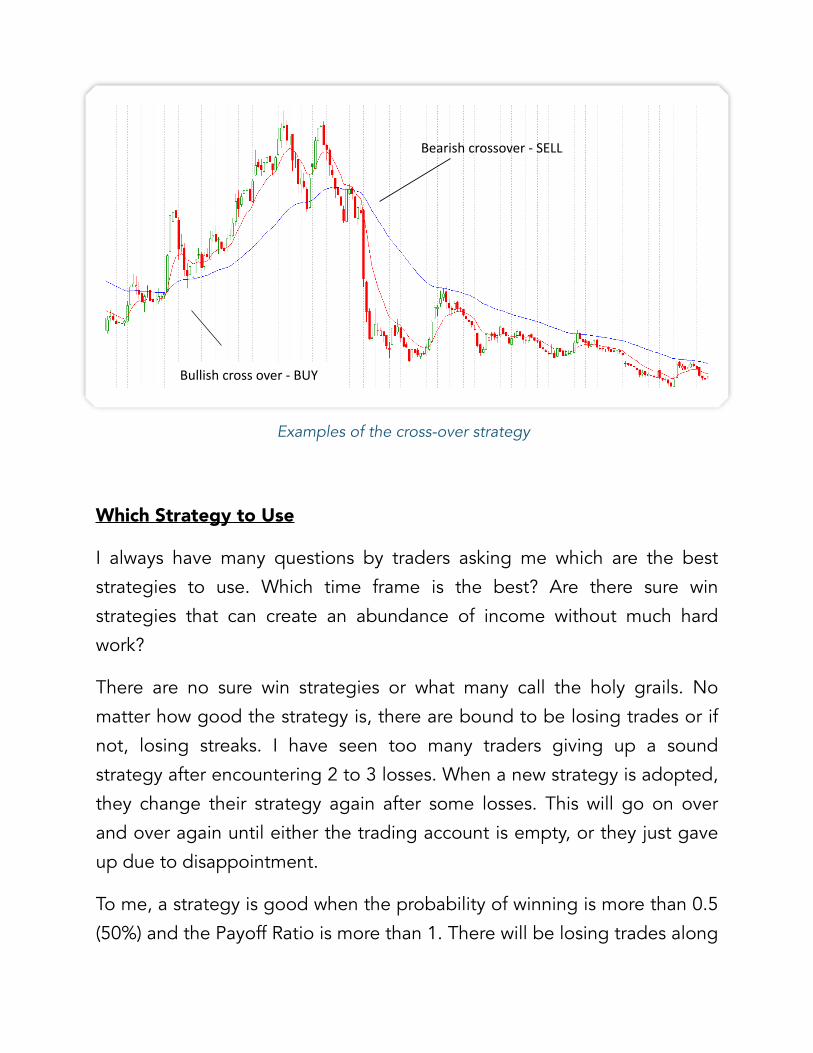
!
Examples of the cross-over strategy
Which Strategy to Use
I always have many questions by traders asking me which are the best
strategies to use. Which time frame is the best? Are there sure win
strategies that can create an abundance of income without much hard
work?
There are no sure win strategies or what many call the holy grails. No
matter how good the strategy is, there are bound to be losing trades or if
not, losing streaks. I have seen too many traders giving up a sound
strategy after encountering 2 to 3 losses. When a new strategy is adopted,
they change their strategy again after some losses. This will go on over
and over again until either the trading account is empty, or they just gave
up due to disappointment.
To me, a strategy is good when the probability of winning is more than 0.5
(50%) and the Payoff Ratio is more than 1. There will be losing trades along
Bullish cross over -‐ BUY
Bearish crossover -‐ SELL
the way, but it is a no brainer that your trading account will grow
consistently in the long run. The next question that arises is how a trader
will know if the strategy used has a good probability of winning and Payoff
Ratio. This is where extensive back-testing is required and traders need to
be diligent in doing this. If you want to be successful in trading, you have
to put in the effort and hard work. There is no such thing as easy money
and be aware of empty promises!
Key Learning Points
• Trading is an art, not a science. Do not be too caught up in looking
for the ideal setup
• The trend is your friend
• Follow your trading plans and not anticipating trades
• When it comes to trading, know you time frame
• There are 4 different types of stop losses; namely: initial, breakeven,
trailing and time stop
• Always know your stop losses BEFORE taking trades
• Move your stops to breakeven when you start to make money
• Do not give up too soon as success is just around the corner
Exercises
1) What is your ideal Payoff Ratio requirement to enter a trade?
2) What should your minimum “Probability of Win Rate” be for the
strategy you are adopting?
3) What is/are your Stop-Loss plan(s)?