Embed Size (px)
Citation preview
Nikita Bos and Tamás Vonyó Winning the war, losing the peace?: a comparative study of labour productivity in British and West German manufacturing, 1936-1968 Conference Item [eg. keynote lecture, etc.]
Original citation: Originally presented at Modern and comparative economic history seminar, 14 February 2013, London School of Economics and Political Science. This version available at: http://eprints.lse.ac.uk/48591/ Available in LSE Research Online: February 2013 © 2013 The Authors LSE has developed LSE Research Online so that users may access research output of the School. Copyright © and Moral Rights for the papers on this site are retained by the individual authors and/or other copyright owners. Users may download and/or print one copy of any article(s) in LSE Research Online to facilitate their private study or for non-commercial research. You may not engage in further distribution of the material or use it for any profit-making activities or any commercial gain. You may freely distribute the URL (http://eprints.lse.ac.uk) of the LSE Research Online website.

1
Winning the war, losing the peace? A comparative study of labour productivity in British and West German industry, 1936-1968
By NIKITA BOS and TAMÁS VONYÓ*
There has been disagreement on the popular notion of Britain’s relative economic decline vis-à-vis West Germany after 1950. While German scholars emphasised the role of the post-war output gap in German super-growth, the recent British literature crystallized around the manufacturing failure hypothesis of Broadberry and Crafts. This paper offers a comprehensive reassessment of the relative productivity performance of British and West German industry both before the outbreak of World War II and in the early post-war period. The war had an enormous impact on the Anglo-German productivity race. Relative to the UK, industrial value added per hour worked in West Germany had declined by a quarter between 1936 and 1951. In the 1950s, German super-growth can be explained entirely by this war-induced productivity gap. Britain’s relative decline in this period cannot be attributed to British manufacturing failure. If at any time during the post-war Golden Age, such failure can be observed in the 1960s.
The notion of relative economic decline has long pervaded British historiography, to the extent that
Tomlinson called this strand of the literature ‘declinism’.1 The growth record of the United Kingdom
during the post-war Golden Age has been studied most frequently in a West German comparison. GDP
per capita increased by 2.4 per cent annually in Britain and by 5 per cent in the Federal Republic.2 Labour
productivity grew at average rates of 3 per cent and 5.2 per cent respectively.3 The inability of British
industry to achieve anything close to German super-growth in the 1950s and its worsening market
position in the face of resurgent German exports was often linked to Olsonian arguments about the
punishment of wartime victors with the legacy of bad institutions inherited from the interwar period.4
More recently, the mainstream interpretation of Britain’s relative economic decline has crystallized
around the Broadberry-Crafts view and, at its core, the manufacturing failure hypothesis: British industry
failed in large scale operations, Fordist technology, and Chandlerian forms of corporate organization.5
Clearly, the United Kingdom was bound to achieve more modest growth rates in industrial
productivity, as she was closer to the productivity frontier after the war. However, annual growth rates
were still substantially lower than what should have been feasible based on the convergence hypothesis.6
We argue that another factor was also in action making British productivity growth look inevitably
inferior in a West German comparison. German scholars put great emphasis on the war-induced gap
between actual and potential output and argued that it was the chief catalyst of the Wirtschaftswunder.7
* Author affiliations: Nikita Bos, Univeristy of Groningen; Tamás Vonyó, London School of Economics. 1 Tomlinson, ‘Inventing decline’, p. 731. 2 Data from Conference Board: http://www.conference-board.org/data/economydatabase 3 O’Mahony, Britain’s productivity’, p. 5. 4 Olson, Rise and decline; Elbaum and Lazonick, ‘Decline’; Kirby, ‘Institutional Rigidities’ 5 Broadberry, Productivity race; idem, ‘Manufacturing’; Broadberry and Crafts, ‘UK productivity’; Idem, ‘British economic
policy’; Broadberry and O’Mahony, ‘Britain’s productivity gap’; Crafts, ‘Deindustrialisation’ 6 Crafts, ‘Never had it so good’; Bean and Crafts, ‘British economic growth’ 7 The reconstruction thesis is attributed to Jánossy, ‘Economic miracle’. On its implication for West German economic growth in
the 1950s, see Abelshauser, Deutsche Wirtschaftsgeschichte, and Eichengreen and Ritschl, ‘Understanding’, among others.
2
The so called reconstruction thesis was confirmed econometrically in cross-country investigations.8 In our
reassessment, we aim to quantify both factors, catch-up and reconstruction growth, and discuss their
contribution to the relative decline of British industry during the Golden Age.
This approach requires additional data that go beyond the currently available time-series evidence
on productivity growth. We need to know both how far West Germany lagged behind Britain in industrial
labour productivity at the start of the Golden Age and how large an impact World War II made on the
productivity race between the two economies. In a comparative framework, the reconstruction thesis
dictates that under normal peacetime conditions, West German industry was bound to restore the
productivity level it had attained relative to its British counterpart. As long as this wasn’t achieved,
German super-growth cannot be attributed to manufacturing failure in the United Kingdom. To quantify
this process we construct two methodologically consistent labour-productivity benchmarks for the
industrial sector in West Germany and Britain for the mid-1930s and the early 1950s.
Our 1951 benchmark is the first direct comparison of industrial labour productivity between the
two economies at the start of the Golden Age. All existing estimates have been derived by extrapolation
from distant benchmarks using time-series data, which do not take account of inter-temporal changes in
relative prices and product weights. As for the mid 1930s, the currently available benchmarks all report
relative levels of labour productivity for Britain and Germany within their interwar borders, and thus are
not directly comparable with post-war productivity data. We report a substantially revised benchmark for
1935/6, drawing on the work of Fremdling and associates but assuring territorial and methodological
consistency with our 1951 benchmark.9 We use a consistent industry classification.
Perhaps the weakest point of most scholarly contributions to the manufacturing failure hypothesis
has been the absence of a clear definition of failure, or at least its meaning in a theoretical framework. We
argue that the concept of growth failure is difficult to interpret at the macro level; it needs to be specific to
particular industries where particular technologies or modes of labour organisation need to be adopted to
improve productivity. This implies that we can only provide for an adequate account of relative British
manufacturing performance at the industry level. To serve this purpose, our benchmarks are significantly
more disaggregated than all previous estimates. A richer dataset also allows us to better test for the
existing explanations of German super-growth after 1950.
The rest of the paper is structured as follows. Section I briefly explains the methodology used to
construct industry-of-origin benchmarks. Section II presents our new labour-productivity benchmark for
1951. Section III reports the revised estimates for 1935/6 and discusses the implications of our data for
cross-war comparisons. In Section IV, we use decomposition analysis to determine the industry-origins of
the reversal of fortunes in the Anglo-German productivity race across World War II. Section V combines
our benchmarks with time-series data to account for the role of the war-induced productivity gap in
German super-growth. We show that Britain’s relative decline in the 1950s cannot be attributed to British
manufacturing failure. If at any time during the post-war Golden Age, such failure can be observed in the
1960s, particularly in large scale industry. Section VI discusses the potential explanations for the latter,
focussing on access to long-term credit and human capital endowments. Section VII concludes.
8 See Dumke, ‘Reassessing’, and Vonyo, ‘Post-war reconstruction’. 9 Frendling et al., ‘British’
3
I. Methodology
Our study follows the industry-of-origin approach that uses unit values to convert values of output into a
common currency. Unit value ratios are the most appropriate indicator for price comparisons in
manufacturing.10 Purchasing Power Parities (PPPs), as computed by the International Comparison Program
(ICOP), are designed for expenditure comparisons and lead to biased estimates in productivity benchmarks.
PPPs include relative transport and distribution margins, and foreign prices, and are usually expressed at
market prices. Market prices, in turn, are influenced by the level of value-added taxes and excise duties,
which are difficult to subtract from the sales price. Another advantage of the unit-value method is that
production censuses also provide data on sectors that produce mainly intermediate inputs. Pig iron, basic
chemicals, or paper pulp are rarely sold for final consumption. They are used as intermediate inputs in the
production of other manufactures. If we used expenditure prices to construct our benchmarks, these
sectors would be insufficiently covered. Unit values are obtained by dividing the ex-factory sales value
(v), i.e. total turnover, by the corresponding quantity (q), or volume of output, for each industry i.
i
i
iq
vuv =
[1]
The unit value represents the average price for a product, or a group of similar products, averaged
throughout the year and over all firms. A comparison of unit values provides the basis of the industry-of-
origin purchasing power parities (industry PPPs), which we use to compare the value of output per worker
and per hour worked in West Germany and Britain both in 1935/6 and in 1951.11
A
i
B
iBA
iuv
uvUVR =
[2]
The unit value ratio (UVR) of the two countries represents the relative producer price of each
matched product. By aggregating these UVRs, we can derive a conversion factor for gross output and
value added in a given industry branch. In some cases, the coverage ratio, i.e. the value ratio of matched
products to total output, is relatively low. This makes it hard to assume that the UVR is representative for
the respective industry branch. Therefore, UVRs are weighted according to their share in gross value-
added generated in a given industry to construct an overall industry PPP. These industry PPPs are then
aggregated, weighted by their share in manufacturing value-added, to obtain a conversion factor for total
manufacturing. In the following formula, i denotes a matched product in industry j, whereas wij is the
share of product i in the gross output of industry j.
∑=
=
GOIj
i
BA
ijij
BA
j UVRwGOPPP,
1 [3]
There are alternative techniques to weight industry branches and then industries within total
manufacturing. By using the weights of the base country (A), we obtain the Laspeyres gross-output PPP.
10 See B. Van Ark, ‘Comparative levels’, pp. 343-74. 11 The name PPP can be slightly misleading, since the actual term is not real purchasing power parity. It is the weighted average
of unite value ratios, which are relative producer prices. However, the term PPP has been used in the existing literature and thus will be adhered to in this paper.
4
∑=
=
GOjI
i
BA
ij
AA
ij
ABA
j UVRwGOPPP,
1
)()(
[4]
By contrast, the Paasche PPP is obtained when using the weights of the country in the numerator.
∑=
=
GOjI
i
BA
ij
BA
ij
BBA
j UVRwGOPPP,
1
)()(
[5]
In general, we expect Laspeyres PPPs to be higher than Paasche PPPs because of the negative
correlation between prices and quantities on the same market. The quantity weights of the other country
(B) are, thus, relatively large. In the Laspereys PPP, the valuation of gross output at foreign quantities
tends to inflate its aggregate value. This is known as the ‘Gerschenkron effect’, named after Alexander
Gerschenkron who first described it in detail.12 The conversion factor is most commonly obtained by
taking the geometric average of the Paasche and Laspeyres PPPs, known as the Fisher PPP. The Fisher
index has several favourable properties. The most important for our study is that it satisfies the country
reversal test, thus changing the denominator and numerator does not alter our results.13
In the existing literature on the period we study, most labour-productivity benchmarks have been
constructed on the basis of measuring labour input by employment. However, due to large differences in
the length of the working week and the number of vacation days, real hours worked in a man-year vary
significantly between countries. Therefore, a comparison based on man hours worked is preferred
whenever reliable data are available. In our investigation, we report benchmarks both based on man-year
and man-hour worked, but our analysis in Sections IV and V will focus on the latter.
Output-based productivity comparisons are subject to distortions caused by quality differences, as
UVRs are computed using sheer quantities. However, it has been argued that in the early post-war period,
this problem was not as severe as it is today.14 Broadberry and Crafts demonstrated that the productivity
performance of Britain relative to the United States in 1948 appears to have been remarkably similar
whether the comparison is based on net output converted by relative unit value ratios or on a physical-
output benchmark, as in the seminal work of Frankel.15 Quality differences are more important in
consumer durables or engineering products than in intermediates such as steel, cement, paper, or timber.16
II. A new labour-productivity benchmark for British and West German industry in 1951
The data necessary for the construction of our labour-productivity benchmark for 1951 are drawn from
the official production censuses of Britain and Germany. For the United Kingdom, detailed figures on
both output and labour input are presented in The Report on the Census of Production for 1951, published
by the Board of Trade. For West Germany, we derived our data from two different series in the annual
industry statistics published by the Federal Statistical Office.17 The industry classification system in
12 Gerschenkron, Economic backwardness. 13 Van Ark, ‘Comparative levels’, p. 30. 14 Broadberry and Fremdling, ‘Comparative productivity’, p. 408. 15 Broadberry and Crafts, 'Explaining’, pp. 376-7; see also Frankel, ‘Anglo-American productivity differences’. 16 Van Ark, International Comparison 17 Industrie der Bundesrepublik Deutschland, Reihe 4, Die industrielle Produktion 1950/55 (1956). Industrie der Bundesrepublik
Deutschland, Reihe 4: Sonderveröffentlichungen, No. 11. (1956). The German sources provide information on gross output
5
Britain lists 24 main industries, which are subdivided into 148 branches. The West German nomenclature
is based on five core industry groups broken down into 44 industries, which are split up into branches in
some cases. We harmonised these classifications at the level of 24 industries, which cover most of,
although not the entire, industrial sector. Table A1 in the appendix provides a detailed account of our
reclassification work. Since the British census reported data at a much more disaggregated level, our
classification system followed the West German nomenclature as much as possible.
Following the classification system used in German industry statistics is not only a choice of
convenience. It resembles closely the United Nations International Standard Industrial Classification
(ISIC), which has been widely used in the literature. Even more importantly, it is the most appropriate
classification to apply when constructing industry-of-origin benchmarks. To accept the matched products
within an industry to be representative of the industry output, we need to assume that the branches of the
respective industry operate with the same production function. The British industry classification groups
industry branches together which use the same type of input materials but at different levels of
processing. This is hugely problematic for the above assumption as industries producing intermediary
products, like iron and steel, or timber, are typically capital intensive, whereas the engineering branches,
or light manufacturing substitute skilled labour for capital – and thus achieve significantly lower levels of
labour productivity. By contrast, the German nomenclature groups industries into one class which operate
at the same level of the vertical production chain.
All previous benchmarks comparing British and German industrial labour productivity in the mid
twentieth century have been constructed on the bases or raw employment data. In order to provide for an
appropriate measure of labour productivity, employment levels need to be adjusted for differences
between the two countries in average working hours. As we will see, there was substantial deviation
between British and West German manufacturing in this regard in the early 1950s, which yield
significantly different estimates for relative productivity levels depending on which definition of labour
input we use. O’Mahony has constructed estimates at the industry level for several countries on average
annual hours worked by all engaged personnel.18
To construct our benchmark, we matched in total 186 products or product groups. The matching of
products was difficult in several instances. Commodities under the same label are often not homogenous,
while similar products are frequently attributed different names in the production statistics of the two
countries. Furthermore, the West German and the British census did not use the same measurements, and
so the British data had to be converted into metric units. In certain cases, the matching of products was
made impossible as the units of measurement were incomparable. Whereas German industry statistics
almost always specify the volume of production in tons, the British census often reports the number of
products instead. Without reliable data on average product weights in the respective industries, it is
impossible to convert volume into quantities, or vice versa. This problem was particularly severe in the
only. Net production value, i.e. value-added, is reported for 1950 in Fachserie D, Reiche 4 (1965). We use the value added/gross output ratio of 1950 to calculate value added from gross output in 1951.
18 O’Mahony, Britain’s Productivity Performance, Table C, p. 102. The industry classification reflects a higher level of
aggregation than our benchmark. However, we could match our 24 industries to 18 industry groups reported by O’Mahony.
We assumed that standard working hours were uniform across branches of any given industry.

6
engineering sector, where the matched product groups often included several products measured in
incomparable units. To solve this problem, we draw information from British trade statistics. This
procedure is described in more detailed in the appendix, in Table A2.
Another problem is that certain products were only manufactured in one country and, therefore,
could not be matched. Data on production was not reported for reasons of confidentiality in the German
industry statistics in minute industries that incorporated a very small number of firms. Finally, in food
products, beverages and tobacco, the German statistics do not provide disaggregate information on output
before 1953. Thus, we calculated the unit values for these products based on the 1953 production statistics
and extrapolated back to 1951, using export prices drawn from the foreign trade statistics.19
We omitted two industries, where a labour-productivity comparison in the early 1950s would not
have made practical sense. Aircraft manufacturing was shut down in West Germany after World War II,
in accord with the Potsdam Agreement, and was only re-established after 1955, when the Federal
Republic had joined NATO. In 1951, only 188 employees were engaged in the aircraft industry, carrying
out repairs on existing civilian airplanes.20 The building of sea-going vessels was also severely restricted
until the lifting of the occupation statutes in 1951, so that product composition in shipbuilding was also
markedly different that it had been before the war, or what it was in the United Kingdom.21
The final challenge we faced was that the widespread price controls that remained in place all over
Europe until the early 1950s could affect input and output prices very differently in the two countries.
These price movements caused sharp deviations in the ratio of value-added to gross output between West
Germany and Britain in several branches of light manufacturing, leading to unrealistic productivity
estimates. To overcome this problem, since we could not adjust for price distortions for the products we
matched, we had to assume that the value-added to gross output ratio in textiles and the leather industry
remained constant between 1935/6 and 1951 in both countries. Appendix Tables A2 and A3 provide more
detail on the production censuses and the adjustments we have made.
Table 1 below presents the number of matched products, the coverage ratios and the Fisher PPPs
for the 24 industries and for industry as a whole. The 186 matched products or product groups cover 26
per cent of British industry and 33 per cent of West German industry. The coverage ratio varies
significantly across industries, which reflects the aforementioned difficulties in the matching of products.
However, having a low number of product matches does not necessarily lead to weak results. In certain
industries, one product can cover a very large part of total output. For example, in hard-coal mining, the
coverage ratio is very high, even though there is only one matched product.
Table 1 about here
The Fisher PPP for total manufacturing is relatively close to the official exchange rate, which was 11.67
Deutschmark (DM) to the pound in 1951. However, for several industries, the industry-specific PPP
deviates strongly from the exchange rate. Such discrepancies occur because the exchange rate fails to take
account of the fact that the purchasing power of a currency will normally vary between different products. 19 Statistisches Jahrbuch 1953, pp. 311-4; Aussenhandel der Bundesrepublik Deutschland, Teil 1: Zusammenfassende
Übersichten. Jahrgang 1955, Jahresheft (1956)., p. 4. 20 Gareau, ‘Industrial disarmament’, p. 522; Statistisches Bundesamt, Die Industrie der Bundesrepublik Deutschland, Reihe 4:
Sonderveröffentlichungen, No. 11 (1956), p. 6. 21 Gareau, ‘Industrial disarmament’, p. 522.

7
This problem was severe in the early 1950s, still marked by quantity controls and other trade restrictions
under a fixed exchange rate regime. We used the PPPs reported in Table 1 to convert gross output and
value added per employee and per man-hour worked in West German industry from DM to Sterling.
Table 2 reports our estimates for labour productivity in West Germany relative to the United Kingdom.
Table 2 about here
In terms of gross output per person employed, Germany was lagging almost twenty per cent
behind Britain at the aggregate level. In value added per man-hour worked, the German performance was
somewhat better at 85 per cent of the British level. However, we can observe large differences across
industries. Generally, Britain’s productivity lead was larger in terms of output per hour than in terms of
output per worker because the German workforce worked significantly longer hours. This phenomenon
can be explained by the fact that West German manufacturers reported a high number of hours in
overtime in the early 1950s. Schudlich showed that, on average, two hours extra were added to the
working week in manufacturing, and in the engineering industries the numbers were even higher.22 In the
remainder of this section, we discuss the estimates for value-added per hour worked.
British firms achieved higher levels of labour productivity then their German counterparts in the
majority of industries, but their lead was especially striking in fabricated metal products, building materials,
beverages and tobacco manufactures. Germany was lagging behind the most in the tobacco industry,
where her productivity was less than one-sixth of the British level. This massive gap reflects two factors.
First, variation in excise duties on tobacco products between the two countries distorts price comparisons
in a way that we cannot fully take into account. Second, the industry is composed of two branches: the
manufacturing of cigarettes is highly capital intensive and thus features high levels of labour productivity,
whereas the production of cigars relies heavily on skilled labour and hence generates considerably less
output per worker. Whereas cigarettes represented the overwhelmingly dominant component in Britain,
cigars still had a large share in the German tobacco industry in the early 1950s.
Thanks to a long-established superiority in steel making and the major steel-processing industries,
Germany retained her productivity lead in iron and steel, and stayed very close to British productivity
levels in the metal processing sector, except electrical engineering. In chemicals, Germany also preserved
a small productivity lead. It is interesting to see that German manufacturers also outperformed their
British rivals in textiles, the glass, timber and paper industries, where they had never been particularly
competitive. Under the Nazi war economy, light manufacturing was deprived of labour, which pushed up
the capital-labour ratio and urged firms operating in these industries to economize on labour. This forced
wartime rationalization combined with the post-currency reform consumer boom that emerged in the
second half of 1948 placed these industries into a favourable position in terms of labour productivity. In
food products, the large German productivity advantage offset a similar British lead in beverages. Both
are to a large extent the outcome of discrepancies in product composition, meaning that industry branches
with different levels of labour productivity had markedly different weights in the two countries.
Table 3 summarises the alternative estimates in the existing literature for comparative labour-
productivity levels of West Germany and the United Kingdom in manufacturing and in the economy as a
22 Schudlich, Abkehr, pp. 158-67.
8
whole for 1950. As we have explained in the Introduction, all previous estimates were derived by
extrapolation from distant benchmark years. Each of these benchmarks is sufficiently far away in time for
the time-series projections to generate biased estimates for the early 1950s. Relative prices may change
over time and thereby render distant industry PPPs obsolete. To account for the substantial difference
between the rate of productivity growth in British and West German industry between 1950 and 1951, we
used time-series evidence to project backward by one year from our 1951 benchmark.23 This makes our
estimate directly comparable with the other sources.
Table 3 about here
The aggregate productivity gap we report can be defended in two ways. First, Germany always
demonstrated higher productivity relative to other advanced nations, and especially the United Kingdom,
in manufacturing than in agriculture or services. Data from the Conference Board on GDP per capita and
GDP per man hour worked indicate that the West German economy was one-third less productive than its
British counterpart in 1951.24 Our benchmark suggests a notably smaller gap in industry, but one large
enough to support the above pattern for the economy as a whole. Second, our estimates are directly
derived from current-price data on industrial production in 1951, and thus are unaffected by distortions
that arise from changing relative prices in time-series extrapolations.
Our estimate is relatively close to those derived by backward projection from future benchmarks.
There is a substantially bigger gap between our figure and that of Broadberry, which was constructed by
forward projection from a 1935 benchmark and which measures gross output per person employed. Using
the same specification, our benchmark for 1951 becomes 82, which is twelve per cent below the level
Broadberry has estimated for one year earlier. This finding shows that changes in relative prices and the
shifting weights of different industries were much more significant across the 1940s than during the post-
war Golden Age that have been characterised with unprecedented macroeconomic stability. We return to
this issue in Section IV, which compares the two benchmarks presented in this paper.
III. A revised labour-productivity benchmark for British and West German industry in 1936
Fremdling, de Jong and Timmer constructed an industry-of-origins benchmark for value added per worker
in German and British manufacturing for the mid 1930s.25 They used data from the 1935 industry census
for the United Kingdom and the archival records of the census of German industry carried out in 1936 and
published in 1939 by the Imperial Office for the Economic Planning of Warfare. Albeit certainly the most
meticulous study on the subject to date, the estimates Fremdling and associates provide are inappropriate
for our investigation for three reasons. One, they cover the German Reich within its interwar borders, and
thus cannot be directly compared with our 1951 benchmark. Second, the industry classification does not
match the post-war West German nomenclature that we have used. Third, productivity estimates were not
adjusted for differences in hours worked between the two countries.
23 See footnotes 28-31. 24 http://www.conference-board.org/data/economydatabase 25 Fremdling, de Jong, and Timmer, ‘British and German manufacturing’
9
In a comparative study of East and West German industrial labour productivity, Sleifer computed
values for gross output, value added, employment, and labour productivity for all industries reported in
the 1936 German industry census according to post-war borders. In the majority of industries,
productivity levels were higher in the western part that in the eastern part of the Reich, but the regional
productivity gaps differed across industries substantially.26 The author has kindly granted us access to his
complete dataset. We used the product matches of Fremdling et al., and combined this with the specific
West German output and employment data reported in the Sleifer dataset. Following this approach, we
could calculate new industry PPPs, as explained in Section II, and thus generated a revised labour-
productivity benchmark for West Germany and Britain. Since the product matches are derived from the
census that covered the whole of Germany, we had to assume that the value of products in East and West
Germany did not differ significantly.
In total, we used 229 product matches from Fremdling et al. and were able to match 57 separate
industries. Table A4 in the appendix provides detailed information on the classification of industries. We
subsequently grouped these industries together to correspond to our 1951 benchmark.27 In the process, we
have excluded the aircraft industry and shipbuilding, as they do not appear in the 1951 benchmark for
reasons explained in the previous section. Table 4 shows the number of matched products, the coverage
ratio and the Fisher PPPs for all 24 industries and for total industry.
Table 4 about here
To account for differences in average hours worked, standard weekly hours were derived from
the ILO Yearbook and the British Labour Statistics for the United Kingdom, and from the statistical
yearbook of the German Reich.28 For both countries, we adjusted for the number of sick days and
holidays, for which data are available from Huberman and Minns.29 The only simplifying assumption we
had to make is that average annual hours per worker within individual industries did not differ across
regions of the German Reich, since we do not have regionally disaggregated data on working hours.
Our revised labour-productivity estimates for 1935/6 are reported in Table 5. West Germany had
a twelve per cent lead over Britain in terms of gross industrial value added per hour worked. The German
superiority was most striking in the metallurgical industries, electrical engineering, timber and
woodworking. As in 1951, West German manufacturers performed most poorly in tobacco and beverages.
As we have explained before, the German tobacco industry was dominated by cigar manufacturing that
employed little capital and relied heavily on the use of skilled labour, whereas cigarettes were already the
main item in the product mix in the United Kingdom during the 1930s. The contrasting gaps in beverages
and food products can likewise be attributed to structural differences.
Table 5 about here
26 Sleifer, ‘Separated unity’ 27 We added coal mining to the revised benchmark, but did not include coke and coal distillation for which we have no sufficient
data for West Germany in 1951. 28 ILO, Year Book of Labour Statistics, p. 44; Department of Employment and Productivity, British Labour Statistics, pp. 96-97,
104-107; Statistisches Jahrbuch 1939/1940, p. 384. British industry was operating on a six-day workweek. In Germany, there were some variations, so we adjusted for daily hours from Wirtschaft und Statistik, vol. 18, 5 (1938), p.187.
29 Huberman and Minns, ‘Times they are not changing’, pp. 546-68.
10
When we compare our revised benchmark with the estimates of Fremdling et al., a few findings
stand out. For most industries, we report higher levels of labour productivity for West German relative to
Britain. This can be explained by the higher productivity levels in West German industry as compared to
the whole German Reich. Sleifer found that East Germany was at 88.9 per cent of the West German
productivity level in manufacturing.30 Since industrial valued added for West Germany makes up roughly
two-thirds of German industrial output in 1936, we can expect a small difference between the benchmark
for West Germany and the whole of Germany. At the industry level, more substantial differences emerge.
In textiles, the original benchmark for the German Reich was 96.7 per cent of the British level in terms of
value added per worker. We find that West Germany was nine per cent more productive in this
specification than the United Kingdom.
According to our estimates, the engineering sector reported a West German productivity lead of
twenty per cent in terms of value added per worker. Fremdling et al. report a smaller gap of 12.3 per cent.
This difference can be explained by the fact that West Germany was 12.6 per cent more productive than
East Germany in this sector.31 Engineering also presents a powerful example for how important it is to
disaggregate further than previous studies have done. We find that in the whole sector West Germany
commanded a 22 per cent lead in value added per man-hour worked over Britain. However, this average
figure disguises substantial differences at the industry level. The gap was 45 per cent in electrical
engineering, but only five per cent in optical and precision instruments.
IV. The economic consequences of the war
Having constructed two methodologically consistent benchmarks for British and West German industry
in the mid-1930s and 1951, we can assess the consequences of World War II for the Anglo-German
productivity race. An important added value of our work is that it does not rely on time-series
extrapolations, which has been a major caveat of previous studies. In fact, our two benchmarks can be
used precisely to demonstrate how much distortion time-series projections introduce. Distortions can be
very substantial in a period characterised by marked structural shifts between and within industry groups
and equally significant changes in relative prices. Generally, direct benchmark comparisons and time-
series extrapolations should arrive at similar estimates at the aggregate level where inter-temporal shifts
tend to balance out. We expect to find much larger differences for disaggregated comparisons.
To test this hypothesis, we apply historical time-series data on net industrial production and
employment statistics used in previous research to determine relative labour-productivity levels in British
and West German industry in 1951. We derive these alternative estimates by extrapolation from our
revised 1935/6 benchmark. The British data are from Feinstein.32 Times-series on industrial value-added
for West Germany are reported in official industry statistics.33 The number of employees is obtained from
the sources we referred to earlier.34 Since we rely on the Feinstein estimates, we do not adjust for working
hours in this exercise. Also, we recalculated our benchmarks according to the 7 major industry groups 30 Sleifer, Planning Ahead, p. 78 31 Sleifer, ‘Separated unity’ [database] 32 Feinstein, Statistical Tables, p. 111, 129. 33 Industrie der Bundesrepublik Deutschland, Sonderveröffentlichungen, No. 8 (1956), p. 17. 34 Industrie der Bundesrepublik Deutschland, Sonderveröffentlichungen, No. 11 (1956), p. 5; Sleifer, ‘Separated unity’ [database].
11
used by Feinstein and aggregated the data from the other sources up to this level. Table 6 reports output,
employment, and productivity growth between 1936 and 1951 for both countries.
Table 6 about here
Manufacturing value-added grew much faster in Britain than it had in West Germany, where the
impact of war-induced dislocation was more extensive and more prolonged. In both countries, the major
war industries, chemicals and engineering, recorded the most impressive growth rates. Metallurgy in
Germany could not surpass the 1936 production level until 1951, which is not surprising given the severe
output targets and dismantlement policy prevailing in this industry until the late 1940s.35 Interestingly, the
mining sector expanded faster in Germany than in Britain, which was primarily the product of Allied
efforts to boost coal extraction in the Ruhr from the early days of the occupation by expanding
employment even at the cost of declining productivity.36 In the United Kingdom, despite demobilisation,
employment growth remained strong in heavy industry. It was much more modest in light manufacturing
and the food industries, which thus reported the highest growth rates in labour productivity.
The productivity figures reported in Table 6 are used in the next step to estimate relative levels of
labour productivity in 1951 by extrapolation from the 1935/6 benchmark. Table 7 compares the thus
derived productivity gaps to the ones determined by our new post-war benchmark. As expected, the two
procedures yield very similar results for total manufacturing. A residual of 1.27 per cent is well within the
margin of error. However, time-series extrapolations introduce vastly larger distortions at the disaggregate
level. With the exception of metal manufacturing, we obtain double-digit percentage differences between
the alternative estimates. West Germany remained much more productive relative to Britain after the war
in chemicals and light manufacturing, but performed much worse than predicted by time-series
projections in mining and the engineering industries. This finding confirms yet again that our new 1951
benchmark makes an important addition to the currently available quantitative evidence.
Table 7 about here
Our benchmarks are also superior in quality to all previously published estimates because they are
much more disaggregated. Arguably the greatest merit of disaggregated productivity comparisons is that
they allow us to measure the contribution of individual industries to and the role of structural effects in
the growth performance of different economies. Decomposition techniques are frequently used in
disaggregated growth accounts to exploit the richness of data in order to gain a better understanding of the
aggregate growth processes. The exact specification below is derived from the recent work of Timmer
and associates.37 We modified their model, in order to make it applicable to cross-sectional examination,
but this does not alter the mathematics. Aggregate nominal value added (Y) is defined as the sum of
nominal value-added (Z) over all industries (j).
j
j
Z
j
YZPYP ∑=
[6]
35 On Allied industry plans and reparations policy in West Germany, see Plumpe, ‘Reparationsleistungen’, pp. 31-46. 36 See Abeshauser, Wirtschaftsgeschichte, pp. 36-43. 37 Timmer et al., Economic Growth, pp. 153-154. The authors applied the above model to decompose GDP growth.
12
Labour-productivity in a given industry (j) is, in turn, computed as gross value-added in the
respective industry divided by the number of labour hours (L).
jjj LZz = [7]
Aggregate labour productivity is defined as a weighted average of labour-productivity levels in
all industries, where the weights represent the share of industry (j) in gross value-added.
j
j
Y
jZ zL
Y ∑= .υ [8]
In a comparative framework, the aggregate labour-productivity ratio between two countries can
be decomposed into a set of industry contributions, where the industry-specific benchmarks are weighted
by the average of their value-added shares between the two countries, and a residual.
RzLLzLY
LYj
j
Y
jZ
j
YjZjj
j
Y
jZ
B
A+=
∆−∆+= ∑∑∑ .,. lnln υυυ [9]
The residual, which in disaggregated growth accounts is referred to as the reallocation effect,
measures the contribution of differences between the two countries in the composition of their labour
input to the aggregate labour-productivity ratio. It is positive whenever industries with above-average
levels of labour productivity have a larger weight in the country of the numerator (A).
Table 8 about here
Table 8 reports the decomposition result for our two benchmarks for industrial value added per
hour worked. The numbers confirm that neither the gaps between the two countries in total industrial
labour productivity nor the shifting of their relative positions between the mid-1930s and the early 1950s
can be explained by structural differences. Individual industry contributions would have produced very
similar results had the two economies exhibited exactly the same industry weights in total manufacturing.
British industry had a small structural advantage in both periods, meaning that its productivity level
relative to Germany would have been slightly smaller both in 1936 and 1951 based on the individual
industry contributions alone. However, this advantage amounted to only a few percentage points, and it is
thus of no importance.
Figure 1 about here
Figure 1 depicts the contributions of individual industries to the aggregate labour-productivity
gap between West Germany and the United Kingdom on a horizontal bar chart. The bars represent the
percentage point deviation of the productivity levels attained in each industry in West Germany from the
corresponding British levels, weighted by the average share of the respective industries in total industrial
value-added between the two countries. The diagram confirms that Britain had managed to establish a
lead in almost all industries by 1951, even in sectors where Germany was clearly superior before World
War II. We can observe major shifts in the relative importance of the different industries in explaining the
reversal of fortunes in the Anglo-German productivity race. The main reason for Germany’s falling

13
behind was clearly the sharp deterioration of her position in the principle war industries: metallurgy and
metal products, machine tools and transport vehicles, electrical engineering and chemicals. In iron and
steel, chemicals, and textiles, Germany managed to preserve some of her vast superiority, but even here,
British industry had closed most of the gap. Germany’s relative position had improved across the war
only in the glass industry, paper and board, and in food products.
As noted in the previous sections, the tobacco industry is a special case. The already sizeable
British productivity lead in the 1930s increased after the war because the technological shift from cigar to
cigarette production explained in the previous sections was faster than in Germany. The mass demand for
cigarettes born out of wartime experience all over Europe also meant that both the actual volume and the
price of tobacco products relative to other manufactures had increased substantially across the war. The
average share of tobacco products in total industrial value-added between the two countries jumped from
a mere 2.6 per cent in 1935/6 to 8.4 per cent in 1951. Figure 1 shows that over half of the aggregate
German productivity lag in 1951 was the contribution of this relatively small industry. In fact, with the
exclusion of tobacco manufactures, labour-productivity in West German relative to British industry would
increase from 85 per cent to 93 per cent. This finding provides a perfect example for how helpful
decomposition techniques are in explaining aggregate growth processes or, in our case, comparative
industrial performance.
V. Post-war reconstruction and Britain’s relative decline
Having established the relative productivity levels for British and West German industry both before and
shortly after World War II enables us to account for convergence and reconstruction growth in the
comparative development of industrial labour productivity during the Golden Age. As we have argued,
Britain’s relative decline was unavoidable to the extent to which it was due to Germany’s larger potential
for catch up and to re-establish the productivity lead she had attained before the war.
We use existing time-series evidence to extrapolate our new 1951 benchmark forward to 1968.
In this way, we can observe approximately when Germany managed to surpass the British productivity
level in a given industry and when she recovered, if at all, to the relative position she had established in
the mid-1930s. This exercise requires annual growth rates of gross-value added per man-hour worked at
the industry level. For Germany this data can be directly acquired from a collection published by the
Federal Statistical Office on long-run time series.38 The index numbers have been constructed on 1962 as
the base year, and thus it required an additional source to establish industry shares in 1962 gross value-
added for the purpose of our reclassification.39 As for Britain, an industrial index of production is reported
in the Annual Abstract of Statistics.40 We built a consistent 1951-68 index-number series by using 1958
weights. Employment figures and index numbers on hours worked are drawn from the British Labour
Statistics, Historical Abstract 1868-1968.41 Using these data, we could construct an index on value-added
per hour worked for every year from 1951 to 1968.
38 Statistisches Bundesamt, Lange Reihen, pp. 74-75. 39 Fachserie D, Reihe 2 (1975), p. 7. 40 Central Statistical Office, Annual Abstract of Statistics (1958, 1960, 1966, and 1976). 41 Department of Employment and Productivity, British Labour Statistics, Tables 25-26, and Table 138.
14
For the United Kingdom, index numbers on valued-added in constant prices for total industry are
reported annually from 1948 onward online by the Office for National Statistics.42 However, this source
was not sufficiently disaggregated for our purposes. We have managed to disaggregate our series into 18
industry groups that are closely matching the industry classification of our benchmark. We only needed to
average up a few industries, especially under food and tobacco and the miscellaneous group, to make our
1951 benchmark perfectly compatible with the time series.
Table 9 about here
The results of our computations are reported in Table 9. At the aggregate level and in almost all
industries, German manufacturers caught up with their British rivals in labour productivity by the late
1950s. The shaded figures represent the point in time when West Germany had overtaken the United
Kingdom in a given industry. The bordered rubrics indicate industries where the German lead was already
established in 1951. Although our cross section is far too small for us to apply sophisticated econometric
techniques, even a quick glance over the table reveals a clear pattern of convergence. In coal mining, the
engineering industries, and leather goods, where the initial productivity gap was smaller than for industry
as a whole, West Germany had overtaken Britain in the first half of the 1950s. By contrast, in food and
tobacco, china and earthenware, and in the miscellaneous industries (which include rubber and asbestos,
jewellery, musical and sports equipment among others), German manufactures only managed to erased
the relatively large initial gaps towards the end of the decade.
In two industries, namely building materials and fabricated metal products, where labour
productivity in German industry in 1951 only attained 67 per cent and 45 per cent of the British level
respectively, the British productivity lead survived until the end of the Golden Age. In the former,
productivity growth was particularly sluggish in West Germany during the 1960s. From the perspective of
our motivation, the most important finding is that while Germany had overtaken the United Kingdom in
industrial labour productivity in the late 1950s, it was not before 1961 that West German manufacturers
managed to re-establish the relative productivity position they had attained by the mid-1930s. At the
aggregate level, Britain’s relative decline in industrial productivity in the course of the German
Wirtschaftswunder can be entirely attributed to the post-war reconstruction dynamic.
Our disaggregated figures enable us to test this postulation in a cross section of industries. The
scatter diagram in Figure 2 plots the projected levels of labour productivity in West Germany in 1961
relative to Britain against the benchmark estimates for 1935/6. We can observe a very strong positive
relationship for most industries, with only three outliers. Germany reported very low relative productivity
levels in fabricated metal products, where she actually commanded a respectable lead in the 1930s. The
main reason for this shift is most likely the changing composition of the product mix. In the interwar
statistics, small firearms, hand grenades, and simple tools used for military consumption were all included
under this industry. The production of armaments was shut down by the Allies after 1945 and was only
re-allowed following the German accession to NATO in 1955 – most notably after the Sputnik shock in
1957. Consequently, until the late 1950s, the industry operated without the relatively large-scale and
highly capital-intensive plants that used to supply these products in 1936.
42 http://www.statistics.gov.uk/statbase

15
Figure 2 about here
By contrast, in the leather and glass industries, West Germany recorded much higher levels of
labour productivity relative to Britain in the post-war period than in 1936. Depressed consumer demand
during the 1930s together with the prioritisation of first public works and later war preparations implied
that light manufacturing received very little investment. This changed markedly thanks to the consumer
boom of the early post-war decades. These industries became increasingly capital intensive particularly
from the late 1950s onward. West Germany was entering an extended period of critical labour shortage,
with the unemployment rate averaging 1 per cent between 1959 and 1972. Under these conditions, the
industries that typically paid the lowest wages had to keep increasing output with declining employment.
This called for the substitution of capital for skilled labour, which was in particularly short supply as the
number of industrial apprentices began to plummet already in 1956.43 In the early 1960s, the number of
manual workers also began to decline sharply in textiles, the timber industry and woodworking, yielding
higher levels of capital intensity and, thus of labour productivity.
For all 18 industry groups, we obtain the coefficient 0.41 for the correlation between the 1935/6
benchmark and the projected levels for 1961, significant at the ten per cent level. If we eliminate the three
clear outliers from the sample, the coefficient jumps to 0.64 and turns significant at the one per cent level.
Given the small number of observations, this is a statistically very robust finding, which confirms the
argument that West German super-growth until the early 1960s was driven by post-war reconstruction. If
in any period during the Golden Age, British industry was failing in comparison with Germany in the
1960s, not in the 1950s. At the aggregate level, the growth of value added per hour worked was still more
than 1 percentage point faster in West Germany than in the United Kingdom after 1961. Moreover, the
growth pattern emerging at the disaggregate level confirms a central component of the manufacturing
failure hypothesis, namely that British industry performed particularly poorly in large scale operations,
characterised by highly capital-intensive American style mass production. In this aspect, Broadberry and
Crafts were undoubtedly right, even if their timing was not precisely accurate.
Table 9 demonstrates that by 1968 the West German productivity lead over Britain was indeed
overwhelming in the branches of large-scale industry, such as coal mining, iron and steel, non-ferrous
metals, chemicals and textiles. By contrast, British manufacturers were performing relatively well in
industries that traditionally included a vast army of highly specialised small and medium-sized firms,
mechanical engineering and metal products, china and earthenware, or clothing and footwear. In electrical
engineering and transport vehicles, labour productivity levels in Britain fell behind more substantially, but
were still not worse compared to the respective West German levels than they had been in the mid-1930s.
Mechanical engineering was the only industry where the United Kingdom was even narrowing the
productivity gap after 1962. At first, this may be striking as West German engineering firms were fiercely
competitive and had been forcing their British rivals out of world markets since the early 1950s.
German historiography provides ample material to unravel this paradox. In the post-war
reconstruction phase, West German engineering firms had no incentive either on the supply or on the
demand side to strive for technical innovation. First, large efficiency gains could be achieved through a
more efficient allocation of available factor endowments and through the elimination of stringent market
43 Hoffmann, Geschichte, p. 67.
16
regulations and state-sponsored monopolies that characterised the economy of Nazi Germany. Therefore,
manufacturers had no reason to increase their production costs by boosting their R&D expenditure and
hence becoming less competitive in the short run.
Second, after two decades of depressed consumption, the war-torn German society had an
insatiable thirst for traditional manufacturing goods, particularly consumer durables. In 1950, three out of
four households had coal heating and only 7 per cent of them were equipped with an electrical stove. By
1958, only every fifth family owned a refrigerator, and there was also substantial pent-up demand for
simple household appliances as well as furniture and textile products.44 The life of the average working
class family during the 1950s did not, in any way, mirror a matured consumer society.45 The restocking of
industrial plants in countries plundered under German occupation during the war meant that the
engineering industries could also thrive on external markets by effectively producing at the technological
level of the 1930s. In heavy equipment, firms were still exporting old coal furnaces and steam-powered
locomotives; the darling of the automobile industry remained the Volkswagen ‘Beetle’.
Finally, in metal products, mechanical and precision engineering, production scale was generally
insufficient for standardised mass production.46 In these strongly export-oriented industries, Germany had
long specialised in skilled-labour intensive, high value-added differentiated quality products, which were
flexibly designed to customer needs.47 Firms continued to concentrate on product rather than process
innovation. Since quality engineering goods sold under the lucrative ‘Made in Germany’ label faced
highly income elastic demand in both domestic and international markets, their producers managed to
maintain high profitability without having to make significant real efficiency gains.48
The factor that slowed down the growth of labour productivity in mechanical engineering in the
1960s, in particular, was a significant shift in the product mix. The most highly capital intensive branch of
this industry was steel constructions, i.e. heavy equipment. The 1958 coal crises marked the transition of
European fuel consumption from coal to hydrocarbons. This development was detrimental for heavy
equipment manufacturers in West Germany as it depressed demand for several of their key products, such
as coal furnaces, railway locomotives and rolling stock, and coal mining equipment. As the most capital
intensive and thus most productive segment of mechanical engineering was shrinking throughout the
1960s, labour-productivity growth for the industry as a whole was bound to slow down.
VI. The causes for British failure in large-scale industry
Transforming factory industry in Europe from a traditionally craft based, medium scale and skilled-labour
intensive system into the large-scale, highly capital intensive mode of serial production assigned an
instrumental role to factor markets. Manufacturing firms had to raise a lot of capital, especially as their
existing plants and machinery park often had to be replaced in order to adopt the new technological
paradigm. Therefore, differences in the institutional environment that conditioned access to long-term
credit for industrial investment and which made incentives for labour-saving investment powerful enough
44 Weimer, Deutsche Wirtschaftsgeschichte, p. 116. 45 Wildt, ‘Privater Konsum’, p. 280. 46 Radkau, ‘Wirtschaftswunder’, pp. 130-131. 47 Berghoff, ‘The end of family business’, p. 276. 48 Ambrosius, ‘Wirtschaftlicher Strukturwandlung’, pp. 118-119.

17
were reflected in the relative productivity performance of different economies. Not surprisingly, both the
British and German literature placed heavy emphasis on such differences. Bad institutional legacies, such
as the prevalence of entrenched trade unions, the high share of public ownership in large-scale industry,
weak competition rules, and inappropriate macro-economic policies have all been blamed for the sluggish
adaptation to fast-changing market conditions in British industry.49 According to Crafts, the post-war
settlement inhibited productivity growth because of “the inheritance from the inter-war economy of craft
trade unionism combined with monopolistic product markets and because the deal effectively precluded
necessary reforms of industrial relations structures, vocational training and anti-trust policy while locking
the economy into high levels of direct taxation and nationalisation”.50 Although our research does not
extend to these issues, we do not wish to refute the claim that by the 1960s West Germany was a better
functioning market economy than the United Kingdom.
Nor do we aim to downplay the significance of the highly favourable conditions faced by German
industrialists seeking large-scale investment financing. In the 1960s, large firms had access to well-
developed capital markets that had never really existed in Germany before. In the interwar period and
during the early post-war years, the regulatory framework was not conducive to a high level of market
capitalisation. However, the increasing importance of open credit markets did not diminish the unique
role that banks had played in financing German industry. The ‘special relationship’ between big banks
and big industry that involved a long-term commitment of financial institutions to manufacturing firms in
their clientele, reaches back to the second industrial revolution, and was characterised by many as a major
catalyst of German industrialisation.51 Not only did this relationship survive the war and the post-war
resettlement; it actually grew much stronger between the 1950s and the 1960s.
The disintegration of capital markets and the commanding heights of the financial sector was an
essential component of Allied policy to dismantle monopolistic structures in the German economy. The
three large universal banks – Deutsche, Dresdner and Commerzbank – were broken up into quasi-
independent regional subsidiaries, and later into three regional banks each with independent legal status.
This made the concentration of assets required to finance large-scale industrial projects extremely
difficult.52 Between 1950 and 1957, market capitalisation accounted for only ten per cent of gross
investment in German industry.53 Thus, short-term borrowing remained the most important source of
investment financing besides retained earnings, with a share of forty per cent in 1950.54 In December
1956, the Bundestag lifted all regulations limiting the concentration of financial institutions, and by 1960
the three large banks were able to re-establish their dominant position in the long-term credit market.
Their role went beyond a direct source of financing as they became increasingly important intermediaries
in the issuing of capital-market instruments for industrial corporations.55
Additionally, German manufacturers were guaranteed better access to cheap credit than their
British counterparts because they faced much less crowding out in capital markets from sovereign bonds.
49 Elbaum and Lazonick, ‘Decline’; Kirby, ‘Institutional rigidities’; Bean and Crafts, ‘British economic growth’; Crafts, ‘Never
had it so good’; Prais, Productivity. 50 Crafts, ‘Adjusting’, p 2. 51 Veblen, Imperial Germany; Gerschenkron, Economic backwardness 52 Pohl, ‘Entwicklung’, pp. 232-6. 53 Bornemann and Linnhoff, Währungsreform, pp. 18-21. 54 Baumgart and Moritz, Finanzierung, pp.84-5. 55 Pohl, ‘Entwicklung’, pp. 236-40.
18
The ratio of national debt to GDP was extremely low in the Federal Republic in the post-war period. It
peaked at 24.5 per cent in 1954 and declined to 16.7 per cent by 1962.56 By contrast, the debt to GDP
ratio never fell below one hundred per cent in the United Kingdom during the 1950s and 1960s.
However, the belated Americanisation of German industry required not only physical capital.
Skill endowments in the industrial workforce had to be restructured as well. Craft-based production
techniques, prevalent in most branches of European manufacturing until the early post-war years, relied
heavily on the use of skilled manual labour. By contrast, large-scale serial production not only substituted
capital for skilled labour, but also employed a large number of highly skilled technical personnel:
production engineers and technicians. We do not have data to compare the composition of industrial
employment according to qualification levels in the two countries over the whole period. However, we
have enough evidence to show that the West German training system proved to be flexible enough to
facilitate this technological transition. The number of apprentices in industry and handcrafts declined by
twenty per cent between 1956 and 1960, despite the significant expansion of manufacturing employment.57
By contrast, total enrolment in engineering schools increased by 62 per cent between 1958 and 1968, even
though employment growth was much more modest than during the 1950s.58
Figure 3 about here
Figure 3 shows how the skilled-labour endowments of West Germany industry had evolved over
the 1950s and 1960s. From 1962 onward, the federal employment and social statistics report detailed data
on the composition of industrial employment, based on which we compute the share of both skilled
manual workers, and engineers and technicians in total employment. For the 1950s, such figures are not
available. However, the Federal Statistical Office conducted two large representative surveys on the
structure of industrial wages and salaries in November 1951 and in October 1957.59 From these sources
we can determine the ratio of skilled workers to the manual workforce and the ratio of technical personnel
to all salaried employees represented in the survey. The annual industry statistics, in turn, report
employment broken down to salaried stuff and wage labour.60 Therefore, we can use the above ratios to
compute the share of skilled manual workers, and of engineers and technicians in total employment. The
chart depicts a stong shift towards a more intensive use of highly skilled technical personnel and a parallel
decline in the application of skilled manual labour between the late 1950s and the early 1960s. To the
extent that this trend was not matched by, or was less dynamic in, British industry, it provides an
additional explanation for the superior German productivity performance in large-scale manufacturing.
VII. Conclusions
In this paper, we offered a comprehensive reassessment of the relative productivity performance of
British industry in West German comparison both before the outbreak of World War II and in the early
post-war period. The economic consequences of the war for the Anglo-German productivity race cannot
56 Sachverständigenrat, Jahresgutachten 1964/65 57 Hoffmann, Geschichte, p. 112. 58 Kultusministerkonferenz, Ausbau, pp. 1-4. 59 Statistik der Bundesrepublik Deutschland, vol. 90-91 (1954), vol. 246.1-2 (1960). 60 Die Industrie der Bundesrepublik Deutschland, Reihe 4: Sonderveröffentlichungen, No. 11 (1956); Statistisches Jahrbuch 1958
19
be overstated. In the mid-1930s, West Germany commanded a respectable lead over the United Kingdom
in industrial labour productivity. By the early 1950s, this pattern had been completely reserved. Relative
to the corresponding British level, value added per hour worked in German industry had declined by a
quarter between 1936 and 1951. Our disaggregated analysis shows that the falling behind of West
Germany was driven by the deteriorating performance of the capital goods industries most important for
the war effort, which subsequently became the locomotives of the Wirtschaftswunder.
Until the early 1960s, the superior growth performance of German industry can be explained by
precisely the elimination of the war-induced productivity gap. This result confirms the line of research
that has linked the economic miracles of war-shattered states in the 1950s to a reconstruction dynamic.
Britain’s relative decline during the 1950s cannot be attributed to British manufacturing failure. If at any
time during the post-war Golden Age, such failure occurred in the 1960s, particularly in industries
dominated by large-scale and highly capital intensive establishments. Here, unsuccessful technological
adaptation to the requirements of standardised mass production, weak competition rules and the lack of
sufficient labour-market flexibility together with a comparatively poor investment climate, stressed by
Broadberry and Crafts among others, were indeed instrumental. Alongside these factors, however, the
superior German productivity performance in these industries also reflected the rapid adjustment of
skilled labour endowments to the technological requirements of standardised mass production.
References
Abelshauser, W., Wirtschaftsgeschichte der Bundesrepublik Deutschland (Frankfurt, 1983).
Ambrosius, G., ‘Wirtschaftlicher Strukturwandlung und Technikentwicklung’, in A. Schildt, A. Sywottek, eds., Modernisierung im Wiederaufbau: Die westdeutsche Gesellschaft der fünfziger Jahre (Bonn, 1993), pp. 107-128.
Baumgart, E., Moritz, W., Die Finanzierung der industriellen Expansion in der Bundesrepublik während der Jahre des
Wiederaufbaus (Berlin, 1960).
Bean, C., Crafts, N.F.R., ‘British economic growth since 1945: relative economic decline…and Renaissance?’, in N. F. R. Crafts and G. Toniolo (eds.), Economic Growth in Europe since 1945 (Cambridge, 1996), pp. 131-162.
Berghoff, H., ‘The end of family business: the Mittelstand and German capitalism in transition, 1949-2000’, Business
History Review, 80 (2006), pp. 263-95.
Bornemann, F. O., Linhoff, H., Die seit der Währungsreform begebenen Industrie-Anleihen (Berlin, 1958).
Broadberry, S. N., The productivity race: British manufacturing in international perspective, 1850-1990 (London, 1997).
Broadberry, S. N., Crafts, N. F. R., ‘UK productivity performance from 1950 to 1979: a restatement of the Broadberry-Crafts view’, Economic History Review, 56 (2003), pp. 718-35.
Broadberry, S. N., Crafts, N. F. R., ‘British economic policy and industrial performance in the early postwar period’, Business History, 38 (1996), 65-91.
Broadberry, S. N., Crafts, N. F. R., ‘Explaining Anglo-American productivity differences in the mid-twentieth century’, Oxford Bulletin of Economic and Statistics, 52 (1990), pp. 375-402.
Broadberry, S. N., Fremdling, R., ‘Comparative productivity in British and German industry 1907-37’, Oxford
Bulletin of Economic and Statistics, 52 (1990), pp. 403-21.
Broadberry, S. N., O’Mahony, M., ‘Britain's productivity gap with the United States and Europe: a historical perspective’, National Institute Economic Review, 189 (2004), pp. 72-85.
20
Crafts, N. F. R., ‘Deindustrialisation and economic growth’, Economic Journal, 106 (1996), 172-183.
Crafts, N. F. R., “You’ve never had it so good?’: British economic policy and performance, 1945-1960’, in Eichengreen, B. (ed.), Europe’s Post-War Recovery (Cambridge, 1995), pp. 246-70.
Crafts, N. F. R., ‘Adjusting from war to peace in 1940s Britain’, Economic and Social Review, 25 (1993), pp. 1-20.
Dumke, R. H., ‘Reassessing the Wirtschaftswunder: reconstruction and postwar growth in West Germany in an international context’ Oxford Bulletin of Economics and Statistics, 52 (1990), 451-91.
Eichengreen, B., Ritschl, A.O., ‘Understanding West German economic growth in the 1950s’, Cliometrica, 3 (2009), 191-219.
Elbaum, B., Lazonick, W., ‘The decline of the British Economy: an institutional perspective’, The Journal of
Economic History, 44 (1984), pp. 567-83.
Feinstein, C.H., Statistical tables of national income, expenditure and output of the U.K. 1855-1965 (London, 1972).
Frankel, M., ‘Anglo-American productivity differences: their magnitude and some causes’, American Economic
Review, 45 (1955), pp. 94-112.
Fremdling, R., de Jong, H. J., and Timmer, M. P., ‘British and German manufacturing productivity compared: a new benchmark for 1935/36 based on double deflated value added’, Journal of Economic History, 67 (2007), pp. 350-78.
Gareau, F.H., ‘Morgenthau’s plan for industrial disarmament in Germany’, The Western Political Quarterly, 14 (1961), pp. 517-34.
Gerschenkron, A., Economic backwardness in historical perspective (Cambridge, MA, 1962).
Hoffmann, E., Zur Geschichte der Berufsausbildung in Deutschland (Bielefeld, 1962).
Huberman, M., Minns, C., ‘The times they are not changin': days and hours of work in old and new worlds, 1870-2000’, Explorations in Economic History, 44 (2007), pp. 538-67.
Jánossy, F., The end of the economic miracle: appearance and reality in economic development (New York, 1969)
Kirby, M. W., ‘Institutional rigidities and economic decline: reflections on the British experience’, The Economic History Review, New Series, vol. 45, 4 (1992), pp. 637-660.
O’Mahony, M., Britain’s productivity performance 1950-1996 (London, 1999).
OMahony, M., ‘Productivity levels in British and German manufacturing industry’, National Institute Economic
Review, 139 (1992), pp. 46-63.
Olson, M., The rise and decline of nations: economic growth, stagflation and social rigidities (New Haven and London, 1982).
Plumpe, W., ‘Die Reparationsleistungen Westdeutschlands nach dem Zweiten Weltkrieg’, in K. Eckart and J Roesler, eds., Die Wirtschaft im geteilten und vereinten Deutschland (Berlin, 1999), pp. 31-46.
Pohl, M., ‘Die Entwicklung des privaten Bankwesens nach 1945: Die Kreditgenossenschaften nach 1945’, in Institut für Bankhistorische Forschung (ed.), Deutsche Bankengeschichte, vol. 3: Vom Ersten Weltkrieg bis zur Gegenwart (Frankfurt: 1983), pp. 207-278.
Prais, S. J., Productivity and industrial structure (Cambridge, 1981).
Radkau, J., ‘Wirtschaftswunder ohne technologische Innovation? Technische Modernität in den 50-er Jahren’, in A. Schildt, A. Sywottek, eds, Modernisierung im Wiederaufbau: Die westdeutsche Gesellschaft der fünfziger Jahre (Bonn, 1993), pp. 129-154.
Schudlich, E., Die Abkehr vom Normalarbeitstag: Entwicklung der Arbeitszeiten in der Industrie der Bundesrepublik
seit 1945 (Frankfurt, 1987).
Sleifer, J., Planning ahead and falling behind: The East German economy in comparison with West Germany, 1936-
2002 (Berlin, 2006).

21
Sleifer, J., Separated Unity: The Industrial Sector in 1936 in the Territory of the German Democratic Republic and
the Federal Republic of Germany, Jahrbuch für Wirtschaftsgeschichte, 42 (2001/1), pp. 133-164.
Smith, A., Hitchens D., and Davies D.W.N., International industrial productivity: a comparison of Britain, America
and Germany (Cambridge, 1982).
Timmer, M. P., Inklaar, R., O’Mahony, M., and Van Ark, B., Economic growth in Europe: a comparative industry
perspective (Cambridge, 2010).
Tomlinson, J., ‘Inventing decline: The falling behind of the British Economy in the postwar years’, Economic History Review, New Series, vol. 49, 4 (1996), pp. 731-57.
Van Ark, B., International comparison of output and productivity: manufacturing productivity performance of ten
countries from 1950 to 1990 (Groningen, 1993).
Van Ark, B., ‘Comparative levels of manufacturing in postwar Europe: measurement and comparison’, Oxford
Bulletin of Economic and Statistics, 52 (1990), pp. 343-74.
Veblen, T., Imperial Germany and the Industrial Revolution (London, 1915).
Vonyó, T., ’Post-war reconstruction and the Golden Age of economic growth’, European Reviewof Economic
History 12 (2008), pp. 221–41.
Weimer, W., Deutsche Wirtschaftsgeschichte (Hamburg, 1998).
Wildt, M., ‘Privater Konsum in Westdeutschland in den 50-er Jahren’, in A. Schildt, A. Sywottek, eds., Modernisierung im Wiederaufbau: Die westdeutsche Gesellschaft der fünfziger Jahre (Bonn, 1993), pp. 275-89.
Official sources
Board of Trade, The Report on the Census of Production for 1951 (1954).
Board of Trade, Accounts Relating to Trade and Navigation of the United Kingdom for Each Month During the
Year (1951).
Bundesministerium für Arbeit und Sozialordnung, Arbeits- und Sozialstatistische Mitteilungen, vol. 16, 4 (1965).
Bundesministerium für Arbeit und Sozialordnung, Hauptergebnisse der Arbeits- und Sozialstatistik, diff. volumes.
Central Statistical Office, Annual Abstract of Statistics, diff. volumes.
Department of Employment and Productivity, British Labour Statistics: Historical Abstract 1886–1968 (1971).
International Labour Office, Year Book of Labour Statistics 1939 (Geneva, 1939).
Office for National Statistics online: http://www.statistics.gov.uk/statbase [July 2011].
Sachverständigenrat zur Begutachtung der gesamtwirtschaftlichen Entwicklung, Jahresgutachten 1964/65: Stabiles,
geldstetiges Wachstum (Stuttgart/Mainz, 1966).
Ständige Konferenz der Kultusminister der Länder in der Bundesrepublik Deutschland [Kultusministerkonferenz], Der Ausbau der Ingenieurschulen 1958 bis 1968, Dokumentation, No. 28 (Bonn, 1969).
Statistisches Bundesamt, Lange Reihen zur Wirtschaftsentwicklung (Stuttgart and Mainz, 1973).
Statistisches Bundesamt, Fachserie D: Industrie und Handwerk, Reihe 2: Indizes der industriellen Produktion, Produktion ausgewählter industrieller Erzeugnisse, Sonderbeitrag, ‘Neuberechnung der Indizes auf Basis 1970’ (1975).
Statistisches Bundesamt, Fachserie D: Industrie und Handwerk, Reihe 4: Sonderbeiträge zur Industriestatistik, ‘Neuberechnung des Index der industriellen Nettoproduktion auf Basis 1958’ (1965).
Statistisches Bundesamt, Der Außenhandel der Bundesrepublik Deutschland, Teil 1: Zusammenfassende Übersichten. Jahrgang 1955, Jahresheft (1956).
22
Statistisches Bundesamt, Die Industrie der Bundesrepublik Deutschland, Reihe 4: Die industrielle Produktion, 1951/55 (1956).
Statistisches Bundesamt, Die Industrie der Bundesrepublik Deutschland, Reihe 4: Sonderveröffentlichungen, No. 11. ‘Beschäftigung und Umsatz, Brennstoff- und Energieversorgung 1951bis 1955: Jahreszahlen der Industrieberichterstattung’ (1956).
Statistisches Bundesamt, Die Industrie der Bundesrepublik Deutschland, Reihe 4: Sonderveröffentlichungen, No. 8, ‘Neuberechnung des Index der industriellen Nettoproduktion’ (1956).
Statistisches Bundesamt, Die Verdienste der Arbeiter in der gewerblichen Wirtschaft im November 1951: Ergebnisse
der Gehalts- und Lohnstrukturerhebung 1951/52, Statistik der Bundesrepublik Deutschland, vol. 90 (1954).
Statistisches Bundesamt, Die Verdienste der Angestellten in der gewerblichen Wirtschaft im November 1951:
Ergebnisse der Gehalts- und Lohnstrukturerhebung 1951/52, Statistik der Bundesrepublik Deutschland, vol. 91 (1954).
Statistisches Bundesamt, Gehalts- und Lohnstrukturerhebung 1957: Verdienste der Arbeiter in der Industrie im
Oktober 1957, vol. 241.1 (1960).
Statistisches Bundesamt, Gehalts- und Lohnstrukturerhebung 1957: Verdienste der Angestellten in der gewerblichen
Wirtschaft im Oktober 1957, vol. 241.2 (1960).
Statistisches Bundesamt, Statistisches Jahrbuch für die Bundesrepublik Deutschland im Jahre 1953, diff. volumes.
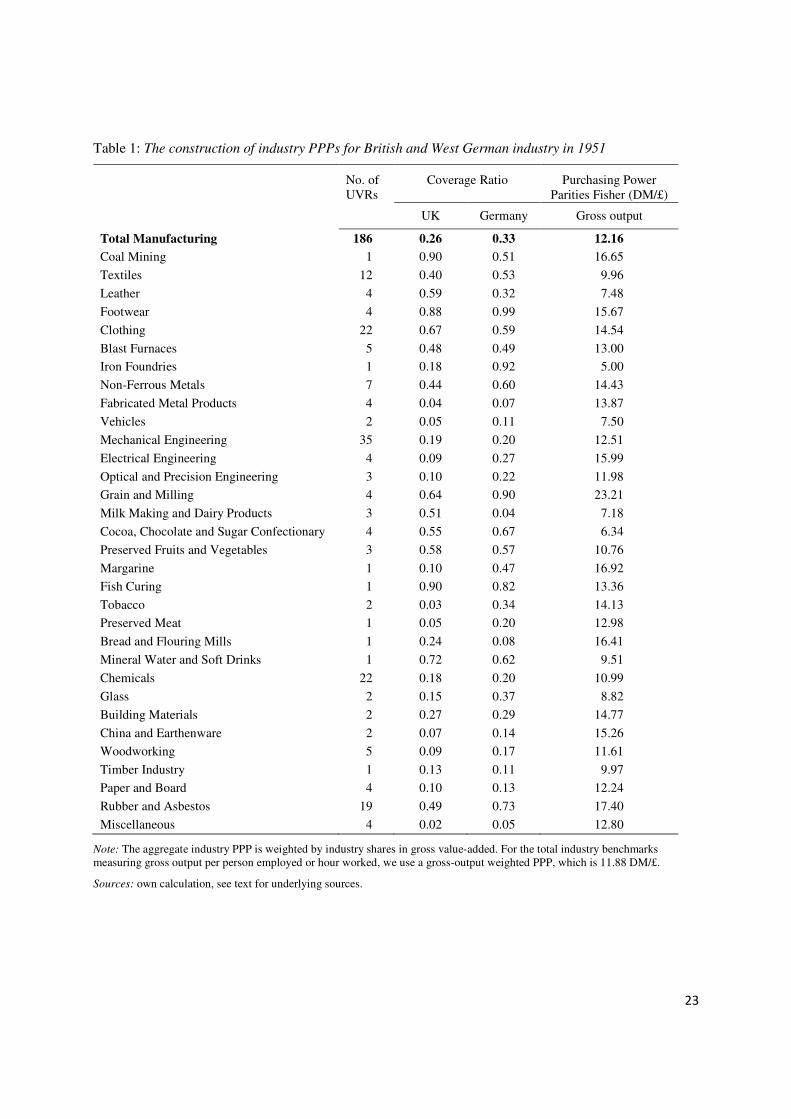
23
Table 1: The construction of industry PPPs for British and West German industry in 1951
No. of UVRs
Coverage Ratio Purchasing Power Parities Fisher (DM/£)
UK Germany Gross output
Total Manufacturing 186 0.26 0.33 12.16 Coal Mining 1 0.90 0.51 16.65
Textiles 12 0.40 0.53 9.96
Leather 4 0.59 0.32 7.48
Footwear 4 0.88 0.99 15.67
Clothing 22 0.67 0.59 14.54
Blast Furnaces 5 0.48 0.49 13.00
Iron Foundries 1 0.18 0.92 5.00
Non-Ferrous Metals 7 0.44 0.60 14.43
Fabricated Metal Products 4 0.04 0.07 13.87
Vehicles 2 0.05 0.11 7.50
Mechanical Engineering 35 0.19 0.20 12.51
Electrical Engineering 4 0.09 0.27 15.99
Optical and Precision Engineering 3 0.10 0.22 11.98
Grain and Milling 4 0.64 0.90 23.21
Milk Making and Dairy Products 3 0.51 0.04 7.18
Cocoa, Chocolate and Sugar Confectionary 4 0.55 0.67 6.34
Preserved Fruits and Vegetables 3 0.58 0.57 10.76
Margarine 1 0.10 0.47 16.92
Fish Curing 1 0.90 0.82 13.36
Tobacco 2 0.03 0.34 14.13
Preserved Meat 1 0.05 0.20 12.98
Bread and Flouring Mills 1 0.24 0.08 16.41
Mineral Water and Soft Drinks 1 0.72 0.62 9.51
Chemicals 22 0.18 0.20 10.99
Glass 2 0.15 0.37 8.82
Building Materials 2 0.27 0.29 14.77
China and Earthenware 2 0.07 0.14 15.26
Woodworking 5 0.09 0.17 11.61
Timber Industry 1 0.13 0.11 9.97
Paper and Board 4 0.10 0.13 12.24
Rubber and Asbestos 19 0.49 0.73 17.40
Miscellaneous 4 0.02 0.05 12.80
Note: The aggregate industry PPP is weighted by industry shares in gross value-added. For the total industry benchmarks measuring gross output per person employed or hour worked, we use a gross-output weighted PPP, which is 11.88 DM/£.
Sources: own calculation, see text for underlying sources.

24
Table 2: Relative labour-productivity levels in West German industry in 1951 (UK=100)
Sources: own calculations, see text for underlying sources.
Gross output per person
Value added per person
Gross output per hour
Value added per hour
Total Industry 82 95 74 85 Coal Mining 82 81 89 88
Textiles 90 114 83 105
Leather 75 103 66 91
Footwear 93 108 83 96
Clothing 97 95 86 84
Iron and Steel 93 134 84 121
Non Ferrous Metals 63 92 57 83
Fabricated Metal Products 82 51 72 45
Transport Vehicles 82 106 74 96
Mechanical Engineering 96 109 84 95
Electrical Engineering 84 89 76 81
Optical and Precision Engineering 90 115 78 99
Tobacco 19 18 16 15
Beverages 54 51 44 42
Food Products 126 200 104 165
Chemicals 98 120 85 104
Glass Products 122 136 107 119
Building Materials 60 76 53 67
China and Earthenware 84 90 74 79
Woodworking 74 100 63 86
Timber 129 144 110 122
Paper and Board 100 138 87 120
Rubber and Asbestos 54 87 50 80
Miscellaneous 52 84 46 73
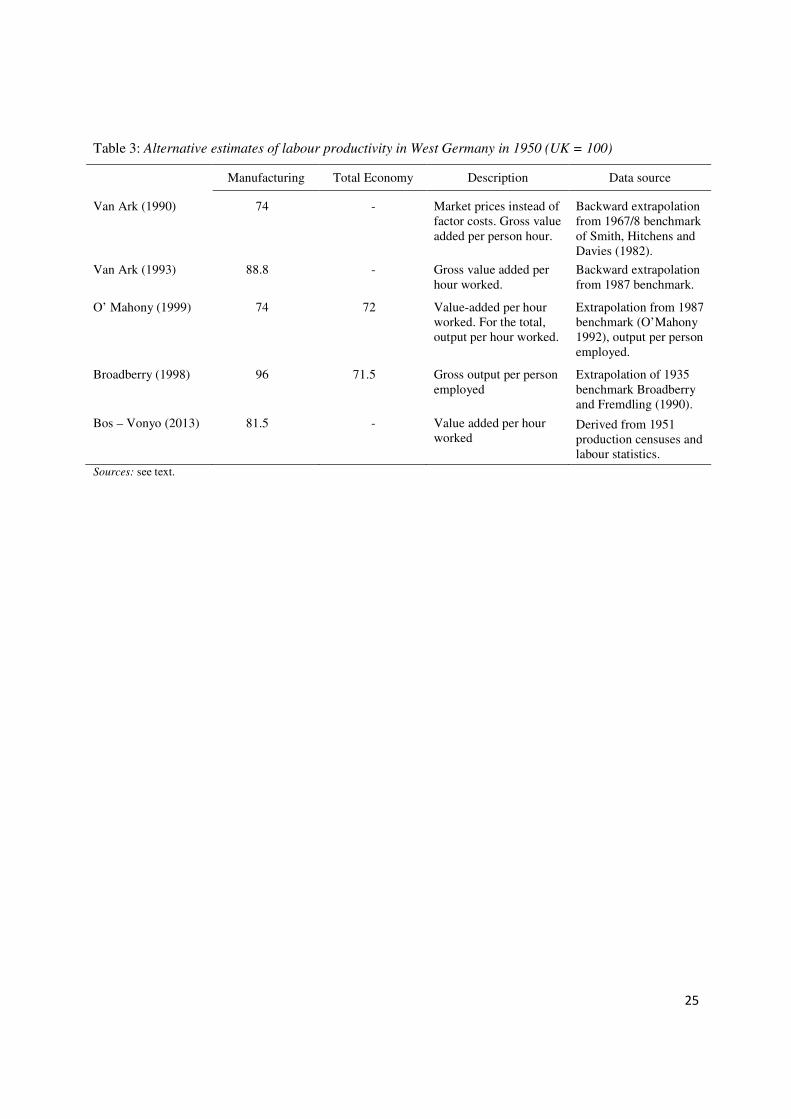
25
Table 3: Alternative estimates of labour productivity in West Germany in 1950 (UK = 100)
Manufacturing Total Economy Description Data source
Van Ark (1990) 74 - Market prices instead of factor costs. Gross value added per person hour.
Backward extrapolation from 1967/8 benchmark of Smith, Hitchens and Davies (1982).
Van Ark (1993) 88.8 - Gross value added per hour worked.
Backward extrapolation from 1987 benchmark.
O’ Mahony (1999) 74 72 Value-added per hour worked. For the total, output per hour worked.
Extrapolation from 1987 benchmark (O’Mahony 1992), output per person employed.
Broadberry (1998) 96 71.5 Gross output per person employed
Extrapolation of 1935 benchmark Broadberry and Fremdling (1990).
Bos – Vonyo (2013) 81.5 - Value added per hour worked
Derived from 1951 production censuses and labour statistics.
Sources: see text.
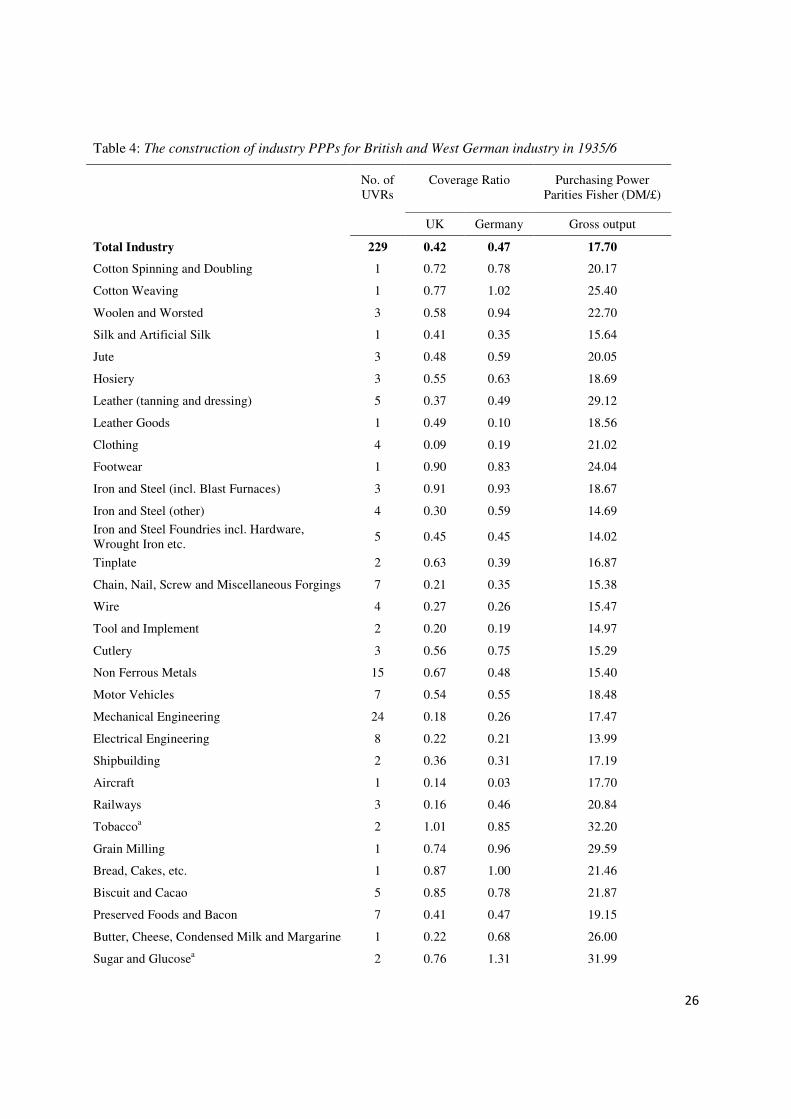
26
Table 4: The construction of industry PPPs for British and West German industry in 1935/6
No. of UVRs
Coverage Ratio Purchasing Power Parities Fisher (DM/£)
UK Germany Gross output
Total Industry 229 0.42 0.47 17.70
Cotton Spinning and Doubling 1 0.72 0.78 20.17
Cotton Weaving 1 0.77 1.02 25.40
Woolen and Worsted 3 0.58 0.94 22.70
Silk and Artificial Silk 1 0.41 0.35 15.64
Jute 3 0.48 0.59 20.05
Hosiery 3 0.55 0.63 18.69
Leather (tanning and dressing) 5 0.37 0.49 29.12
Leather Goods 1 0.49 0.10 18.56
Clothing 4 0.09 0.19 21.02
Footwear 1 0.90 0.83 24.04
Iron and Steel (incl. Blast Furnaces) 3 0.91 0.93 18.67
Iron and Steel (other) 4 0.30 0.59 14.69
Iron and Steel Foundries incl. Hardware, Wrought Iron etc.
5 0.45 0.45 14.02
Tinplate 2 0.63 0.39 16.87
Chain, Nail, Screw and Miscellaneous Forgings 7 0.21 0.35 15.38
Wire 4 0.27 0.26 15.47
Tool and Implement 2 0.20 0.19 14.97
Cutlery 3 0.56 0.75 15.29
Non Ferrous Metals 15 0.67 0.48 15.40
Motor Vehicles 7 0.54 0.55 18.48
Mechanical Engineering 24 0.18 0.26 17.47
Electrical Engineering 8 0.22 0.21 13.99
Shipbuilding 2 0.36 0.31 17.19
Aircraft 1 0.14 0.03 17.70
Railways 3 0.16 0.46 20.84
Tobaccoa 2 1.01 0.85 32.20
Grain Milling 1 0.74 0.96 29.59
Bread, Cakes, etc. 1 0.87 1.00 21.46
Biscuit and Cacao 5 0.85 0.78 21.87
Preserved Foods and Bacon 7 0.41 0.47 19.15
Butter, Cheese, Condensed Milk and Margarine 1 0.22 0.68 26.00
Sugar and Glucosea 2 0.76 1.31 31.99
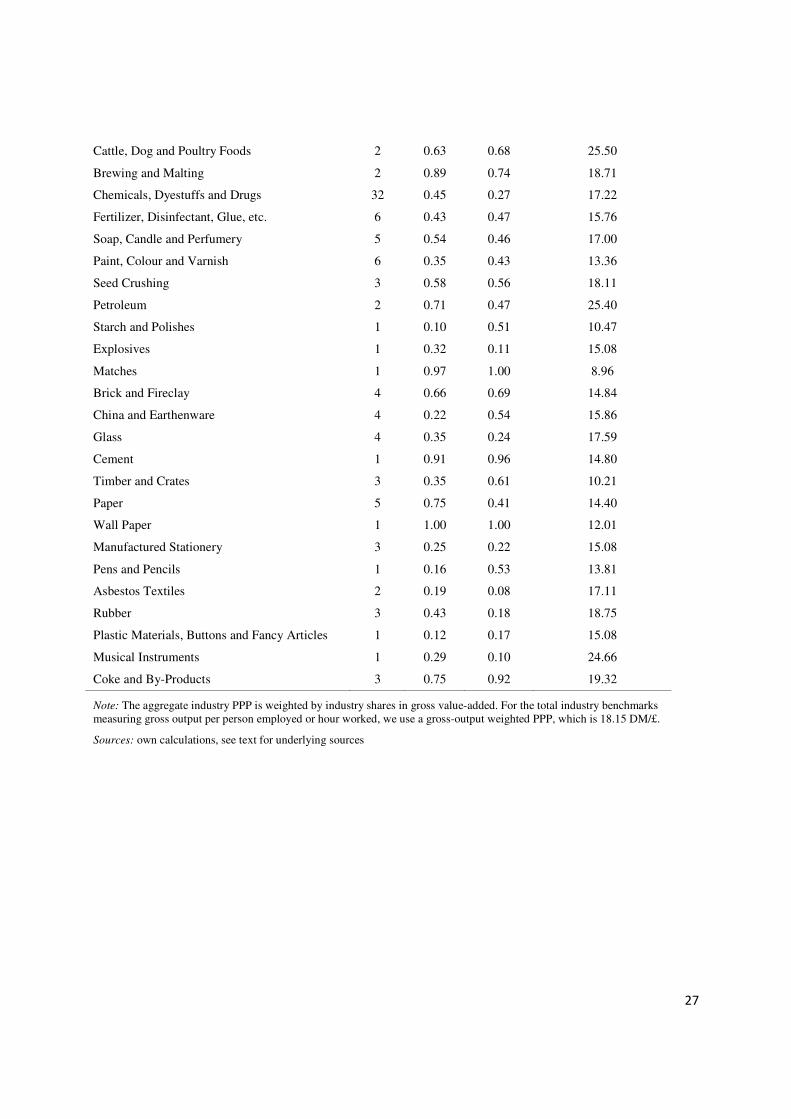
27
Cattle, Dog and Poultry Foods 2 0.63 0.68 25.50
Brewing and Malting 2 0.89 0.74 18.71
Chemicals, Dyestuffs and Drugs 32 0.45 0.27 17.22
Fertilizer, Disinfectant, Glue, etc. 6 0.43 0.47 15.76
Soap, Candle and Perfumery 5 0.54 0.46 17.00
Paint, Colour and Varnish 6 0.35 0.43 13.36
Seed Crushing 3 0.58 0.56 18.11
Petroleum 2 0.71 0.47 25.40
Starch and Polishes 1 0.10 0.51 10.47
Explosives 1 0.32 0.11 15.08
Matches 1 0.97 1.00 8.96
Brick and Fireclay 4 0.66 0.69 14.84
China and Earthenware 4 0.22 0.54 15.86
Glass 4 0.35 0.24 17.59
Cement 1 0.91 0.96 14.80
Timber and Crates 3 0.35 0.61 10.21
Paper 5 0.75 0.41 14.40
Wall Paper 1 1.00 1.00 12.01
Manufactured Stationery 3 0.25 0.22 15.08
Pens and Pencils 1 0.16 0.53 13.81
Asbestos Textiles 2 0.19 0.08 17.11
Rubber 3 0.43 0.18 18.75
Plastic Materials, Buttons and Fancy Articles 1 0.12 0.17 15.08
Musical Instruments 1 0.29 0.10 24.66
Coke and By-Products 3 0.75 0.92 19.32
Note: The aggregate industry PPP is weighted by industry shares in gross value-added. For the total industry benchmarks measuring gross output per person employed or hour worked, we use a gross-output weighted PPP, which is 18.15 DM/£.
Sources: own calculations, see text for underlying sources
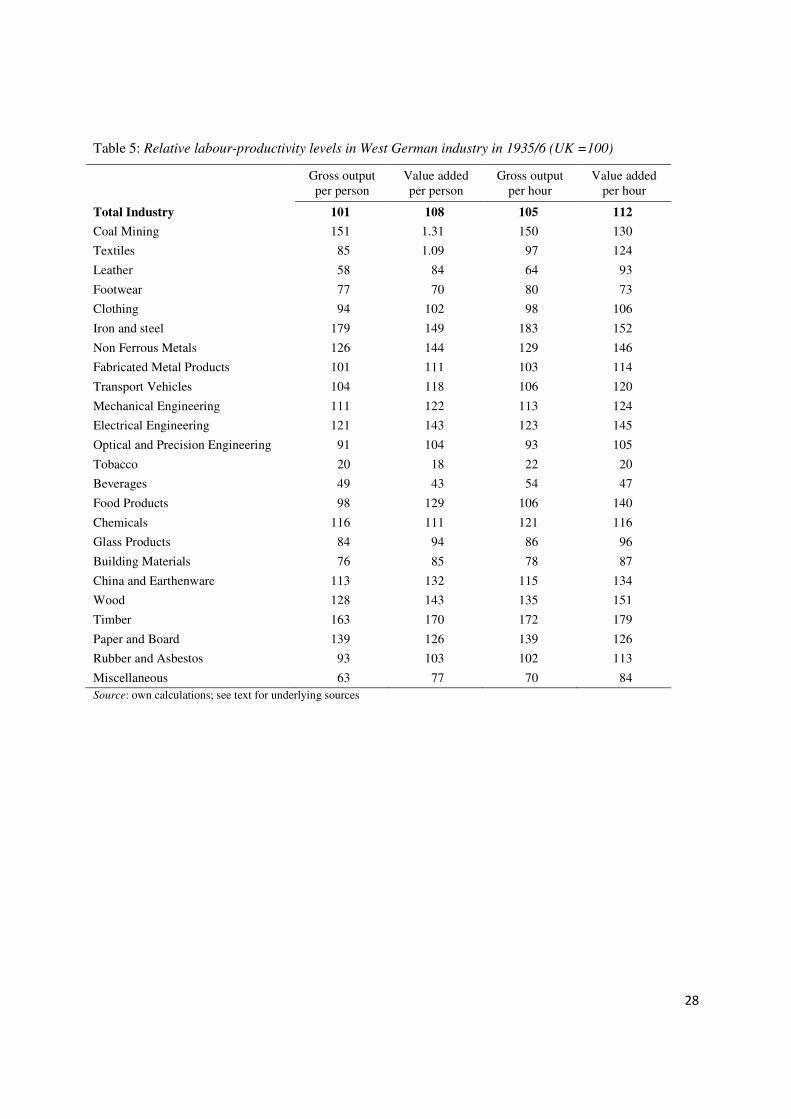
28
Table 5: Relative labour-productivity levels in West German industry in 1935/6 (UK =100)
Gross output per person
Value added per person
Gross output per hour
Value added per hour
Total Industry 101 108 105 112
Coal Mining 151 1.31 150 130
Textiles 85 1.09 97 124
Leather 58 84 64 93
Footwear 77 70 80 73
Clothing 94 102 98 106
Iron and steel 179 149 183 152
Non Ferrous Metals 126 144 129 146
Fabricated Metal Products 101 111 103 114
Transport Vehicles 104 118 106 120
Mechanical Engineering 111 122 113 124
Electrical Engineering 121 143 123 145
Optical and Precision Engineering 91 104 93 105
Tobacco 20 18 22 20
Beverages 49 43 54 47
Food Products 98 129 106 140
Chemicals 116 111 121 116
Glass Products 84 94 86 96
Building Materials 76 85 78 87
China and Earthenware 113 132 115 134
Wood 128 143 135 151
Timber 163 170 172 179
Paper and Board 139 126 139 126
Rubber and Asbestos 93 103 102 113
Miscellaneous 63 77 70 84 Source: own calculations; see text for underlying sources

29
Table 6: Index numbers for employment, value-added and labour productivity in 1951 (1936 = 100)
United Kingdom West Germany
Y L Y/L Y L Y/L
Mining and quarrying 91.8 98.9 92.8 114.3 147.3 77.6
Total manufacturing 147.4 123.5 119.4 129.2 121.0 106.7 Chemicals and allied products 205.6 188.6 109.0 147.0 169.1 86.9
Metal manufacturing 153.8 123.8 124.2 100.4 99.9 100.5
Engineering and vehicles 184.9 170.0 108.8 146.0 141.2 103.5
Textiles, leather & clothing 94.8 90.6 104.6 130.2 127.2 102.4
food, drink and tobacco 133.2 105.0 126.9 121.1 92.1 131.6
other manufacturing 140.8 114.9 122.5 118.9 113.1 105.2
Sources: see text.
Table 7: Alternative labour-productivity estimates for West German industry in 1951 (UK = 100)
Extrapolation Benchmark Error (%)
Mining and quarrying 1.00 0.81 -18.79
Total manufacturing 0.96 0.95 -1.27 Chemicals and allied products 0.87 1.14 26.82
Metal manufacturing 1.04 0.97 -6.86
Engineering and vehicles 1.15 0.88 -26.54
Textiles, leather & clothing 0.99 1.10 11.03
food, drink and tobacco 0.67 0.89 21.35
other manufacturing 0.92 1.09 17.64
Sources: see text.
Table 8: Decomposing aggregate labour-productivity in West German Industry (UK =1)
1935/6 1951
Aggregate labour productivity 1.12 0.86
Industry contributions 1.16 0.91
Residual -0.04 -0.05
Note: labour productivity is measured as industrial value added per hour worked.
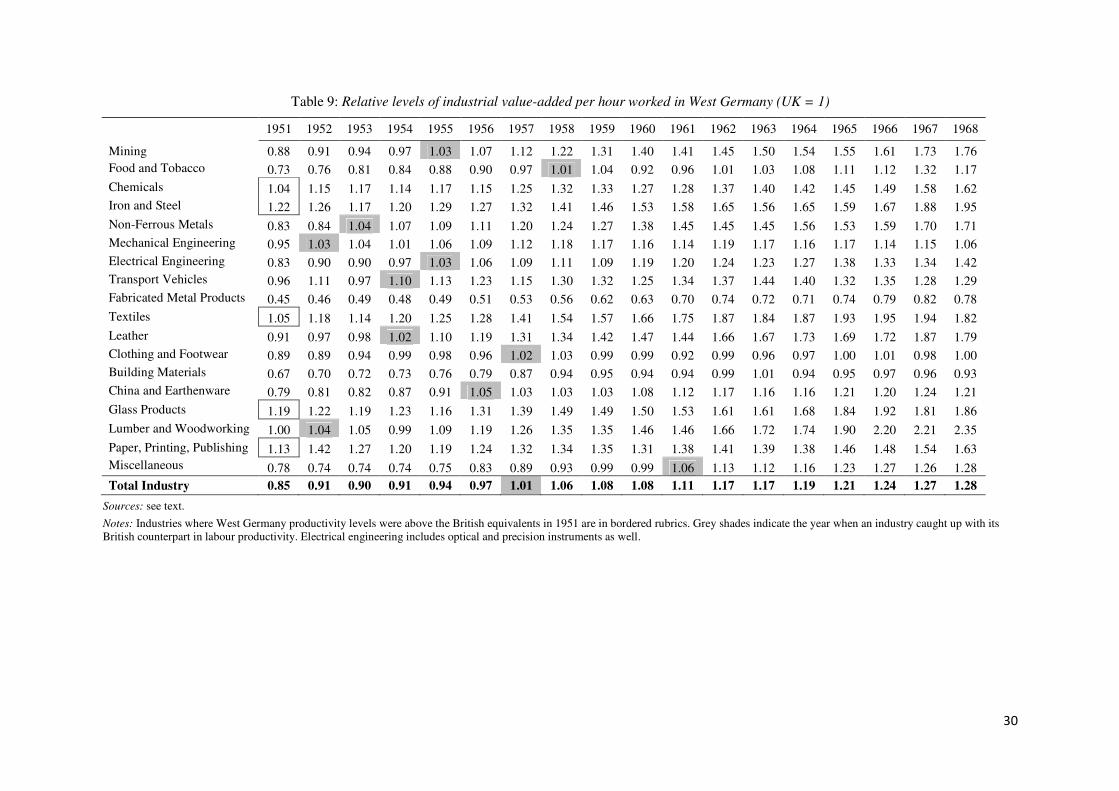
30
Table 9: Relative levels of industrial value-added per hour worked in West Germany (UK = 1)
1951 1952 1953 1954 1955 1956 1957 1958 1959 1960 1961 1962 1963 1964 1965 1966 1967 1968
Mining 0.88 0.91 0.94 0.97 1.03 1.07 1.12 1.22 1.31 1.40 1.41 1.45 1.50 1.54 1.55 1.61 1.73 1.76 Food and Tobacco 0.73 0.76 0.81 0.84 0.88 0.90 0.97 1.01 1.04 0.92 0.96 1.01 1.03 1.08 1.11 1.12 1.32 1.17
Chemicals 1.04 1.15 1.17 1.14 1.17 1.15 1.25 1.32 1.33 1.27 1.28 1.37 1.40 1.42 1.45 1.49 1.58 1.62 Iron and Steel 1.22 1.26 1.17 1.20 1.29 1.27 1.32 1.41 1.46 1.53 1.58 1.65 1.56 1.65 1.59 1.67 1.88 1.95
Non-Ferrous Metals 0.83 0.84 1.04 1.07 1.09 1.11 1.20 1.24 1.27 1.38 1.45 1.45 1.45 1.56 1.53 1.59 1.70 1.71 Mechanical Engineering 0.95 1.03 1.04 1.01 1.06 1.09 1.12 1.18 1.17 1.16 1.14 1.19 1.17 1.16 1.17 1.14 1.15 1.06 Electrical Engineering 0.83 0.90 0.90 0.97 1.03 1.06 1.09 1.11 1.09 1.19 1.20 1.24 1.23 1.27 1.38 1.33 1.34 1.42 Transport Vehicles 0.96 1.11 0.97 1.10 1.13 1.23 1.15 1.30 1.32 1.25 1.34 1.37 1.44 1.40 1.32 1.35 1.28 1.29 Fabricated Metal Products 0.45 0.46 0.49 0.48 0.49 0.51 0.53 0.56 0.62 0.63 0.70 0.74 0.72 0.71 0.74 0.79 0.82 0.78
Textiles 1.05 1.18 1.14 1.20 1.25 1.28 1.41 1.54 1.57 1.66 1.75 1.87 1.84 1.87 1.93 1.95 1.94 1.82
Leather 0.91 0.97 0.98 1.02 1.10 1.19 1.31 1.34 1.42 1.47 1.44 1.66 1.67 1.73 1.69 1.72 1.87 1.79 Clothing and Footwear 0.89 0.89 0.94 0.99 0.98 0.96 1.02 1.03 0.99 0.99 0.92 0.99 0.96 0.97 1.00 1.01 0.98 1.00 Building Materials 0.67 0.70 0.72 0.73 0.76 0.79 0.87 0.94 0.95 0.94 0.94 0.99 1.01 0.94 0.95 0.97 0.96 0.93 China and Earthenware 0.79 0.81 0.82 0.87 0.91 1.05 1.03 1.03 1.03 1.08 1.12 1.17 1.16 1.16 1.21 1.20 1.24 1.21
Glass Products 1.19 1.22 1.19 1.23 1.16 1.31 1.39 1.49 1.49 1.50 1.53 1.61 1.61 1.68 1.84 1.92 1.81 1.86
Lumber and Woodworking 1.00 1.04 1.05 0.99 1.09 1.19 1.26 1.35 1.35 1.46 1.46 1.66 1.72 1.74 1.90 2.20 2.21 2.35
Paper, Printing, Publishing 1.13 1.42 1.27 1.20 1.19 1.24 1.32 1.34 1.35 1.31 1.38 1.41 1.39 1.38 1.46 1.48 1.54 1.63 Miscellaneous 0.78 0.74 0.74 0.74 0.75 0.83 0.89 0.93 0.99 0.99 1.06 1.13 1.12 1.16 1.23 1.27 1.26 1.28
Total Industry 0.85 0.91 0.90 0.91 0.94 0.97 1.01 1.06 1.08 1.08 1.11 1.17 1.17 1.19 1.21 1.24 1.27 1.28
Sources: see text.
Notes: Industries where West Germany productivity levels were above the British equivalents in 1951 are in bordered rubrics. Grey shades indicate the year when an industry caught up with its British counterpart in labour productivity. Electrical engineering includes optical and precision instruments as well.

31
Figure 1: Industry contributions to the aggregate manufacturing labour-productivity gaps
Notes: On the construction of the diagram, see text.
-8 -6 -4 -2 0 2 4 6
Miscellaneous
Food Products
Tobacco
Beverages
Clothing
Textiles
Footwear
Leather
Paper and Board
Timber
Woodwork
China and Earthenware
Glass Products
Building Materials
Rubber and Asbestos
Chemicals
Optical and Precision Engineering
Electrical Engineering
Mechanical Engineering
Transport Vehicles
Fabricated Metal Products
Non Ferrous Metals
Iron and Steel
Coal Mining
1951
1935/6
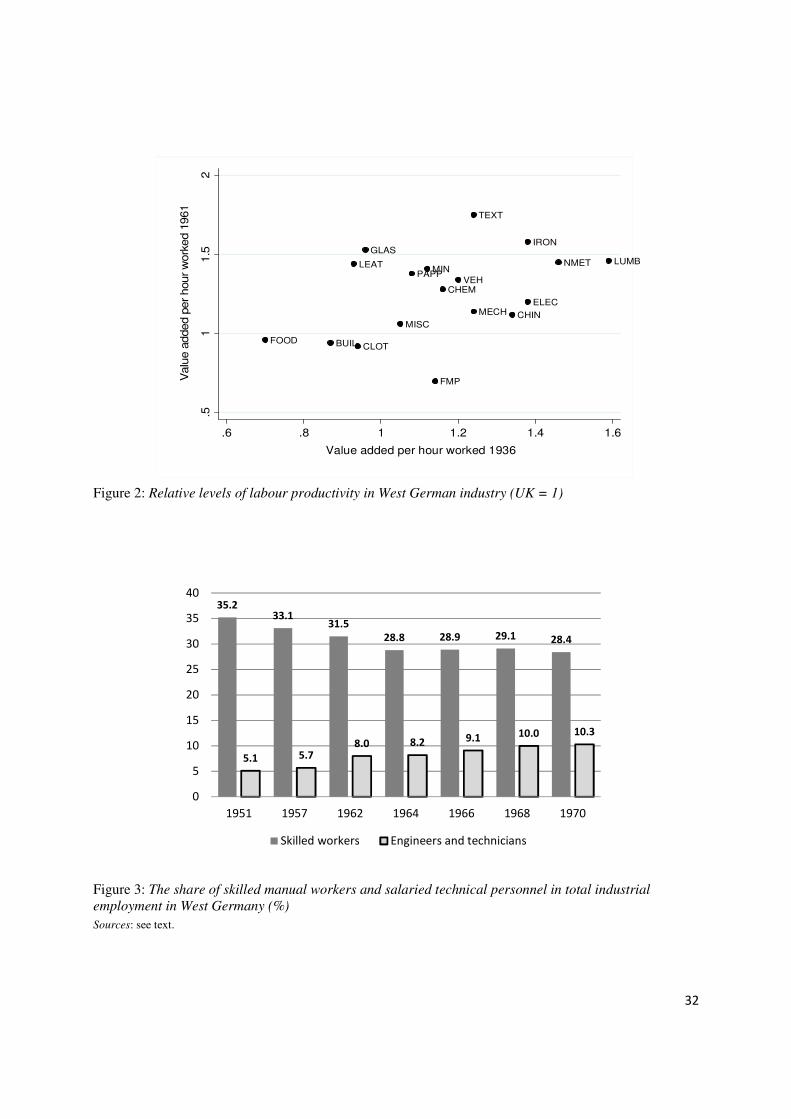
32
Figure 2: Relative levels of labour productivity in West German industry (UK = 1)
Figure 3: The share of skilled manual workers and salaried technical personnel in total industrial
employment in West Germany (%)
Sources: see text.
MIN
FOOD
CHEM
IRON
NMET
MECHELEC
VEH
FMP
TEXT
LEAT
CLOTBUIL
CHIN
GLAS
LUMB
PAPP
MISC
.51
1.5
2
Valu
e a
dded p
er hour w
ork
ed 1
961
.6 .8 1 1.2 1.4 1.6
Value added per hour worked 1936
35.2
33.131.5
28.8 28.9 29.1 28.4
5.1 5.7
8.0 8.29.1
10.0 10.3
0
5
10
15
20
25
30
35
40
1951 1957 1962 1964 1966 1968 1970
Skilled workers Engineers and technicians

33
Appendix Tables A1: The classification of industry branches into industries for 1951
A2: Detailed information on data sources and adjustments to data for the 1951 benchmark
A3: Detailed information on data sources and adjustments to data for the 1935/6 benchmark
A4: The classification of industry branches into industries for 1935/6
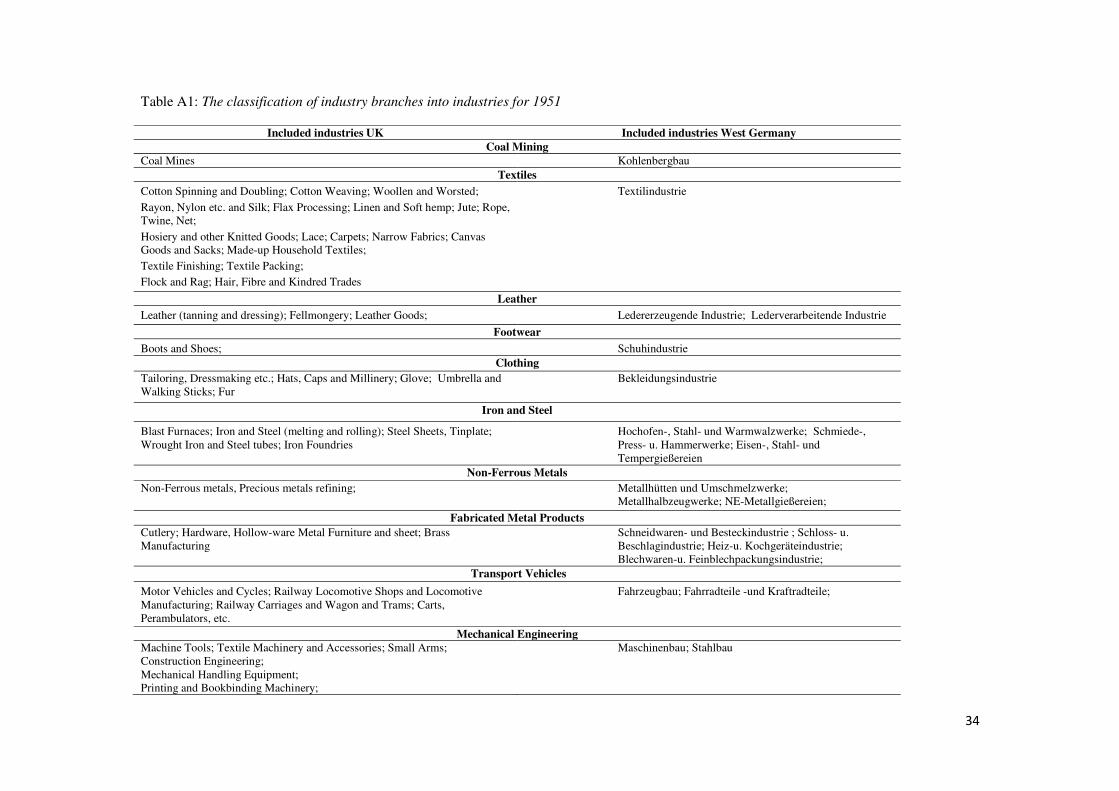
34
Table A1: The classification of industry branches into industries for 1951
Included industries UK Included industries West Germany Coal Mining
Coal Mines Kohlenbergbau Textiles
Cotton Spinning and Doubling; Cotton Weaving; Woollen and Worsted;
Rayon, Nylon etc. and Silk; Flax Processing; Linen and Soft hemp; Jute; Rope, Twine, Net;
Hosiery and other Knitted Goods; Lace; Carpets; Narrow Fabrics; Canvas Goods and Sacks; Made-up Household Textiles;
Textile Finishing; Textile Packing;
Flock and Rag; Hair, Fibre and Kindred Trades
Textilindustrie
Leather Leather (tanning and dressing); Fellmongery; Leather Goods; Ledererzeugende Industrie; Lederverarbeitende Industrie
Footwear Boots and Shoes; Schuhindustrie
Clothing Tailoring, Dressmaking etc.; Hats, Caps and Millinery; Glove; Umbrella and Walking Sticks; Fur
Bekleidungsindustrie
Iron and Steel
Blast Furnaces; Iron and Steel (melting and rolling); Steel Sheets, Tinplate; Wrought Iron and Steel tubes; Iron Foundries
Hochofen-, Stahl- und Warmwalzwerke; Schmiede-, Press- u. Hammerwerke; Eisen-, Stahl- und Tempergießereien
Non-Ferrous Metals Non-Ferrous metals, Precious metals refining; Metallhütten und Umschmelzwerke;
Metallhalbzeugwerke; NE-Metallgießereien;
Fabricated Metal Products Cutlery; Hardware, Hollow-ware Metal Furniture and sheet; Brass Manufacturing
Schneidwaren- und Besteckindustrie ; Schloss- u. Beschlagindustrie; Heiz-u. Kochgeräteindustrie; Blechwaren-u. Feinblechpackungsindustrie;
Transport Vehicles
Motor Vehicles and Cycles; Railway Locomotive Shops and Locomotive Manufacturing; Railway Carriages and Wagon and Trams; Carts, Perambulators, etc.
Fahrzeugbau; Fahrradteile -und Kraftradteile;
Mechanical Engineering Machine Tools; Textile Machinery and Accessories; Small Arms; Construction Engineering; Mechanical Handling Equipment; Printing and Bookbinding Machinery;
Maschinenbau; Stahlbau
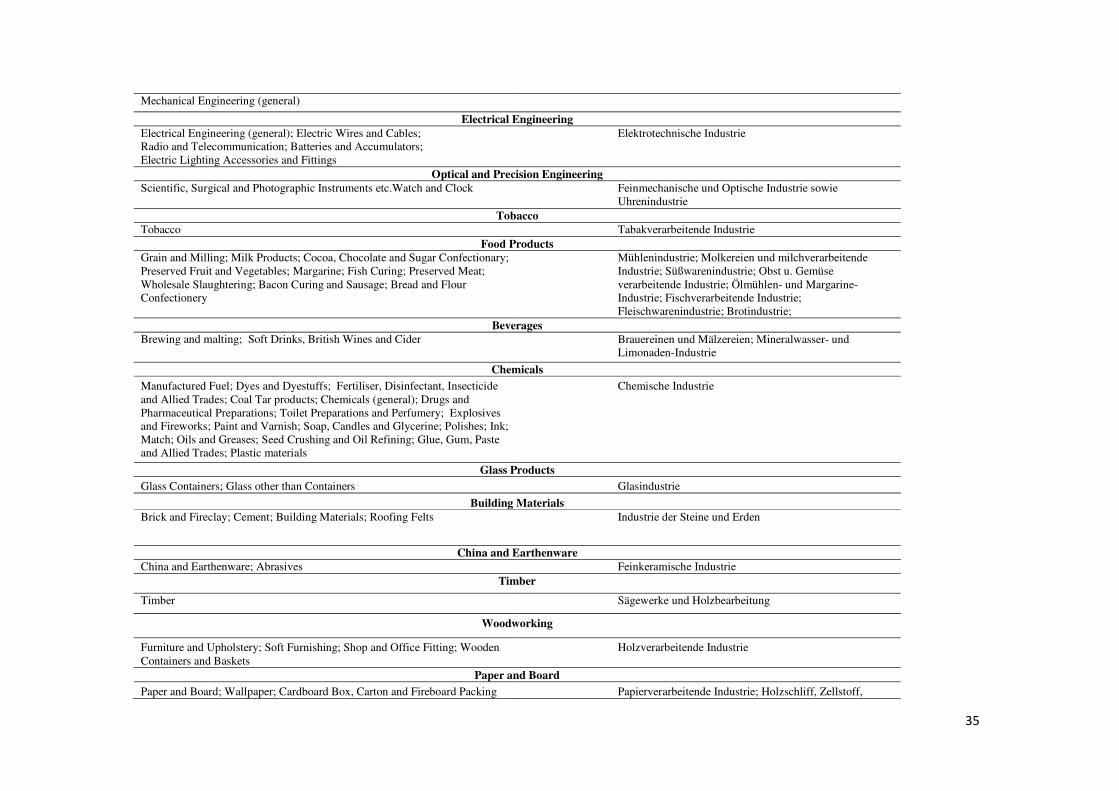
35
Mechanical Engineering (general)
Electrical Engineering Electrical Engineering (general); Electric Wires and Cables; Radio and Telecommunication; Batteries and Accumulators; Electric Lighting Accessories and Fittings
Elektrotechnische Industrie
Optical and Precision Engineering Scientific, Surgical and Photographic Instruments etc.Watch and Clock Feinmechanische und Optische Industrie sowie
Uhrenindustrie Tobacco
Tobacco Tabakverarbeitende Industrie Food Products
Grain and Milling; Milk Products; Cocoa, Chocolate and Sugar Confectionary; Preserved Fruit and Vegetables; Margarine; Fish Curing; Preserved Meat; Wholesale Slaughtering; Bacon Curing and Sausage; Bread and Flour Confectionery
Mühlenindustrie; Molkereien und milchverarbeitende Industrie; Süßwarenindustrie; Obst u. Gemüse verarbeitende Industrie; Ölmühlen- und Margarine-Industrie; Fischverarbeitende Industrie; Fleischwarenindustrie; Brotindustrie;
Beverages Brewing and malting; Soft Drinks, British Wines and Cider Brauereinen und Mälzereien; Mineralwasser- und
Limonaden-Industrie
Chemicals Manufactured Fuel; Dyes and Dyestuffs; Fertiliser, Disinfectant, Insecticide and Allied Trades; Coal Tar products; Chemicals (general); Drugs and Pharmaceutical Preparations; Toilet Preparations and Perfumery; Explosives and Fireworks; Paint and Varnish; Soap, Candles and Glycerine; Polishes; Ink; Match; Oils and Greases; Seed Crushing and Oil Refining; Glue, Gum, Paste and Allied Trades; Plastic materials
Chemische Industrie
Glass Products Glass Containers; Glass other than Containers Glasindustrie
Building Materials Brick and Fireclay; Cement; Building Materials; Roofing Felts Industrie der Steine und Erden
China and Earthenware China and Earthenware; Abrasives Feinkeramische Industrie
Timber
Timber Sägewerke und Holzbearbeitung
Woodworking
Furniture and Upholstery; Soft Furnishing; Shop and Office Fitting; Wooden Containers and Baskets
Holzverarbeitende Industrie
Paper and Board Paper and Board; Wallpaper; Cardboard Box, Carton and Fireboard Packing Papierverarbeitende Industrie; Holzschliff, Zellstoff,

36
Case; Manufactures Stationery, Paper Bag and Kindred Trades Papier und Pappeerzeugung
Rubber and Asbestos Rubber, Asbestos Kautschukverarbeitende und Asbestindustrie
Miscellaneous Musical Instruments; Jewellery and Plat; Linoleum, Leather Cloth and Allied Trades; Brushes and Brooms; Toys and games; Sport Requisites; Miscellaneous Stationer’s Goods; Cinematographic film production; Cinematographic film printing; Plastic Goods and Fancy Articles; Incandescent Mantels
Kunstoffverarbeitende Industrie; Musikinstrumenten-, Turn, und Sportgeräte, Spiel und Schmuckwarenindustrie;
Sources: see text.

37
Table A2: Detailed information on data sources and adjustments to data for the 1951 benchmark
Census description
In the British census, establishments were classified to trades according to the nature of their output. An establishment engaged in multiple activities, e.g. a firm engaged in machine-tool production and casting, was classified to a trade if the principal products of that trade accounted for a greater proportion of the value of its output than did the principal products of any other trade. Offices, warehouses, laboratories and other ancillary places of business, which were separated apart from the producing work, were not regarded as separate establishments, and the persons employed were included on the return for the works. If firms with more than one establishment were unable to make separate returns for each establishment, they were generally allowed to make one return covering all establishments in one trade. In Britain, proprietors employing an average of less than ten people were not required to report detailed returns. However, small firms were required to provide information on the annual average number of male and female workers and the nature of their business. In trades in which the output of small firms was thought to have accounted for a relatively high proportion of the total output, small firms were required to complete a simplified form.
In the German census, firms active in multiple industries were placed in the industry group where the core of their business was, as measured by the number of employees engaged in production. This method of classification differs from the British method, where the value of output was used to locate the core of the business. However, it seems reasonable to expect that these methods will not deviate too much, since output value and employment are highly correlated.a In the German census, the same rule applied: information is provided only for firms that employed at least ten persons. The German census provides no information when there are less than three firms operating in an industry on confidentiality grounds. Data adjustments In a few industries adjustments were needed in order to construct a consistent benchmark. Below the adjustments are in detail explained.
- One problem in the engineering sector is that in the British census most products are quoted in numbers, whereas in the German census products are quoted in tons. Since we have no information on the products, besides a description, we cannot compare these two quantities. To overcome this problem we have used the British trade statistics, in which export is quoted in tons. We deducted five per cent of the value of export, since export process are quoted f.o.b., and we want to use a proxy for ex-factory prices. Comparing tons of machines with tons of machines is still problematic, since we have no information on the quality of products, and machinery is less homogenous than other products in this comparison. Given that there is no other method of comparing that is preferable, we will use this approach. However, caution has to be taken in interpreting these results.
- For musical instruments there was no detailed information for 1951 in the German source, but we were able to use the 1952 data, and extrapolate this to 1951 using trade statistics.
- In the vehicle branch we were not able to match cars, since Britain provides numbers and Germany tons of cars. We were able to match motorcycles and engines. We took the PPP from mechanical engineering as a proxy for the PPP for cars, and weighted this PPP with the motorcycle/engines PPP to obtain a PPP for the whole vehicle branch.
- For footwear and leather we took the weighted average of the footwear and leather branch as a proxy for the PPP in these two branches.
Sources: Trade and Navigation Accounts (1952). Note: a). For the correlation between the net value of production and the
number of employees we obtain a coefficient of 0.83 for Germany and 0.97 for the UK. Both coefficients are significant at the 1
percent level.
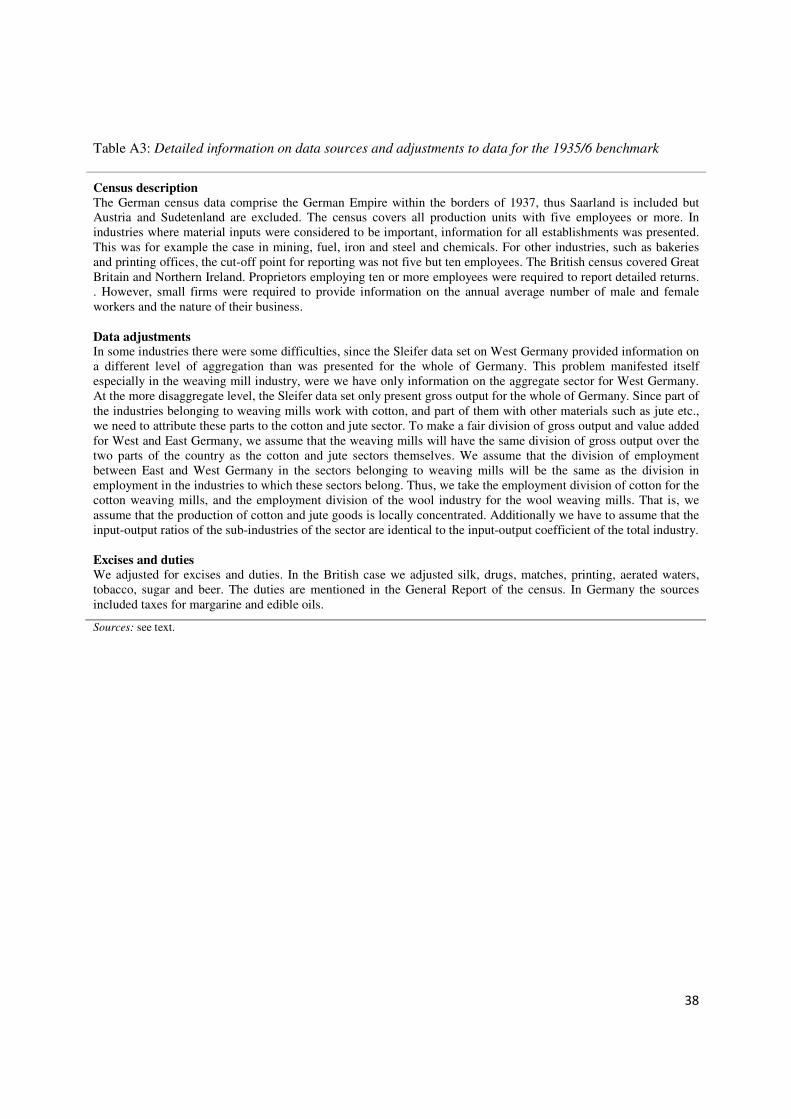
38
Table A3: Detailed information on data sources and adjustments to data for the 1935/6 benchmark
Census description The German census data comprise the German Empire within the borders of 1937, thus Saarland is included but Austria and Sudetenland are excluded. The census covers all production units with five employees or more. In industries where material inputs were considered to be important, information for all establishments was presented. This was for example the case in mining, fuel, iron and steel and chemicals. For other industries, such as bakeries and printing offices, the cut-off point for reporting was not five but ten employees. The British census covered Great Britain and Northern Ireland. Proprietors employing ten or more employees were required to report detailed returns. . However, small firms were required to provide information on the annual average number of male and female workers and the nature of their business. Data adjustments In some industries there were some difficulties, since the Sleifer data set on West Germany provided information on a different level of aggregation than was presented for the whole of Germany. This problem manifested itself especially in the weaving mill industry, were we have only information on the aggregate sector for West Germany. At the more disaggregate level, the Sleifer data set only present gross output for the whole of Germany. Since part of the industries belonging to weaving mills work with cotton, and part of them with other materials such as jute etc., we need to attribute these parts to the cotton and jute sector. To make a fair division of gross output and value added for West and East Germany, we assume that the weaving mills will have the same division of gross output over the two parts of the country as the cotton and jute sectors themselves. We assume that the division of employment between East and West Germany in the sectors belonging to weaving mills will be the same as the division in employment in the industries to which these sectors belong. Thus, we take the employment division of cotton for the cotton weaving mills, and the employment division of the wool industry for the wool weaving mills. That is, we assume that the production of cotton and jute goods is locally concentrated. Additionally we have to assume that the input-output ratios of the sub-industries of the sector are identical to the input-output coefficient of the total industry. Excises and duties We adjusted for excises and duties. In the British case we adjusted silk, drugs, matches, printing, aerated waters, tobacco, sugar and beer. The duties are mentioned in the General Report of the census. In Germany the sources included taxes for margarine and edible oils.
Sources: see text.
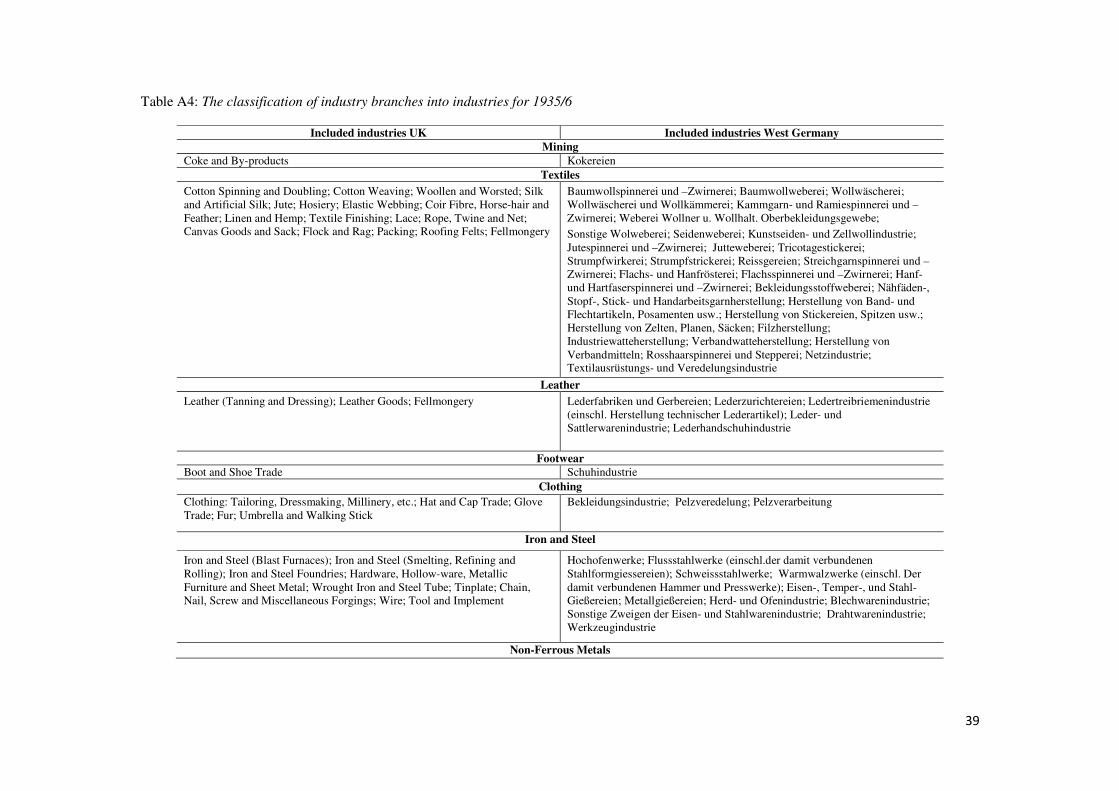
39
Table A4: The classification of industry branches into industries for 1935/6
Included industries UK Included industries West Germany Mining
Coke and By-products Kokereien Textiles
Cotton Spinning and Doubling; Cotton Weaving; Woollen and Worsted; Silk and Artificial Silk; Jute; Hosiery; Elastic Webbing; Coir Fibre, Horse-hair and Feather; Linen and Hemp; Textile Finishing; Lace; Rope, Twine and Net; Canvas Goods and Sack; Flock and Rag; Packing; Roofing Felts; Fellmongery
Baumwollspinnerei und –Zwirnerei; Baumwollweberei; Wollwäscherei; Wollwäscherei und Wollkämmerei; Kammgarn- und Ramiespinnerei und –Zwirnerei; Weberei Wollner u. Wollhalt. Oberbekleidungsgewebe;
Sonstige Wolweberei; Seidenweberei; Kunstseiden- und Zellwollindustrie; Jutespinnerei und –Zwirnerei; Jutteweberei; Tricotagestickerei; Strumpfwirkerei; Strumpfstrickerei; Reissgereien; Streichgarnspinnerei und –Zwirnerei; Flachs- und Hanfrösterei; Flachsspinnerei und –Zwirnerei; Hanf- und Hartfaserspinnerei und –Zwirnerei; Bekleidungsstoffweberei; Nähfäden-, Stopf-, Stick- und Handarbeitsgarnherstellung; Herstellung von Band- und Flechtartikeln, Posamenten usw.; Herstellung von Stickereien, Spitzen usw.; Herstellung von Zelten, Planen, Säcken; Filzherstellung; Industriewatteherstellung; Verbandwatteherstellung; Herstellung von Verbandmitteln; Rosshaarspinnerei und Stepperei; Netzindustrie; Textilausrüstungs- und Veredelungsindustrie
Leather Leather (Tanning and Dressing); Leather Goods; Fellmongery Lederfabriken und Gerbereien; Lederzurichtereien; Ledertreibriemenindustrie
(einschl. Herstellung technischer Lederartikel); Leder- und Sattlerwarenindustrie; Lederhandschuhindustrie
Footwear
Boot and Shoe Trade Schuhindustrie Clothing
Clothing: Tailoring, Dressmaking, Millinery, etc.; Hat and Cap Trade; Glove Trade; Fur; Umbrella and Walking Stick
Bekleidungsindustrie; Pelzveredelung; Pelzverarbeitung
Iron and Steel
Iron and Steel (Blast Furnaces); Iron and Steel (Smelting, Refining and Rolling); Iron and Steel Foundries; Hardware, Hollow-ware, Metallic Furniture and Sheet Metal; Wrought Iron and Steel Tube; Tinplate; Chain, Nail, Screw and Miscellaneous Forgings; Wire; Tool and Implement
Hochofenwerke; Flussstahlwerke (einschl.der damit verbundenen Stahlformgiessereien); Schweissstahlwerke; Warmwalzwerke (einschl. Der damit verbundenen Hammer und Presswerke); Eisen-, Temper-, und Stahl-Gießereien; Metallgießereien; Herd- und Ofenindustrie; Blechwarenindustrie; Sonstige Zweigen der Eisen- und Stahlwarenindustrie; Drahtwarenindustrie; Werkzeugindustrie
Non-Ferrous Metals

40
Aluminium, Lead, Tin, etc. (Smelting, Rolling, etc.); Gold and Silver Refining; Finished Brass; Plate and Jewellery)
Kupfer-, Blei- und Silberhütten; Kupferraffinerien und –Elektrolysen; Gold und Silberscheideanstalten; Zinkhütten; Zinkhütten und Entzinnungsanstalten; Tonerfabriken; Aluminiumhütten; Gewinnung von Nickel und Kobalt; Gewinnung von Wolfram, Molybdän u. anderen Metallbau; Herstellung von Ferrolegierungen, Elektrokorund, Karborund; Walz-,Press-und Hammerwerke der Nichteisenmetallindustrie; Herstellung von Warmpressteilen der Nichteisenmetallindustrie; Metallschmelzereien; Edelmetall- und Schmuckwarenindustrie
Fabricated Metal Products Cutlery Feine Schneidewarenindustrie (einschl. Schlägeindustrie)
Vehicles Motor and Cycle Kraftfahrzeugindustrie; Herstellung von Kraftfahrzeuganhängern und
Kraftfahrzeugaufbauten; Fahrradindustrie und Herstellung von Kinderwagen; Fahrzeugteileindustrie
Mechanical Engineering Mechanical Engineering
Werkzeugmaschinenindustrie; Textilmaschinenindustrie; Herstellung von Maschinen für das Bekleidungsgewerbe; Landmaschinenindustrie; Herstellung von Maschinen und Apparaten für die Papierherstellung, Papierverarbeitung und für das graphische Gewerbe; Büromaschinenindustrie; Herstellung von Maschinen und Apparaten für Müllerei, Nahrungsmittel- und Genussmittelindustrie u.ä.; Armaturenindustrie; Sonstiger Maschinenbau; Kessel-und Apparatebau
Electrical Engineering Electrical Engineering
Herstellung von elektrischen Maschinen Apparaten und Zubehör der Stark- und Schwachstromindustrie; Kabelindustrie; Elektrokohleindustrie; Batterie- und Elementen Industrie; Akkumulatoren Industrie; Glühlampen- und Leuchtröhrenindustrie;
Optical and Precision Engineering Scientific Instruments, Appliances and Apparatus; Watch and Clock
Optische, fein- und medizinmechanischeindustrie; Herstellung von orthopädischen Erzeugnissen und hygienischen Bandagen; Grossuhrenindustrie; Taschen- und Armbanduhrenindustrie; Photographische Industrie
Railways Railway Carriage and Wagon Building;Carriage Cart and Wagon Waggonbau; Feld- und Werkbahnwagenbau
Tobacco Tobacco Tabakindustrie
Food Grain Milling; Bread Cakes, etc.,; Biscuit; Cocoa and Sugar Confectionary; Preserved Foods; Bacon Curing and Sausage; Butter, Cheese, Condensed Milk and Margarine; Sugar and Glucose; Cattle Dog and Poultry Foods; Fish Curing
Getreidemüllerei; Schälmühlen; Brodindustrie und Bäckereien; Süßwarenindustrie; Teigwarenindustrie; Fleischwarenindustrie; Obst- und Gemüsekonservenindustrie; Herstellung von Rheinischkraut; Obstsaft- und Fruchtweinindustrie; Senfindustrie; Gewürzindustrie; Kartoffeltrocknerei; Nährmittelindustrie; Kaffee-Ersatz-Industrie; Dauermilchindustrie;
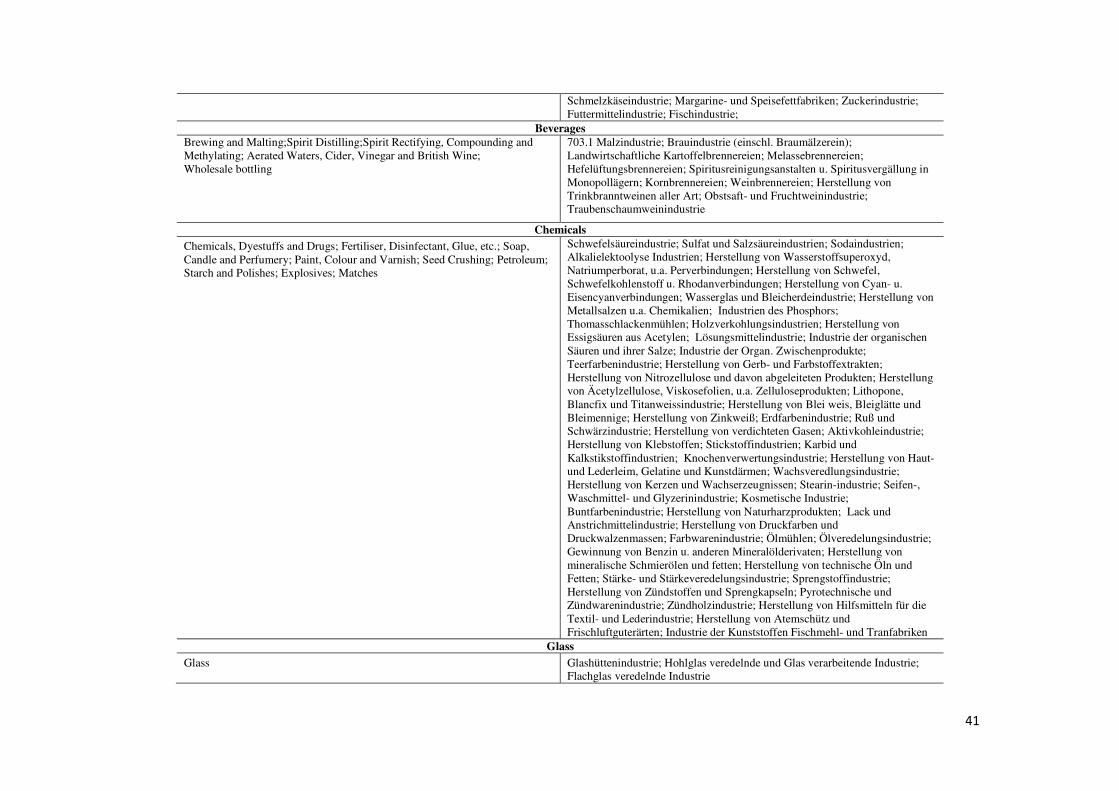
41
Schmelzkäseindustrie; Margarine- und Speisefettfabriken; Zuckerindustrie; Futtermittelindustrie; Fischindustrie;
Beverages Brewing and Malting;Spirit Distilling;Spirit Rectifying, Compounding and Methylating; Aerated Waters, Cider, Vinegar and British Wine; Wholesale bottling
703.1 Malzindustrie; Brauindustrie (einschl. Braumälzerein); Landwirtschaftliche Kartoffelbrennereien; Melassebrennereien; Hefelüftungsbrennereien; Spiritusreinigungsanstalten u. Spiritusvergällung in Monopollägern; Kornbrennereien; Weinbrennereien; Herstellung von Trinkbranntweinen aller Art; Obstsaft- und Fruchtweinindustrie; Traubenschaumweinindustrie
Chemicals Chemicals, Dyestuffs and Drugs; Fertiliser, Disinfectant, Glue, etc.; Soap, Candle and Perfumery; Paint, Colour and Varnish; Seed Crushing; Petroleum; Starch and Polishes; Explosives; Matches
Schwefelsäureindustrie; Sulfat und Salzsäureindustrien; Sodaindustrien; Alkalielektoolyse Industrien; Herstellung von Wasserstoffsuperoxyd, Natriumperborat, u.a. Perverbindungen; Herstellung von Schwefel, Schwefelkohlenstoff u. Rhodanverbindungen; Herstellung von Cyan- u. Eisencyanverbindungen; Wasserglas und Bleicherdeindustrie; Herstellung von Metallsalzen u.a. Chemikalien; Industrien des Phosphors; Thomasschlackenmühlen; Holzverkohlungsindustrien; Herstellung von Essigsäuren aus Acetylen; Lösungsmittelindustrie; Industrie der organischen Säuren und ihrer Salze; Industrie der Organ. Zwischenprodukte; Teerfarbenindustrie; Herstellung von Gerb- und Farbstoffextrakten; Herstellung von Nitrozellulose und davon abgeleiteten Produkten; Herstellung von Äcetylzellulose, Viskosefolien, u.a. Zelluloseprodukten; Lithopone, Blancfix und Titanweissindustrie; Herstellung von Blei weis, Bleiglätte und Bleimennige; Herstellung von Zinkweiß; Erdfarbenindustrie; Ruß und Schwärzindustrie; Herstellung von verdichteten Gasen; Aktivkohleindustrie; Herstellung von Klebstoffen; Stickstoffindustrien; Karbid und Kalkstikstoffindustrien; Knochenverwertungsindustrie; Herstellung von Haut- und Lederleim, Gelatine und Kunstdärmen; Wachsveredlungsindustrie; Herstellung von Kerzen und Wachserzeugnissen; Stearin-industrie; Seifen-, Waschmittel- und Glyzerinindustrie; Kosmetische Industrie; Buntfarbenindustrie; Herstellung von Naturharzprodukten; Lack und Anstrichmittelindustrie; Herstellung von Druckfarben und Druckwalzenmassen; Farbwarenindustrie; Ölmühlen; Ölveredelungsindustrie; Gewinnung von Benzin u. anderen Mineralölderivaten; Herstellung von mineralische Schmierölen und fetten; Herstellung von technische Öln und Fetten; Stärke- und Stärkeveredelungsindustrie; Sprengstoffindustrie; Herstellung von Zündstoffen und Sprengkapseln; Pyrotechnische und Zündwarenindustrie; Zündholzindustrie; Herstellung von Hilfsmitteln für die Textil- und Lederindustrie; Herstellung von Atemschütz und Frischluftguterärten; Industrie der Kunststoffen Fischmehl- und Tranfabriken
Glass Glass Glashüttenindustrie; Hohlglas veredelnde und Glas verarbeitende Industrie;
Flachglas veredelnde Industrie
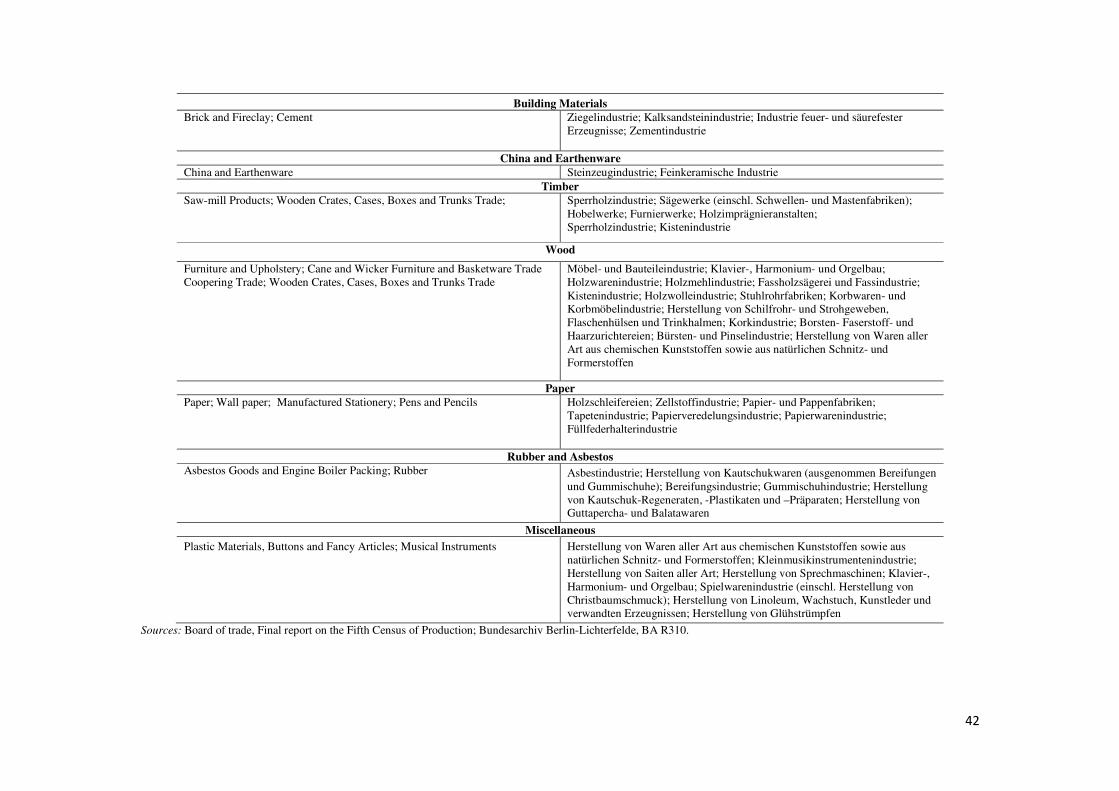
42
Building Materials Brick and Fireclay; Cement
Ziegelindustrie; Kalksandsteinindustrie; Industrie feuer- und säurefester Erzeugnisse; Zementindustrie
China and Earthenware China and Earthenware Steinzeugindustrie; Feinkeramische Industrie
Timber Saw-mill Products; Wooden Crates, Cases, Boxes and Trunks Trade;
Sperrholzindustrie; Sägewerke (einschl. Schwellen- und Mastenfabriken); Hobelwerke; Furnierwerke; Holzimprägnieranstalten; Sperrholzindustrie; Kistenindustrie
Wood
Furniture and Upholstery; Cane and Wicker Furniture and Basketware Trade Coopering Trade; Wooden Crates, Cases, Boxes and Trunks Trade
Möbel- und Bauteileindustrie; Klavier-, Harmonium- und Orgelbau; Holzwarenindustrie; Holzmehlindustrie; Fassholzsägerei und Fassindustrie; Kistenindustrie; Holzwolleindustrie; Stuhlrohrfabriken; Korbwaren- und Korbmöbelindustrie; Herstellung von Schilfrohr- und Strohgeweben, Flaschenhülsen und Trinkhalmen; Korkindustrie; Borsten- Faserstoff- und Haarzurichtereien; Bürsten- und Pinselindustrie; Herstellung von Waren aller Art aus chemischen Kunststoffen sowie aus natürlichen Schnitz- und Formerstoffen
Paper Paper; Wall paper; Manufactured Stationery; Pens and Pencils
Holzschleifereien; Zellstoffindustrie; Papier- und Pappenfabriken; Tapetenindustrie; Papierveredelungsindustrie; Papierwarenindustrie; Füllfederhalterindustrie
Rubber and Asbestos Asbestos Goods and Engine Boiler Packing; Rubber Asbestindustrie; Herstellung von Kautschukwaren (ausgenommen Bereifungen
und Gummischuhe); Bereifungsindustrie; Gummischuhindustrie; Herstellung von Kautschuk-Regeneraten, -Plastikaten und –Präparaten; Herstellung von Guttapercha- und Balatawaren
Miscellaneous Plastic Materials, Buttons and Fancy Articles; Musical Instruments Herstellung von Waren aller Art aus chemischen Kunststoffen sowie aus
natürlichen Schnitz- und Formerstoffen; Kleinmusikinstrumentenindustrie; Herstellung von Saiten aller Art; Herstellung von Sprechmaschinen; Klavier-, Harmonium- und Orgelbau; Spielwarenindustrie (einschl. Herstellung von Christbaumschmuck); Herstellung von Linoleum, Wachstuch, Kunstleder und verwandten Erzeugnissen; Herstellung von Glühstrümpfen
Sources: Board of trade, Final report on the Fifth Census of Production; Bundesarchiv Berlin-Lichterfelde, BA R310.

43