Embed Size (px)
Citation preview

Education
Winning by degrees: the strategies of highly productive higher-education institutions
Acknowledgements
Many have made the case for increasing degree production in the United States, both to ensure economic prosperity and also as a way to address the cycle of poverty and inequity plaguing some communities. This paper presents the findings of an investigation by McKinsey & Company’s Education Practice into degree productivity in higher education as a potential approach for achieving greater degree production in a time of constrained budgets. The aim of this paper is: to provide a snapshot of current levels of productivity in all U.S. higher education institutions; to understand in detail the most important drivers of productivity in a sample of eight of the most productive institutions; and to suggest approaches to incorporating those drivers across the higher education system.
We owe a huge debt of gratitude to the many colleagues at our profiled eight institutions who welcomed us to their Campus, generously gave of their time and knowledge and kindly trusted us with their proprietary datasets.
�� Brigham�Young�University–Idaho:�President Kim B. Clark, Henry J. Eyring, Scott J. Bergstrom, Larry H. Rigby, Robert J. Garrett, Robert I. Eaton, Betty A. Oldham, Amy LaBaugh
�� DeVry�University: President David Pauldine, Joe Cantoni, Jerry Murphy, Kerry Kopera, Donna Loraine
�� Indiana�Wesleyan�University–College�of�Adult�&�Professional�Studies:�President Henry Smith, Douglas P. Clark, Gail Whitenack, Audrey Hahn, Sue Melton, Bridget Aitchison, Duane Kilty, David Wright
�� Rio�Salado�College:�President Chris Bustamante, Todd Simmons, Vernon Smith, Kishia Brock, Dana Reid, Edward Kelty, Elizabeth Moody, Devi Bala, David Sweeley, Genevieve Winters, Adam Lange
�� Southern�New�Hampshire�University: President Paul LeBlanc, Bill McGarry, Patty Lynott, Amelia Manning, Timothy Dreyer, Ray Prouty, Darrell Krook, Heather Lorenz

�� Tennessee�Technology�Centers:�Vice Chancellor James King, Chelle Travis, Greg Shutz, Lily Hsu
�� Valencia�Community�College:�President Sandy Shugart, Keith Houck, Kaye Walter, Linda Downing, Joyce Romano
�� Western�Governors�University:�President Bob Mendenhall, David Grow, Jim Schnitz, Greg Waddoups, Amy Fulton, Heather Chapman
We are equally indebted to working partners at the two state systems who provided us with state datasets, spent numerous hours with us discussing the systems and findings. These partners have chosen to remain anonymous.
Our Steering Committee provided significant input; our thanks to Bill Massy, Charles Hatcher, Carol Twigg, Dennis Jones, Jane Wellman, Kevin Corcoran, Mitchell Stevens, Mark Schneider, Michael Kirst, Nate Johnson, and Harrison Keller. Their collective guidance and diverse perspectives on educational achievement were critical throughout the project.
In addition, numerous experts on higher education—including David Longanecker, Pat Callan, Mike McPherson, Kevin Carey, Lucie Lapovsky, Joel Meyerson, Steve Shank, Linda Thor, Scott Pattison, Stan Jones, Anne Neal, Paul Schroeder, David Gardner, Art Hauptman, Richard Rhodes, Patrick Kelly, Christopher Mullin and Charles Kolb—provided their time and invaluable insights to the team.
The authors wish to deeply thank our colleagues Lenny Mendonca, Matt Miller, Paul Arnold, Eugine Chung, Ying Shi and Chris Crittenden for their significant contributions to this report.
This report is based on research co-funded by the Bill & Melinda Gates Foundation and McKinsey & Company. This work is part of the fulfillment of McKinsey’s social sector mission to help leaders and leading institutions to understand and address important and complex societal challenges. As with all McKinsey research, results and conclusions are those of the authors, and are based on the approach and experience base that McKinsey brings to bear.


Winning by degrees: the strategies of highly productive higher-education institutions
November 2010
Byron G. AugusteAdam CotaKartik JayaramMartha C. A. Laboissière

6
EducationWinning by degrees: the strategies of highly productive higher-education institutions 7
College attainment rates are rising in almost every industrialized country. In the United States, however, they have remained relatively flat for the past ten years, even though completing a college degree has become increasingly critical to a person’s life chances. Producing more college-educated workers is similarly critical to the nation’s overall economic growth and prosperity. Based on recent research,1 we estimate the United States needs to produce roughly one million more graduates a year by 2020—about 40 percent more than today—to ensure the country has the skilled workers it needs. Reaching this goal would mean increasing today’s annual output of associate and bachelor’s degree-holders by about 3.5 percent a year for the next decade.
If the United States wants to hold its position in the global economy and preserve the living standards of its citizens, reaching this goal is key. How can it be achieved? One answer would be to spend substantially more on higher education. But states have been spending less on higher education in recent years and today’s economic and fiscal circumstances make a spending increase unlikely. An alternative is to produce more graduates for the same investment without compromising educational quality or restricting access to higher education2 —in other words, to improve productivity in higher education’s core process of transforming freshmen into
degree-holders. This report explores such “degree productivity” improvement.
Educational experts have long been interested in degree productivity. So far, however, no consensus has emerged on its critical drivers. Candidates include tying funding to completing a degree, promoting administrative efficiencies, improving developmental education,3 refining transfer policies to allow for easy transition between institutions, and increasing reliance on part-time faculty. But uncertainty remains about the impact of each contending driver on degree productivity and their relative importance.
To advance this dialogue, McKinsey’s Education Practice has assessed the operational drivers of degree productivity from three angles. We began by synthesizing existing research on degree productivity. At the same time, using the simplified yardstick of cost per degree completed,4 we analyzed system-wide datasets5 to form a broad view of degree productivity across America’s higher education landscape. We then conducted detailed studies of eight high-performing institutions to understand what makes them so productive. We focused on two-year associate-granting institutions and four-year bachelor’s-granting institutions with open-access or less competitive admissions policies since these are the primary educators of low-income young
Executive Summary
1 Anthony P. Carnevale, Nicole Smith, and Jeff Strohl, “Help wanted: Projection of jobs and education requirements through 2018,” Georgetown
University, Center on Education and the Workforce, 2010.
2 While educational quality is difficult to measure, for the purpose of this report we rely on available evidence and proxies including graduation rates,
student satisfaction surveys, staff surveys, scores on credentialing exams, credit default rates, and general reputation.
3 Developmental education programs serve students who enter college below “college ready” standards to improve their proficiency in needed skills.
4 Cost per degree completed has two key determinants: completion efficiency and cost efficiency. Completion efficiency is defined by the ratio of students
a school enrolls (measured in full-time student equivalents or FTSEs) to the number of degrees it awards. A low FTSE/degree ratio means a completion
efficient system, that is, one in which enrolled students have a high chance of gaining a degree. Cost efficiency is defined by an institution’s total cost
divided by the number of FTSEs. A low cost/FTSE ratio means a more cost efficient system, that is, one in which more students can be served with a given
set of resources.
5 Including the Integrated Post-secondary Education Data Systems (IPEDS) national dataset and state longitudinal databases from two states
8
adults, together accounting for 51 percent of enrolled students nationwide. Combining findings from these three research angles enabled us to break higher education degree productivity into its component parts, identify some of the most powerful drivers, and quantify their effects across these institutions.
We found no “silver bullet” driver that could by itself dramatically improve productivity for each degree delivered. Rather, we found a set of five practices that appear to raise degree productivity in these institutions without reducing quality or restricting access.
� The first two practices, (i) systematically enabling students to reach graduation (ii) reducing nonproductive credits, contribute to raising the rate at which students complete their degrees.
� The next three practices, (iii) redesigning the delivery of instruction, (iv) redesigning core support services, and (v) optimizing non-core services and other operations, contribute to reducing cost per student.
Overall, we find that a college’s degree productivity depends critically on the relationship between the proportion of its students who complete their degrees and its total costs. The impact of these five strategies on productivity suggests that if they were more widely applied to a bigger student population, the nation could produce a million more degrees by 2020 within today’s education spending limits.
The challenge: improve productivity in the United States higher education system by approximately 23 percent
To produce one million more graduates a year by 2020 at today’s levels of degree productivity, the United States would have to increase educational funding by $52 billion a year from its 2008 level of $301 billion.6 Such a funding increase is highly unlikely: revenue shortfalls led 42 states to cut higher education budgets in FY09 or FY10, and 31 states are planning additional cuts in FY11.7 State funding per student had recovered briefly from cuts made between 2002 and 2005,8 but the latest cuts are eroding it again.
To plug spending gaps, many states have increased student tuition fees, which rose by 439 percent between 1985 and 2005, compared to rises in the Consumer Price Index and the Health Care Index over the same period of 108 percent and 251 percent respectively.9 Partly as a consequence, student loan debt and default rates are increasing. These trends threaten both access to and demand for higher education.
Expert projections suggest that pressures on student, state, and federal10 budgets are unlikely to relax soon. Therefore the only realistic way to generate enough graduates within existing state and student financial constraints is to produce more graduates without increases to public funds or tuition per student and without compromising the quality of degrees awarded or reducing access—in short, to increase higher-education degree productivity.
6 Calculated at 2008 dollars.
7 National Association of State Budget Officers and National Governors Association, Fiscal Survey of the States, Washington, DC (June, 2010); State higher
education finance FY2009, State Higher Education Executive Officers, 2010.
8 See “Trends in higher education spending” by the Delta Cost Project for more on this topic.
9 “Is college still worth the price?” April 13, 2009 (http://money.cnn.com/2008/08/20/pf/college/college_price.moneymag/); and The College Board,
Trends in College Pricing 2009; Annual Survey of Colleges.
10 “Findings of biannual fiscal survey show states lag behind national economic recovery,” National Governor’s Association News Release, June 03, 2010;
and Elizabeth McNichol, Phil Oliff, and Nicholas Johnson., “States continue to feel recession’s impact”, Center for Budget and Policy Priorities, October
7, 2010; Conor Dougherty and Sara Murray, “Lost decade for family income,” The Wall Street Journal, September 17, 2010. “Federal spending target of 21
percent of GDP not appropriate benchmark for deficit- reduction efforts,” Center for Budget and Public Policy, July 28, 2010.
T he country’s economic needs and ethos of opportunity also demand we do more with the resources we have, not do the same with less.
EducationWinning by degrees: the strategies of highly productive higher-education institutions 9
Our calculations show that achieving the 2020 graduate goal without increasing public funding implies an improvement in average degree productivity of approximately 15 percent to 34 percent, depending on which institutions and credentials see improvement, to give an overall average improvement of 23 percent.11 This calculation is based on a scenario in which total tuition revenue scales with enrollment.
It is important to note that while this report makes the case for lowering the cost per degree in higher education, its findings do not support cutting overall funding. Not only would funding cuts make reaching the one million goal even harder; the country’s economic needs and ethos of opportunity also demand we do more with the resources we have, not do the same with less.
Productive US institutions show that 23 percent improvement in higher education productivity by 2020 is achievable
Many different types of institution make up the diverse universe of U.S. higher education: four-year, two-year, and technical colleges; public, private for-profit, and private nonprofits; rural and urban colleges; unionized and nonunionized faculty and staff. Taking the national datasets, we classified all the institutions in the system into 12 peer groups,12 then divided the members of each peer group into quartiles according to their degree productivity.
Institutions in the top quartiles of each peer group are already delivering graduates at levels of degree productivity ranging from 17 percent to 38 percent better than their peer group average, even when differences in the top-quartile members’ missions, extent of student selection, proportion of transfer students, and other student characteristics that may influence their degree productivity are taken into account.13 On average across peer groups, the top performing competitive bachelor’s- and associate-granting institutions are 23 percent and 22 percent respectively more productive than their group average. This level of variation suggests that a 23 percent improvement in degree productivity across the system is feasible.
Our subsequent research focused on finding out what institutions in the top quartile of associate-granting and less selective bachelor-granting institutions are doing to achieve their better rates of degree productivity and which of their practices other institutions may be able to emulate.
We found that all the institutions in the top-performing quartiles achieve greater degree productivity by focusing on strategies to improve rates of degree completion and increasing cost efficiency. However, different types of institution place a different emphasis on each type of strategy and no institution emphasized all of them. On average, four-year institutions in the top quartile have improved productivity most by improving cost efficiency. They educate students at a cost per degree 23 percent lower than their peer average, of which 16 percentage
11 If the $52 billion costs are shared across the whole higher education community, achieving the goal of a million extra students from a base of $301 billion
would require a 15 percent improvement in productivity across the whole spectrum; if costs are shared by associate and bachelor capacity only (base
of $190 billion), these institutions need to improve productivity by 21 percent; and if costs are shared by by all associates and bachelors capacity from
institutions with open access and “competitive” admissions policies, these institutions need to improve productivity by 34 percent. Averaging these three
scenarios results in a required productivity improvement of 23 percent.
12 Peer groups were defined according to Carnegie’s classification (research or doctoral; bachelor’s or master’s; associates), Barron’s admissions
competitiveness criterion (most or highly competitive; very competitive; competitive or less / non-competitive), these 12 peer groups were further divided
into subgroups for some analyses based on the proportion of transfer students, proportion of African American student, proportion of students receiving
federal aid, and proportion of degree-seeking students.
13 Using IPEDS data.
10
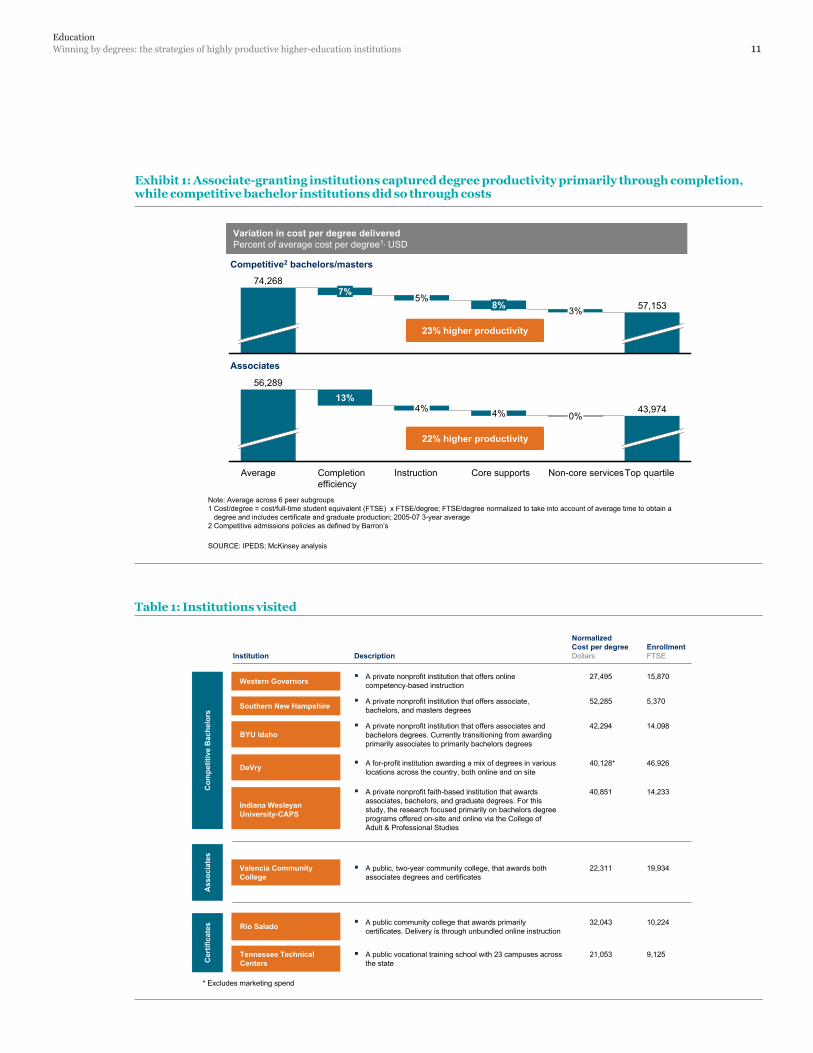
points derive from better cost efficiency and 7 from higher completion rates. In contrast, two-year institutions in the top-performing quartile attain most of their greater degree productivity through higher rates of completion: they produce degrees at a 22 percent lower cost than their group average, of which 14 percentage points derive from higher completion rates and 8 points derive from improved cost efficiency. Together, better completion rates and greater cost efficiency account for roughly 70 and 60 percent of the degree productivity improvements captured by the four-year and two-year best practice institutions, respectively (Exhibit 1).
High-performing institutions are achieving degree productivity up to 60 percent better than their peer group average
To assess what highly productive institutions are doing to raise their rates of degree completion and improve cost efficiency, we partnered with eight highly productive institutions from different parts of the learning spectrum, each selected for their track record in degree productivity and for quality (Table 1).
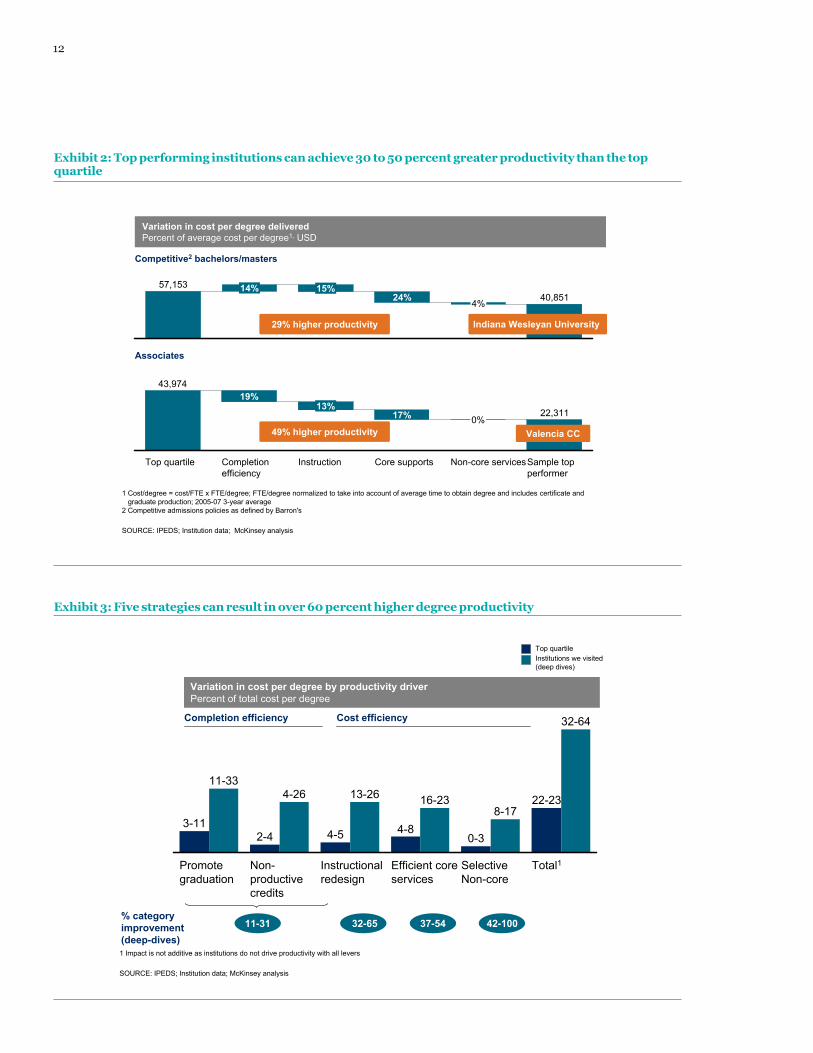
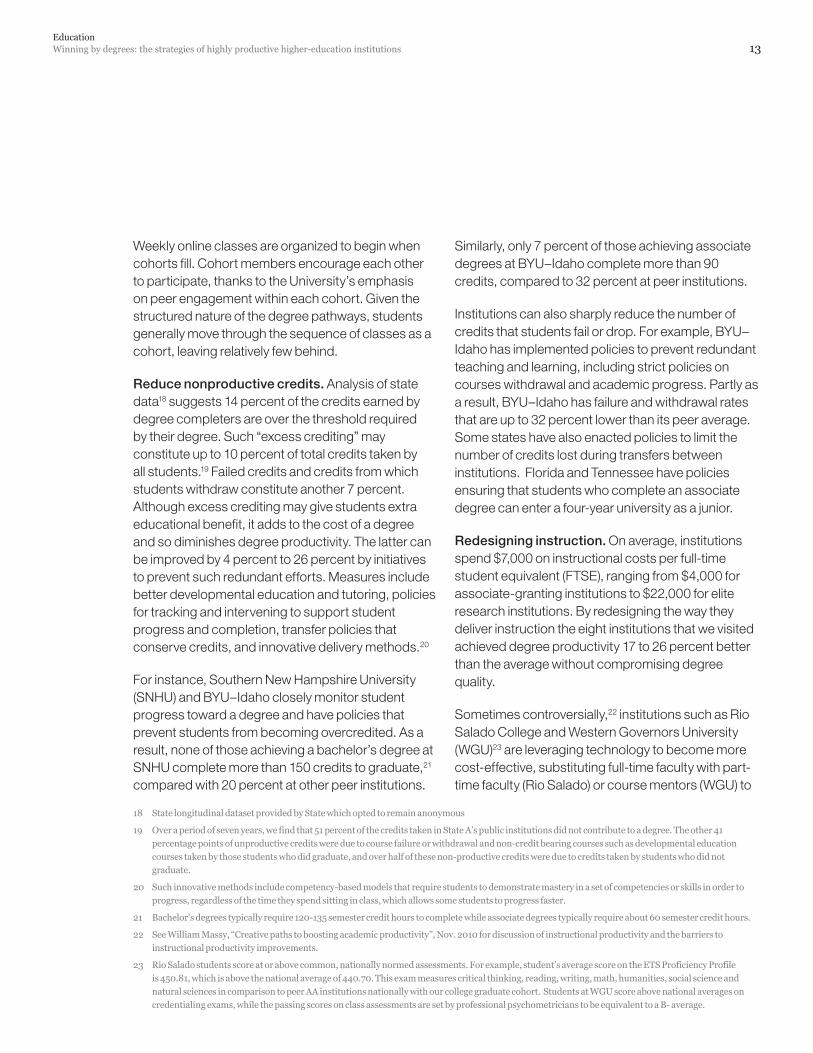
Using a variety of strategies, these highly productive institutions attain up to 50 percent higher overall productivity than the average for the top quartile in their peer group and 60 percent higher than the peer group average (Exhibit 2). Using data provided by the schools, we measured the impact on degree productivity of their particular strategies and identified the five detailed below that had the most impact. Through implementing these five levers, the eight institutions studied achieve improved cost per degree three to six times greater for each lever than the average improvement achieved by top-quartile institutions (Exhibit 3).
Five strategies that increase degree productivity
This group of eight clearly does not represent the full breadth of higher education institutions. But the strongly positive impact on degree productivity of the five strategies suggest these are worth considering as part of any national, state or institution effort to produce more graduates on a limited budget.14
Systematically�enabling�students�to�reach�graduation. Graduation rates vary widely between institutions, even within peer groups. Among community colleges, graduation rates typically range from 19 percent to 45 percent and from 37 percent to 62 percent among four-year institutions.15 Reforms to enable students to persevere through to graduation include providing structured pathways to graduation, effective student supports and effective placement and college preparation, as well as preparing students for post-study work.
An integrated package of such initiatives can boost graduation rates enough to bring down the average cost of a degree by 11 percent to 33 percent. For instance, Valencia Community College’s three-year graduation rate of 35 percent is 15 percentage points above that of peer institutions partly because the college provides students with support and tools for planning their path to graduation. It also tailors support to its different student segments and has redesigned student support services to improve their quality.16
Indiana Wesleyan University College of Adult & Professional Studies’ six-year graduation rate of 65 percent is 19 percentage points above its peer average. The college has developed a cohort model and structured degree pathways with few electives.17
14 Institutions in different segments and with different needs may choose to focus on different strategies
15 Graduation rates are IPEDS first-time, full-time graduation rates within 150% of expected time. Ranges represent top and bottom quartiles.
16 Valencia Community College closely tracks quality and performance metrics for core student support services such as financial aid processing
17 Descriptions of Indiana Wesleyan University’s practices focus on the Center for Adult and Professional Studies’ associate and bachelor programs, which
enroll about 5,000 of IWU’s approximately 15,000 students. The remaining students are enrolled in graduate programs or enrolled in IWU’s residential
campus.
EducationWinning by degrees: the strategies of highly productive higher-education institutions 11
Top quartile
43,974
Non-core servicesCompletion efficiency
0%
13%
Core supportsAverage
4%
56,289
Instruction
4%
57,1538%5%
7%74,268
3%
Competitive2 bachelors/masters
Associates
Variation in cost per degree deliveredPercent of average cost per degree1, USD
SOURCE: IPEDS; McKinsey analysis
22% higher productivity
Note: Average across 6 peer subgroups1 Cost/degree = cost/full-time student equivalent (FTSE) x FTSE/degree; FTSE/degree normalized to take into account of average time to obtain a
degree and includes certificate and graduate production; 2005-07 3-year average2 Competitive admissions policies as defined by Barron’s
23% higher productivity
Exhibit 1: Associate-granting institutions captured degree productivity primarily through completion, while competitive bachelor institutions did so through costs
InstitutionEnrollmentFTSEDescription
NormalizedCost per degreeDollars
9,125 A public vocational training school with 23 campuses across the state
21,053
10,224 A public community college that awards primarily certificates. Delivery is through unbundled online instruction
32,043
Valencia Community College
19,934 A public, two-year community college, that awards both associates degrees and certificates
22,311
Com
petit
ive
Bac
helo
rsA
ssoc
iate
sC
ertif
icat
es
15,870 A private nonprofit institution that offers online competency-based instruction
27,495Western Governors
5,370 A private nonprofit institution that offers associate, bachelors, and masters degrees
52,285Southern New Hampshire
14,098 A private nonprofit institution that offers associates and bachelors degrees. Currently transitioning from awarding primarily associates to primarily bachelors degrees
42,294BYU Idaho
46,926 A for-profit institution awarding a mix of degrees in various locations across the country, both online and on site
40,128*DeVry
14,233 A private nonprofit faith-based institution that awards associates, bachelors, and graduate degrees. For this study, the research focused primarily on bachelors degree programs offered on-site and online via the College of Adult & Professional Studies
40,851
Indiana Wesleyan University-CAPS
Rio Salado
Tennessee Technical Centers
* Excludes marketing spend
Table 1: Institutions visited
12
Sample top performer
22,311
Non-core services
0%
Core supports
17%
Instruction
13%
Completion efficiency
19%
Top quartile
43,974
40,8514%24%15%14%57,153
SOURCE: IPEDS; Institution data; McKinsey analysis
Variation in cost per degree deliveredPercent of average cost per degree1, USD
29% higher productivity
49% higher productivity
Indiana Wesleyan University
Valencia CC
1 Cost/degree = cost/FTE x FTE/degree; FTE/degree normalized to take into account of average time to obtain degree and includes certificate and graduate production; 2005-07 3-year average
2 Competitive admissions policies as defined by Barron's
Competitive2 bachelors/masters
Associates
Exhibit 2: Top performing institutions can achieve 30 to 50 percent greater productivity than the top quartile
1 Impact is not additive as institutions do not drive productivity with all levers
SOURCE: IPEDS; Institution data; McKinsey analysis
% category improvement (deep-dives)
11-31 32-65 37-54 42-100
Institutions we visited (deep dives)
Top quartile
Variation in cost per degree by productivity driverPercent of total cost per degree
Completion efficiency Cost efficiency
Total1
32-64
22-23
Selective Non-core
8-17
0-3
Efficient core services
16-23
4-8
Instructional redesign
13-26
4-5
Non-productive credits
4-26
2-4
Promote graduation
11-33
3-11
Exhibit 3: Five strategies can result in over 60 percent higher degree productivity
EducationWinning by degrees: the strategies of highly productive higher-education institutions 13
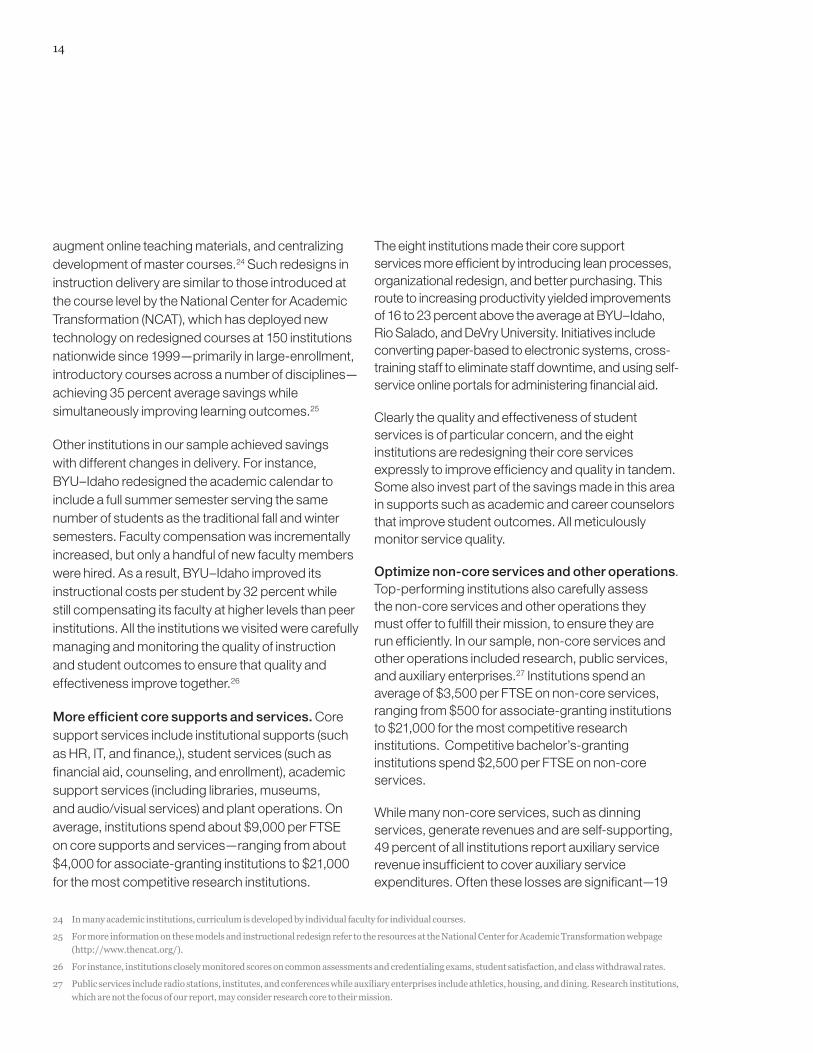
Weekly online classes are organized to begin when cohorts fill. Cohort members encourage each other to participate, thanks to the University’s emphasis on peer engagement within each cohort. Given the structured nature of the degree pathways, students generally move through the sequence of classes as a cohort, leaving relatively few behind.
Reduce�nonproductive�credits. Analysis of state data18 suggests 14 percent of the credits earned by degree completers are over the threshold required by their degree. Such “excess crediting” may constitute up to 10 percent of total credits taken by all students.19 Failed credits and credits from which students withdraw constitute another 7 percent. Although excess crediting may give students extra educational benefit, it adds to the cost of a degree and so diminishes degree productivity. The latter can be improved by 4 percent to 26 percent by initiatives to prevent such redundant efforts. Measures include better developmental education and tutoring, policies for tracking and intervening to support student progress and completion, transfer policies that conserve credits, and innovative delivery methods.20
For instance, Southern New Hampshire University (SNHU) and BYU–Idaho closely monitor student progress toward a degree and have policies that prevent students from becoming overcredited. As a result, none of those achieving a bachelor’s degree at SNHU complete more than 150 credits to graduate,21 compared with 20 percent at other peer institutions.
Similarly, only 7 percent of those achieving associate degrees at BYU–Idaho complete more than 90 credits, compared to 32 percent at peer institutions.
Institutions can also sharply reduce the number of credits that students fail or drop. For example, BYU–Idaho has implemented policies to prevent redundant teaching and learning, including strict policies on courses withdrawal and academic progress. Partly as a result, BYU–Idaho has failure and withdrawal rates that are up to 32 percent lower than its peer average. Some states have also enacted policies to limit the number of credits lost during transfers between institutions. Florida and Tennessee have policies ensuring that students who complete an associate degree can enter a four-year university as a junior.
Redesigning�instruction. On average, institutions spend $7,000 on instructional costs per full-time student equivalent (FTSE), ranging from $4,000 for associate-granting institutions to $22,000 for elite research institutions. By redesigning the way they deliver instruction the eight institutions that we visited achieved degree productivity 17 to 26 percent better than the average without compromising degree quality.
Sometimes controversially,22 institutions such as Rio Salado College and Western Governors University (WGU)23 are leveraging technology to become more cost-effective, substituting full-time faculty with part-time faculty (Rio Salado) or course mentors (WGU) to
18 State longitudinal dataset provided by State which opted to remain anonymous
19 Over a period of seven years, we find that 51 percent of the credits taken in State A’s public institutions did not contribute to a degree. The other 41
percentage points of unproductive credits were due to course failure or withdrawal and non-credit bearing courses such as developmental education
courses taken by those students who did graduate, and over half of these non-productive credits were due to credits taken by students who did not
graduate.
20 Such innovative methods include competency-based models that require students to demonstrate mastery in a set of competencies or skills in order to
progress, regardless of the time they spend sitting in class, which allows some students to progress faster.
21 Bachelor’s degrees typically require 120-135 semester credit hours to complete while associate degrees typically require about 60 semester credit hours.
22 See William Massy, “Creative paths to boosting academic productivity”, Nov. 2010 for discussion of instructional productivity and the barriers to
instructional productivity improvements.
23 Rio Salado students score at or above common, nationally normed assessments. For example, student’s average score on the ETS Proficiency Profile
is 450.81, which is above the national average of 440.70. This exam measures critical thinking, reading, writing, math, humanities, social science and
natural sciences in comparison to peer AA institutions nationally with our college graduate cohort. Students at WGU score above national averages on
credentialing exams, while the passing scores on class assessments are set by professional psychometricians to be equivalent to a B- average.
14
augment online teaching materials, and centralizing development of master courses.24 Such redesigns in instruction delivery are similar to those introduced at the course level by the National Center for Academic Transformation (NCAT), which has deployed new technology on redesigned courses at 150 institutions nationwide since 1999—primarily in large-enrollment, introductory courses across a number of disciplines—achieving 35 percent average savings while simultaneously improving learning outcomes.25
Other institutions in our sample achieved savings with different changes in delivery. For instance, BYU–Idaho redesigned the academic calendar to include a full summer semester serving the same number of students as the traditional fall and winter semesters. Faculty compensation was incrementally increased, but only a handful of new faculty members were hired. As a result, BYU–Idaho improved its instructional costs per student by 32 percent while still compensating its faculty at higher levels than peer institutions. All the institutions we visited were carefully managing and monitoring the quality of instruction and student outcomes to ensure that quality and effectiveness improve together.26
More�efficient�core�supports�and�services. Core support services include institutional supports (such as HR, IT, and finance,), student services (such as financial aid, counseling, and enrollment), academic support services (including libraries, museums, and audio/visual services) and plant operations. On average, institutions spend about $9,000 per FTSE on core supports and services—ranging from about $4,000 for associate-granting institutions to $21,000 for the most competitive research institutions.
The eight institutions made their core support services more efficient by introducing lean processes, organizational redesign, and better purchasing. This route to increasing productivity yielded improvements of 16 to 23 percent above the average at BYU–Idaho, Rio Salado, and DeVry University. Initiatives include converting paper-based to electronic systems, cross-training staff to eliminate staff downtime, and using self-service online portals for administering financial aid.
Clearly the quality and effectiveness of student services is of particular concern, and the eight institutions are redesigning their core services expressly to improve efficiency and quality in tandem. Some also invest part of the savings made in this area in supports such as academic and career counselors that improve student outcomes. All meticulously monitor service quality.
Optimize�non-core�services�and�other�operations. Top-performing institutions also carefully assess the non-core services and other operations they must offer to fulfill their mission, to ensure they are run efficiently. In our sample, non-core services and other operations included research, public services, and auxiliary enterprises.27 Institutions spend an average of $3,500 per FTSE on non-core services, ranging from $500 for associate-granting institutions to $21,000 for the most competitive research institutions. Competitive bachelor’s-granting institutions spend $2,500 per FTSE on non-core services.
While many non-core services, such as dinning services, generate revenues and are self-supporting, 49 percent of all institutions report auxiliary service revenue insufficient to cover auxiliary service expenditures. Often these losses are significant—19
24 In many academic institutions, curriculum is developed by individual faculty for individual courses.
25 For more information on these models and instructional redesign refer to the resources at the National Center for Academic Transformation webpage
(http://www.thencat.org/).
26 For instance, institutions closely monitored scores on common assessments and credentialing exams, student satisfaction, and class withdrawal rates.
27 Public services include radio stations, institutes, and conferences while auxiliary enterprises include athletics, housing, and dining. Research institutions,
which are not the focus of our report, may consider research core to their mission.
EducationWinning by degrees: the strategies of highly productive higher-education institutions 15
percent of institutions report losses greater than $500 per student, and 10 percent of institutions report losses greater than $1,000 per student.
By maintaining only mission-critical non-core services, institutions in our sample save up to 17 percent of their peer group average cost per degree. WGU, DeVry University, and SNHU, for example, offer little in the way of non-core services, as part of their effort to control total costs. However, we recognize that many institutions will continue to maintain non-core services to fulfill their mission. In these cases, institutions should pay especially close attention to operations which require general fund subsidies while improving efficiency across all non-core services to drive down costs to students and other stakeholders
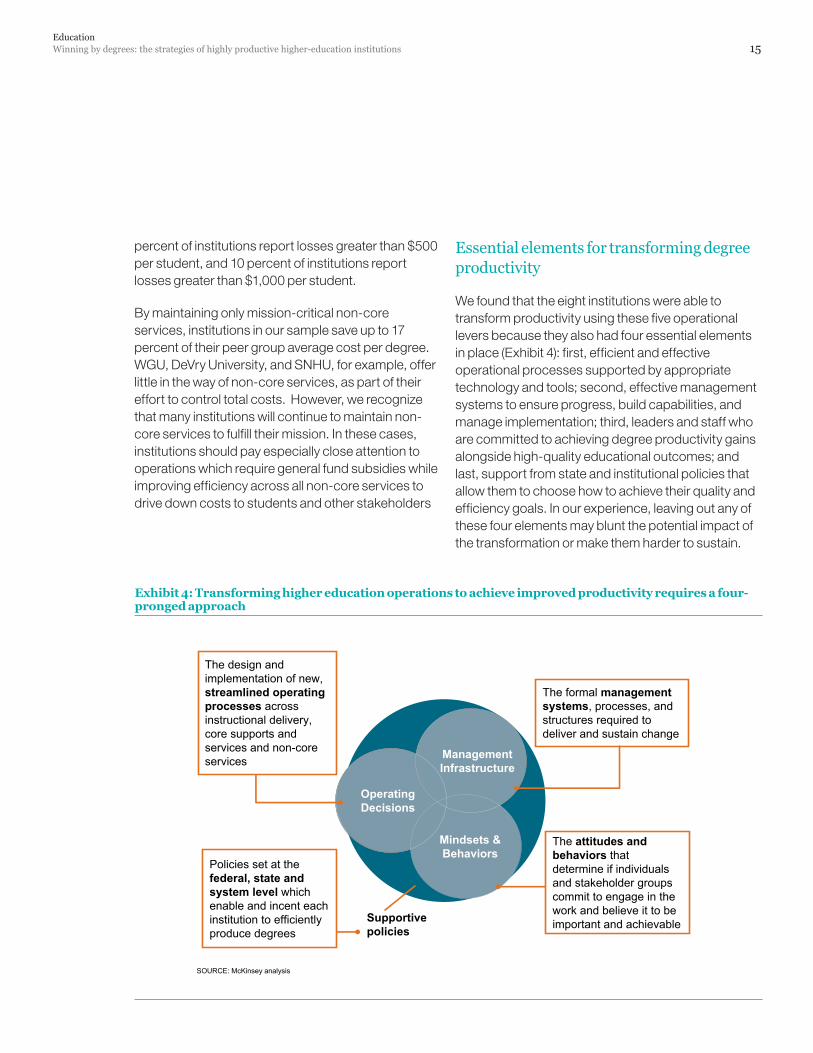
Essential elements for transforming degree productivity
We found that the eight institutions were able to transform productivity using these five operational levers because they also had four essential elements in place (Exhibit 4): first, efficient and effective operational processes supported by appropriate technology and tools; second, effective management systems to ensure progress, build capabilities, and manage implementation; third, leaders and staff who are committed to achieving degree productivity gains alongside high-quality educational outcomes; and last, support from state and institutional policies that allow them to choose how to achieve their quality and efficiency goals. In our experience, leaving out any of these four elements may blunt the potential impact of the transformation or make them harder to sustain.
Mindsets & Behaviors
Supportive policies
The formal management systems, processes, and structures required to deliver and sustain change
Policies set at the federal, state and system level which enable and incent each institution to efficiently produce degrees
Management Infrastructure
Operating Decisions
SOURCE: McKinsey analysis
The design and implementation of new, streamlined operating processes across instructional delivery, core supports and services and non-core services
The attitudes and behaviors that determine if individuals and stakeholder groups commit to engage in the work and believe it to be important and achievable
Exhibit 4: Transforming higher education operations to achieve improved productivity requires a four-pronged approach
16
In addition, the eight institutions we visited had an unwavering focus on educating students. They were determined to combine effective educational practices and good management to achieve their educational mission productively.
Increasing degree productivity requires institutions and policy makers to collaborate
Colleges and universities that already achieve outstanding levels of degree productivity can serve as models for others. Their main lesson to institution leaders and policymakers is to concentrate on improving degree completion and cost efficiency. Given the urgent need to increase the number of U.S. college graduates, these institutions and their stakeholders must also commit to rapid change.
How can all institutions raise their degree productivity to the levels achieved by the highest performers? Our research suggests several steps for institutions and state and federal policymakers to consider.
First, every higher education institution should carry out an honest self-assessment, comparing their overall educational productivity and their performance on the five strategies of highly productive post-secondary institutions to an appropriate peer group. Next, all institutions should assess the will and skill of leadership, managers, and staff to pursue change. Without committed leadership, transformational change is unlikely to happen. If they have the will to change, they must make firm commitments to reaching high levels of degree productivity while maintaining or improving quality and access. Then institutions can set aspirations for improved productivity, develop a multiyear operational plan with defined performance milestones, and commit to implementing it. Some institutions will need to make only incremental changes. Others will require more fundamental transformation.
Second, the entire higher education system requires better performance measurement, data gathering, and benchmarking so that institutions and funders can track their progress. Institutions need a common fact base of benchmarks to serve as an external reference for their own performance. Many worthwhile efforts are underway and, together with the data in this report, they offer a starting point. States should agree with colleges on standard practices for recording and measuring productivity and publish college productivity data. Unless such data become comprehensive and accessible, states and institutions cannot be held accountable for their progress.
Third, state governments and federal policy makers must develop and uphold policies that elevate productivity in higher education further up government agendas. Momentum for policy action is building. To signal their commitment, state and other levels of government must require institutions to collect degree productivity data, as part of a balanced picture of their diverse contributions and impact.
Grants and policies should foster productivity innovatively, for example, through sharing best practices, or introducing competitive grants and results-based funding. But they should not dictate how better productivity is achieved. This report shows that creative institutions can improve productivity in different ways, as long as they stay focused on the goal of educating more students for the same cost while maintaining or raising quality and access.
Also, all these lessons need to be reflected in the design of new models of teaching institutions, so that such innovators achieve their full degree productivity potential from the outset and the gains from their experience are shared across the system. For example, more than three decades ago, the Maricopa district launched Rio Salado as a community college with an alternative way of delivering instruction. It
High performing institutions operated at the nexus of effective educational practices and good management
EducationWinning by degrees: the strategies of highly productive higher-education institutions 17
moved to online instruction as soon as this became feasible. Now, Rio Salado, in terms of student headcount, is the largest college in the system and the community college with the largest online enrollments in the nation. US higher education needs a new generation of such innovation at scale.
• • •
Unless America’s higher education institutions can improve the skill level of the labor force, the nation risks failing to produce the talent required to maintain its economic competitiveness. Many Americans may never fulfill their potential or see their relative living standards fall. A variety of strategies may be needed to meet this challenge head on. But their aim should be to increase the number of students who enroll, increase the rate of degree completion, and improve the output and outcomes of higher education expenditures as rapidly as possible, while maintaining a steadfast commitment to broadening access and upholding the quality of post-secondary education in the United States.

18
EducationWinning by degrees: the strategies of highly productive higher-education institutions 19
Introduction
Many have made the case for increasing degree production in the United States, both to ensure economic prosperity and also as a way to address the cycle of poverty and inequity plaguing some communities. The arguments stem from a broad evidence base that shows how postsecondary education impacts the nation, states, households, and individuals. Some of the evidence is quite compelling.
First, research indicates the share of jobs in the US economy that requires a postsecondary degree is expected to increase to 45 percent in the coming decade, translating to about 5 million additional degrees needed to fill those positions. From 1973 to 2008, the share of jobs in the US economy requiring a postsecondary degree increased from 28 percent to 42 percent. That number is expected to increase again, to 45 percent, in the coming decade.1 We estimate the United States will need to produce about 1 million additional degrees annually by 2020 to meet this demand—up from 2.5 million annually today.2
Second, it is well documented that not having a postsecondary degree weakens individuals’ earning power and job opportunities. In the United States, since 1990, the average earnings of a high school graduate actually fell in real terms by 2 percent, while those of college graduates rose by 10 percent.3
Currently in the United States, individuals who hold an associate degree earn 20–30 percent more than those who have only a high school degree. A bachelor’s degree holder earns 70–75 percent more.4 Future occupation analysis shows that nine out of ten workers with a high school education or less will be limited to occupations that either pay low wages or are in decline.5
Third, it has been shown that postsecondary degree attainment by parents is the biggest driver of individuals’ and families’ movement out of poverty.6 Students who do not have parents who have a college degree are more likely to be in a low-income household. Students from low-income families are less likely to graduate from high school, less likely to enroll in college, and less likely to complete college.7 Evidence also shows that students from the top income quartile are four times more likely than those from the lowest to get a bachelor’s degree.8 Recognizing the importance and urgency of postsecondary degree attainment to individuals and the nation overall, distinct stakeholders and most recently President Obama have sent a loud and clear message9: the current level of college attainment in the United States is not acceptable; it needs to dramatically improve to meet the labor demand that will allow individual and national prosperity.
1 Carnevale, Smith, Strohl, “Help Wanted: Projection of Jobs and Education Requirements Through 2018. Georgetown University, Center on education and the workforce, 2010.
2 Based on an estimated 166 million workforce in 2018, an additional three percentage points would translate into approximately 5 million additional degrees between 2007 and 2018. A linear increase over a 10 year period results in approximately 1 million additional degrees produced annually after 10 years. We do not account for additional degree baseline attainment growth beyond that required to maintain a baseline of 42 percent attainment.
3 McKinsey Global Institute—unpublished results
4 Baum and Payea, “Education Pays: The Benefits of Higher Education for Individuals and Society,” The College Board, 2004.
5 Carnevale, Smith, Strohl, “Help wanted: Projection of jobs and education requirements through 2018” Georgetown University, Center on education and the workforce, 2010.
6 Hertz, “Understanding mobility in America” Center for American Progress, 2006
7 McKinsey Global Institute—unpublished results
8 McKinsey Global Institute—unpublished results
9 In February 2009, President Barack Obama told a joint session of Congress: “By 2020, America will once again have the highest proportion of college graduates in the world.” The administration’s goal is to achieve 60 percent college attainment rate among 25- to 34-year-olds by 2020.
20
The challenges ahead
The urgent need and relevance of promoting postsecondary attainment doesn’t immediately translate to accomplishing it at a nationwide level. Today the US higher education system faces two key challenges: the slowly growing attainment rates and the fast-increasing cost to obtaining a degree.
The US higher education system has a worldwide reputation for excellence. Six US institutions are ranked among the world’s top 10 universities, and 13 among the top 25.10 At a national level, college attainment rates have doubled from about 20 percent in the late 1960s to 40 percent today, while degree production has increased 2.5-fold–from 1 million degrees per year in 1968 to 2.5 million degrees today.
Since the 1970s, however, the postsecondary attainment rate in the United States has increased slowly, with bachelor’s attainment rising from 24 percent in 1976 to 31 percent in 2009. Once the first in the world, the United States recently ranked tenth among OECD countries in the percentage of its young adults ages 25 to 34 with college degrees (associate and higher).11 College attainment rates are rising in almost every industrialized or postindustrial country in the world, except for the United States.12 If the current trajectory continues, the nation will rank 17th by 2020.13
Moreover, institutions and students are currently facing a period of declining state contributions whilst tuition, fees room and board and total cost have
increased faster than inflation. Some argue that our higher education systems are fighting for their own financial survival.14
State budgets for FY2011 are expected to remain 8.4 percent lower than that of FY2008.15 According to the Center for Budget and Policy Priorities, 39 states have already projected budget gaps totaling $112 billion in FY2012, noting that “once all states have prepared estimates these are likely to grow to some $140 billion.”16 This is on top of difficult cuts that have already been made since FY2008. Scott Pattison, budget director of the National Association of State Budget Officers (NASBO), recently remarked that “states face significant fiscal challenges going forward with the federal Recovery Act funds ending, revenues not expected to be returning to pre-recession levels, and higher demands for many services like health and education.”17
These state revenue shortfalls have resulted in decreased state funding for higher education. Forty-two states have reduced higher education budgets in FY09 or FY10, and 31 states are planning additional cuts in FY11 in order to close budget gaps.18These cuts are again decreasing state funding as they were beginning to recover from cuts made from 2002 to 2005.19
To make up for decreases in state funding, higher education systems have dramatically increased tuition in many states. As noted in one report,20 “Florida college students could face yearly 15 percent tuition increases for years, and University of Illinois students
10 “World’s best universities,” U.S. News and World Report, based on QS World University Rankings. According to Shanghai University’s “Academic Ranking of World Universities,” US institutions hold 8 of the top 10 positions and 19 of the top 25 positions.
11 Organization for Economic Cooperation and Development (OECD), Education at a Glance 2010: OECD indicators, 2010 (www.sourceoecd.org). The United States is also behind Russia and Israel in college attainment; however, these countries are not part of the OECD.
12 The Lumina Foundation for Education, “A stronger nation through higher education,” February 2009.
13 Projections based on a linear regression of 2008 college attainment by age range for each country.
14 “Colleges flunk economics test as Harvard model destroys budgets,” Bloomberg News, May 1, 2009.
15 “Findings of biannual fiscal survey show states lag behind national economic recovery,” National Governor’s Association News Release, June 3, 2010.
16 Elizabeth McNichol, Phil Oliff, and Nicholas Johnson, “States continue to feel recession’s impact,” Center for Budget and Policy Priorities, October 7, 2010.
17 National Association of State Budget Officers and National Governors Association, Fiscal Survey of the States,Washington DC (June, 2010)
18 State higher education finance FY2009, State Higher Education Executive Officers, 2010; also footnote 16.
19 See “Trends in higher education spending” by the Delta Cost Project for more on trends in higher education funding.
20 “Students on edge over rising tuition,” CBS News, February 2, 2010 (http://www.cbsnews.com/stories/2010/02/02/national/main6164634.shtml)
EducationWinning by degrees: the strategies of highly productive higher-education institutions 21
will pay at least 9 percent more. The University of Washington will charge 14 percent more at its flagship campus. Tuition at the California State University system has tripled in 10 years. And in California, tuition increases of more than 30 percent have sparked protests reminiscent of the 1960s. This is in addition to tuition that has already risen by 439 percent between 1985 and 2005—far exceeding the Consumer Price Index (108 percent) and health care index (251 percent).21 As a consequence, student loan debt is on the rise. College seniors who graduated last year owed an average of $24,000 in student loan debt, up 6 percent from the year before, according to a report from the Project on Student Debt.22
Given the current economic crisis, projections from experts indicate that budget pressures are unlikely to relax in the next several years—either on households or on the state or federal government.23 Meanwhile, loan default rates have increased from 5.2 percent in FY2006 to 7 percent in FY2008, increasing across all sectors including public, nonprofit, and for-profit institutions.24
There is concern that these increases in net total cost of attendance25 are threatening access and demand. While student protests of recent tuition hikes have made headlines, many others are asking the question “Is college still worth the cost?”26 Recent surveys highlight that despite this debate, the belief in the value of a college degree is increasing; according to a recent survey by the National Center for Public
Policy and Higher Education, 55 percent of Americans believe a degree is “necessary” for achieving success. However, the same survey found that 69 percent of respondents believed that “many qualified students” didn’t have the opportunity to go to college—the highest rate on record.27 Moreover, increasing access among lower-income students—a likely requirement to expand degree production—may make maintaining current tuition levels difficult.
These opposing trends, of increasing degree production to meet economic and individual needs on one side and funding constraints, historical cost increases (both tuition and total expenditures), and higher default rates on the other, make a call for a dramatic increase in degree production sound like an uphill battle. Add to that the need to maintain access and quality no matter what changes are instituted, and the challenge appears insurmountable. However, not increasing degree production—potentially the “easiest” answer—is not an option, as it may have the largest negative impact for individuals and on the US national and state economies over the long term.
One potential solution to the dilemma, which we explore in depth in this report, would be to dramatically improve degree productivity in higher education while expanding degree production: in other words, to produce more graduates for the same total expenditures without compromising the quality of degrees awarded or reducing access. There is precedent for dramatically improving
21 “Is college still worth the price?” April 13, 2009 (http://money.cnn.com/2008/08/20/pf/college/college_price.moneymag/) and The College Board, Trends in College Pricing 2009; Annual Survey of Colleges.
22 Student debt and the class of 2009, The Project on Student Debt October, 2010 available at http://www.projectonstudentdebt.org/
23 See “Findings of biannual fiscal survey show states lag behind national economic recovery,” NGA; and McNichol, Oliff, and Johnson, “States continue to feel recession’s impact,” CBPP.
24 “Student loan default rates increase,” Department of Education press release, September 13, 2010 (http://www.ed.gov/news/press-releases/student-loan-default-rates-increase-0).
25 Includes tuition, fees, room and board
26 See “Is a college degree still worth the cost,” U.S. News and World Report. November 17, 2008. (http://www.usnews.com/blogs/college-cash-101/2008/11/17/is-a-college-degree-really-worth-the-cost.html); and “Is college still worth the price?” April 13, 2009 (http://money.cnn.com/2008/08/20/pf/college/college_price.moneymag/).
27 John Immerwahr, Jean Johnson, Amber Ott, and Jonathan Rochkind, “Squeeze play 2010: Continued public anxiety on cost, harsher judgments on how colleges are run,” National Center for Public Policy and Higher Education and Public Agenda, February 2010.
22
degree productivity while maintaining or improving quality levels. It could be accomplished through improved completion rates and increased efficiency of both instructional delivery and non-instructional operations. Bringing these changes about will require effort and determination on everyone’s part.
For institutions and policy makers alike, there is a trade-off: achieving an increase of 1 million degrees will help individuals, society and the economy overall, but likely will not result in significantly more public revenue for schools in the next several years. Yet, the importance of their decisions, particularly at this critical moment in the nation’s economic health, cannot be overstated. Whether active or passive, through action or inaction, the choices that are made now may dramatically alter the current system, for better or worse, for a generation.
Focus and contribution of our research
Based on McKinsey’s long-standing work on productivity and economic development, we believe the education sector could benefit from embracing the challenge of increasing degree production while improving degree productivity. To help move the dialogue forward, McKinsey’s Education practice has designed and conducted a study of the operational drivers of degree productivity in higher education.
As our yardstick of productivity, we have selected the measure of cost per degree.28 Determining cost per degree factors in two key components: completion
and cost. Completion efficiency is a critical measure of productivity and overall efficiency of an institution, assessing the number of students a school enrolls—in full-time student equivalents (FTSEs)—in relation to the number of degrees awarded. A low FTSE/degree ratio indicates an efficient system.29 Cost efficiency, the second critical measure of productivity, is defined by the total cost per number of FTSEs. Similarly, a low cost/FTSE quotient indicates a more efficient system. The result of poor cost efficiency is that fewer students can be served with a given set of resources.
To date, a significant amount of research has been done on degree productivity in higher education.30 However, most of this research has relied on national datasets and regression analysis to identify broad trends. In contrast, our work uses a three-pronged approach: synthesizing existing analyses of degree productivity in higher education and studying established case examples; analyzing broad datasets such as Integrated Postsecondary Education Data Systems (IPEDS’) national dataset and state longitudinal data; and pursuing a detailed quantitative analysis of cost and completion data followed by site visits and interviews to identify the strategies used by eight high-performing institutions that contribute to their high levels of productivity. Our objective was to gain a detailed and nuanced picture of how institutions become productive—identifying what is possible as opposed to what is broadly true.
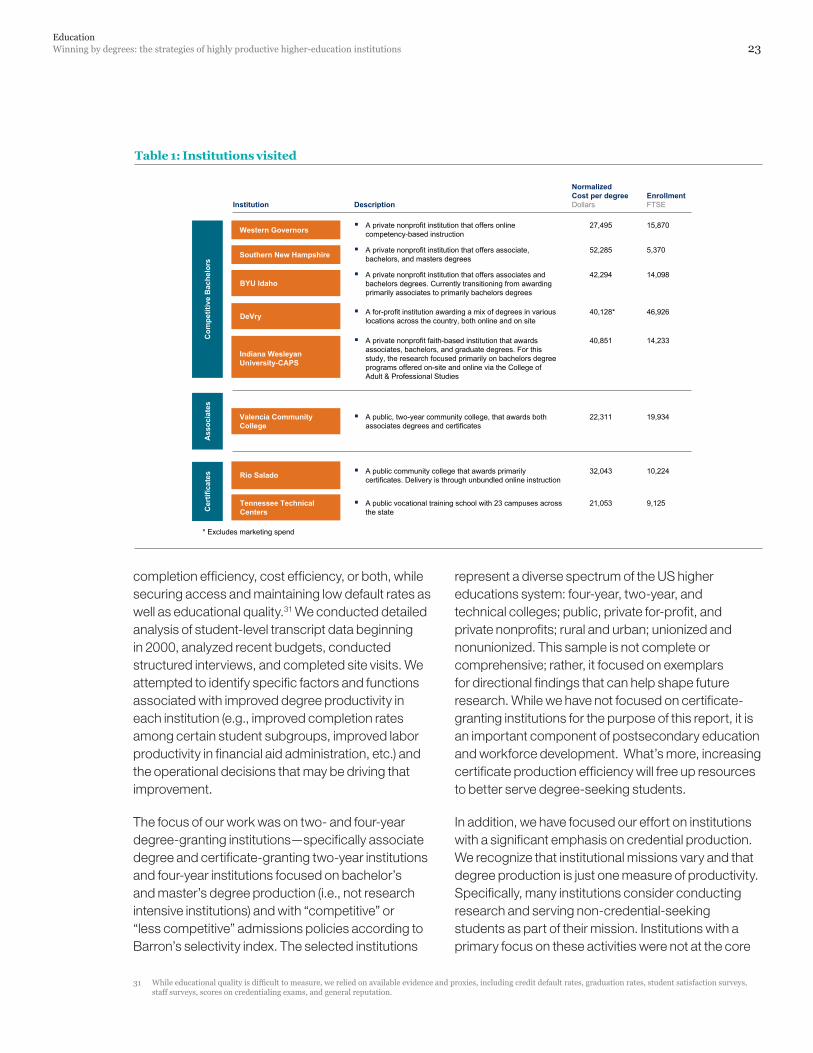
To pursue the institution analysis, we partnered with eight high-performing institutions (Table 1). These institutions demonstrated higher performance in
28 Cost per degree has been used by other expert studies of productivity in higher education. For instance, see The Delta Cost Project’s “The Dreaded P Word.”
29 One FTSE is equivalent to one full-time annual load of credits – 30 credits. If 100 percent of students graduated from a community college with a two-year associate degree, having taken and completed two years’ worth of credits (60 credits), then the FTSEs/degree would be 2.0. If all students graduated from a university with a four-year bachelor’s degree having taken and completed four years’ worth of credits (120 credits), then the FTSEs/degree would be 4.0. Because of lower graduation rates, courses failed or withdrawn, and other inefficiencies, the FTSEs/degree tend to be higher than these theoretical baselines.
30 For a review of the literature see Jane Wellman, “Connecting the dots between learning and resources,” January 2010; or the Delta Cost Project’s resource page at http://www.deltacostproject.org/resources/index.asp.
Whether active or passive, through action or inaction, the choices that are made now may dramatically alter the current system, for better or worse, for a generation.
EducationWinning by degrees: the strategies of highly productive higher-education institutions 23
completion efficiency, cost efficiency, or both, while securing access and maintaining low default rates as well as educational quality.31 We conducted detailed analysis of student-level transcript data beginning in 2000, analyzed recent budgets, conducted structured interviews, and completed site visits. We attempted to identify specific factors and functions associated with improved degree productivity in each institution (e.g., improved completion rates among certain student subgroups, improved labor productivity in financial aid administration, etc.) and the operational decisions that may be driving that improvement.
The focus of our work was on two- and four-year degree-granting institutions—specifically associate degree and certificate-granting two-year institutions and four-year institutions focused on bachelor’s and master’s degree production (i.e., not research intensive institutions) and with “competitive” or “less competitive” admissions policies according to Barron’s selectivity index. The selected institutions
represent a diverse spectrum of the US higher educations system: four-year, two-year, and technical colleges; public, private for-profit, and private nonprofits; rural and urban; unionized and nonunionized. This sample is not complete or comprehensive; rather, it focused on exemplars for directional findings that can help shape future research. While we have not focused on certificate-granting institutions for the purpose of this report, it is an important component of postsecondary education and workforce development. What’s more, increasing certificate production efficiency will free up resources to better serve degree-seeking students.
In addition, we have focused our effort on institutions with a significant emphasis on credential production. We recognize that institutional missions vary and that degree production is just one measure of productivity. Specifically, many institutions consider conducting research and serving non-credential-seeking students as part of their mission. Institutions with a primary focus on these activities were not at the core
InstitutionEnrollmentFTSEDescription
NormalizedCost per degreeDollars
9,125 A public vocational training school with 23 campuses across the state
21,053
10,224 A public community college that awards primarily certificates. Delivery is through unbundled online instruction
32,043
Valencia Community College
19,934 A public, two-year community college, that awards both associates degrees and certificates
22,311
Com
petit
ive
Bac
helo
rsA
ssoc
iate
sC
ertif
icat
es
15,870 A private nonprofit institution that offers online competency-based instruction
27,495Western Governors
5,370 A private nonprofit institution that offers associate, bachelors, and masters degrees
52,285Southern New Hampshire
14,098 A private nonprofit institution that offers associates and bachelors degrees. Currently transitioning from awarding primarily associates to primarily bachelors degrees
42,294BYU Idaho
46,926 A for-profit institution awarding a mix of degrees in various locations across the country, both online and on site
40,128*DeVry
14,233 A private nonprofit faith-based institution that awards associates, bachelors, and graduate degrees. For this study, the research focused primarily on bachelors degree programs offered on-site and online via the College of Adult & Professional Studies
40,851
Indiana Wesleyan University-CAPS
Rio Salado
Tennessee Technical Centers
* Excludes marketing spend
Table 1: Institutions visited
31 While educational quality is difficult to measure, we relied on available evidence and proxies, including credit default rates, graduation rates, student satisfaction surveys, staff surveys, scores on credentialing exams, and general reputation.
24
32 Later in the report, using data from the state longitudinal data system we quantify the percentage of credits taken by individuals not seeking degrees.
33 The 25-34 year old age range is commonly used by the Census and for purposes of international comparisons
of the effort described in this report. But while we did not focus on research institutions, we believe several of the lessons learned and the process and analysis used may be applied to these institutions as well. In addition, while the metric of cost per degree may be an imperfect measure of the productivity of institutions with varied missions our findings suggest that a large majority of institutions can improve upon both completion and cost efficiency. Given constraints on funding, each institution should continue to evaluate the trade-offs associated with their missions including the lost degree-producing capacity.32
Also, the study focused on reaching the additional 1 million degrees per year by 2020 from attainment by young adults in the age cohort of 25–34 years.33
Today, approximately 84 percent of students enrolled in higher education institutions are younger than 35. As graduation rates tend to be lower for students older than 35, students younger than 35 are likely awarded an even larger share of the degrees each year.
In addition to the institution analysis described earlier, we used the Integrated Postsecondary Education Data Systems (IPEDS) dataset to analyze the range in cost per degree, completion efficiency (as measured by FTSEs per degree), and cost efficiency (as measured by cost per FTSE) for peer groups of institutions as described later. In addition, we analyzed transcript-level data from two state longitudinal data systems for the 2002 and 2005 student cohorts. State A institutions had productivity that was close to average, with completion and cost efficiency that was also similar to the national average. We believe these institutions, on average, may provide insight into what is “typical” across public institutions. State B was recognized as one of the states with the highest productivity (the lowest cost per degree delivered) driven by both completion and cost.
Our work benefited from the extensive findings available from many that preceded us. Several economists and other researchers have studied productivity in higher education. We used a standardized methodology to review a comprehensive list of the potential drivers, which we identified by reviewing the literature and interviewing key thought leaders. We strived to verify the relevance of each driver to higher education degree productivity to measure their relative impact on different groups of workers and to understand their interaction.
Our combined findings have enabled us to describe the impact of best practice and make the fact-based recommendations for policy and further research presented in this report.
EducationWinning by degrees: the strategies of highly productive higher-education institutions 25
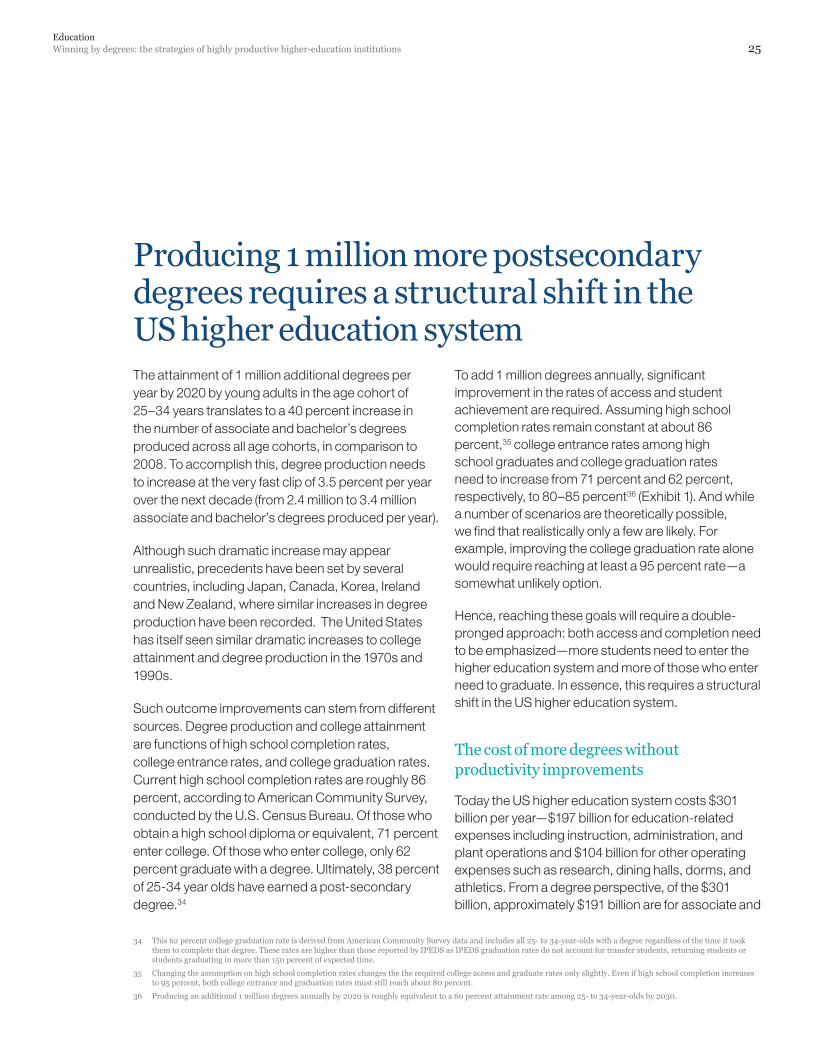
Producing 1 million more postsecondary degrees requires a structural shift in the US higher education systemThe attainment of 1 million additional degrees per year by 2020 by young adults in the age cohort of 25–34 years translates to a 40 percent increase in the number of associate and bachelor’s degrees produced across all age cohorts, in comparison to 2008. To accomplish this, degree production needs to increase at the very fast clip of 3.5 percent per year over the next decade (from 2.4 million to 3.4 million associate and bachelor’s degrees produced per year).
Although such dramatic increase may appear unrealistic, precedents have been set by several countries, including Japan, Canada, Korea, Ireland and New Zealand, where similar increases in degree production have been recorded. The United States has itself seen similar dramatic increases to college attainment and degree production in the 1970s and 1990s.
Such outcome improvements can stem from different sources. Degree production and college attainment are functions of high school completion rates, college entrance rates, and college graduation rates. Current high school completion rates are roughly 86 percent, according to American Community Survey, conducted by the U.S. Census Bureau. Of those who obtain a high school diploma or equivalent, 71 percent enter college. Of those who enter college, only 62 percent graduate with a degree. Ultimately, 38 percent of 25-34 year olds have earned a post-secondary degree.34
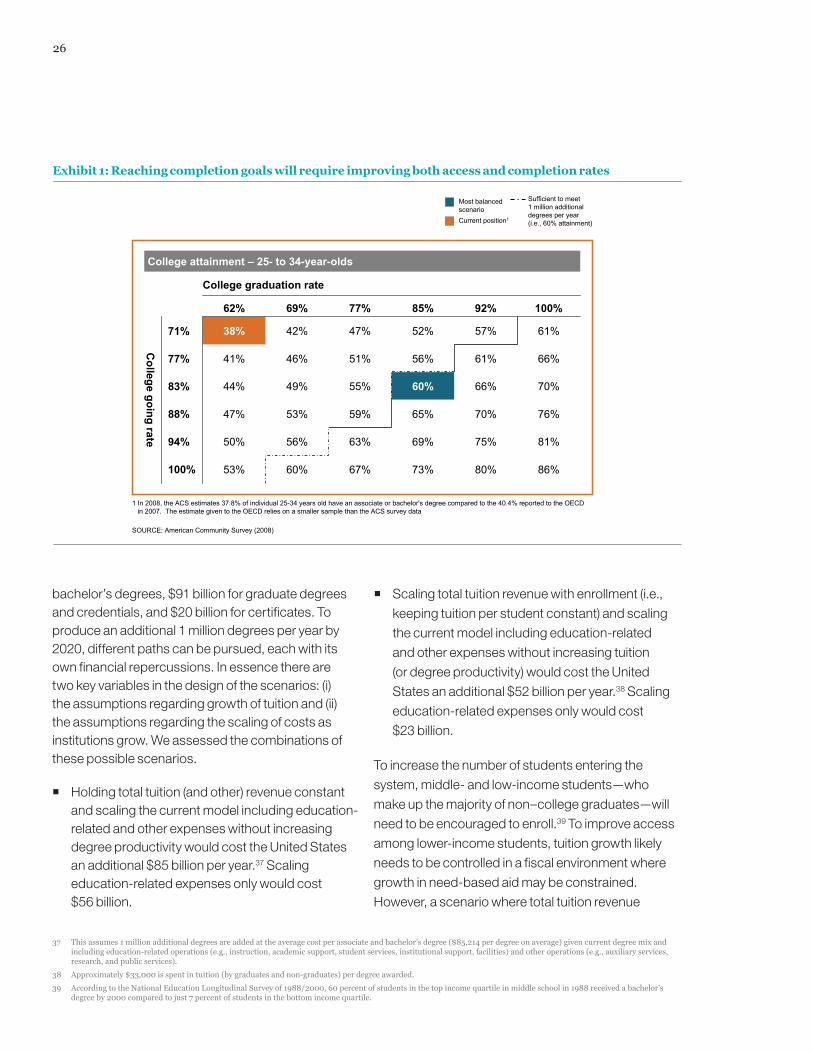
To add 1 million degrees annually, significant improvement in the rates of access and student achievement are required. Assuming high school completion rates remain constant at about 86 percent,35 college entrance rates among high school graduates and college graduation rates need to increase from 71 percent and 62 percent, respectively, to 80–85 percent36 (Exhibit 1). And while a number of scenarios are theoretically possible, we find that realistically only a few are likely. For example, improving the college graduation rate alone would require reaching at least a 95 percent rate—a somewhat unlikely option.
Hence, reaching these goals will require a double-pronged approach: both access and completion need to be emphasized—more students need to enter the higher education system and more of those who enter need to graduate. In essence, this requires a structural shift in the US higher education system.
The cost of more degrees without productivity improvements
Today the US higher education system costs $301 billion per year—$197 billion for education-related expenses including instruction, administration, and plant operations and $104 billion for other operating expenses such as research, dining halls, dorms, and athletics. From a degree perspective, of the $301 billion, approximately $191 billion are for associate and
34 This 62 percent college graduation rate is derived from American Community Survey data and includes all 25- to 34-year-olds with a degree regardless of the time it took them to complete that degree. These rates are higher than those reported by IPEDS as IPEDS graduation rates do not account for transfer students, returning students or students graduating in more than 150 percent of expected time.
35 Changing the assumption on high school completion rates changes the the required college access and graduate rates only slightly. Even if high school completion increases to 95 percent, both college entrance and graduation rates must still reach about 80 percent.
36 Producing an additional 1 million degrees annually by 2020 is roughly equivalent to a 60 percent attainment rate among 25- to 34-year-olds by 2030.
26
bachelor’s degrees, $91 billion for graduate degrees and credentials, and $20 billion for certificates. To produce an additional 1 million degrees per year by 2020, different paths can be pursued, each with its own financial repercussions. In essence there are two key variables in the design of the scenarios: (i) the assumptions regarding growth of tuition and (ii) the assumptions regarding the scaling of costs as institutions grow. We assessed the combinations of these possible scenarios.
� Holding total tuition (and other) revenue constant and scaling the current model including education-related and other expenses without increasing degree productivity would cost the United States an additional $85 billion per year.37 Scaling education-related expenses only would cost $56 billion.
� Scaling total tuition revenue with enrollment (i.e., keeping tuition per student constant) and scaling the current model including education-related and other expenses without increasing tuition (or degree productivity) would cost the United States an additional $52 billion per year.38 Scaling education-related expenses only would cost $23 billion.
To increase the number of students entering the system, middle- and low-income students—who make up the majority of non–college graduates—will need to be encouraged to enroll.39 To improve access among lower-income students, tuition growth likely needs to be controlled in a fiscal environment where growth in need-based aid may be constrained. However, a scenario where total tuition revenue
Sufficient to meet 1 million additional degrees per year (i.e., 60% attainment)
1 In 2008, the ACS estimates 37.8% of individual 25-34 years old have an associate or bachelor's degree compared to the 40.4% reported to the OECD in 2007. The estimate given to the OECD relies on a smaller sample than the ACS survey data
SOURCE: American Community Survey (2008)
Most balanced scenarioCurrent position1
College attainment – 25- to 34-year-olds
71%
77%
83%
88%
94%
100%
College going rate
38% 42% 47% 52% 57% 61%
41% 46% 51% 56% 61% 66%
44% 49% 55% 60% 66% 70%
47% 53% 59% 65% 70% 76%
50% 56% 63% 69% 75% 81%
53% 60% 67% 73% 80% 86%
62% 69% 77% 85% 92% 100%
College graduation rate
Exhibit 1: Reaching completion goals will require improving both access and completion rates
37 This assumes 1 million additional degrees are added at the average cost per associate and bachelor’s degree ($85,214 per degree on average) given current degree mix and including education-related operations (e.g., instruction, academic support, student services, institutional support, facilities) and other operations (e.g., auxiliary services, research, and public services).
38 Approximately $33,000 is spent in tuition (by graduates and non-graduates) per degree awarded.
39 According to the National Education Longitudinal Survey of 1988/2000, 60 percent of students in the top income quartile in middle school in 1988 received a bachelor’s degree by 2000 compared to just 7 percent of students in the bottom income quartile.
EducationWinning by degrees: the strategies of highly productive higher-education institutions 27
remains constant means that with additional students, tuition per student will decrease—an unlikely scenario.
We also believe that using a scenario where the full current expenses – including both education-related and other operating expenses – makes for the best “baseline” scenario as current operating models of higher education are closely linked to research and enterprises such as dormitories and sports teams. Not scaling these enterprises with enrollment may require changes to institutional focus or mission and would be a departure from the status quo. And while many institutions may, in the end, not scale these areas of operations, we would count such decisions towards productivity improvements and do not assume them into the base case. Others argue that many of these non-education-related expenses are paid for by student fees or other government sources. As these expenses represent real costs and we assume most funding sources will remain constrained, we do not consider the funding source a reason for excluding these costs from the analysis.40
Therefore, we believe the $52 billion a year scenario represents the best “theoretical baseline case” representing what 1 million additional degrees would cost should there be no change in productivity.
Current levels of tuition, fees, room and board per student have triggered increasing concern about the “return on investment” of college for many current and potential students and have put college out of reach for many. Similarly, given public budget constraints, any increase in public funds may prove unlikely, meaning institutions will largely need to finance the increased student population themselves. Hence, the productivity of the system—defined as the combination of completion rates and cost efficiency—must be improved.
To produce 1 million more postsecondary degrees, at constant system costs, requires a approximately 23 percent degree productivity improvement
To be able to produce an additional 1 million degrees per year without increasing public funding or the tuition per student, degree productivity—as measured by the total system cost per degree delivered—would need to improve by approximately 23 percent.
To reach this finding, we assumed a theoretical baseline case where the full current costs–including education-related and other costs–were scaled up with change in total tuition revenue at a total incremental cost of $52 billion per year. We then ran three scenarios of productivity improvement. In the first, scenario, we assume that all institutions achieve productivity improvement across all operations in order to fund the additional associates and bachelors production. This would require a 15 percent degree productivity improvement. Assuming that productivity improvements are limited to all associate and bachelor capacity would require a 21 percent productivity improvement. Limiting the productivity improvement to associate and bachelors degree producing institutions with open access or less selective admissions policies (the types of institutions most likely to produce the new degrees) would require a 34 percent improvement in productivity.
Averaging these three scenarios results in a required productivity improvement of 23 percent in order to produce the additional degrees under revenue constraints. We believe different states and systems may choose to seek improvement across different spans of the higher education system in order to fund the additional degrees—the required productivity improvement may vary accordingly.
40 In addition, 49 percent of institutions do not cover the expenses associated with auxiliary enterprises with revenue from those operations and therefore require a subsidy from other sources of funding
28
Solutions are already available in the dynamic and diverse US higher education system Top quartile institutions produce degrees with 17–38 percent higher degree productivity than their average peer institutions, suggesting a 23 percent improvement across the board is feasible
The broad student base, wide ranging student interests, and diverse missions of institutions have shaped a higher education system that can be segmented by a number of characteristics. Due to this variability, we must compare institutions to a peer group if we want to properly understand the degree productivity of each. For example, community colleges should be compared to community colleges and research institutions to research institutions.
To define peer groups, we first segmented the institutions41 along two dimensions: (1) by types of degrees offered42 (research/doctorate, bachelor’s/master’s, and associate) and (2) by levels of admissions competitiveness43 (highly competitive, very competitive, competitive, and least/noncompetitive). This first segmentation results in 12 groups, five of which account for more than 80 percent of total enrollment.44
Once our peer groups were determined, the next step in gauging the feasibility of our target institutions’ improving their degree productivity by 23 percent was to assess the variability in cost per degree among peers.
For the purposes of this report, we focused on two peer groups with the highest enrollment and which will likely enroll a disproportionate number of new degree-seekers: competitive bachelor’s/master’s and least competitive associate-degree institutions. These two segments account for 51 percent of total enrollments. Further, we controlled for those student enrollment characteristics that may affect variance in cost per degree. Using percentage of students, the characteristics we controlled for were (i) degree-seeking, (ii) first-time degree-seeking, (iii) receiving financial aid, and (iv) African American.45
For these two key peer groups we find that the average cost per degree is $74,268 per bachelor’s degree equivalent and $56,289 per associate degree equivalent.46 We also find that there is important variability between the average and the top and bottom cost per degree quartiles.
41 Institutions with fewer than 200 students or more than $1 million per degree awarded were excluded from this analysis, representing ~2 percent of the total students enrolled.
42 Based on a modified Carnegies classification system. The Carnegies classification system has four primary categories. For the purposes of our analysis, master’s and bachelor’s-granting institutions were combined into a single category.
43 Based on a modified Barron’s Admissions Competitiveness Index. “Highly competitive” approximately corresponds to Barron’s most and highly competitive categories; “least competitive” approximates Barron’s less and noncompetitive categories; “competitive” and “very competitive” classifications approximate Barron’s competitive and very competitive classifications respectively.
44 In order of decreasing enrollment: Least competitive associate-granting institutions, competitive bachelor’s institution, highly competitive research institutions, competitive research institutions, and least competitive bachelor’s institutions.
45 Percentage of students receiving federal aid and percentage of African American students (excluding historically black colleges) are two variables that have been shown to be statistically significant descriptive variables of graduation rate. Webber A. Douglas and Ehrenberg G. Ronald, “Do expenditures other than instructional expenditures affect graduation and persistence rates in American higher education,” NBER Working Paper No. 15216, August 2009.
46 All credentials awarded from competitive bachelor’s institutions were normalized to a four-year bachelor’s equivalent based on expected time to completion while credentials awarded from associate-granting institutions were normalized to a two-year associate degree equivalent.
EducationWinning by degrees: the strategies of highly productive higher-education institutions 29
Our findings show that:
� On�average,�there�is�a�34�percent�difference�in�cost�per�degree�between�the�average�institution�and�those�institutions�that�fall�in�the�top�quartile�of�productivity�for�each�segment�(Exhibit 2). The largest percent difference between the average and the top quartile institution exists among the highly competitive research institutions (50 percent), while the smallest difference occurs among the very competitive research institutions (23 percent). This translates to a difference of $122,000 per degree for highly competitive research institutions and $27,000 per degree for very competitive research institutions. The average difference between the bottom quartile and the average is somewhat smaller—from 11 percent to 23 percent—with least competitive research/doctoral institutions having the lowest percent difference and least competitive associate-granting institutions having the highest percent difference. The result is a difference of about $12,000 per degree in these segments.
� Controlling�for�characteristics�of�students,�such�as�percentage�of�students�receiving�federal�aid,�our�analysis�still�shows�variability�in�cost�per�degree�between�the�average�and�top�quartile�of�about�25�percent. This difference ranges from 17 to 38 percent between the average and top quartile, and from 10 to 20 percent between the bottom quartile and average. This translates to a difference of approximately $15,000 per degree for the associate and competitive bachelor peer groups examined. The greatest absolute difference is seen among competitive bachelor’s-granting institutions serving a low percentage of first-time students, a moderate percentage of federal aid recipients, and a high
percentage of African American students, while the smallest difference occurs among associate-granting institutions serving students with a moderate level of need.47 These variations translate to differences of $19,000 per degree and $10,000 per degree, respectively.
Perhaps not surprisingly, our findings show the diversity of paths that institutions can take to reach higher numbers of degrees granted for similar costs. Indeed, some of these highly productive institutions have more successfully improved completion while others have focused on costs. Even among a group of institutions with similar characteristics, for example, top-quartile associate-granting institutions with “medium” student characteristics, there is a twofold variance in both cost per FTSE and FTSEs per degree48 (Exhibit 3).
On average, four-year institutions that have improved their cost per degree have gained more from cost efficiency: of their 23 percent degree productivity margin over the median, 16 percentage points derive from better cost efficiency and 7 from higher completion rates. In contrast, two-year institutions in the top-performing quartile improved degree productivity more through better rates of completion: of their 22 percentage point advantage, 14 points came from completion gains and 8 from improved cost efficiency. Together, better completion rates and cost efficiency account for roughly 70 percent and 60 percent, respectively, of the degree productivity improvements captured by the four-year and two-year best practice institutions (Exhibit 4).
Our findings of such large variation in degree productivity among peer institutions suggests that within the dynamic and diverse US higher education system, solutions are already being created. Similar variability has also been shown in the total cost per
47 Low, medium, and high percentages are based in quartile values with “high„ percentages being greater than top quartile values and “low„ percentages being less than the bottom quartile. Institutions with moderate based need are in the middle quartile across all variables examined including percent receiving federal aid, percent African American, percent first-time students and percent degree-seeking students.
48 FTSEs per degree range from approximately 33 to 66 among top-quartile institutions in this peer group while costs per FTSE vary from about $4,000 per student to $10,000 per student.
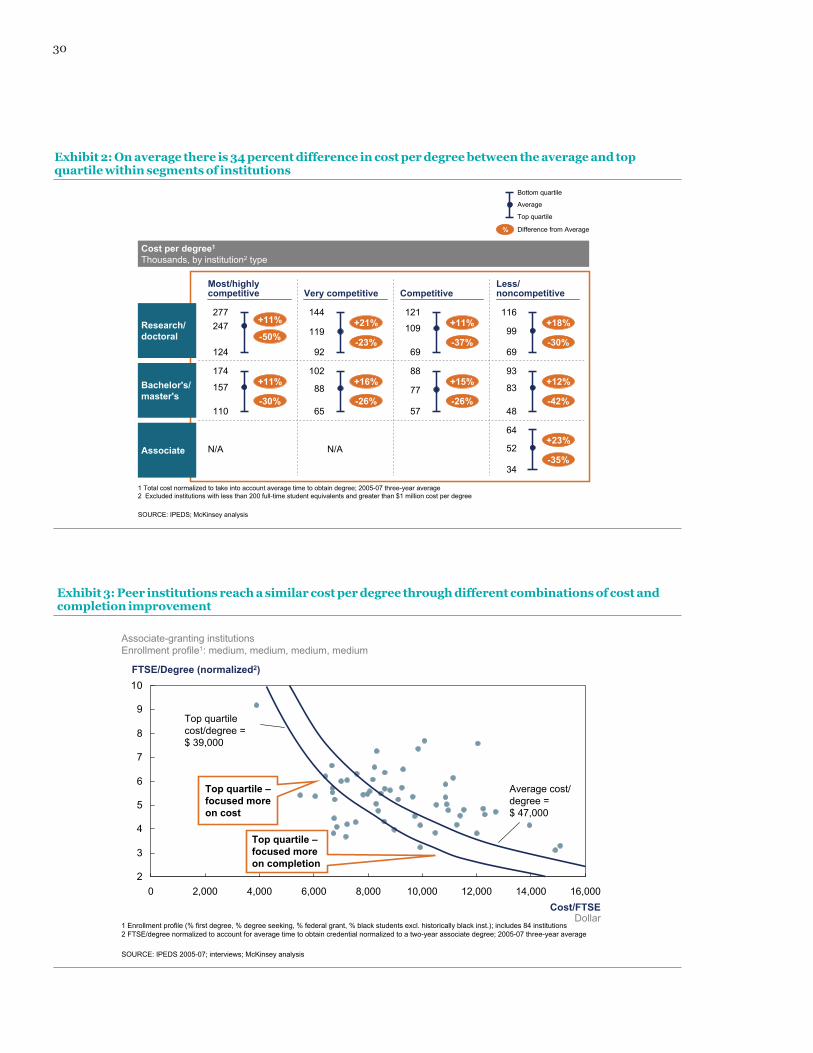
30
2
3
4
5
6
7
8
9
10FTSE/Degree (normalized2)
Cost/FTSEDollar
8,0006,0004,0002,000 16,00014,00012,00010,0000
SOURCE: IPEDS 2005-07; interviews; McKinsey analysis
Average cost/degree = $ 47,000
Top quartile cost/degree =$ 39,000
Top quartile –focused more on cost
Top quartile –focused more on completion
Associate-granting institutions Enrollment profile1: medium, medium, medium, medium
1 Enrollment profile (% first degree, % degree seeking, % federal grant, % black students excl. historically black inst.); includes 84 institutions2 FTSE/degree normalized to account for average time to obtain credential normalized to a two-year associate degree; 2005-07 three-year average
Exhibit 3: Peer institutions reach a similar cost per degree through different combinations of cost and completion improvement
SOURCE: IPEDS; McKinsey analysis
1 Total cost normalized to take into account average time to obtain degree; 2005-07 three-year average2 Excluded institutions with less than 200 full-time student equivalents and greater than $1 million cost per degree
Bottom quartile
Average
Top quartile
% Difference from Average
Cost per degree1
Thousands, by institution2 type
Research/ doctoral
N/A N/A
Very competitiveMost/highly competitive Competitive
Less/noncompetitive
277247
124
+11%
-50%
144
119
92
+21%
-23%
121
109
69
+11%
-37%
116
99
69
+18%
-30%
174
157 +11%
-30%
102
88
65
+16%
-26%
88
77
57
+15%
-26%
93
83
48
+12%
-42%
64
52
34
+23%
-35%
Bachelor's/ master's
Associate
110
Exhibit 2: On average there is 34 percent difference in cost per degree between the average and top quartile within segments of institutions
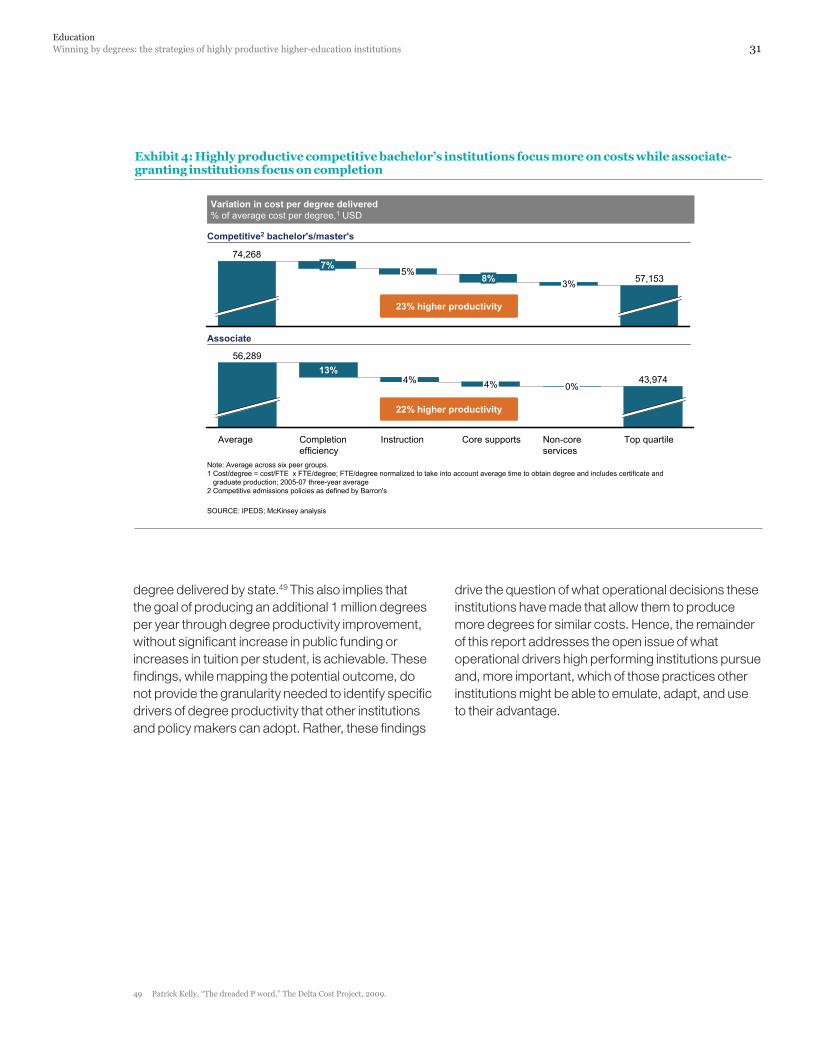
EducationWinning by degrees: the strategies of highly productive higher-education institutions 31
degree delivered by state.49 This also implies that the goal of producing an additional 1 million degrees per year through degree productivity improvement, without significant increase in public funding or increases in tuition per student, is achievable. These findings, while mapping the potential outcome, do not provide the granularity needed to identify specific drivers of degree productivity that other institutions and policy makers can adopt. Rather, these findings
drive the question of what operational decisions these institutions have made that allow them to produce more degrees for similar costs. Hence, the remainder of this report addresses the open issue of what operational drivers high performing institutions pursue and, more important, which of those practices other institutions might be able to emulate, adapt, and use to their advantage.
Top quartile
43,974
Non-core services
0%
Core supports
4%
Instruction
4%
Completion efficiency
13%
Average
56,289
5%8% 3% 57,153
74,2687%
SOURCE: IPEDS; McKinsey analysis
22% higher productivity
Note: Average across six peer groups.1 Cost/degree = cost/FTE x FTE/degree; FTE/degree normalized to take into account average time to obtain degree and includes certificate and
graduate production; 2005-07 three-year average2 Competitive admissions policies as defined by Barron's
23% higher productivity
Variation in cost per degree delivered% of average cost per degree,1 USD
Competitive2 bachelor's/master's
Associate
Exhibit 4: Highly productive competitive bachelor’s institutions focus more on costs while associate-granting institutions focus on completion
49 Patrick Kelly, “The dreaded P word,” The Delta Cost Project, 2009.
32
Five strategies to degree productivity improvement emerge from analysis of high-performing institutions
Through the analysis of our partner institutions, we find that to successfully improve productivity, these institutions have focused their efforts on five core operational levers. The first two levers—measures to enable student persistence through graduation and reduce nonproductive credits—affect completion efficiency. The other three levers—improving instructional operations, core non-instructional supports and services, and noncore operations—affect cost efficiency. On each of the levers, the eight model institutions capture improvements in productivity that are three- to sixfold higher than those that the average top-quartile institution achieves (Exhibit 5). Specifically, while top-quartile institutions achieve an average of 23 percent higher productivity than average institutions, the highest performing institutions achieve up to 64 percent higher productivity—up to 50 percent higher than top-quartile institutions. As examples, Indiana Wesleyan University’s College of Adult & Professional Studies (IWU–CAPS) and Valencia Community College achieve about 30 percent and 50 percent higher productivity than the top-quartile institutions respectively in each of their peer group, each spending about $20,000 per degree less than their peers. However, the operational levers each has employed to achieve lower cost per degree are different: IWU–CAPS’s productivity is largely driven
by decreased cost per student while Valencia’s productivity is driven by both completion and cost efficiency (Exhibit 6).
Completion efficiency drivers
We found that low completion efficiency numbers are largely driven by a relatively high number of students who do not persist through graduation (low graduation rate) and/or students who take relatively more credits that can be classified as “nonproductive”—namely, credits that do not contribute to a degree because they constitute either failed or withdrawn classes, noncredit classes, transfer credits that are not accepted toward a degree, or credits taken that are above those required. This results in fewer seats available for new students or for students in need of those seats to graduate. From a systems perspective, ultimately, these equal added cost per degree completed.
Overall, we find high-performing institutions can improve their completion efficiency by up to 30 percent relative to their peer average. For instance, at Valencia Community College, it takes an average of 4.0 FTSEs for each two-year associate degree awarded, while peer institutions require 5.8 FTSEs per degree—making Valencia 31 percent more efficient.
We found that over a period of seven years, 51 percent of the credits taken in the State’s public institutions did not contribute to a degree.
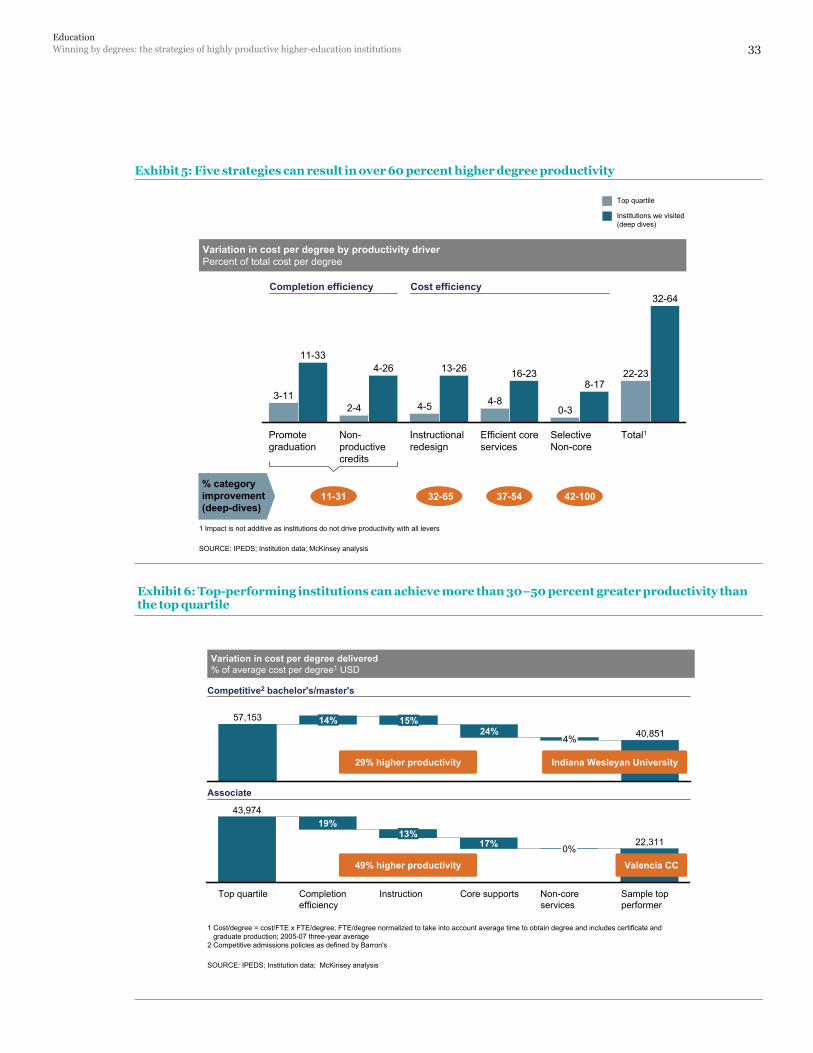
EducationWinning by degrees: the strategies of highly productive higher-education institutions 33
SOURCE: IPEDS; Institution data; McKinsey analysis
1 Cost/degree = cost/FTE x FTE/degree; FTE/degree normalized to take into account average time to obtain degree and includes certificate and graduate production; 2005-07 three-year average
2 Competitive admissions policies as defined by Barron's
Variation in cost per degree delivered% of average cost per degree1 USD
Competitive2 bachelor's/master's
Associate
Core supports
19%
17%
Top quartile Instruction
43,974
13%
Completion efficiency
0%
Sample top performer
22,311
Non-core services
24%15%14%57,153
40,8514%
49% higher productivity
29% higher productivity
Valencia CC
Indiana Wesleyan University
Exhibit 6: Top-performing institutions can achieve more than 30–50 percent greater productivity than the top quartile
1 Impact is not additive as institutions do not drive productivity with all levers
SOURCE: IPEDS; Institution data; McKinsey analysis
11-31 32-65 37-54 42-100
Total1
32-64
22-23
Selective Non-core
8-17
0-3
Efficient core services
16-23
4-8
Instructional redesign
13-26
4-5
Non-productive credits
4-26
2-4
Promote graduation
11-33
3-11
Variation in cost per degree by productivity driverPercent of total cost per degree
Top quartile
Institutions we visited (deep dives)
Completion efficiency Cost efficiency
% category improvement (deep-dives)
Exhibit 5: Five strategies can result in over 60 percent higher degree productivity
34
A state’s systems view helps to illustrate the impact of these two drivers. We analyzed state longitudinal data for the entering 2002 cohort for State A higher education system with transcript-level data for all students through Q2 2010.50 We found that over a period of seven years, 51 percent of the credits taken in the State’s public institutions did not contribute to a degree. Of these, 21 percent, although taken by students who went on to graduate, were nonproductive due to course failure or withdrawal, non-credit-bearing courses such as developmental education, or courses taken beyond the required number of credits (i.e., students who were “overcredit”). The additional 30 percentage points are attributed to students who did not to graduate (Exhibit 7). Of the 30 points, roughly half, 16 percentage points, were credits taken by nongraduating developmental education students (see sidebar “Developmental Education).
Not surprisingly then, we find that the two key drivers that improve completion efficiency are (1) measures to promote graduation and (2) measures that reduce nonproductive credits.
Systematically enabling students to reach graduation
Graduation rates vary widely across institutions even within peer groups. We find that graduation rates typically range from about 19 percent to 45 percent for community colleges and from 37 percent to 62 percent for four-year institutions.51
To address low completion rates, many institutions have experimented, and succeeded, in implementing reforms to drive up completion to the tune of up to 27 percent. We find that these changes are centered on four key themes: (i) structured pathways
to graduation; (ii) effective student supports and services; (iii) effective developmental education; and (iv) effective student acceptance, placement, and preparation programs.52 Importantly, these themes are not implemented in isolation, but rather are put in place together. For that reason it is difficult to identify the impact of each lever independently. Instead it is necessary to look at the improved system as a whole. Some examples of the implementation of these initiatives are shared below.
� Valencia Community College is a member of Achieving the Dream, a network of 100 institutions in 22 states focused on increasing student completion and other measures of student success. At Valencia, graduation rates are 15 percentage points above peers. The school’s portfolio of reforms includes innovations in developmental education, such as a student cohort model, a credit-bearing”student success” course to help students develop the skills needed to succeed in college, as well as tools to help students plan their path to completion and beyond (e.g., LifeMap). In addition, leaders at Valencia Community College are passionate about “seeing the college through the eyes of the student” and work hard to foster a culture of completion. With this mind-set, they have redesigned critical student support processes, such as financial aid and registration, to ensure streamlined processes, high quality of service, and high “customer satisfaction.” What’s more, while the “lean processes” approach has driven down costs for support services such as financial aid and student records relative to some peers, Valencia continues to invest more in counseling and career services—nearly 25 percent more than one peer system with low graduation rates. To help the school tailor its interventions to the needs of each student, Valencia segments
50 Previous analysis demonstrated that State A institutions exhibit completion efficiency that is similar to the U.S. average and so we use it as a proxy for what may be occurring broadly across the country.
51 First-time, full-time graduation rates within 150 percent of expected time as reported by IPEDS. Ranges represent top and bottom quartiles
52 These findings agree with and build on the work of experts in the field. See for example, Douglas Webber and Ronald Ehrenberg, “Do expenditures other than instructional expenditures affect graduation and persistence rates in American higher education?” August 2009. See also Jeremy Offenstein, Colleen Moore, Nancy Shulock, “Advancing by Degrees: A Framework for Increasing College Completion”, Education Trust, April 2010.
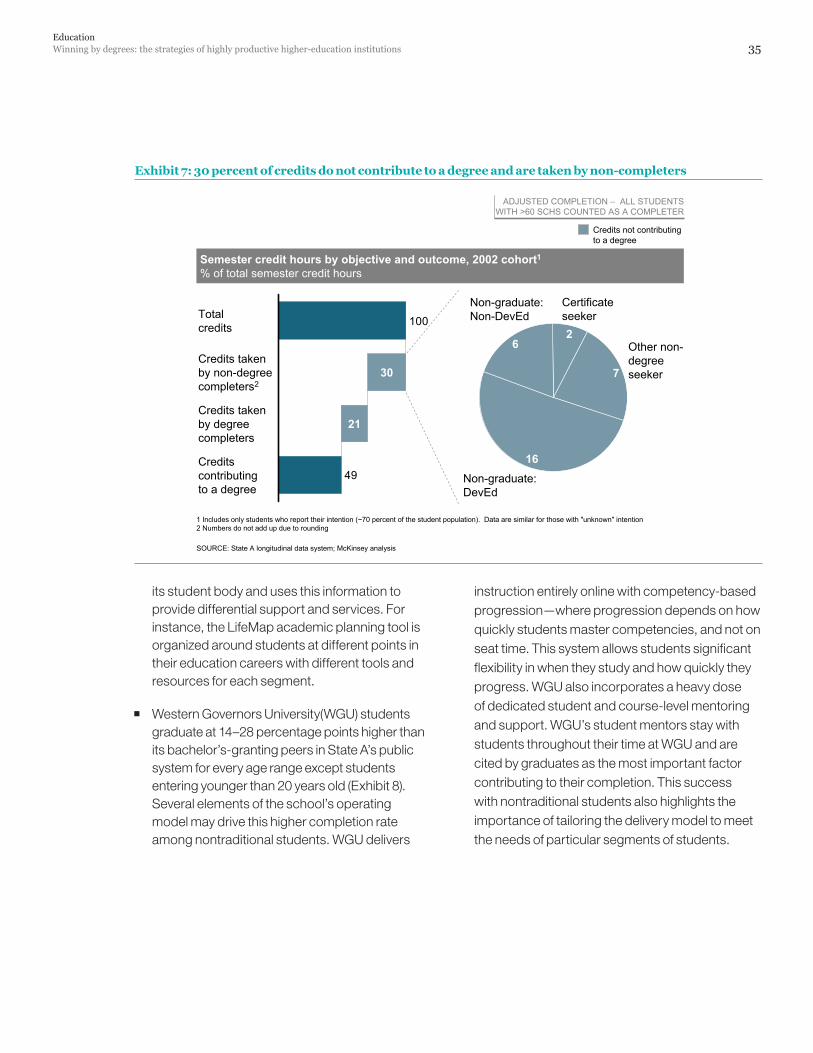
EducationWinning by degrees: the strategies of highly productive higher-education institutions 35
49
100
Creditscontributingto a degree
Credits takenby degreecompleters
21
Credits takenby non-degreecompleters2
30
Totalcredits
Non-graduate:Non-DevEd
6
Non-graduate:DevEd
16
Other non-degreeseeker7
Certificateseeker2
Credits not contributing to a degree
1 Includes only students who report their intention (~70 percent of the student population). Data are similar for those with "unknown" intention2 Numbers do not add up due to rounding
SOURCE: State A longitudinal data system; McKinsey analysis
ADJUSTED COMPLETION – ALL STUDENTSWITH >60 SCHS COUNTED AS A COMPLETER
Semester credit hours by objective and outcome, 2002 cohort1
% of total semester credit hours
Exhibit 7: 30 percent of credits do not contribute to a degree and are taken by non-completers
its student body and uses this information to provide differential support and services. For instance, the LifeMap academic planning tool is organized around students at different points in their education careers with different tools and resources for each segment.
� Western Governors University(WGU) students graduate at 14–28 percentage points higher than its bachelor’s-granting peers in State A’s public system for every age range except students entering younger than 20 years old (Exhibit 8). Several elements of the school’s operating model may drive this higher completion rate among nontraditional students. WGU delivers
instruction entirely online with competency-based progression—where progression depends on how quickly students master competencies, and not on seat time. This system allows students significant flexibility in when they study and how quickly they progress. WGU also incorporates a heavy dose of dedicated student and course-level mentoring and support. WGU’s student mentors stay with students throughout their time at WGU and are cited by graduates as the most important factor contributing to their completion. This success with nontraditional students also highlights the importance of tailoring the delivery model to meet the needs of particular segments of students.
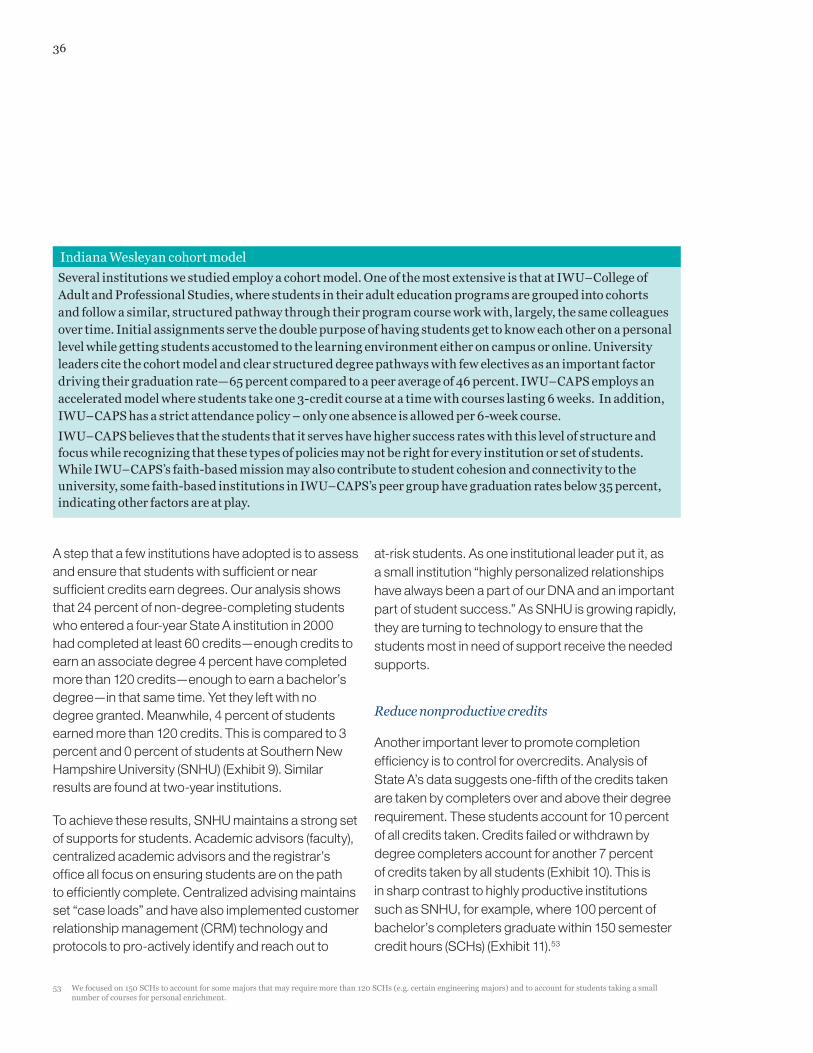
36
Indiana Wesleyan cohort model
Several institutions we studied employ a cohort model. One of the most extensive is that at IWU–College of Adult and Professional Studies, where students in their adult education programs are grouped into cohorts and follow a similar, structured pathway through their program course work with, largely, the same colleagues over time. Initial assignments serve the double purpose of having students get to know each other on a personal level while getting students accustomed to the learning environment either on campus or online. University leaders cite the cohort model and clear structured degree pathways with few electives as an important factor driving their graduation rate—65 percent compared to a peer average of 46 percent. IWU–CAPS employs an accelerated model where students take one 3-credit course at a time with courses lasting 6 weeks. In addition, IWU–CAPS has a strict attendance policy – only one absence is allowed per 6-week course.
IWU–CAPS believes that the students that it serves have higher success rates with this level of structure and focus while recognizing that these types of policies may not be right for every institution or set of students. While IWU–CAPS’s faith-based mission may also contribute to student cohesion and connectivity to the university, some faith-based institutions in IWU–CAPS’s peer group have graduation rates below 35 percent, indicating other factors are at play.
53 We focused on 150 SCHs to account for some majors that may require more than 120 SCHs (e.g. certain engineering majors) and to account for students taking a small number of courses for personal enrichment.
A step that a few institutions have adopted is to assess and ensure that students with sufficient or near sufficient credits earn degrees. Our analysis shows that 24 percent of non-degree-completing students who entered a four-year State A institution in 2000 had completed at least 60 credits—enough credits to earn an associate degree 4 percent have completed more than 120 credits—enough to earn a bachelor’s degree—in that same time. Yet they left with no degree granted. Meanwhile, 4 percent of students earned more than 120 credits. This is compared to 3 percent and 0 percent of students at Southern New Hampshire University (SNHU) (Exhibit 9). Similar results are found at two-year institutions.
To achieve these results, SNHU maintains a strong set of supports for students. Academic advisors (faculty), centralized academic advisors and the registrar’s office all focus on ensuring students are on the path to efficiently complete. Centralized advising maintains set “case loads” and have also implemented customer relationship management (CRM) technology and protocols to pro-actively identify and reach out to
at-risk students. As one institutional leader put it, as a small institution “highly personalized relationships have always been a part of our DNA and an important part of student success.” As SNHU is growing rapidly, they are turning to technology to ensure that the students most in need of support receive the needed supports.
Reduce nonproductive credits
Another important lever to promote completion efficiency is to control for overcredits. Analysis of State A’s data suggests one-fifth of the credits taken are taken by completers over and above their degree requirement. These students account for 10 percent of all credits taken. Credits failed or withdrawn by degree completers account for another 7 percent of credits taken by all students (Exhibit 10). This is in sharp contrast to highly productive institutions such as SNHU, for example, where 100 percent of bachelor’s completers graduate within 150 semester credit hours (SCHs) (Exhibit 11).53
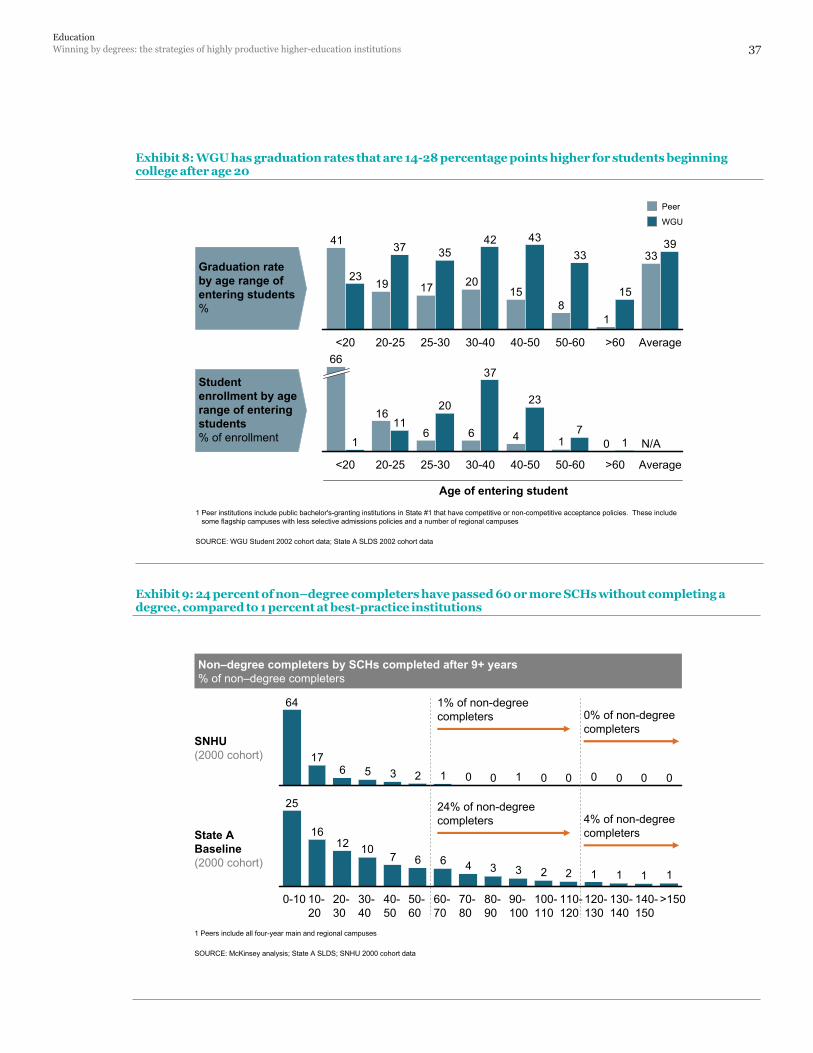
EducationWinning by degrees: the strategies of highly productive higher-education institutions 37
1 Peers include all four-year main and regional campuses
1111223346671012
16
25
>150140-150
130-140
120-130
110-120
100-110
90-100
80-90
70-80
60-70
50-60
40-50
30-40
20-30
10-20
0-10
State ABaseline(2000 cohort)
SNHU(2000 cohort)
SOURCE: McKinsey analysis; State A SLDS; SNHU 2000 cohort data
0000001001235617
64
Non–degree completers by SCHs completed after 9+ years% of non–degree completers
1% of non-degree completers 0% of non-degree
completers
24% of non-degree completers 4% of non-degree
completers
Exhibit 9: 24 percent of non–degree completers have passed 60 or more SCHs without completing a degree, compared to 1 percent at best-practice institutions
33
18
15201719
41 39
15
334342
3537
23
Average>6050-6040-5030-4025-3020-25<20
01466
16
17
23
37
2011
1
Average
N/A
>6050-6040-5030-4025-3020-25<20
66
1 Peer institutions include public bachelor's-granting institutions in State #1 that have competitive or non-competitive acceptance policies. These include some flagship campuses with less selective admissions policies and a number of regional campuses
SOURCE: WGU Student 2002 cohort data; State A SLDS 2002 cohort data
Peer
WGU
Graduation rate by age range of entering students%
Student enrollment by age range of entering students% of enrollment
Age of entering student
Exhibit 8: WGU has graduation rates that are 14-28 percentage points higher for students beginning college after age 20
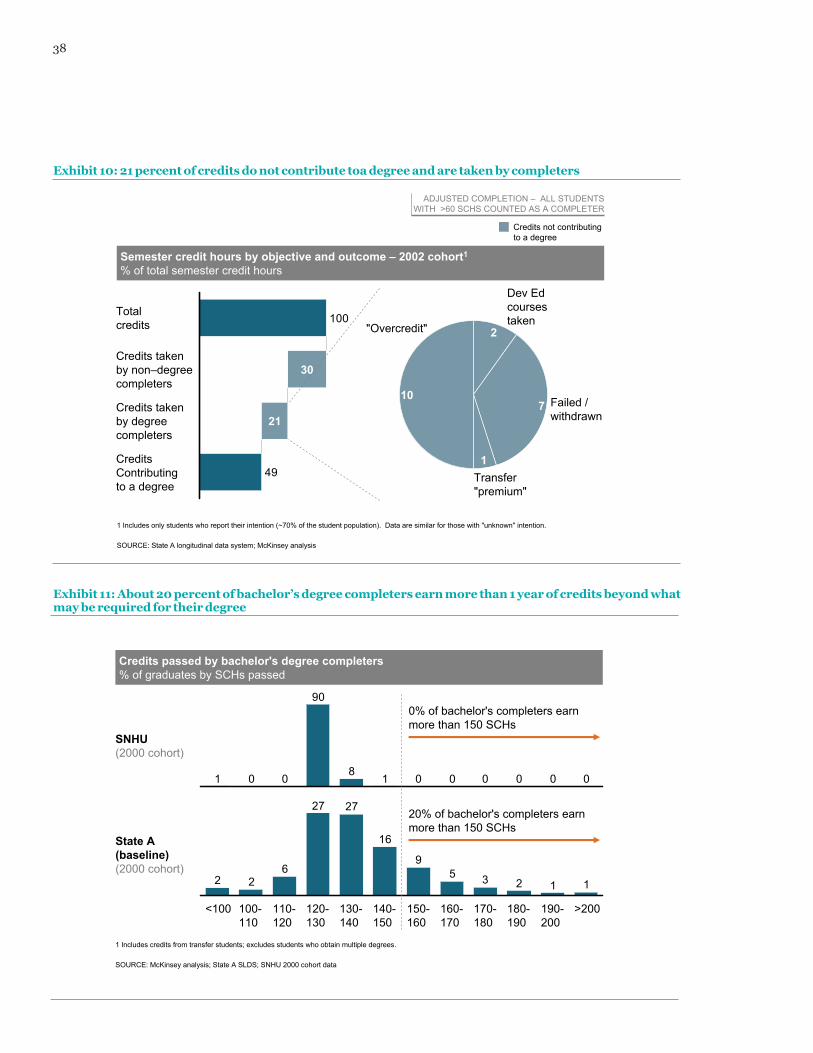
38
00000018
90
001
112359
16
2727
622
>200190-200
180-190
170-180
160-170
150-160
140-150
130-140
120-130
110-120
100-110
<100
1 Includes credits from transfer students; excludes students who obtain multiple degrees.
SOURCE: McKinsey analysis; State A SLDS; SNHU 2000 cohort data
Credits passed by bachelor's degree completers% of graduates by SCHs passed
State A(baseline)(2000 cohort)
SNHU(2000 cohort)
0% of bachelor's completers earn more than 150 SCHs
20% of bachelor's completers earn more than 150 SCHs
Exhibit 11: About 20 percent of bachelor’s degree completers earn more than 1 year of credits beyond what may be required for their degree
100
49
Totalcredits
30
CreditsContributingto a degree
Credits takenby degreecompleters
Credits takenby non–degreecompleters
21
10
"Overcredit"
1Transfer"premium"
7 Failed /withdrawn
2
Dev Edcoursestaken
1 Includes only students who report their intention (~70% of the student population). Data are similar for those with "unknown" intention.
SOURCE: State A longitudinal data system; McKinsey analysis
ADJUSTED COMPLETION – ALL STUDENTSWITH >60 SCHS COUNTED AS A COMPLETER
Credits not contributing to a degree
Semester credit hours by objective and outcome – 2002 cohort1
% of total semester credit hours
Exhibit 10: 21 percent of credits do not contribute toa degree and are taken by completers
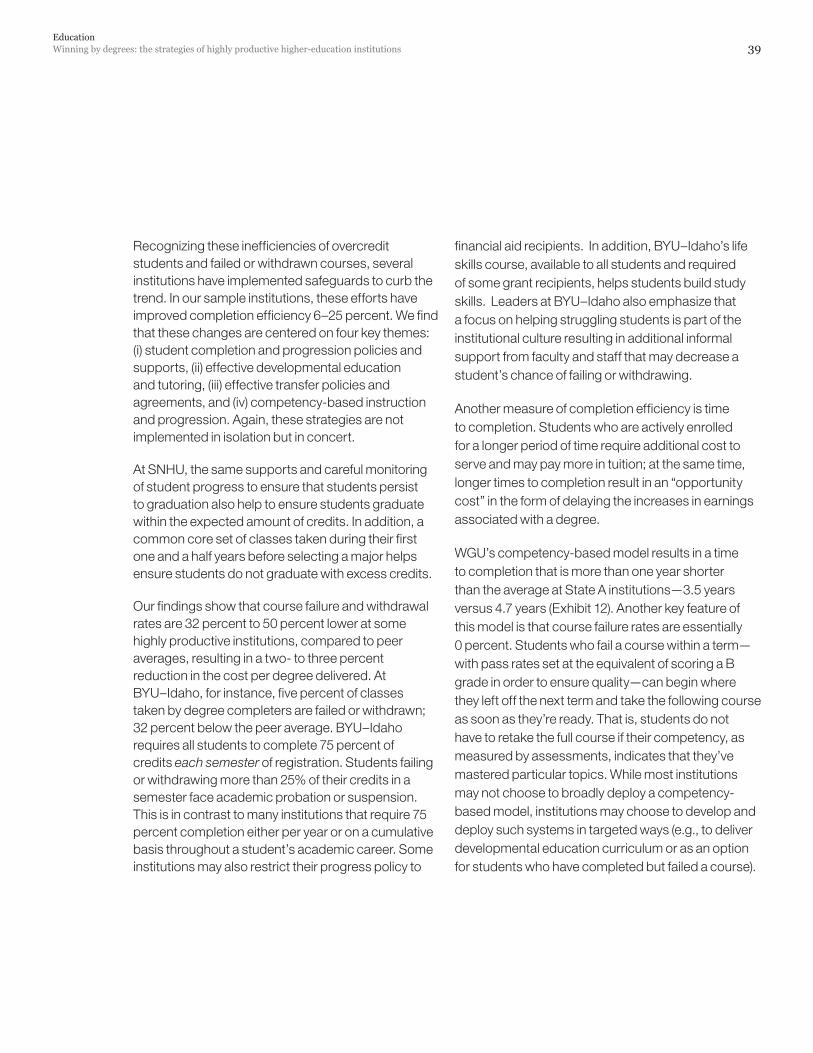
EducationWinning by degrees: the strategies of highly productive higher-education institutions 39
Recognizing these inefficiencies of overcredit students and failed or withdrawn courses, several institutions have implemented safeguards to curb the trend. In our sample institutions, these efforts have improved completion efficiency 6–25 percent. We find that these changes are centered on four key themes: (i) student completion and progression policies and supports, (ii) effective developmental education and tutoring, (iii) effective transfer policies and agreements, and (iv) competency-based instruction and progression. Again, these strategies are not implemented in isolation but in concert.
At SNHU, the same supports and careful monitoring of student progress to ensure that students persist to graduation also help to ensure students graduate within the expected amount of credits. In addition, a common core set of classes taken during their first one and a half years before selecting a major helps ensure students do not graduate with excess credits.
Our findings show that course failure and withdrawal rates are 32 percent to 50 percent lower at some highly productive institutions, compared to peer averages, resulting in a two- to three percent reduction in the cost per degree delivered. At BYU–Idaho, for instance, five percent of classes taken by degree completers are failed or withdrawn; 32 percent below the peer average. BYU–Idaho requires all students to complete 75 percent of credits each semester of registration. Students failing or withdrawing more than 25% of their credits in a semester face academic probation or suspension. This is in contrast to many institutions that require 75 percent completion either per year or on a cumulative basis throughout a student’s academic career. Some institutions may also restrict their progress policy to
financial aid recipients. In addition, BYU–Idaho’s life skills course, available to all students and required of some grant recipients, helps students build study skills. Leaders at BYU–Idaho also emphasize that a focus on helping struggling students is part of the institutional culture resulting in additional informal support from faculty and staff that may decrease a student’s chance of failing or withdrawing.
Another measure of completion efficiency is time to completion. Students who are actively enrolled for a longer period of time require additional cost to serve and may pay more in tuition; at the same time, longer times to completion result in an “opportunity cost” in the form of delaying the increases in earnings associated with a degree.
WGU’s competency-based model results in a time to completion that is more than one year shorter than the average at State A institutions—3.5 years versus 4.7 years (Exhibit 12). Another key feature of this model is that course failure rates are essentially 0 percent. Students who fail a course within a term—with pass rates set at the equivalent of scoring a B grade in order to ensure quality—can begin where they left off the next term and take the following course as soon as they’re ready. That is, students do not have to retake the full course if their competency, as measured by assessments, indicates that they’ve mastered particular topics. While most institutions may not choose to broadly deploy a competency-based model, institutions may choose to develop and deploy such systems in targeted ways (e.g., to deliver developmental education curriculum or as an option for students who have completed but failed a course).
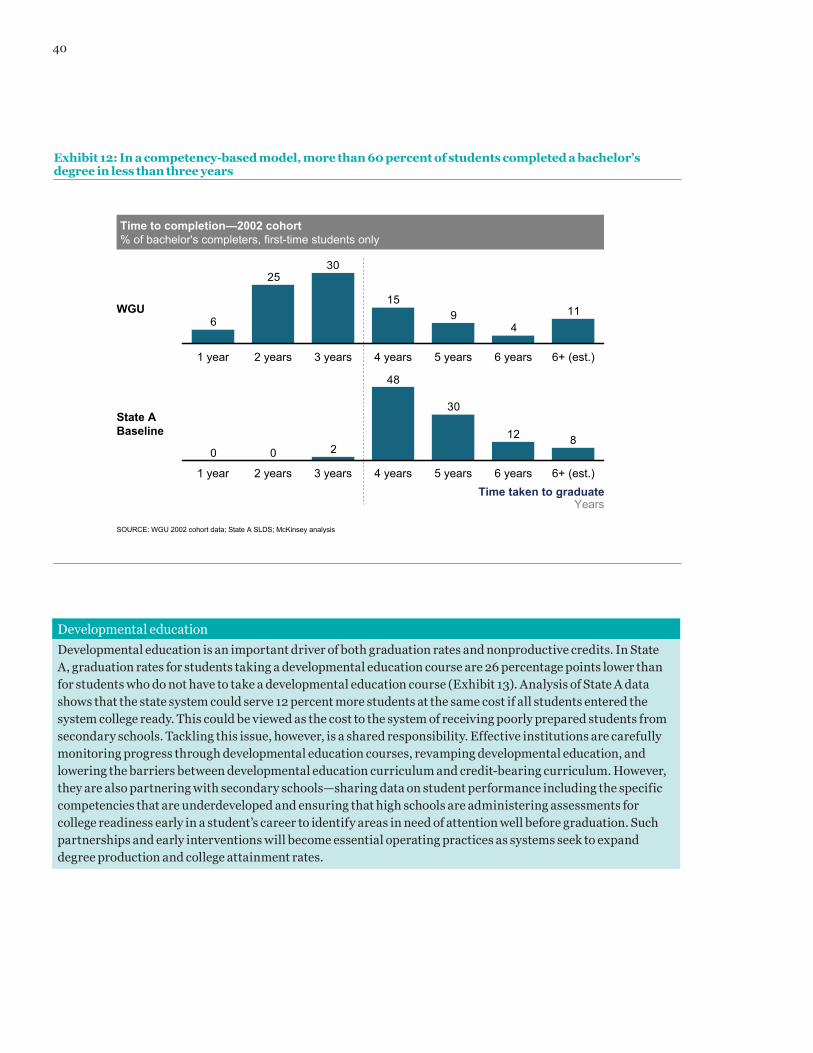
40
812
30
48
200
Time taken to graduateYears
6+ (est.)6 years5 years4 years3 years2 years1 year
SOURCE: WGU 2002 cohort data; State A SLDS; McKinsey analysis
Time to completion—2002 cohort% of bachelor's completers, first-time students only
114
915
3025
6
6+ (est.)6 years5 years4 years3 years2 years1 year
State A Baseline
WGU
Exhibit 12: In a competency-based model, more than 60 percent of students completed a bachelor’s degree in less than three years
Developmental education
Developmental education is an important driver of both graduation rates and nonproductive credits. In State A, graduation rates for students taking a developmental education course are 26 percentage points lower than for students who do not have to take a developmental education course (Exhibit 13). Analysis of State A data shows that the state system could serve 12 percent more students at the same cost if all students entered the system college ready. This could be viewed as the cost to the system of receiving poorly prepared students from secondary schools. Tackling this issue, however, is a shared responsibility. Effective institutions are carefully monitoring progress through developmental education courses, revamping developmental education, and lowering the barriers between developmental education curriculum and credit-bearing curriculum. However, they are also partnering with secondary schools—sharing data on student performance including the specific competencies that are underdeveloped and ensuring that high schools are administering assessments for college readiness early in a student’s career to identify areas in need of attention well before graduation. Such partnerships and early interventions will become essential operating practices as systems seek to expand degree production and college attainment rates.
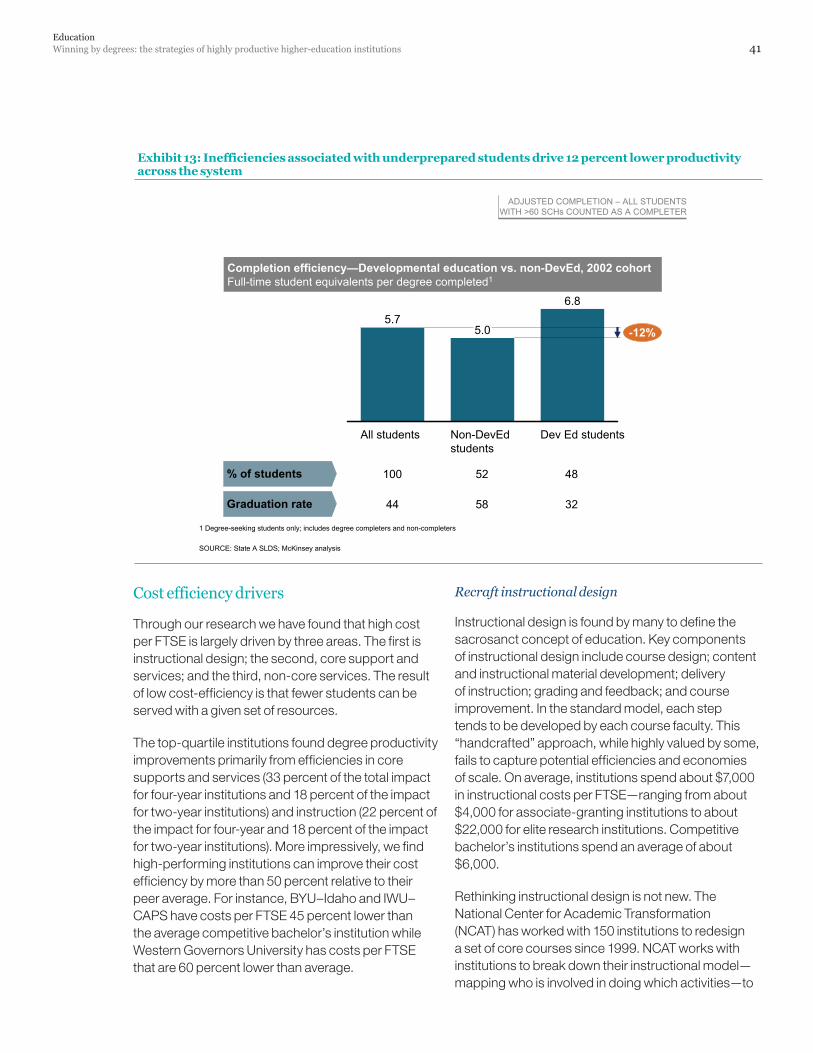
EducationWinning by degrees: the strategies of highly productive higher-education institutions 41
Cost efficiency drivers
Through our research we have found that high cost per FTSE is largely driven by three areas. The first is instructional design; the second, core support and services; and the third, non-core services. The result of low cost-efficiency is that fewer students can be served with a given set of resources.
The top-quartile institutions found degree productivity improvements primarily from efficiencies in core supports and services (33 percent of the total impact for four-year institutions and 18 percent of the impact for two-year institutions) and instruction (22 percent of the impact for four-year and 18 percent of the impact for two-year institutions). More impressively, we find high-performing institutions can improve their cost efficiency by more than 50 percent relative to their peer average. For instance, BYU–Idaho and IWU–CAPS have costs per FTSE 45 percent lower than the average competitive bachelor’s institution while Western Governors University has costs per FTSE that are 60 percent lower than average.
Recraft instructional design
Instructional design is found by many to define the sacrosanct concept of education. Key components of instructional design include course design; content and instructional material development; delivery of instruction; grading and feedback; and course improvement. In the standard model, each step tends to be developed by each course faculty. This “handcrafted” approach, while highly valued by some, fails to capture potential efficiencies and economies of scale. On average, institutions spend about $7,000 in instructional costs per FTSE—ranging from about $4,000 for associate-granting institutions to about $22,000 for elite research institutions. Competitive bachelor’s institutions spend an average of about $6,000.
Rethinking instructional design is not new. The National Center for Academic Transformation (NCAT) has worked with 150 institutions to redesign a set of core courses since 1999. NCAT works with institutions to break down their instructional model—mapping who is involved in doing which activities—to
6.8
Dev Ed studentsAll students
5.7
Non-DevEdstudents
5.0 -12%
SOURCE: State A SLDS; McKinsey analysis
1 Degree-seeking students only; includes degree completers and non-completers
ADJUSTED COMPLETION – ALL STUDENTSWITH >60 SCHs COUNTED AS A COMPLETER
Completion efficiency—Developmental education vs. non-DevEd, 2002 cohortFull-time student equivalents per degree completed1
Graduation rate
% of students 100 52 48
44 58 32
Exhibit 13: Inefficiencies associated with underprepared students drive 12 percent lower productivity across the system
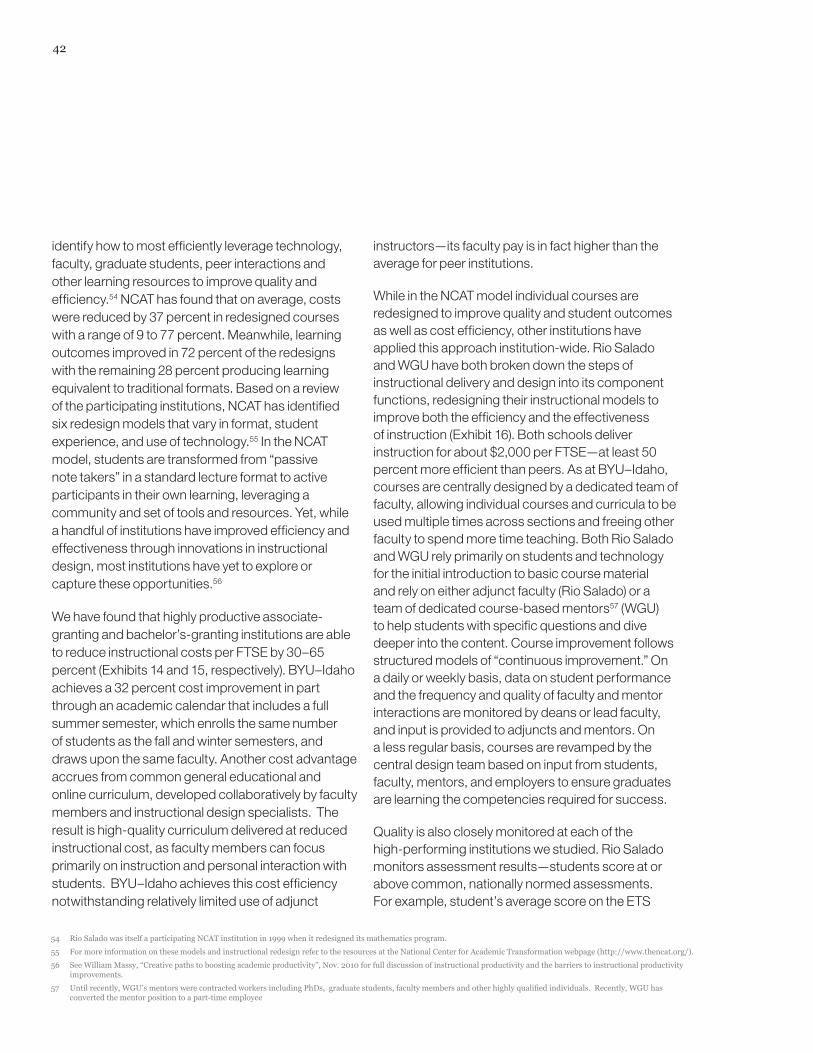
42
54 Rio Salado was itself a participating NCAT institution in 1999 when it redesigned its mathematics program.
55 For more information on these models and instructional redesign refer to the resources at the National Center for Academic Transformation webpage (http://www.thencat.org/).
56 See William Massy, “Creative paths to boosting academic productivity”, Nov. 2010 for full discussion of instructional productivity and the barriers to instructional productivity improvements.
57 Until recently, WGU’s mentors were contracted workers including PhDs, graduate students, faculty members and other highly qualified individuals. Recently, WGU has converted the mentor position to a part-time employee
identify how to most efficiently leverage technology, faculty, graduate students, peer interactions and other learning resources to improve quality and efficiency.54 NCAT has found that on average, costs were reduced by 37 percent in redesigned courses with a range of 9 to 77 percent. Meanwhile, learning outcomes improved in 72 percent of the redesigns with the remaining 28 percent producing learning equivalent to traditional formats. Based on a review of the participating institutions, NCAT has identified six redesign models that vary in format, student experience, and use of technology.55 In the NCAT model, students are transformed from “passive note takers” in a standard lecture format to active participants in their own learning, leveraging a community and set of tools and resources. Yet, while a handful of institutions have improved efficiency and effectiveness through innovations in instructional design, most institutions have yet to explore or capture these opportunities.56
We have found that highly productive associate-granting and bachelor’s-granting institutions are able to reduce instructional costs per FTSE by 30–65 percent (Exhibits 14 and 15, respectively). BYU–Idaho achieves a 32 percent cost improvement in part through an academic calendar that includes a full summer semester, which enrolls the same number of students as the fall and winter semesters, and draws upon the same faculty. Another cost advantage accrues from common general educational and online curriculum, developed collaboratively by faculty members and instructional design specialists. The result is high-quality curriculum delivered at reduced instructional cost, as faculty members can focus primarily on instruction and personal interaction with students. BYU–Idaho achieves this cost efficiency notwithstanding relatively limited use of adjunct
instructors—its faculty pay is in fact higher than the average for peer institutions.
While in the NCAT model individual courses are redesigned to improve quality and student outcomes as well as cost efficiency, other institutions have applied this approach institution-wide. Rio Salado and WGU have both broken down the steps of instructional delivery and design into its component functions, redesigning their instructional models to improve both the efficiency and the effectiveness of instruction (Exhibit 16). Both schools deliver instruction for about $2,000 per FTSE—at least 50 percent more efficient than peers. As at BYU–Idaho, courses are centrally designed by a dedicated team of faculty, allowing individual courses and curricula to be used multiple times across sections and freeing other faculty to spend more time teaching. Both Rio Salado and WGU rely primarily on students and technology for the initial introduction to basic course material and rely on either adjunct faculty (Rio Salado) or a team of dedicated course-based mentors57 (WGU) to help students with specific questions and dive deeper into the content. Course improvement follows structured models of “continuous improvement.” On a daily or weekly basis, data on student performance and the frequency and quality of faculty and mentor interactions are monitored by deans or lead faculty, and input is provided to adjuncts and mentors. On a less regular basis, courses are revamped by the central design team based on input from students, faculty, mentors, and employers to ensure graduates are learning the competencies required for success.
Quality is also closely monitored at each of the high-performing institutions we studied. Rio Salado monitors assessment results—students score at or above common, nationally normed assessments. For example, student’s average score on the ETS
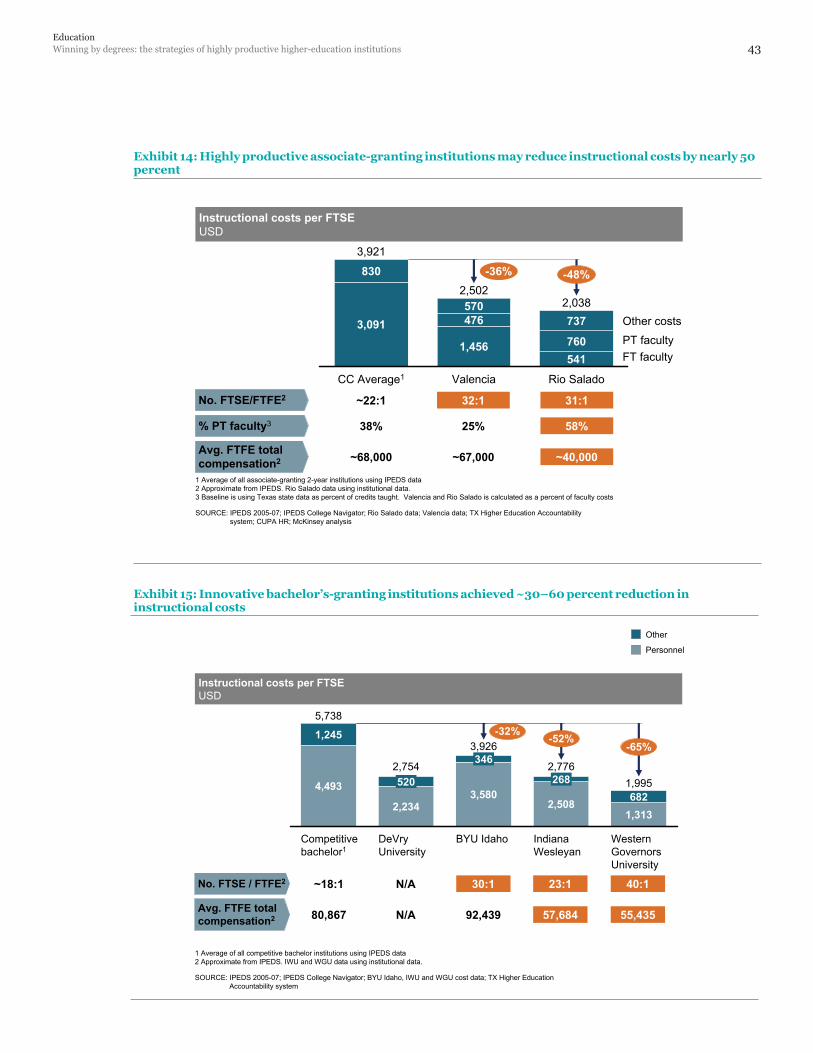
EducationWinning by degrees: the strategies of highly productive higher-education institutions 43
SOURCE: IPEDS 2005-07; IPEDS College Navigator; BYU Idaho, IWU and WGU cost data; TX Higher Education Accountability system
1 Average of all competitive bachelor institutions using IPEDS data2 Approximate from IPEDS. IWU and WGU data using institutional data.
1,245
DeVryUniversity
682
346
2,234
4,493 2682,754
3,580
2,776
Indiana Wesleyan
1,995
1,313
BYU Idaho Western Governors University
2,508
3,926
520
Competitive bachelor1
5,738-32%
-65%-52%
Instructional costs per FTSEUSD
Other
Personnel
No. FTSE / FTFE2
Avg. FTFE total compensation2
~18:1
80,867
N/A
N/A
30:1
92,439
23:1
57,684
40:1
55,435
Exhibit 15: Innovative bachelor’s-granting institutions achieved ~30–60 percent reduction in instructional costs
541 FT faculty760
2,5022,038737
Valencia
1,456 PT faculty
476570
CC Average1
Other costs
Rio Salado
3,921
3,091
830 -36% -48%
SOURCE: IPEDS 2005-07; IPEDS College Navigator; Rio Salado data; Valencia data; TX Higher Education Accountability system; CUPA HR; McKinsey analysis
1 Average of all associate-granting 2-year institutions using IPEDS data2 Approximate from IPEDS. Rio Salado data using institutional data.3 Baseline is using Texas state data as percent of credits taught. Valencia and Rio Salado is calculated as a percent of faculty costs
Instructional costs per FTSEUSD
No. FTSE/FTFE2
% PT faculty3
Avg. FTFE total compensation2
~22:1 32:1 31:1
38% 25% 58%
~68,000 ~67,000 ~40,000
Exhibit 14: Highly productive associate-granting institutions may reduce instructional costs by nearly 50 percent
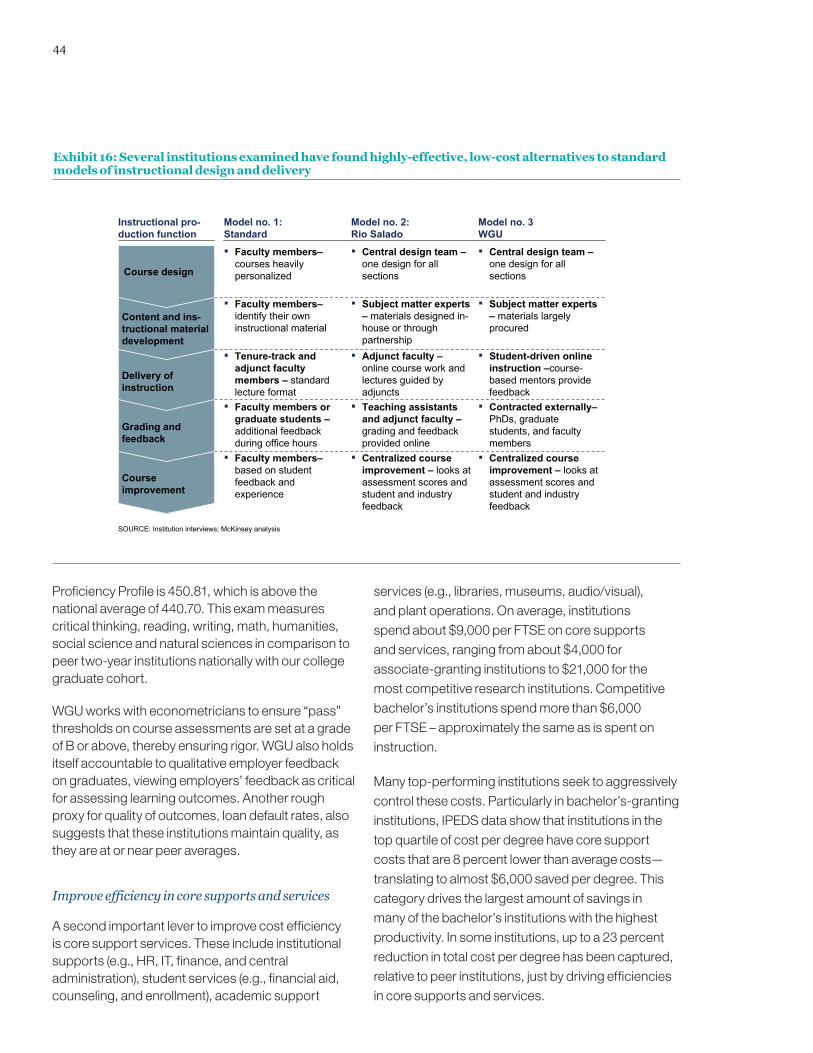
44
Proficiency Profile is 450.81, which is above the national average of 440.70. This exam measures critical thinking, reading, writing, math, humanities, social science and natural sciences in comparison to peer two-year institutions nationally with our college graduate cohort.
WGU works with econometricians to ensure “pass” thresholds on course assessments are set at a grade of B or above, thereby ensuring rigor. WGU also holds itself accountable to qualitative employer feedback on graduates, viewing employers’ feedback as critical for assessing learning outcomes. Another rough proxy for quality of outcomes, loan default rates, also suggests that these institutions maintain quality, as they are at or near peer averages.
Improve efficiency in core supports and services
A second important lever to improve cost efficiency is core support services. These include institutional supports (e.g., HR, IT, finance, and central administration), student services (e.g., financial aid, counseling, and enrollment), academic support
services (e.g., libraries, museums, audio/visual), and plant operations. On average, institutions spend about $9,000 per FTSE on core supports and services, ranging from about $4,000 for associate-granting institutions to $21,000 for the most competitive research institutions. Competitive bachelor’s institutions spend more than $6,000 per FTSE – approximately the same as is spent on instruction.
Many top-performing institutions seek to aggressively control these costs. Particularly in bachelor’s-granting institutions, IPEDS data show that institutions in the top quartile of cost per degree have core support costs that are 8 percent lower than average costs—translating to almost $6,000 saved per degree. This category drives the largest amount of savings in many of the bachelor’s institutions with the highest productivity. In some institutions, up to a 23 percent reduction in total cost per degree has been captured, relative to peer institutions, just by driving efficiencies in core supports and services.
SOURCE: Institution interviews; McKinsey analysis
Course design
Delivery of instruction
Content and ins-tructional material development
Grading and feedback
Course improvement
Model no. 3WGU
Model no. 2:Rio Salado
Model no. 1:Standard
▪ Faculty members–courses heavily personalized
▪ Central design team –one design for all sections
▪ Central design team –one design for all sections
▪ Faculty members–identify their own instructional material
▪ Subject matter experts – materials designed in-house or through partnership
▪ Subject matter experts – materials largely procured
▪ Tenure-track and adjunct faculty members – standard lecture format
▪ Adjunct faculty –online course work and lectures guided by adjuncts
▪ Student-driven online instruction –course-based mentors provide feedback
▪ Faculty members or graduate students –additional feedback during office hours
▪ Teaching assistants and adjunct faculty –grading and feedback provided online
▪ Contracted externally–PhDs, graduate students, and faculty members
▪ Faculty members–based on student feedback and experience
▪ Centralized course improvement – looks at assessment scores and student and industry feedback
▪ Centralized course improvement – looks at assessment scores and student and industry feedback
Instructional pro-duction function
Exhibit 16: Several institutions examined have found highly-effective, low-cost alternatives to standard models of instructional design and delivery
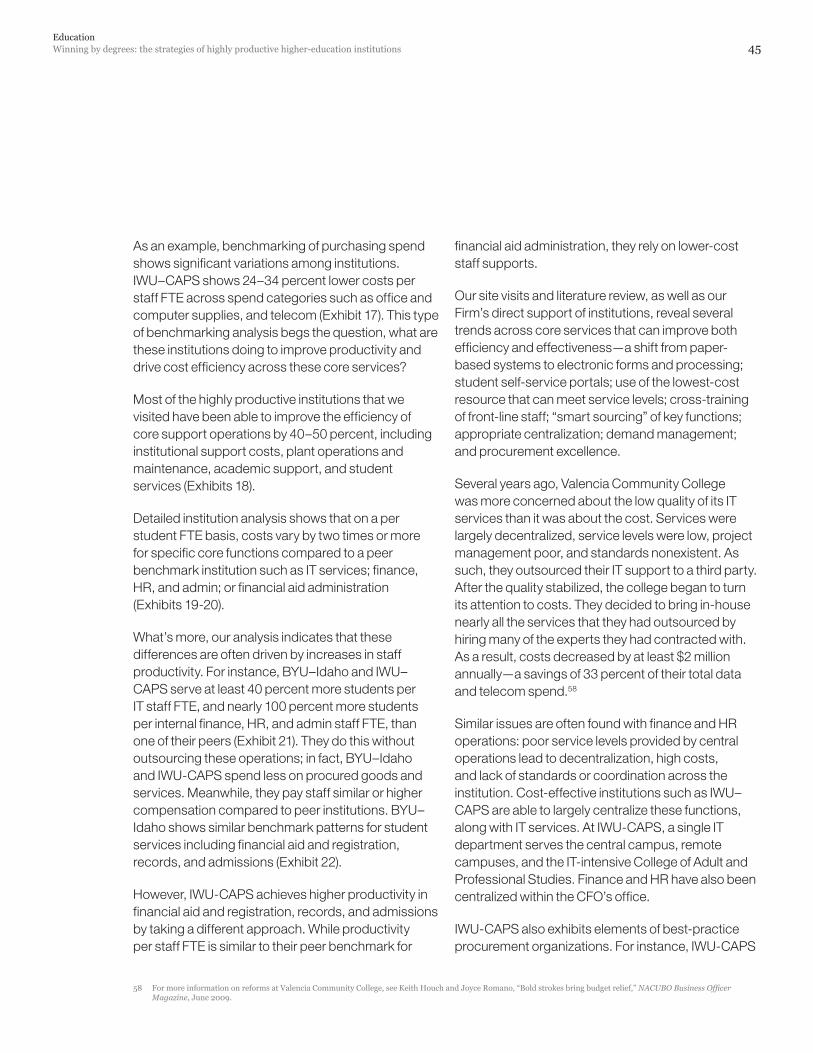
EducationWinning by degrees: the strategies of highly productive higher-education institutions 45
As an example, benchmarking of purchasing spend shows significant variations among institutions. IWU–CAPS shows 24–34 percent lower costs per staff FTE across spend categories such as office and computer supplies, and telecom (Exhibit 17). This type of benchmarking analysis begs the question, what are these institutions doing to improve productivity and drive cost efficiency across these core services?
Most of the highly productive institutions that we visited have been able to improve the efficiency of core support operations by 40–50 percent, including institutional support costs, plant operations and maintenance, academic support, and student services (Exhibits 18).
Detailed institution analysis shows that on a per student FTE basis, costs vary by two times or more for specific core functions compared to a peer benchmark institution such as IT services; finance, HR, and admin; or financial aid administration (Exhibits 19-20).
What’s more, our analysis indicates that these differences are often driven by increases in staff productivity. For instance, BYU–Idaho and IWU–CAPS serve at least 40 percent more students per IT staff FTE, and nearly 100 percent more students per internal finance, HR, and admin staff FTE, than one of their peers (Exhibit 21). They do this without outsourcing these operations; in fact, BYU–Idaho and IWU-CAPS spend less on procured goods and services. Meanwhile, they pay staff similar or higher compensation compared to peer institutions. BYU–Idaho shows similar benchmark patterns for student services including financial aid and registration, records, and admissions (Exhibit 22).
However, IWU-CAPS achieves higher productivity in financial aid and registration, records, and admissions by taking a different approach. While productivity per staff FTE is similar to their peer benchmark for
financial aid administration, they rely on lower-cost staff supports.
Our site visits and literature review, as well as our Firm’s direct support of institutions, reveal several trends across core services that can improve both efficiency and effectiveness—a shift from paper-based systems to electronic forms and processing; student self-service portals; use of the lowest-cost resource that can meet service levels; cross-training of front-line staff; “smart sourcing” of key functions; appropriate centralization; demand management; and procurement excellence.
Several years ago, Valencia Community College was more concerned about the low quality of its IT services than it was about the cost. Services were largely decentralized, service levels were low, project management poor, and standards nonexistent. As such, they outsourced their IT support to a third party. After the quality stabilized, the college began to turn its attention to costs. They decided to bring in-house nearly all the services that they had outsourced by hiring many of the experts they had contracted with. As a result, costs decreased by at least $2 million annually—a savings of 33 percent of their total data and telecom spend.58
Similar issues are often found with finance and HR operations: poor service levels provided by central operations lead to decentralization, high costs, and lack of standards or coordination across the institution. Cost-effective institutions such as IWU–CAPS are able to largely centralize these functions, along with IT services. At IWU-CAPS, a single IT department serves the central campus, remote campuses, and the IT-intensive College of Adult and Professional Studies. Finance and HR have also been centralized within the CFO’s office.
IWU-CAPS also exhibits elements of best-practice procurement organizations. For instance, IWU-CAPS
58 For more information on reforms at Valencia Community College, see Keith Houch and Joyce Romano, “Bold strokes bring budget relief,” NACUBO Business Officer Magazine, June 2009.
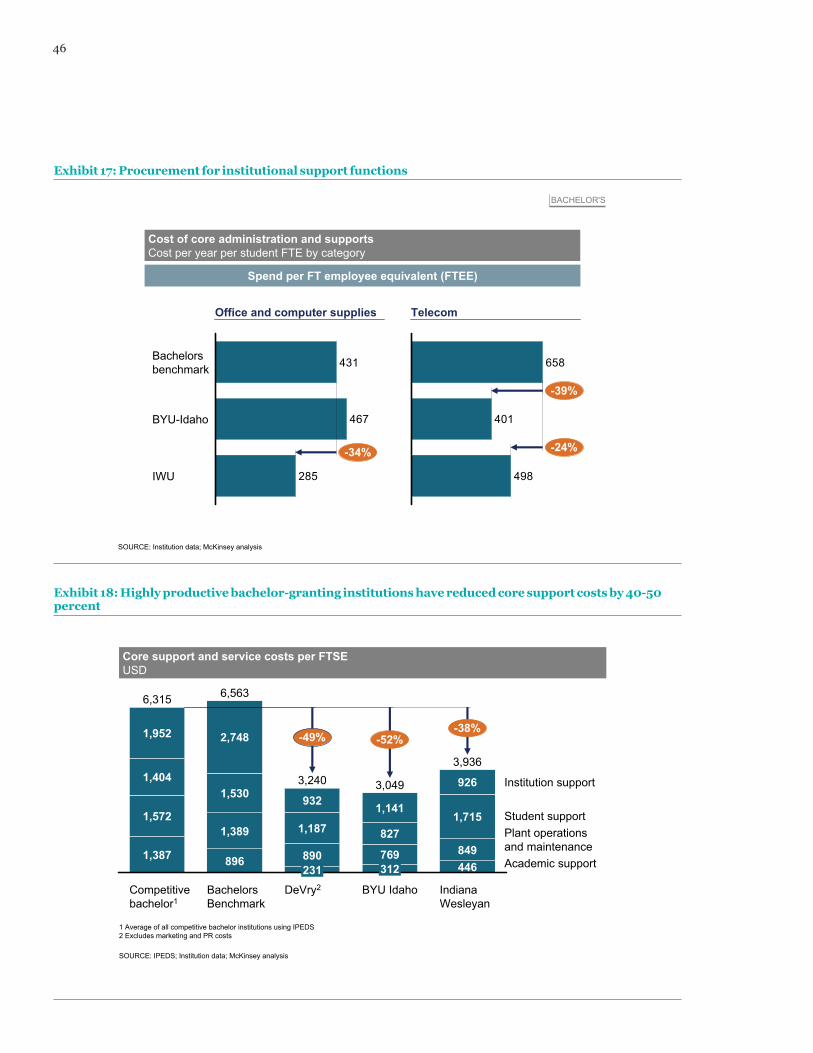
46
6,315
2,748
Competitive bachelor1
1,387
1,572
1,404 Institution support
849
1,952
1,715Plant operationsand maintenance
9263,2403,936
3,049
BYU Idaho
312769
827
Academic support
1,141
DeVry2
231890
Student support1,187
932
Bachelors Benchmark
6,563
Indiana Wesleyan
446896
1,389
1,530
-52%-38%
-49%
SOURCE: IPEDS; Institution data; McKinsey analysis
1 Average of all competitive bachelor institutions using IPEDS2 Excludes marketing and PR costs
Core support and service costs per FTSEUSD
Exhibit 18: Highly productive bachelor-granting institutions have reduced core support costs by 40-50 percent
BACHELOR'S
Spend per FT employee equivalent (FTEE)
SOURCE: Institution data; McKinsey analysis
Cost of core administration and supportsCost per year per student FTE by category
285
467
431
BYU-Idaho
IWU
Bachelorsbenchmark
-34%
Office and computer supplies
498
401
658
-39%
-24%
Telecom
Exhibit 17: Procurement for institutional support functions
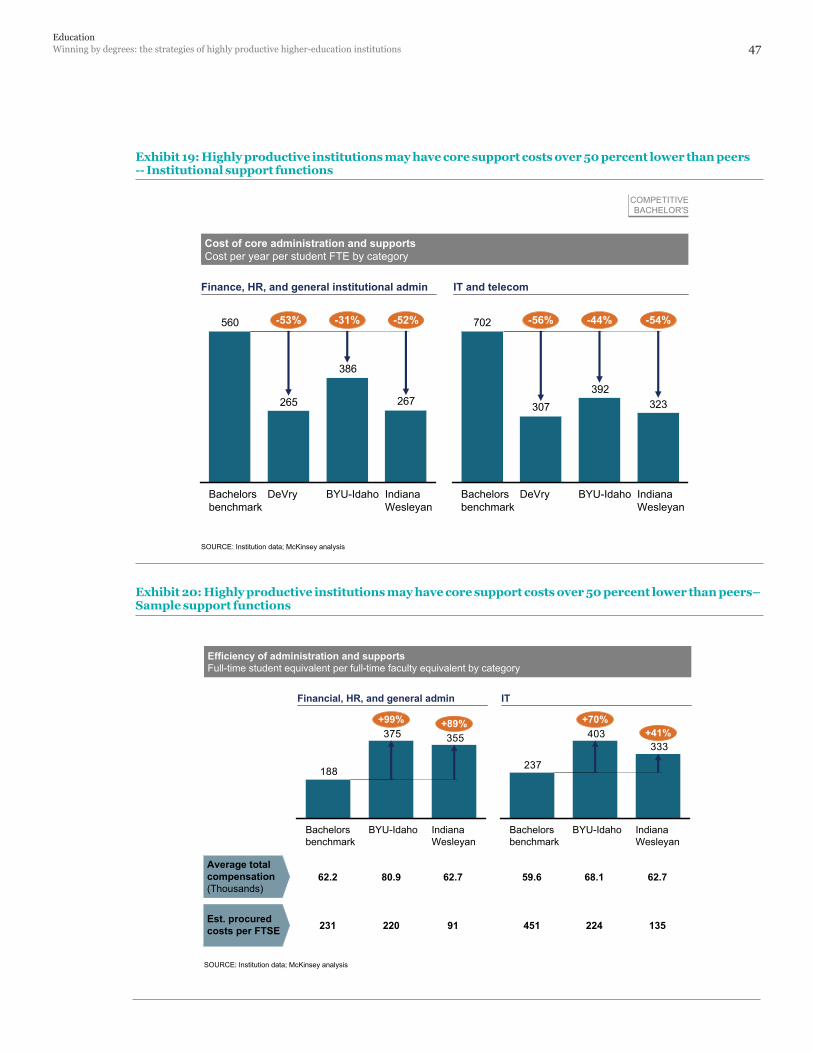
EducationWinning by degrees: the strategies of highly productive higher-education institutions 47
333403
237
BYU-IdahoBachelors benchmark
Indiana Wesleyan
+70%+41%355375
188
Indiana Wesleyan
BYU-IdahoBachelors benchmark
+89%+99%
62.2 80.9 62.7 59.6 68.1 62.7
231 220 91 451 224 135
SOURCE: Institution data; McKinsey analysis
Efficiency of administration and supportsFull-time student equivalent per full-time faculty equivalent by category
Financial, HR, and general admin IT
Average total compensation (Thousands)
Est. procured costs per FTSE
Exhibit 20: Highly productive institutions may have core support costs over 50 percent lower than peers– Sample support functions
323392
307
702
Indiana Wesleyan
BYU-IdahoDeVryBachelors benchmark
-54%-44%-56%
COMPETITIVEBACHELOR'S
SOURCE: Institution data; McKinsey analysis
Cost of core administration and supportsCost per year per student FTE by category
Finance, HR, and general institutional admin IT and telecom
267
386
265
560
Indiana Wesleyan
BYU-IdahoDeVryBachelors benchmark
-53% -52%-31%
Exhibit 19: Highly productive institutions may have core support costs over 50 percent lower than peers -- Institutional support functions
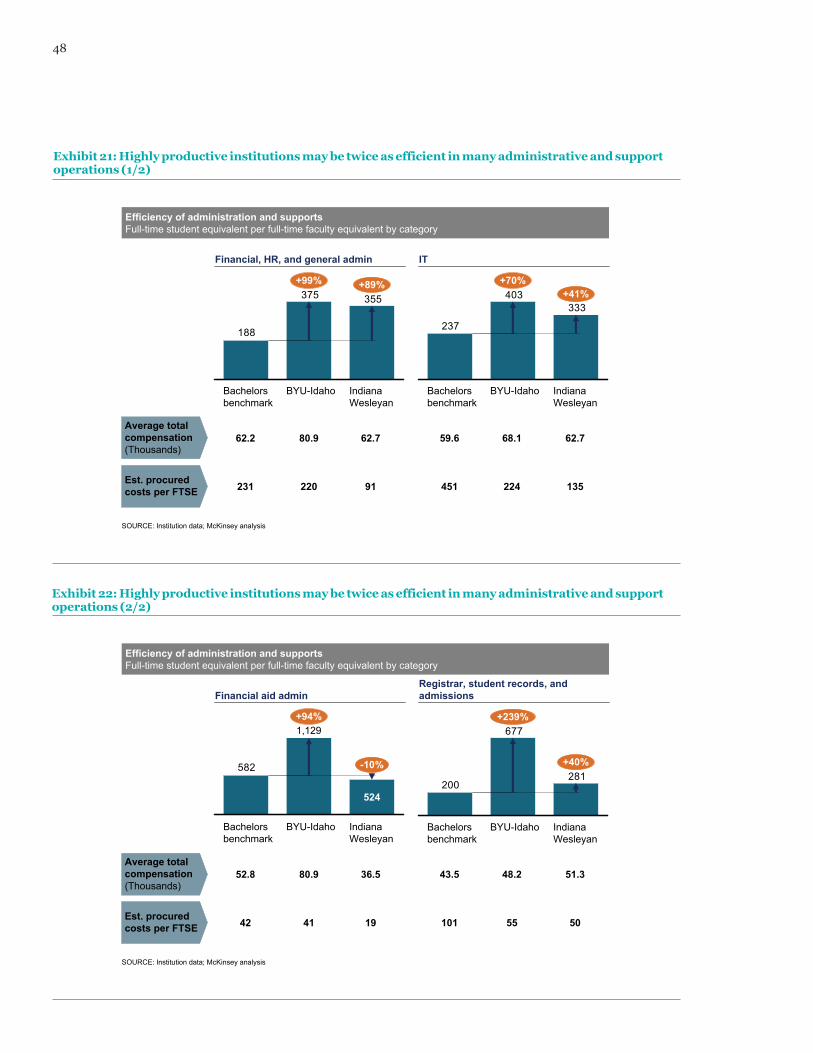
48
281
677
200
Indiana Wesleyan
BYU-IdahoBachelors benchmark
+40%
+239%
582
Indiana Wesleyan
1,129
Bachelors benchmark
BYU-Idaho
524
+94%
-10%
52.8 80.9 36.5 43.5 48.2 51.3
42 41 19 101 55 50
SOURCE: Institution data; McKinsey analysis
Efficiency of administration and supportsFull-time student equivalent per full-time faculty equivalent by category
Financial aid adminRegistrar, student records, and admissions
Average total compensation (Thousands)
Est. procured costs per FTSE
Exhibit 22: Highly productive institutions may be twice as efficient in many administrative and support operations (2/2)
333403
237
BYU-IdahoBachelors benchmark
Indiana Wesleyan
+70%+41%355375
188
Indiana Wesleyan
BYU-IdahoBachelors benchmark
+89%+99%
62.2 80.9 62.7 59.6 68.1 62.7
231 220 91 451 224 135
SOURCE: Institution data; McKinsey analysis
Efficiency of administration and supportsFull-time student equivalent per full-time faculty equivalent by category
Financial, HR, and general admin IT
Average total compensation (Thousands)
Est. procured costs per FTSE
Exhibit 21: Highly productive institutions may be twice as efficient in many administrative and support operations (1/2)
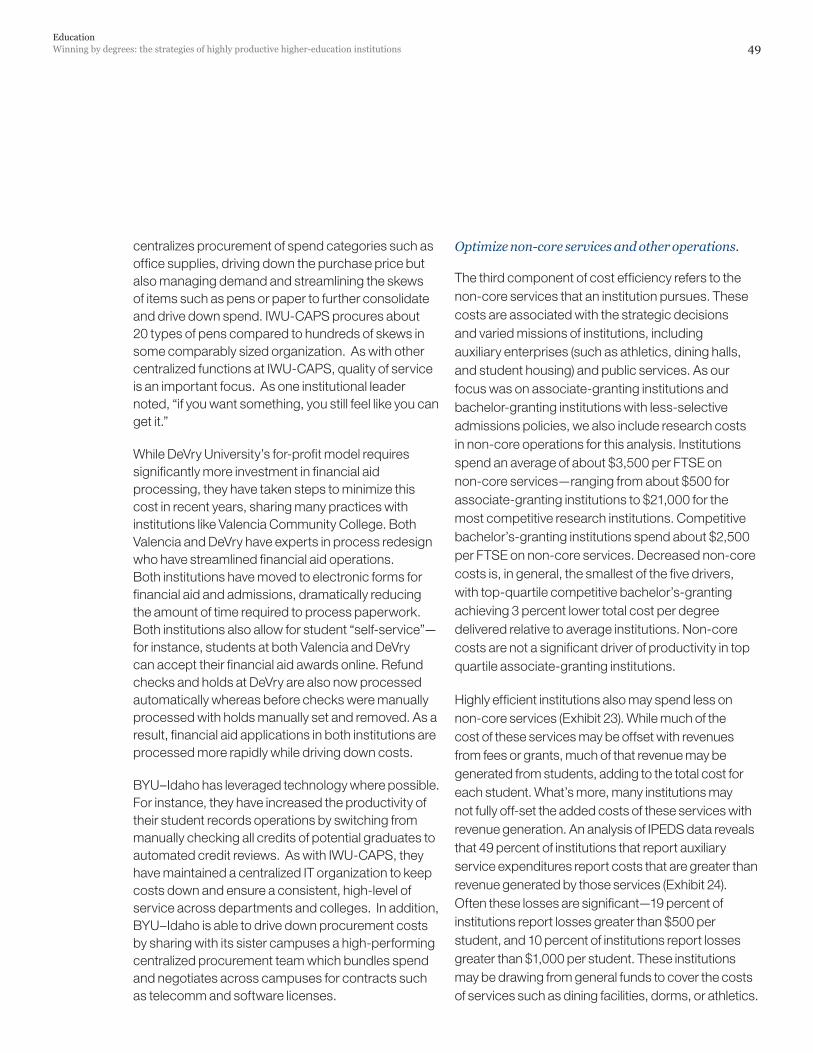
EducationWinning by degrees: the strategies of highly productive higher-education institutions 49
centralizes procurement of spend categories such as office supplies, driving down the purchase price but also managing demand and streamlining the skews of items such as pens or paper to further consolidate and drive down spend. IWU-CAPS procures about 20 types of pens compared to hundreds of skews in some comparably sized organization. As with other centralized functions at IWU-CAPS, quality of service is an important focus. As one institutional leader noted, “if you want something, you still feel like you can get it.”
While DeVry University’s for-profit model requires significantly more investment in financial aid processing, they have taken steps to minimize this cost in recent years, sharing many practices with institutions like Valencia Community College. Both Valencia and DeVry have experts in process redesign who have streamlined financial aid operations. Both institutions have moved to electronic forms for financial aid and admissions, dramatically reducing the amount of time required to process paperwork. Both institutions also allow for student “self-service”—for instance, students at both Valencia and DeVry can accept their financial aid awards online. Refund checks and holds at DeVry are also now processed automatically whereas before checks were manually processed with holds manually set and removed. As a result, financial aid applications in both institutions are processed more rapidly while driving down costs.
BYU–Idaho has leveraged technology where possible. For instance, they have increased the productivity of their student records operations by switching from manually checking all credits of potential graduates to automated credit reviews. As with IWU-CAPS, they have maintained a centralized IT organization to keep costs down and ensure a consistent, high-level of service across departments and colleges. In addition, BYU–Idaho is able to drive down procurement costs by sharing with its sister campuses a high-performing centralized procurement team which bundles spend and negotiates across campuses for contracts such as telecomm and software licenses.
Optimize non-core services and other operations.
The third component of cost efficiency refers to the non-core services that an institution pursues. These costs are associated with the strategic decisions and varied missions of institutions, including auxiliary enterprises (such as athletics, dining halls, and student housing) and public services. As our focus was on associate-granting institutions and bachelor-granting institutions with less-selective admissions policies, we also include research costs in non-core operations for this analysis. Institutions spend an average of about $3,500 per FTSE on non-core services—ranging from about $500 for associate-granting institutions to $21,000 for the most competitive research institutions. Competitive bachelor’s-granting institutions spend about $2,500 per FTSE on non-core services. Decreased non-core costs is, in general, the smallest of the five drivers, with top-quartile competitive bachelor’s-granting achieving 3 percent lower total cost per degree delivered relative to average institutions. Non-core costs are not a significant driver of productivity in top quartile associate-granting institutions.
Highly efficient institutions also may spend less on non-core services (Exhibit 23). While much of the cost of these services may be offset with revenues from fees or grants, much of that revenue may be generated from students, adding to the total cost for each student. What’s more, many institutions may not fully off-set the added costs of these services with revenue generation. An analysis of IPEDS data reveals that 49 percent of institutions that report auxiliary service expenditures report costs that are greater than revenue generated by those services (Exhibit 24). Often these losses are significant—19 percent of institutions report losses greater than $500 per student, and 10 percent of institutions report losses greater than $1,000 per student. These institutions may be drawing from general funds to cover the costs of services such as dining facilities, dorms, or athletics.
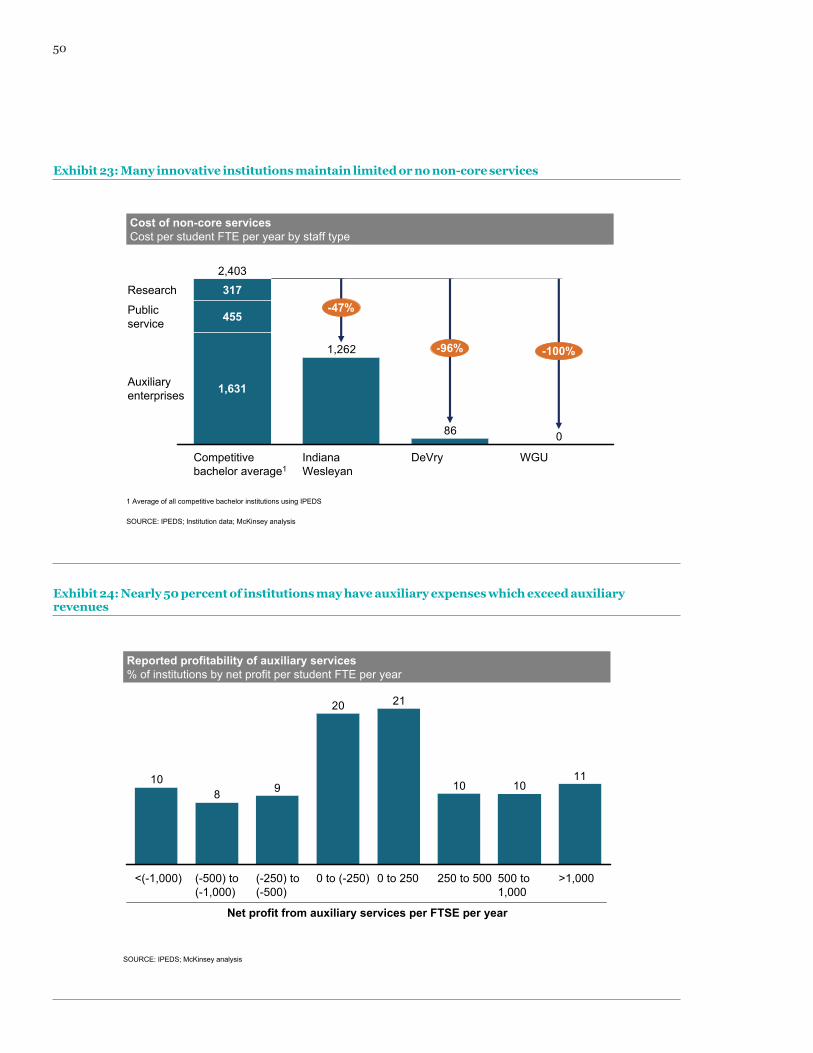
50
111010
2120
9810
>1,000500 to 1,000
250 to 5000 to 2500 to (-250)(-250) to (-500)
(-500) to (-1,000)
<(-1,000)
SOURCE: IPEDS; McKinsey analysis
Reported profitability of auxiliary services% of institutions by net profit per student FTE per year
Net profit from auxiliary services per FTSE per year
Exhibit 24: Nearly 50 percent of institutions may have auxiliary expenses which exceed auxiliary revenues
86
1,262
0
Auxiliaryenterprises
Publicservice
Research
WGUDeVryIndianaWesleyan
Competitive bachelor average1
2,403
1,631
455
317
-96% -100%
-47%
SOURCE: IPEDS; Institution data; McKinsey analysis
Cost of non-core servicesCost per student FTE per year by staff type
1 Average of all competitive bachelor institutions using IPEDS
Exhibit 23: Many innovative institutions maintain limited or no non-core services
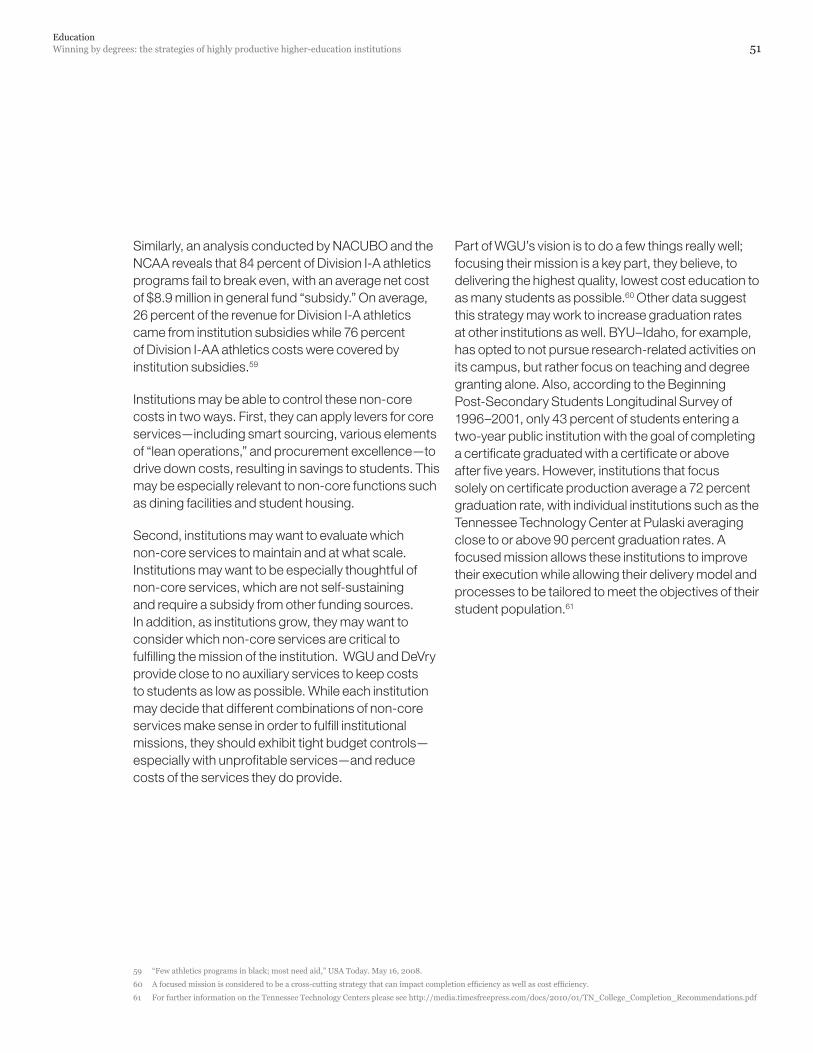
EducationWinning by degrees: the strategies of highly productive higher-education institutions 51
Similarly, an analysis conducted by NACUBO and the NCAA reveals that 84 percent of Division I-A athletics programs fail to break even, with an average net cost of $8.9 million in general fund “subsidy.” On average, 26 percent of the revenue for Division I-A athletics came from institution subsidies while 76 percent of Division I-AA athletics costs were covered by institution subsidies.59
Institutions may be able to control these non-core costs in two ways. First, they can apply levers for core services—including smart sourcing, various elements of “lean operations,” and procurement excellence—to drive down costs, resulting in savings to students. This may be especially relevant to non-core functions such as dining facilities and student housing.
Second, institutions may want to evaluate which non-core services to maintain and at what scale. Institutions may want to be especially thoughtful of non-core services, which are not self-sustaining and require a subsidy from other funding sources. In addition, as institutions grow, they may want to consider which non-core services are critical to fulfilling the mission of the institution. WGU and DeVry provide close to no auxiliary services to keep costs to students as low as possible. While each institution may decide that different combinations of non-core services make sense in order to fulfill institutional missions, they should exhibit tight budget controls—especially with unprofitable services—and reduce costs of the services they do provide.
Part of WGU’s vision is to do a few things really well; focusing their mission is a key part, they believe, to delivering the highest quality, lowest cost education to as many students as possible.60 Other data suggest this strategy may work to increase graduation rates at other institutions as well. BYU–Idaho, for example, has opted to not pursue research-related activities on its campus, but rather focus on teaching and degree granting alone. Also, according to the Beginning Post-Secondary Students Longitudinal Survey of 1996–2001, only 43 percent of students entering a two-year public institution with the goal of completing a certificate graduated with a certificate or above after five years. However, institutions that focus solely on certificate production average a 72 percent graduation rate, with individual institutions such as the Tennessee Technology Center at Pulaski averaging close to or above 90 percent graduation rates. A focused mission allows these institutions to improve their execution while allowing their delivery model and processes to be tailored to meet the objectives of their student population.61
59 “Few athletics programs in black; most need aid,” USA Today. May 16, 2008.
60 A focused mission is considered to be a cross-cutting strategy that can impact completion efficiency as well as cost efficiency.
61 For further information on the Tennessee Technology Centers please see http://media.timesfreepress.com/docs/2010/01/TN_College_Completion_Recommendations.pdf
52
To illustrate the potential impact of the five strategies at a system-level, we have simulated a few scenarios that reflect some of the best practices effectively implemented by the institutions visited (Exhibits 25 and 26).
Except with changes to instructional delivery, we assumed that the productivity improvements depicted applied to all associate and bachelors-granting capacity. Annually, these institutions produce approximately 2.2 million degrees and spend approximately $191 billion according to IPEDS. The additional degrees calculated assume the reinvesting of all the savings into the system to produce more degrees.
Improving productivity in core services to reflect the ~ 40 percent improved efficiency of the deep-dive institutions would improve overall productivity by about 20 percent and result in the ability to serve over half a million additional students at current total cost. Based on the examples shared above, institutions would achieve this improvement through a suite of initiatives. For instance, improving procurement may yield approximately a 3 percent productivity improvement, which would contribute to the total of 20 percent.
Initiatives to promote and improve persistence through graduation will also have significant impact. Initiatives that ensure all students enter “college ready” could translate to 310 thousand additional degrees
at current costs, a 12 percent productivity gain. If all students who pass either more than 60 SCHs from a two-year institution or 120 SCHs from a four-year institution graduate, an additional 240 thousand more degrees could be produced at current total cost (a system productivity increase of approximately 10 percent).62 Finally, serving students entering college after age 20 with a more effective model63 would improve overall productivity by about 4 percent delivering 80,000 additional degrees at current cost across all associate- and bachelors-granting capacity.
While potentially challenging to implement,64 efficient instructional delivery implemented to the tune of those observed at the institution profiled above, could very much contribute to additional capacity. Increasing student to faculty ratios from about 20 to about 30 in institutions with less selective admissions policies, while maintaining current ratios of full-time to part-time staff, would improve productivity by about 15 percent in these institutions and produce capacity to graduate 190 thousand more students. This translates to a productivity improvement of 8 percent when averaged across all associate and bachelor-granting capacity. If, in addition, these institutions shifted to a heavy use of part-time faculty, this would allow for an additional 70 thousand more students to graduate for the same costs—totaling 260 thousand students and and a 10 percent increase in productivity averaged across all associate and bachelor-granting capacity.
Implementation of these strategies system-wide could allow educating 1 million more students per year
62 This is based on an analysis of State A data. State A has completion efficiency that is close to the national average and we assume that the results are representative of what may be seen in other states.
63 Graduation rates for these students are significantly lower than traditional institutions although models exist that significantly improve these rates.
64 Given the various challenges associated with improving the efficiency of instructional delivery, we assumed for the purposes of these scenarios that the productivity improvements applied only to associate-granting institutions and bachelor-granting institutions that are either open-access or have low-levels of admissions selectivity
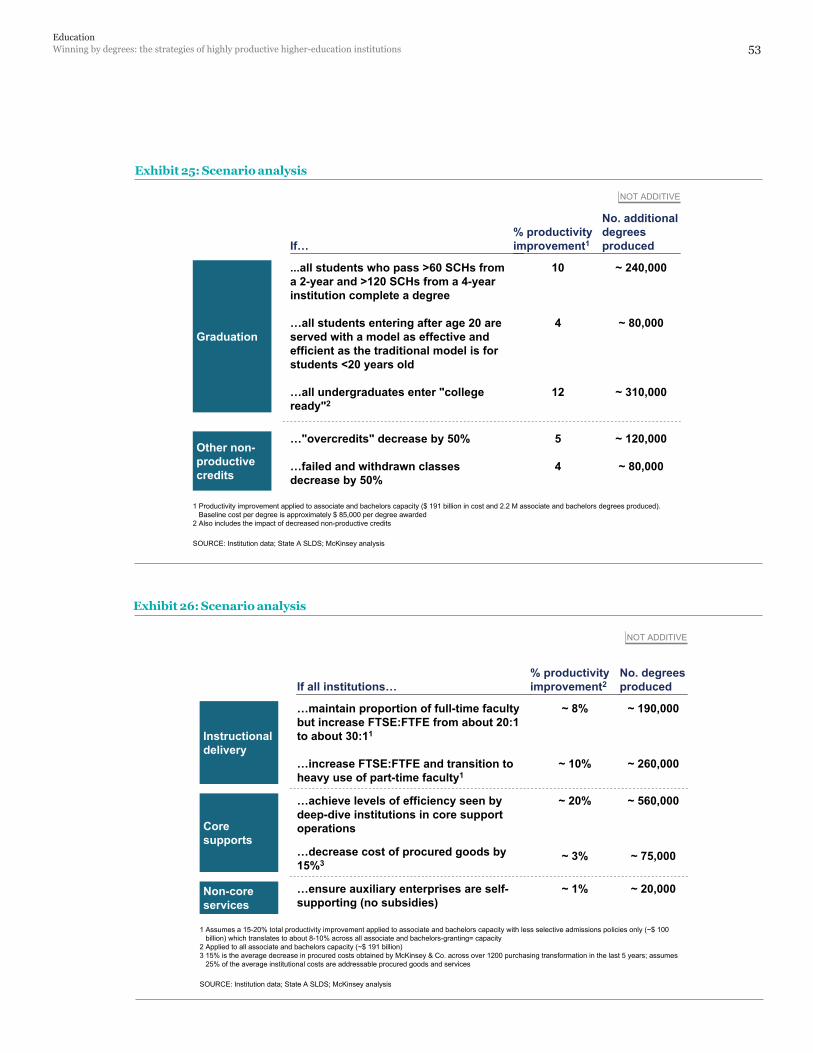
EducationWinning by degrees: the strategies of highly productive higher-education institutions 53
SOURCE: Institution data; State A SLDS; McKinsey analysis
1 Assumes a 15-20% total productivity improvement applied to associate and bachelors capacity with less selective admissions policies only (~$ 100 billion) which translates to about 8-10% across all associate and bachelors-granting= capacity
2 Applied to all associate and bachelors capacity (~$ 191 billion)3 15% is the average decrease in procured costs obtained by McKinsey & Co. across over 1200 purchasing transformation in the last 5 years; assumes
25% of the average institutional costs are addressable procured goods and services
No. degreesproduced
% productivity improvement2If all institutions…
~ 190,000
~ 260,000
~ 8%
~ 10%
…maintain proportion of full-time faculty but increase FTSE:FTFE from about 20:1 to about 30:11
…increase FTSE:FTFE and transition to heavy use of part-time faculty1
Instructional delivery
…achieve levels of efficiency seen by deep-dive institutions in core support operations
…decrease cost of procured goods by 15%3
~ 560,000
~ 75,000
~ 20%
~ 3%
Core supports
…ensure auxiliary enterprises are self-supporting (no subsidies)
~ 20,000~ 1%Non-core services
NOT ADDITIVE
Exhibit 26: Scenario analysis
10
4
12
5
4
SOURCE: Institution data; State A SLDS; McKinsey analysis
NOT ADDITIVE
1 Productivity improvement applied to associate and bachelors capacity ($ 191 billion in cost and 2.2 M associate and bachelors degrees produced). Baseline cost per degree is approximately $ 85,000 per degree awarded
2 Also includes the impact of decreased non-productive credits
Graduation
Other non-productive credits
No. additional degreesproduced
% productivity improvement1If…
...all students who pass >60 SCHs from a 2-year and >120 SCHs from a 4-year institution complete a degree
…all students entering after age 20 are served with a model as effective and efficient as the traditional model is for students <20 years old
…all undergraduates enter "college ready"2
…"overcredits" decrease by 50%
…failed and withdrawn classes decrease by 50%
~ 240,000
~ 80,000
~ 310,000
~ 120,000
~ 80,000
Exhibit 25: Scenario analysis
54
Baumol’s Cost Disease Theory
Four decades ago, William Baumol and William Bowen developed the Cost Disease Theory, which attempts to explain why wages in sectors such as the performing arts, nursing, and education rise while their productivity does not. Baumol and Bowen point out that certain labor-intensive industries—such as education—have not enjoyed the benefits of technology and innovation and will remain as labor-intensive today as they were hundreds of years ago. In essence, they advocate that wages for these sectors continue to rise because they must compete with other sectors that have seen increasing wages due to productivity improvements in their industry.
While this theory is often cited by institution leaders, our findings suggest that the relevance of the theory in explaining productivity in the higher education sectors may not be as far-reaching, as once thought, as it doesn’t consider some key elements discussed in this research.
� Baumol’s theory does not account for the efficiency of students moving through the system to completion; namely, it doesn’t account for students dropping out, failing courses, or taking more credits than are required to graduate.
� Baumol’s theory also does not account for productivity in non-instructional areas of higher education. Yet, the private sector has seen dramatic increases in productivity in areas such as IT, HR, finance, administration, and facilities. According to the Delta Cost Project, administrative functions such as these (along with areas such as financial aid processing, enrollment, and recreation and athletics, which are also not covered by Baumol) are the fastest-growing costs for universities, suggesting that the efficiencies seen in other industries in these areas have not been captured by higher education institutions.65 These costs account for nearly 55 percent of the average higher education budget.
� While Baumol’s theory has been recognized as explaining instructional productivity, here too there appears to be signs that innovation is making in-roads that may challenge the theory. Online institutions such as Western Governors University and Rio Salado—building on work from the National Center for Academic Transformation—have dramatically improved productivity while maintaining a high level of quality. While fully online models may not work for many universities and many students, NCAT has dramatically improved productivity through the redesign of courses in a full range of institutions, from community colleges to elite research institutions. What’s more, outcomes in these models are often improved, suggesting higher quality: retention and graduation rates are higher than peers, student and staff satisfaction levels are high, and measurable academic outcomes (including scores on credentialing exams) match or exceed those of peers.
Combined, this evidence suggests that Baumol’s theory may apply to a smaller segment of higher education instruction than it did previously.
65 Jane Wellman, “Trends in college spending,” Delta Cost Project, 2009.
EducationWinning by degrees: the strategies of highly productive higher-education institutions 55
Relative to the strategies above, reducing non-productive credits may lead to more modest productivity improvements. For instance, reducing the number of excess credits taken by students who are over-credit by 50 percent would result in a 5 percent productivity improvement; enough to add about 120 thousand degrees at current costs. Decreasing the rate of course failure and withdrawal would add another 80 thousand degrees; about a 4 percent productivity improvement.
Finally, initiatives to reduce non-core costs have, on average, the most modest impact. For instance, ensuring that auxiliary services “break-even”—for example, by decreasing expenditures to match revenues or discontinuing operations which require a subsidization from other funds productivity— would create capacity to award 20 thousand more degrees at current cost; a one percent productivity improvement. It is important to note though, that initiatives that optimize non-core operations may have significantly more impact for some institutions. For instance, institutions with a $500 loss per student from auxiliary services, and $10,000 in cost per student per year, could improve productivity by 5 percent in these institutions by aligning auxiliary costs and revenues.
Transforming productivity in higher education takes more than deciding to reform operations
Top performers were able to make productivity gains from their use of these five operational levers because they had four higher-level skills or attributes (Exhibit 27):
1) Operating decisions: Each of the institutions that we visited have designed efficient and effective operational processes supported with appropriate technology and tools; they had made conscious decisions to change core processes to make the
school more efficient, even applying operations/manufacturing principles, such as “lean” processes. At Rio Salado and WGU, the instructional delivery system was broken into subfunctions, and decisions were made to use the highest-quality, lowest-cost “input” for each function and minimize the variability across sections—two core principles of “lean” operations. At DeVry University, changes to the financial aid processes were based on detailed process maps and a quantitative understanding of where waste and inefficiencies were occurring.
2) Management systems: Second, these institutions had effective management systems to ensure progress, build capabilities, and manage implementation. Committed leadership, rigorous performance management systems, and processes to develop and retain highly capable staff are among the formal management characteristics we noted at high-performing institutions. Leadership at each institution articulated a core commitment to some variation of completion efficiency, cost efficiency, quality, and access. Each institution also sought to keep and retain highly capable staff. They then dedicated this staff to core issues affecting productivity. For instance, many of the institutions studied had a small number of individuals who were highly trained in process redesign. At DeVry University the individual in charge of financial aid processes is a certified Six Sigma Blackbelt operations specialist. At Valencia Community College the individual who oversees changes to student services and financial aid processing has studied process redesign for years. BYU–Idaho, meanwhile, has a significant number of leaders with business backgrounds, giving them significant experience in process engineering and driving customer experience.
In addition, many institutions that we visited closely monitor student and staff satisfaction as a broad indicator of improved performance. For instance, DeVry University monitors its “Net Promoter Score”
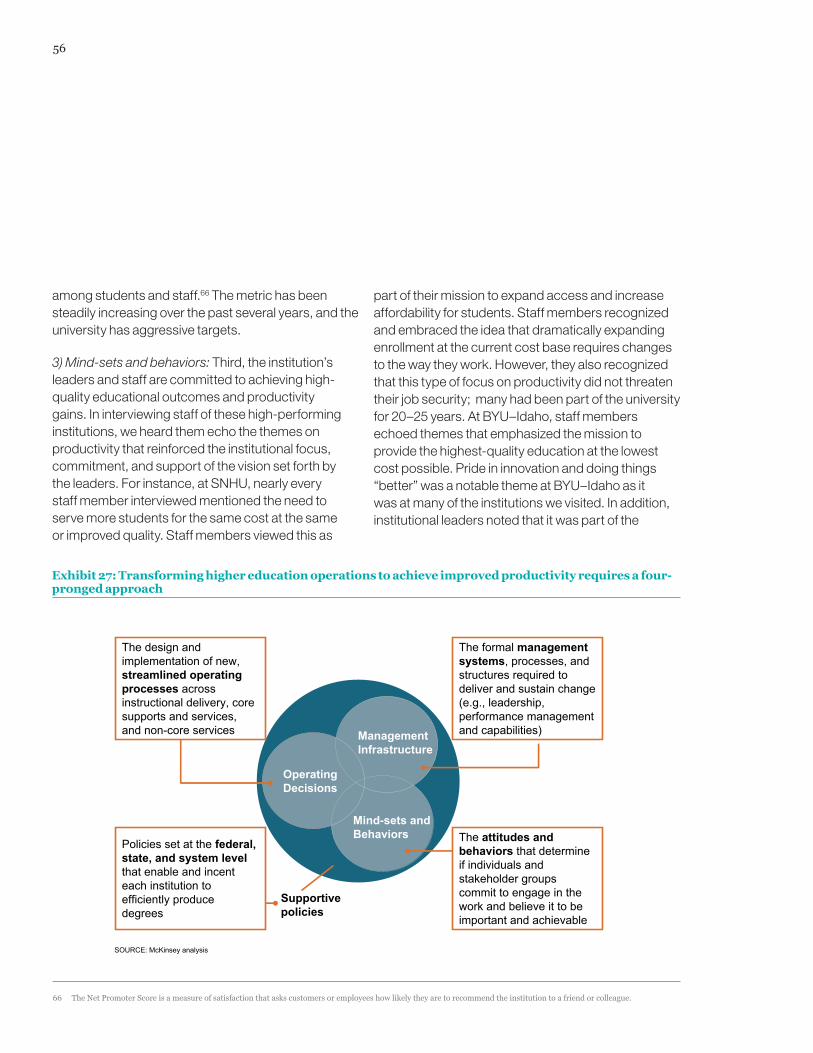
56
among students and staff.66 The metric has been steadily increasing over the past several years, and the university has aggressive targets.
3) Mind-sets and behaviors: Third, the institution’s leaders and staff are committed to achieving high-quality educational outcomes and productivity gains. In interviewing staff of these high-performing institutions, we heard them echo the themes on productivity that reinforced the institutional focus, commitment, and support of the vision set forth by the leaders. For instance, at SNHU, nearly every staff member interviewed mentioned the need to serve more students for the same cost at the same or improved quality. Staff members viewed this as
part of their mission to expand access and increase affordability for students. Staff members recognized and embraced the idea that dramatically expanding enrollment at the current cost base requires changes to the way they work. However, they also recognized that this type of focus on productivity did not threaten their job security; many had been part of the university for 20–25 years. At BYU–Idaho, staff members echoed themes that emphasized the mission to provide the highest-quality education at the lowest cost possible. Pride in innovation and doing things “better” was a notable theme at BYU–Idaho as it was at many of the institutions we visited. In addition, institutional leaders noted that it was part of the
Mind-sets and Behaviors
Management Infrastructure
Operating Decisions
The design and implementation of new, streamlined operating processes across instructional delivery, core supports and services, and non-core services
The attitudes and behaviors that determine if individuals and stakeholder groups commit to engage in the work and believe it to be important and achievable
Supportive policies
The formal management systems, processes, and structures required to deliver and sustain change (e.g., leadership, performance management and capabilities)
Policies set at the federal, state, and system level that enable and incent each institution to efficiently produce degrees
SOURCE: McKinsey analysis
Exhibit 27: Transforming higher education operations to achieve improved productivity requires a four-pronged approach
66 The Net Promoter Score is a measure of satisfaction that asks customers or employees how likely they are to recommend the institution to a friend or colleague.
EducationWinning by degrees: the strategies of highly productive higher-education institutions 57
institution’s culture for “professors and other staff to focus on the student who is struggling.”
Rio Salado College credits its success to the mind-set of state policy makers and system leaders, who are supportive of innovation (see below for how this mind-set translates into policy). Meanwhile, at IWU–CAPS and Valencia Community College, there is a strong “culture of completion” among institution leaders, staff, and students: there is a common focus on graduation, which translates into supportive institutional policies, improved student-facing operations, and countless day-to-day interactions and conversations supportive of completion that can’t be accounted for. Similarly, leaders at SNHU credit a “culture of high expectations” as motivating reforms.
4) Supportive policies: While not at the core of the interviews and discussions with the schools we visited, we have also found that to be successful, these institutions need state and institutional policies that provide flexibility to achieve their quality and efficiency goals. Although every institution can improve performance, no institution can reach full potential without supportive policies at the state and system level. Rio Salado College owes its existence to the Maricopa Community College system, which established it back in 1978 as an innovative, low-cost model for reaching nontraditional students. College leaders cite lack of restrictive regulations at the state level and support from the system board as essential for their innovation and expansion over several years. For instance, while community college enrollment is restricted to the county in which the school operates, the state decided not to apply the same principle to online institutions, allowing Rio Salado to operate across the state. The board of the Maricopa Community College system allows Rio Salado to
operate across counties while other brick-and-mortar institutions have predefined service areas.
Similarly, the focused mission of the Tennessee Technology Centers is due in part to state legislation that separates certificate production from associate production, allowing institutions to focus on optimizing the operating model for particular outcomes and student segments.
Valencia Community College’s high completion rates benefit in part from Florida’s state policies, which encourage dual enrollment, Advanced Placement (AP), and International Baccalaureate (IB) programs, and a streamlined transfer policy between institutions, resulting in a high rate of productive credits. For instance, students completing an associates degree are guaranteed admission to a public four-year institution and able to transfer at least 60 credits.67 A common course numbering system in Florida also makes it easier for students to take and transfer courses across institutions. While even in these systems policies could be improved, there is a strong base of existing support relative to some other systems.
It is important to emphasize that it is the combination of all of these elements—practices, policies, mindsets, and management—that unlocks the full potential of an institution. For instance, institutions that try implementing “cultural transformations” without changes to the underlying processes or management systems may find the early hope and momentum worn away over time by the lack of improvement. Institutions focusing only on process changes may find the organization does not stick faithfully to those processes, resulting in a failure to gain traction or sustain change (Exhibit 28).
67 Southern New Hampshire University has a similar agreement with local community colleges
“The barriers to improving productivity are cultural, not financial or technical.”
- Bill Massy
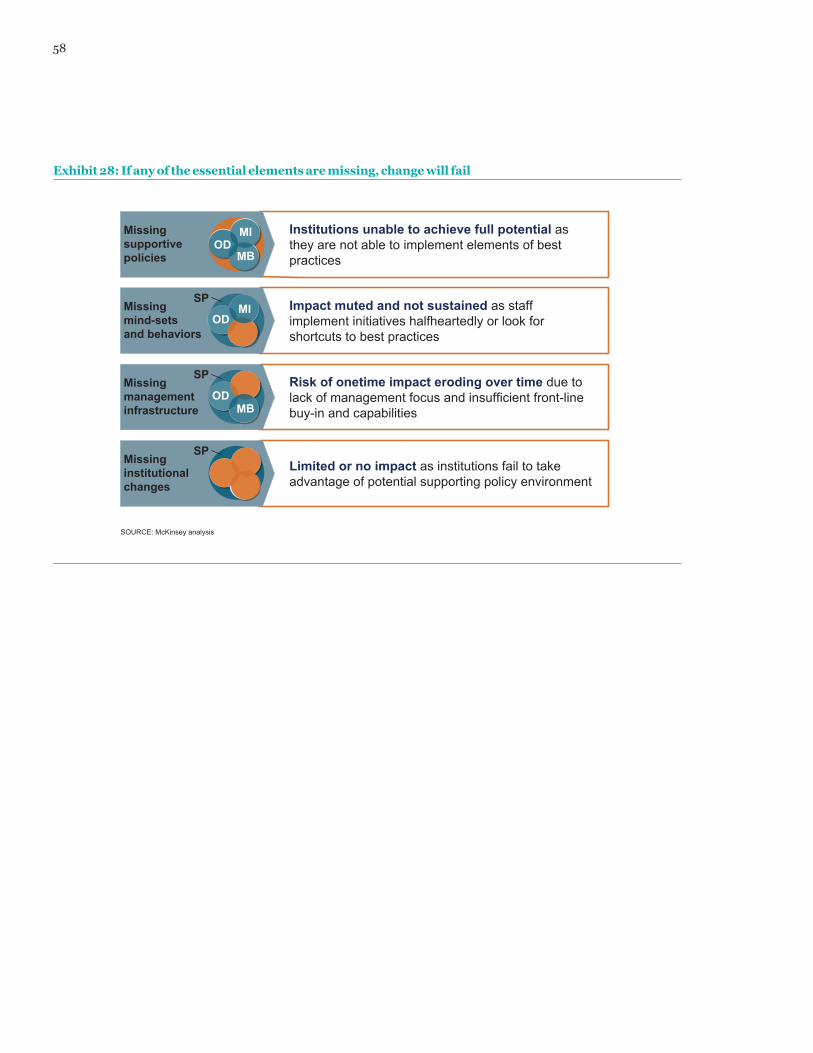
58
Limited or no impact as institutions fail to take advantage of potential supporting policy environment
Institutions unable to achieve full potential as they are not able to implement elements of best practices
Impact muted and not sustained as staff implement initiatives halfheartedly or look for shortcuts to best practices
Risk of onetime impact eroding over time due to lack of management focus and insufficient front-line buy-in and capabilities
SOURCE: McKinsey analysis
Missing supportive policies
Missing mind-sets and behaviors
Missing management infrastructure
Missing institutional changes
ODMI
MB
MIOD
MBOD
SP
SP
SP
Exhibit 28: If any of the essential elements are missing, change will fail
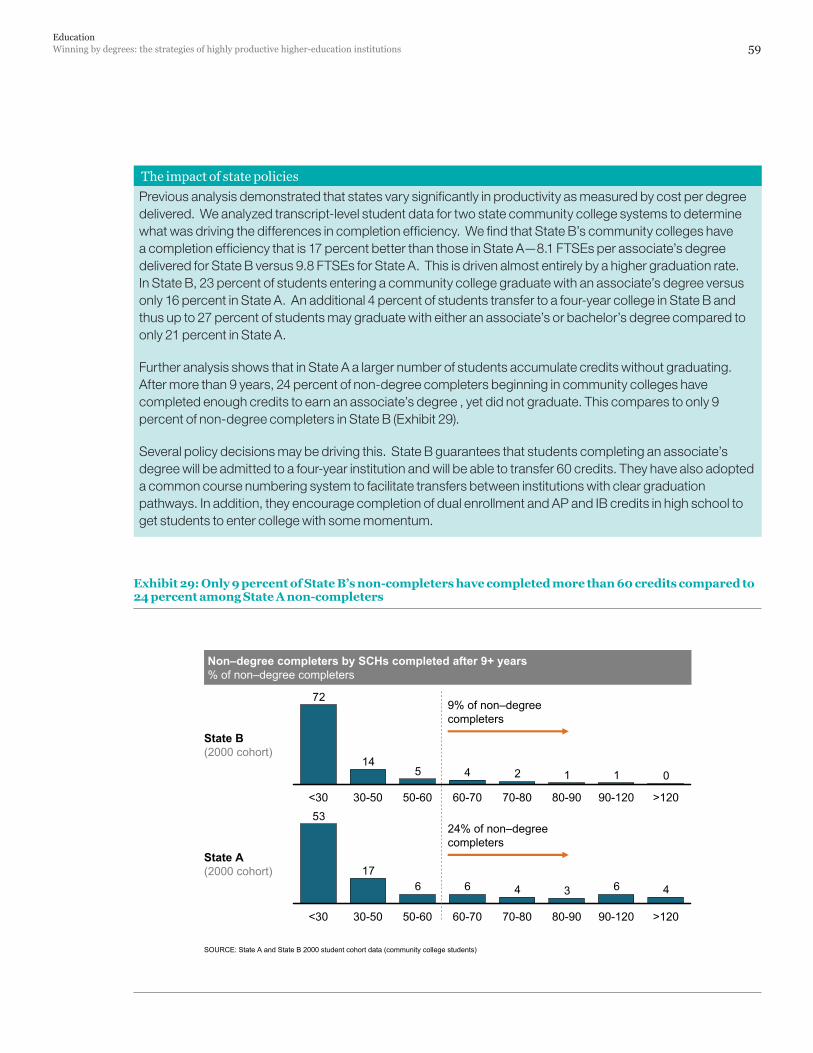
EducationWinning by degrees: the strategies of highly productive higher-education institutions 59
The impact of state policies
Previous analysis demonstrated that states vary significantly in productivity as measured by cost per degree delivered. We analyzed transcript-level student data for two state community college systems to determine what was driving the differences in completion efficiency. We find that State B’s community colleges have a completion efficiency that is 17 percent better than those in State A—8.1 FTSEs per associate’s degree delivered for State B versus 9.8 FTSEs for State A. This is driven almost entirely by a higher graduation rate. In State B, 23 percent of students entering a community college graduate with an associate’s degree versus only 16 percent in State A. An additional 4 percent of students transfer to a four-year college in State B and thus up to 27 percent of students may graduate with either an associate’s or bachelor’s degree compared to only 21 percent in State A.
Further analysis shows that in State A a larger number of students accumulate credits without graduating. After more than 9 years, 24 percent of non-degree completers beginning in community colleges have completed enough credits to earn an associate’s degree , yet did not graduate. This compares to only 9 percent of non-degree completers in State B (Exhibit 29).
Several policy decisions may be driving this. State B guarantees that students completing an associate’s degree will be admitted to a four-year institution and will be able to transfer 60 credits. They have also adopted a common course numbering system to facilitate transfers between institutions with clear graduation pathways. In addition, they encourage completion of dual enrollment and AP and IB credits in high school to get students to enter college with some momentum.
46346617
53
90-120 >12070-80 80-9030-50 60-7050-60<30
01124514
72
<30 >12090-12080-9070-8060-7050-6030-50
SOURCE: State A and State B 2000 student cohort data (community college students)
Non–degree completers by SCHs completed after 9+ years% of non–degree completers
State B(2000 cohort)
State A(2000 cohort)
9% of non–degree completers
24% of non–degree completers
Exhibit 29: Only 9 percent of State B’s non-completers have completed more than 60 credits compared to 24 percent among State A non-completers
60
Increasing productivity in the US higher education system—an imperative that calls for collaboration between institutions and policy makers
We believe that the growing number of innovative institutions that are able to achieve outstanding levels of degree productivity can serve as a model for other institutions and provide a solution to sluggish expansion in the US graduate pool. Their achievements suggest that institution leaders and policy makers need to concentrate efforts on improving degree completion and cost efficiency while upholding the quality of their degrees and unwavering commitment to open access. But given the immediate nature of the challenge—a million more degrees a year by 2020—stakeholders also need to commit to rapid change.
How can all institutions raise their degree productivity to the levels achieved by the best? We do not have clear answers for individual institutions or for state and federal policy makers; however, our analysis suggests that there are several points that can help inform recommendations, as well as several steps worth considering.
We find that while it takes full institutional commitment to achieve dramatic improvement and transformation, there are a number of practices that can be adopted by any institution. Different institutions will likely have different degrees of freedom and local contexts that may constrain the nature of reform, at least in the short-term. For instance, institutions in some states may have constraints in the percent of part-time faculty that they can use. In addition, many institutions do not have the financial or other incentives to focus on productivity. As many others have documented,
we also found that data availability and consistency is significantly lacking with few common definitions.
Achieving the full potential of reform across the system will require joint effort between institutions and policymakers given the breadth and depth of some of the change management that might be undertaken and scope of decision-making authority. Given these constraints, we focus our recommendations on a general process that institutions and policy-makers can consider to identify the level and type of reforms that are appropriate for their context.
First, all institutions should identify a short�list�of�strategies�to�pursue that do not require dramatic change in the institution. While the specific strategies will vary by institutions, from our sample promising strategies include stricter policies on academic progression and withdrawal to drive down withdrawal rates or improving a handful of core supports such as financial aid processing or registration. Institutions may also study the reasons for students accumulating more than enough credits to graduate without graduating or for students becoming “overcredit” and incorporate those learnings into revised student supports and advising.
Second, we find that existing institutions would benefit from an assessment of the will and skill of leadership, managers, and staff to pursue change. Institutions that have the will for more dramatic changes may undertake a process that can lead to real transformational change. These institutions would then assess current performance on degree
EducationWinning by degrees: the strategies of highly productive higher-education institutions 61
completion and cost against objective benchmarks. Then institutions need to set aspirations for improved productivity and develop a multiyear operational plan with defined performance milestones and commit to implementing the plan. Some specific actions include:
� Make a firm, unrelenting�commitment�to improving productivity along with access and quality; build alignment among and engage with key institution leaders, faculty, staff and students.
� Conduct benchmarking�and�diagnostic�analysis using this report as a starting guide and leveraging data from peer institutions. Include a quantitative analysis of costs and completion as well as qualitative assessment of operating decisions, management practices and leadership commitment, capabilities and mind-sets and behaviors of staff and system leaders.
� Conduct research and map�possible�interventions�leveraging available resources, including Achieving the Dream and Completion by Design (graduation rates) and resources from the National Center for Academic Transformation (instructional redesign) as well as other reference material.
� Develop a multiyear�operational�plan that includes specific initiatives, steps, timeline, goals, and owners, and execute it. Ensure there is process for feedback and improvement as learnings are captured. Launch pilots and allow for course correction.
� Assign a project�lead�to�drive�implementation and closely monitor progress using a project management office (PMO) that employs key metrics to monitor productivity, access, and quality.
Third, the entire higher education system requires better performance measurement, data gathering and benchmarking efforts that are consistent and coherent so that institutions and funders can track their progress. Institutions need a common fact base of benchmarks to serve as an external reference to their own performance. Some specific actions include:
� States could agree with colleges on standard�metrics�and�practices for recording and measuring productivity, such as graduation rates, time to degree, and cost per degree, while controlling for measures of quality for all students. Several such efforts are underway.68 This will prevent each institution from reinventing key performance measuring processes. Doing this among a consortium of states or at the federal level will prevent the need for redundant efforts across states.
� Develop a common�set�of�facts across institutions and states (e.g., a common benchmarking approach potentially including hundreds of institutions or common data collected at the state or national level) that allows�data�to�be�used�to�improve�the�system. For example, improve data capturing by IPEDS by expanding beyond the full time, first-time cohort for purposes of calculating graduation rates. Our findings show that to more successfully advance the discussion, more detailed and nuanced data is needed.
� Data collected could be made publicly�available.69 Unless data on institutions’ degree productivity and completion rates become more accessible and comprehensive, it is unlikely that states or institutions can be held accountable for progress in these areas.
68 A few examples of such efforts include National Academies of Science: Measuring Higher Education Productivity: Conceptual Framework and Data Need available at http://www8.nationalacademies.org/cp/committeeview.aspx?key=49147; Complete college America available at http://www.completecollege.org/; National Governor’s Association such as http://www.nga.org/Files/pdf/1007COMMONCOLLEGEMETRICS.PDF.
69 For more on the role of the state in driving higher education accountability see: Kevin Carey and Chad Alderman, “ Ready to assemble: A model state higher education accountability system” Education Sector Reports, December 2008. Available online at: http://www.educationsector.org/usr_doc/HigherEdAccountability.pdf
62
Fourth, the higher education community and state policy makers could develop and uphold policies that elevate productivity in higher education agendas as a policy goal, without attempting to dictate how each institution could achieve such outcomes. Although institution leaders can still dramatically improve performance given current regulations and constraints, supporting policy changes could accelerate progress. Some specific actions policy makers and other stakeholder in the higher education community include:
� Develop a system�for�training�and�familiarizing�leaders,�managers,�and�staff with the types of innovations and operations described in this report. Networking, collaboration, and policy support, while important, may not be able to ensure the types of skills are developed to implement and sustain the reforms in the mass of institutions required.
� States could promote performance budgeting and incentivize�institutions’�success in improving degree productivity; this could be accompanied with capturing the lessons from previous attempts (both national and international), model the insights and build upon those; Similarly federal grants could require reporting of the common metrics captured.
� State’s could invest�in�high�quality,�highly�productive�institutions�in order to expand degree production. Institutions that are self-sustaining on tuition and require limited or no public support may be important models to consider given public budget constraints.70
70 The State of Indiana’s partnership with WGU may offer a model for consideration.
EducationWinning by degrees: the strategies of highly productive higher-education institutions 63
Areas for further research
This work raises questions for further study. Some specific topics for research include:
� Expand the current sample of this work, in order to build a broader database of the educational practices and management policies that work for different institutions and better understand the range of outcomes achieved.
� Further assess degree productivity nuances, for example the impact of program designs, program offering, or research to institutional degree productivity.
� Benchmark the organizational health of higher education institutions. Our work focused on the operational side of the institutions. Research might identify the management and organizational
practices and characteristics of high performing institutions which are most important to achieving high degree productivity.71
� Understand of the “demand” side—in particular examining the demographics of the students who are likely to represent the “1 million more”, their preferences and needs for serving them, and current barriers to entering and completing college.
� Assess success of previous performance based funding, dissecting the drivers of success and the challenges faced, and modeling the impact of alternate designs.
71 See, for example, “Driving Federal Performance”, McKinsey & Company October 2009.
64
Conclusion
The country’s economic needs and ethics of opportunity demand higher education systems must find ways to produce more graduates at a lower cost per degree, without compromising the quality of their education or restricting access. Improving productivity across the U.S. higher education system likely holds the key to success.
Discussing productivity in education is always contentious, since most higher education institutions have aims beyond ensuring that all their students achieve a good degree at a reasonable cost to the institution and the students. But they do all share that
central aim. High levels of productivity shown by some U.S. institutions in the core process of transforming freshmen into graduates suggest a systemwide improvement in productivity is achievable. Other institutions may choose different measures to improve their productivity. But if they focus on the principles established by the most productive—helping more students complete their degrees while controlling total costs, continually monitoring the quality of education, and broadening access —then productivity of U.S. higher education could be transformed.

McKinsey & Company is a management consulting firm that helps many of the world’s leading corporations, public agencies, and non-profit entities address their strategic, organizational, and operational challenges. McKinsey’s Social Sector Office works with global institutions, philanthropies, and public-private partnerships to address chronic, complex societal challenges in health, education and economic development.

Social Sector OfficeNovember 2010Designed by Visual Aids BrazilCopyright © McKinsey & Company Download available at: sso.mckinsey.com/UShighereducation