Embed Size (px)
Citation preview

Irrigation Management of Winegrapes with a Limited Water Supply If there are questions regarding the following information, please contact: Terry Prichard at [email protected] or at 209-‐953-‐6120. Introduction “Appropriate irrigation scheduling” is an axiom whereby irrigations are scheduled to apply an optimum quantity of water that maximizes productivity. This often results in maintaining soil water content near field capacity. Shortages of water, increased costs of irrigation and diseases caused by excessive soil moisture have traditionally been the limiting factors to over irrigation in most annual and perennial crops. However, in the production of winegrapes, it has long been recognized that water deficits can lead to improved fruit quality—especially in red wine varieties. Typical strategies to achieve water deficits in winegrapes were developed using surface irrigation and relied on irrigation cutoff to limit water as the fruit ripened. This resulted in both successes and failures depending on the timing of the cutoff, climatic and soil storage conditions. Precision microirrigation has played a major role in reducing the applied water required in winegrapes by improving emission uniformity. Microirrigation technology made possible new irrigation strategies that can further increase water savings as well as improve fruit quality. Vine water status plays a large role in determining the final composition of the fruit, impacting various solutes such as sugar and organic acids which establish the potential of the fruit to make quality wine. A moderate plant water deficit can improve the partitioning of carbohydrate to reproductive structures such as fruit and also control excessive vegetative growth (Chalmers et al., 1981), giving rise to what has been termed by (Chalmers et al., 1986) as ‘regulated deficit irrigation’ (RDI). Regulated deficit irrigation (RDI) is a term for the practice of regulating or restricting the application of irrigation water limiting the vine water use to below that of a fully watered vine. The reduction is often expressed as a percent (RDI %). By restricting irrigation water, soil water available to the vine becomes limited to a level where transpiration exceeds water uptake. It is at this point that the vine begins to undergo a water deficit. RDI can be a consistent reduction (i.e., consistent reduction of planned irrigation volumes over the entire season) or a variable reduction over the irrigation season to induce the desired vine response at the appropriate time. Achievement of successful RDI requires accurate soil moisture or plant ‘stress’ sensing, the ability to estimate crop demand, and the ability to irrigate frequently. As pointed out by Jones (2004), a disadvantage of RDI is that it requires plant or soil water status to be maintained accurately within a rather narrow tolerance; any excess application loses the advantage of the

2
regulated deficit and can cost more in terms of water used, while any under-‐application can lead to yield or quality losses. Regulated Deficit Irrigation can be a component of a “standard” irrigation strategy or utilized in a “drought strategy” to curtail vine water use during periods of limited water availability. Vine Water Deficits Caused by Reduced Soil Water Availability Under normal early-‐season conditions, (1) water is readily available in the root zone, (2) the vine is not at full canopy expansion, and (3) the atmospheric-‐driven water demand is small. Therefore, under normal early season conditions, water deficits are uncommon in most winegrowing regions of California. As the season progresses without irrigation, the canopy expands, climatic demands intensify and the soil is further depleted of available water. It is at this time that the vine’s water demand can exceed water uptake from the soil causing water deficits. An irrigation deficit occurs when the water absorption lags behind transpiration. Cooler growing regions and a greater volume of available water in the soil from winter storage or irrigation will cause water deficits to be postponed until later in the season. Generally, water deficits do not begin to occur until the vine has extracted about 50 percent of the available soil water contained in the root zone. This rule of thumb is influenced by soil depth, texture and the total water stored in the root zone as well as the severity of the climatic. As water deficits begin, they occur only for a short period of time at the peak water demand period of the day. Initial vine response to water deficits is to reduce the aperture of stomata, pores in the undersides of the leaf, to limit leaf water loss which creates a better balance between transpiration and water absorption. Additional recovery occurs when atmospheric conditions become moderate in the later part of the day and during darkness hours. This cycle continues each day, influenced by climate, available soil moisture and to some extent, root extensiveness. Without irrigation, the water deficits become longer in duration and more severe as the season progresses. Vine Water Status: a Measure of Water Stress Vine water status of leaves is measured using a pressure chamber in which a leaf contained in a plastic bag is placed in the pressure vessel then sealed from the atmosphere with the petiole exposed. The amount of pressure required to exude the xylem sap out of the petiole is termed leaf water potential. Well watered grapevines undergo significant fluctuations in leaf water potential during the day -‐ from a predawn level of -‐1 to -‐3 bars to midday levels of -‐6 to -‐8 bars depending on the severity of the evaporative demand. Midday levels are typically used for comparison since they plateau for a few hours around solar noon, when the sun appears the highest in the sky. The two primary factors determining water status of vines are the availability of soil water and evaporative demand. Once soil water is limited, water is lost from the leaves resulting in more

3
negative midday leaf water potential. Midday leaf water potential of -‐9 to -‐14 indicates levels of low to moderate water stress. Timing of Water Deficits and Seasonal Vine Growth Stages The timing and degree of vine water stress determines the effect on vine growth and fruit development. Moderating the severity of water deficits through stomatal closure works well initially, generally limiting the effects of water deficits to a reduction in vegetative growth. As water deficits increase in severity and duration, the stomatal openings are reduced for longer periods of time. Since the stomata are the entry points for atmospheric carbon dioxide gas used in photosynthesis, severe water deficits limit the time the stomata are fully open which in turn limits photosynthesis. The degree to which canopy and fruit growth are impacted depends on the severity of water deficit and vine growth stage. The rates of vegetative and fruit growth change over the course of the growing season (Figure 1). Shoot growth begins shortly after bud break and proceeds at a high rate so that nearly one-‐half the final shoot length is attained by flowering. Vegetative growth rate then declines to near zero as veraison, the onset of fruit ripening, is approached. Berry growth rate can be described in three stages; Stage I, a rapid period of growth caused by cell division, Stage II, a much slower growth rate referred to as the lag phase and Stage III, a final rapid growth period caused by cell expansion beginning near veraison.
Figure 1. Growth rate of various organs of Colombard grapevines, after Van Zyl (1984)
0
0.5
1
1.5
2
2.5
3
0 20 40 60 80 100 120 140 160 180 200 220
Days from Bud Break
Shoo
t Elo
ngat
ion
Rat
e (c
m/d
ay)
012345678
Berr
y G
row
th R
ate
(g/d
ay/1
00 b
erri
es)
Flowering Veraison Harvest
Shoots
Berries
Vegetative growth rate of the shoot begins to decline in berry Stage I and is virtually non-‐existent during Stage III (Mullins et al., 1992). Most soils can provide adequate water for shoot growth, root growth, and berry cell division up to about a month before veraison.

4
During this period, water deficits reduce main and lateral shoot growth. Limiting canopy growth at this time, in general, can improve fruit quality by allowing more indirect sunlight to reach the clusters during fruit ripening. Depending on the trellis-‐training system, 2 to 5 m2 of leaf area per meter canopy length is optimum, (Kliewer and Dokoozlian, 2005). Another way to assess adequate shoot growth is to determine the pruning weight per unit canopy length. Between 0.5 to 1.0 kg per meter canopy length for a single curtain canopy and 0.4 to 0.8 kg per meter canopy length for a double curtain canopy is considered balanced in terms of the effect on fruit and wine quality (Kliewer and Dokoozlian, 2005). Early Season Deficits Under normal early-‐season conditions up through fruit set, water deficits are uncommon in most winegrowing regions of California because (1) water is readily available in the root zone, (2) the vine is not at full canopy expansion, and (3) the atmospheric-‐driven demand is small. This assumes a root zone of at least 24 inches. Pre-Veraison Deficits As the season progresses without irrigation, the canopy expands, evaporative demand increases and the soil is further depleted of available water. At this time the vine’s water demand can exceed water uptake from the soil causing water deficits. Regions with lower evaporative demand and a greater volume of available water in the soil from winter storage or irrigation will cause water deficits to be postponed to later in the season. Moderate water deficits at this time can control expansive vegetative growth while allowing photosynthesis to continue unabated. This is the basis for successful Regulated Deficit Irrigation strategy. Post-‐Veraison Deficits Although canopy growth is not significant or has stopped, canopy size and climatic conditions drive water use at its maximum rate at this time. Even vineyards with the largest soil resource and cool climate will experience water deficits without irrigation. Moderate deficits are necessary during this period to deter the resumption of shoot growth. Depending on the RDI selected for this period, berry size can be significantly reduced when compared to a well-‐watered vine. Recent research supports less severe water deficits during the last few weeks prior to harvest that will minimize crop reduction while still maintaining desired fruit characteristics. This is especially true when harvest timing is predicated on extended maturation. Postharvest Deficits Severe deficits at this time can lead to a reduction in stored carbohydrate reserves and negatively affect shoot growth and cluster development the next season. Trunk and root growth is responsive to photosynthate produced after harvest. A post harvest root flush requires soil moisture for root expansion. If vines become defoliated a short time after harvest under certain conditions, shoot growth may occur if water is applied.

5
Effects of Water Deficits Vegetative Growth Moderate water deficits inhibit shoot growth and can cause basal leaf drop depending on timing. Both increase the light into the fruit zone promoting fruit color and character. Water deficits occurring early season (bud break to fruit set) are not usually possible in most California viticultural regions as previously discussed. Midseason (fruit set to veraison) water deficits are possible in soils that are shallow or coarse textured with limited water holding capacity. In low rainfall areas and during drought years, midseason deficits are possible even in deep soils. During this period, shoot development (both main shoot length and the number and length of lateral shoots) can be restricted by water deficits (Figure 2). In low vigor situations, reduced leaf area may be insufficient to develop and mature fruit. In years with low amounts of stored soil water, irrigation during midseason may be needed to attain adequate shoot growth. However, in sites with adequate or excessive vine vigor, restricting or controlling additional canopy (leaf area) is desirable. More severe water deficits occurring in the period between veraison and harvest, can result in senescence of lower and interior canopy leaves increasing fruit exposure to light. Depending on canopy size, leaf loss in the fruit zone may occur without significantly reducing sugar accumulation. Moderate amounts of irrigation water during this period can successfully moderate water deficits, causing the desired effect of inhibiting further shoot growth without reducing photosynthesis or causing defoliation. Excessive water deficits can further increase leaf loss, which can lead to sunburn, “raisining” and increased berry temperature, all resulting in reduced fruit quality. Excessive water stress may also result in reduced shoot growth and fruitfulness the following year. Figure 3 illustrates shoot length over time of a full watered treatment compared to two RDI treatments where water volumes of 60 and 35% of full irrigation were applied after -‐12 bars leaf water potential had occurred. Irrigation volumes should be adjusted to moderate, not eliminate, the water deficit late in the season. Excessive irrigation during this period may cause lateral shoot growth to resume, creating a competitive sink for photosynthate, which can delay fruit maturation and harvest. In addition it can increase shading and cause bunch rot in susceptible varieties. Effects on the wine include increased pH, high malic acid concentrations, poor color/character and vegetal flavors. A continued or increasing water deficit following harvest provides little or no benefit to the vine and next year’s crop. Root growth, which increases after harvest if adequate soil moisture is present, can be restricted which can result in early season nutrient deficiencies the following spring.

6
Figure 2. Shoot lengthHopland Cabernet 1999
0
20
40
60
80
100
120
140
160
5/20 5/30 6/9 6/19 6/29 7/9 7/19 7/29 8/8 8/18 8/28 9/7
D a t e
Full WaterRDI -12/60%RDI -12/35%
Begin Irrigating RDIBegin Irrigating Full Water
Berry Growth Stage 1 berry growth begins after fruit set and growth progresses at a rapid rate for 40-‐60 days (Mullins et al., 1992) during which time the berry diameter may double in size. Stage II follows for approximately 7-‐40 days where the growth rate slows or stops, often call the “lag” phase. The onset of Stage III is marked by veraison lasting until near harvest (typically a 35-‐55 day period) in which berry growth resumes. Berry growth is less sensitive to water deficits than vegetative growth. However, depending on the timing and severity of water deficits, berry size can be reduced. Water deficits during Stage I of fruit growth are thought to reduce potential berry size by reducing the number of cells per berry. The reduction in cell number causes smaller berries and almost always causes a reduced yield. As previously mentioned, water deficits at this time are unusual in most winegrape regions of California. However, in years with low amounts of stored water at bud break, irrigation may be needed to prevent significant reduction of berry size and therefore yield reduction. Water deficits occurring during Stage II (lag phase) or III (cell enlargement) can only affect individual cell size. The common effect of moderate water deficits during these later periods is to slightly reduce berry (cell) size. Severe water deficits near harvest can cause reduced berry size at harvest by dehydration. Fruit Quality

7
Potential wine quality is largely determined by the composition of the fruit. The solute composition of fruit at harvest is sensitive to vine water status throughout its development. Moderate water deficits a few weeks before veraison and continuing until harvest can increase the rate of sugar accumulation. If deficits are severe and/or the vine is carrying a large crop, sugar accumulation is generally slowed and further increases in sugar are mostly driven by berry dehydration rather than sugar production. The result is often a fruit with poor balance of solutes and reduced wine quality potential. Titratable Acidity/Malic Acid Water deficits result in only moderate decreases in titratable acidity; however, malic acid is likely to decrease sooner with pre-‐veraison season water deficits. Deficit irrigation causing moderate water deficits typically reduces malic acid concentrations by one third of a fully watered vine. Increased water stress before irrigation begins, as well as after start of irrigation, further reduces malic acid content (Lundquist et al., 2004) (Table 1). With malic acid declining, the greatest effect of water deficits on the fruit is an increase in the tartaric to malic acid ratio
Table 1. Hopland 1998 Cabernet Sauvignon
Must Analysis
oBrix pH Titratable Acidity
(gm/L)
Malate
(mg/L)
T1 (100) 23.0 3.37 6.68 3555
T2 (-‐14/60) 23.1 3.49 4.94 2528
T3 (-‐14/35) 22.4 3.51 5.39 1450
T4 (-‐12/60) 23.2 3.43 6.04 2645
T5 (-‐12/35) 23.0 3.50 5.97 1808
P= 0.4788 0.4152 0.0004 0.0001
Treatments: T1 (100) = full potential water use
T2-‐T5 = Leaf water potential at irrigation start / RDI %
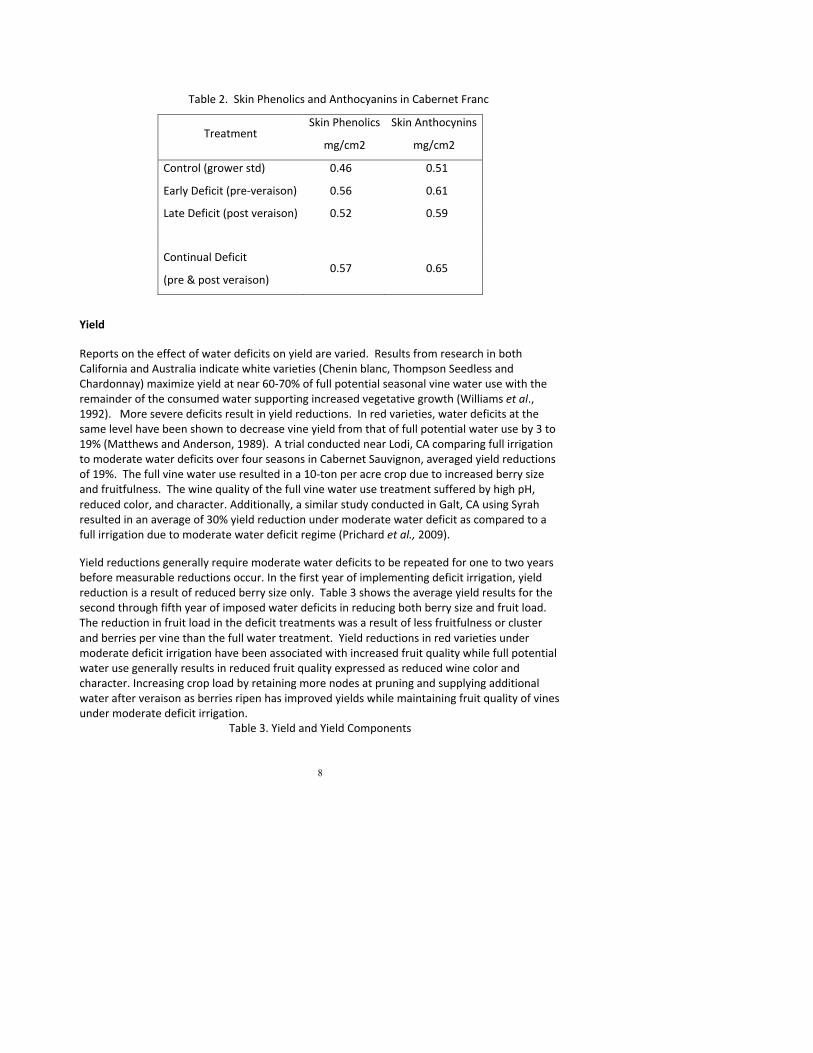
Phenolics Phenolics contribute bitterness and astringency in addition to flavors existing in berry flesh and skin. Water deficits and timing of such have a positive influence of the levels of skin phenolics including anthocyanins. Table 2 shows that timing of water deficits increased concentrations of skin phenolics and anthocyanins compared to a more fully watered grower standard (Matthews and Anderson, 1988)
8
Table 2. Skin Phenolics and Anthocyanins in Cabernet Franc
Treatment Skin Phenolics
mg/cm2
Skin Anthocynins
mg/cm2
Control (grower std) 0.46 0.51
Early Deficit (pre-‐veraison) 0.56 0.61
Late Deficit (post veraison) 0.52 0.59
Continual Deficit
(pre & post veraison) 0.57 0.65
Yield Reports on the effect of water deficits on yield are varied. Results from research in both California and Australia indicate white varieties (Chenin blanc, Thompson Seedless and Chardonnay) maximize yield at near 60-‐70% of full potential seasonal vine water use with the remainder of the consumed water supporting increased vegetative growth (Williams et al., 1992). More severe deficits result in yield reductions. In red varieties, water deficits at the same level have been shown to decrease vine yield from that of full potential water use by 3 to 19% (Matthews and Anderson, 1989). A trial conducted near Lodi, CA comparing full irrigation to moderate water deficits over four seasons in Cabernet Sauvignon, averaged yield reductions of 19%. The full vine water use resulted in a 10-‐ton per acre crop due to increased berry size and fruitfulness. The wine quality of the full vine water use treatment suffered by high pH, reduced color, and character. Additionally, a similar study conducted in Galt, CA using Syrah resulted in an average of 30% yield reduction under moderate water deficit as compared to a full irrigation due to moderate water deficit regime (Prichard et al., 2009). Yield reductions generally require moderate water deficits to be repeated for one to two years before measurable reductions occur. In the first year of implementing deficit irrigation, yield reduction is a result of reduced berry size only. Table 3 shows the average yield results for the second through fifth year of imposed water deficits in reducing both berry size and fruit load. The reduction in fruit load in the deficit treatments was a result of less fruitfulness or cluster and berries per vine than the full water treatment. Yield reductions in red varieties under moderate deficit irrigation have been associated with increased fruit quality while full potential water use generally results in reduced fruit quality expressed as reduced wine color and character. Increasing crop load by retaining more nodes at pruning and supplying additional water after veraison as berries ripen has improved yields while maintaining fruit quality of vines under moderate deficit irrigation.
Table 3. Yield and Yield Components

9
2005-‐2008 Syrah, Galt
Irrigation Yield
(lbs/vine)
Berry Size
(g)
Fruit Load
(berries/vine)
Cluster No.
(Cl/vine)
Cluster Wt.
(lbs/Cl)
I-‐1 22.1 a 1.52 a 6342 a 57.5 a 0.37 a
I-‐2 17.0 b 1.29 b 5779 b 53.4 b 0.30 b
I-‐3 14.1 c 1.20 c 5209 c 47.4 c 0.29 b
P = 0.0000 0.0000 0.0000 0.0000 0.0000
Treatments: I-‐1 Full Potential Water Use
I-‐2 -‐14 bars leaf water potential at irrigation start / 50% RDI to 100% at 19º Brix
I-‐3 -‐14 bars leaf water potential at irrigation start / 50% RDI
Developing an Irrigation Strategy Incorporating RDI Principles Deficit Irrigation is practiced to limit excessive vegetative growth and improve fruit quality or limit water use in times of drought. If neither of these conditions exist, alternative irrigation strategies may be more appropriate. Examples of the latter include young developing vineyards and low vigor vineyards whether it is from rootstock/scion selection for the soil resource or nutrition or pest related issues. When selecting an irrigation strategy it should be designed to accomplish a solution to a specific problem, executed, and then monitored to determine its effect. Adjustments can be made in succeeding years to move towards the desired effects. A strategy to control excessive vigor and open up the canopy to increase diffuse light to the fruit zone generally requires that no irrigation be applied until shoot growth has slowed as a result of reduced water availability in the root zone. Visual clues or leaf water potential measurements may be used to monitor vine water deficits to allow only a moderate level of stress to occur prior to the first irrigation. Moderate levels of vine water stress vary somewhat by variety and fruit quality goals. White winegrapes can benefit by reducing vegetative growth, however leaf loss allowing light into the canopy may create more color and character than desired. Red winegrapes on the other hand tend to benefit from more exposure and higher levels of stress. Mid-‐day leaf water potential of -‐10 to -‐13 bars is a typical irrigation start point for a RDI program white winegrapes. Red winegrapes develop desired fruit characteristics with a more severe midday leaf water potential of -‐13 to -‐15 bars. Varieties of red grapes differ in responsiveness to water stress. Merlot is most sensitive followed by Cabernet Sauvignon and Syrah. Within this group, Zinfandel is the most tolerant to water stress.

10
Once a specific midday leaf water potential is selected as the irrigation start point (referred to as the “irrigation threshold” or simply “threshold” in this document) the question then becomes how much water to apply for a specific RDI. The RDI is a percentage of the full potential vine water use based on climatic demand and canopy size. The selected RDI should be low enough to prevent the resumption of shoot growth and high enough to continue photosynthesis, and prevent excessive leaf loss which could cause the fruit to be sunburned or raisined. Successful RDI’s are typically 50 to 60% of full vine water use. More severe RDI’s of 35-‐40%, when sustained through the ripening period, have resulted in delayed maturity and poor quality fruit in seasons with weather conditions that also delay fruit maturity. Implementing a Strategy Using Deficit Threshold-‐RDI Irrigation The first seasonal irrigation is made at a specific vine water status which can be measured by leaf water potential.) Once the threshold stress level is achieved the volume of water to apply is determined by calculating the full potential vine water use for an irrigation period based on the canopy size then applying a portion (RDI %) of the full water use. Estimating Full Potential Water Use Full potential water use varies as a result of climatic conditions and the size of the canopy. The climate factor can be estimated using the reference evapotranspiration (ETo) values, which indicate that vine water use varies over the season. “Normal” or average year’s ETo data for the period of 1984-‐ 2003 is shown for Lodi, California in Figure 3. Water use is also influenced by vine canopy growth from bud break to full canopy expansion. Canopy growth is accounted for by a modifying factor of the ETo called the Crop Coefficient (Kc). The Kc varies from a small value after bud break and increases as the vine canopy expands to maximum size. Together, these factors (ETo and Kc) contribute to a water use pattern that begins at a low rate in spring, peaks in mid-‐summer, and then declines as leaf drop approaches. Canopy management practices such as hedging and leaf removal or canopy disruption by machine harvesting can further modify this pattern by reducing the solar energy interception by the vine and therefore the Kc. When considering the water use of a single vine, a larger canopy will have a larger leaf area exposed to the atmospheric conditions that drive water use and, therefore, that individual vine will have a greater water use. When estimating the full water use of an area of land planted to winegrapes (ETc), it is necessary to quantify the extent of canopy coverage by measuring the percentage of land surface shaded by the vine canopy. Trellis design, vine health, and vigor as a result of rootstock/scion combination, soil conditions, pests that affect leaf area or root function, and fertility can affect the amount of land surface shaded. In addition, vine training, trellis type, and spring growth conditions influence the rate of canopy expansion thus emphasizing the fact that the percentage of land surface shaded increases as the canopy develops. The variables that

11
affect land surface shading will subsequently affect vine water use. Vine water use increases as the percent of land surface shaded increases. Row spacing can influences percent land surface shaded with closer rows increasing the land surface shaded by the vines. Wider spaced rows, young grapevines or low vigor vines with a small canopy have a lesser percentage land surface shaded and use less water on a per-‐ acre basis than vines with a larger canopy. The percentage of land surface shaded is measured midday (solar noon). The method described in the next section for estimating land surface shading seems to work well with bilateral or quadrilateral trellis systems, but less so when vertical shoot positioned (VSP) vineyards are measured. VSP canopies have the minimum land surface shaded at solar noon when row orientation is north/south and therefore may require a different method to account for the canopy/land surface relationship. Research is currently underway to develop a reliable method for use with VSP and similar trellis systems. Evapotranspiration Reference Values (ETo) Reference evapotranspiration (ETo) values are calculated using measurements of climatic variables including solar radiation, humidity, temperature, and wind speed and expressed in inches or millimeters of water. A one-‐inch depth of water use, like rainfall or irrigation water, is equal to 27,158 gallons per acre of land. ETo values most closely approximate the water use of a short mowed full coverage grass crop. Climatic data are continuously collected from which ETo values are calculated and made available to the public by CIMIS. The California Irrigation Management Information System (CIMIS) is managed by the State of California Department of Water Resources, and it collects data from nearly 100 weather stations throughout California to calculate ETo. Both historical averages (normal) and real time (current year) daily ETo and climate data are available. CIMIS is on the web at: http://www.cimis.water.ca.gov
Figure 3. Lodi Eto, 1984 - 2003 AverageCIMIS Stations # 42 and 166
0
0.5
1
1.5
2
1/1 2/12 3/25 5/6 6/17 7/29 9/9 10/21 12/2
ETo
Wee
kly
(in)
Crop Coefficient (Kc)

12
The Crop Coefficient (Kc) is a factor used to modify reference evapotranspiration (ETo) values to estimate full grapevine water use (ETc) of a non-‐water stressed vineyard. In vineyards, Kc values have been experimentally linked to the percent shaded area measured at midday. Shaded area can be measured and Kc calculated at any time of the season, however when using the Deficit Threshold-‐RDI Method, it is necessary to only measure at the threshold or beginning of irrigation. At that time, canopy expansion is complete. It should be re-‐measured if canopy reductions occur due to management practices such as hedging. Larry Williams (2005) demonstrated in a weighing lysimeter at the University of California Kearney Research and Extension Center that vineyard water use and Kc increases linearly with the percentage of land surface shaded by the crop (Figure 4). He suggests measuring the percent shaded at midday and using the following equation to determine Kc:
Figure 4. Relationship between land surface shaded and crop coefficient (Kc)
Kc = 0.002 + 0.017 × the percent shaded area
Simplified Equation: Kc = 1.7 × proportional shaded area (e.g., use 0.40
for 40% shaded area)
The procedure would entail measuring the average shade on the floor at midday of (as an example), an 11-‐foot row spacing with a 7 foot vine spacing. The average amount of shade between two vines is measured at 31 sq ft then compared to the single vine area of 77 sq ft which is 40% of the square foot area of one vine. The Kc is calculated as follows:
Kc= (1.7 x 0.40) = 0.68 Calculating Full Potential Water Use with Historical Average ETo The best way to illustrate the mechanics of calculating the amount of water to apply after a threshold stress level has been reached is to use a spreadsheet that develops an irrigation schedule that incorporates ETo, Kc, a selected RDI, soil moisture use, and effective rainfall. The following example illustrates the use of a spread sheet for a vineyard in Northern San Joaquin Valley, California. (See Appendix for an irrigation schedule utilizing inputs for a vineyard located in North Coast California) The specific vineyard conditions are: Variety: Cabernet Sauvignon, mature

13
Training: Sprawl (not shoot positioned) Spacing 7 x 11 feet bi-‐lateral cordon
Leaf water potential threshold of -‐13 bars reached July 8th Shaded area: 68% or 0.68 Area: Lodi, CA CIMIS station # 166 Harvest: October 1st Figure 5 is a calculation of weekly full potential water use for Lodi, CA using the 1984 to 2003 historical average ETo for CIMIS stations #42 and #166 (station #42 replaced by #166 in 2001.). After the -‐13 bar threshold was achieved (July 8 in this example), the full potential water use can be calculated from the threshold date to the end of the season using average historical ETo values. The Kc used is 0.68 for a 40% midday shaded area. Calculations are made only after the threshold midday leaf water potential (-‐13 bars) was measured in the vineyard on July 8. The product of ETo and Kc yields the full potential water use.
ETo × Kc = Full Potential Water Use (ETc) Calculating the Water Use Using Regulated Deficit Irrigation% (RDI %) Once the full potential water requirement is calculated for the vineyard, the Regulated Deficit Irrigation percent (RDI %) is used to calculate the amount of water the vineyard will use under the RDI % you have selected. In our example, 0.50 or 50 % of full potential water use was selected. Notice the RDI % increased to 1.0 or 100% after harvest as full water is required to encourage root growth and further carbohydrate accumulation. Figure 6 shows the full potential water use x RDI % makes up the majority of the net irrigation requirement.

14

15

16
Adjusting the Schedule for the Current Season’s Weather Conditions
When real time (current season) ETo and effective rainfall values become available, they can be substituted into the table to account for the variance from normal ETo and actual effective rainfall values. Real time ETo and rainfall are available on a one day lag time from the CIMIS network. The Deficit Threshold-‐RDI Method relies on a calculation using historical ETo data for a one-‐week period, then applying the indicated amount of water to the vineyard. After the end of that week, real time data is then downloaded and input into the spreadsheet to replace the historical ETo used to develop the previous week’s schedule. Any difference between the previous week’s application volume should be adjusted as an addition or subtraction on the new, current week’s schedule. For example if 12 hours were applied using the historical ETo values and upon re-‐calculating using real-‐time data it is determined the amount should have been 11 hours, simply subtract 1 hour from the current week schedule. In order to react to rapidly changing climate, if an extraordinary hot and low humidity period begins and is expected to last a few days—increase the irrigation volume to try to meet the increase in water use. When recalculating with real time ETo values, the next week’s result will indicate your success in estimation. Accounting for Soil Water Contribution The soil moisture content declines as the vine extracts moisture from the beginning of shoot growth. When the leaf water potential threshold is reached, the vine can still remove additional moisture from the root zone until harvest; however, the available moisture is located at deeper depths, and the rate of extraction is slow. This water must be accounted for as an input to vine water use. The available soil water volume remaining at the leaf water potential threshold can be estimated. In deep (7 ft) medium texture soils, an average amount of water removed from the irrigation start to harvest is typically 2½ inches. On shallower soils, this amount can be as low as 1 inch. Soil water content can be measured using a calibrated instrument to obtain inches of water per foot of soil and the water content of the root zone can be measured at bud break, the irrigation start and at harvest. Subtracting the irrigation start soil moisture content from the moisture content at bud break will represent the volume of soil moisture used prior to the onset of irrigation. Additionally, subtracting the harvest (dry point) soil moisture content from the volume at the irrigation start represents the volume of water the vines will use from that point through harvest. Table 4 shows the readings typical of a 7 ft depth sandy loam soil in Lodi, California. If soil measurements are not available, use the estimations described above.

17
Table 4. Total Root Zone Soil Moisture Content
Inches Inches
Total Moisture
A – Bud Break 16.0
B – Irrigation Start 12.45
C – Harvest 10.0
Available Water
At Bud Break A – C 6.0
At Irrigation Start B – C 2.4
The water that will be used from the threshold to harvest is called the soil contribution. Divide the amount (in this example, 2.4 inches) by the weekly periods from the threshold to the estimated harvest date, July 8 through Sept 30. Figure 7 illustrates the addition of the estimated soil contribution of each weekly period from the threshold to harvest (Column E) as follows:
2.4 inches / 12 weekly periods = 0.2 inches per period Accounting for Effective Rainfall Effective rainfall is usually minimal in the period of time from the threshold through harvest. However, significant rainfall is possible and must be accounted for as a water source to meet the calculated vine requirement. The most practical method to estimate effective in-‐season rainfall for vineyards is using the formula:
Effective Rainfall = [rainfall (in) -‐ 0.25 in] × 0.8 This method discounts the first 0.25-‐inch as lost to evaporation after the event and estimates 80% of the remainder is stored in the soil for vine use. In Figure 7, the effective rainfall (column F) is entered the week beginning October 28. The measured rainfall was 0.65 inches and the effective rainfall is calculated as follows:
Effective Rainfall = [0.65 -‐0.25] × 0.8 = 0.32in. Notice that the 0.32 inches is nearly equal to that week’s calculated vine use and the irrigation volume is reduced to near zero for that week period.

18
Monitoring Performance to Evaluate the Strategy Measuring vine performance makes it possible to improve the irrigation both during the current year and for the following season. Leaf water potential can be measured after the irrigation threshold has been reached to evaluate the effectiveness of the RDI%. . Fruit quality and yield components can be measured at harvest while maximum shoot length and pruning weights can be measured after harvest.

19
Post Threshold Midday Leaf Water Potential Using the Deficit Threshold-‐RDI Method, measurements of vine water status are made to determine when to begin irrigation. The pressure chamber is then used to monitor the vine water status as it is influenced by the irrigation amounts determined by the RDI %. Vine water status measurements that assess maximum water stress should be made just before an irrigation event. Figure 8 shows the leaf water potential of various irrigation regimes before and after weekly irrigation events. Post threshold monitoring can be used to determine the effect of the irrigation amounts and to validate the RDI %. Changes can be made to the irrigation volumes if results are inconsistent with expectations. Note that there can be a lag in leaf water potential recovery after significant water deficits as shown after irrigation began in Treatment 4 (Figure 8).
Vegetative Growth Shoot length measurements are the most common evaluation of vegetative growth. They can be made after veraison, before hedging or at pruning if no hedging occurred prior to harvest. Shoot growth is quite variable, so more measurements will give a better estimate of the average. Maximum shoot length can be determined prior to pruning. Pruning weights are also a good indication of vegetative growth when vines are not hedged at harvest. Typically, the pruning weights of 10 vines per site and 3 sites per block are necessary

20
to achieve a reasonable average. Measurement of spur diameter between the 1st and 2nd buds of a spur is also gaining popularity since pre-‐harvest hedging frequently occurs. Yield Yield is typically recorded as the delivered fruit from a block. It is important to keep blocks irrigated by different strategies separate to evaluate the effect of an irrigation regime. Cluster counts on a per vine basis and a berry sample to determine average berry size is more illuminating than just yield, since berry size and fruit load determines the ultimate yield. Figure 9 shows the average relationship between berry size and the portion of full water use (applied water) from six vineyards in 1998 (from L.E. Williams 1998). Berry weight was 97% of maximum at 0.75 of full potential water use.
Fruit Quality Visual estimates of fruit quality include the amount of sunburn, shrivel, and rot. Fruit quality can be assessed by measuring soluble solids (ºBrix), pH, titratable acidity (TA), and malic acid content. Each of these measurements along with the comments from the winemaker should be used to evaluate the success of any irrigation regime. Some wineries are also determining quality by color based on total phenolics, measured by gallic acid equivalent.

21
Important Considerations Using a RDI Strategy Young Vines Young vines should be fully irrigated until the first bearing year to maximize root and above-‐ground growth. Use of Cover Crops Vines in deep soil and high available water holding capacity soils located in a cool region, may not reach the predetermined RDI threshold by harvest or the threshold may be reached only after a sustained severe weather period. In these cases, the soil/water resource is too large for the environmental demand. The use of a cover crop to extract moisture might be appropriate to reduce the available soil water. In shallow soils or low water holding capacity soils a cover crop or resident vegetation may cause the threshold to be reached too early in the season causing water deficits in berry development (Stage I). Water deficits at this time will reduce fruit set and cause smaller berries, which will reduce yields. To avoid this situation, irrigation can delay the threshold until adequate shoot growth is attained. Rootstocks Rootstock differences seem to be insignificant for the RDI threshold selected; however, the rate at which the threshold is reached seems to be rootstock dependent. The more vigorous and root extensive rootstocks will be slower and more predictable in the increase in water stress as they approach the threshold. Less vigorous rootstocks and those that have a predominance of shallow roots will increase in water stress in a more rapid fashion, especially when climatic conditions are harsher. Low Vigor Vineyards Extremely low vigor vineyards with barely sufficient leaf area to sustain vine growth and mature fruit are not appropriate candidates for the Regulated Deficit Method. Reduced canopy growth in these vineyards may be due to a variety of causes including minimum available water holding capacity, disease or pests. In other low vigor sites, the effects of a RDI strategy yield and fruit maturity must be carefully monitored. Drought Periods or Low Rainfall Years In years with low amounts of stored soil water at bud break, irrigation may be needed prior to bloom to attain adequate shoot growth. However, when vine vigor provides adequate to more than adequate canopy to support the crop load, limiting water availability and restricting or controlling additional canopy (leaf area) is desirable. Soil Salinity

22
At sites with elevated soil salinity, deficit irrigation needs to be approached with some caution. High soil salinity adds an additional stress factor to the vineyard, and needs to be taken into account when restricting irrigation. The leaching requirement of such soils may also lead to the need for increased water applications outside of the normal vine growth period. Extreme Climate Selecting a high stress threshold or low RDI% can be risky in growing areas where severe climatic conditions exist. Either of these selections combined with sever climate conditions can lead to excessive fruit exposure raising berry temperature and preventing the accumulation of pigments, resulting in poor berry color. Enhancement of color pigments (anthocyanin) and flavor compounds (phenolics) is a consistent result of optimum light exposure , not high berry temperature. Leaf Removal Water deficits can cause basal leaves to drop depending on severity. Leaf removal, mechanically or by hand, can open the canopy and supply additional light in the fruiting area. These practices are synergistic and care should be exercised when using both practices, especially in more extreme climatic region of California. Water Savings Using a Regulated Deficit Irrigation strategy, whether in response to drought conditions or in the normal course of producing quality fruit, considerable water can be saved over full potential vine water use. Typical water savings using RDI varies by growing region from 28 to 57% (Table 5).
Table 5. Irrigation Water Comparison Full/Deficit in Three Areas
San Joaquin Valley Lodi North Coast Full water use (in) 29 27 24 Soil storage (in) 4 9 10 Net irrigation requirement (in) 25 18 14 Irrigation efficiency (%) 90 90 90 Gross irrigation requirement (in) 27.8 20 15.6 Deficit irrigation use (in) 22 18 16 Soil storage (in) 4 9 10 Net irrigation requirement (in) 18 9 6 Irrigation efficiency (%) 90 90 90 Gross irrigation requirement (in) 20 10 6.7 Deficit/Full (%) 72 50 43

23
Water Use Efficiency Water use efficiency can be viewed from the perspective of the amount of grapes per unit of applied water consumed or the total water consumed. Total water consumed (ETc) includes soil water contribution, effective in season rainfall, and irrigation. Regardless which measure of water use efficiency used, full potential vine water use is the least efficient (Table 6). An increase in efficiency is possible using deficit irrigation. RDI level 3 (most severe) was the highest water use efficiency while the less severe RDI level 2 was intermediate.
Table 6. Water Use Efficiency
2005 Syrah, Galt
Yield Lbs Product / Acre Inch Water
Treatment lb /vine Applied
Water
Consumed Water
Full Potential 16.4 522 379
RDI Level 2 11.5 810 418
RDI Level 3 10.8 983 479

24
References: Chalmers. D.J., G. Burge, P.H. Jerie, P.D. Mitchell. 1986. The mechanism of regulation of Bartlett pear fruit and vegetative growth by irrigation withholding and regulated deficit irrigation. Journal of the American Society of Horticultural Science 111, 904–907. Chalmers, D.J., P.D. Mitchell, L. Vanheek. 1981. Control of peach tree growth and productivity by regulated water supply, tree density and summer pruning. Journal of the American Society of Horticultural Science 106, 307–312. Coombe, B.G. 1960. Relationship of growth and development to changes in sugars, auxin and gibberellins in fruit of seeded and seedless varieties of Vitis vinifera. Plant Physiol. 35: 241-‐250. http://www.plantphysiol.org/cgi/reprint/35/2/241 Jones, H.G. 2004. Irrigation scheduling: advantages and pitfalls of plant-‐based methods, Journal of Experimental Botany 2004 55(407):2427-‐2436. http://jxb.oxfordjournals.org/cgi/reprint/55/407/2427 Kliewer, W.M. and N.K Dokoozlian. 2005. Leaf Area/Crop Weight Ratios of Grapevines: Influence on Fruit Composition and Wine Quality. American Journal of Enology and Viticulture. 56:2. http://www.ajevonline.org/cgi/reprint/56/2/170 Lundquist, E.J., T.L. Prichard, R.J. Smith. 2005. Regulated Deficit Irrigation Effects on California North Coast Cabernet Sauvignon. Abstract presented to 56th Annual Meeting of the American Society for Enology and Viticulture. Matthews, M.A. and M.M. Anderson. 1989. Reproductive development in grape (Vitis vinifera L.): responses to seasonal water deficits. Am J Enol Vitic 40(1):52–60. http://www.ajevonline.org/cgi/reprint/40/1/52 Mullins, M.G., A. Bouquet, E. Williams. 1992. Biology of the grapevine, published by Cambridge University Press. Prichard, T.L., P.S.Verdegaal, and C.A. Ingels. 2009. Deficit Irrigation Management Strategies and the Influence of Extended Maturation on Vine Health, Fruit Yield and Quality: Syrah in Region III-‐IV. Report to California Department of Water Resources. Williams, L. E., D. W. Williams, and C. J. Phene. 1992. Modelling grapevine water use. Proc. 8th Australian Wine Industry Technical Conference. http://www.awitc.com.au/proceedings/default.asp?action=search&ARTICLE_AUTHORS=williams&ARTICLE_TITLE=&DATE=1993&AUTHORS=request.form%28ARTICLE_AUTHORS%29&submit_search=Search Williams, L.E. 1998.
�

25
Williams, L. E., and J.E. Ayres. 2005. Grapevine water use and the crop coefficients are linear functions of the shaded area measured beneath the canopy. Agricultural and Forest Meteorology. 132:201-‐211. http://www.sciencedirect.com/science?_ob=PublicationURL&_tockey=%23TOC%235881%232005%23998679996%23609060%23FLA%23&_cdi=5881&_pubType=J&_auth=y&_acct=C000066888&_version=1&_urlVersion=0&_userid=5411275&md5=94c8cc8a0448362723abe12c123898d8 Williams, L.E. , and F. J. Araujo2002. Correlations among predawnleaf, midday leaf, and midday stem water potential and their correlations with other measures of soil and plant water status in Vitis vinifera. J. Amer Soc. Hort. Sci. 127:448-‐454. http://journal.ashspublications.org/cgi/reprint/127/3/448 Van Zyl, J.L. 1984. Response of colombar grapevines to irrigation as regards quality aspects and growth. South Afr. J. Enology and Viticulture 5:19-‐28. http://www.sasev.org/journal/sajev-‐articles/volume-‐5-‐1/art3 response of columbar to irrigation.pdf/view

26
Appendix Threshold Deficit RDI Scheduling for Windsor California
The specific vineyard conditions are: Variety: Cabernet Sauvignon, mature Spacing 5 x 10 feet Quad cordon, shoot positioned Leaf water potential threshold of -‐13 bars reached July 8th Shaded area: 30% or 0.30 Area: Windsor, CA CIMIS station # 103 Harvest: October 1st

27

28
29
Contributors:
Terry Prichard, UCCE Water Management Specialist, e-‐mail: [email protected], phone: 209-‐953-‐6120.
Mark Battany, UCCE Viticulture Farm Advisor-‐San Luis Obispo and Santa Barbara County, e-‐mail: [email protected], phone: 805-‐781-‐5948.
Rhonda Smith, UCCE Viticulture Farm Advisor – Sonoma Co., e-‐mail: [email protected], phone: 707-‐565-‐2621.
Larry Schwankl, UCCE Irrigation Specialist, e-‐mail: [email protected], phone: 559-‐646-‐6569.