Embed Size (px)
DESCRIPTION
Statistic about wine market in Greece
Citation preview
WINE IN GREECE
Euromonitor International
May 2012
W I N E I N G R E E C E P a s s p o r t I
© E u r o m o n i t o r I n t e r n a t i o n a l
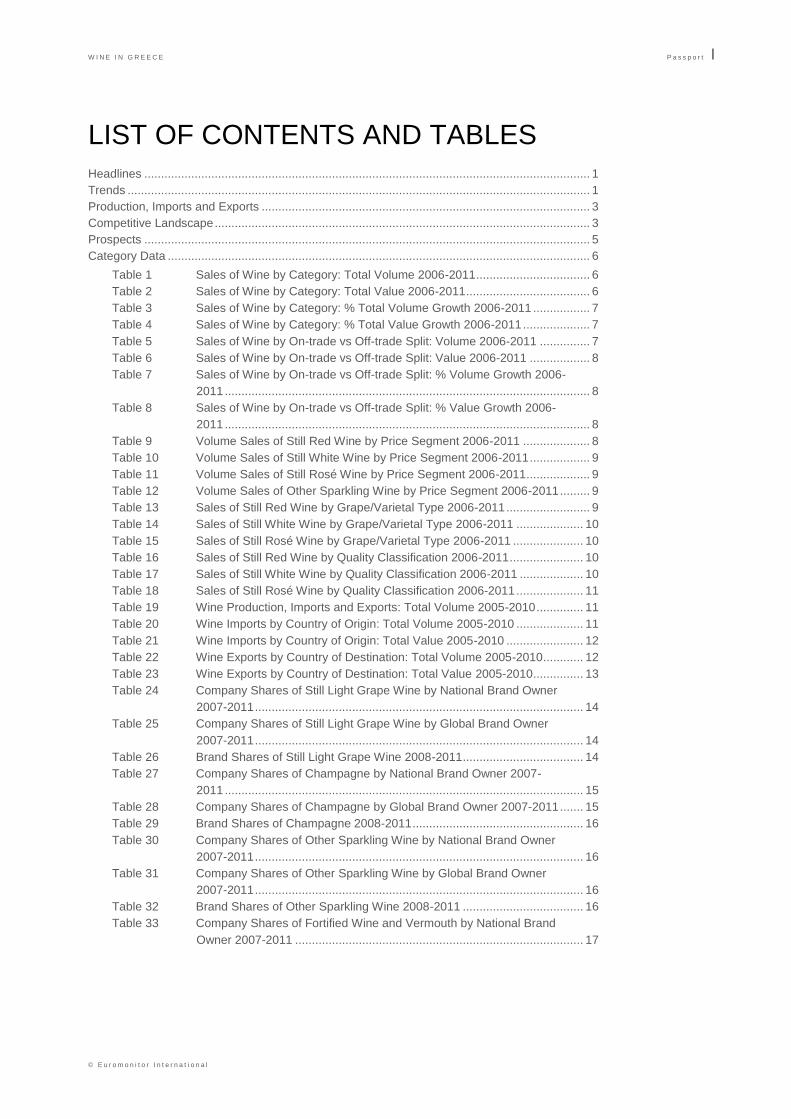
LIST OF CONTENTS AND TABLES
Headlines ..................................................................................................................................... 1 Trends .......................................................................................................................................... 1 Production, Imports and Exports .................................................................................................. 3 Competitive Landscape ................................................................................................................ 3 Prospects ..................................................................................................................................... 5 Category Data .............................................................................................................................. 6
Table 1 Sales of Wine by Category: Total Volume 2006-2011 .................................. 6 Table 2 Sales of Wine by Category: Total Value 2006-2011 ..................................... 6 Table 3 Sales of Wine by Category: % Total Volume Growth 2006-2011 ................. 7 Table 4 Sales of Wine by Category: % Total Value Growth 2006-2011 .................... 7 Table 5 Sales of Wine by On-trade vs Off-trade Split: Volume 2006-2011 ............... 7 Table 6 Sales of Wine by On-trade vs Off-trade Split: Value 2006-2011 .................. 8 Table 7 Sales of Wine by On-trade vs Off-trade Split: % Volume Growth 2006-
2011 ............................................................................................................. 8 Table 8 Sales of Wine by On-trade vs Off-trade Split: % Value Growth 2006-
2011 ............................................................................................................. 8 Table 9 Volume Sales of Still Red Wine by Price Segment 2006-2011 .................... 8 Table 10 Volume Sales of Still White Wine by Price Segment 2006-2011 .................. 9 Table 11 Volume Sales of Still Rosé Wine by Price Segment 2006-2011 ................... 9 Table 12 Volume Sales of Other Sparkling Wine by Price Segment 2006-2011 ......... 9 Table 13 Sales of Still Red Wine by Grape/Varietal Type 2006-2011 ......................... 9 Table 14 Sales of Still White Wine by Grape/Varietal Type 2006-2011 .................... 10 Table 15 Sales of Still Rosé Wine by Grape/Varietal Type 2006-2011 ..................... 10 Table 16 Sales of Still Red Wine by Quality Classification 2006-2011 ...................... 10 Table 17 Sales of Still White Wine by Quality Classification 2006-2011 ................... 10 Table 18 Sales of Still Rosé Wine by Quality Classification 2006-2011 .................... 11 Table 19 Wine Production, Imports and Exports: Total Volume 2005-2010 .............. 11 Table 20 Wine Imports by Country of Origin: Total Volume 2005-2010 .................... 11 Table 21 Wine Imports by Country of Origin: Total Value 2005-2010 ....................... 12 Table 22 Wine Exports by Country of Destination: Total Volume 2005-2010 ............ 12 Table 23 Wine Exports by Country of Destination: Total Value 2005-2010 ............... 13 Table 24 Company Shares of Still Light Grape Wine by National Brand Owner
2007-2011 .................................................................................................. 14 Table 25 Company Shares of Still Light Grape Wine by Global Brand Owner
2007-2011 .................................................................................................. 14 Table 26 Brand Shares of Still Light Grape Wine 2008-2011 .................................... 14 Table 27 Company Shares of Champagne by National Brand Owner 2007-
2011 ........................................................................................................... 15 Table 28 Company Shares of Champagne by Global Brand Owner 2007-2011 ....... 15 Table 29 Brand Shares of Champagne 2008-2011 ................................................... 16 Table 30 Company Shares of Other Sparkling Wine by National Brand Owner
2007-2011 .................................................................................................. 16 Table 31 Company Shares of Other Sparkling Wine by Global Brand Owner
2007-2011 .................................................................................................. 16 Table 32 Brand Shares of Other Sparkling Wine 2008-2011 .................................... 16 Table 33 Company Shares of Fortified Wine and Vermouth by National Brand
Owner 2007-2011 ...................................................................................... 17
W I N E I N G R E E C E P a s s p o r t I I
© E u r o m o n i t o r I n t e r n a t i o n a l
Table 34 Company Shares of Fortified Wine and Vermouth by Global Brand
Owner 2007-2011 ...................................................................................... 17 Table 35 Brand Shares of Fortified Wine and Vermouth 2008-2011 ......................... 18 Table 36 Forecast Sales of Wine by Category: Total Volume 2011-2016 ................. 18 Table 37 Forecast Sales of Wine by Category: Total Value 2011-2016 .................... 18 Table 38 Forecast Sales of Wine by Category: % Total Volume Growth 2011-
2016 ........................................................................................................... 19 Table 39 Forecast Sales of Wine by Category: % Total Value Growth 2011-
2016 ........................................................................................................... 19
W I N E I N G R E E C E P a s s p o r t 1
© E u r o m o n i t o r I n t e r n a t i o n a l
WINE IN GREECE
HEADLINES Wine declines by 7% in total volume terms to reach 315 million litres in 2011
The economic downturn has a qualitative and quantitative impact on sales
With just a -4% decline in total volume terms, other sparkling wine is the best performing
segment in 2011
Average price of wine declines to EUR13 per litre as the penetration of economy wines
increases
With 10% volume share, Malamatinas, E, & Sons SA leads wine in 2011
Wine is expected to continue to witness a decline over the forecast period with a -3% CAGR
in total volume terms
TRENDS The economic downturn led to a decline in sales of wine. Consumers reduced spending in all
non-commodity goods along and in this context wine sales were also affected. The category
benefited to an extent from consumers trading down from spirits, yet at the same time the
penetration of artisanal wine increased considerably in the expense of branded products,
further contributing to the decline in sales.
Sales in volume terms declined by 7% to reach 315 million litres in 2011. The decline was
undoubtedly higher compared to the review period CAGR of -2%, given that the recession
forced consumers to migrate to cheaper wines, switch to at-home consumption and at the
same time reduce consumption of wine altogether.
With a -3% volume growth rate, other sparkling wine was the best performing segment within
wine in 2011. Sparkling wine still accounts for a very low base. The segment benefited to an
extent from some consumers trading down from Champagne, but also from rising awareness,
given that other sparkling wine is becoming increasingly available in the on-trade channel and
gains popularity amongst female consumers.
Champagne was considerably affected by the crisis. With the bulk of Champagne sales being
tied to festive occasions, the fact that the economic crisis pushes the frequency of such
occasions to a minimum, has a strong impact in sales. The target group of Champagne
drinkers in Greece is mostly affluent consumers, while some middle class consumers used to
also purchasing Champagne on a one-off basis for New Year's Eve or weddings. The latter
has now traded down to other sparkling wine.
Discounting was a key trend in 2010 in wine. Both manufacturers and retailers adopted
extensive promotions in order to gain volume sales. In line with this, the average unit price did
not increase despite the rise in VAT. The average price showed a decrease in off-trade in
2011 as a result of the increasing penetration of economy wines, migration to private label
and the booming share of discounter chain Lidl that offers a wide range of wines at prices
often below EUR3 per litre. On-trade prices remained stable given the reluctance of operators
to increase prices in context of the crisis.
The consecutive rises in special consumption tax that took place in 2010 did not affect wine,
due to lower alcohol content and the fact that wine is classified as agricultural produce and
therefore is subject to different legislation.
W I N E I N G R E E C E P a s s p o r t 2
© E u r o m o n i t o r I n t e r n a t i o n a l
The decline in tourism that took place in 2010 had an impact on sales of branded wines in the
on-trade channel as tourists are a key consumer base. Overall, the on-trade channel was
badly affected from restricted disposable incomes as Greek consumers reduced the
frequency of their nights out, yet establishments that serve mainly wine were much less
affected than bars and clubs where consumption of spirits dominates, and in this context on-
trade sales of wine were less affected compared to spirits for instance.
The off-trade channel certainly outperformed on-trade, given that although many consumers
migrated to wine from other product types as a cheaper solution for their nights out, the
frequency of nights out declined considerably resulting in overall steep declines in on-trade
consumption.
In the HoReCa channel, the key selection criterion regarding the wines which appear on the
menu is the manufacturer‟s selling price. Most entrepreneurs chase the lowest possible
wholesale price, with their priority being the highest profit margins rather than offering quality
wine to their clientele. Under this light, the penetration of unbranded wine, directly sold from
small-scale producers, is very high through on-trade. While this trend has gradually changed,
as more restaurants in urban areas are starting to pay more attention to quality, the economic
climate seems to be favouring the expansion of unbranded wine again, as well as in the off-
trade. It must be noted that unbranded wine accounts for 50% of total wine volume sales.
The most popular varieties of still white wine in Greece are Moschofilero and Asirtiko, while in
still red wine it is Ageioritiko and Xynomavro. Furthermore, Moschomavro and Roditis are two
varieties which are showing an increasing trend. As consumers become jaded with the classic
varieties, there is increasing demand for differentiated, novel varieties. The white wine
varieties Malagouzia and Savvatiano are up and coming, while Greek producers also start to
focus on differentiated varieties for exporting.
As Greece is a member of the European Union, it has to comply with pan-European
regulations for wine quality classification, which are divided into two major categories:
VQPRD, French for quality wines produced in a determined region, and table wines. The
superior category within table wines is Wines of Controlled Origin. Thus, in Greece there are
two categories of VQPRD, Wines with Appellation of Superior Quality and wines with
Appellation of Controlled Origin, which is only used for dessert wines. VQPRD wines are
small and have potential for further increase, but have not shown any important increase so
far. In 2010, the Greek Ministry of Rural Development and Food signed six agreements
(totalling EUR1.5 million) with local companies, for the promotion of VQPRD and local wine in
Canada, the US, Australia, China and Russia in 2010-2012.
New world wines continued to hold minimal share in Greek wine. The Greek consumers are
very loyal to locally-produced wine and not open to experimenting with imported products.
With the exception of Champagne, where all products are imported, almost 98% of sales of
the wine consumed in Greece come from local production. Chilean and Argentinean wines,
fall mostly under the economy range in Greece and to that end they mostly compete with no-
name products and private label, rather posing a threat to domestic manufacturers.
Cava and Prosecco still account for a fraction of sales of other sparkling wine, although Cair
SA began to invest in imports of such product types. Greeks are not yet familiar with these
products; hence large marketing investments are required in order for Cava or Prosecco to
gain momentum.
In line with cocooning trends, larger packs perform the best. In this context, there is certainly a
migration away from the 750 ml bottles to 3 or 5 litre packs. BinB also gained share in line
with its lower unit price, whereas single portions are also starting to gain popularity especially
amongst single person households.
W I N E I N G R E E C E P a s s p o r t 3
© E u r o m o n i t o r I n t e r n a t i o n a l
Wine is widely consumed in Greece by both genders and different age groups. Branded wine
mostly appeals to women and urban consumers, yet there is a strong wine culture in Greece
with very high consumption rates of artisanal wine both in urban and rural areas.
White and rosé wine are mostly consumed over the summer months, whereas red wine gains
ground in winter. Given the elongated summer season and high temperatures in the country
for the biggest part of the year, rosé and white are the most dynamic segments within still
wine.
Retsina accounts for 8% of all wine in Greece. Its penetration grew considerably over the last
two years of the review period given its lower unit price in comparison to other types of white
wine.
Restaurants witnessed the highest decline in footfall within on-trade and this had an impact on
wine sales, as wine and beer are the most widely consumed products in restaurants. Both in
restaurants and Tsipouradika, a migration from branded to unbranded wine was strongly
evidenced. A migration from high ranking restaurants to taverns was also evidenced in
context of taverns being a cheaper option for dining out and this also affected the product mix
in the category, because although high class restaurants offer more expensive wines, taverns
promote domestic economy brands mainly, with no imported wines on their menus.
The price of branded wine in restaurants is very high in comparison to unbranded, and given
that profit margins are much higher in unbranded wines, not only consumers prefer it but even
operators promote it more. In an average tavern, unbranded wine costs on average EUR6-8
per litre compared to EUR16-17 for branded. There is a high share of black market sales in
unbranded wine.
PRODUCTION, IMPORTS AND EXPORTS Due to the varied categorisation of the different wine types in Greece, production data was not
available from the National Bureau of Statistics.
Wine production in Greece increases every year and exports are becoming a key focus for
many key players, yet the bulk of wine produced in Greece is still supplied domestically.
Domestic wine continues to hold its dominant position in Greece. Imported wine however
gained share in the supermarkets to account for 2% share of total wine sales in 2011 since in
many cases its shelf-price is quite low, sometimes even lower than Greek wines.
COMPETITIVE LANDSCAPE With 10% volume share Malamatinas, E, & Sons SA was the category leader in 2011. The
company focuses primarily on Retsina which is an economy white wine type. Due to its low
price, Retsina performed well over the past few years boosting the company‟s sales.
Domestic brands continued to account for the bulk of sales in wine, yet the share of imported
wines rose in line with their lower prices. However, the major threat for manufacturers comes
from unbranded wines rather than imported products.
Both in the off and on-trade channel the share of unbranded wine increased as consumers
started to look for cheaper products. Although in previous years, branded wines performed
very well, this was not the case in 2010, where consumers especially in the on-trade opted for
artisanal products that were sold at considerably lower prices. With the penetration of black
market sales being very high when it comes to artisanal wine, the impact on wine was very
severe.
W I N E I N G R E E C E P a s s p o r t 4
© E u r o m o n i t o r I n t e r n a t i o n a l
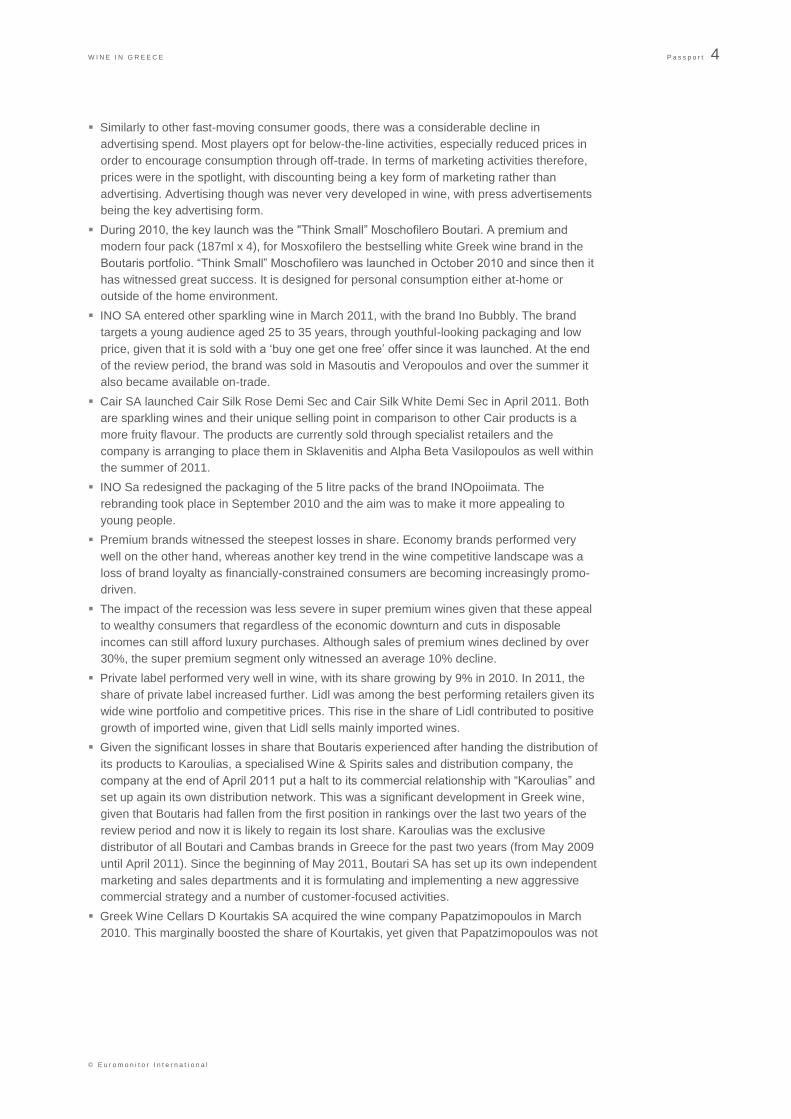
Similarly to other fast-moving consumer goods, there was a considerable decline in
advertising spend. Most players opt for below-the-line activities, especially reduced prices in
order to encourage consumption through off-trade. In terms of marketing activities therefore,
prices were in the spotlight, with discounting being a key form of marketing rather than
advertising. Advertising though was never very developed in wine, with press advertisements
being the key advertising form.
During 2010, the key launch was the "Think Small” Moschofilero Boutari. A premium and
modern four pack (187ml x 4), for Mosxofilero the bestselling white Greek wine brand in the
Boutaris portfolio. “Think Small” Moschofilero was launched in October 2010 and since then it
has witnessed great success. It is designed for personal consumption either at-home or
outside of the home environment.
INO SA entered other sparkling wine in March 2011, with the brand Ino Bubbly. The brand
targets a young audience aged 25 to 35 years, through youthful-looking packaging and low
price, given that it is sold with a „buy one get one free‟ offer since it was launched. At the end
of the review period, the brand was sold in Masoutis and Veropoulos and over the summer it
also became available on-trade.
Cair SA launched Cair Silk Rose Demi Sec and Cair Silk White Demi Sec in April 2011. Both
are sparkling wines and their unique selling point in comparison to other Cair products is a
more fruity flavour. The products are currently sold through specialist retailers and the
company is arranging to place them in Sklavenitis and Alpha Beta Vasilopoulos as well within
the summer of 2011.
INO Sa redesigned the packaging of the 5 litre packs of the brand INOpoiimata. The
rebranding took place in September 2010 and the aim was to make it more appealing to
young people.
Premium brands witnessed the steepest losses in share. Economy brands performed very
well on the other hand, whereas another key trend in the wine competitive landscape was a
loss of brand loyalty as financially-constrained consumers are becoming increasingly promo-
driven.
The impact of the recession was less severe in super premium wines given that these appeal
to wealthy consumers that regardless of the economic downturn and cuts in disposable
incomes can still afford luxury purchases. Although sales of premium wines declined by over
30%, the super premium segment only witnessed an average 10% decline.
Private label performed very well in wine, with its share growing by 9% in 2010. In 2011, the
share of private label increased further. Lidl was among the best performing retailers given its
wide wine portfolio and competitive prices. This rise in the share of Lidl contributed to positive
growth of imported wine, given that Lidl sells mainly imported wines.
Given the significant losses in share that Boutaris experienced after handing the distribution of
its products to Karoulias, a specialised Wine & Spirits sales and distribution company, the
company at the end of April 2011 put a halt to its commercial relationship with “Karoulias” and
set up again its own distribution network. This was a significant development in Greek wine,
given that Boutaris had fallen from the first position in rankings over the last two years of the
review period and now it is likely to regain its lost share. Karoulias was the exclusive
distributor of all Boutari and Cambas brands in Greece for the past two years (from May 2009
until April 2011). Since the beginning of May 2011, Boutari SA has set up its own independent
marketing and sales departments and it is formulating and implementing a new aggressive
commercial strategy and a number of customer-focused activities.
Greek Wine Cellars D Kourtakis SA acquired the wine company Papatzimopoulos in March
2010. This marginally boosted the share of Kourtakis, yet given that Papatzimopoulos was not
W I N E I N G R E E C E P a s s p o r t 5
© E u r o m o n i t o r I n t e r n a t i o n a l
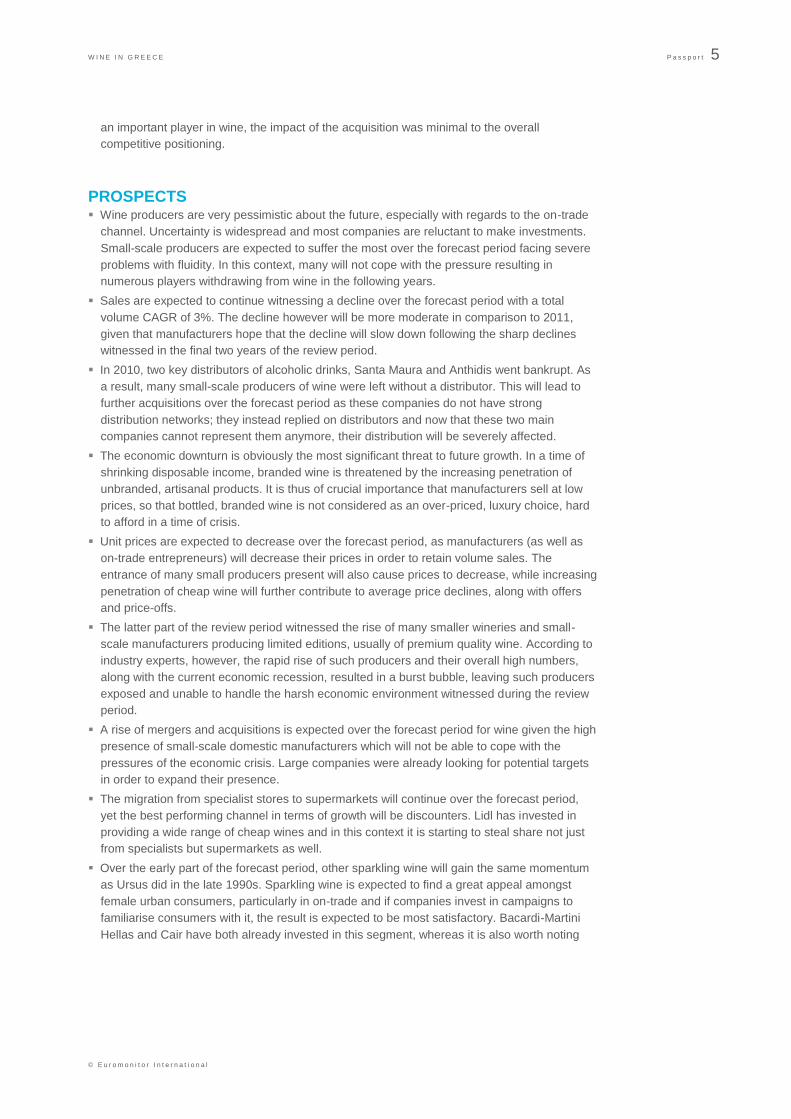
an important player in wine, the impact of the acquisition was minimal to the overall
competitive positioning.
PROSPECTS Wine producers are very pessimistic about the future, especially with regards to the on-trade
channel. Uncertainty is widespread and most companies are reluctant to make investments.
Small-scale producers are expected to suffer the most over the forecast period facing severe
problems with fluidity. In this context, many will not cope with the pressure resulting in
numerous players withdrawing from wine in the following years.
Sales are expected to continue witnessing a decline over the forecast period with a total
volume CAGR of 3%. The decline however will be more moderate in comparison to 2011,
given that manufacturers hope that the decline will slow down following the sharp declines
witnessed in the final two years of the review period.
In 2010, two key distributors of alcoholic drinks, Santa Maura and Anthidis went bankrupt. As
a result, many small-scale producers of wine were left without a distributor. This will lead to
further acquisitions over the forecast period as these companies do not have strong
distribution networks; they instead replied on distributors and now that these two main
companies cannot represent them anymore, their distribution will be severely affected.
The economic downturn is obviously the most significant threat to future growth. In a time of
shrinking disposable income, branded wine is threatened by the increasing penetration of
unbranded, artisanal products. It is thus of crucial importance that manufacturers sell at low
prices, so that bottled, branded wine is not considered as an over-priced, luxury choice, hard
to afford in a time of crisis.
Unit prices are expected to decrease over the forecast period, as manufacturers (as well as
on-trade entrepreneurs) will decrease their prices in order to retain volume sales. The
entrance of many small producers present will also cause prices to decrease, while increasing
penetration of cheap wine will further contribute to average price declines, along with offers
and price-offs.
The latter part of the review period witnessed the rise of many smaller wineries and small-
scale manufacturers producing limited editions, usually of premium quality wine. According to
industry experts, however, the rapid rise of such producers and their overall high numbers,
along with the current economic recession, resulted in a burst bubble, leaving such producers
exposed and unable to handle the harsh economic environment witnessed during the review
period.
A rise of mergers and acquisitions is expected over the forecast period for wine given the high
presence of small-scale domestic manufacturers which will not be able to cope with the
pressures of the economic crisis. Large companies were already looking for potential targets
in order to expand their presence.
The migration from specialist stores to supermarkets will continue over the forecast period,
yet the best performing channel in terms of growth will be discounters. Lidl has invested in
providing a wide range of cheap wines and in this context it is starting to steal share not just
from specialists but supermarkets as well.
Over the early part of the forecast period, other sparkling wine will gain the same momentum
as Ursus did in the late 1990s. Sparkling wine is expected to find a great appeal amongst
female urban consumers, particularly in on-trade and if companies invest in campaigns to
familiarise consumers with it, the result is expected to be most satisfactory. Bacardi-Martini
Hellas and Cair have both already invested in this segment, whereas it is also worth noting
W I N E I N G R E E C E P a s s p o r t 6
© E u r o m o n i t o r I n t e r n a t i o n a l
that the wine‟s presence in supermarkets is also increasing substantially with ever more shelf-
space allocated to sparkling wines.
Boutaris‟ single portion of Moschofilero will perform well in line with cocooning trends and will
find great appeal amongst single person households. The product provides an economy
solution for those who want to have a glass of wine but not spend much. More manufacturers
are expected to follow Boutaris‟ example and introduce single portions in supermarkets.
Ino Bubbly is expected to perform well given the overall trend for other sparkling wine, the
„buy one get one free‟ promotion that makes the product affordable to a wider consumer base
and its youthful positioning. Unlike Cair which targets an older consumer base, Ino is trying to
reach the younger generation.
Increasing numbers of companies will try to focus on their exporting activities in order to
balance domestic losses. Germany and Australia are the most prominent targets given the
high presence of Greek migrants and the UK is also slowly rising to top of the agenda in line
with high presence of expatriates.
CATEGORY DATA
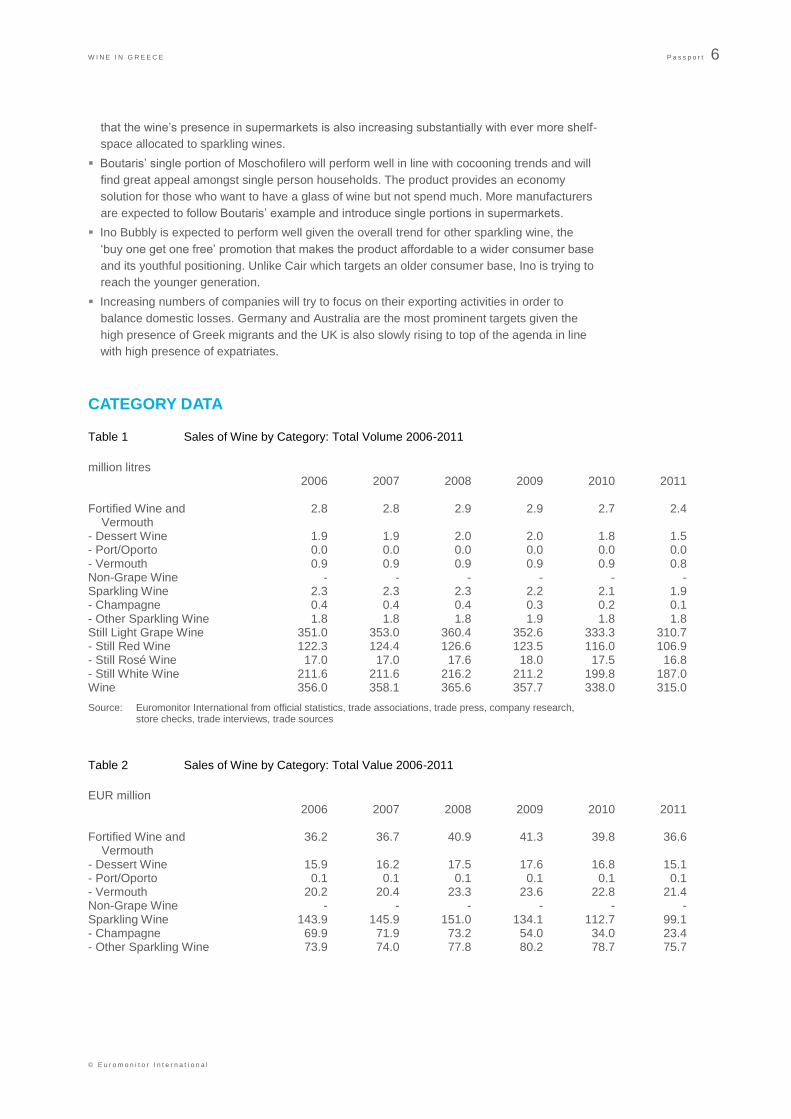
Table 1 Sales of Wine by Category: Total Volume 2006-2011
million litres 2006 2007 2008 2009 2010 2011 Fortified Wine and 2.8 2.8 2.9 2.9 2.7 2.4 Vermouth - Dessert Wine 1.9 1.9 2.0 2.0 1.8 1.5 - Port/Oporto 0.0 0.0 0.0 0.0 0.0 0.0 - Vermouth 0.9 0.9 0.9 0.9 0.9 0.8 Non-Grape Wine - - - - - - Sparkling Wine 2.3 2.3 2.3 2.2 2.1 1.9 - Champagne 0.4 0.4 0.4 0.3 0.2 0.1 - Other Sparkling Wine 1.8 1.8 1.8 1.9 1.8 1.8 Still Light Grape Wine 351.0 353.0 360.4 352.6 333.3 310.7 - Still Red Wine 122.3 124.4 126.6 123.5 116.0 106.9 - Still Rosé Wine 17.0 17.0 17.6 18.0 17.5 16.8 - Still White Wine 211.6 211.6 216.2 211.2 199.8 187.0 Wine 356.0 358.1 365.6 357.7 338.0 315.0
Source: Euromonitor International from official statistics, trade associations, trade press, company research, store checks, trade interviews, trade sources
Table 2 Sales of Wine by Category: Total Value 2006-2011
EUR million 2006 2007 2008 2009 2010 2011 Fortified Wine and 36.2 36.7 40.9 41.3 39.8 36.6 Vermouth - Dessert Wine 15.9 16.2 17.5 17.6 16.8 15.1 - Port/Oporto 0.1 0.1 0.1 0.1 0.1 0.1 - Vermouth 20.2 20.4 23.3 23.6 22.8 21.4 Non-Grape Wine - - - - - - Sparkling Wine 143.9 145.9 151.0 134.1 112.7 99.1 - Champagne 69.9 71.9 73.2 54.0 34.0 23.4 - Other Sparkling Wine 73.9 74.0 77.8 80.2 78.7 75.7
W I N E I N G R E E C E P a s s p o r t 7
© E u r o m o n i t o r I n t e r n a t i o n a l
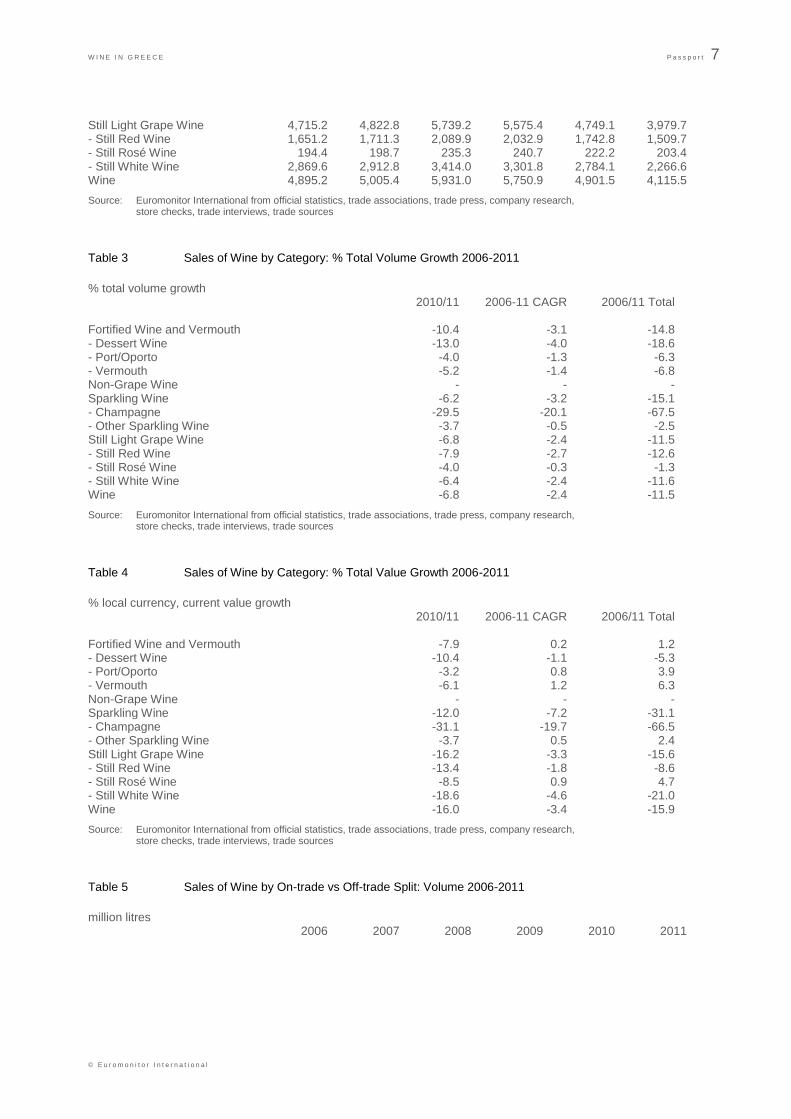
Still Light Grape Wine 4,715.2 4,822.8 5,739.2 5,575.4 4,749.1 3,979.7 - Still Red Wine 1,651.2 1,711.3 2,089.9 2,032.9 1,742.8 1,509.7 - Still Rosé Wine 194.4 198.7 235.3 240.7 222.2 203.4 - Still White Wine 2,869.6 2,912.8 3,414.0 3,301.8 2,784.1 2,266.6 Wine 4,895.2 5,005.4 5,931.0 5,750.9 4,901.5 4,115.5
Source: Euromonitor International from official statistics, trade associations, trade press, company research, store checks, trade interviews, trade sources
Table 3 Sales of Wine by Category: % Total Volume Growth 2006-2011
% total volume growth 2010/11 2006-11 CAGR 2006/11 Total Fortified Wine and Vermouth -10.4 -3.1 -14.8 - Dessert Wine -13.0 -4.0 -18.6 - Port/Oporto -4.0 -1.3 -6.3 - Vermouth -5.2 -1.4 -6.8 Non-Grape Wine - - - Sparkling Wine -6.2 -3.2 -15.1 - Champagne -29.5 -20.1 -67.5 - Other Sparkling Wine -3.7 -0.5 -2.5 Still Light Grape Wine -6.8 -2.4 -11.5 - Still Red Wine -7.9 -2.7 -12.6 - Still Rosé Wine -4.0 -0.3 -1.3 - Still White Wine -6.4 -2.4 -11.6 Wine -6.8 -2.4 -11.5
Source: Euromonitor International from official statistics, trade associations, trade press, company research, store checks, trade interviews, trade sources
Table 4 Sales of Wine by Category: % Total Value Growth 2006-2011
% local currency, current value growth 2010/11 2006-11 CAGR 2006/11 Total Fortified Wine and Vermouth -7.9 0.2 1.2 - Dessert Wine -10.4 -1.1 -5.3 - Port/Oporto -3.2 0.8 3.9 - Vermouth -6.1 1.2 6.3 Non-Grape Wine - - - Sparkling Wine -12.0 -7.2 -31.1 - Champagne -31.1 -19.7 -66.5 - Other Sparkling Wine -3.7 0.5 2.4 Still Light Grape Wine -16.2 -3.3 -15.6 - Still Red Wine -13.4 -1.8 -8.6 - Still Rosé Wine -8.5 0.9 4.7 - Still White Wine -18.6 -4.6 -21.0 Wine -16.0 -3.4 -15.9
Source: Euromonitor International from official statistics, trade associations, trade press, company research, store checks, trade interviews, trade sources
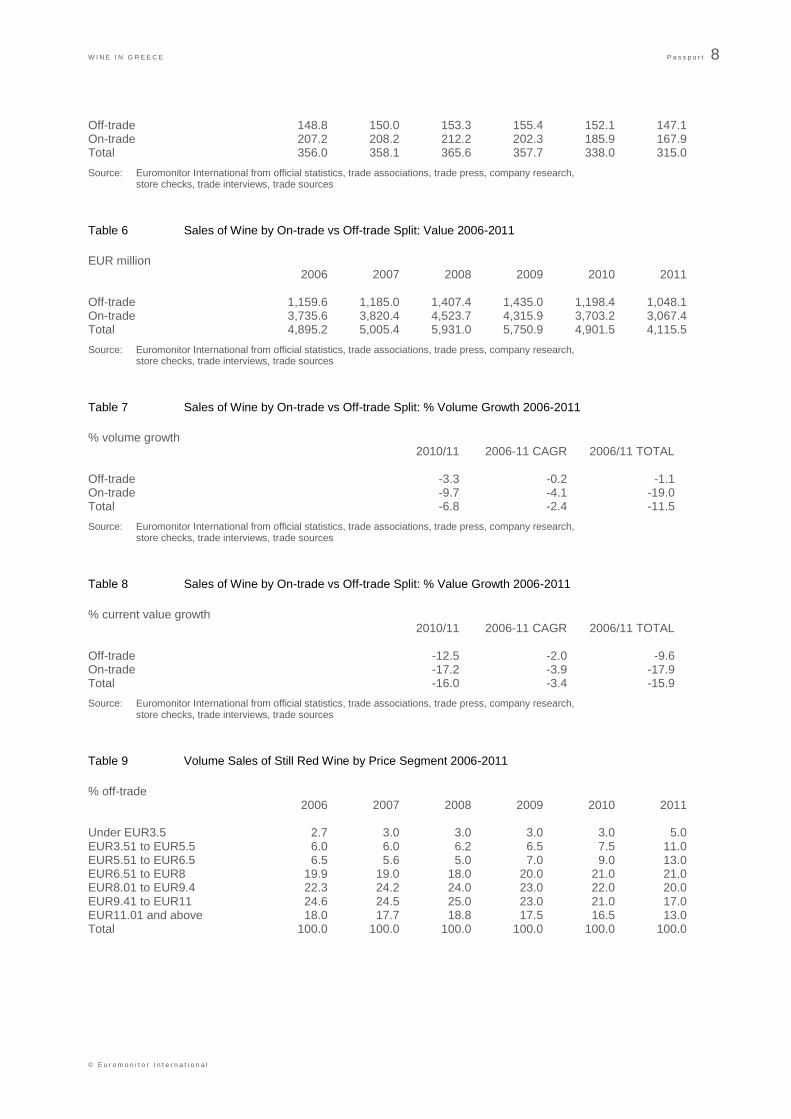
Table 5 Sales of Wine by On-trade vs Off-trade Split: Volume 2006-2011
million litres 2006 2007 2008 2009 2010 2011
W I N E I N G R E E C E P a s s p o r t 8
© E u r o m o n i t o r I n t e r n a t i o n a l
Off-trade 148.8 150.0 153.3 155.4 152.1 147.1 On-trade 207.2 208.2 212.2 202.3 185.9 167.9 Total 356.0 358.1 365.6 357.7 338.0 315.0
Source: Euromonitor International from official statistics, trade associations, trade press, company research, store checks, trade interviews, trade sources
Table 6 Sales of Wine by On-trade vs Off-trade Split: Value 2006-2011
EUR million 2006 2007 2008 2009 2010 2011 Off-trade 1,159.6 1,185.0 1,407.4 1,435.0 1,198.4 1,048.1 On-trade 3,735.6 3,820.4 4,523.7 4,315.9 3,703.2 3,067.4 Total 4,895.2 5,005.4 5,931.0 5,750.9 4,901.5 4,115.5
Source: Euromonitor International from official statistics, trade associations, trade press, company research, store checks, trade interviews, trade sources
Table 7 Sales of Wine by On-trade vs Off-trade Split: % Volume Growth 2006-2011
% volume growth 2010/11 2006-11 CAGR 2006/11 TOTAL Off-trade -3.3 -0.2 -1.1 On-trade -9.7 -4.1 -19.0 Total -6.8 -2.4 -11.5
Source: Euromonitor International from official statistics, trade associations, trade press, company research, store checks, trade interviews, trade sources
Table 8 Sales of Wine by On-trade vs Off-trade Split: % Value Growth 2006-2011
% current value growth 2010/11 2006-11 CAGR 2006/11 TOTAL Off-trade -12.5 -2.0 -9.6 On-trade -17.2 -3.9 -17.9 Total -16.0 -3.4 -15.9
Source: Euromonitor International from official statistics, trade associations, trade press, company research, store checks, trade interviews, trade sources
Table 9 Volume Sales of Still Red Wine by Price Segment 2006-2011
% off-trade 2006 2007 2008 2009 2010 2011 Under EUR3.5 2.7 3.0 3.0 3.0 3.0 5.0 EUR3.51 to EUR5.5 6.0 6.0 6.2 6.5 7.5 11.0 EUR5.51 to EUR6.5 6.5 5.6 5.0 7.0 9.0 13.0 EUR6.51 to EUR8 19.9 19.0 18.0 20.0 21.0 21.0 EUR8.01 to EUR9.4 22.3 24.2 24.0 23.0 22.0 20.0 EUR9.41 to EUR11 24.6 24.5 25.0 23.0 21.0 17.0 EUR11.01 and above 18.0 17.7 18.8 17.5 16.5 13.0 Total 100.0 100.0 100.0 100.0 100.0 100.0
W I N E I N G R E E C E P a s s p o r t 9
© E u r o m o n i t o r I n t e r n a t i o n a l
Source: Euromonitor International from official statistics, trade associations, trade press, company research, store checks, trade interviews, trade sources
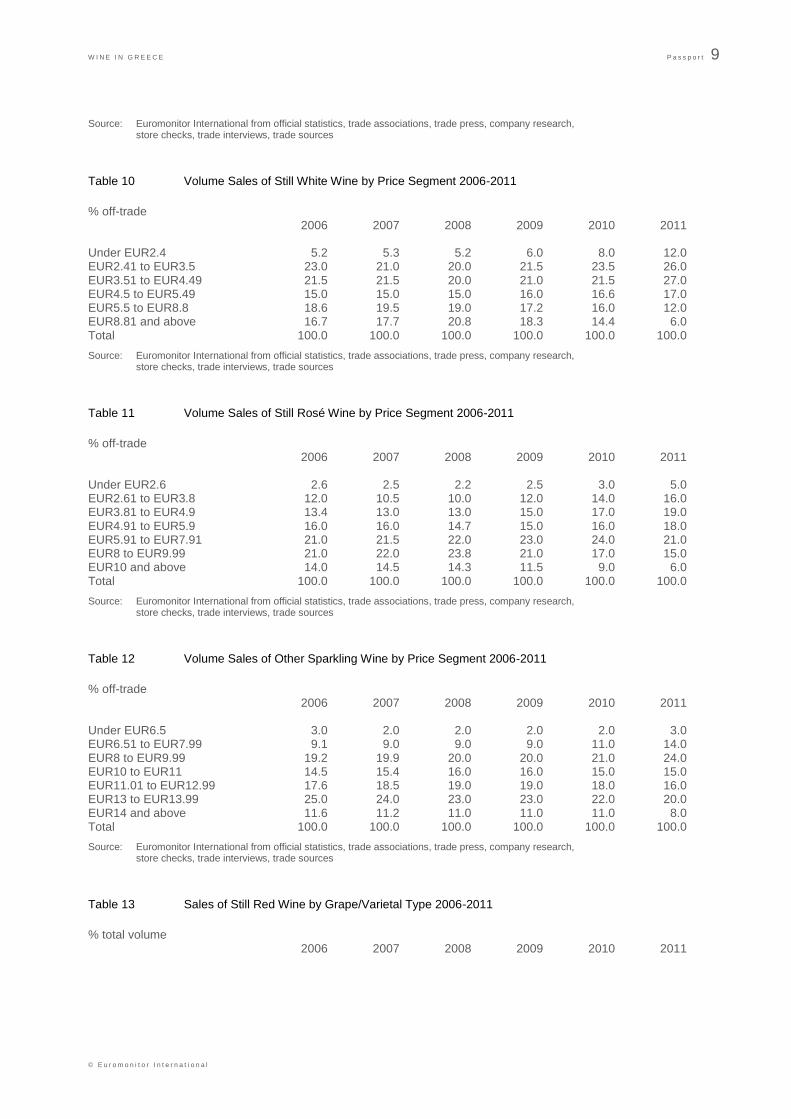
Table 10 Volume Sales of Still White Wine by Price Segment 2006-2011
% off-trade 2006 2007 2008 2009 2010 2011 Under EUR2.4 5.2 5.3 5.2 6.0 8.0 12.0 EUR2.41 to EUR3.5 23.0 21.0 20.0 21.5 23.5 26.0 EUR3.51 to EUR4.49 21.5 21.5 20.0 21.0 21.5 27.0 EUR4.5 to EUR5.49 15.0 15.0 15.0 16.0 16.6 17.0 EUR5.5 to EUR8.8 18.6 19.5 19.0 17.2 16.0 12.0 EUR8.81 and above 16.7 17.7 20.8 18.3 14.4 6.0 Total 100.0 100.0 100.0 100.0 100.0 100.0
Source: Euromonitor International from official statistics, trade associations, trade press, company research, store checks, trade interviews, trade sources
Table 11 Volume Sales of Still Rosé Wine by Price Segment 2006-2011
% off-trade 2006 2007 2008 2009 2010 2011 Under EUR2.6 2.6 2.5 2.2 2.5 3.0 5.0 EUR2.61 to EUR3.8 12.0 10.5 10.0 12.0 14.0 16.0 EUR3.81 to EUR4.9 13.4 13.0 13.0 15.0 17.0 19.0 EUR4.91 to EUR5.9 16.0 16.0 14.7 15.0 16.0 18.0 EUR5.91 to EUR7.91 21.0 21.5 22.0 23.0 24.0 21.0 EUR8 to EUR9.99 21.0 22.0 23.8 21.0 17.0 15.0 EUR10 and above 14.0 14.5 14.3 11.5 9.0 6.0 Total 100.0 100.0 100.0 100.0 100.0 100.0
Source: Euromonitor International from official statistics, trade associations, trade press, company research, store checks, trade interviews, trade sources
Table 12 Volume Sales of Other Sparkling Wine by Price Segment 2006-2011
% off-trade 2006 2007 2008 2009 2010 2011 Under EUR6.5 3.0 2.0 2.0 2.0 2.0 3.0 EUR6.51 to EUR7.99 9.1 9.0 9.0 9.0 11.0 14.0 EUR8 to EUR9.99 19.2 19.9 20.0 20.0 21.0 24.0 EUR10 to EUR11 14.5 15.4 16.0 16.0 15.0 15.0 EUR11.01 to EUR12.99 17.6 18.5 19.0 19.0 18.0 16.0 EUR13 to EUR13.99 25.0 24.0 23.0 23.0 22.0 20.0 EUR14 and above 11.6 11.2 11.0 11.0 11.0 8.0 Total 100.0 100.0 100.0 100.0 100.0 100.0
Source: Euromonitor International from official statistics, trade associations, trade press, company research, store checks, trade interviews, trade sources
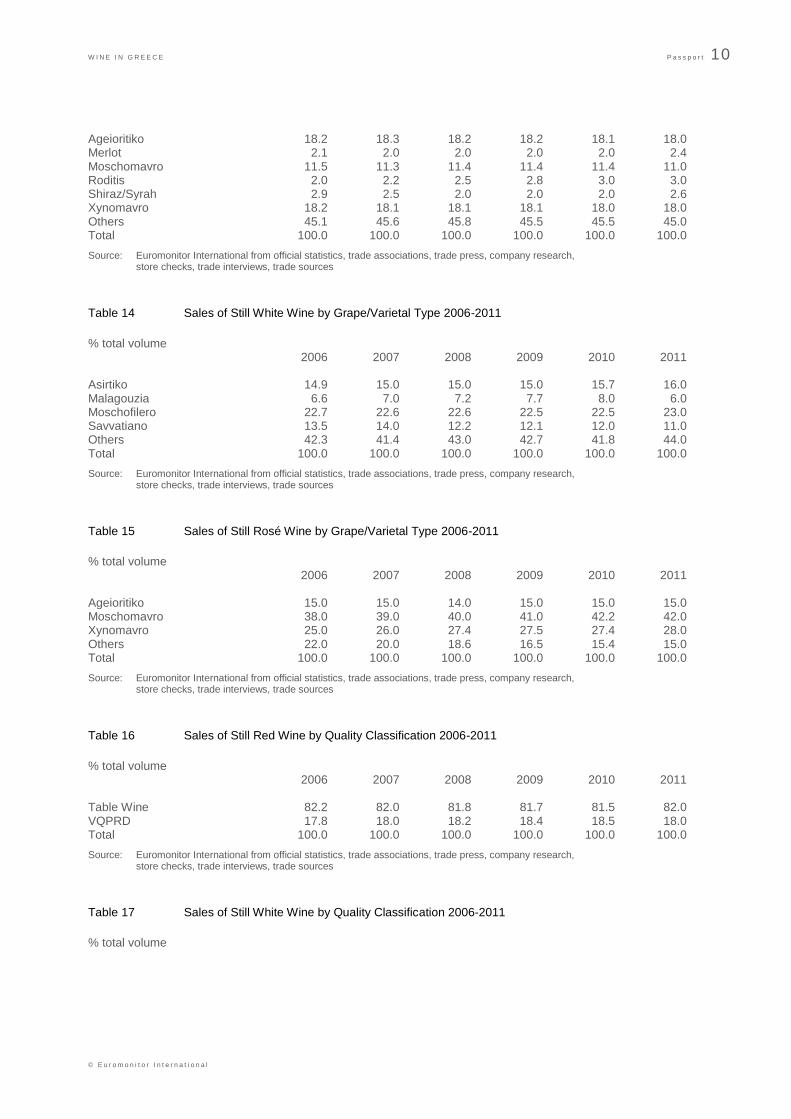
Table 13 Sales of Still Red Wine by Grape/Varietal Type 2006-2011
% total volume 2006 2007 2008 2009 2010 2011
W I N E I N G R E E C E P a s s p o r t 10
© E u r o m o n i t o r I n t e r n a t i o n a l
Ageioritiko 18.2 18.3 18.2 18.2 18.1 18.0 Merlot 2.1 2.0 2.0 2.0 2.0 2.4 Moschomavro 11.5 11.3 11.4 11.4 11.4 11.0 Roditis 2.0 2.2 2.5 2.8 3.0 3.0 Shiraz/Syrah 2.9 2.5 2.0 2.0 2.0 2.6 Xynomavro 18.2 18.1 18.1 18.1 18.0 18.0 Others 45.1 45.6 45.8 45.5 45.5 45.0 Total 100.0 100.0 100.0 100.0 100.0 100.0
Source: Euromonitor International from official statistics, trade associations, trade press, company research, store checks, trade interviews, trade sources
Table 14 Sales of Still White Wine by Grape/Varietal Type 2006-2011
% total volume 2006 2007 2008 2009 2010 2011 Asirtiko 14.9 15.0 15.0 15.0 15.7 16.0 Malagouzia 6.6 7.0 7.2 7.7 8.0 6.0 Moschofilero 22.7 22.6 22.6 22.5 22.5 23.0 Savvatiano 13.5 14.0 12.2 12.1 12.0 11.0 Others 42.3 41.4 43.0 42.7 41.8 44.0 Total 100.0 100.0 100.0 100.0 100.0 100.0
Source: Euromonitor International from official statistics, trade associations, trade press, company research, store checks, trade interviews, trade sources
Table 15 Sales of Still Rosé Wine by Grape/Varietal Type 2006-2011
% total volume 2006 2007 2008 2009 2010 2011 Ageioritiko 15.0 15.0 14.0 15.0 15.0 15.0 Moschomavro 38.0 39.0 40.0 41.0 42.2 42.0 Xynomavro 25.0 26.0 27.4 27.5 27.4 28.0 Others 22.0 20.0 18.6 16.5 15.4 15.0 Total 100.0 100.0 100.0 100.0 100.0 100.0
Source: Euromonitor International from official statistics, trade associations, trade press, company research, store checks, trade interviews, trade sources
Table 16 Sales of Still Red Wine by Quality Classification 2006-2011
% total volume 2006 2007 2008 2009 2010 2011 Table Wine 82.2 82.0 81.8 81.7 81.5 82.0 VQPRD 17.8 18.0 18.2 18.4 18.5 18.0 Total 100.0 100.0 100.0 100.0 100.0 100.0
Source: Euromonitor International from official statistics, trade associations, trade press, company research, store checks, trade interviews, trade sources
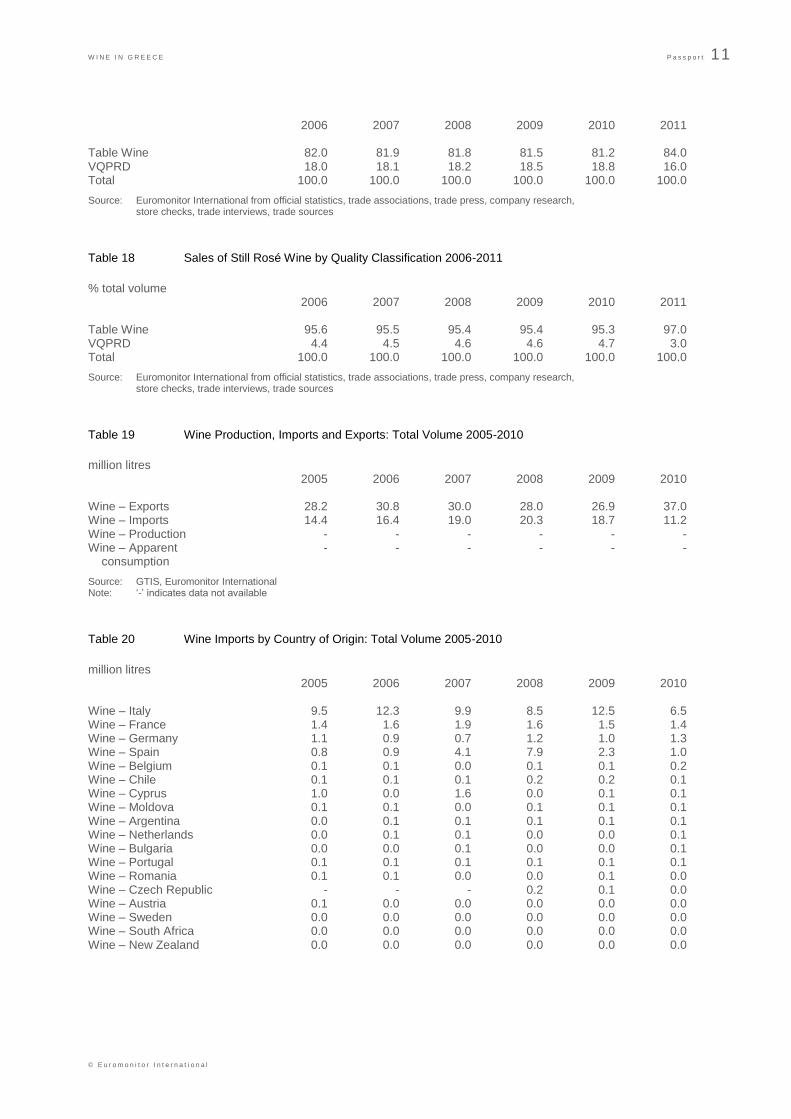
Table 17 Sales of Still White Wine by Quality Classification 2006-2011
% total volume
W I N E I N G R E E C E P a s s p o r t 11
© E u r o m o n i t o r I n t e r n a t i o n a l
2006 2007 2008 2009 2010 2011 Table Wine 82.0 81.9 81.8 81.5 81.2 84.0 VQPRD 18.0 18.1 18.2 18.5 18.8 16.0 Total 100.0 100.0 100.0 100.0 100.0 100.0
Source: Euromonitor International from official statistics, trade associations, trade press, company research, store checks, trade interviews, trade sources
Table 18 Sales of Still Rosé Wine by Quality Classification 2006-2011
% total volume 2006 2007 2008 2009 2010 2011 Table Wine 95.6 95.5 95.4 95.4 95.3 97.0 VQPRD 4.4 4.5 4.6 4.6 4.7 3.0 Total 100.0 100.0 100.0 100.0 100.0 100.0
Source: Euromonitor International from official statistics, trade associations, trade press, company research, store checks, trade interviews, trade sources
Table 19 Wine Production, Imports and Exports: Total Volume 2005-2010
million litres 2005 2006 2007 2008 2009 2010 Wine – Exports 28.2 30.8 30.0 28.0 26.9 37.0 Wine – Imports 14.4 16.4 19.0 20.3 18.7 11.2 Wine – Production - - - - - - Wine – Apparent - - - - - - consumption
Source: GTIS, Euromonitor International Note: „-‟ indicates data not available
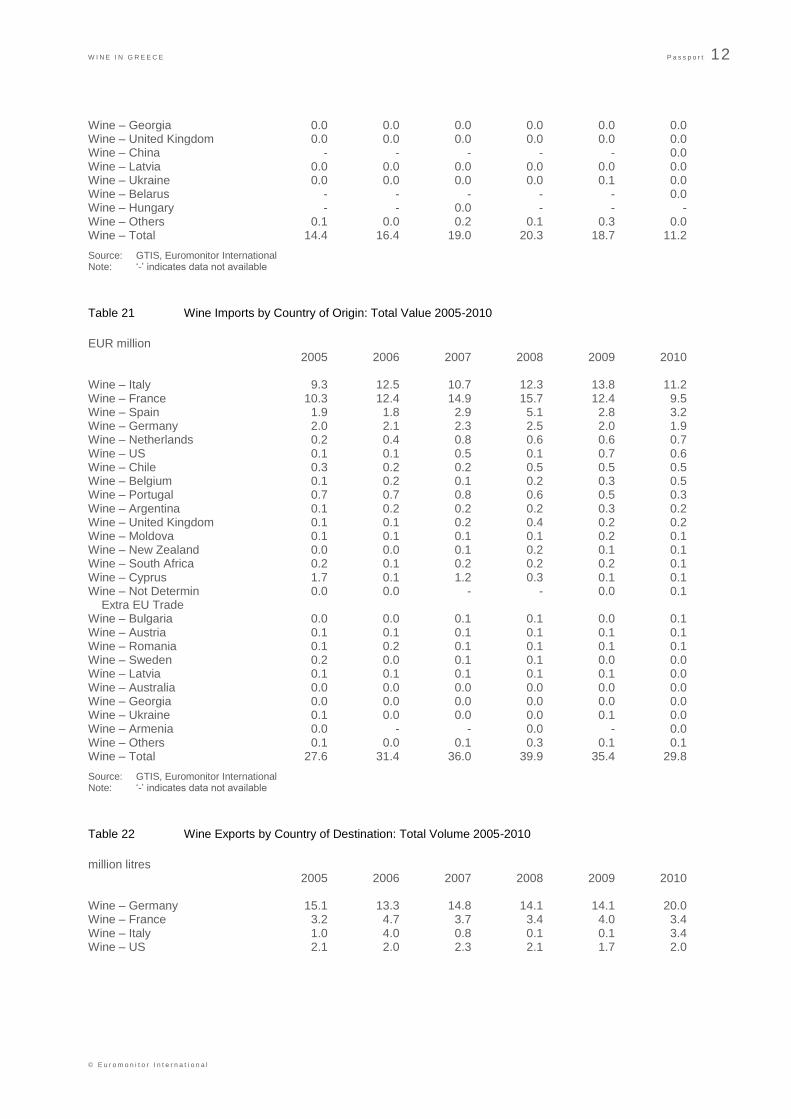
Table 20 Wine Imports by Country of Origin: Total Volume 2005-2010
million litres 2005 2006 2007 2008 2009 2010 Wine – Italy 9.5 12.3 9.9 8.5 12.5 6.5 Wine – France 1.4 1.6 1.9 1.6 1.5 1.4 Wine – Germany 1.1 0.9 0.7 1.2 1.0 1.3 Wine – Spain 0.8 0.9 4.1 7.9 2.3 1.0 Wine – Belgium 0.1 0.1 0.0 0.1 0.1 0.2 Wine – Chile 0.1 0.1 0.1 0.2 0.2 0.1 Wine – Cyprus 1.0 0.0 1.6 0.0 0.1 0.1 Wine – Moldova 0.1 0.1 0.0 0.1 0.1 0.1 Wine – Argentina 0.0 0.1 0.1 0.1 0.1 0.1 Wine – Netherlands 0.0 0.1 0.1 0.0 0.0 0.1 Wine – Bulgaria 0.0 0.0 0.1 0.0 0.0 0.1 Wine – Portugal 0.1 0.1 0.1 0.1 0.1 0.1 Wine – Romania 0.1 0.1 0.0 0.0 0.1 0.0 Wine – Czech Republic - - - 0.2 0.1 0.0 Wine – Austria 0.1 0.0 0.0 0.0 0.0 0.0 Wine – Sweden 0.0 0.0 0.0 0.0 0.0 0.0 Wine – South Africa 0.0 0.0 0.0 0.0 0.0 0.0 Wine – New Zealand 0.0 0.0 0.0 0.0 0.0 0.0
W I N E I N G R E E C E P a s s p o r t 12
© E u r o m o n i t o r I n t e r n a t i o n a l
Wine – Georgia 0.0 0.0 0.0 0.0 0.0 0.0 Wine – United Kingdom 0.0 0.0 0.0 0.0 0.0 0.0 Wine – China - - - - - 0.0 Wine – Latvia 0.0 0.0 0.0 0.0 0.0 0.0 Wine – Ukraine 0.0 0.0 0.0 0.0 0.1 0.0 Wine – Belarus - - - - - 0.0 Wine – Hungary - - 0.0 - - - Wine – Others 0.1 0.0 0.2 0.1 0.3 0.0 Wine – Total 14.4 16.4 19.0 20.3 18.7 11.2
Source: GTIS, Euromonitor International Note: „-‟ indicates data not available
Table 21 Wine Imports by Country of Origin: Total Value 2005-2010
EUR million 2005 2006 2007 2008 2009 2010 Wine – Italy 9.3 12.5 10.7 12.3 13.8 11.2 Wine – France 10.3 12.4 14.9 15.7 12.4 9.5 Wine – Spain 1.9 1.8 2.9 5.1 2.8 3.2 Wine – Germany 2.0 2.1 2.3 2.5 2.0 1.9 Wine – Netherlands 0.2 0.4 0.8 0.6 0.6 0.7 Wine – US 0.1 0.1 0.5 0.1 0.7 0.6 Wine – Chile 0.3 0.2 0.2 0.5 0.5 0.5 Wine – Belgium 0.1 0.2 0.1 0.2 0.3 0.5 Wine – Portugal 0.7 0.7 0.8 0.6 0.5 0.3 Wine – Argentina 0.1 0.2 0.2 0.2 0.3 0.2 Wine – United Kingdom 0.1 0.1 0.2 0.4 0.2 0.2 Wine – Moldova 0.1 0.1 0.1 0.1 0.2 0.1 Wine – New Zealand 0.0 0.0 0.1 0.2 0.1 0.1 Wine – South Africa 0.2 0.1 0.2 0.2 0.2 0.1 Wine – Cyprus 1.7 0.1 1.2 0.3 0.1 0.1 Wine – Not Determin 0.0 0.0 - - 0.0 0.1 Extra EU Trade Wine – Bulgaria 0.0 0.0 0.1 0.1 0.0 0.1 Wine – Austria 0.1 0.1 0.1 0.1 0.1 0.1 Wine – Romania 0.1 0.2 0.1 0.1 0.1 0.1 Wine – Sweden 0.2 0.0 0.1 0.1 0.0 0.0 Wine – Latvia 0.1 0.1 0.1 0.1 0.1 0.0 Wine – Australia 0.0 0.0 0.0 0.0 0.0 0.0 Wine – Georgia 0.0 0.0 0.0 0.0 0.0 0.0 Wine – Ukraine 0.1 0.0 0.0 0.0 0.1 0.0 Wine – Armenia 0.0 - - 0.0 - 0.0 Wine – Others 0.1 0.0 0.1 0.3 0.1 0.1 Wine – Total 27.6 31.4 36.0 39.9 35.4 29.8
Source: GTIS, Euromonitor International Note: „-‟ indicates data not available
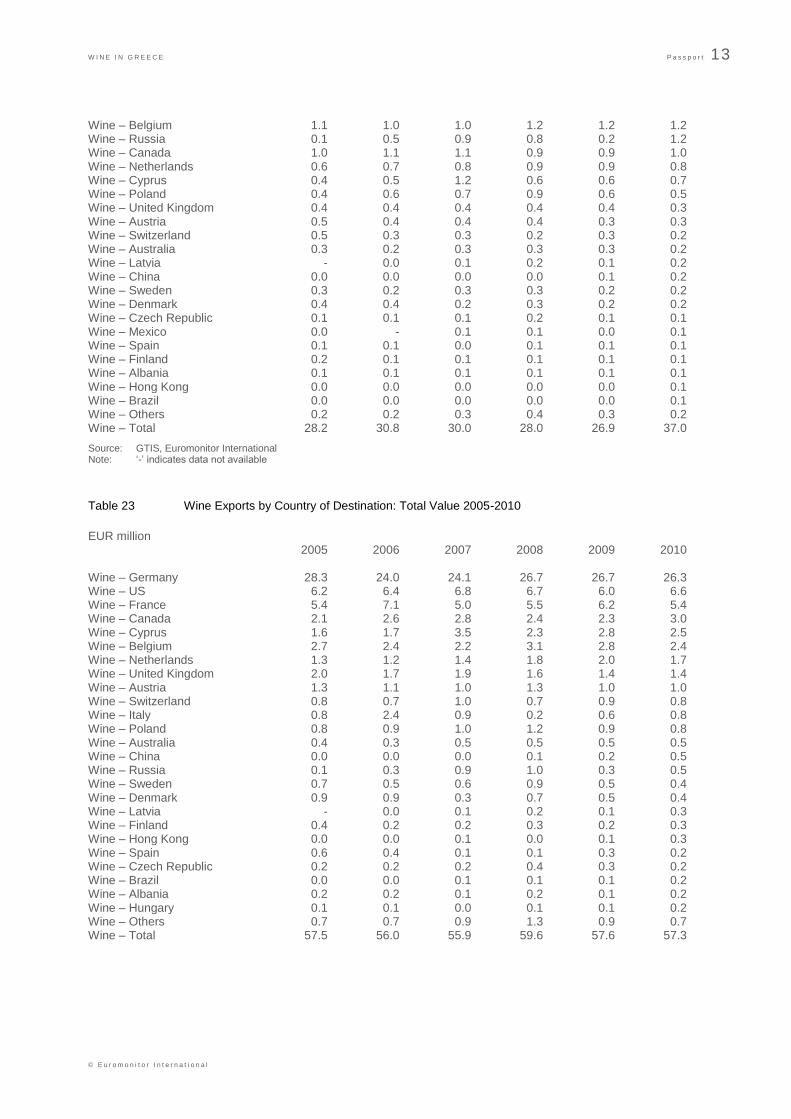
Table 22 Wine Exports by Country of Destination: Total Volume 2005-2010
million litres 2005 2006 2007 2008 2009 2010 Wine – Germany 15.1 13.3 14.8 14.1 14.1 20.0 Wine – France 3.2 4.7 3.7 3.4 4.0 3.4 Wine – Italy 1.0 4.0 0.8 0.1 0.1 3.4 Wine – US 2.1 2.0 2.3 2.1 1.7 2.0
W I N E I N G R E E C E P a s s p o r t 13
© E u r o m o n i t o r I n t e r n a t i o n a l
Wine – Belgium 1.1 1.0 1.0 1.2 1.2 1.2 Wine – Russia 0.1 0.5 0.9 0.8 0.2 1.2 Wine – Canada 1.0 1.1 1.1 0.9 0.9 1.0 Wine – Netherlands 0.6 0.7 0.8 0.9 0.9 0.8 Wine – Cyprus 0.4 0.5 1.2 0.6 0.6 0.7 Wine – Poland 0.4 0.6 0.7 0.9 0.6 0.5 Wine – United Kingdom 0.4 0.4 0.4 0.4 0.4 0.3 Wine – Austria 0.5 0.4 0.4 0.4 0.3 0.3 Wine – Switzerland 0.5 0.3 0.3 0.2 0.3 0.2 Wine – Australia 0.3 0.2 0.3 0.3 0.3 0.2 Wine – Latvia - 0.0 0.1 0.2 0.1 0.2 Wine – China 0.0 0.0 0.0 0.0 0.1 0.2 Wine – Sweden 0.3 0.2 0.3 0.3 0.2 0.2 Wine – Denmark 0.4 0.4 0.2 0.3 0.2 0.2 Wine – Czech Republic 0.1 0.1 0.1 0.2 0.1 0.1 Wine – Mexico 0.0 - 0.1 0.1 0.0 0.1 Wine – Spain 0.1 0.1 0.0 0.1 0.1 0.1 Wine – Finland 0.2 0.1 0.1 0.1 0.1 0.1 Wine – Albania 0.1 0.1 0.1 0.1 0.1 0.1 Wine – Hong Kong 0.0 0.0 0.0 0.0 0.0 0.1 Wine – Brazil 0.0 0.0 0.0 0.0 0.0 0.1 Wine – Others 0.2 0.2 0.3 0.4 0.3 0.2 Wine – Total 28.2 30.8 30.0 28.0 26.9 37.0
Source: GTIS, Euromonitor International Note: „-‟ indicates data not available
Table 23 Wine Exports by Country of Destination: Total Value 2005-2010
EUR million 2005 2006 2007 2008 2009 2010 Wine – Germany 28.3 24.0 24.1 26.7 26.7 26.3 Wine – US 6.2 6.4 6.8 6.7 6.0 6.6 Wine – France 5.4 7.1 5.0 5.5 6.2 5.4 Wine – Canada 2.1 2.6 2.8 2.4 2.3 3.0 Wine – Cyprus 1.6 1.7 3.5 2.3 2.8 2.5 Wine – Belgium 2.7 2.4 2.2 3.1 2.8 2.4 Wine – Netherlands 1.3 1.2 1.4 1.8 2.0 1.7 Wine – United Kingdom 2.0 1.7 1.9 1.6 1.4 1.4 Wine – Austria 1.3 1.1 1.0 1.3 1.0 1.0 Wine – Switzerland 0.8 0.7 1.0 0.7 0.9 0.8 Wine – Italy 0.8 2.4 0.9 0.2 0.6 0.8 Wine – Poland 0.8 0.9 1.0 1.2 0.9 0.8 Wine – Australia 0.4 0.3 0.5 0.5 0.5 0.5 Wine – China 0.0 0.0 0.0 0.1 0.2 0.5 Wine – Russia 0.1 0.3 0.9 1.0 0.3 0.5 Wine – Sweden 0.7 0.5 0.6 0.9 0.5 0.4 Wine – Denmark 0.9 0.9 0.3 0.7 0.5 0.4 Wine – Latvia - 0.0 0.1 0.2 0.1 0.3 Wine – Finland 0.4 0.2 0.2 0.3 0.2 0.3 Wine – Hong Kong 0.0 0.0 0.1 0.0 0.1 0.3 Wine – Spain 0.6 0.4 0.1 0.1 0.3 0.2 Wine – Czech Republic 0.2 0.2 0.2 0.4 0.3 0.2 Wine – Brazil 0.0 0.0 0.1 0.1 0.1 0.2 Wine – Albania 0.2 0.2 0.1 0.2 0.1 0.2 Wine – Hungary 0.1 0.1 0.0 0.1 0.1 0.2 Wine – Others 0.7 0.7 0.9 1.3 0.9 0.7 Wine – Total 57.5 56.0 55.9 59.6 57.6 57.3
W I N E I N G R E E C E P a s s p o r t 14
© E u r o m o n i t o r I n t e r n a t i o n a l
Source: GTIS, Euromonitor International Note: „-‟ indicates data not available
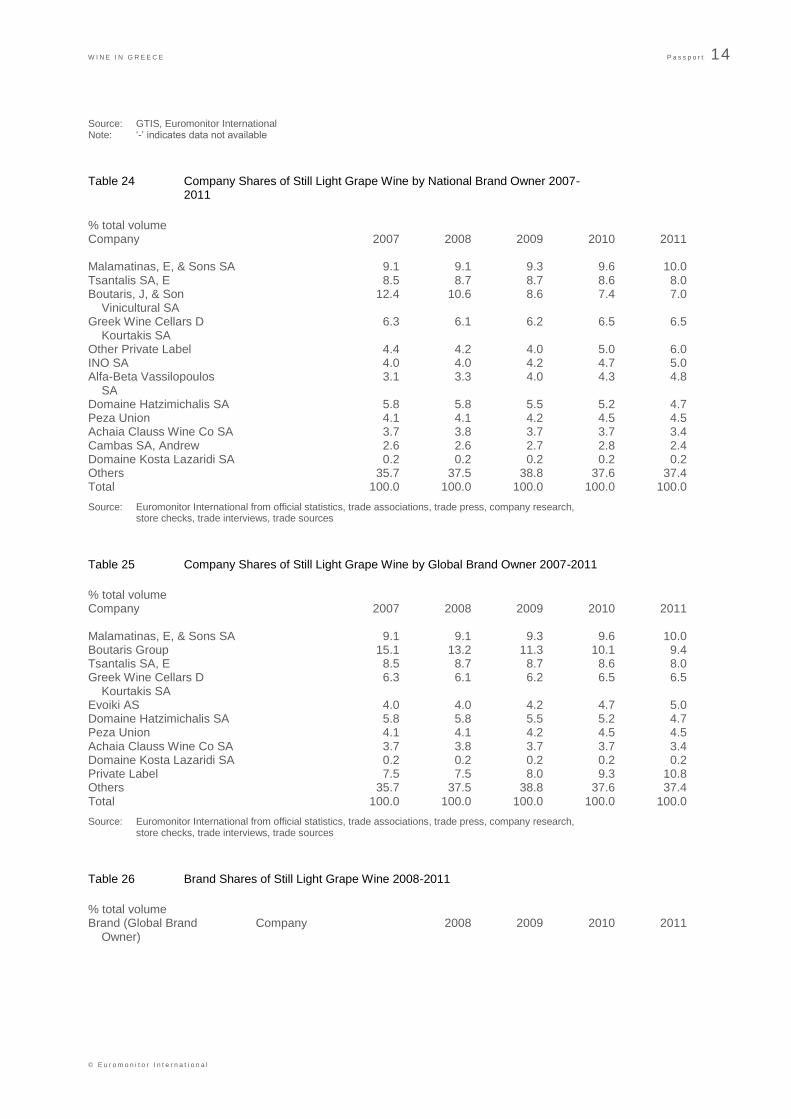
Table 24 Company Shares of Still Light Grape Wine by National Brand Owner 2007-2011
% total volume Company 2007 2008 2009 2010 2011 Malamatinas, E, & Sons SA 9.1 9.1 9.3 9.6 10.0 Tsantalis SA, E 8.5 8.7 8.7 8.6 8.0 Boutaris, J, & Son 12.4 10.6 8.6 7.4 7.0 Vinicultural SA Greek Wine Cellars D 6.3 6.1 6.2 6.5 6.5 Kourtakis SA Other Private Label 4.4 4.2 4.0 5.0 6.0 INO SA 4.0 4.0 4.2 4.7 5.0 Alfa-Beta Vassilopoulos 3.1 3.3 4.0 4.3 4.8 SA Domaine Hatzimichalis SA 5.8 5.8 5.5 5.2 4.7 Peza Union 4.1 4.1 4.2 4.5 4.5 Achaia Clauss Wine Co SA 3.7 3.8 3.7 3.7 3.4 Cambas SA, Andrew 2.6 2.6 2.7 2.8 2.4 Domaine Kosta Lazaridi SA 0.2 0.2 0.2 0.2 0.2 Others 35.7 37.5 38.8 37.6 37.4 Total 100.0 100.0 100.0 100.0 100.0
Source: Euromonitor International from official statistics, trade associations, trade press, company research, store checks, trade interviews, trade sources
Table 25 Company Shares of Still Light Grape Wine by Global Brand Owner 2007-2011
% total volume Company 2007 2008 2009 2010 2011 Malamatinas, E, & Sons SA 9.1 9.1 9.3 9.6 10.0 Boutaris Group 15.1 13.2 11.3 10.1 9.4 Tsantalis SA, E 8.5 8.7 8.7 8.6 8.0 Greek Wine Cellars D 6.3 6.1 6.2 6.5 6.5 Kourtakis SA Evoiki AS 4.0 4.0 4.2 4.7 5.0 Domaine Hatzimichalis SA 5.8 5.8 5.5 5.2 4.7 Peza Union 4.1 4.1 4.2 4.5 4.5 Achaia Clauss Wine Co SA 3.7 3.8 3.7 3.7 3.4 Domaine Kosta Lazaridi SA 0.2 0.2 0.2 0.2 0.2 Private Label 7.5 7.5 8.0 9.3 10.8 Others 35.7 37.5 38.8 37.6 37.4 Total 100.0 100.0 100.0 100.0 100.0
Source: Euromonitor International from official statistics, trade associations, trade press, company research, store checks, trade interviews, trade sources
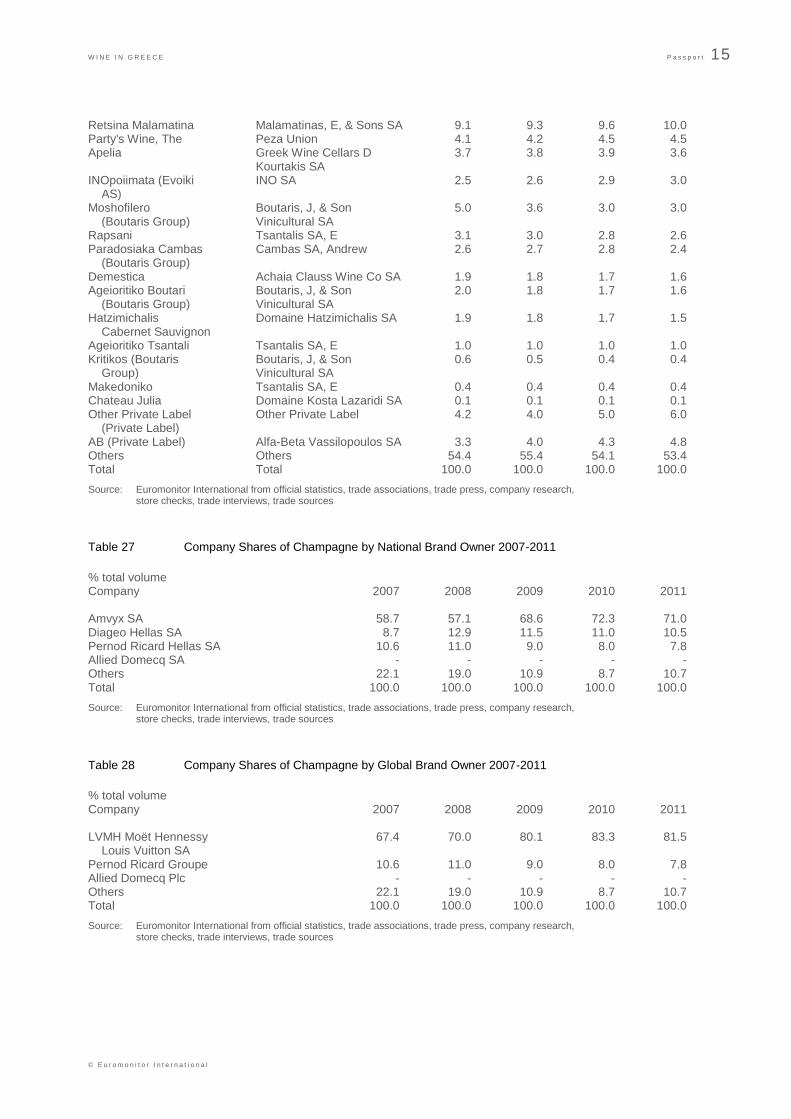
Table 26 Brand Shares of Still Light Grape Wine 2008-2011
% total volume Brand (Global Brand Company 2008 2009 2010 2011 Owner)
W I N E I N G R E E C E P a s s p o r t 15
© E u r o m o n i t o r I n t e r n a t i o n a l
Retsina Malamatina Malamatinas, E, & Sons SA 9.1 9.3 9.6 10.0 Party's Wine, The Peza Union 4.1 4.2 4.5 4.5 Apelia Greek Wine Cellars D 3.7 3.8 3.9 3.6 Kourtakis SA INOpoiimata (Evoiki INO SA 2.5 2.6 2.9 3.0 AS) Moshofilero Boutaris, J, & Son 5.0 3.6 3.0 3.0 (Boutaris Group) Vinicultural SA Rapsani Tsantalis SA, E 3.1 3.0 2.8 2.6 Paradosiaka Cambas Cambas SA, Andrew 2.6 2.7 2.8 2.4 (Boutaris Group) Demestica Achaia Clauss Wine Co SA 1.9 1.8 1.7 1.6 Ageioritiko Boutari Boutaris, J, & Son 2.0 1.8 1.7 1.6 (Boutaris Group) Vinicultural SA Hatzimichalis Domaine Hatzimichalis SA 1.9 1.8 1.7 1.5 Cabernet Sauvignon Ageioritiko Tsantali Tsantalis SA, E 1.0 1.0 1.0 1.0 Kritikos (Boutaris Boutaris, J, & Son 0.6 0.5 0.4 0.4 Group) Vinicultural SA Makedoniko Tsantalis SA, E 0.4 0.4 0.4 0.4 Chateau Julia Domaine Kosta Lazaridi SA 0.1 0.1 0.1 0.1 Other Private Label Other Private Label 4.2 4.0 5.0 6.0 (Private Label) AB (Private Label) Alfa-Beta Vassilopoulos SA 3.3 4.0 4.3 4.8 Others Others 54.4 55.4 54.1 53.4 Total Total 100.0 100.0 100.0 100.0
Source: Euromonitor International from official statistics, trade associations, trade press, company research, store checks, trade interviews, trade sources
Table 27 Company Shares of Champagne by National Brand Owner 2007-2011
% total volume Company 2007 2008 2009 2010 2011 Amvyx SA 58.7 57.1 68.6 72.3 71.0 Diageo Hellas SA 8.7 12.9 11.5 11.0 10.5 Pernod Ricard Hellas SA 10.6 11.0 9.0 8.0 7.8 Allied Domecq SA - - - - - Others 22.1 19.0 10.9 8.7 10.7 Total 100.0 100.0 100.0 100.0 100.0
Source: Euromonitor International from official statistics, trade associations, trade press, company research, store checks, trade interviews, trade sources
Table 28 Company Shares of Champagne by Global Brand Owner 2007-2011
% total volume Company 2007 2008 2009 2010 2011 LVMH Moët Hennessy 67.4 70.0 80.1 83.3 81.5 Louis Vuitton SA Pernod Ricard Groupe 10.6 11.0 9.0 8.0 7.8 Allied Domecq Plc - - - - - Others 22.1 19.0 10.9 8.7 10.7 Total 100.0 100.0 100.0 100.0 100.0
Source: Euromonitor International from official statistics, trade associations, trade press, company research, store checks, trade interviews, trade sources
W I N E I N G R E E C E P a s s p o r t 16
© E u r o m o n i t o r I n t e r n a t i o n a l
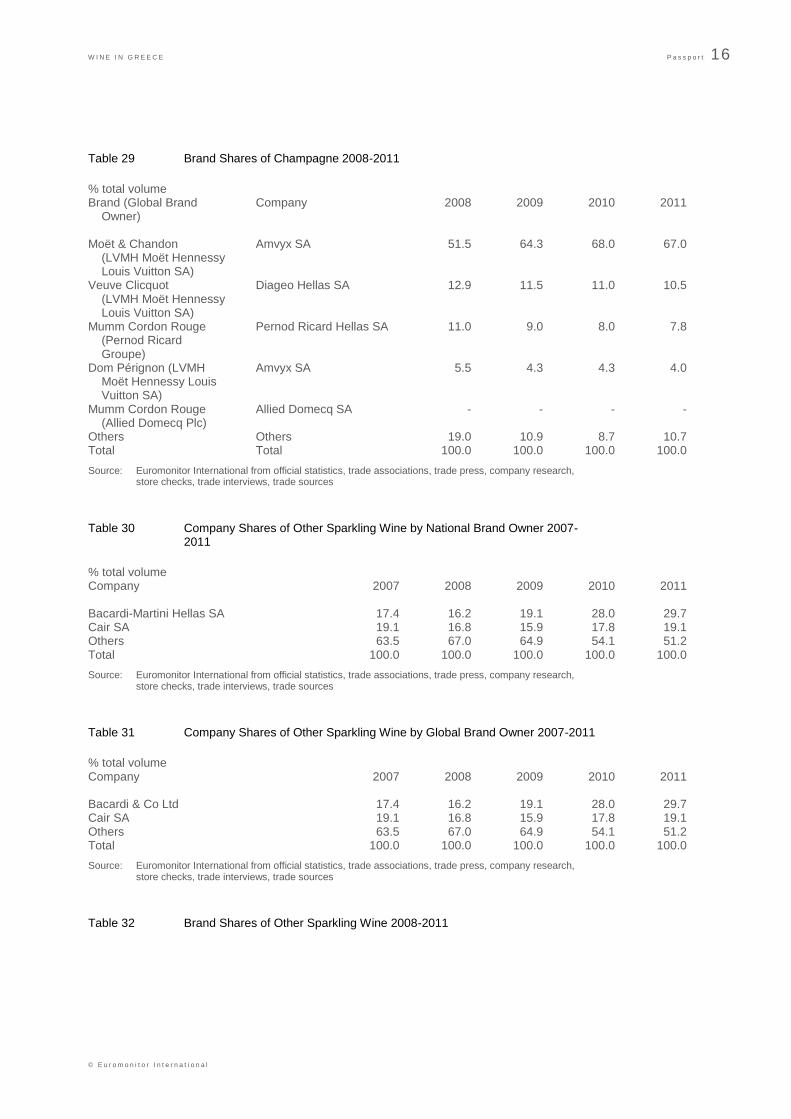
Table 29 Brand Shares of Champagne 2008-2011
% total volume Brand (Global Brand Company 2008 2009 2010 2011 Owner) Moët & Chandon Amvyx SA 51.5 64.3 68.0 67.0 (LVMH Moët Hennessy Louis Vuitton SA) Veuve Clicquot Diageo Hellas SA 12.9 11.5 11.0 10.5 (LVMH Moët Hennessy Louis Vuitton SA) Mumm Cordon Rouge Pernod Ricard Hellas SA 11.0 9.0 8.0 7.8 (Pernod Ricard Groupe) Dom Pérignon (LVMH Amvyx SA 5.5 4.3 4.3 4.0 Moët Hennessy Louis Vuitton SA) Mumm Cordon Rouge Allied Domecq SA - - - - (Allied Domecq Plc) Others Others 19.0 10.9 8.7 10.7 Total Total 100.0 100.0 100.0 100.0
Source: Euromonitor International from official statistics, trade associations, trade press, company research, store checks, trade interviews, trade sources
Table 30 Company Shares of Other Sparkling Wine by National Brand Owner 2007-2011
% total volume Company 2007 2008 2009 2010 2011 Bacardi-Martini Hellas SA 17.4 16.2 19.1 28.0 29.7 Cair SA 19.1 16.8 15.9 17.8 19.1 Others 63.5 67.0 64.9 54.1 51.2 Total 100.0 100.0 100.0 100.0 100.0
Source: Euromonitor International from official statistics, trade associations, trade press, company research, store checks, trade interviews, trade sources
Table 31 Company Shares of Other Sparkling Wine by Global Brand Owner 2007-2011
% total volume Company 2007 2008 2009 2010 2011 Bacardi & Co Ltd 17.4 16.2 19.1 28.0 29.7 Cair SA 19.1 16.8 15.9 17.8 19.1 Others 63.5 67.0 64.9 54.1 51.2 Total 100.0 100.0 100.0 100.0 100.0
Source: Euromonitor International from official statistics, trade associations, trade press, company research, store checks, trade interviews, trade sources
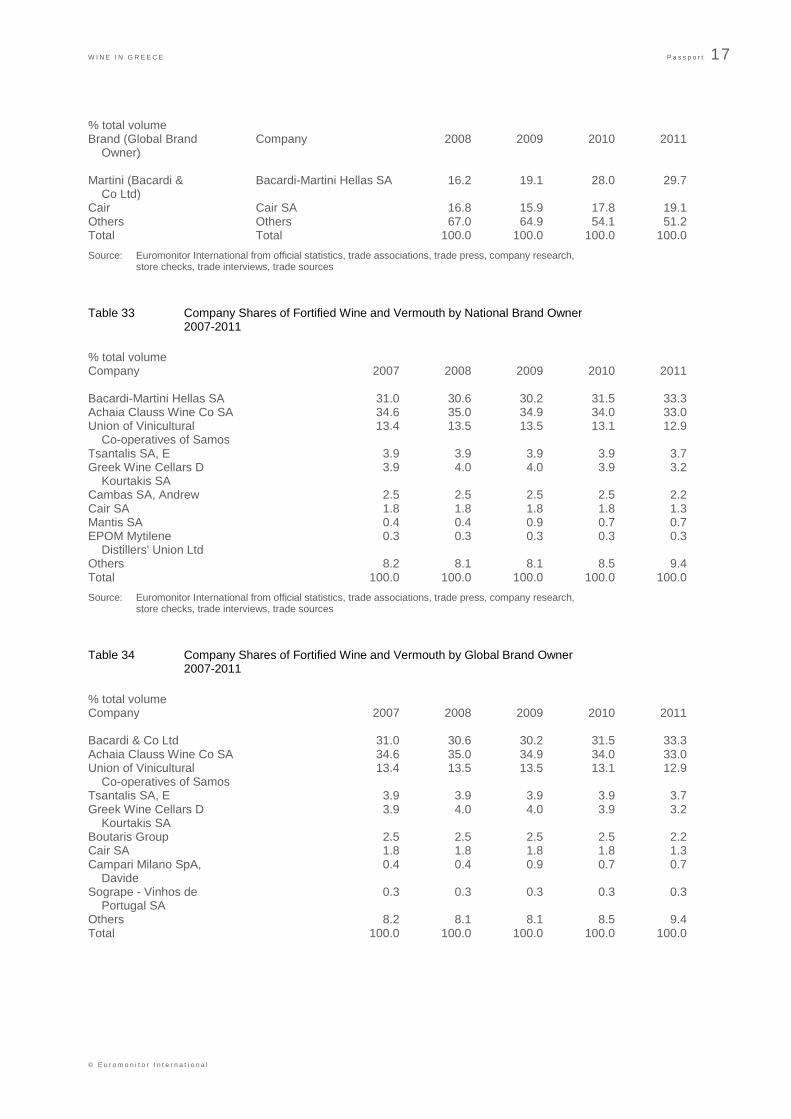
Table 32 Brand Shares of Other Sparkling Wine 2008-2011
W I N E I N G R E E C E P a s s p o r t 17
© E u r o m o n i t o r I n t e r n a t i o n a l
% total volume Brand (Global Brand Company 2008 2009 2010 2011 Owner) Martini (Bacardi & Bacardi-Martini Hellas SA 16.2 19.1 28.0 29.7 Co Ltd) Cair Cair SA 16.8 15.9 17.8 19.1 Others Others 67.0 64.9 54.1 51.2 Total Total 100.0 100.0 100.0 100.0
Source: Euromonitor International from official statistics, trade associations, trade press, company research, store checks, trade interviews, trade sources
Table 33 Company Shares of Fortified Wine and Vermouth by National Brand Owner 2007-2011
% total volume Company 2007 2008 2009 2010 2011 Bacardi-Martini Hellas SA 31.0 30.6 30.2 31.5 33.3 Achaia Clauss Wine Co SA 34.6 35.0 34.9 34.0 33.0 Union of Vinicultural 13.4 13.5 13.5 13.1 12.9 Co-operatives of Samos Tsantalis SA, E 3.9 3.9 3.9 3.9 3.7 Greek Wine Cellars D 3.9 4.0 4.0 3.9 3.2 Kourtakis SA Cambas SA, Andrew 2.5 2.5 2.5 2.5 2.2 Cair SA 1.8 1.8 1.8 1.8 1.3 Mantis SA 0.4 0.4 0.9 0.7 0.7 EPOM Mytilene 0.3 0.3 0.3 0.3 0.3 Distillers' Union Ltd Others 8.2 8.1 8.1 8.5 9.4 Total 100.0 100.0 100.0 100.0 100.0
Source: Euromonitor International from official statistics, trade associations, trade press, company research, store checks, trade interviews, trade sources
Table 34 Company Shares of Fortified Wine and Vermouth by Global Brand Owner 2007-2011
% total volume Company 2007 2008 2009 2010 2011 Bacardi & Co Ltd 31.0 30.6 30.2 31.5 33.3 Achaia Clauss Wine Co SA 34.6 35.0 34.9 34.0 33.0 Union of Vinicultural 13.4 13.5 13.5 13.1 12.9 Co-operatives of Samos Tsantalis SA, E 3.9 3.9 3.9 3.9 3.7 Greek Wine Cellars D 3.9 4.0 4.0 3.9 3.2 Kourtakis SA Boutaris Group 2.5 2.5 2.5 2.5 2.2 Cair SA 1.8 1.8 1.8 1.8 1.3 Campari Milano SpA, 0.4 0.4 0.9 0.7 0.7 Davide Sogrape - Vinhos de 0.3 0.3 0.3 0.3 0.3 Portugal SA Others 8.2 8.1 8.1 8.5 9.4 Total 100.0 100.0 100.0 100.0 100.0
W I N E I N G R E E C E P a s s p o r t 18
© E u r o m o n i t o r I n t e r n a t i o n a l
Source: Euromonitor International from official statistics, trade associations, trade press, company research, store checks, trade interviews, trade sources
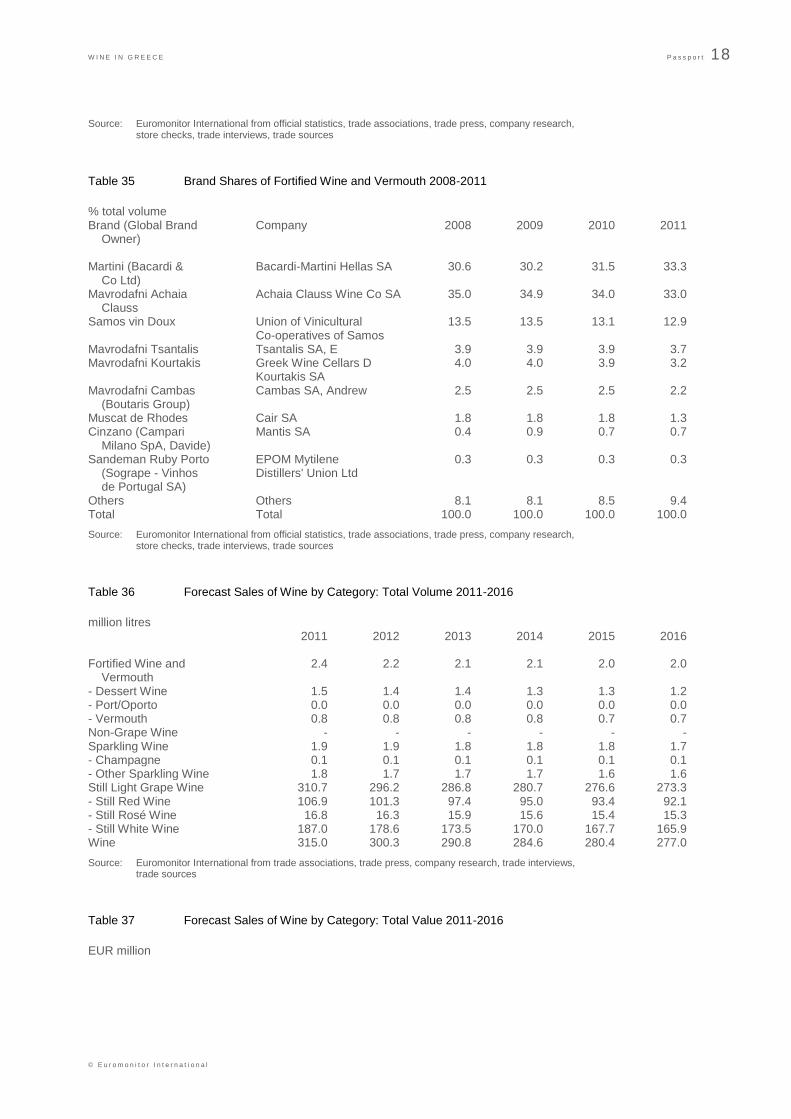
Table 35 Brand Shares of Fortified Wine and Vermouth 2008-2011
% total volume Brand (Global Brand Company 2008 2009 2010 2011 Owner) Martini (Bacardi & Bacardi-Martini Hellas SA 30.6 30.2 31.5 33.3 Co Ltd) Mavrodafni Achaia Achaia Clauss Wine Co SA 35.0 34.9 34.0 33.0 Clauss Samos vin Doux Union of Vinicultural 13.5 13.5 13.1 12.9 Co-operatives of Samos Mavrodafni Tsantalis Tsantalis SA, E 3.9 3.9 3.9 3.7 Mavrodafni Kourtakis Greek Wine Cellars D 4.0 4.0 3.9 3.2 Kourtakis SA Mavrodafni Cambas Cambas SA, Andrew 2.5 2.5 2.5 2.2 (Boutaris Group) Muscat de Rhodes Cair SA 1.8 1.8 1.8 1.3 Cinzano (Campari Mantis SA 0.4 0.9 0.7 0.7 Milano SpA, Davide) Sandeman Ruby Porto EPOM Mytilene 0.3 0.3 0.3 0.3 (Sogrape - Vinhos Distillers' Union Ltd de Portugal SA) Others Others 8.1 8.1 8.5 9.4 Total Total 100.0 100.0 100.0 100.0
Source: Euromonitor International from official statistics, trade associations, trade press, company research, store checks, trade interviews, trade sources
Table 36 Forecast Sales of Wine by Category: Total Volume 2011-2016
million litres 2011 2012 2013 2014 2015 2016 Fortified Wine and 2.4 2.2 2.1 2.1 2.0 2.0 Vermouth - Dessert Wine 1.5 1.4 1.4 1.3 1.3 1.2 - Port/Oporto 0.0 0.0 0.0 0.0 0.0 0.0 - Vermouth 0.8 0.8 0.8 0.8 0.7 0.7 Non-Grape Wine - - - - - - Sparkling Wine 1.9 1.9 1.8 1.8 1.8 1.7 - Champagne 0.1 0.1 0.1 0.1 0.1 0.1 - Other Sparkling Wine 1.8 1.7 1.7 1.7 1.6 1.6 Still Light Grape Wine 310.7 296.2 286.8 280.7 276.6 273.3 - Still Red Wine 106.9 101.3 97.4 95.0 93.4 92.1 - Still Rosé Wine 16.8 16.3 15.9 15.6 15.4 15.3 - Still White Wine 187.0 178.6 173.5 170.0 167.7 165.9 Wine 315.0 300.3 290.8 284.6 280.4 277.0
Source: Euromonitor International from trade associations, trade press, company research, trade interviews, trade sources
Table 37 Forecast Sales of Wine by Category: Total Value 2011-2016
EUR million
W I N E I N G R E E C E P a s s p o r t 19
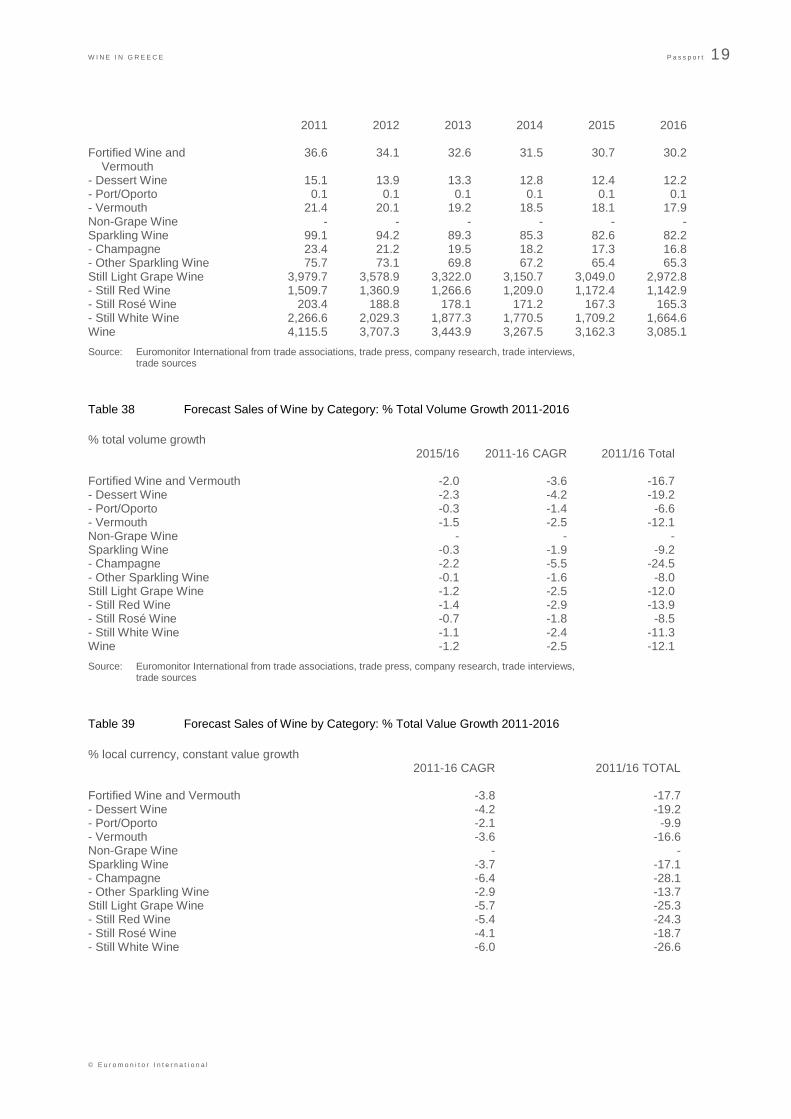
© E u r o m o n i t o r I n t e r n a t i o n a l
2011 2012 2013 2014 2015 2016 Fortified Wine and 36.6 34.1 32.6 31.5 30.7 30.2 Vermouth - Dessert Wine 15.1 13.9 13.3 12.8 12.4 12.2 - Port/Oporto 0.1 0.1 0.1 0.1 0.1 0.1 - Vermouth 21.4 20.1 19.2 18.5 18.1 17.9 Non-Grape Wine - - - - - - Sparkling Wine 99.1 94.2 89.3 85.3 82.6 82.2 - Champagne 23.4 21.2 19.5 18.2 17.3 16.8 - Other Sparkling Wine 75.7 73.1 69.8 67.2 65.4 65.3 Still Light Grape Wine 3,979.7 3,578.9 3,322.0 3,150.7 3,049.0 2,972.8 - Still Red Wine 1,509.7 1,360.9 1,266.6 1,209.0 1,172.4 1,142.9 - Still Rosé Wine 203.4 188.8 178.1 171.2 167.3 165.3 - Still White Wine 2,266.6 2,029.3 1,877.3 1,770.5 1,709.2 1,664.6 Wine 4,115.5 3,707.3 3,443.9 3,267.5 3,162.3 3,085.1
Source: Euromonitor International from trade associations, trade press, company research, trade interviews, trade sources
Table 38 Forecast Sales of Wine by Category: % Total Volume Growth 2011-2016
% total volume growth 2015/16 2011-16 CAGR 2011/16 Total Fortified Wine and Vermouth -2.0 -3.6 -16.7 - Dessert Wine -2.3 -4.2 -19.2 - Port/Oporto -0.3 -1.4 -6.6 - Vermouth -1.5 -2.5 -12.1 Non-Grape Wine - - - Sparkling Wine -0.3 -1.9 -9.2 - Champagne -2.2 -5.5 -24.5 - Other Sparkling Wine -0.1 -1.6 -8.0 Still Light Grape Wine -1.2 -2.5 -12.0 - Still Red Wine -1.4 -2.9 -13.9 - Still Rosé Wine -0.7 -1.8 -8.5 - Still White Wine -1.1 -2.4 -11.3 Wine -1.2 -2.5 -12.1
Source: Euromonitor International from trade associations, trade press, company research, trade interviews, trade sources
Table 39 Forecast Sales of Wine by Category: % Total Value Growth 2011-2016
% local currency, constant value growth 2011-16 CAGR 2011/16 TOTAL Fortified Wine and Vermouth -3.8 -17.7 - Dessert Wine -4.2 -19.2 - Port/Oporto -2.1 -9.9 - Vermouth -3.6 -16.6 Non-Grape Wine - - Sparkling Wine -3.7 -17.1 - Champagne -6.4 -28.1 - Other Sparkling Wine -2.9 -13.7 Still Light Grape Wine -5.7 -25.3 - Still Red Wine -5.4 -24.3 - Still Rosé Wine -4.1 -18.7 - Still White Wine -6.0 -26.6
W I N E I N G R E E C E P a s s p o r t 20
© E u r o m o n i t o r I n t e r n a t i o n a l
Wine -5.6 -25.0
Source: Euromonitor International from trade associations, trade press, company research, trade interviews, trade sources