Embed Size (px)
Citation preview
Wine Market Council PresentationDecember 9, 2004

Wine Market Council Internet Consumer Survey Conducted in June/July 2004
by Merrill Research
1328 respondents (558 core, 770 marginal)
Screener criteria same as previous surveys
Data weighted by gender and income
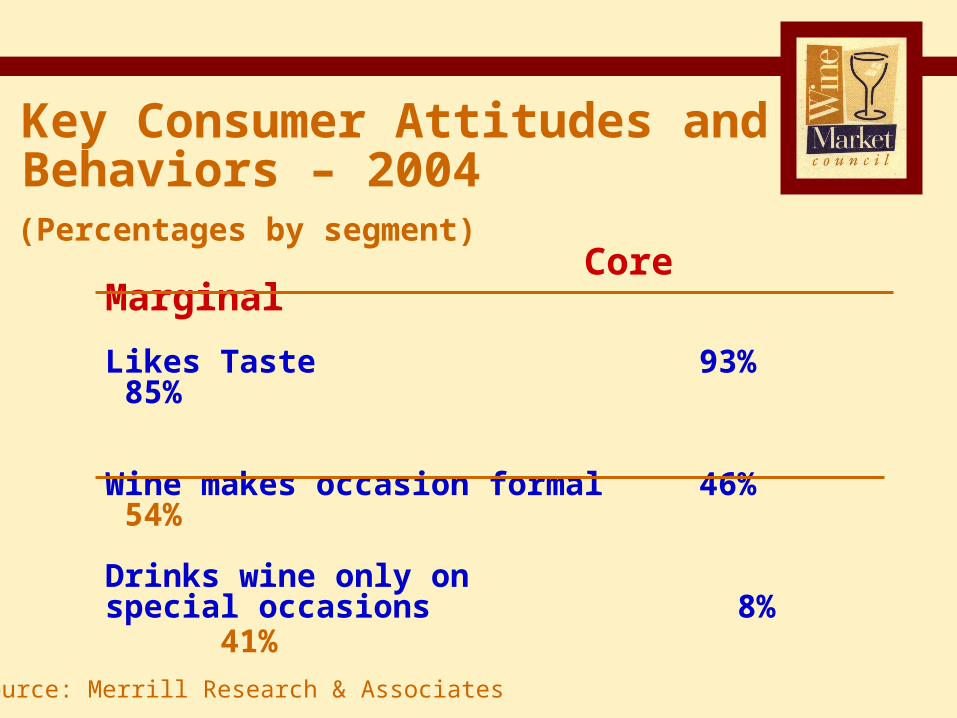
Key Consumer Attitudes and Behaviors – 2004
Core Marginal
Likes Taste 93% 85%
Wine makes occasion formal 46% 54%
Drinks wine only onspecial occasions 8% 41%
(Percentages by segment)
Source: Merrill Research & Associates

Positive Attitudes – 2004
Source: Merrill Research & Associates
Makes a good gift 95 92
Can buy good wine without spending a lot
96 88
Moderate use is good for you
94 90
Core Marginal
(Percentages by segment)
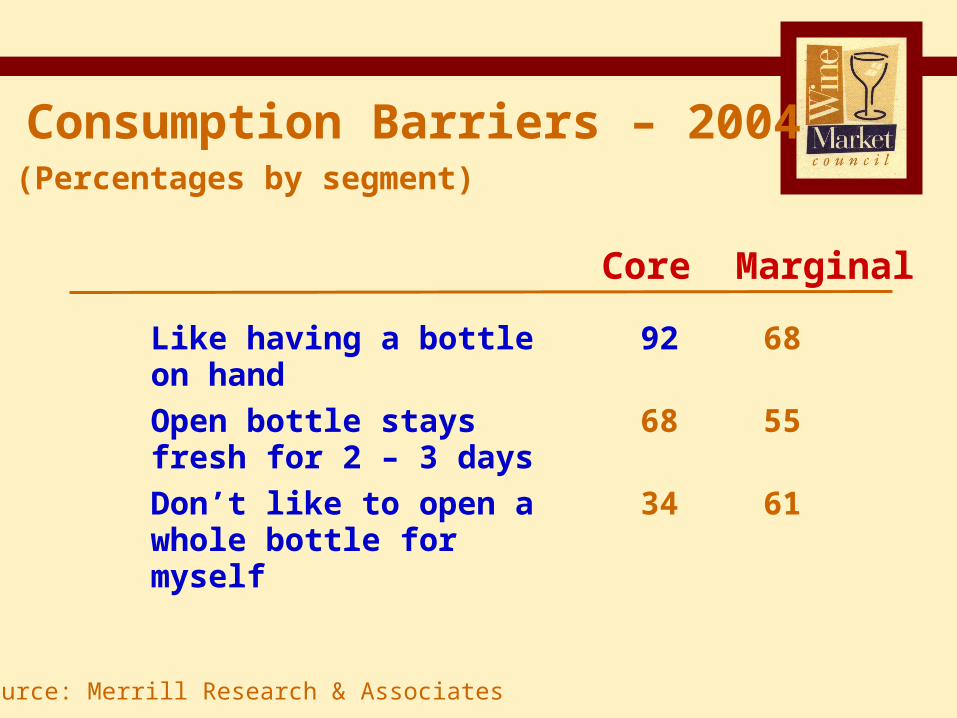
Consumption Barriers – 2004
Source: Merrill Research & Associates
Like having a bottle on hand
92 68
Open bottle stays fresh for 2 – 3 days
68 55
Don’t like to open a whole bottle for myself
34 61
Core Marginal
(Percentages by segment)
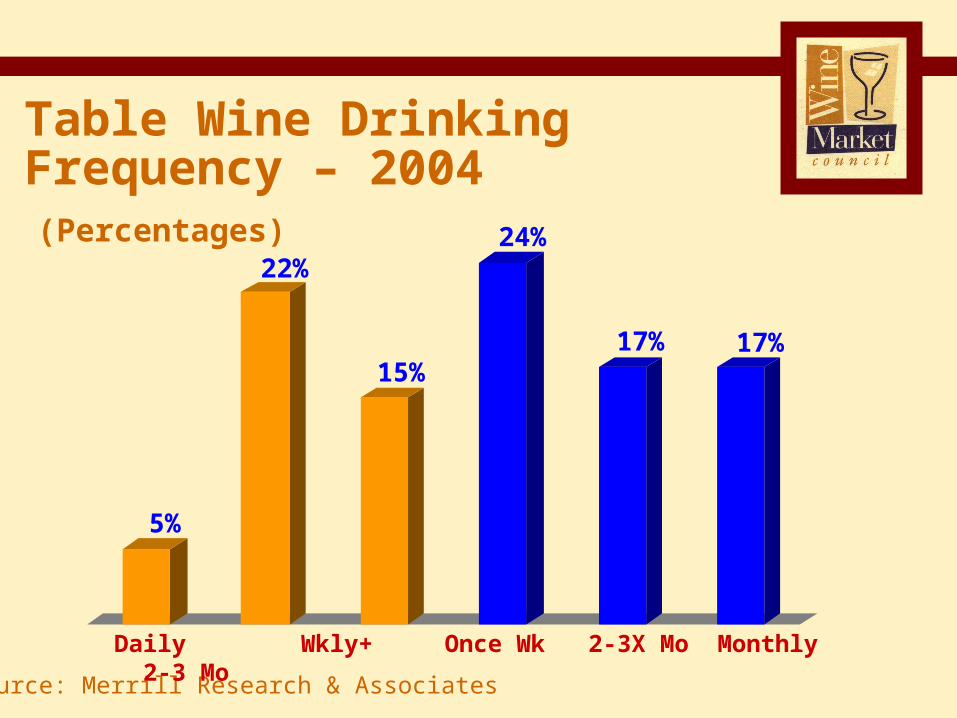
(Percentages)
Table Wine Drinking Frequency – 2004
Source: Merrill Research & Associates
Daily Wkly+ Once Wk 2-3X Mo Monthly 2-3 Mo
5%
22%
15%
24%
17% 17%

Drinking More v. Less Wine
Total Males Females
CoreMarginal
(Net gain by segment – 2004)
39%
3%
36%
1%
41%
4%
Source: Merrill Research & Associates

Total Males Females
Core
Marginal
Prefer wine to other alcohol beverages?(Percentages by segment – 2004)
Source: Merrill Research & Associates
74
32
48
67
80
42
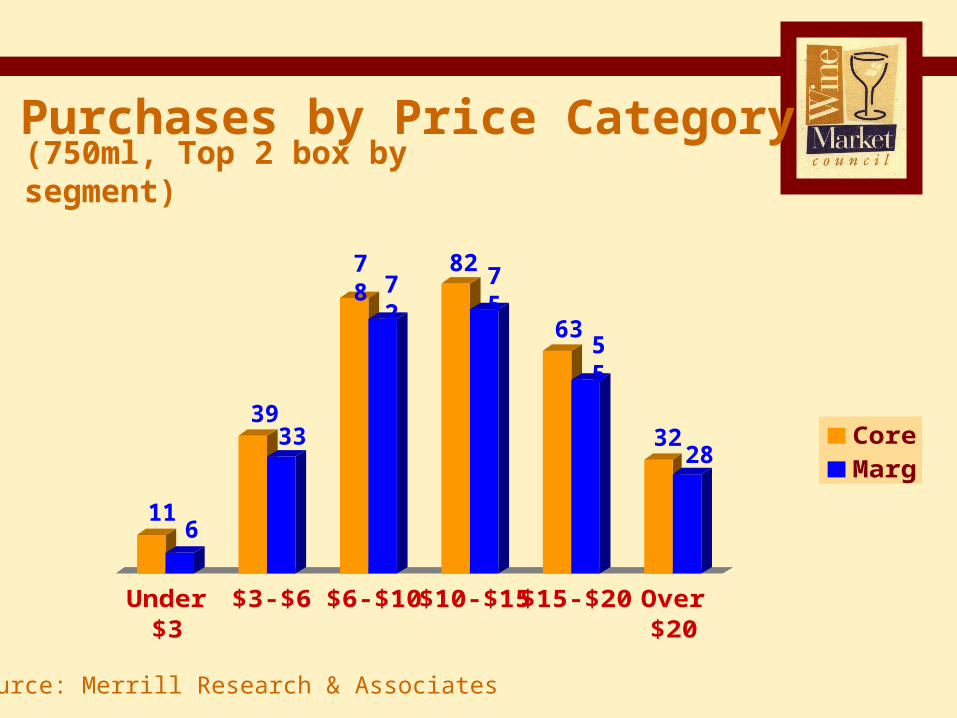
Under$3
$3-$6 $6-$10 $10-$15$15-$20 Over$20
Core
Marg
Purchases by Price Category(750ml, Top 2 box by segment)
Source: Merrill Research & Associates
11
39
82
63
3228
6
78 75
55
33
72

Import & Domestic Wine Consumption - 2004
Core MarginalSource: Merrill Research & Associates
Domestic 70%
Import 30%
Domestic 77%
Import 23%
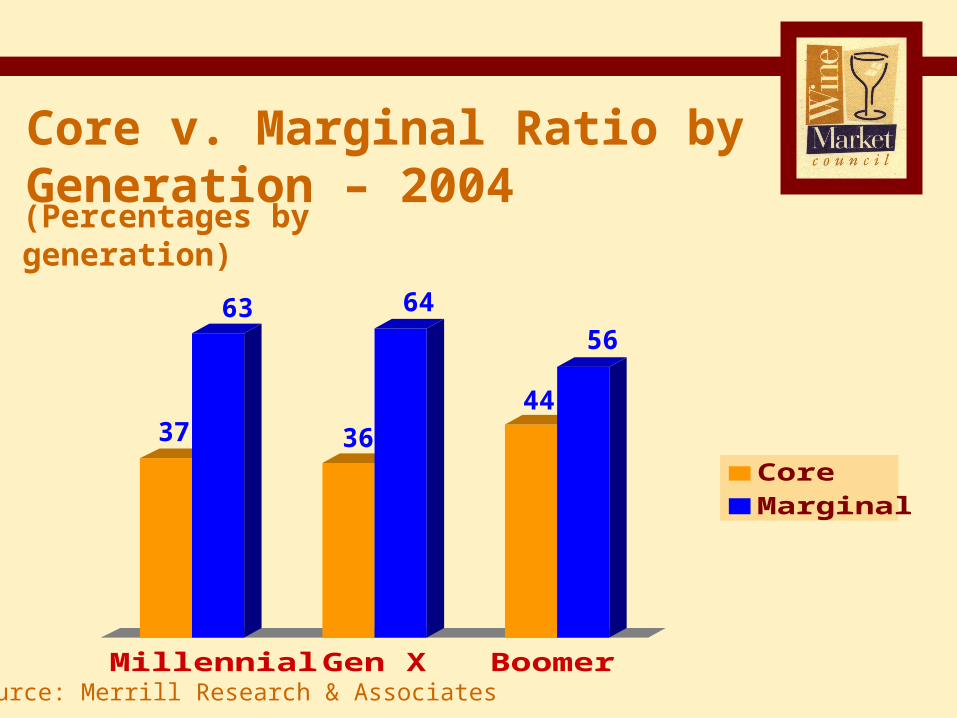
Millennial Gen X Boomer
Core
Marginal
Source: Merrill Research & Associates
Core v. Marginal Ratio by Generation – 2004
63
37 36
64
44
56
(Percentages by generation)
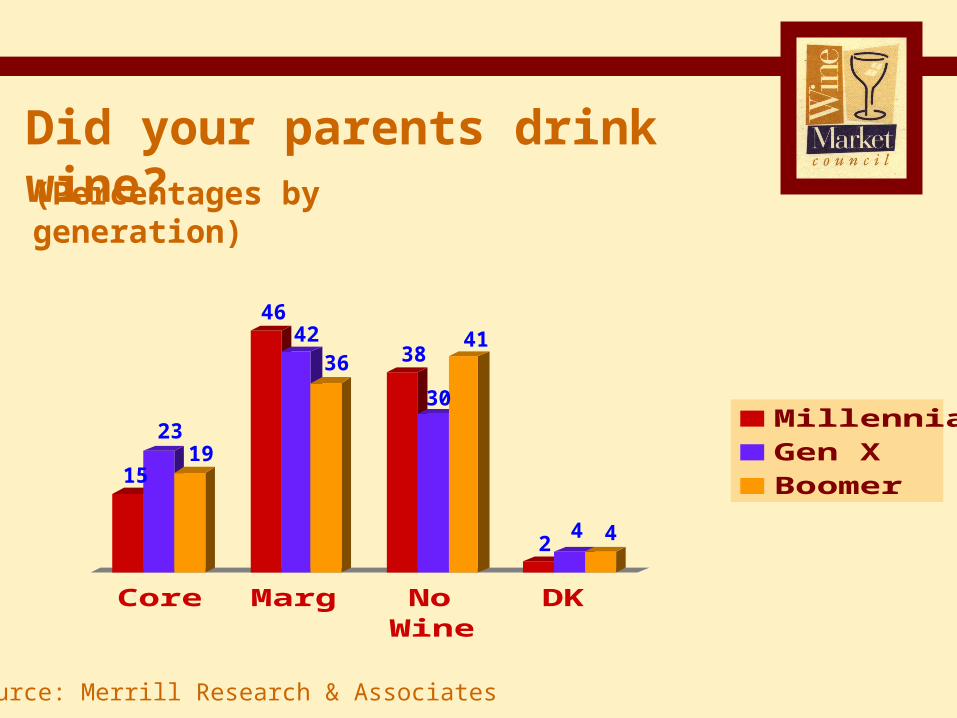
Core Marg NoWine
DK
Millennial
Gen X
Boomer
Source: Merrill Research & Associates
15
23
4642
38
30
Did your parents drink wine?(Percentages by generation)
2
19
3641
44
Source: Merrill Research & Associates
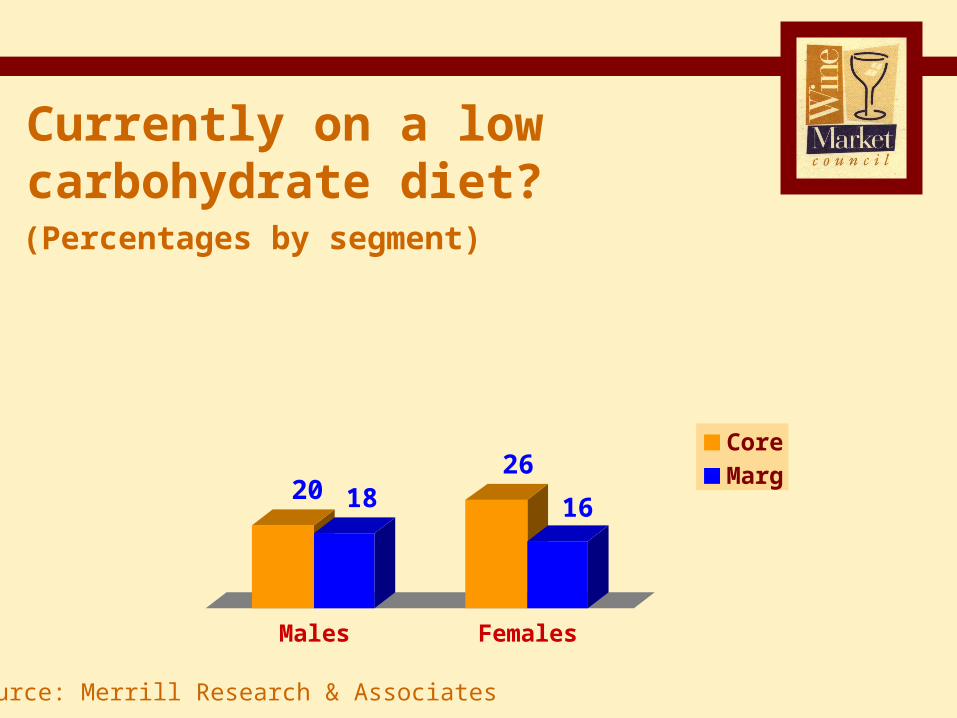
Currently on a low carbohydrate diet?(Percentages by segment)
Males Females
Core
Marg20 1826
16

Source: Merrill Research & Associates
Purchased screwcap wine in past 3 months?(Percentages by generation)
Millennial Gen X Boomer
25
20 20
Source: Merrill Research & Associates
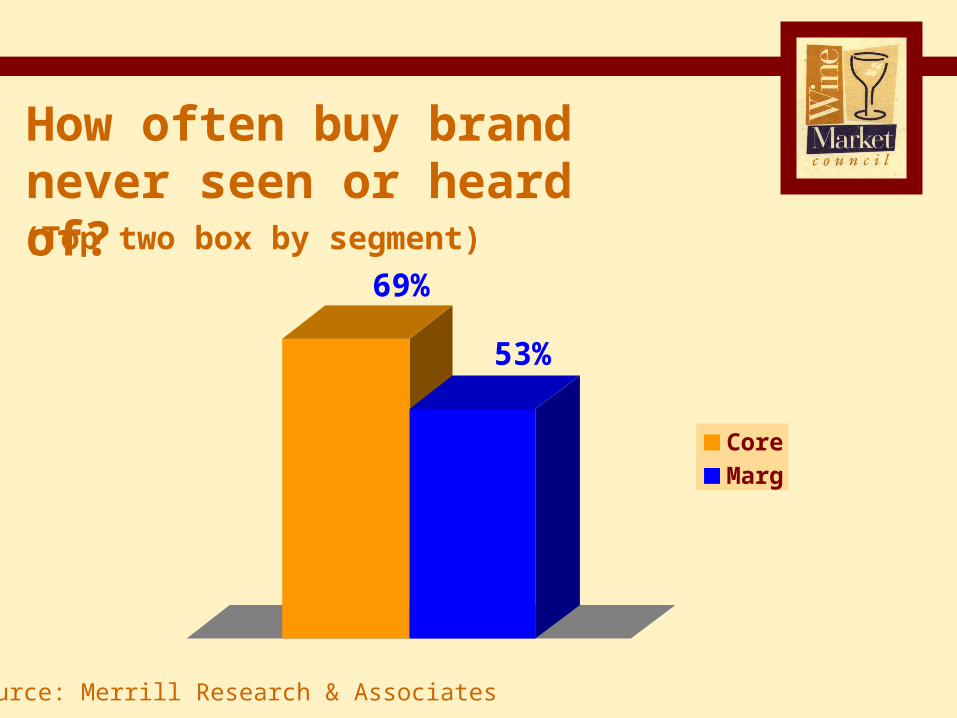
How often buy brand never seen or heard of?(Top two box by segment)
Core
Marg
69%
53%
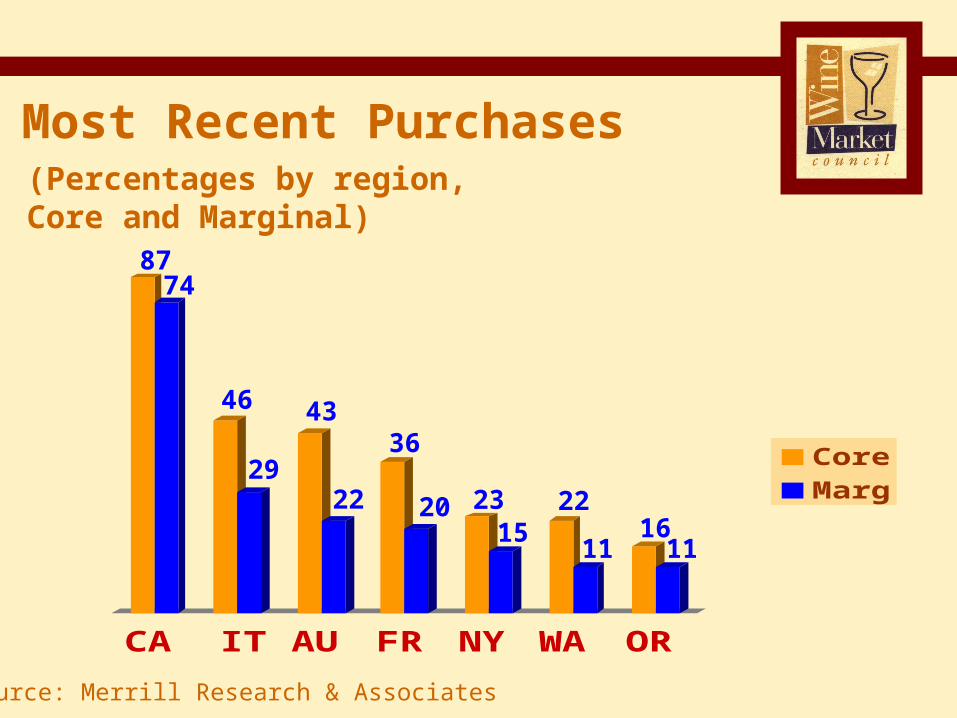
Most Recent Purchases(Percentages by region, Core and Marginal)
CA IT AU FR NY WA OR
Core
Marg
Source: Merrill Research & Associates
8774
46
29
43
22
36
20 2315
22
1116
11
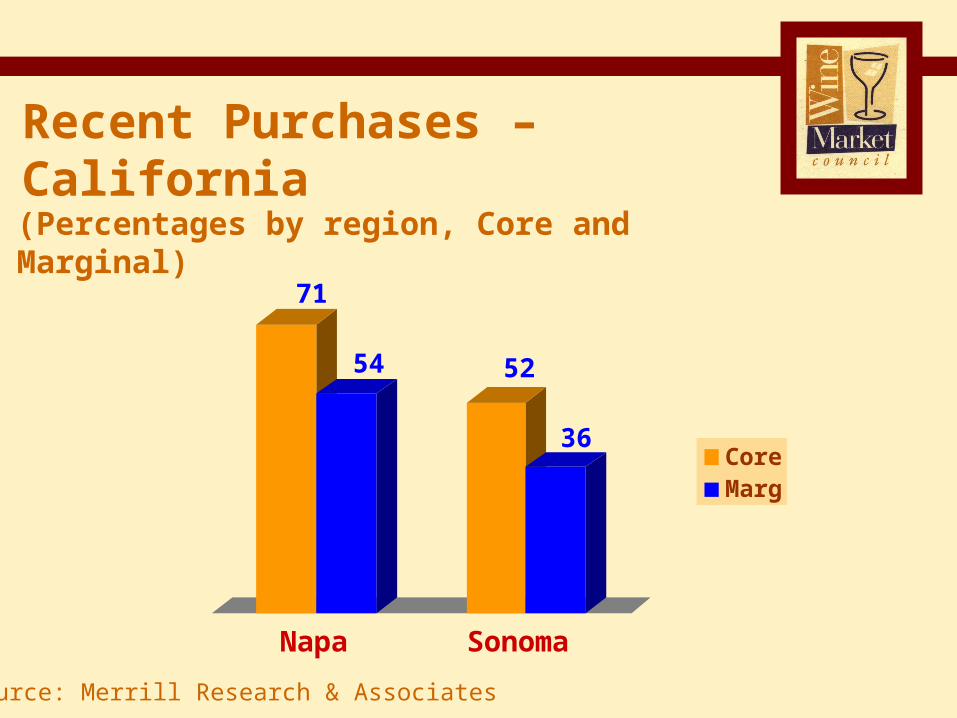
Recent Purchases – California (Percentages by region, Core and Marginal)
Napa Sonoma
CoreMarg
Source: Merrill Research & Associates
71
54 52
36
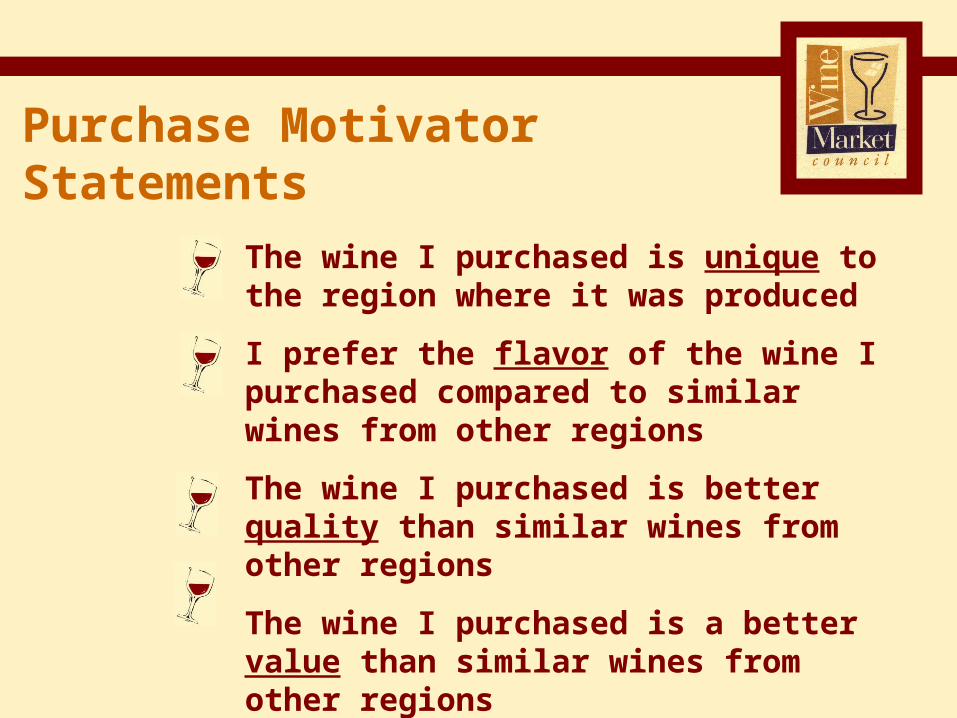
Purchase Motivator Statements
The wine I purchased is unique to the region where it was produced
I prefer the flavor of the wine I purchased compared to similar wines from other regions
The wine I purchased is better quality than similar wines from other regions
The wine I purchased is a better value than similar wines from other regions

Unique Flavor Quality Value
CA
IT
FR
AU
Source: Merrill Research & Associates
42
5956
53 53
49
Purchase Factors/Beliefs(Percentages by world region)
59
41
61
47
38
33
54 5451
55
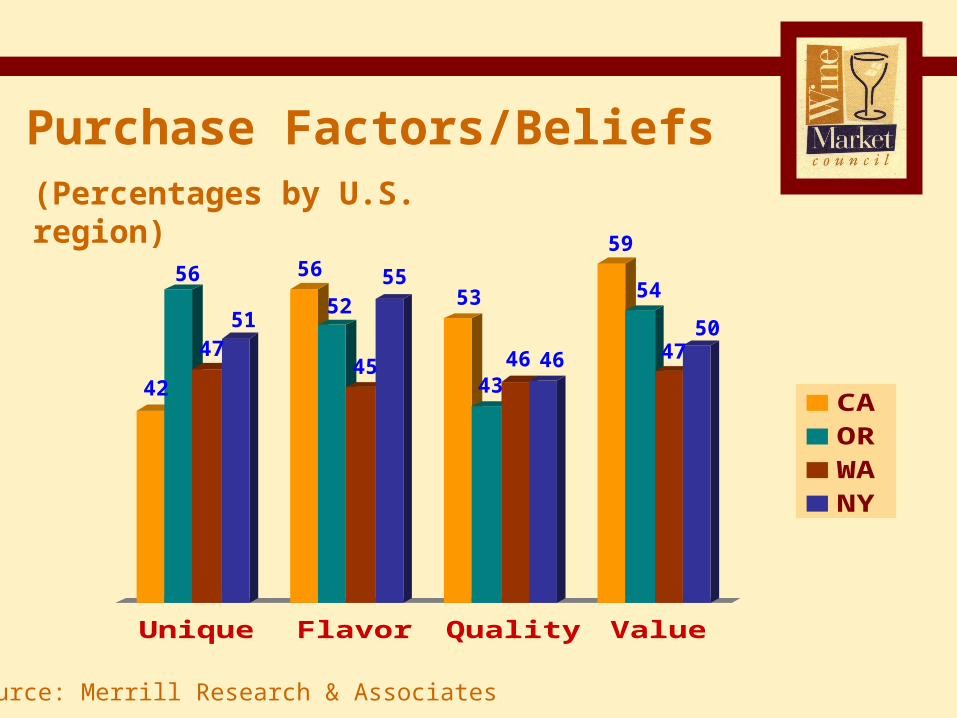
Unique Flavor Quality Value
CA
OR
WA
NY
Source: Merrill Research & Associates
42
56 56
52 53
43
Purchase Factors/Beliefs(Percentages by U.S. region) 59
54
4745 46 47
51
55
46
50

Unique Flavor Quality Value
Core
Marg
Source: Merrill Research & Associates
47
63
56
Purchase Factors/Beliefs – California Wines
62
38
51 50
57
(Percentages, Core and Marginal)
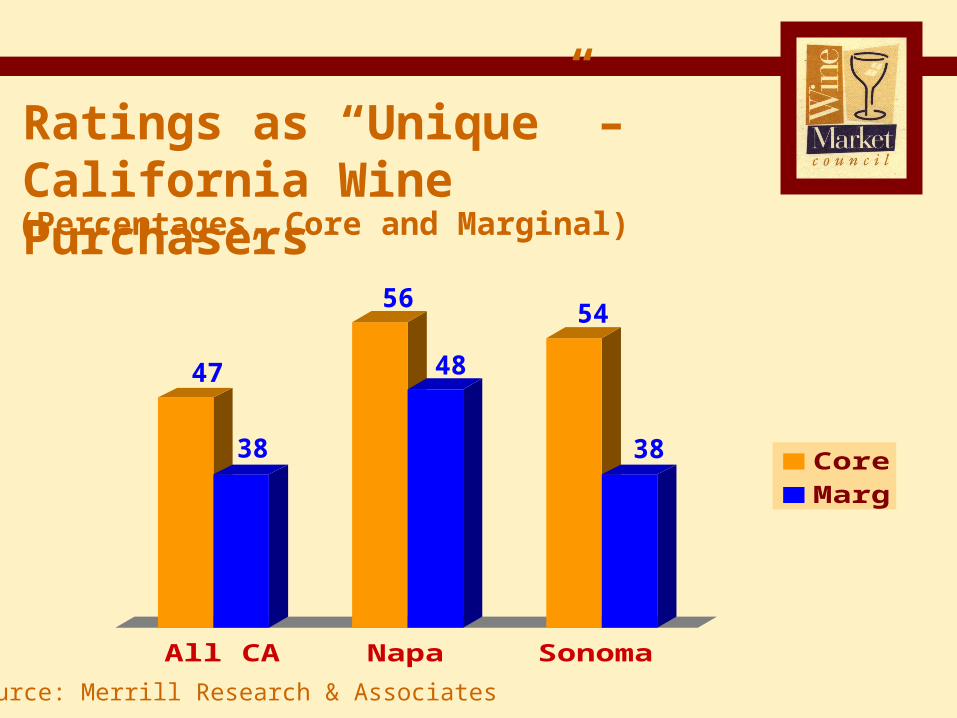
All CA Napa Sonoma
Core
Marg
Source: Merrill Research & Associates
47
5654
Ratings as “Unique” – California Wine Purchasers
38
48
38
(Percentages, Core and Marginal)

Unique Flavor Quality Value
Core
Marg
Source: Merrill Research & Associates
69
49
41
Purchase Factors/Beliefs – French Wines
31
5045
35 35
(Percentages, Core and Marginal)
Unique Flavor Quality Value
Core
Marg
Source: Merrill Research & Associates
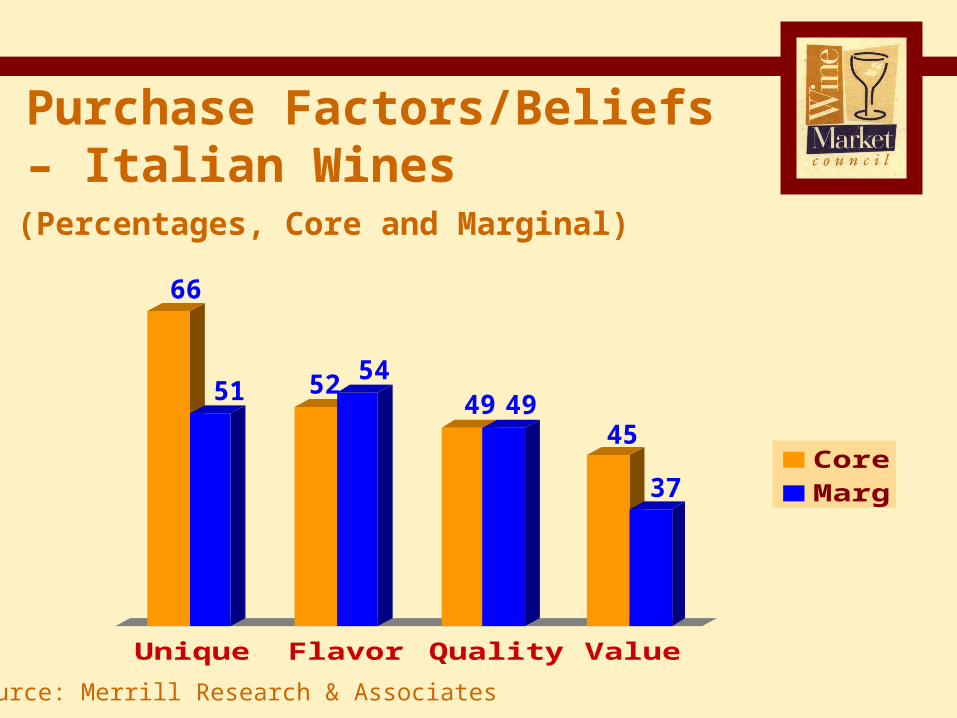
66
5249
Purchase Factors/Beliefs – Italian Wines
45
5154
49
37
(Percentages, Core and Marginal)

Unique Flavor Quality Value
Core
Marg
Source: Merrill Research & Associates
5452
49
Purchase Factors/Beliefs – Australian Wines
5654 55 54 53
(Percentages, Core and Marginal)

Unique Flavor Quality Value
Core
Marg
Source: Merrill Research & Associates
56
51
44
Purchase Factors/Beliefs – New York Wines
4845
60
4751
(Percentages, Core and Marginal)
Unique Flavor Quality Value
Core
Marg
Source: Merrill Research & Associates
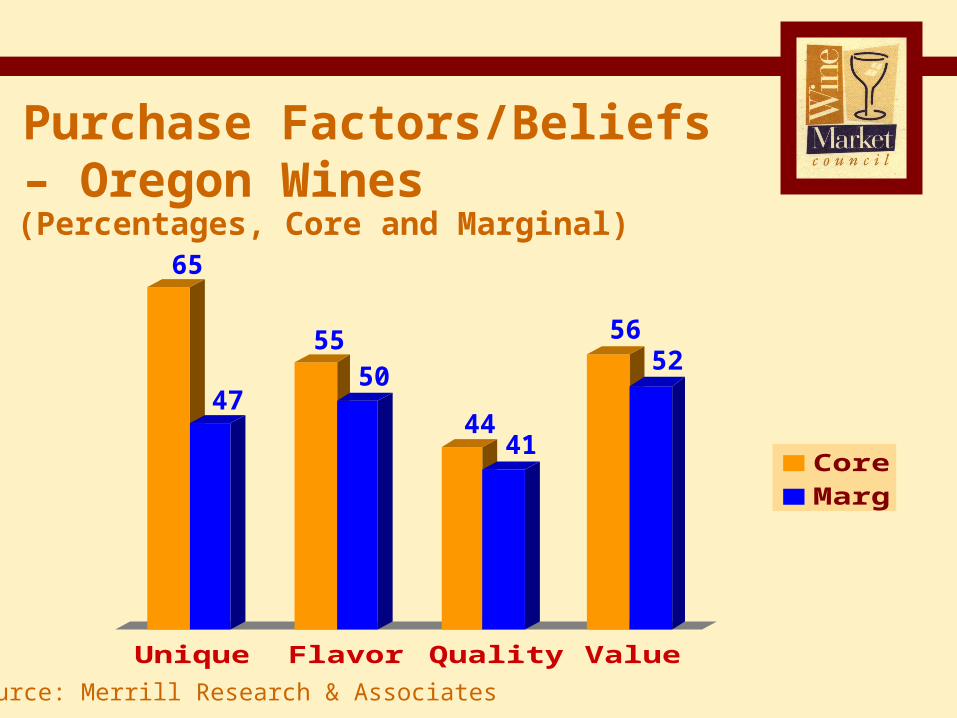
65
55
44
Purchase Factors/Beliefs – Oregon Wines
56
4750
41
52
(Percentages, Core and Marginal)

Unique Flavor Quality Value
Core
Marg
Source: Merrill Research & Associates
42 4341
Purchase Factors/Beliefs – Washington Wines
46
54
48
52
48
(Percentages, Core and Marginal)

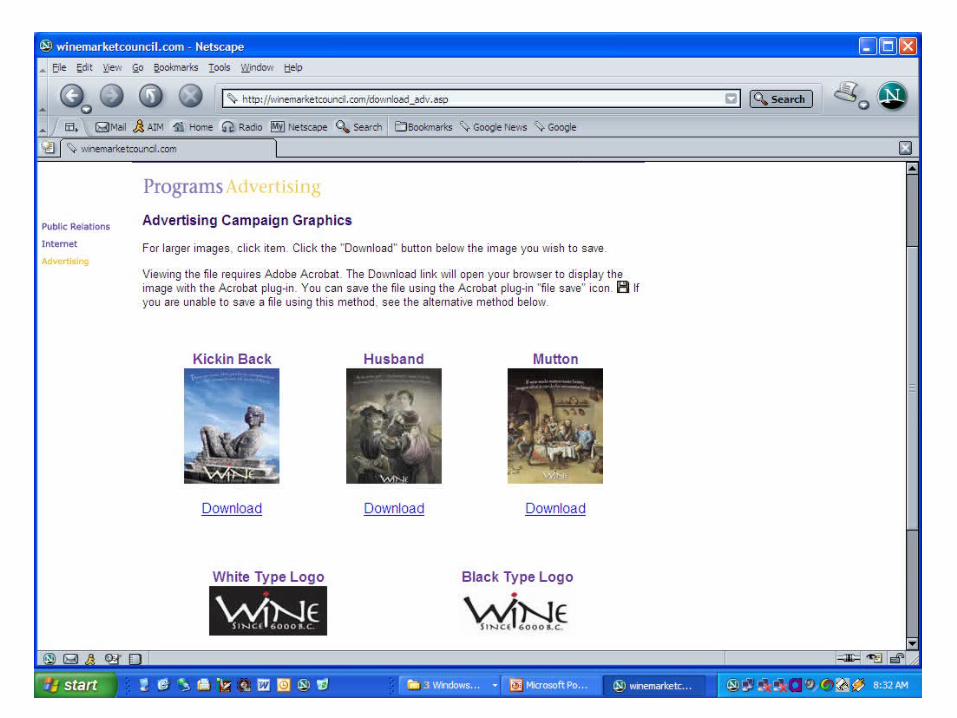
A Campaign for the Wine Industry

Wine. Since 6000 B.C.
Focus on the authenticity of wine
A statement only the wine industry can make
Juxtaposes ancient and modern images to capture the imagination
Humorous copy lines deliver the message: “wine is a casual, everyday enjoyment”
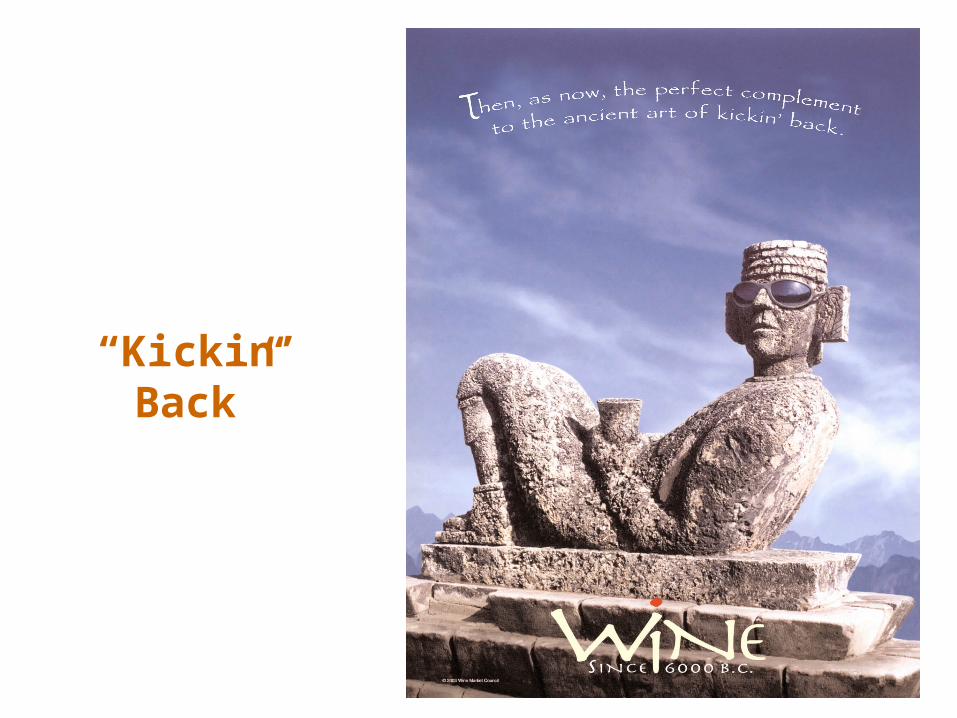
“Kickin’ Back”

“Husband”

“Mutton”

Columbus Test Market

Columbus Test Market Campaign
October 20 to November 28
Print placements in Columbus Dispatch, USA Weekend, Columbus Monthly
PR and merchandising initiatives
Pre and post consumer survey, focus groups, IRI scan data matched market analysis


Wine Market Council PresentationDecember 9, 2004