Embed Size (px)
Citation preview
8/7/2019 Wine Industry Profile-United Kingdom
http://slidepdf.com/reader/full/wine-industry-profile-united-kingdom 1/40
www.datamonitor.comDatamonitor USA
245 Fifth Avenue4th Floor
New York, NY 10016USA
t: +1 212 686 7400
f: +1 212 686 2626
Datamonitor Europe
119 Farringdon RoadLondon EC1R 3DA
United Kingdom
t: +44 20 7551 9000f: +44 20 7675 7500
Datamonitor Middle East
and North America
Datamonitor
PO Box 24893Dubai, UAE
t: +49 69 9754 4517
f: +49 69 9754 4900
Datamonitor Asia Pacific
Level 46, 2 Park StreetSydney, NSW 2000
Australia
t: +61 2 8705 6900
f: +61 2 8705 6901
United Kingdom - Wine 0183 - 0800 - 2009
© Datamonitor. This profile is a licensed product and is not to be photocopied Page 1
INDUSTRY PROFILE
Wine in
the United Kingdom
Reference Code: 0183-0800
Publication Date: May 2010
8/7/2019 Wine Industry Profile-United Kingdom
http://slidepdf.com/reader/full/wine-industry-profile-united-kingdom 2/40
EXECUTIVE SUMMARY
United Kingdom - Wine 0183 - 0800 - 2009
© Datamonitor. This profile is a licensed product and is not to be photocopied Page 2
EXECUTIVE SUMMARY
Market value
The United Kingdom wine market shrank by 0.6% in 2009 to reach a value of $15,457.8 million.
Market value forecast
In 2014, the United Kingdom wine market is forecast to have a value of $16,144.6 million, an increase of
4.4% since 2009.
Market volume
The United Kingdom wine market shrank by 1.3% in 2009 to reach a volume of 1,425.4 million liters.
Market volume forecast
In 2014, the United Kingdom wine market is forecast to have a volume of 1,433 million liters, an increase
of 0.5% since 2009.
Market segmentation I
Still wine is the largest segment of the wine market in the United Kingdom, accounting for 82% of the
market's total value.
Market segmentation II
The United Kingdom accounts for 10.1% of the European wine market value.
Market share
Constellation Brands, Inc. is the leading player in the United Kingdom wine market, generating a 8.6%
share of the market's volume.Market rivalry
The UK market for wine is highly fragmented, with top three players holding a market share of 17.4% of
the total wine market by volumes. Owing to an unfavorable climate for cultivating grapes, the vast majority
of wine is imported by foreign producers, either already bottled or in bulk for bottling in the UK.
Furthermore, wine is vulnerable to the threat from its substitutes, such as spirits and beer, due to low
switching costs and various consumption patterns. The ease of market entry for new players is affected
by government regulation and high import duties applicable. There are considerable import duties and
taxes to be paid; however, this country remains a popular market. The wide range of brands available,
with an accompanying variance in quality and price, means that buyer power is prevented from becoming
disproportionately strong. The degree of rivalry is assessed to be moderate in this market.
8/7/2019 Wine Industry Profile-United Kingdom
http://slidepdf.com/reader/full/wine-industry-profile-united-kingdom 3/40
CONTENTS
United Kingdom - Wine 0183 - 0800 - 2009
© Datamonitor. This profile is a licensed product and is not to be photocopied Page 3
TABLE OF CONTENTS
EXECUTIVE SUMMARY 2 MARKET OVERVIEW 7
Market definition 7 Research highlights 8 Market analysis 9
MARKET VALUE 10 MARKET VOLUME 11 MARKET SEGMENTATION I 12 MARKET SEGMENTATION II 13 MARKET SHARE 14 COMPETITIVE LANDSCAPE 15 LEADING COMPANIES 17
Constellation Brands Inc. 17 Diageo plc 21 Pernod Ricard 26
MARKET DISTRIBUTION 31 MARKET FORECASTS 32
Market value forecast 32 Market volume forecast 33
MACROECONOMIC INDICATORS 34 APPENDIX 36
Methodology 36 Industry associations 37 Related Datamonitor research 37 Disclaimer 38
ABOUT DATAMONITOR 39 Premium Reports 39 Summary Reports 39
8/7/2019 Wine Industry Profile-United Kingdom
http://slidepdf.com/reader/full/wine-industry-profile-united-kingdom 4/40
CONTENTS
United Kingdom - Wine 0183 - 0800 - 2009
© Datamonitor. This profile is a licensed product and is not to be photocopied Page 4
Datamonitor consulting 39
8/7/2019 Wine Industry Profile-United Kingdom
http://slidepdf.com/reader/full/wine-industry-profile-united-kingdom 5/40
CONTENTS
United Kingdom - Wine 0183 - 0800 - 2009
© Datamonitor. This profile is a licensed product and is not to be photocopied Page 5
LIST OF TABLES
Table 1: United Kingdom wine market value: $ million, 2005–09(e) 10 Table 2: United Kingdom wine market volume: million liters, 2005–09(e) 11 Table 3: United Kingdom wine market segmentation I:% share, by value, 2009(e) 12 Table 4: United Kingdom wine market segmentation II: % share, by value, 2009(e) 13 Table 5: United Kingdom wine market share: % share, by volume, 2009(e) 14 Table 6: Constellation Brands Inc.: key facts 17 Table 7: Constellation Brands Inc.: key financials ($) 19 Table 8: Constellation Brands Inc.: key financial ratios 19 Table 9: Diageo plc: key facts 21 Table 10: Diageo plc: key financials ($) 23 Table 11: Diageo plc: key financials (£) 23 Table 12: Diageo plc: key financial ratios 24 Table 13: Pernod Ricard: key facts 26 Table 14: Pernod Ricard: key financials ($) 28 Table 15: Pernod Ricard: key financials ( € ) 28 Table 16: Pernod Ricard: key financial ratios 29 Table 17: United Kingdom wine market distribution: % share, by volume, 2009(e) 31 Table 18: United Kingdom wine market value forecast: $ million, 2009–14 32 Table 19: United Kingdom wine market volume forecast: million liters, 2009–14 33 Table 20: United Kingdom size of population (million), 2005–09 34 Table 21: United Kingdom gdp (constant 2000 prices, $ billion), 2005–09 34 Table 22: United Kingdom gdp (current prices, $ billion), 2005–09 34 Table 23: United Kingdom inflation, 2005–09 35 Table 24: United Kingdom consumer price index (absolute), 2005–09 35 Table 25: United Kingdom exchange rate, 2005–09 35
8/7/2019 Wine Industry Profile-United Kingdom
http://slidepdf.com/reader/full/wine-industry-profile-united-kingdom 6/40
CONTENTS
United Kingdom - Wine 0183 - 0800 - 2009
© Datamonitor. This profile is a licensed product and is not to be photocopied Page 6
LIST OF FIGURES
Figure 1: United Kingdom wine market value: $ million, 2005–09(e) 10 Figure 2: United Kingdom wine market volume: million liters, 2005–09(e) 11 Figure 3: United Kingdom wine market segmentation I:% share, by value, 2009(e) 12 Figure 4: United Kingdom wine market segmentation II: % share, by value, 2009(e) 13 Figure 5: United Kingdom wine market share: % share, by volume, 2009(e) 14 Figure 6: Constellation Brands Inc.: revenues & profitability 20 Figure 7: Constellation Brands Inc.: assets & liabilities 20 Figure 8: Diageo plc: revenues & profitability 24 Figure 9: Diageo plc: assets & liabilities 25 Figure 10: Pernod Ricard: revenues & profitability 29 Figure 11: Pernod Ricard: assets & liabilities 30 Figure 12: United Kingdom wine market distribution: % share, by volume, 2009(e) 31 Figure 13: United Kingdom wine market value forecast: $ million, 2009–14 32 Figure 14: United Kingdom wine market volume forecast: million liters, 2009–14 33
8/7/2019 Wine Industry Profile-United Kingdom
http://slidepdf.com/reader/full/wine-industry-profile-united-kingdom 7/40
MARKET OVERVIEW
United Kingdom - Wine 0183 - 0800 - 2009
© Datamonitor. This profile is a licensed product and is not to be photocopied Page 7
MARKET OVERVIEW
Market definition
The wine market consists of retail sale of champagne, fortified wine, sparkling wine and still wine. Themarket is valued according to retail selling price (RSP) and includes any applicable taxes. Any currency
conversions used in the creation of this report have been calculated using constant 2009 annual average
exchange rates.
For the purpose of this report, Europe comprises Belgium, the Czech Republic, Denmark, France,
Germany, Hungary, Italy, Netherlands, Norway, Poland, Romania, Russia, Spain, Sweden, the Ukraine
and the United Kingdom.
8/7/2019 Wine Industry Profile-United Kingdom
http://slidepdf.com/reader/full/wine-industry-profile-united-kingdom 8/40
MARKET OVERVIEW
United Kingdom - Wine 0183 - 0800 - 2009
© Datamonitor. This profile is a licensed product and is not to be photocopied Page 8
Research highlights
The United Kingdom wine market generated total revenues of $15.5 billion in 2009, representing a
compound annual growth rate (CAGR) of 1% for the period spanning 2005-2009.
Still wine sales proved the most lucrative for the United Kingdom wine market in 2009, generating total
revenues of $12.7 billion, equivalent to 82% of the market's overall value.
The performance of the market is forecast to decelerate, with an anticipated CAGR of 0.9% for the five-
year period 2009-2014, which will lead the market to a value of $16.2 billion by the end of 2014.
8/7/2019 Wine Industry Profile-United Kingdom
http://slidepdf.com/reader/full/wine-industry-profile-united-kingdom 9/40
MARKET OVERVIEW
United Kingdom - Wine 0183 - 0800 - 2009
© Datamonitor. This profile is a licensed product and is not to be photocopied Page 9
Market analysis
After a period of unexciting growth, a decline occurred within the UK wine market in 2008, which further
continued into 2009. Recovery is expected in the forecast period and the market set to grow at a sluggish
rate towards 2014.
The United Kingdom wine market generated total revenues of $15.5 billion in 2009, representing a
compound annual growth rate (CAGR) of 1% for the period spanning 2005-2009. In comparison, the
French and Italian markets grew with CAGRs of 0.9% and 1.1%, respectively, over the same period, to
reach respective values of $37.7 billion and $41.9 billion in 2009.
Market consumption volumes slightly increased with a CAGR of 0.9% for the period 2005-2009, to reach
a total of 1.4 billion litres in 2009. However, the market's volume is expected to rise marginally to 1.4
billion litres by the end of 2014, representing a CAGR of 0.1% for the 2009-2014 period.
Still wine sales proved the most lucrative for the United Kingdom wine market in 2009, generating total
revenues of $12.7 billion, equivalent to 82% of the market's overall value. In comparison, sales of fortifiedwine generated revenues of $1.5 billion in 2009, equating to 9.4% of the market's aggregate revenues.
The performance of the market is forecast to decelerate, with an anticipated CAGR of 0.9% for the five-
year period 2009-2014, which will lead the market to a value of $16.2 billion by the end of 2014.
Comparatively, the French and Italian markets will grow with CAGRs of 1.1% and 0.7%, respectively, over
the same period, to reach respective values of $39.8 billion and $43.4 billion in 2014.
8/7/2019 Wine Industry Profile-United Kingdom
http://slidepdf.com/reader/full/wine-industry-profile-united-kingdom 10/40
MARKET VALUE
United Kingdom - Wine 0183 - 0800 - 2009
© Datamonitor. This profile is a licensed product and is not to be photocopied Page 10
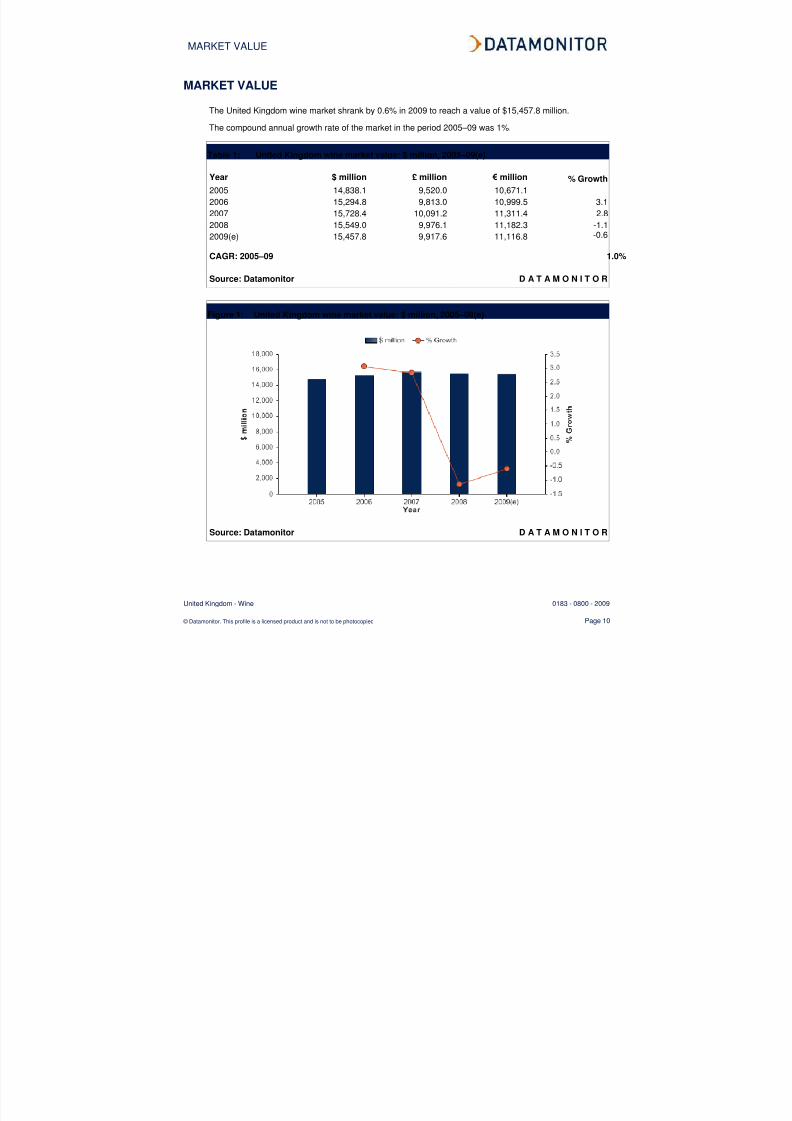
MARKET VALUE
The United Kingdom wine market shrank by 0.6% in 2009 to reach a value of $15,457.8 million.
The compound annual growth rate of the market in the period 2005–09 was 1%.
Table 1: United Kingdom wine market value: $ million, 2005–09(e)
Year $ million £ million € million % Growth
2005 14,838.1 9,520.0 10,671.1
2006 15,294.8 9,813.0 10,999.5 3.1
2007 15,728.4 10,091.2 11,311.4 2.8
2008 15,549.0 9,976.1 11,182.3 -1.1
2009(e) 15,457.8 9,917.6 11,116.8 -0.6
CAGR: 2005–09 1.0%
Source: Datamonitor D A T A M O N I T O R
Figure 1: United Kingdom wine market value: $ million, 2005–09(e)
Source: Datamonitor D A T A M O N I T O R
8/7/2019 Wine Industry Profile-United Kingdom
http://slidepdf.com/reader/full/wine-industry-profile-united-kingdom 11/40
MARKET VOLUME
United Kingdom - Wine 0183 - 0800 - 2009
© Datamonitor. This profile is a licensed product and is not to be photocopied Page 11
MARKET VOLUME
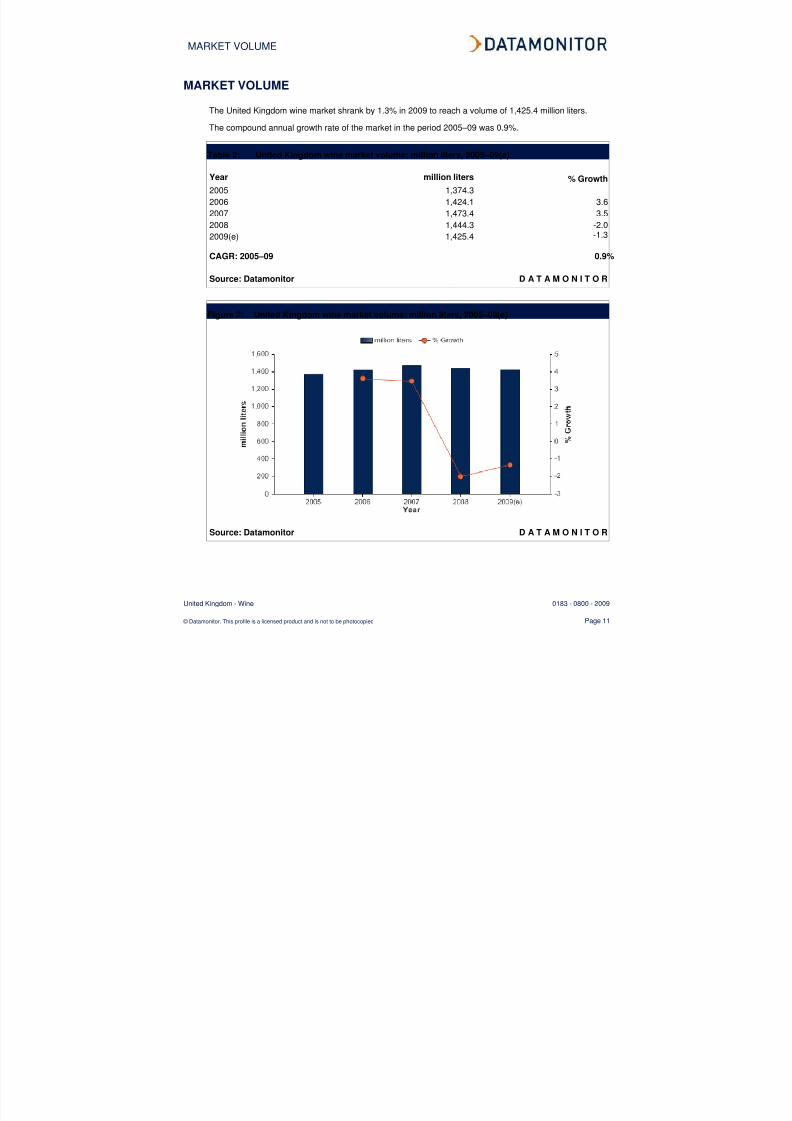
The United Kingdom wine market shrank by 1.3% in 2009 to reach a volume of 1,425.4 million liters.
The compound annual growth rate of the market in the period 2005–09 was 0.9%.
Table 2: United Kingdom wine market volume: million liters, 2005–09(e)
Year million liters % Growth
2005 1,374.3
2006 1,424.1 3.6
2007 1,473.4 3.5
2008 1,444.3 -2.0
2009(e) 1,425.4 -1.3
CAGR: 2005–09 0.9%
Source: Datamonitor D A T A M O N I T O R
Figure 2: United Kingdom wine market volume: million liters, 2005–09(e)
Source: Datamonitor D A T A M O N I T O R
8/7/2019 Wine Industry Profile-United Kingdom
http://slidepdf.com/reader/full/wine-industry-profile-united-kingdom 12/40
MARKET SEGMENTATION I
United Kingdom - Wine 0183 - 0800 - 2009
© Datamonitor. This profile is a licensed product and is not to be photocopied Page 12
MARKET SEGMENTATION I
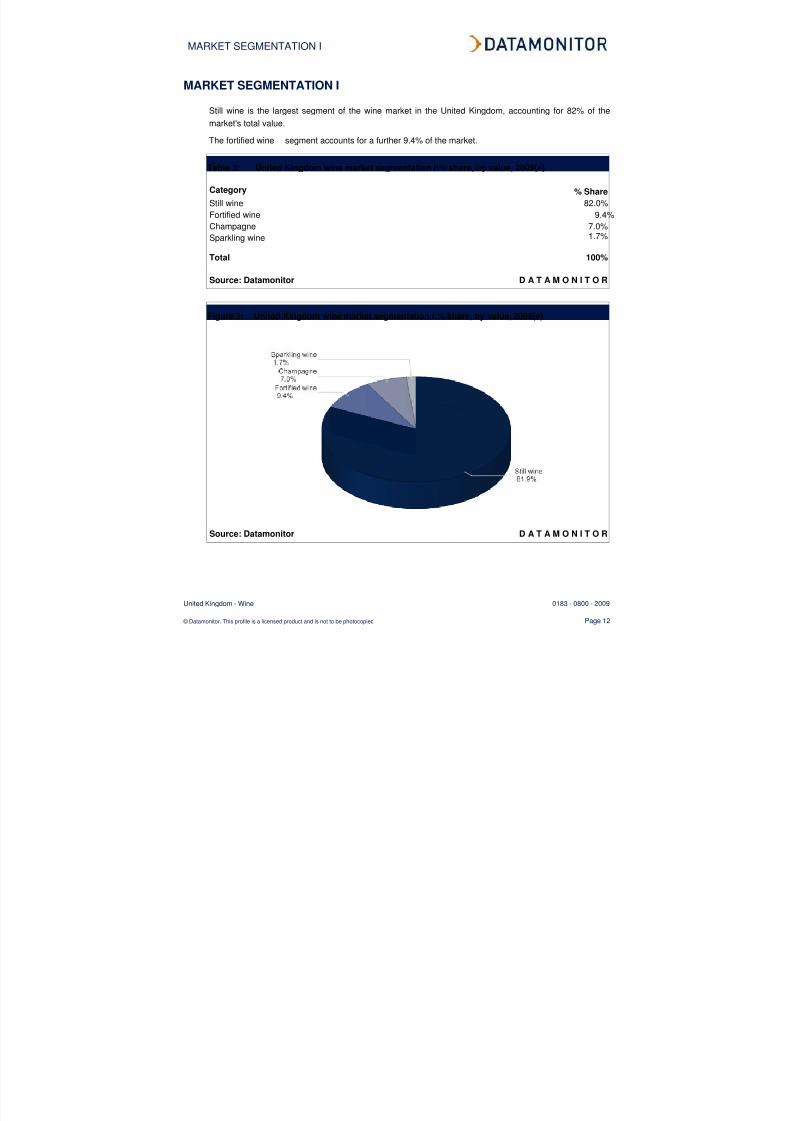
Still wine is the largest segment of the wine market in the United Kingdom, accounting for 82% of the
market's total value.
The fortified wine segment accounts for a further 9.4% of the market.
Table 3: United Kingdom wine market segmentation I:% share, by value, 2009(e)
Category % Share
Still wine 82.0%
Fortified wine 9.4%
Champagne 7.0%
Sparkling wine 1.7%
Total 100%
Source: Datamonitor D A T A M O N I T O R
Figure 3: United Kingdom wine market segmentation I:% share, by value, 2009(e)
Source: Datamonitor D A T A M O N I T O R
8/7/2019 Wine Industry Profile-United Kingdom
http://slidepdf.com/reader/full/wine-industry-profile-united-kingdom 13/40
MARKET SEGMENTATION II
United Kingdom - Wine 0183 - 0800 - 2009
© Datamonitor. This profile is a licensed product and is not to be photocopied Page 13
MARKET SEGMENTATION II
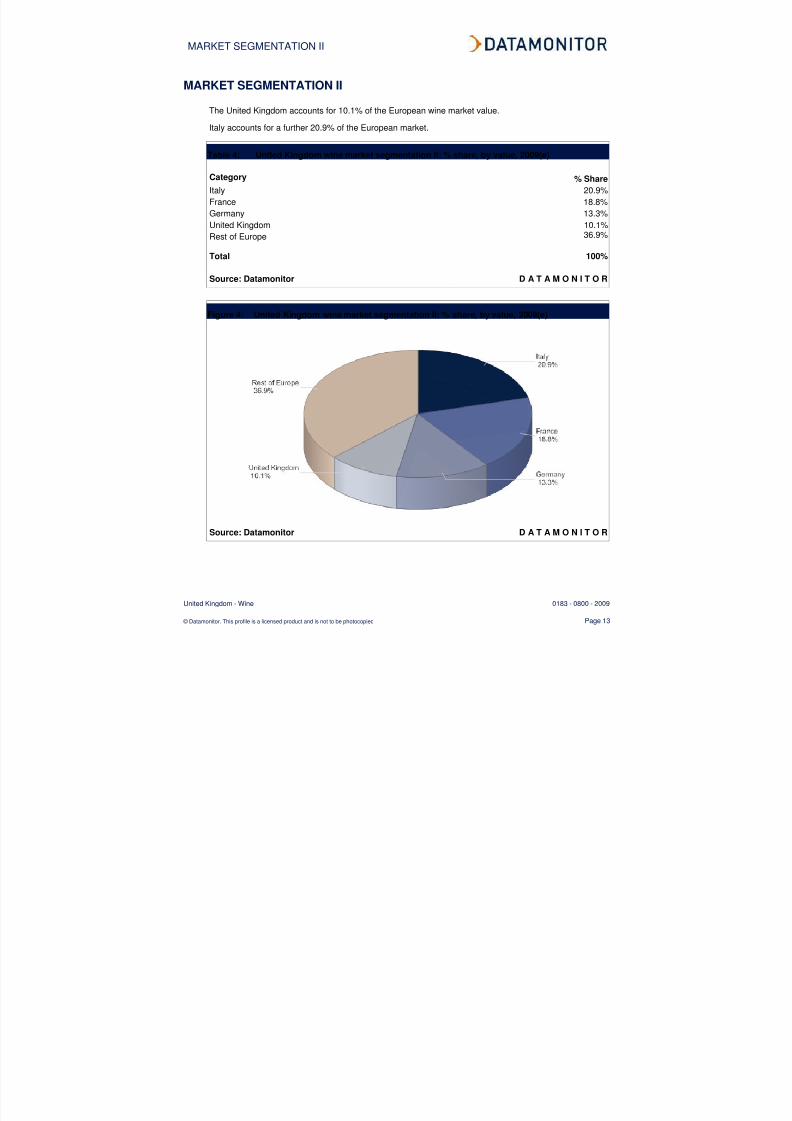
The United Kingdom accounts for 10.1% of the European wine market value.
Italy accounts for a further 20.9% of the European market.
Table 4: United Kingdom wine market segmentation II: % share, by value, 2009(e)
Category % Share
Italy 20.9%
France 18.8%
Germany 13.3%
United Kingdom 10.1%
Rest of Europe 36.9%
Total 100%
Source: Datamonitor D A T A M O N I T O R
Figure 4: United Kingdom wine market segmentation II: % share, by value, 2009(e)
Source: Datamonitor D A T A M O N I T O R
8/7/2019 Wine Industry Profile-United Kingdom
http://slidepdf.com/reader/full/wine-industry-profile-united-kingdom 14/40
MARKET SHARE
United Kingdom - Wine 0183 - 0800 - 2009
© Datamonitor. This profile is a licensed product and is not to be photocopied Page 14
MARKET SHARE
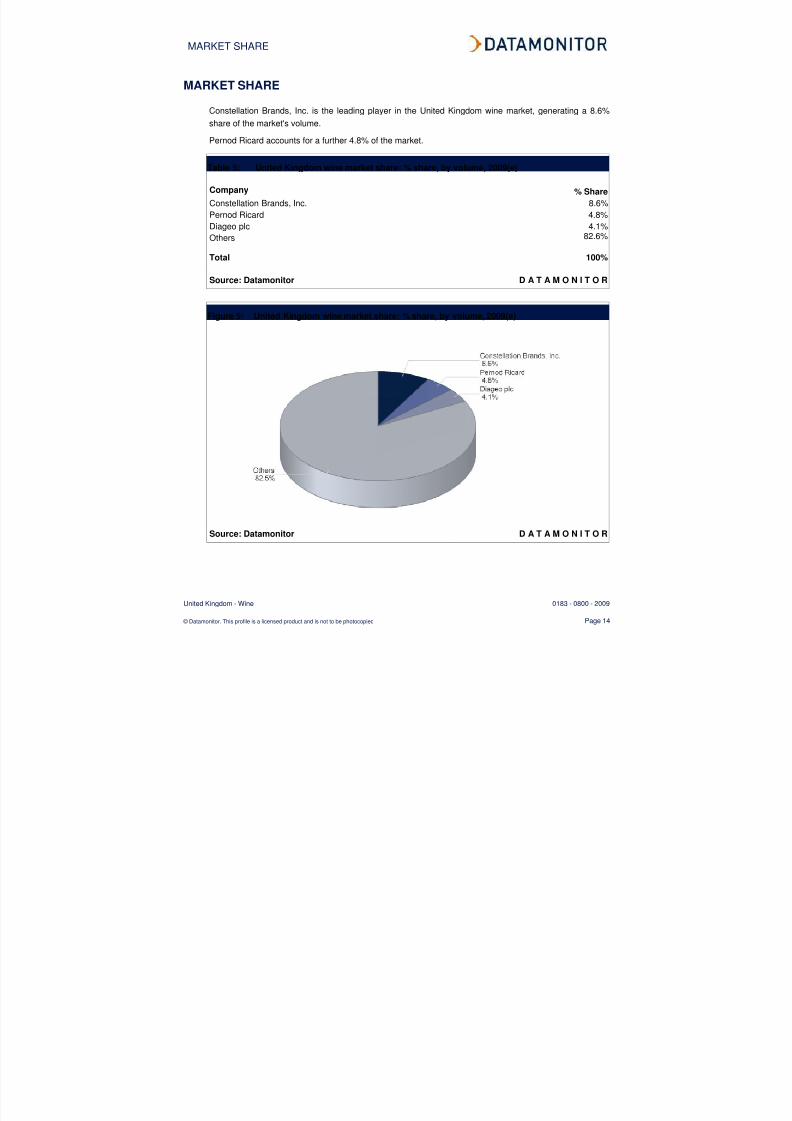
Constellation Brands, Inc. is the leading player in the United Kingdom wine market, generating a 8.6%
share of the market's volume.
Pernod Ricard accounts for a further 4.8% of the market.
Table 5: United Kingdom wine market share: % share, by volume, 2009(e)
Company % Share
Constellation Brands, Inc. 8.6%
Pernod Ricard 4.8%
Diageo plc 4.1%
Others 82.6%
Total 100%
Source: Datamonitor D A T A M O N I T O R
Figure 5: United Kingdom wine market share: % share, by volume, 2009(e)
Source: Datamonitor D A T A M O N I T O R
8/7/2019 Wine Industry Profile-United Kingdom
http://slidepdf.com/reader/full/wine-industry-profile-united-kingdom 15/40
COMPETITIVE LANDSCAPE
United Kingdom - Wine 0183 - 0800 - 2009
© Datamonitor. This profile is a licensed product and is not to be photocopied Page 15
COMPETITIVE LANDSCAPE
The wine market will be analyzed taking manufacturers of wine as players. The key buyers will be taken
as retail and on-trade companies, and independent grape growers and other raw material producers as
the key suppliers.
The UK market for wine is highly fragmented, with top three players holding a market share of 17.4% of
the total wine market by volumes. Owing to an unfavorable climate for cultivating grapes, the vast majority
of wine is imported by foreign producers, either already bottled or in bulk for bottling in the UK.
Furthermore, wine is vulnerable to the threat from its substitutes, such as spirits and beer, due to low
switching costs and various consumption patterns. The ease of market entry for new players is affected
by government regulation and high import duties applicable. There are considerable import duties and
taxes to be paid; however, this country remains a popular market. The wide range of brands available,
with an accompanying variance in quality and price, means that buyer power is prevented from becoming
disproportionately strong. The degree of rivalry is assessed to be moderate in this market.
In the UK wine market, supermarkets and hypermarkets are the main buyers, since they distribute the
majority of the market’s volume (48.1%). In the UK, there is a relatively high concentration in the food and
beverage retail market, which boosts buyer power significantly: supermarket chains are often able to
negotiate very strongly on price with wine producers. Wine producers can differentiate their products quite
strongly, for example by the overall segment (such as still or sparkling) region of origin, grape variety,
style, and so on. Furthermore, major buyers generally need to offer a wide range of wines for their own
customers which tend to weaken the buyer power. However, switching costs for buyers are not
particularly high, which increases buyer power in all markets. Furthermore, producers and buyers operate
in distinct businesses, with very little likelihood of on-trade businesses or retailers integrating backwards.
Overall, buyer power is assessed as moderate.The main inputs for wine producers in the UK and those that export to the country are grapes and bottles.
The climate in the UK is not ideal for growing grapes, although a few vineyards do exist. However, most
players will need to make wine elsewhere and import it, perhaps bottling it in the UK. Traditionally, wine
makers operated vertically-integrated businesses; harvesting and crushing grapes from their own
vineyards, then making wine from them, and then bottling it. This model is still followed by large
companies to some extent. In some cases, the company-owned vineyards are used for producing
premium wines, while third-party grapes are used for producing lower-priced products. The independents
are numerous, and include some fairly small operations, weakening supplier power. However,
independent grape growers can find alternative markets - for example, grapes are a raw material for fruit
sugar production - and integrate forward into winemaking. These factors boost supplier power.Additionally, raw material quality is highly important in this business. The end product is strongly
influenced by the nature of the grapes used. Overall, supplier power is assessed to be moderate.
Entry to the UK wine market may be achieved by starting a new company, by diversifying an existing
company's operations into winemaking or, in the case of foreign producers, by beginning to export to the
8/7/2019 Wine Industry Profile-United Kingdom
http://slidepdf.com/reader/full/wine-industry-profile-united-kingdom 16/40
COMPETITIVE LANDSCAPE
United Kingdom - Wine 0183 - 0800 - 2009
© Datamonitor. This profile is a licensed product and is not to be photocopied Page 16
country. There is very little domestic wine production in the UK, and the vast majority therefore comes
from foreign producers. All wine imported into the UK must adhere to EU legislation. This is quite
stringent, and covers issues such as labeling requirements. Wine imported from outside the EU requires a
Common Agricultural Policy import license and a VI1 document; furthermore, it is subject to import duty,
excise duty, and value-added tax. Wine imports from “third countries” (non-EU countries) also require a
CAP (Common Agricultural Policy) Import License and must be accompanied by a VI1 document to be
freely circulated. Wines from the third-country (non-EU) imports are also subject to excise duty and a
value-added tax. Regulations and import duties constitute barriers to market entry. As high quality wines
can be sold at premium prices, it is possible to enter the market on a small scale, recouping investment in
vines, production equipment, etc by adding a good margin to the price of the end product. The larger
companies, however, produce not only premium wines, but mass-market products. Here, margins may be
much lower. Producers need to distribute the wines widely, which generally involves channels such as
supermarkets. These retail chains often have considerable buyer power, which forces down the prices
that wine producers can obtain. Overall, there is a weak likelihood of new entrants.
The main substitutes for wine are other alcoholic beverages, such as spirits and beer. From the point of
view of retailers or on-trade businesses, the switching costs are not high, and the per-unit-volume prices
may be higher (for spirits) or lower (for beers). It is also difficult to be conclusive about the benefits of the
alternatives: for example, not only beer but also champagne and white wine are optimally stored in chilled
cabinets, which makes them more expensive to store; more concentrated forms of alcohol (spirits) may
offer better returns on shelf space than higher-volume wines and beers. Some on-trade establishments,
such as restaurants, would find it difficult to operate without selling wine; others, for example pubs and
clubs targeting particular demographics, are strongly focused on beers and spirits. From the point of view
of the consumer, there are some differences between the ways different alcoholic beverages are used
(champagne as a signifier of celebration, and so on), but many consumption decisions are a matter of
personal taste – this makes wine vulnerable to the threat of other alcoholic beverages. Overall, there is a
strong threat from substitutes.
The UK wine market is highly fragmented, with the top three players holding an aggregate share of 17.4%
of the total market by volume. Wine is a highly differentiated product with variety of brands available in the
market, which may be intimidating to some consumers due to the lack of consumer orientation. Some
wine producers, i.e. Bacardi and Diageo, have began to introduce brand management and modern
merchandising by launching bold brands, label designs and marketing campaigns in order to become
more identifiable with the public. Purchasers have a very wide range of wines to choose from with low
switching costs. These factors tend to intensify rivalry. Major players may offer premium wines, but much
of their business involves mass-market products. This implies high fixed costs, because of the need to
operate large winemaking plants. These factors boost rivalry, which is assessed as moderate overall.
8/7/2019 Wine Industry Profile-United Kingdom
http://slidepdf.com/reader/full/wine-industry-profile-united-kingdom 17/40
LEADING COMPANIES
United Kingdom - Wine 0183 - 0800 - 2009
© Datamonitor. This profile is a licensed product and is not to be photocopied Page 17
LEADING COMPANIES
Constellation Brands Inc.
Table 6: Constellation Brands Inc.: key facts
Head office: 207 High Point Drive, Building 100, Victor, New York 14564, USA
Telephone: 1 585 678 7100
Fax:
Local office: Constellation House, The Guildway, Old Portsmouth Road, Guildford,Surrey GU3 1LR, GBR
Telephone: 44 1483 690 000
Website: www.cbrands.com
Financial year-end: February
Ticker: STZ
Stock exchange: New York
Source: company website D A T A M O N I T O R
Constellation Brands is engaged in the production and marketing of alcoholic beverages with a portfolio of
wine, spirits, imported beers and other beverage alcohol products. The company also exports wine to
Australia and New Zealand, and operates as a producer and independent drinks wholesaler in the UK.
The company conducts its business through its wholly-owned entities as well as through joint ventures
with various other entities, both within and outside the US. Constellation Brands operates 45 facilities
across the world and sells its products in about 150 countries. It operates 19 wineries in the US, 11wineries in Australia. The company also has 10 wineries in Canada, four wineries in New Zealand and
one winery in South Africa. It is headquartered in New York, US and employs about 6,600 people
worldwide.
Constellation Brands operates its business activities through three business segments: Constellation
Wines, Constellation Spirits and Crown Imports (earlier Constellation Beers).
Constellation Wines sells a number of wine brands across all categories including table wine, sparkling
wine and dessert wine. Its portfolio of super-premium and fine wines is supported by vineyard holdings in
the US, Canada, Australia and New Zealand. In the US, Constellation Wines sells 24 wine brands. In
Canada, it sells wine across all price points, and sells five wine brands including the leading Icewine
brand with Inniskillin. Constellation Wines' wine brands include Robert Mondavi Winery, Inniskillin, Simi,
Franciscan Oakville Estate, Kim Crawford, Estancia, Toasted Head, Ravenswood, Jackson-Triggs,
Kumala, Woodbridge by Robert Mondavi, Vendange, Arbor Mist, Almaden, and Stowells. The segment
8/7/2019 Wine Industry Profile-United Kingdom
http://slidepdf.com/reader/full/wine-industry-profile-united-kingdom 18/40
LEADING COMPANIES
United Kingdom - Wine 0183 - 0800 - 2009
© Datamonitor. This profile is a licensed product and is not to be photocopied Page 18
also produces and markets cider brands like Blackthorn and Gaymer's Olde English. It also produces and
sells wine kits and beverage alcohol refreshment coolers in Canada.
Constellation Spirits segment produces, bottles, imports and markets a diversified line of distilled spirits.
The majority of the segment's distilled spirits unit volume consists of products marketed in the value and
mid-premium priced category. The company's principal distilled spirits brands include Black Velvet, Chi-
Chi's prepared cocktails, Barton, Skol, Fleischmann's, Canadian LTD, Montezuma, Ten High, Mr. Boston
and Inver House. Its premium spirits brands include Black Velvet Reserve, the 99Schnapps family, Effen
Vodka, 1792 Ridgemont Reserve, Meukow Cognac, Cocktails by Jenn, Monte Alban, Danfield's, di
Amore, Caravella, Balblair, Old Pulteney and Speyburn. The segment also acquired Swedish Vodka
brand, Svedka in March 2007. In UK, the company operates two facilities that produce wine and cider and
sells eight table wine brands in the country.
The ‘Constellation beers’ segment was renamed as 'Crown Imports' segment, after the company
completed Crown Imports joint venture with Modelo in early 2007. Constellation Brands and Modelo haveequal interest in Crown Imports and import, market and sell Corona Extra, Corona Light, Coronita, Modelo
Especial, Pacifico, Negra Modelo, St. Pauli Girl and Tsingtao beer brands in all 50 states of the US.
Key Metrics
Constellation Brands generated revenues of $3.4 billion in the financial year (FY) ended February 2010, a
decrease of 7.9% over 2009. The company reported a net income of $99.3 million in FY2010, as
compared to a net loss of $301.4 million in FY2009. The decline in sales was primarily due to the impact
of the value spirits divestiture and the unfavorable impact of year-over-year currency exchange rate
fluctuations.
The Constellation Wines segment recorded revenues of $2.9 billion in FY2010, a decrease of 2.9% as
compared to 2009.
Europe accounted for 18.5% of the total revenues in FY2010. Revenues from Europe reached $622
million in 2010, a decrease of 4.1% over 2009.
8/7/2019 Wine Industry Profile-United Kingdom
http://slidepdf.com/reader/full/wine-industry-profile-united-kingdom 19/40
LEADING COMPANIES
United Kingdom - Wine 0183 - 0800 - 2009
© Datamonitor. This profile is a licensed product and is not to be photocopied Page 19
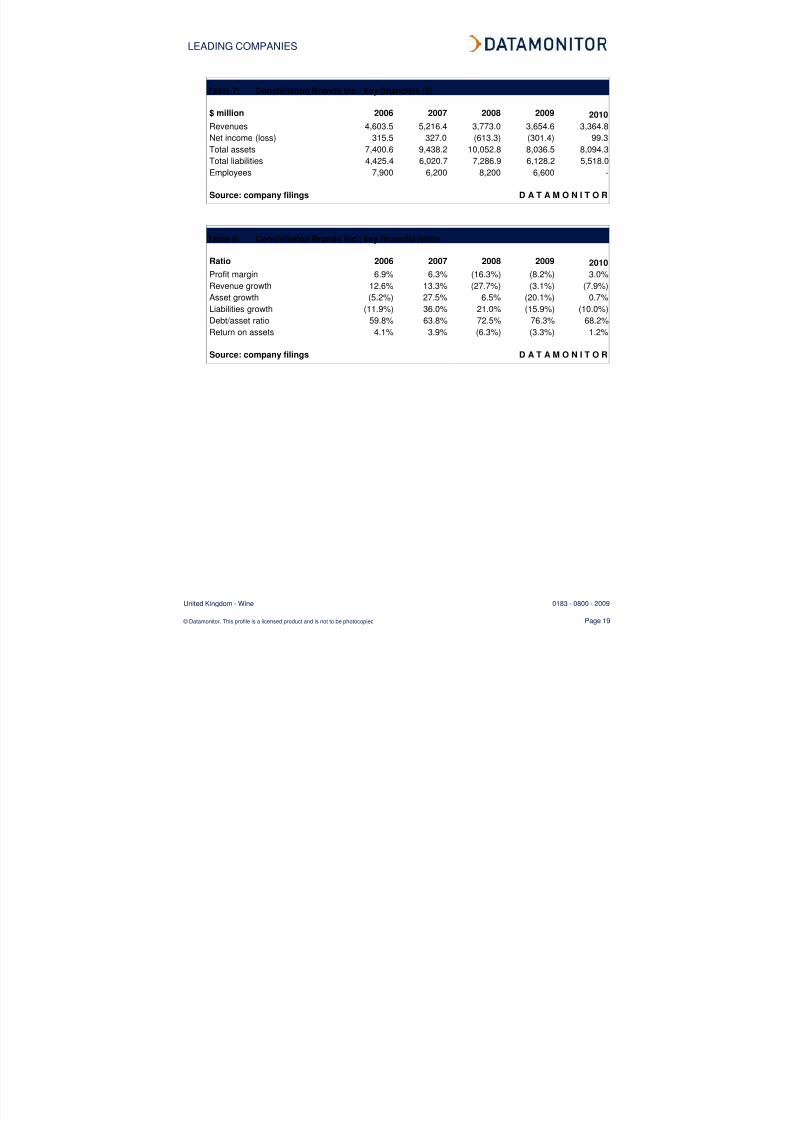
Table 7: Constellation Brands Inc.: key financials ($)
$ million 2006 2007 2008 2009 2010
Revenues 4,603.5 5,216.4 3,773.0 3,654.6 3,364.8Net income (loss) 315.5 327.0 (613.3) (301.4) 99.3
Total assets 7,400.6 9,438.2 10,052.8 8,036.5 8,094.3
Total liabilities 4,425.4 6,020.7 7,286.9 6,128.2 5,518.0
Employees 7,900 6,200 8,200 6,600 -
Source: company filings D A T A M O N I T O R
Table 8: Constellation Brands Inc.: key financial ratios
Ratio 2006 2007 2008 2009 2010Profit margin 6.9% 6.3% (16.3%) (8.2%) 3.0%
Revenue growth 12.6% 13.3% (27.7%) (3.1%) (7.9%)
Asset growth (5.2%) 27.5% 6.5% (20.1%) 0.7%
Liabilities growth (11.9%) 36.0% 21.0% (15.9%) (10.0%)
Debt/asset ratio 59.8% 63.8% 72.5% 76.3% 68.2%
Return on assets 4.1% 3.9% (6.3%) (3.3%) 1.2%
Source: company filings D A T A M O N I T O R
8/7/2019 Wine Industry Profile-United Kingdom
http://slidepdf.com/reader/full/wine-industry-profile-united-kingdom 20/40
LEADING COMPANIES
United Kingdom - Wine 0183 - 0800 - 2009
© Datamonitor. This profile is a licensed product and is not to be photocopied Page 20
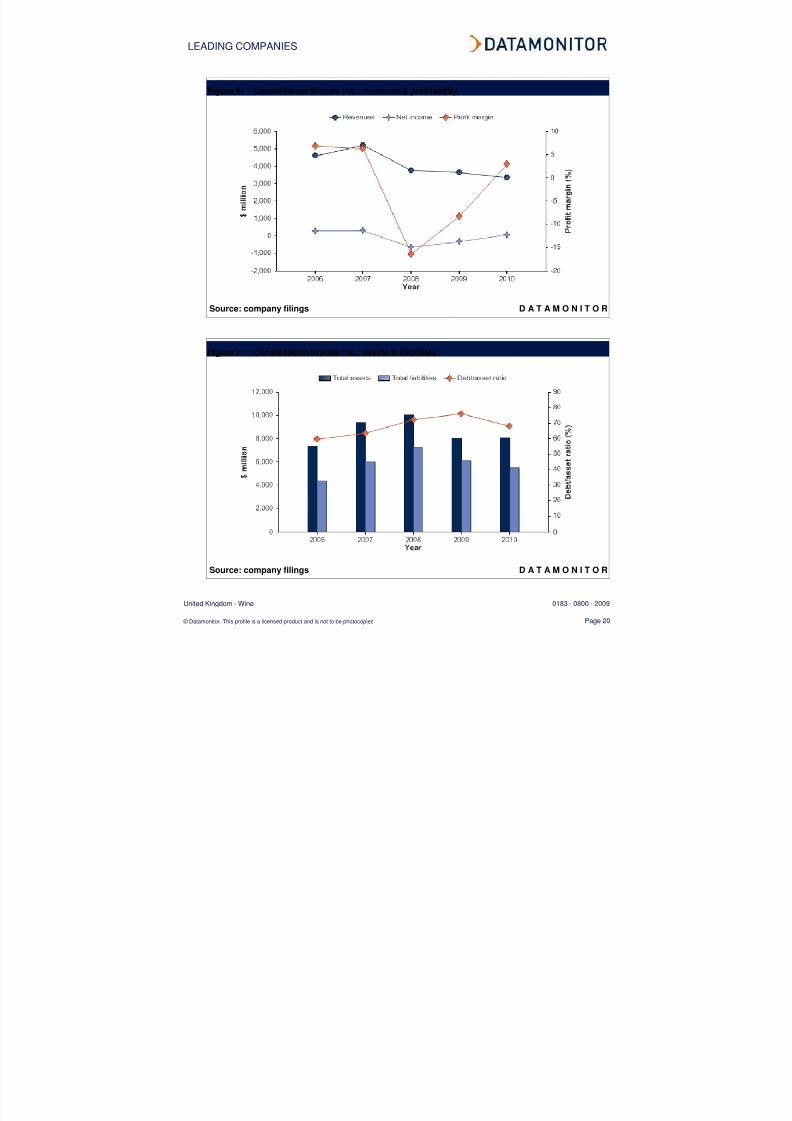
Figure 6: Constellation Brands Inc.: revenues & profitability
Source: company filings D A T A M O N I T O R
Figure 7: Constellation Brands Inc.: assets & liabilities
Source: company filings D A T A M O N I T O R
8/7/2019 Wine Industry Profile-United Kingdom
http://slidepdf.com/reader/full/wine-industry-profile-united-kingdom 21/40
LEADING COMPANIES
United Kingdom - Wine 0183 - 0800 - 2009
© Datamonitor. This profile is a licensed product and is not to be photocopied Page 21
Diageo plc
Table 9: Diageo plc: key facts
Head office: 8 Henrietta Place, London W1G 0NB, GBR
Telephone: 44 207 927 5200
Fax: 44 207 927 4600
Local office:
Website: www.diageo.com
Financial year-end: June
Ticker: DGE
Stock exchange: London
Source: company website D A T A M O N I T O R
Diageo produces and distributes branded premium spirits, beer and wine. The company is engaged in a
range of activities within the beverage alcohol industry. Its operations include producing, distilling,
brewing, bottling, packaging, distributing, developing and marketing branded alcohol beverages in more
than 180 territories around the world. Diageo produces and distributes premium brands such as Smirnoff
vodka, Johnnie Walker Scotch whiskies, Guinness stout, Baileys Original Irish Cream liqueur, Captain
Morgan rum, J&B Scotch whisky and Tanqueray gin. In addition, it owns the distribution rights for the
Jose Cuervo tequila brands in the US and other countries.
Diageo operates through six business segments: Europe, North America, International, Asia Pacific, Moet
Hennessy, and corporate and other.
In the European segment, Diageo covers the UK, Ireland, Hungary, Northern Europe, Southern and
Eastern Europe, Iberia, and Russia. In the UK, Diageo markets its products via three business units:
Diageo GB (spirits, beer and ready to drink), Percy Fox & Co (wines) and Justerini & Brooks Retail
(private client wines). The products are distributed both via independent wholesalers and directly to the
major grocers, convenience and specialist stores. In the 'on trade' (licensed major bars and restaurants)
segment, products are sold through major brewers, multiple retail groups and smaller regional
independent brewers and wholesalers. In Ireland, Diageo sells and distributes directly to both the on trade
and the off trade (retail shops and wholesalers) through a telesales operation, extensive sales calls to
outlets and third party logistics providers. Diageo also markets its alcohol brands across spirits, wine and
beer categories in the UK. The key brands offered in the UK market include Guinness, Baileys, Bell's,
Gordon's, Pimms, Smirnoff and Blossom Hill.
8/7/2019 Wine Industry Profile-United Kingdom
http://slidepdf.com/reader/full/wine-industry-profile-united-kingdom 22/40
LEADING COMPANIES
United Kingdom - Wine 0183 - 0800 - 2009
© Datamonitor. This profile is a licensed product and is not to be photocopied Page 22
In June 2008, Diageo completed the acquisition of Netherland based Ketel One Worldwide BV (KOW), a
50:50 company with the Nolet Group, owners of the Ketel One brand. The company owns the exclusive
and perpetual global rights to market and distribute Ketel One vodka products, including Ketel One vodka,
and Ketel One Citroen vodka.
In the North American segment, Diageo markets its products through four operating units: US Spirits,
Diageo-Guinness USA, Diageo Chateau & Estates Wine Company, and Diageo Canada. Through its
Diageo Chateau & Estate Wines unit, Diageo owns and operates vineyards in the states of California and
Washington.
In the international segment, Diageo covers Latin America, the Caribbean, Africa and the Middle East. In
Latin America and the Caribbean, distribution is done through a mixture of Diageo companies and third
party distributors. In Africa, the company distributes either through subsidiaries or under license. In the
Middle East, distribution is achieved mainly through third party distributors. In May 2008, Diageo formed a
new venture, called DHN Drinks (Pty) Limited, with Heineken and Namibia Breweries Limited (NBL) fortheir combined beer, cider and ready to drink businesses in South Africa.
Diageo's Asia Pacific segment comprises India, China, South Korea, Japan and other Asian markets;
Australia and New Zealand. Diageo works with a number of joint venture partners in Asia Pacific. Diageo
maintains a joint venture agreement with Moet Hennessy to distribute the majority of its spirits and wine
brands in Singapore, Malaysia, Hong Kong, China, Thailand and Japan. In Australia, Diageo has its own
production and distribution company, which handles the majority of products sold in the Australian market.
It also has production and distribution arrangements with VOK Beverages and a licensed brewing
arrangement with Fosters.
Diageo also has a distribution agreement with third party distributors for the distribution of certain spirits
brands in the People's Republic of China. In South Korea, Diageo's own Distribution Company distributes
the majority of Diageo's brands. In Japan, Guinness beer is distributed through a joint venture company
with Sapporo Breweries. In Malaysia, Diageo's own and third party beers are distributed by a listed
business (Guinness Anchor Berhad) in which Diageo and its partner, Asia Pacific Breweries, have a
majority share through a jointly controlled joint venture company. In Singapore, Asia Pacific Breweries
distributes Diageo's beer brands.
Diageo has 34% equity interest in Moet Hennessy, the spirits and wine subsidiary of LVMH Moet
Hennessy – Louis Vuitton. Moet Hennessy is a producer and exporter of a number of brands in its main
business areas of champagne and cognac. Its principal champagne brands are Moet & Chandon(including Dom Perignon), Veuve Clicquot and Mercier.
Diageo's corporate and other segment include costs of the business service centre and other corporate
costs which cannot be directly allocated to any of the geographical units. Also included in this segment
are the revenues and costs related to rents receivable in respect of properties not used by Diageo in the
8/7/2019 Wine Industry Profile-United Kingdom
http://slidepdf.com/reader/full/wine-industry-profile-united-kingdom 23/40
LEADING COMPANIES
United Kingdom - Wine 0183 - 0800 - 2009
© Datamonitor. This profile is a licensed product and is not to be photocopied Page 23
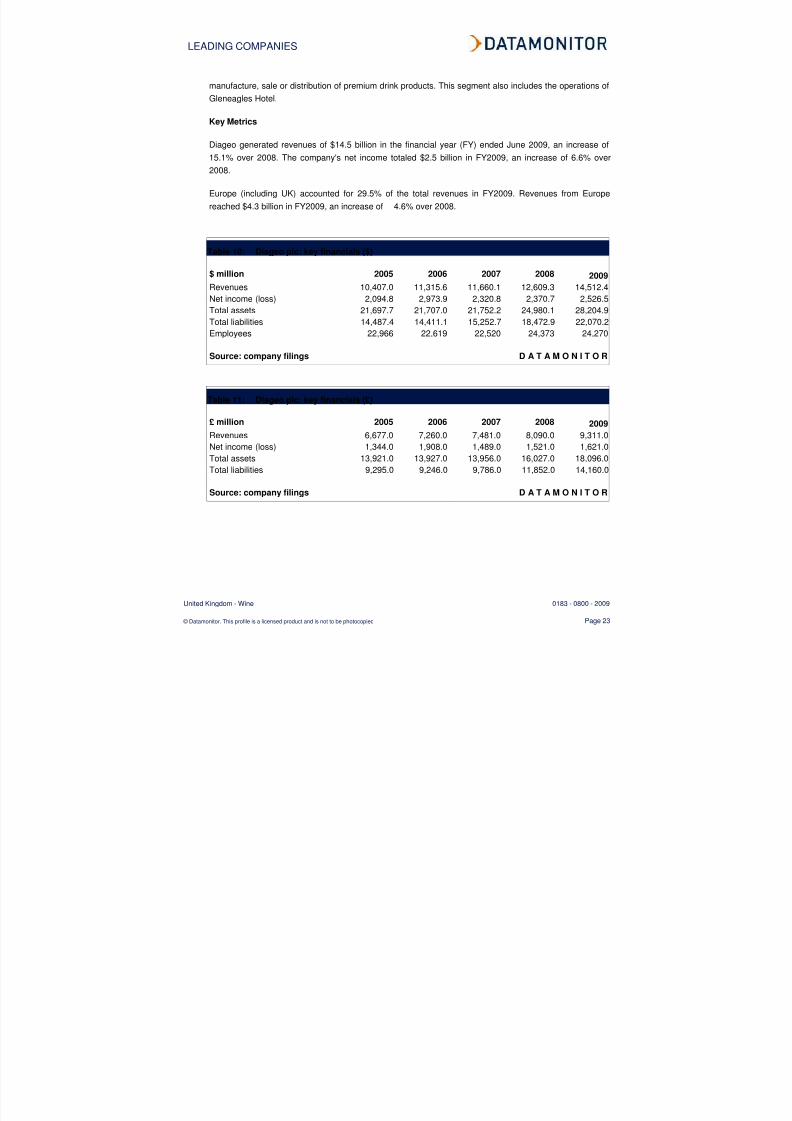
manufacture, sale or distribution of premium drink products. This segment also includes the operations of
Gleneagles Hotel.
Key Metrics
Diageo generated revenues of $14.5 billion in the financial year (FY) ended June 2009, an increase of
15.1% over 2008. The company's net income totaled $2.5 billion in FY2009, an increase of 6.6% over
2008.
Europe (including UK) accounted for 29.5% of the total revenues in FY2009. Revenues from Europe
reached $4.3 billion in FY2009, an increase of 4.6% over 2008.
Table 10: Diageo plc: key financials ($)
$ million 2005 2006 2007 2008 2009
Revenues 10,407.0 11,315.6 11,660.1 12,609.3 14,512.4
Net income (loss) 2,094.8 2,973.9 2,320.8 2,370.7 2,526.5
Total assets 21,697.7 21,707.0 21,752.2 24,980.1 28,204.9
Total liabilities 14,487.4 14,411.1 15,252.7 18,472.9 22,070.2
Employees 22,966 22,619 22,520 24,373 24,270
Source: company filings D A T A M O N I T O R
Table 11: Diageo plc: key financials (£)
£ million 2005 2006 2007 2008 2009
Revenues 6,677.0 7,260.0 7,481.0 8,090.0 9,311.0
Net income (loss) 1,344.0 1,908.0 1,489.0 1,521.0 1,621.0
Total assets 13,921.0 13,927.0 13,956.0 16,027.0 18,096.0
Total liabilities 9,295.0 9,246.0 9,786.0 11,852.0 14,160.0
Source: company filings D A T A M O N I T O R

8/7/2019 Wine Industry Profile-United Kingdom
http://slidepdf.com/reader/full/wine-industry-profile-united-kingdom 24/40
LEADING COMPANIES
United Kingdom - Wine 0183 - 0800 - 2009
© Datamonitor. This profile is a licensed product and is not to be photocopied Page 24
Table 12: Diageo plc: key financial ratios
Ratio 2005 2006 2007 2008 2009
Profit margin 20.1% 26.3% 19.9% 18.8% 17.4%Revenue growth (24.9%) 8.7% 3.0% 8.1% 15.1%
Asset growth (1.2%) N.M 0.2% 14.8% 12.9%
Liabilities growth (6.2%) (0.5%) 5.8% 21.1% 19.5%
Debt/asset ratio 66.8% 66.4% 70.1% 74.0% 78.2%
Return on assets 9.6% 13.7% 10.7% 10.1% 9.5%
Revenue per employee $453,146 $500,271 $517,766 $517,347 $597,956
Profit per employee $91,213 $131,476 $103,055 $97,266 $104,101
Source: company filings D A T A M O N I T O R
Figure 8: Diageo plc: revenues & profitability
Source: company filings D A T A M O N I T O R
8/7/2019 Wine Industry Profile-United Kingdom
http://slidepdf.com/reader/full/wine-industry-profile-united-kingdom 25/40
LEADING COMPANIES
United Kingdom - Wine 0183 - 0800 - 2009
© Datamonitor. This profile is a licensed product and is not to be photocopied Page 25
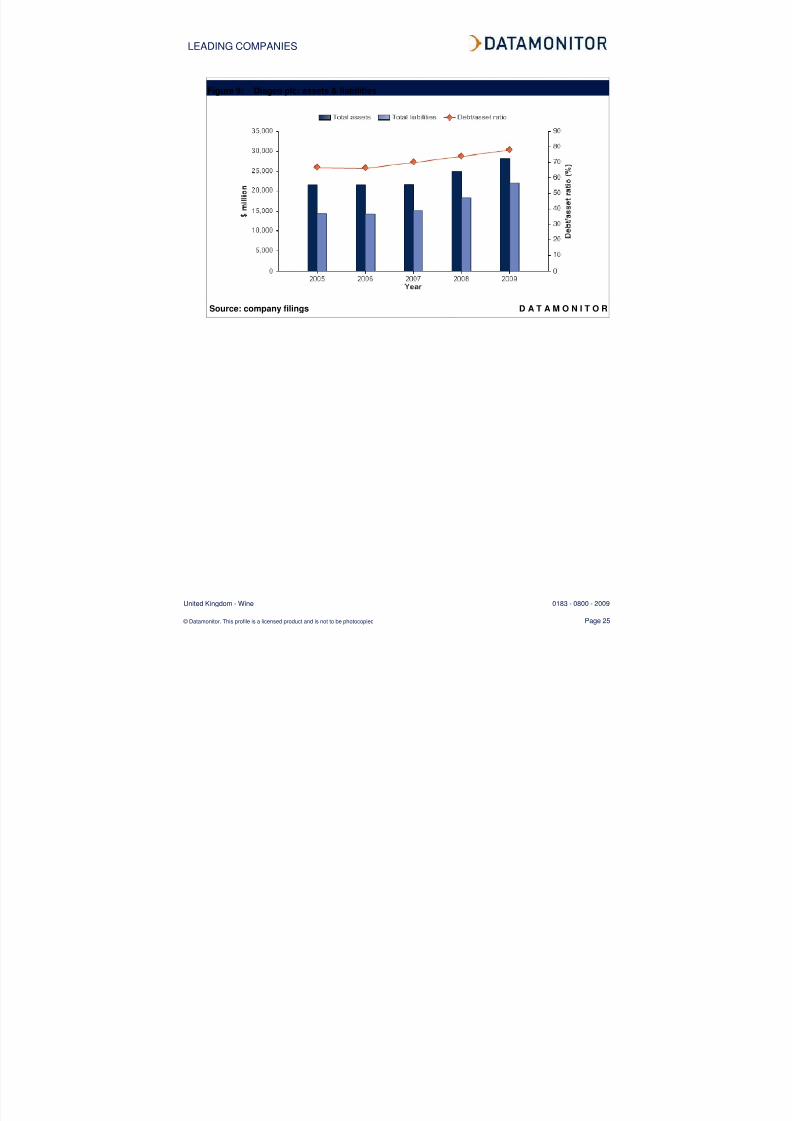
Figure 9: Diageo plc: assets & liabilities
Source: company filings D A T A M O N I T O R
8/7/2019 Wine Industry Profile-United Kingdom
http://slidepdf.com/reader/full/wine-industry-profile-united-kingdom 26/40
LEADING COMPANIES
United Kingdom - Wine 0183 - 0800 - 2009
© Datamonitor. This profile is a licensed product and is not to be photocopied Page 26
Pernod Ricard
Table 13: Pernod Ricard: key facts
Head office: 12, place des Etats-Unis, 75116 Paris, FRA
Telephone: 33 1 41004100
Fax: 33 1 41004141
Local office: Central House, 3 Lampton Road, Hounslow, Middlesex, TW3 1HY,GBR
Telephone: 44 208 538 4484
Website: www.pernod-ricard.com
Financial year-end: June
Ticker: RI
Stock exchange: Paris
Source: company website D A T A M O N I T O R
Pernod Ricard is a producer and distributor of wines and spirits. The company has 113 production sites
operates in 25 countries across the Americas, Europe and the Asia Pacific. These sites include 65
bottling and 33 distillation facilities, while the others cover ageing, vinification and vatting operations. In
addition to these production facilities, the group also owns office buildings and farmlands, including nearly
8,000 hectares of vineyards, located primarily in Australia, New Zealand, Spain, Argentina and France.
Pernod Ricard operates through a holding company structure. The group is organized into a holding
company and subsidiaries. The holding company focuses on strategic management and monitoring of the
group's business activities, while the subsidiaries are responsible for taking operational decisions.
The group divides its operations into four primary segments constituted by the following geographic
regions: France, Europe, the Americas and Asia/Rest of the World.
Pernod Ricard is one of the leading provider of spirits, and the fourth largest manufacturer of wines. The
company's spirit products include a range of whiskies, anise drinks, liqueurs, cognacs and brandies, white
spirits and rums, and bitters. The wine products include different varieties of wines and champagnes. The
group owns 15 strategic brands and 30 leading local brands, It sold 51.5 million cases of whiskies,
cognac, champagne under its 15 strategic brands in 2009.
The group is the leading whiskey manufacturer in the world, offering a complete range of Scotch; Scotch
malt; Irish; Bourbon; Canadian; and other local whiskies. The important Whiskey brands of the group
include Chivas Regal (Scotch whiskey), Ballantine’s (Scotch Whiskey), Clan Campbell (Scotch), Imperial
(Scotch Blended), The Glenlivet (Scotch malt), Beefeater (distilled gin), Jameson (Irish whiskey), wisers
(Canadian Whiskey), Blenders Pride (other local Whiskey), and Royal Stag (Other Whiskey).
8/7/2019 Wine Industry Profile-United Kingdom
http://slidepdf.com/reader/full/wine-industry-profile-united-kingdom 27/40
LEADING COMPANIES
United Kingdom - Wine 0183 - 0800 - 2009
© Datamonitor. This profile is a licensed product and is not to be photocopied Page 27
Pernod Ricard is the largest manufacturer of anis-based drinks in the world. These spirits are produced
using natural extracts of star anise, green anise, fennel or any other anise plant. The group's anise drinks
division has five brands in its portfolio. Ricard is the sixth largest spirits brand worldwide and the largest
selling spirits brand in France, Belgium and Luxembourg. The other anise-based drink brands include
Pastis 51, Pernod and Ouzo Mini.
Pernod Ricard is the second largest producer of liqueurs (a sweet alcoholic beverage, produced by
distillation, maceration or infusion of fruits or plants). The group’s key liqueur brands include Malibu
(coconut flavored rums sold in more than 150 countries); Kahlua (leading coffee liqueur brand in the
world). The other liqueur brands of the group include Tia Maria, Hiram Walker, Soho, Dita, Zoco,
Ruavieja, Cusenier. The group is leading provider of cognacs & brandies (wine-based spirits). The
group’s key cognac brands include Martell, Bisquit and Renault. Pernod Ricard offers varied line of
brandies, under Presidente, Ararat, Anejo Los Reyes, and Don Pedro brands.
Pernod Ricard is the second largest producer of White spirits and rums, offering a complete range ofrums, Tequilas, gins, and vodkas. The key brands of the group in this segment include Havana Club rum,
Olmeca Tezon, Viuda de Romero, Zubrowka, Lodowa, Montilla, Seagram’s gin and Beefeater gin. The
group is also the third leading player of bitter drinks (spirits flavored with bitter plants). The group owns
the brands Suze and Amaro Ramazzotti, produced in France and Italy respectively. The other brands of
the group include Gammel Dansk Bitter Dram, Fernet Capri, and Becherovka.
In the UK, the key brands of the group include Chivas Regal, Jameson, Havana Club, Jacob's Creek, and
Ballantine’s. In 2008, Pernod Ricard acquired Vin & Sprit. The transaction was valued at approximately $8
billion. The acquisition of V&S enabled Pernod Ricard to acquire Absolut, a premium vodka brand. The
group awarded distribution rights to Central European Distribution for marketing its Zubrowka vodka
brand in the UK.
The group produces wines in five strategic origins including Australia, New Zealand, Spain, Argentina and
France. The wine categories include still and sparkling wines; wine-based aperitifs; and natural sweet
wines. The group owns the Australian Jacob's Creek brand, which has annual sales of over five million
cases. The other important wine brands of the group include Montana, Dubonnet, Church Road,
Australian Wyndham Estate, the Argentinean Etchart and the South African Long Mountain wines, as well
as the Spanish wine Palacio de la Vega. The group also offers champagnes in more than 100 countries
under Mumm and Perrier-Jouet brand names.
Key Metrics
Pernod Ricard generated revenues of $10 billion in the financial year (FY) ended June 2009, an increase
of 9.3% over 2008. The company's net income totaled $1.3 billion in FY2009, an increase of 12.5% over
2008.
8/7/2019 Wine Industry Profile-United Kingdom
http://slidepdf.com/reader/full/wine-industry-profile-united-kingdom 28/40
LEADING COMPANIES
United Kingdom - Wine 0183 - 0800 - 2009
© Datamonitor. This profile is a licensed product and is not to be photocopied Page 28
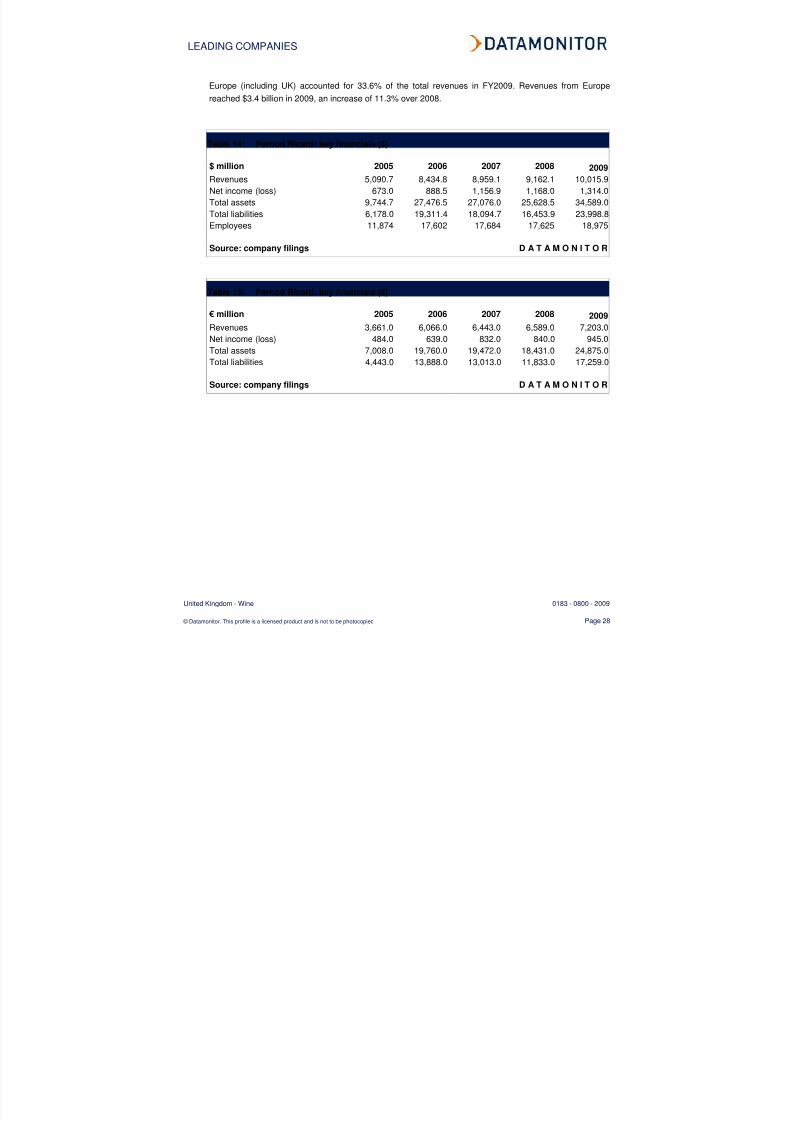
Europe (including UK) accounted for 33.6% of the total revenues in FY2009. Revenues from Europe
reached $3.4 billion in 2009, an increase of 11.3% over 2008.
Table 14: Pernod Ricard: key financials ($)
$ million 2005 2006 2007 2008 2009
Revenues 5,090.7 8,434.8 8,959.1 9,162.1 10,015.9
Net income (loss) 673.0 888.5 1,156.9 1,168.0 1,314.0
Total assets 9,744.7 27,476.5 27,076.0 25,628.5 34,589.0
Total liabilities 6,178.0 19,311.4 18,094.7 16,453.9 23,998.8
Employees 11,874 17,602 17,684 17,625 18,975
Source: company filings D A T A M O N I T O R
Table 15: Pernod Ricard: key financials (€)
€ million 2005 2006 2007 2008 2009
Revenues 3,661.0 6,066.0 6,443.0 6,589.0 7,203.0
Net income (loss) 484.0 639.0 832.0 840.0 945.0
Total assets 7,008.0 19,760.0 19,472.0 18,431.0 24,875.0
Total liabilities 4,443.0 13,888.0 13,013.0 11,833.0 17,259.0
Source: company filings D A T A M O N I T O R
8/7/2019 Wine Industry Profile-United Kingdom
http://slidepdf.com/reader/full/wine-industry-profile-united-kingdom 29/40
LEADING COMPANIES
United Kingdom - Wine 0183 - 0800 - 2009
© Datamonitor. This profile is a licensed product and is not to be photocopied Page 29
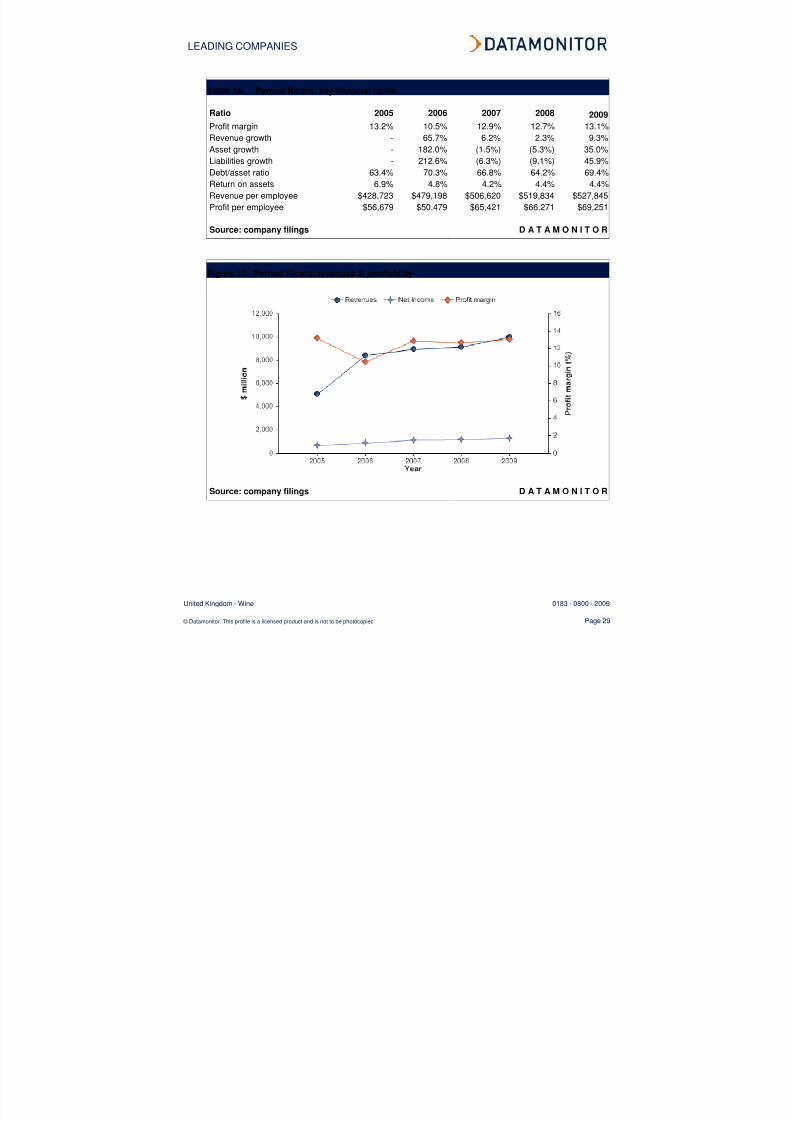
Table 16: Pernod Ricard: key financial ratios
Ratio 2005 2006 2007 2008 2009
Profit margin 13.2% 10.5% 12.9% 12.7% 13.1%Revenue growth - 65.7% 6.2% 2.3% 9.3%
Asset growth - 182.0% (1.5%) (5.3%) 35.0%
Liabilities growth - 212.6% (6.3%) (9.1%) 45.9%
Debt/asset ratio 63.4% 70.3% 66.8% 64.2% 69.4%
Return on assets 6.9% 4.8% 4.2% 4.4% 4.4%
Revenue per employee $428,723 $479,198 $506,620 $519,834 $527,845
Profit per employee $56,679 $50,479 $65,421 $66,271 $69,251
Source: company filings D A T A M O N I T O R
Figure 10: Pernod Ricard: revenues & profitability
Source: company filings D A T A M O N I T O R
8/7/2019 Wine Industry Profile-United Kingdom
http://slidepdf.com/reader/full/wine-industry-profile-united-kingdom 30/40
LEADING COMPANIES
United Kingdom - Wine 0183 - 0800 - 2009
© Datamonitor. This profile is a licensed product and is not to be photocopied Page 30
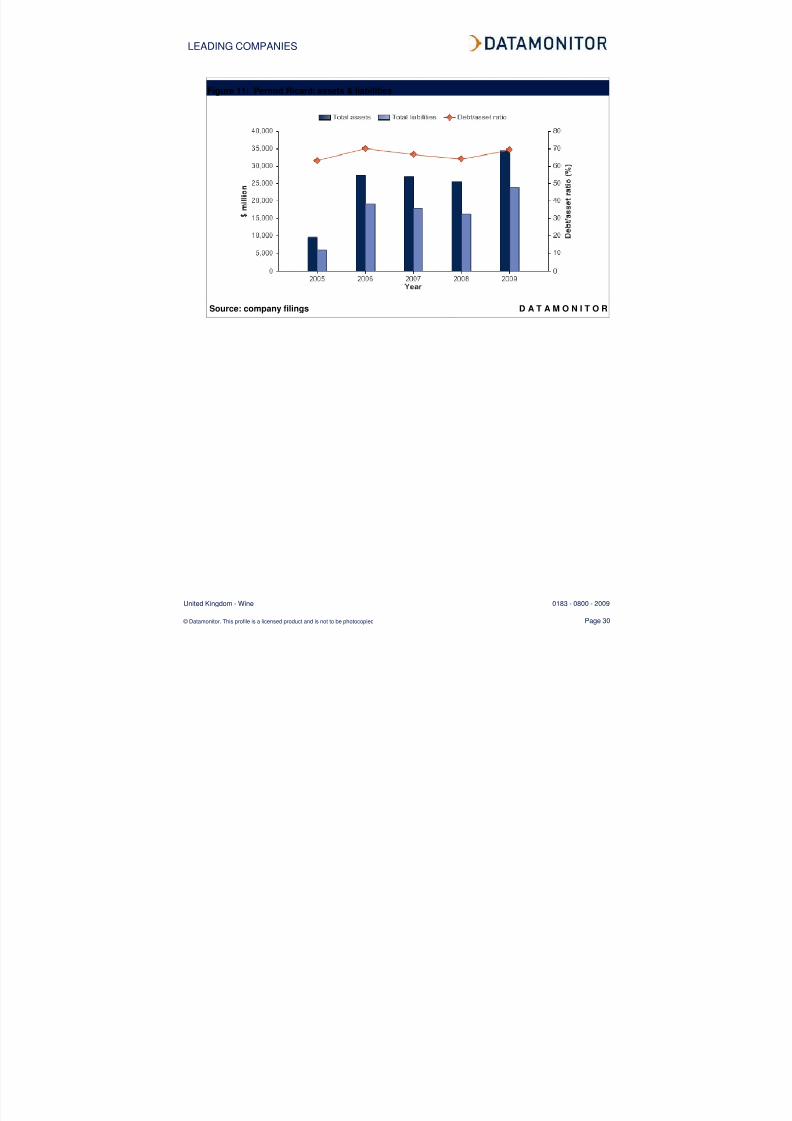
Figure 11: Pernod Ricard: assets & liabilities
Source: company filings D A T A M O N I T O R
8/7/2019 Wine Industry Profile-United Kingdom
http://slidepdf.com/reader/full/wine-industry-profile-united-kingdom 31/40
DISTRIBUTION
United Kingdom - Wine 0183 - 0800 - 2009
© Datamonitor. This profile is a licensed product and is not to be photocopied Page 31
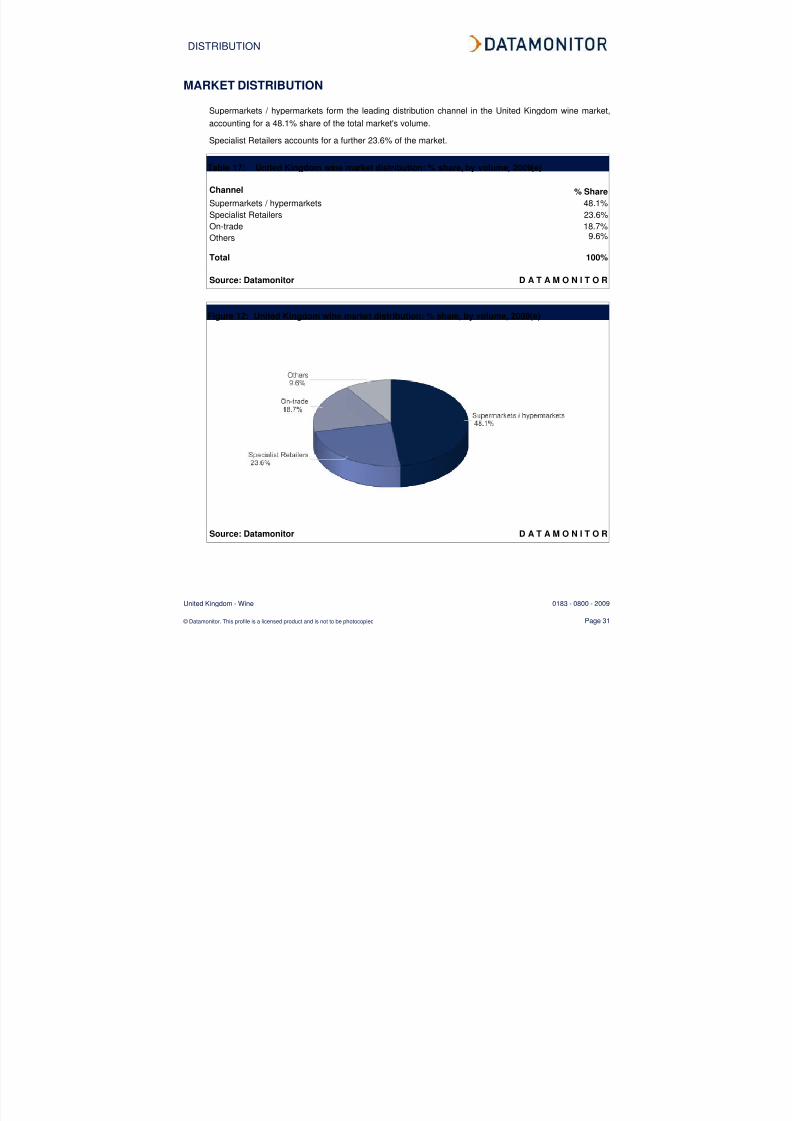
MARKET DISTRIBUTION
Supermarkets / hypermarkets form the leading distribution channel in the United Kingdom wine market,
accounting for a 48.1% share of the total market's volume.
Specialist Retailers accounts for a further 23.6% of the market.
Table 17: United Kingdom wine market distribution: % share, by volume, 2009(e)
Channel % Share
Supermarkets / hypermarkets 48.1%
Specialist Retailers 23.6%
On-trade 18.7%
Others 9.6%
Total 100%
Source: Datamonitor D A T A M O N I T O R
Figure 12: United Kingdom wine market distribution: % share, by volume, 2009(e)
Source: Datamonitor D A T A M O N I T O R
8/7/2019 Wine Industry Profile-United Kingdom
http://slidepdf.com/reader/full/wine-industry-profile-united-kingdom 32/40
MARKET FORECASTS
United Kingdom - Wine 0183 - 0800 - 2009
© Datamonitor. This profile is a licensed product and is not to be photocopied Page 32
MARKET FORECASTS
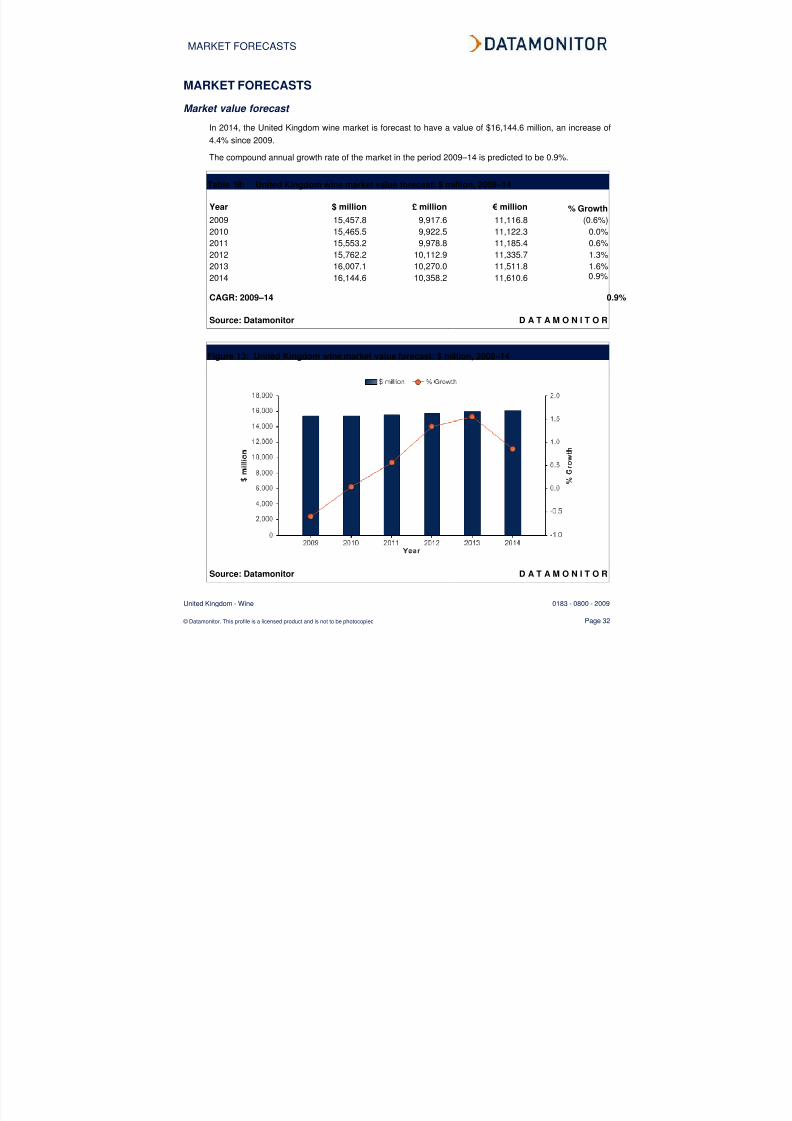
Market value forecast
In 2014, the United Kingdom wine market is forecast to have a value of $16,144.6 million, an increase of4.4% since 2009.
The compound annual growth rate of the market in the period 2009–14 is predicted to be 0.9%.
Table 18: United Kingdom wine market value forecast: $ million, 2009–14
Year $ million £ million € million % Growth
2009 15,457.8 9,917.6 11,116.8 (0.6%)
2010 15,465.5 9,922.5 11,122.3 0.0%
2011 15,553.2 9,978.8 11,185.4 0.6%
2012 15,762.2 10,112.9 11,335.7 1.3%
2013 16,007.1 10,270.0 11,511.8 1.6%
2014 16,144.6 10,358.2 11,610.6 0.9%
CAGR: 2009–14 0.9%
Source: Datamonitor D A T A M O N I T O R
Figure 13: United Kingdom wine market value forecast: $ million, 2009–14
Source: Datamonitor D A T A M O N I T O R
8/7/2019 Wine Industry Profile-United Kingdom
http://slidepdf.com/reader/full/wine-industry-profile-united-kingdom 33/40
MARKET FORECASTS
United Kingdom - Wine 0183 - 0800 - 2009
© Datamonitor. This profile is a licensed product and is not to be photocopied Page 33
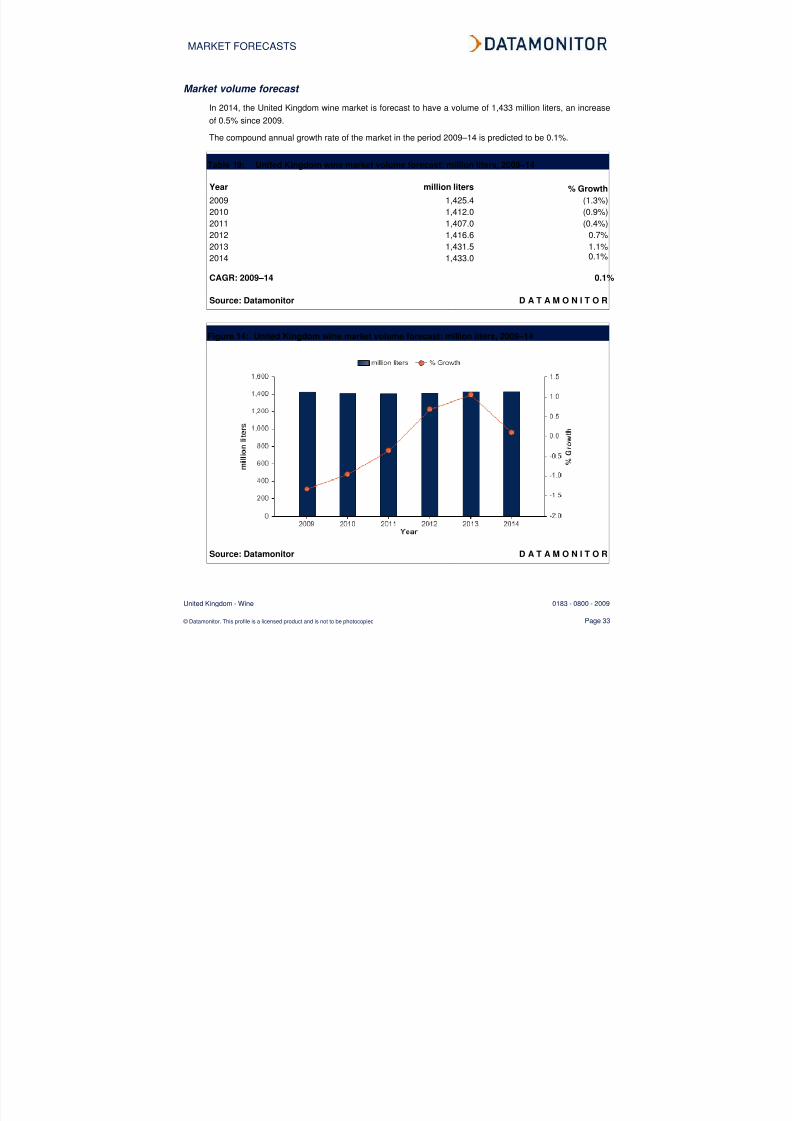
Market volume forecast
In 2014, the United Kingdom wine market is forecast to have a volume of 1,433 million liters, an increase
of 0.5% since 2009.
The compound annual growth rate of the market in the period 2009–14 is predicted to be 0.1%.
Table 19: United Kingdom wine market volume forecast: million liters, 2009–14
Year million liters % Growth
2009 1,425.4 (1.3%)
2010 1,412.0 (0.9%)
2011 1,407.0 (0.4%)
2012 1,416.6 0.7%
2013 1,431.5 1.1%
2014 1,433.00.1%
CAGR: 2009–14 0.1%
Source: Datamonitor D A T A M O N I T O R
Figure 14: United Kingdom wine market volume forecast: million liters, 2009–14
Source: Datamonitor D A T A M O N I T O R
8/7/2019 Wine Industry Profile-United Kingdom
http://slidepdf.com/reader/full/wine-industry-profile-united-kingdom 34/40
MACROECONOMIC INDICATORS
United Kingdom - Wine 0183 - 0800 - 2009
© Datamonitor. This profile is a licensed product and is not to be photocopied Page 34
MACROECONOMIC INDICATORS
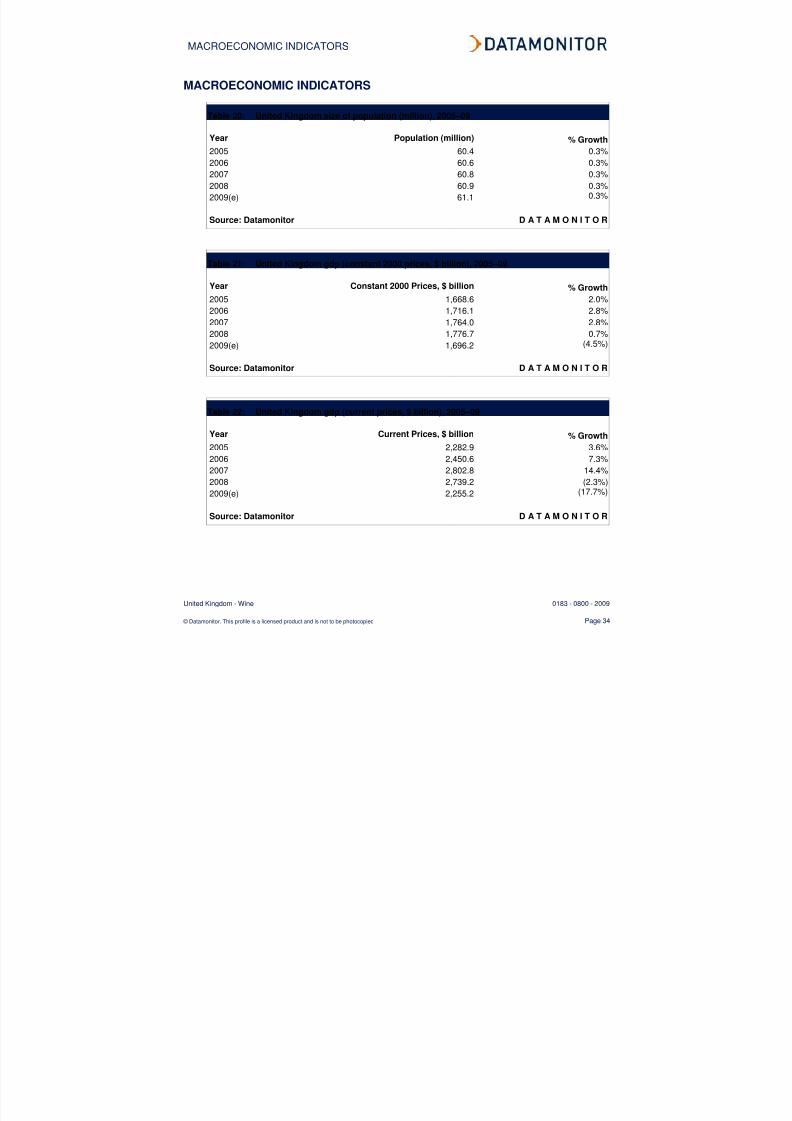
Table 20: United Kingdom size of population (million), 2005–09
Year Population (million) % Growth
2005 60.4 0.3%
2006 60.6 0.3%
2007 60.8 0.3%
2008 60.9 0.3%
2009(e) 61.1 0.3%
Source: Datamonitor D A T A M O N I T O R
Table 21: United Kingdom gdp (constant 2000 prices, $ billion), 2005–09
Year Constant 2000 Prices, $ billion % Growth
2005 1,668.6 2.0%
2006 1,716.1 2.8%
2007 1,764.0 2.8%
2008 1,776.7 0.7%
2009(e) 1,696.2 (4.5%)
Source: Datamonitor D A T A M O N I T O R
Table 22: United Kingdom gdp (current prices, $ billion), 2005–09
Year Current Prices, $ billion % Growth
2005 2,282.9 3.6%
2006 2,450.6 7.3%
2007 2,802.8 14.4%
2008 2,739.2 (2.3%)
2009(e) 2,255.2 (17.7%)
Source: Datamonitor D A T A M O N I T O R
8/7/2019 Wine Industry Profile-United Kingdom
http://slidepdf.com/reader/full/wine-industry-profile-united-kingdom 35/40
MACROECONOMIC INDICATORS
United Kingdom - Wine 0183 - 0800 - 2009
© Datamonitor. This profile is a licensed product and is not to be photocopied Page 35
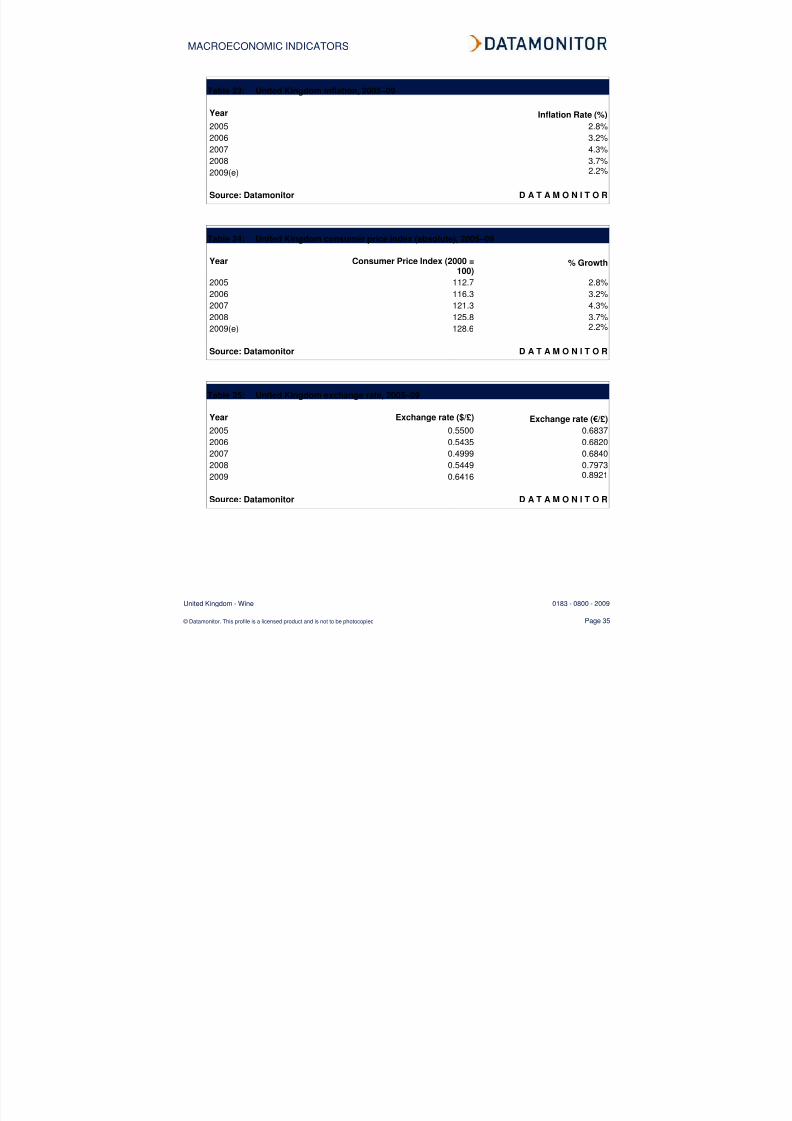
Table 23: United Kingdom inflation, 2005–09
Year Inflation Rate (%)
2005 2.8%2006 3.2%
2007 4.3%
2008 3.7%
2009(e) 2.2%
Source: Datamonitor D A T A M O N I T O R
Table 24: United Kingdom consumer price index (absolute), 2005–09
Year Consumer Price Index (2000 =100)
% Growth
2005 112.7 2.8%
2006 116.3 3.2%
2007 121.3 4.3%
2008 125.8 3.7%
2009(e) 128.6 2.2%
Source: Datamonitor D A T A M O N I T O R
Table 25: United Kingdom exchange rate, 2005–09
Year Exchange rate ($/£) Exchange rate (€/£)
2005 0.5500 0.6837
2006 0.5435 0.6820
2007 0.4999 0.6840
2008 0.5449 0.7973
2009 0.6416 0.8921
Source: Datamonitor D A T A M O N I T O R
8/7/2019 Wine Industry Profile-United Kingdom
http://slidepdf.com/reader/full/wine-industry-profile-united-kingdom 36/40
APPENDIX
United Kingdom - Wine 0183 - 0800 - 2009
© Datamonitor. This profile is a licensed product and is not to be photocopied Page 36
APPENDIX
Methodology
Datamonitor Industry Profiles draw on extensive primary and secondary research, all aggregated,analyzed, cross-checked and presented in a consistent and accessible style.
Review of in-house databases – Created using 250,000+ industry interviews and consumer surveys
and supported by analysis from industry experts using highly complex modeling & forecasting tools,
Datamonitor’s in-house databases provide the foundation for all related industry profiles
Preparatory research – We also maintain extensive in-house databases of news, analyst
commentary, company profiles and macroeconomic & demographic information, which enable our
researchers to build an accurate market overview
Definitions – Market definitions are standardized to allow comparison from country to country. The
parameters of each definition are carefully reviewed at the start of the research process to ensure they
match the requirements of both the market and our clients
Extensive secondary research activities ensure we are always fully up-to-date with the latest
industry events and trends
Datamonitor aggregates and analyzes a number of secondary information sources, including:
- National/Governmental statistics
- International data (official international sources)
- National and International trade associations
- Broker and analyst reports
- Company Annual Reports
- Business information libraries and databases
Modeling & forecasting tools – Datamonitor has developed powerful tools that allow quantitative
and qualitative data to be combined with related macroeconomic and demographic drivers to create
market models and forecasts, which can then be refined according to specific competitive, regulatory
and demand-related factors
Continuous quality control ensures that our processes and profiles remain focused, accurate and
up-to-date
8/7/2019 Wine Industry Profile-United Kingdom
http://slidepdf.com/reader/full/wine-industry-profile-united-kingdom 37/40
APPENDIX
United Kingdom - Wine 0183 - 0800 - 2009
© Datamonitor. This profile is a licensed product and is not to be photocopied Page 37
Industry associations
The Wine and Spirit Association
Five Kings House, 1 Queen Street Place, LONDON, EC4R 1XX, UK
Tel.: 44 20 7248 5377Fax: 44 20 7489 0322
www.go-e2.co.uk
Related Datamonitor research
Industry profiles
Global Wine
Wine in Europe
Wine in Asia-Pacific
Wine in Denmark
Wine in Italy
Wine in Spain
Wine in the Netherlands
Wine in the United States
Wine in Canada
Wine in Mexico
Wine in France
8/7/2019 Wine Industry Profile-United Kingdom
http://slidepdf.com/reader/full/wine-industry-profile-united-kingdom 38/40
APPENDIX
United Kingdom - Wine 0183 - 0800 - 2009
© Datamonitor. This profile is a licensed product and is not to be photocopied Page 38
Disclaimer
All Rights Reserved.
No part of this publication may be reproduced, stored in a retrieval system or transmitted in any form
by any means, electronic, mechanical, photocopying, recording or otherwise, without the prior
permission of the publisher, Datamonitor plc.
The facts of this report are believed to be correct at the time of publication but cannot be guaranteed.
Please note that the findings, conclusions and recommendations that Datamonitor delivers will be
based on information gathered in good faith from both primary and secondary sources, whose
accuracy we are not always in a position to guarantee. As such Datamonitor can accept no liability
whatever for actions taken based on any information that may subsequently prove to be incorrect.
8/7/2019 Wine Industry Profile-United Kingdom
http://slidepdf.com/reader/full/wine-industry-profile-united-kingdom 39/40
ABOUT DATAMONITOR
United Kingdom - Wine 0183 - 0800 - 2009
© Datamonitor. This profile is a licensed product and is not to be photocopied Page 39
ABOUT DATAMONITOR
The Datamonitor Group is a world-leading provider of premium global business information, delivering
independent data, analysis and opinion across the Automotive, Consumer Markets, Energy & Utilities,
Financial Services, Logistics & Express, Pharmaceutical & Healthcare, Retail, Technology and
Telecoms industries.
Combining our industry knowledge and experience, we assist over 6,000 of the world’s leading
companies in making better strategic and operational decisions.
Delivered online via our user-friendly web platforms, our market intelligence products and services
ensure that you will achieve your desired commercial goals by giving you the insight you need to best
respond to your competitive environment.
Premium Reports
Datamonitor's premium reports are based on primary research with industry panels and consumers.We gather information on market segmentation, market growth and pricing, competitors and products.
Our experts then interpret this data to produce detailed forecasts and actionable recommendations,
helping you create new business opportunities and ideas.
Summary Reports
Our series of company, industry and country profiles complements our premium products, providing
top-level information on 30,000 companies, 3,000 industries and 100 countries. While they do not
contain the highly detailed breakdowns found in premium reports, profiles give you the most important
qualitative and quantitative summary information you need - including predictions and forecasts.
Datamonitor consulting
We hope that the data and analysis in this profile will help you make informed and imaginative business
decisions. If you have further requirements, Datamonitor’s consulting team may be able to help you. For
more information about Datamonitor’s consulting capabilities, please contact us directly at

8/7/2019 Wine Industry Profile-United Kingdom
http://slidepdf.com/reader/full/wine-industry-profile-united-kingdom 40/40
Copyright of Wine Industry Profile: United Kingdom is the property of Datamonitor Plc and its content may not
be copied or emailed to multiple sites or posted to a listserv without the copyright holder's express written
permission. However, users may print, download, or email articles for individual use.