Embed Size (px)
Citation preview

Winds of Change
David Cohen 1
WindsofChange:ForcesImpactingtheFutureoftheForest
Sector
Dr. David CohenUBC
Outline
The Big Picture
Models of Sustainability
Global Forests – Global Trade: A Brief Summary
Drivers of Change in Forestry
David Cohen 2
FourKeyInteractingDrivers
1) Population Growth
2) Economic Power Shift to Developing Regions with their growing middle class
3) Squeeze on world resources, and
4) Growing environmental degradation
David Cohen 3
1)GlobalPopulationGrowth
0
2
4
6
8
10
12
Billion
s of p
eople
2.5 4.1 6.1 7.7 8.7 9.6
Source: Population Reference Bureau 2013David Cohen 4
Winds of Change
David Cohen 2
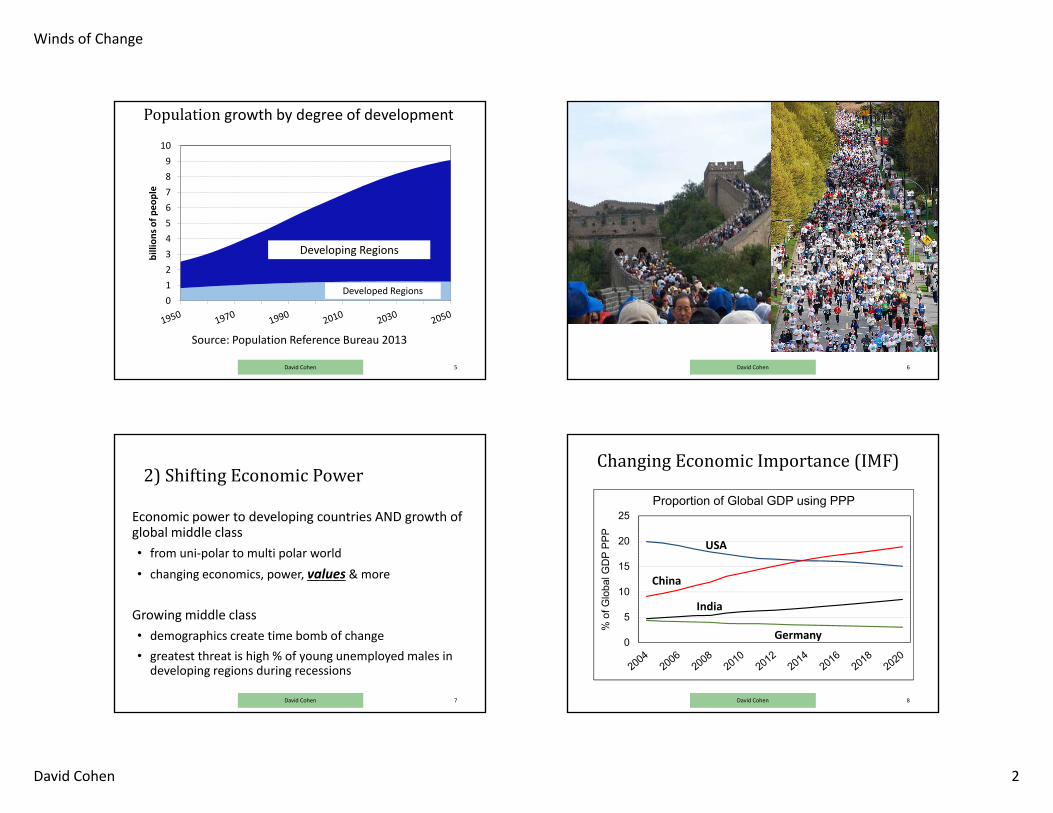
Population growth by degree of development
0123456789
10billion
s of p
eople
Developed Regions
Developing Regions
Source: Population Reference Bureau 2013
David Cohen 5 David Cohen 6
2)ShiftingEconomicPower
Economic power to developing countries AND growth of global middle class• from uni‐polar to multi polar world• changing economics, power, values & more
Growing middle class• demographics create time bomb of change• greatest threat is high % of young unemployed males in developing regions during recessions
David Cohen 7
ChangingEconomicImportance(IMF)
0
5
10
15
20
25
% o
f Glo
bal G
DP
PPP
Proportion of Global GDP using PPP
India
USA
China
Germany
David Cohen 8

Winds of Change
David Cohen 3
ChangingEconomicImportance(IMF)
0
1
2
3
4
% of G
loba
l GDP
Proportion of Global GDP using PPP
Canada
UKIndonesia
David Cohen 9
ThestickysuperpowerTheEconomistOct3,2015Weighted by share of world GDP, trade & exports
GrowingMiddleClass
Globally Middle Class : Extreme Poverty
• Middle class defined as spending of $10‐100/day
• 1 billion people joined 1990‐2010
• Now 2.5 billion (McKinsey: 5 billion by 2022)
• Future drivers of world economic growth
• 1980 – 2015 extreme poverty 47% to 9.6% of world population (<$1.90 per day PPP)
David Cohen 12
BankofCanada:MonthlyCommodityPriceIndexto6/2015
0
500
1,000
1,500
2,000
2,500
3,000
Energy Metals and Minerals Forestry Agriculture
David Cohen 13

Winds of Change
David Cohen 4
BankofCanada:MonthlyCommodityPriceIndexto6/2015
0
500
1,000
1,500
2,000
2,500
3,000
Energy Metals and Minerals Forestry Agriculture
Well managed renewables
flat
Non renewables (metal &
energy) prices doubled
David Cohen 14
3.SqueezeonWorldResources
Leading to high prices and increases in:• Conservation – 3R’s• Eco‐efficiency in business (leaning all operations)• Innovation ‐ resource productivity• Replacing limited non‐renewables with well managed renewables
Paradigm shift this century as sustainability in business becomes opportunity not responsibility
David Cohen 15
UPM Biofore all wood car (2014)
Wood based electronic circuits (2015) http://www.cnbc.com/id/102798585
http://vancouver.housing.ubc.ca/wp‐content/uploads/2017/09/Brock‐Commons‐Tallwood‐House%E2%80%93web.jpg
David Cohen 16
4.Environmentaldegradation:Ecologicalfootprint
Source: Global Footprint Network August 2013http://www.footprintnetwork.org/en/index.php/GFN/page/world_footprint/
David Cohen 19
Winds of Change
David Cohen 5
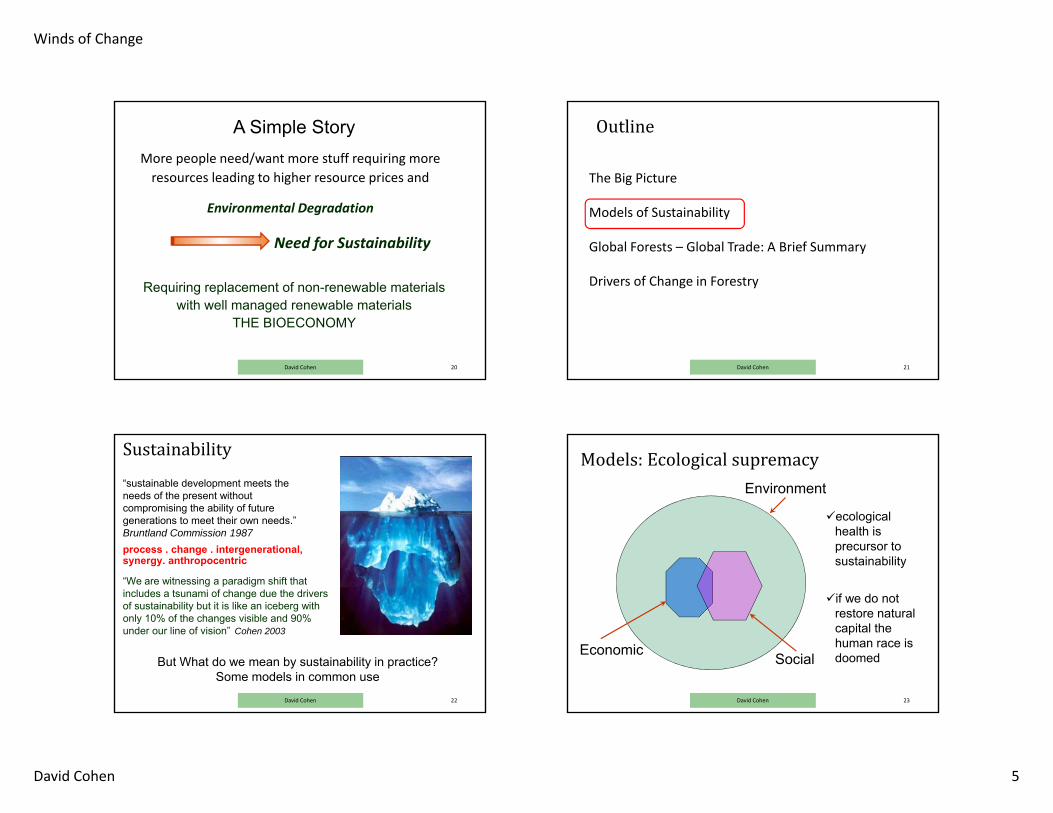
A Simple StoryMore people need/want more stuff requiring moreresources leading to higher resource prices and
Environmental Degradation
Requiring replacement of non-renewable materials with well managed renewable materials
THE BIOECONOMY
Need for Sustainability
David Cohen 20
Outline
The Big Picture
Models of Sustainability
Global Forests – Global Trade: A Brief Summary
Drivers of Change in Forestry
David Cohen 21
Sustainability
“We are witnessing a paradigm shift that includes a tsunami of change due the drivers of sustainability but it is like an iceberg with only 10% of the changes visible and 90% under our line of vision” Cohen 2003
David Cohen 22
“sustainable development meets the needs of the present without compromising the ability of future generations to meet their own needs.” Bruntland Commission 1987process . change . intergenerational, synergy. anthropocentric
But What do we mean by sustainability in practice?Some models in common use
Models:Ecologicalsupremacy
ecological health is precursor to sustainability
if we do not restore natural capital the human race is doomedEconomic
Environment
Social
David Cohen 23

Winds of Change
David Cohen 6
DynamicBalance:mostpopular
Environment
EconomicSocial
Sustainability Models that Reflect Global Reality
Nested Hierarchy
David Cohen 25
NestedHierarchyasfirstproposed
Economy
Society
EnvironmentProposed by Natural Step
Environment is supreme with Economics last (organizational bias)
David Cohen 26
NestedHierarchy:AdaptivemodelThree pillars do not have equal importance BUT:
Different groups have different priorities for pillars.
There is NO “right” hierarchy
Depends on context!
David Cohen 27

Winds of Change
David Cohen 7
Whatisthestory?
All changes point to
SUSTAINABILITY
as key driver for all civil, business, and societal decisions in the future.
Key driver of innovation!
BUT It means different things to different people
David Cohen 28
Outline
The Big Picture
Models of Sustainability
Global Forests – Global Trade: A Brief Summary
Drivers of Change in Forestry
David Cohen 29
This graphic shows some of the countries with the largest forest resources. Those regions highlighted in red show where deforestation has occurred over the past 10 years. Estimates show Indonesia & Brazil account for >75% of global deforestation in most yearsRussia has 1/5th of the world’s forests but produces far less than 1/5th of the worlds wood products. The US & Canada have same forest area BUT the US produces almost twice as many wood products.
Canada–7.7
Source: FRA 2010
USA –7.5
Russia – 20.1
Brazil – 13.0
China –5.1
Indonesia – 2.3
Sweden/Finland – 1.2
David Cohen 30
Forests cover 31% of the worlds land surface or about 4 billion hectares of land. Every continent has some forest cover except for Antarctica. The figure below shows the location of global forest resources in 2010 according to the FAO. Some regions are growing their forest area due to afforestation or planting more areas of tress than are harvested. Some areas are in decline due to land conversion to non forest uses or illegal logging.
area in millions ha: annual % change 2000 ‐ 2010Region#,######
N/C America 7050
S America 864‐8.0
Asia593+4.5
Europe1,005+1.4
Africa674‐3.4
Oceania1
‐1.4
View from Vancouver
David Cohen 31

Winds of Change
David Cohen 8
Global Forest Resources 2010area in millions ha: annual change 2000 ‐ 2010
N/C America 7050
S America 864‐8.0
Asia593+4.5
Europe1,005+1.4
Africa674‐3.4
Oceania191‐1.4
Source: FAO 2000 Yearbook of Forest Products, published in 2002.
Region#,######
View from Toronto
David Cohen 32
Whatisharvested
Harvest of 3.3 – 3.8 billion m3/yr from ~400 billion m3 of trees (0.8% of wood volume) on 4 billion ha of forest land
Subsistence (~50%) vs Industrial (~50%)subsistence and less wood needed to make more products (2015 54% industrial)
Coniferous SW (1/3) vs Non‐coniferous HW (2/3)C (2/3 industrial) vs NC (~2/3 subsistence)
Missing data due to illegal logging and poor reporting =10 ‐ 35% of total volumes
Little change since 1990 25 years
David Cohen 33
Therehasnotbeenmuchchangeisthevolumeofwoodharvestedortheproportionwhichisusedforsubsistenceuseandindustrialuseoverthepast35years.Ittendstovarybasedonhowtheglobaleconomyisfairing.Buttherehasbeenchangesuntermsofsourceofwood.
1,0001,1001,2001,3001,4001,5001,6001,7001,8001,9002,000
Millions of cub
ic m
etres
Annual wood harvests 1980‐2015
for fuel industrial logs
David Cohen 34
Country % 2015 Global Ind. Log Production
% 2000 Global Ind. Log Production
USA 18.3 23.6Russia 9.5 8.2China 8.3 5.3
Canada 8.2 11.2Brazil 7.5 5.4Sweden 3.3 3.2
Indonesia 3.1 2.7
Finland 2.6 2.8
India 2.5 2.3
Germany 2.2 2.9
Chile 2.1 1.4
Poland 1.8 1.4
New Zealand 1.4 1.1
Australia 1.4 1.4
IndustrialLog
Production(20001.6820151.84billionm3) 10%
DeclineinCanada&USGrowthin
China,Russia,Brazil&manyequatorialcountries
David Cohen 35

Winds of Change
David Cohen 9
David Cohen 36
Country % 2015 Log Exports % 2000 Log Exports
Russia 14.9 26.9New Zealand 11.1 5.2USA 9.0 10.4
Canada 4.6 2.5
Ukraine 4.2 0.6
Australia 4.1 1.0
LogExports
Russianexportsduetotax Plantationwood&EasternEurope
LogImports
(6.6‐6.8%oftotal
industriallogharvest2000&2015)
CHINA
Country % 2015 Log Imports % 2000 Log Imports
China 36.1 10.4Germany 7.0 2.7Austria 6.2 6.5Sweden 5.6 8.9Finland 4.6 7.5
Global SW Lumber Production & Exports
David Cohen 37
90
140
190
240
290
340
390
Millions of cum
Exports Production
David Cohen 38
Country % 2015 sawnwood production
% 2000 sawnwood production
USA 17.0 23.7
China 16.4 1.7Canada 10.4 13.1
Russia 7.7 5.2Germany 4.7 4.2
Sweden 4.0 4.2
Brazil 3.4 5.5
Finland 2.4 3.5
Japan 2.1 4.4
Austria 1.9 2.7
Chile 1.9 1.5
SW&HWSawnwoodProduction(2015=452:2000=385millionm3)
• 17%• Shift fromtraditional suppliersto CHINA & Russia
SawnwoodExportsCountry % 2015 Sawnwood Exports % 2000 Sawnwood Exports
Canada 22.9 31.9
Russia 17.7 6.8
Sweden 9.5 9.7
Finland 5.8 7.4
Germany 5.3 3.4
David Cohen 39
SawnwoodExports
SawnwoodImports
(30%oftotal
sawnwoodproductionin2000&2015)
Country % 2015 Sawnwood Imports % 2000 Sawnwood Imports
China 19.9 3.2USA 18.7 30.1UK 4.8 6.9Japan 4.6 8.7Egypt 4.5 1.8

Winds of Change
David Cohen 10
Global Panel Production & Imports
David Cohen 40
050
100150200250300350
Millions of cum
Production Imports
China largest exporter (2.5 times #2) USA, Germany & Japan largest importers
Country % Global Wood Panel Production 2015
% Global Wood Panel Production 2000
China 50.2 9.8USA 8.5 24.5Russia 3.4 2.5Canada 3.2 8.1Germany 3.1 7.5Brazil 2.8 3.1Turkey 2.4 1.3Poland 2.3 2.5Indonesia 1.8 4.9Malaysia 1.7 3.1
WoodPanelProduction(2015– 399;2000‐ 186millionm3)
Chronic under reporting in China
David Cohen 41
David Cohen 42
Country % Global Wood Panel Exports 2015
% Global Wood Panel Exports 2000
China 7.6 1.5Canada 3.9 19.0Germany 3.1 8.1Malaysia 2.7 9.2Russia 2.3 2.5Thailand 2.1 1.5
Exports
WoodPanelExport/import(201581:200057.5millionm3)~30%ofproduction
Imports
Country % Global Wood Panel Imports 2015
% Global Wood Panel Imports 2000
USA 15.1 23.3Germany 6.8 6.8Japan 5.3 10.4Canada 4.2 6.8UK 4.0 5.5
17 countries with 1.0 – 1.7% in 2015
WoodPanels
David Cohen 43
• China; largest producer of MDF, blockboard & plywood
• China uses wood panels for concrete forming & secondary manufacturing
• Chinese production , exports , domestic use grows
• Tendency to overproduce and flood the market before China stops building MDF plants, steel mills, paper plants, etc.
• Before GFC many new OSB plants in NA ready to open new supply easy to add so lid on prices

Winds of Change
David Cohen 11
Chinese Panel Production, Exports & Imports
David Cohen 44
0
20
40
60
80
100
120
140millions of cum
Production
Export
Import
TrendsinPanels
David Cohen 45
• OSB gaining in Europe – entry in Asia China produces > 50% of world supply of MDF
• use of alternative materials for panels Kenaf, strawboard, bamboo board, etc.
• production & exports from China & Brazil
• trade & production of wood panels
• new types of panels e.g. CLT
Pulp
Pulp production has changed substantially between 2000 & 2015. • volume remained almost the same but great increase in
pulp from recycled paper • this now provides almost 1.5 times as much pulp as virgin
wood pulp • reduction in graphic paper use has led to less softwood
pulp use (e.g. in US & Canada) and more use of low cost pulp from eucalyptus plantations in equatorial regions (e.g. Brazil & Uruguay)
• BUT declining paper use results in less paper to recycle
David Cohen 46
Country % Global Production 2015 % Global Production 2000
USA 26.6 33.1
Brazil 9.6 4.2
Canada 9.5 15.3
Sweden 6.3 6.6
Finland 5.6 6.9
China, 5.3 1.9
Japan 4.8 6.6Russia 4.3 3.4
Indonesia 3.6 2.4
Chile 2.8 1.5
WoodPulpProduction(2015– 176;2000=171milliontonnes)
David Cohen 47

Winds of Change
David Cohen 12
Country % Global Wood Pulp Exports 2015
% Global Wood Pulp Exports 2000
Brazil 20.4 7.8Canada 16.8 31.0USA 13.1 15.2Chile 7.5 4.8Sweden 5.9 8.0Indonesia 5.7 3.5
Exports
WoodPulpExports&Imports
2000– 22%2015‐ 34%ofproduction
ImportsCountry % Global Wood Pulp
Imports 015% Global Wood Pulp
Imports 2000China 33.7 7.4USA 9.1 15.8Germany 8.3 9.7Italy 5.9 7.6Korea 3.9 5.1France 3.4 5.7
David Cohen 48
Outline
The Big PictureModels of SustainabilityGlobal Forests – Global Trade: A Brief SummaryDrivers of Change in Forestry• Increased private forest land ownership• Growth of equatorial plantations
• Shifting global timber supply
• Declining paper use• Restricted market access
• Carbon sequestration?
• Crisis in Science
David Cohen 49
IncreasedPrivateOwnershipofForestLandInvestors (e.g. pension plans) seek real assets to
balance stocks and bondsWhy
• To create stable long term cash flows• Long term safe returns• Deflation/inflation hedge• Diversification
Leads to global• Increase in land & house prices
Rapid growth in private equity purchasing forest land from governments (e.g. NZ) and forest companies
50David Cohen
ChangeinPrivateOwnershipofForestLand
David Cohen 51
1990‐2000 2000‐2010 1990‐2010temperate 17.1% 21.0% 41.7%subtropical 5.9% 8.3% 14.7%tropical ‐3.9% 8.2% 3.9%global 8.9% 14.1% 24.2%
• Private forest land ownership increased by 104 million hectares from 1990‐2010
Source: Whitman, Wickramasinghe & Pina, 2015, Forest Ecology and Management 352 (2015) 99‐108.

Winds of Change
David Cohen 13
GrowthofequatorialplantationsHighly managed & subsidized
Trees as agricultural crop
Low cost, fast grown, privately owned, cheap
Technology compensates for weak fibre• e.g. genetic modification, computerized process control,
fertilization, pruning, etc.
Support by NGOs e.g. FSC (intensive vs extensive)
52
SA Eucalyptus harvest has grown to 50 million m3 providing 40% of total SA industrial harvest!
David Cohen
GrowthofPlantedForestAccording to UN FAO (2012) planted forests increased from 1990 – 2010 by 3.6 million ha/year• in developing regions with long growing seasons• 76% were for industrial wood production• Eucalyptus (mostly for pulp) most planted species• China planted greatest area (>60%) followed by Brazil
What about palm plantations? Are they forests?
David Cohen 53
Growthofequatorialplantations
• Most are eucalyptus trees which have short, weak fibres but grow fast compared to NA and EU pulp
• In September 2017 Asia Pulp and Paper paid a very high premium for a pulp mill with expansion option in Brazil
• Paid US$2,810/tonne of pulp capacity which was~70% over recent sales>500% premium over Canfor NBSK production
What could this mean in terms of:competitiveness of northern pulp, relative attractiveness of operating in NA or EUfuture pulp demand, etc.
David Cohen 54
SimplifiedViewofForestPlantations
David Cohen 55
Good for the World
• Rapid growth less land needed natural forest conservation
• Good use of scarce resources• Creates continuous, long term
wood supply• Economically beneficial
Bad for the World
• Biological deserts – NO biodiversity
• Depletes soil / requires fertilization
• Creates hydrological problems
• Monoculture increases pest & disease problems

Winds of Change
David Cohen 14
ShiftingGlobalTimberSupply
Growth in forest volumes (often private) in
• SE USA Pine plantations
• NZ (decline after 2025) Pine plantations
• Australia Plantations
• China plantations Plantations
• Brazil Eucalypts plantations
• Uruguay Eucalypts plantations
• Finland Red & white wood plantations
56David Cohen
DecliningCanadianTimberSupply
BC ‐ substantial declining harvests (more mills will close)Ontario & Quebec – by 2016 all mills that can reopen will do soAlberta – may have room for small increased harvestAtlantic Canada – at or beyond maximum harvest levels
Before US housing starts regain steady state (~1.5 million/yr) Canada has maxed out its lumber production
Does not include impact of fire season of 2017 in western NA
David Cohen 57
DeclineofPaperUse
0
10
20
30
40
50
60
millions of ton
nes NA and EU Graphic Paper Production
USA & Canada
N. & W. Europe
first public access to internet
David Cohen 58
NADemandforNewsprintSource:RBCCapitalMarkets“NewsprintStats”Aug24,2015
David Cohen 59

Winds of Change
David Cohen 15
21st CenturyRecoveredPaperProduction(FAO)
0
50
100
150
200
250
2000 2003 2006 2009 2012 2015
Million tonn
es
How will declining paper use impact this
growth trend?
technology & design keeps increasing % of paper recovered
“urban pulp supply” needs strong virgin
pulp added each time it is recycled
Today almost 60% of all pulp comes from recovered paper
David Cohen 60
MarketAccessRestrictions
US & EU: illegal to use of illegal/unsustainable wood
US Lacey Act Revision 2008• Revised Act to ban trade in illegal animals or plants animal, Great concern to Asian exporters to EU and US
EU’s Forest Law Enforcement, Governance and Trade (FLEGT)• Action plan seeks to use voluntary partnerships with governments to reduce illegal logging & increase legal logging
David Cohen 62
MarketAccessRestrictions
Growing Protectionism• US approval of almost ALL tariff requests by ITC
• Canadian linkage of trade to gender, diversity & labour issues
• Growing use of “environmental imperialism” (which I support due to my personal biases)
• Regulatory bias to home grown SOEs (e.g. China)
David Cohen 63
CarbonSequestration
Flood of Advocacy Research• Showing building with wood sequesters carbon
e.g. tall wood buildings• Showing not harvesting tress sequesters carbon
e.g. communication among trees• Crisis in scientific integrity
David Cohen 64

Winds of Change
David Cohen 16
LooselybasedonCrisisinScience
From “The Rightful Place of Science: Science on the Verge”
by Andrea Saltelli et al.”to improve actual practice in science”
David Cohen 65
Crisisinsciencethreatensitsintegrity:Why?
• “Most published research findings are false” Ionnidis 2005• Unreliability in scientific literature and systematic bias
Boyd 2013• Over 75% of research cannot be reproduced (medical
plus)• Pressure to publish even if findings are not really
significant• Ignoring difference between correlation and causality• Rapid growth of fake papers, journals that publish for
money with no real review, • Promotion based on publishing metrictocracy and not
meritocracy and diversity discrimination
David Cohen 66
• Becomes policy based evidence and not evidence based policy i.e. advocacy science
• Overreliance on dynamic stochastic general models (DSGE) and other modeling techniques:minor changes to basic assumptions and the need for simplification can dramatically change the results climate change and global economic modeling are examples
• Scientific folklore i.e. science can solve any problem given time & money
• “faith based science” so those who disagree become “deniers” and should be punished (David Suzuki)
Crisisinsciencethreatensitsintegrity:Why?“Fallacyofevidencebasedpolicy”
David Cohen 67
Ionnidis, 2005. Why Most Published Research Findings are False, PLoS Med 2(8): e124 doi: 10.1371/journal/pmed. 0020124
Boyd, I. 2013. A standard for policy‐relevant science. Ian Boyd calls for an auditing process to help policy makers to navigate research bias” Nature Comment 501: 160 12 September
David Cohen 68

Winds of Change
David Cohen 17
Outline
The Big PictureModels of SustainabilityGlobal Forests – Global Trade: A Brief SummaryDrivers of Change in Forestry• Increased private forest land ownership• Growth of equatorial plantations
• Shifting global timber supply
• Declining paper use• Restricted market access
• Carbon sequestration?
• Crisis in Science
David Cohen 69