Embed Size (px)
Citation preview


R&D Roadmap For Emerging Window And Building Envelope Technologies ii
Cover Photo Credits: IStockphoto
DISCLAIMER
This report was prepared as an account of work sponsored by an agency of the United States Government.
Neither the United States Government, nor any agency thereof, nor any of their employees, nor any of
their contractors, subcontractors, or their employees, makes any warranty, express or implied, or assumes
any legal liability or responsibility for the accuracy, completeness, or usefulness of any information,
apparatus, product, or process disclosed, or represents that its use would not infringe privately owned
rights. Reference herein to any specific commercial product, process, or service by trade name,
trademark, manufacturer, or otherwise, does not necessarily constitute or imply its endorsement,
recommendation, or favoring by the United States Government or any agency, contractor or subcontractor
thereof. The views and opinions of authors expressed herein do not necessarily state or reflect those of the
United States Government or any agency thereof.

R&D Roadmap For Emerging Window And Building Envelope Technologies iii
ACKNOWLEDGMENTS The U.S. Department of Energy (DOE) would like to acknowledge and thank everyone who contributed
their time, expertise, and guidance to develop this research and development (R&D) roadmap. This report
was prepared with the input of nearly 100 scientists, engineers, industry representatives, technology and
program managers, and other stakeholders, and represents the synthesis of results and discussion from the
2013 Windows and Building Envelope R&D Program Roadmap Workshop, internal analysis performed
in the Building Technologies Office (BTO), and supporting scientific literature. As such, thanks go out to
all participants of the 2013 Building Envelope and Windows R&D Program Roadmap Workshop held on
April 5, 2013 (full participant list shown in Appendix A). Special thanks are extended to those listed
below, the workshop plenary and lunch speakers, workshop steering committee members, and DOE
subject-matter experts who assisted in the framing of the workshop and the R&D roadmap.
Plenary and Lunch Speakers:
An Chen (University of Idaho), Guillermo Garcia (Heliotrope Technologies), Christian Kohler
(Lawrence Berkeley National Laboratory [LBNL]), Eric Werling (DOE, Building America Program),
Hongxi Yin (Southeast University, Nanjing, China)
Steering Committee Members:
Mehran Arbab (PPG Industries, Inc.), Greg Bergtold (The Dow Chemical Company), André Desjarlais
(Oak Ridge National Laboratory [ORNL]), Eric Jackson (Quanex Building Products), Ming Qu (Purdue
University), Stephen Selkowitz (LBNL)
DOE Subject-Matter Experts:
Omar Abdelaziz (BTO, on detail from ORNL), Ian LaHiff (BTO, now City of Orlando), Jason Koman
(BTO, now Green Strategies Inc.), Patrick Phelan (BTO), Samuel Rashkin (BTO), Eric Werling (BTO)
The workshop planning and execution and the preparation of this report were conducted under the
direction of Karma Sawyer with significant contributions from others in BTO, workshop steering
committee members, and Energetics Incorporated. Special thanks go to Omar Abdelaziz (BTO, on detail
from ORNL), Greg Bergtold (The Dow Company), John Breshears (Architectural Applications) and
Roderick Jackson (ORNL) for lending their technical expertise to help prepare specific portions of this
report. Lastly, thanks to all roadmap technical peer reviewers, including Mehran Arbab (PPG Industries),
John Breshears (Architectural Applications), D. Charlie Curcija (LBNL), Thomas Culp (Birch Point
Consulting), André Desjarlais (ORNL), Chaiwat Engtrakul (National Renewable Energy Laboratory
[NREL]), Guillermo Garcia (Heliotrope Technologies), Roderick Jackson (ORNL), Sneh Kumar
(Traco/Kawneer/Alcoa), Ian LaHiff (City of Orlando), Richard Lunt (Michigan State), William Miller
(BTO), Patrick Phelan (BTO), Ming Qu (Purdue University), Glenn Schatz (BTO), Timothy Snow
(NREL), Minoru Taya (University Washington), and Robert Tenent (NREL).
COMMENTS
DOE is interested in feedback or comments on the materials presented in this document. Please write to:
Karma Sawyer, Ph.D.
Windows and Building Envelope Technology Manager
EE-5B
U.S. Department of Energy
1000 Independence Avenue SW
Washington, DC 20585-0121

R&D Roadmap For Emerging Window And Building Envelope Technologies iv
TABLE OF CONTENTS Acknowledgments ......................................................................................................................... iii
Table of Contents........................................................................................................................... iv
Executive Summary ...................................................................................................................... vii
1. Introduction ............................................................................................................................... 1 Background and Importance of Buildings Energy Consumption........................................................... 1 Building Technologies Office ................................................................................................................. 2 Emerging Technologies Program .......................................................................................................... 3 Role of Windows and Envelope Technologies in Reducing Building Energy Consumption ................. 4 Windows and Building Envelope R&D Program Roadmap Workshop ................................................. 6 Organization and Purpose of the Roadmap .......................................................................................... 7
2. Impact of Windows and Building Envelope Technologies on Building Energy Consumption ................................................................................................................................... 8
Introduction to the Prioritization Tool ..................................................................................................... 8 Prioritization Tool Results.................................................................................................................... 11
3. Roadmap for Emerging Windows Technologies .................................................................. 15 Priority R&D Topics Summary ............................................................................................................ 15 Crosscutting Barriers for Next-Generation Window Technologies...................................................... 18 Windows Highest Priority R&D Topic 1: Highly Insulating Windows .................................................. 19 Windows High Priority R&D Topic 1: Dynamic Windows or Window Films ........................................ 26 Windows High Priority R&D Topic 2: Visible Light Redirection ........................................................... 31 Early-Stage R&D Topic: Dynamic Windows with Energy Harvesting ................................................. 34
4. Roadmap for Emerging Building Envelope Technologies .................................................. 36 Priority R&D Topics Summary ............................................................................................................ 36 Barriers for Next-Generation Building Envelope Technologies ........................................................... 40 Building Envelope Highest Priority R&D Topic 1: Envelope Insulation Material ................................. 42 Building Envelope Highest Priority R&D Topic 2: Air-Sealing Systems .............................................. 47 Building Envelope High Priority R&D Topic: Highly Insulating Roofs for Commercial Buildings ........ 54
5. Crosscutting Drivers and Challenges ................................................................................... 57 Overview.............................................................................................................................................. 57 Soft Costs ............................................................................................................................................ 57 Building Diagnostics ............................................................................................................................ 59 Technology Deployment Strategies .................................................................................................... 60
Appendix A: R&D Roadmap Workshop Participants ................................................................. 63
Appendix B: Acronyms and Abbreviations ................................................................................ 65
Appendix C: Prioritization Tool Results ...................................................................................... 66
Appendix D: References .............................................................................................................. 71

R&D Roadmap For Emerging Window And Building Envelope Technologies v
List of Figures
Figure 1. Staged maximum adoption potential and staged payback in 2030 for priority windows and building
envelope technologies in the residential (R) and commercial (C) building sectors. Technologies with
staged paybacks longer than expected technology lifetime are indicated with an asterisk (*). ....................... ix Figure 2. 2010 U.S. primary energy consumption (quads) ............................................................................................. 1 Figure 3. 2010 Commercial and residential primary energy end uses (quads) .............................................................. 2 Figure 4. Integrated approach to BTO Program efforts .................................................................................................. 2 Figure 5. Overall BTO energy savings goal in 2030 shown by commercial and residential building market segments...... 3 Figure 6. Notional timeline of anticipated building technology R&D progress ................................................................ 4 Figure 7. Composition of R&D roadmap workshop participants ..................................................................................... 6 Figure 8. Prioritization tool analysis results for select windows technologies at development levels 1, 2, or 3 ............ 12 Figure 9. Prioritization tool analysis results for select thermal insulation materials at development levels 1, 2, or 3 ........ 13 Figure 10. Prioritization tool analysis results for select air-sealing system technologies at development levels 1, 2, or 3 ..... 14 Figure 11. Prioritization tool analysis results for select commercial roofing technologies at development levels 1, 2, or 3 ...... 14 Figure 12. Prioritization tool analysis results for window technologies roadmap targets, including highly insulating
windows, dynamic windows, and visible light redirection technologies .......................................................... 17 Figure 13. Comparison of payback periods for baseline technologies and technologies that achieve the roadmap
cost and performance targets ........................................................................................................................ 18 Figure 14. R-5 window, schematic diagram (left) and commercial product (right) (images courtesy of
Alcoa/TRACO) ............................................................................................................................................... 20 Figure 15. Sensitivity analysis of simple payback time for highly insulating windows (R-7, R-8.5, R-10) in the
residential sector ............................................................................................................................................ 22 Figure 16. Sensitivity analysis of simple payback time for highly insulating windows (R-3, R-5, R-7) in the
commercial sector .......................................................................................................................................... 22 Figure 17. Highly insulating window installed cost and performance targets (residential sector) ................................. 25 Figure 18. Highly insulating window installed cost and performance targets (commercial sector) ............................... 25 Figure 19. Highly insulating, dynamic windows with automated shading, schematic diagram (left) and prototype
(right) (images courtesy of LBNL) .................................................................................................................. 26 Figure 20. Dynamic window and window film installed cost and performance targets
, ................................................ 30
Figure 21. Picture of LightLouver unit product (left), interior view of Caltrans District 3 Headquarters atrium with
LightLouver installed on clerestory windows (right). Visible light redirection technology intercepts and
redirects sunlight onto the ceiling or deep into the interior of the building, reducing glare and electric
lighting and mechanical cooling requirements. (image courtesy of LBNL) ..................................................... 31 Figure 22. Visible light redirection technologies installed cost and performance targets .............................................. 33 Figure 23. The VIP in the foreground has an R-value three times higher than the fibrous batt insulation in the
background at one-third the thickness. .......................................................................................................... 38 Figure 24: Prioritization tool analysis results for building envelope technologies roadmap targets, including thermal
insulation, air-sealing, and roof technologies ................................................................................................. 38 Figure 25: Comparison of payback periods for baseline technologies and technologies that achieve the roadmap
cost and performance targets ........................................................................................................................ 39 Figure 26. Fibrous glass loose fill insulation installed in a test attic in a climate simulator just prior to evaluating its
R-value. ......................................................................................................................................................... 40 Figure 27. Sensitivity analysis of simple payback period for thermal insulation materials for a range of cost targets
($/ft2), assuming 2 in of insulation material is applied .................................................................................... 43
Figure 28. Envelope insulation material cost and performance targets ........................................................................ 46 Figure 29. Sensitivity analysis of simple payback period for air-sealing technologies (3 ACH50 – 0.5 ACH50) for
pre-2010 buildings in the residential building sector ...................................................................................... 49 Figure 30. Sensitivity analysis of simple payback period for air-sealing technologies (1 ACH50 and 0.5 ACH50) for
post-2010 buildings in the residential building sector ..................................................................................... 49 Figure 31. Air-sealing systems installed cost and performance targets (residential sector) ......................................... 53 Figure 32. Air-sealing systems installed cost and performance targets (commercial sector) ....................................... 53 Figure 33. Highly insulating roof technology installed cost and performance targets
, .................................................. 56
Figure 34. Infrared image of a residential home, showing parts of building with high energy losses (red) ................... 59 Figure 35. Selection of currently available windows and daylighting simulation tools, including the Complex
Glazing Database (CGDB), EnergyPlus, International Glazing Database (IGDB), Optics, Two-
Dimensional Building Heat-Transfer Modeling (THERM), Radiance and WINDOW. These tools and
others are available for download at windows.lbl.gov/software/. .................................................................... 61

R&D Roadmap For Emerging Window And Building Envelope Technologies vi
List of Tables Table 1. Summary of Priority Windows and Building Envelope Research Areas and R&D Cost and Performance
Targets .......................................................................................................................................................... viii Table 2. Primary Energy Consumption Attributable to Fenestration and Building Envelope Components in 2010
(Quads) ............................................................................................................................................................ 9 Table 3. Primary Energy Consumption Attributable to Fenestration and Opaque Building Envelope Components
Projected for 2035 (Quads)6 ........................................................................................................................... 10 Table 4. New and Existing Residential Buildings in 2010 and 2035. ............................................................................ 10 Table 5. New and Existing Commercial Building Floorspace in 2010 and 2035. ......................................................... 10 Table 6. Residential and Commercial Window Priority Research Topics ..................................................................... 15 Table 7. Roadmap Target Prioritization Tool Analysis Results for Window Technologies, Including Highly
Insulating Window Technologies, Dynamic Window Technologies, and Visible Light Redirection
Technologies ................................................................................................................................................. 16 Table 8. Primary Energy Savings from Highly Insulating Windows (R-7, R-8.5, R-10) in the Residential and
Commercial Sectors....................................................................................................................................... 21 Table 9. Technical Barriers and Challenges to the Development and Cost-Reduction of Highly Insulating Windows . 23 Table 10. Market and Deployment Barriers to the Adoption of Highly Insulating Windows .......................................... 23 Table 11. Highly Insulating Windows R&D Technology Roadmap ............................................................................... 24 Table 12. Technical Barriers and Challenges to the Development and Cost Reduction of Dynamic Windows or
Window Films ................................................................................................................................................ 28 Table 13. Market and Deployment Barriers to the Adoption of Dynamic Windows or Window Films ........................... 28 Table 14. Dynamic Window and Window Film R&D Technology Roadmap ................................................................. 29 Table 15. Technical Barriers and Challenges to the Development of Commercial Windows with Visible Light
Redirection ..................................................................................................................................................... 32 Table 16. Market and Deployment Barriers to the Adoption of Commercial Windows with Visible Light Redirection .. 32 Table 17. Visible Light Redirection R&D Technology Roadmap .................................................................................. 32 Table 18. Technical Barriers and Challenges to the Development of Dynamic Windows with Energy Harvesting ...... 34 Table 19. Market and Deployment Barriers to the Adoption of Dynamic Windows with Energy Harvesting ................. 35 Table 20. Dynamic Window with Energy Harvesting R&D Technology Roadmap ....................................................... 35 Table 21. Residential and Commercial Building Envelope Priority Research Topics ................................................... 36 Table 22. Roadmap Target Prioritization Tool Analysis Results for Building Envelope Technologies, Including
Thermal Insulation Materials, Air-Sealing System Technologies, and Commercial Roofing Technologies .... 37 Table 23. Primary Energy Savings from Thermal Insulation Materials Added to Walls of Existing Buildings ............... 42 Table 24. Technical Barriers and Challenges to the Development of Envelope Insulation Materials ........................... 44 Table 25. Market and Deployment Barriers to the Adoption of Envelope Insulation Material ....................................... 44 Table 26. Envelope Insulation Material R&D Technology Roadmap ............................................................................ 45 Table 27. Primary Energy Savings from Air-Sealing System Technologies for New and Existing Buildings in the
Residential Sectors ........................................................................................................................................ 47 Table 28. Technical Barriers and Challenges to the Development of Cost-Effective Advanced Air-Sealing
Technologies .................................................................................................................................................. 51 Table 29. Market and Deployment Barriers to the Adoption of a Systems-Level Approach to Air-Sealing ................... 51 Table 30. Air-Sealing Systems R&D Technology Roadmap ........................................................................................ 52 Table 31. Technical Barriers and Challenges to the Development of Cost-Effective Highly Insulating Commercial
Roofs .............................................................................................................................................................. 54 Table 32. Market and Deployment Barriers to the Adoption of Highly Insulating Commercial Roofs ........................... 55 Table 33. Highly Insulating Roof R&D Technology Roadmap ...................................................................................... 55 Table 34. Prioritization Tool Analysis Results for Select Windows Technologies at Development Levels 1, 2, or 3 .... 66 Table 35. Prioritization Tool Analysis Results for Select Building Envelope Technologies at Development Levels 1,
2, or 3............................................................................................................................................................. 67 Table 36. Sources and Notes for Prioritization Tool Energy Efficiency Measures ........................................................ 68

R&D Roadmap For Emerging Window And Building Envelope Technologies vii
EXECUTIVE SUMMARY
The U.S. buildings sector, which consists of over 85 million existing residential and commercial
buildings, accounts for approximately 40% of the United States’ primary energy consumption and 39% of
U.S. carbon dioxide emissions (Energy Information Agency 2013d; Office of Energy Efficiency and
Renewable Energy 2011a). Due to the expected gross addition of over 1 million buildings each year, the
number of buildings in the United States is projected to grow to over 100 million by 2035 (Energy
Information Agency 2010; Energy Information Agency 2013a; Office of Energy Efficiency and
Renewable Energy 2011h). However, existing buildings are projected to continue to dominate the market
through that time. Efforts to reduce energy use in U.S. buildings will directly impact both residential
homes and commercial businesses by saving money for both homeowners and business owners. The
environmental impacts of energy use are also an important long-term economic consideration for
businesses and homeowners. In particular, lower operating costs for businesses will translate to more
competitive U.S. products and more jobs. Accordingly, President Obama, in his 2013 State of the Union
address to the nation, issued a new national goal of reducing energy losses in buildings by 50% in the
next 20 years (Remarks by the President 2013).
The U.S. Department of Energy (DOE) Building Technologies Office’s (BTO’s) mission is to improve
the efficiency of existing and new buildings in both the residential and commercial sector through the
development of high-impact energy efficiency technologies and practices. BTO aims to meet the national
goal by developing and widely deploying tools and technologies that result from a variety of activities,
including research and development (R&D), market stimulation, and codes and standards development.
Next-generation windows and building envelope technologies have substantial technical potential to
reduce energy consumption in buildings, but in order to significantly contribute to the goal the installed
cost of high performance technologies must be reduced. As such, the windows and building envelope
R&D community, including BTO, need to make a substantial and sustained commitment to R&D.
While the overall goal is clear, it is quite broad. As a result, a wide range of strategies may be needed to
reach the goal and it is not always clear how to do so most effectively. What technology areas should
R&D efforts focus on? What energy saving impacts will result? What is the specific market opportunity,
new vs. retrofit or residential vs. commercial, for each approach? This R&D roadmap report aims to
provide guidance to help answer these questions, focusing on windows and building envelope
technologies. In many cases, it is not possible to develop a technology that will fit all possible use cases,
which may appear to limit the energy-savings impact. However, the technological advances resulting in
improved performance and/or cost reductions for one technology, material or process can often be
leveraged for improvements in related technologies applicable to a wider market. Identifying these
opportunities is critical to maximizing the impact of BTO’s R&D investment.
Table 1 summarizes the windows and building envelope research areas that this report has identified as
priority areas of interest. Figure 1 illustrates the how the staged payback and energy savings of these
technologies compare. To avoid double counting of energy savings, this figure assumes that measures
with lower projected cost of conserved energy are the first to capture their share of the market. Accordingly,
this figure shows technology staged payback, which is longer than the unstaged payback for some
technologies (e.g., dynamic windows) because a portion of energy savings are already captured by lower
cost technologies.

R&D Roadmap For Emerging Window And Building Envelope Technologies viii
Table 1. Summary of Priority Windows and Building Envelope Research Areas and R&D Cost and Performance Targets
Technology
Description
Target
Sector(s) 2025 Cost Target1 2025 Performance Target
Highest Priority R&D Areas
Highly
insulating
windows
Commercial
and
Residential
Sectors
Residential sector: Projected
installed cost premium ≤$6/ft2
compared to the 2010 standard
base of windows
Commercial sector: Projected
installed cost premium ≤$3/ft2
compared to the 2010 standard
base of windows
Residential sector: R-10 windows with VT>0.6.
Commercial sector: R-7 windows with VT >0.4.
Highly insulating windows must be at comparable thickness
and weight to the currently installed window base to enable
retrofits.
Building
envelope
material
Commercial
and
Residential
Sectors
Projected installed cost premium
≤$0.25/ft2, including insulation
material and associated labor,
assuming an R-12/in performance
to enable a payback period less
than 10 years.
≥R-12/in building envelope thermal insulation material
that can be added to walls to retrofit existing buildings
and can also be applicable to other portions of the
building enclosure (e.g., reduce the impact of thermal
bridging between building components). The material
must meet durability requirements and minimize
occupant disturbance.
Air-sealing
technologies
(systems-level
approach)
Commercial
and
Residential
Sectors
Projected installed cost premium
of ≤$0.5/ft2 finished floor (25% of
current average costs, including
mechanical ventilation costs).
A system capable of concurrently regulating heat, air, and
moisture flow to achieve the following performance
specifications:
Residential sector: <1 ACH50
Commercial sector: <0.25 CFM75/ft2 (5-sided envelope)
High Priority R&D Areas
Dynamic
windows and
window films
Commercial
and
Residential
Sectors
Dynamic windows: Projected
installed cost premium ≤$8/ft2
compared to a standard IGU
Dynamic window films: Projected
installed cost premium ≤$2/ft2
compared to a standard IGU
Demonstrate SHGC > 0.4 with VT bleached state > 0.6 for
the residential sector and > 0.4 for the commercial sector.
Visible light
redirection
Commercial
Sector
Projected installed cost premium
≤$5/ft2 compared to the cost of a
standard window or blind
installation including the costs of
sensors and lighting controls.
Reduce lighting energy use by 50% for a 50-ft floor plate.
Highly
insulating
roofs
Commercial
Sector
Projected incremental cost
increase ≤$1/ft2 compared to
standard roof costs.
An energy use reduction equivalent to a doubling of
current American Society of Heating, Refrigerating and
Air-Conditioning Engineers (ASHRAE) R-values.
Each of the above technologies is discussed in more detail in this report including the potential energy
savings opportunity if cost and performance targets are met and the technical and market challenges to
reaching these targets, R&D milestones and activities, and the identification of the key stakeholders that
will need to collaborate in order to reach the identified R&D goals. For each technology described, focus
is given to improving performance, as well as specific strategies to reduce installed costs in order to
increase the likelihood of mass-market adoption of the technologies that emerge from these R&D efforts.
1 Cost targets in this report are quantified in order to provide a viable critical pathway from current technology R&D status to a
cost target that, at scale, will facilitate mass-market technology adoption.

R&D Roadmap For Emerging Window And Building Envelope Technologies ix
0
5
10
15
20
25
30
35
40
45
50
0 500 1,000 1,500 2,000 2,500 3,000 3,500 4,000 4,500 5,000
Sta
ge
d P
ayb
ac
k P
eri
od
(ye
ars
)
Primary Energy Savings, 2030 (TBtu)
Air-Sealing Systems(R)
Air-Sealing Systems (C)
Dynamic Window
Films (R)
Highly Insulating Windows
(R)
Building Envelope Technology Window Technology
Highly Insulating
Roofs(C)
Dynamic Window
Films (C)
Highly Insulating Windows
(C)
Visible Light Redirection
(C)
Building Envelope Material
(R)
Dynamic Windows,
New Buildings*
(C)
Dynamic Windows,
Existing Buildings*
(C)
Dynamic Windows,
Existing Buildings*
(R)
Dynamic Windows,
New Buildings
(R)
Figure 1. Staged maximum adoption potential and staged payback in 2030 for priority windows and building
envelope technologies in the residential (R) and commercial (C) building sectors. Technologies with staged
paybacks longer than expected technology lifetime are indicated with an asterisk (*).2
In addition to technical R&D activities, it is critically important that focus is also given to mitigating non-
energy market drivers that may spur the mass-market adoption of these energy-efficient technologies. A
discussion and summary of these barriers and their mitigation is presented in Chapter 5 and include:
Reducing balance of system (BOS) costs and approaches to achieve those BOS cost reductions.
Developing diagnostic technologies that will help make a business case for building energy
upgrades and changes in building codes.
Understanding methods for strengthening the business case for retrofits and developing
appropriate and innovative business plans.
DOE looks forward to continuing to work together with researchers and technology developers in
industry, academia, and the national laboratories in developing energy efficient building technologies and
facilitating development of those that carry the greatest benefits today and in the years to come. While
this roadmap does not cover all the important R&D areas, it will help facilitate and accelerate these efforts
by identifying particular R&D milestones, final goals, and over-arching strategies necessary for the
development of next-generation windows and building envelope technologies at a cost that enables mass
adoption in commercial and residential buildings in the U.S. In addition, this roadmap aims to be a
dynamic resource that will be updated as technologies develop and new technologies emerge. This report
is intended to be a source of direction and focus to both public and private decision makers pursuing high-
impact R&D that fosters participation from existing and new researchers as the next steps are taken to
advance next-generation energy efficient windows and building envelope technologies.
2 Staged Maximum Adoption Potential (TBtu) assumes that measures with the lowest cost of conserved energy are the first to
capture their share of the market to avoid double counting of energy savings. The staged maximum adoption potential represents
the energy savings that would result if the technology is deployed only for all end-of-life replacements and new purchases, and
does not include savings that result from other technologies with a lower cost of conserved energy. Accordingly, the staged
payback of the higher cost technologies shown in this figure (e.g., dynamic windows) is longer than unstaged payback because a
portion of projected energy savings are considered to be already captured by lower cost technologies.


R&D Roadmap For Emerging Window And Building Envelope Technologies 1
1. INTRODUCTION Background and Importance of Buildings Energy Consumption
The U.S. buildings sector accounted for approximately 41% of United States primary energy consumption
in 2010; more energy than any other end-use sector. Residential and commercial buildings were
responsible for 22 quadrillion Btu (quads) and 18 quads of energy, respectively. In 2010, 43% of U.S.
residential building energy consumption (equal to 9.5 quads of energy) was consumed for space
conditioning, including both heating and cooling. For perspective, the entire electric output of the nation’s
nuclear power plants was 8.4 quads in 2010 (Energy Information Agency 2013d). In the commercial
buildings sector, lighting was the largest category of energy end use in 2010, consuming 20% of
commercial building sector energy consumption (equal to 3.7 quads). Space heating and cooling also
consumed significant portions of commercial building energy consumption in 2010. Space heating
consumed 16% of commercial building energy consumption (equal to 2.9 quads), while space cooling
consumed 14% of commercial building energy consumption (equal to 2.6 quads). By comparison, the
U.S. aviation industry consumed 2.1 quads of energy in 2010 (Office of Energy Efficiency and
Renewable Energy 2012). Space heating, space cooling, and lighting end uses across residential and
commercial buildings consumed 21 quads of energy or nearly 52% of overall building energy
consumption.
Industrial31%
Transportation28%
Buildings-Residential
23%
Buildings-Commercial
19%
Buildings 41%
Other
Computers
Cooking
Wet Cleaning
Refrigeration
Electronics
Lighting
Water Heating
Space Cooling
Space Heating
9%
2%
4%
5%
6%
8%
10%
13%
15%
28%
Residential Buildings
Other
Cooking
Computers
Water Heating
Electronics
Refrigeration
Ventilation
Space Cooling
Space Heating
Lighting
20%
1%
4%
4%
4%
7%
9%
14%
16%
20%
Commercial Buildings
U.S. Primary Energy Consumption98 Quadrillion Btu
Figure 2. 2010 U.S. primary energy consumption (quads)3
Source: Energy Information Agency 2013d; Office of Energy Efficiency and Renewable Energy 2011b; Office of Energy
Efficiency and Renewable Energy 2011e
3 End uses labeled Other in residential buildings include small electric devices, heating elements, motors, swimming pool and hot
tub heaters, outdoor grills, and any energy attributable to the residential buildings sector, but not directly to specific end-uses.
Other end uses in commercial buildings include service station equipment, ATMs, telecommunications equipment, medical
equipment, pumps, emergency electric generators, combined heat and power in commercial buildings, manufacturing performed
in commercial buildings, and any energy attributable to the commercial buildings sector, but not directly to specific end-uses.

R&D Roadmap For Emerging Window And Building Envelope Technologies 2
Space Heating and Cooling
15.1
Lighting5.8
Water Heating3.6
Refrigeration2.6
Electronics2.5
Wet Cleaning (residential)
1.1
Ventilation (commercial)
1.7
Cooking1.1
Computers1.2
Other5.7
2010 Commerical and Residential Primary Energy End Use (Quadrillion Btu)
Figure 3. 2010 Commercial and residential primary energy end uses (quads)
Source: Office of Energy Efficiency and Renewable Energy 2011b; Office of Energy Efficiency and Renewable Energy 2011e
Building Technologies Office
BTO’s mission is to improve the efficiency of
existing and new buildings in both the residential
and commercial sectors through the development of
energy-efficiency technologies and practices. With
this mission in mind, BTO aims to reduce building-
related energy costs by developing and widely
deploying tools and technologies to reduce building
energy use by 50% by 2030 relative to the 2030
“business as usual” baseline energy use predicted by
the EIA’s Annual Energy Outlook 2010 at a cost
less than that of the energy saved.
As illustrated in Figure 4, BTO employs a three-
pronged integrated approach to achieve its mission and
goal, focusing program efforts on (1) R&D, (2) market stimulation, and (3) codes and standards.
R&D efforts are focused on funding the development of next-generation, energy-efficient technologies
for building technologies that have performance metrics equal or better than state-of-the art technologies
at a cost that enables mass-adoption. Market stimulation efforts involve collaborating with industry
partners and other key stakeholders to increase the adoption of energy-efficient technologies. Market
barriers, including policy, financial, and communication barriers, are identified and mitigated in
collaboration with BTO program partners. Finally, codes and standards efforts establish minimum energy
use levels using a transparent public process, which is critical to raising the efficiency bar, enhancing
industry competitiveness and profitability, and protecting consumer interests. All three strategies must be
tightly integrated and are all equally important in order for BTO to reach its goal. The focus of this report
is to develop a roadmap for the Windows and Buildings Envelope Research and Development Emerging
Research &
Development
Market
Stimulation
Codes and
Standards
BTO
Ecosystem
Figure 4. Integrated approach to BTO Program efforts

R&D Roadmap For Emerging Window And Building Envelope Technologies 3
Technologies (ET) Program that will integrate with the Market Stimulation and Codes and Standards
programs, and ultimately contributing to the larger BTO goals.
Emerging Technologies Program
The BTO ET Program funds research and development of energy-efficient and cost-effective building
technologies in industry, academia, and the Department of Energy national laboratories. The portfolio
includes technologies targeted at both new buildings and building retrofits for both the commercial and
residential building sectors. The ET Program funds a wide-range of technologies, including solid-state
lighting, space heating and cooling, windows and building envelope, water heating, modeling and tools,
and sensors and controls.
The ET mission is to accelerate the research, development, and commercialization of emerging, high-
impact building technologies that will impact the BTO program’s overall 2030 goal. The overall BTO
goal can be broken out into specific technology area goals. BTO analysis projects that if the overall BTO
goal is met in 2030, buildings will consume over 20% less energy from heating, ventilation, and air
conditioning (HVAC) and refrigeration due to improvements in the opaque portions of the building
envelope (walls, roofs, foundation, and infiltration), accounting for 4.2 quads total energy savings. Along
the same lines, improvements in windows will lead to 1.1 quads of energy savings due to reduced HVAC
and refrigeration use. In total, BTO projects the use of cost-effective, energy-efficiency technologies
could result in savings of 23.4 quads in 2030 (23% of these total savings are projected to result from
improvements in windows and building envelope technologies). This breakdown is shown in Figure 5.
-
5
10
15
20
25
30
35
40
45
Baseline EnergyUse
HVAC Lighting Water Heating Other Appliances Remaining Uses
Pri
mar
y En
ergy
(Q
uad
s)
Commercial Energy Use Commercial Energy Savings
Residential Energy Use Residential Energy Savings
23.4
Quads
Energy
Savings
Figure 5. Overall BTO energy savings goal in 2030 shown by commercial and residential building market segments4
4 Savings from building envelope and window technologies are included in HVAC, except for savings from daylighting
technologies, which are included in the form of reduced lighting energy consumption. Lighting energy savings result when
daylighting sensors and controls are able to turn off lights automatically when daylight enters a building. Non-daylighting
fenestration technologies will only reduce lighting energy load if there are associated lighting sensors and controls. The lighting
energy savings are not accounted for because sensors and controls for fenestration technologies are not included in the R&D
targets, except for visible light redirection.

R&D Roadmap For Emerging Window And Building Envelope Technologies 4
Figure 6 shows a notional timeline that would need to occur in order to achieve the 2030 BTO goal. This
report’s focus is on developing the roadmap, including quantitatitive metrics, to inform the upcoming
R&D activities. Market entry would need to occur no later than 2025 to give ample time for scale-up and
deployment efforts.
2014 2030
2015 2016 2017 2018 2019 2020 2021 2022 2023 2024 2025 2026 2027 2028 2029
Windows & Building Envelope
Program Goal:Meeting this goal
is projected to result in 5.3
quads of energy savings
2014 - 2025
R&D Progress
2023 - 2025
Market Entry(at the latest)
2025 - 2030
Deployment & Scale-Up
Figure 6. Notional timeline of anticipated building technology R&D progress
Role of Windows and Envelope Technologies in Reducing
Building Energy Consumption
Next-generation windows and building envelope technologies, such as those identified in this report, have
substantial potential to reduce energy consumption in buildings. However, to make significant progress
toward the program goal, any next-generation technologies must be developed with a specific emphasis
achieving a market-acceptable installed cost to facilitate mass-market adoption. Both transparent and
opaque components of the envelope protect building occupants from undesirable external environmental
conditions. Alternatively, the envelope can be constructed to take advantage of desirable external
conditions by providing natural lighting or ventilation. Both strategies may reduce the use of energy
consuming machinery in buildings. A complementary strategy employed by ET is to fund R&D for more
efficient machinery (e.g., more efficient heating, ventilation, and air conditioning [HVAC] systems or
more efficient lighting). A successful example of the role R&D can play to successfully stimulate product
innovation is described on the next page.

R&D Roadmap For Emerging Window And Building Envelope Technologies 5
The Low-E Window R&D Success Story† The development of low-emissivity (“low‑E”) windows in the late 1970s to 1980s offers an excellent case study to
show how government funded R&D and seed investments can make a significant impact on the market adoption of
energy-efficient technologies and, ultimately, the nation’s energy consumption. Low-E windows use a transparent
coating that blocks infrared radiation to keep heat outside the building on hot days and keep it inside the building on
cold days.
From 1976 to 1983, the U.S. government spent $2 million ($5.5 million in current dollars) to initiate window
research at Lawrence Berkeley National Laboratory (LBNL) and support research into low-E window technologies.
During that same time period, a start-up company called Suntek Research Associates (later renamed Southwall
Technologies) was formed by a group of Massachusetts Institute of Technology students to develop low-E window
technology. This fledgling company was unable to obtain adequate private-sector investment because of the
perception that low-E technology was unproven and risky, particularly for a company of that size. However, DOE
saw great promise in the technology and granted the company $700,000 ($1.95 million in current dollars) in initial
R&D funding on the condition that the company collaborate with a national laboratory. The company chose to
partner with LBNL, a collaboration that proved to be very fruitful, as Southwall was then able to develop the Heat
Mirror transparent film (released in 1981), the first low-E window technology to become a commercial product.
At that point, the major window and glass manufacturers became more interested in low-E technology and
accelerated their investment in low-E research, coating manufacturing, and window products. A major glass and
window manufacturer stated that “DOE-funded efforts in the late 1970s and early 1980s were important factors in
the critical decisions that led them to make [the] major capital investments” (Romm 1996) necessary to begin
producing low-E glass and windows. By the mid-1980s, industry investment in low-E manufacturing facilities had
grown to $150 million ($320 million in current dollars), and “virtually every major window and glass company
offered a low-E product” (Romm 1996).
Low-E windows rapidly increased market share, accounting for 20% of residential window sales by 1988. Further
adoption of these energy-efficient windows was driven by the introduction of ENERGY STAR® window standards
in 1998, to the point where today, low-E windows command a >80% market share of residential windows and a
>50% market share of commercial windows in the United States. Ultimately, DOE-sponsored research investments
into this technology helped generate net savings of more than $8 billion ($10.7 billion in current dollars) by 2000.
† This case study summary is adapted from the “Case Studies on the Government’s Role in Energy Technology Innovation: Low-
Emissivity Windows” by Jeffrey Rissman and Hallie Kennan of the American Energy Innovation Council. The full case study can be
found at: americanenergyinnovation.org/wp-content/uploads/2013/03/Case-Low-e-Windows.pdf.

R&D Roadmap For Emerging Window And Building Envelope Technologies 6
Figure 7. Composition of R&D roadmap workshop participants
Windows and Building Envelope R&D Program Roadmap
Workshop
A collaborative Windows and Building Envelope R&D Program Roadmap workshop was held on April 5,
2013 in Washington, DC, in order to lay the basis for this roadmap report. This facilitated workshop
provided a structured forum for participants to discuss challenges and identify and prioritize research
directions, goals, and metrics for the windows and building envelope community. Participants (see full
participant listing in Appendix A; also summarized in Figure 7) included researchers, industry leaders,
and other experts in the windows and building envelope community.
Following introductory remarks and presentations from DOE staff, the workshop began with a series of
overview presentations focused on relevant issues within the following areas:
1. Residential Windows: Highly Insulating Residential Windows using Smart Automated Shading
(Christian Kohler, LBNL)
2. Residential Building Envelope: Residential Envelopes: Future Market Needs (Eric Werling,
Building Technologies Office, Residential Buildings Program)
3. Commercial Building Envelope: Energy Efficient Integrated FRP-Confined Sandwich Roof for
Commercial Buildings (An Chen, University of Idaho)
4. Commercial Windows: Dynamic Control in Commercial Fenestration (Guillermo Garcia,
Heliotrope Technologies)
Following these plenary presentations, the workshop
participants split into four breakout discussion groups,
with each group focusing on one of the aforementioned
topic areas. During the breakout sessions, each of the four
groups prioritized R&D topic areas for building window
technologies and building envelope technologies. Each
discussion group identified the technical challenges
associated with each priority R&D topic. Workshop
participants then participated in an additional discussion
session to identify the metrics, milestones, and
roadmap/action plans associated with each R&D
topic area. The final discussion session allowed
for workshop participants to discuss relevant crosscutting perspectives, including soft costs, diagnostics,
filtration issues, aesthetics, the role of the contractor or architect, indoor air quality (IAQ), soundproofing,
and thermal comfort. The workshop concluded with presentations from breakout group representatives
summarizing results.
The results that emerged from the breakout group discussions form the basis of this report. The
International Energy Agency (IEA) has conducted a similar exercise to identify performance and cost
roadmaps for key building envelope and window technologies (International Energy Agency 2013). The
IEA publication identifies similar focus areas to the ones identified in this report, with comparable
performance and cost targets.
Industry35%
National Lab24%
Other Government
14%
Small Business12%
Academia11%
Other4%

R&D Roadmap For Emerging Window And Building Envelope Technologies 7
Organization and Purpose of the Roadmap
This roadmap focuses on R&D for windows and building envelope technologies. It is the result of
collaboration with prominent researchers and leaders in the field, and aims to prioritize BTO’s
investments in developing the next generation of high-performance, cost-competitive windows and
building envelope technologies. While it does not cover all relevant areas in depth, it does highlight some
ideas of particular importance. By identifying opportunities and the barriers inhibiting progress, it is
hoped that this roadmap will inform the strategic direction of BTO in soliciting and selecting innovative
technology solutions to overcome technical barriers and ultimately help fulfill the BTO mission and goal.
Chapter 2 of this roadmap provides an introduction to the BTO Prioritization Tool, which has been
utilized throughout this report to compare investment opportunities by evaluating energy savings potential
and cost effectiveness. Chapter 3 details technology roadmaps for emerging windows technologies, while
the focus of Chapter 4 is an analogous examination of emerging building envelope technologies. When
appropriate, each chapter identifies technologies relevant to the residential and commercial building
sectors. In addition, important stakeholders relevant to the technology’s development are also identified in
each chapter, as concerted action by all stakeholders will be critical to realizing BTO and ET goals.
Chapter 5 provides an overview of important crosscutting market drivers and challenges including soft
costs, building diagnostics and infiltration issues, aesthetics, the role of the contractor or architect,
acoustics and soundproofing, and building occupant thermal comfort. While the focus of this report is
R&D, these crosscutting market drivers are very important to facilitate the market adoption of any
technologies that are the result of focused R&D efforts and should be integrated into R&D projects as
early as possible.
Ultimately, success may require long-term, high-risk research and public-private collaborations between
academia, national laboratories, government, and private industry. This roadmap is a dynamic resource to
assist in this process, and as such it will continue to change and be refined and/or expanded as the market
develops and as technology breakthroughs emerge.

R&D Roadmap For Emerging Window And Building Envelope Technologies 8
2. IMPACT OF WINDOWS AND
BUILDING ENVELOPE
TECHNOLOGIES ON BUILDING
ENERGY CONSUMPTION Introduction to the Prioritization Tool
BTO has developed a comprehensive tool, called the Prioritization Tool (Farese 2012a), to compare
investment opportunities by evaluating their energy savings potential and cost effectiveness. BTO uses
the Prioritization Tool to perform sensitivity analyses and to inform programmatic decisions and targets.
The tool provides an objective framework for most energy-saving measures and scenarios, as well as
methodology, comparing long-term benefits and end-user costs applied to various markets, end-uses, and
lifetimes. The methodology for this tool has been described in detail elsewhere (Farese 2012b). In brief,
more than 500 building energy efficiency measures have been identified and input into the tool by
defining key metrics for each measure to describe energy efficiency performance, cost, market
penetration, and lifetime. These energy efficiency measures cover a spectrum of market opportunities,
including residential and commercial buildings, new and existing buildings, as well as industrial and
outdoor applications. Each measure is analyzed both individually and in the context of the full portfolio of
measures using stock and flow dynamics, technology diffusion, and a staging framework.
The tool outputs include:
Market size (TBtu): The energy consumption associated with a building component (e.g.,
windows), within a particular buildings market segment (e.g., commercial, residential, new or
existing buildings).
Payback period (years): Equal to the installed costs of an energy efficiency measure divided by
the projected annual energy savings. Payback period is assessed in the year 2030.
Technical potential (TBtu): Existing stock is instantly replaced with the new measure. The
technical potential represents the theoretical maximum energy savings available if the technology
is implemented in the U.S. buildings sector.
Unstaged maximum adoption potential (TBtu): A ‘stock and flow’ model accounting for unit
replacement, elimination, or addition. The unstaged maximum adoption potential represents the
energy savings that would result if the technology is deployed only for all end-of-life
replacements and new purchases.
Staged maximum adoption potential (TBtu): Measures with the lowest cost of conserved
energy are the first to capture their share of the market to avoid double counting. The staged
maximum adoption potential represents the energy savings that would result if the technology is
deployed only for all end-of-life replacements and new purchases. It does not include savings that
result from other technologies with a lower cost of conserved energy.

R&D Roadmap For Emerging Window And Building Envelope Technologies 9
This analysis framework provides one method to better understand the opportunities for energy-efficiency
technologies in buildings in the light of BTO’s overall goal of reducing energy consumption in buildings
by 50% by 2030. The tool allows for the evaluation of "what if" scenarios when pursuing potential
competing energy efficiency measures and it ultimately helps BTO create technology roadmap and
Funding Opportunity Announcements (FOAs) objectives. However, the methodology is only framed in
terms of the levelized cost of conserved energy, which is defined as the incremental investment in the
technology divided by the present value of the energy saved over the baseline energy use.5 Other market
drivers (thermal comfort, indoor air quality, aesthetics, etc.) are not accounted for and can certainly
impact the adoption of energy-efficiency technologies, especially for first adopters. Additionally, the tool
does not accurately capture the benefit of non-efficiency or enabling technologies, such as building
energy storage or building energy modeling.
As shown in Figure 3, within the U.S. buildings sector, 37% of primary energy is used for space heating
and cooling. Table 2 and Table 3 show the energy lost through windows (both conduction and solar heat
gain) and opaque building envelope components from heating and cooling in both the residential and
commercial building sectors in 2010 and projected for 2035. This data suggests that the building envelope
components that can have the most impact on energy savings in the residential sector are infiltration,
conduction through windows, and walls. In the commercial sector, the most impactful components are
infiltration and conduction through windows, followed by infiltration and conduction through walls.
However, it is noted that in cooling-dominated climates, solar heat gain from windows has a significant
energy impact in both the sectors. This data does not account for the impact of window technologies on
reducing lighting loads.
Table 2. Primary Energy Consumption Attributable to Fenestration and Building Envelope Components in 2010
(Quads)6
Building Component Residential Commercial
Heating Cooling Heating Cooling
Roofs 1.00 0.49 0.88 0.05
Walls 1.54 0.34 1.48 -0.03
Foundation 1.17 -0.22 0.79 -0.21
Infiltration 2.26 0.59 1.29 -0.15
Windows (Conduction) 2.06 0.03 1.60 -0.30
Windows (Solar Heat Gain) -0.66 1.14 -0.97 1.38
Source: Office of Energy Efficiency and Renewable Energy 2011b; Office of Energy Efficiency and Renewable Energy 2011d;
Office of Energy Efficiency and Renewable Energy 2011e; Office of Energy Efficiency and Renewable Energy 2011g
5 Discount rates are used to calculate a range of present values, from 3% (inflation), to 6%–10% (historic rates of returns on
bonds and securities), to 20%–40% (rates observed to govern some decisions). The default discount rate is 7%. 6 A negative value indicates the building component reduces heat load.

R&D Roadmap For Emerging Window And Building Envelope Technologies 10
Table 3. Primary Energy Consumption Attributable to Fenestration and Opaque Building Envelope Components
Projected for 2035 (Quads)6
Building Component Residential Commercial
Heating Cooling Heating Cooling
Roofs 0.92 0.55 0.80 0.04
Walls 1.42 0.37 1.35 -0.02
Foundation 1.08 -0.24 0.72 -0.16
Infiltration 2.09 0.65 1.18 -0.11
Windows (Conduction) 1.90 0.03 1.46 -0.23
Windows (Solar Heat Gain) -0.61 1.26 -0.89 1.03
Source: Office of Energy Efficiency and Renewable Energy 2011c; Office of Energy Efficiency and Renewable Energy 2011d;
Office of Energy Efficiency and Renewable Energy 2011f; Office of Energy Efficiency and Renewable Energy 2011g
Table 4 shows the stock of residential buildings in 2010 and what is projected for 2035. Similarly, Table
5 shows the total floorspace of new and residential commercial buildings in 2010 and projected to 2035.
These tables show the number of residential buildings or commercial floorspace built prior to 2010 and
the number of buildings and commercial floor space built post-2010. For both the residential and
commercial building sectors, the number of buildings built prior to 2010 continues to be the majority of
overall buildings even past the year 2035. This is important to note in light of the overall BTO goal,
which encompasses both new and existing buildings. Retrofitting existing buildings often requires
different, more challenging technologies at different price points than the energy-efficient technologies
that can be used for new buildings. However, because existing buildings dominate the market in 2010 and
will continue to do so for the foreseeable future, all of the priority R&D areas discussed herein must be
applicable to retrofitting existing buildings.
Table 4. New and Existing Residential Buildings in 2010 and 2035.7
Source: Energy Information Agency 2013a; Energy Information Agency 2013b
Table 5. New and Existing Commercial Building Floorspace in 2010 and 2035.8
Source: Energy Information Agency 2010; Energy Information Agency 2013c
Number of Buildings (millions)
Pre-2010 Buildings Post-2010 Buildings
2010 81.7 1.2
2035 52 51
Total Floorspace (billion ft2)
Pre-2010 Buildings Post-2010 Buildings
2010 79.3 1.8
2035 52.8 50.2
7 Numbers in this table assume a building lifespan of 70 years in order to account for changes in building stock from year to year.
Apartment buildings are excluded from the estimates in this table. 8 Numbers in this table assume a building lifespan of 70 years in order to account for changes in building stock from year to year.

R&D Roadmap For Emerging Window And Building Envelope Technologies 11
Prioritization Tool Results
BTO has used the Prioritization Tool (PT) to analyze a wide range of windows and building envelope
technologies. The results for technologies at development level9 3, 2, or 1 that are most relevant to the
roadmap R&D targets are summarized graphically in Figure 8, Figure 9, Figure 10, and Figure 11 below,
and are also shown in more detail in Table 34 and Table 35 in Appendix C. These figures and tables show
the market size (TBtu), technical potential (TBtu), the unstaged maximum adoption potential (TBtu), and
staged maximum adoption potential (TBtu) for each technology. The applicable buildings market
segment, residential (R) and/or commercial (C) is shown on the x-axis label. The PT results use present-
day costs of the installed measures, assuming significant market adoption, as described in more detail in
(Farese 2012b).
Figure 8 shows PT results for select windows technologies. These results are shown in more detail in
Appendix C, Table 34. Among these window technologies, the technical potential impact of R-10
window development is greatest, equal to just greater than 2 quads of energy savings by the year 2030.
However, the staged max adoption potential of R-10 windows is only 234 TBtu, which indicates that R-
10 windows will need considerable cost reductions in order to achieve these energy savings (the staged
max adoption potential adjusts the unstaged max adoption potential to avoid double-counting energy
savings from measures of overlapping markets and the max adoption potential accounts for savings of the
lowest cost measures first). Window attachments, including energy-efficient low-E storm windows,
cellular shades, and low-E window films, have sizable technical potential savings with reasonable
payback periods. However, other than the automated window attachments, which require integration with
low-cost sensor and control technologies, these products are in need of market-driving initiatives in order
to accelerate adoption, rather than the R&D that is focused on in this roadmap. Dynamic windows, on the
other hand, are much more costly, particularly in the commercial sector. Daylighting technology’s
technical potential is more limited and adoption is limited by high costs.
Figure 9 shows PT results for a wide array of building envelope technologies, covering a broad range of
energy savings potential and payback periods. These PT results are shown in more detail in Appendix C,
Table 35. A variety of thermal insulation materials are shown, of which R-6/in sheathing with sealing has
the largest staged max adoption potential and lowest payback period. The figure clearly shows that VIPs
in walls in existing buildings have the greatest potential to save energy with a technical potential of 1,099
and 575 TBtu in residential and commercial buildings, respectively. However, the unstaged and staged10
maximum adoption potential data show that VIPs will have limited market penetration without a
substantial reduction in cost. This trend is observed for other thermally insulating building envelope
components as well, suggesting that the focus of R&D for these technologies should be on installed cost
reduction. On the other hand, roofing technologies for the commercial sector, including cool roofs and
thermally insulating roof technologies, have technical potentials of 90 and 100 TBtu, respectively, but
they also have substantial market penetration in part because of a short payback periods. Figure 10 shows
9 Level 1 is defined as early stage R&D (i.e., lab bench scale, beyond basic science), level 2 is defined as late stage R&D (cost
reduction and performance improvements still needed, but technology may be available to early adopters), and level 3 is defined
as early deployment (energy savings are not yet proven in a whole building context). 10 Staged Maximum Adoption Potential (TBtu) assumes that measures with the lowest cost of conserved energy are the first to
capture their share of the market to avoid double counting. The staged maximum adoption potential represents the energy savings
that would result if the technology is deployed only for all end-of-life replacements and new purchases, and does not include
savings that result from other technologies with a lower cost of conserved energy.

R&D Roadmap For Emerging Window And Building Envelope Technologies 12
building wrap technologies that offer substantial savings potential with relatively low payback periods,
especially in the residential sector, but building wrap technologies do not provide system-level control of
heat, moisture, and air that would increase functionality over today’s technologies and increase
deployment and energy savings impact. Finally, Figure 11 shows PT results for highly insulating
commercial building roofs that have relatively small savings potential and thus require performance
improvements in order to enable more substantial energy savings (Farese 2012b).
0
200
400
600
800
1,000
1,200
1,400
1,600
1,800
2,000
R-10Windows
(R)
R-10Windows
(C)
WindowAttachments
(R)
WindowAttachments
(C)
DynamicWindows,
ExistingBuildings
(R)
DynamicWindows,
New Buildings(R)
DynamicWindows,
ExistingBuildings
(C)
DynamicWindows,
New Buildings(C)
Daylighting(50 ft. plate)
(C)
Pri
mar
y En
erg
y Sa
vin
gs, 2
03
0 (
TBtu
)
Market Size (TBtu)
Technical Potential, 2030 (TBtu)
Unstaged Max Adoption Potential, 2030 (TBtu)
Staged Max Adoption Potential, 2030 (TBtu)
Figure 8. Prioritization tool analysis results for select windows technologies at development levels 1, 2, or 3

R&D Roadmap For Emerging Window And Building Envelope Technologies 13
0
200
400
600
800
1,000
1,200
1,400
1,600
1,800
2,000
R-6Sheathing
withSealing
(R)
Sheathingwith
Siding, NoInsulation
(R)
Sheathingto EIFS
Upgrade(R)
EIFS withSealing
(R)
EIFS R-30Walls
(C)
R-30Walls,
ExistingHomes
(R)
R-30Walls,New
Homes(R)
VIPs inWalls,
ExistingBuildings
(R)
VIPs inWalls,
ExistingBuildings
(C)
VIPs inWalls,New
Buildings(C)
R-10 SlabEdge inExistingHomes
(R)
Pri
mar
y En
erg
y Sa
vin
gs, 2
03
0 (
TBtu
)Market Size (TBtu)
Technical Potential, 2030 (TBtu)
Unstaged Max Adoption Potential, 2030 (TBtu)
Staged Max Adoption Potential, 2030 (TBtu)
Figure 9. Prioritization tool analysis results for select thermal insulation materials at development levels 1, 2, or 3

R&D Roadmap For Emerging Window And Building Envelope Technologies 14
0
200
400
600
800
1,000
1,200
1,400
1,600
1,800
2,000
Building Wrap(C)
Building Wrap(infiltration reduction of 40%
in 47% of drafty homes)(R)
Air Sealing Systems(infiltration reduction of 10% in
commercial buildings)(C)
Pri
mar
y En
erg
y Sa
vin
gs, 2
03
0 (
TBtu
)Market Size (TBtu)
Technical Potential, 2030 (TBtu)
Unstaged Max Adoption Potential, 2030 (TBtu)
Staged Max Adoption Potential, 2030 (TBtu)
Figure 10. Prioritization tool analysis results for select air-sealing system technologies at development levels 1, 2, or 3
0
200
400
600
800
1,000
1,200
1,400
1,600
1,800
2,000
Increase Roof Insulation,New Buildings
(C)
Increase Roof Insulation,Existing Buildings
(C)
Cool Roofs, 0.75 SR,Hot Climates
(C)
Pri
mar
y En
erg
y Sa
vin
gs, 2
03
0 (
TBtu
)
Market Size (TBtu)
Technical Potential, 2030 (TBtu)
Unstaged Max Adoption Potential, 2030 (TBtu)
Staged Max Adoption Potential, 2030 (TBtu)
Figure 11. Prioritization tool analysis results for select commercial roofing technologies at development levels 1, 2, or 3

R&D Roadmap For Emerging Window And Building Envelope Technologies 15
3. ROADMAP FOR EMERGING
WINDOWS TECHNOLOGIES Priority R&D Topics Summary
Improving building energy performance will require R&D to produce low-cost advanced materials and
window technologies that can be easily and cost-effectively installed into new building construction and
existing retrofits. The mission of the BTO ET Program is to accelerate the research, development, and
commercialization of emerging, high-impact building technologies. This roadmap report aims to
contribute to this mission by identifying technology R&D opportunities and barriers.
Taking into consideration traditional development schedules, window R&D topics will need to be
identified and initiated in the near future in order to have technologies ready for mass-market adoption by
2030. These designs will need to be applicable to both new buildings and retrofits. Numerous topics can
be pursued; however, BTO internal analysis and stakeholder engagement indicates that the following
areas will have the largest potential for energy savings. These topics, which will be individually
expounded in more detail, are summarized in the table below:
Table 6. Residential and Commercial Window Priority Research Topics11
Technology
Description
Target
Sector(s) 2025 Cost Target12 2025 Performance Target
Highest Priority R&D Area
Highly
insulating
windows
Commercial
and
Residential
Sectors
Residential sector: Projected installed cost premium ≤$6/ft
2 compared to the 2010
standard base of windows Commercial sector: Projected installed cost premium ≤$3/ft
2 compared to the 2010
standard base of windows
Residential sector: R-10 windows with VT>0.6.13
Commercial sector: R-7 windows with VT >0.4.13
Highly insulating windows must be at comparable
thickness and weight to the currently installed
window base to enable retrofits.
High Priority R&D Areas
Dynamic
windows and
window films
Commercial
and
Residential
Sectors
Dynamic windows: Projected installed cost
premium ≤$8/ft2 compared to a standard IGU
Dynamic window films: Projected installed cost
premium ≤$2/ft2 compared to a standard IGU
Demonstrate SHGC > 0.4 with VT bleached
state >0.6 for the residential sector and >0.4 for
the commercial sector.13
Visible light
redirection
Commercial
Sector
Projected installed cost premium ≤$5/ft2
compared to the cost of a standard window or
blind installation including costs of sensors and
lighting controls
Reduce lighting energy use by 50% for a
50-ft floor plate
11 There is a wide range of technologies that can be used to reduce energy consumption in buildings; however, because of limited
R&D funds BTO must prioritize its investments for technologies with the greatest energy savings potential. Thus, while BTO
will be investing in a wide range of technologies, the majority of its focus will be on highest priority R&D areas. 12 Cost targets in this report are quantified in order to provide a viable critical pathway from current technology R&D status to a
cost target that, at scale, will facilitate mass-market technology adoption. 13 Visible transmission should be sufficient to provide a market-acceptable level of daylighting in the relevant sector without
negatively impacting lighting load. Visible transmission performance targets are based on center-of-glass measurements.

R&D Roadmap For Emerging Window And Building Envelope Technologies 16
Table 2 shows the energy lost (conduction and solar heat gain) through windows and opaque building
envelope components in 2010 and Table 3 shows the projected loss for 2035. In 2010 in the residential
sector, conduction through windows accounted for 2.06 quads of lost energy used for space heating, but
offset cooling loads by 0.03 quads. Along those same lines in the commercial sector, conduction through
windows accounted for 1.60 quads of energy lost in space heating, offset by 0.30 quads of cooling loads.
In the residential sector, solar heat gain through windows accounted for 1.14 quads of energy lost from
space cooling, but provided 0.66 quads of heating energy. Similarly in the commercial sector, solar heat
gain through windows accounted for 1.38 quads of energy lost from cooling, but offset heating loads by
0.97 quads. The projected trends are similar for 2035. In aggregate, this data suggests that in both the
residential and commercial sectors the most impactful strategy for reducing energy lost through windows
is to focus on reducing energy losses resulting from conduction through windows. However, strategies
focused on mitigating solar heat gain are clearly needed in cooling-dominated climates. In addition, the
development of these highly insulating windows can also be integrated with other next-generation
technologies, such as dynamic fenestration systems, daylighting systems, controls, and building integrated
photovoltaics (PV).
Table 7. Roadmap Target Prioritization Tool Analysis Results for Window Technologies, Including Highly
Insulating Window Technologies, Dynamic Window Technologies, and Visible Light Redirection Technologies
Window Technologies
Roadmap Target Technology Description
Market Size14 (TBtu)
Technical Potential15, 2030 (TBtu)
Unstaged Max Adoption
Potential16, 2030 (TBtu)
Payback in 2030 (years)
Prioritization Tool
Measure Number17
Highest Priority: Highly Insulating Windows
R-10 windows (R) 1,589 1,409 969 5.3 421
R-7 windows (C) 780 599 263 8.3 422
Dynamic Window Technologies
Dynamic window films (R) 257 121 121 7.2 651
Dynamic window films (C) 133 79 79 21 652
Dynamic windows, existing buildings (R) 1,961 1,010 571 10 401
Dynamic windows, new buildings (R) 532 212 138 12 400
Dynamic windows, existing buildings (C) 947 416 73 22 402
Dynamic windows, new buildings (C) 911 308 215 21 399
Visible Light Redirection Technologies
Visible light redirection (C) 682 345 168 10 816
14 Market Size represents the energy consumption associated with a building component (e.g., windows), within a particular
buildings market segment (e.g., commercial, residential, new or existing buildings). 15 Technical Potential assumes existing stock is immediately replaced with the new measure. The technical potential represents
the theoretical maximum energy savings available if the technology is implemented in the U.S. buildings sector (free of practical
constraints such as financing and deployment considerations). 16 Unstaged Maximum Adoption Potential (TBtu) assumes a ‘stock and flow’ model accounting for unit replacement,
elimination, or addition. The unstaged maximum adoption potential represents the energy savings that would result if the
technology is deployed only for all end-of-life replacements and new purchases. 17 Detailed sources for each measure number are shown in Appendix C.
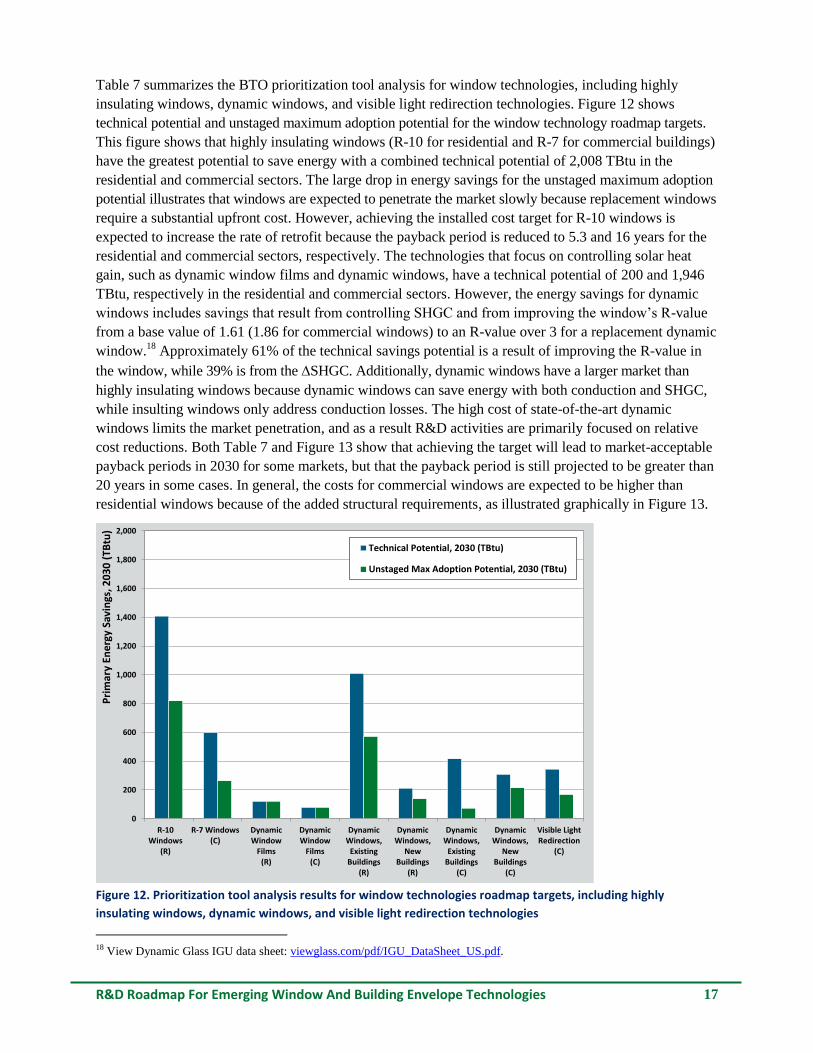
R&D Roadmap For Emerging Window And Building Envelope Technologies 17
Table 7 summarizes the BTO prioritization tool analysis for window technologies, including highly
insulating windows, dynamic windows, and visible light redirection technologies. Figure 12 shows
technical potential and unstaged maximum adoption potential for the window technology roadmap targets.
This figure shows that highly insulating windows (R-10 for residential and R-7 for commercial buildings)
have the greatest potential to save energy with a combined technical potential of 2,008 TBtu in the
residential and commercial sectors. The large drop in energy savings for the unstaged maximum adoption
potential illustrates that windows are expected to penetrate the market slowly because replacement windows
require a substantial upfront cost. However, achieving the installed cost target for R-10 windows is
expected to increase the rate of retrofit because the payback period is reduced to 5.3 and 16 years for the
residential and commercial sectors, respectively. The technologies that focus on controlling solar heat
gain, such as dynamic window films and dynamic windows, have a technical potential of 200 and 1,946
TBtu, respectively in the residential and commercial sectors. However, the energy savings for dynamic
windows includes savings that result from controlling SHGC and from improving the window’s R-value
from a base value of 1.61 (1.86 for commercial windows) to an R-value over 3 for a replacement dynamic
window.18
Approximately 61% of the technical savings potential is a result of improving the R-value in
the window, while 39% is from the SHGC. Additionally, dynamic windows have a larger market than
highly insulating windows because dynamic windows can save energy with both conduction and SHGC,
while insulting windows only address conduction losses. The high cost of state-of-the-art dynamic
windows limits the market penetration, and as a result R&D activities are primarily focused on relative
cost reductions. Both Table 7 and Figure 13 show that achieving the target will lead to market-acceptable
payback periods in 2030 for some markets, but that the payback period is still projected to be greater than
20 years in some cases. In general, the costs for commercial windows are expected to be higher than
residential windows because of the added structural requirements, as illustrated graphically in Figure 13.
0
200
400
600
800
1,000
1,200
1,400
1,600
1,800
2,000
R-10Windows
(R)
R-7 Windows(C)
DynamicWindow
Films(R)
DynamicWindow
Films(C)
DynamicWindows,
ExistingBuildings
(R)
DynamicWindows,
NewBuildings
(R)
DynamicWindows,
ExistingBuildings
(C)
DynamicWindows,
NewBuildings
(C)
Visible LightRedirection
(C)
Pri
mar
y En
erg
y Sa
vin
gs, 2
03
0 (
TBtu
)
Technical Potential, 2030 (TBtu)
Unstaged Max Adoption Potential, 2030 (TBtu)
Figure 12. Prioritization tool analysis results for window technologies roadmap targets, including highly
insulating windows, dynamic windows, and visible light redirection technologies
18 View Dynamic Glass IGU data sheet: viewglass.com/pdf/IGU_DataSheet_US.pdf.

R&D Roadmap For Emerging Window And Building Envelope Technologies 18
0
10
20
30
40
50
60
70
80
R-10 Windows(R)
R-7 Windows(C)
DynamicWindows,
Existing Buildings(R)
DynamicWindows,
New Buildings(R)
DynamicWindows,
Existing Buildings(C)
DynamicWindows,
New Buildings(C)
Visible LightRedirection
(C)
Pay
bac
k P
eri
od
(ye
ars)
Payback in 2030, Baseline Technology (years)
Payback in 2030, Roadmap Target (years)
Figure 13. Comparison of payback periods for baseline technologies and technologies that achieve the roadmap
cost and performance targets19
Crosscutting Barriers for Next-Generation Window
Technologies
The key crosscutting challenges to innovative R&D for next-generation window technologies include the
availability of high-performance materials, innovative manufacturing processes to reduce costs, and the
ability to integrate new technologies into existing building systems.
Materials – Increased costs of high performance materials may lead to greater up-front costs that
must be passed down the supply chain to building owners. Additionally, while technically
feasible, advanced concepts for high-performance windows may be hindered by the potentially
limited availability of high-performance, next-generation materials.
Manufacturing – Manufacturing costs must be lowered in order to facilitate mass-market
adoption of next-generation window technologies. As such, technology development should
proceed forward cognizant of the need to transition to automated, high-throughput manufacturing
and installation processes that can be used for custom and large sized components.
System integration – The inability to integrate new technologies into current system
configurations (retrofits) and then demonstrate improved system performance is a significant
challenge. Appropriate test methods and standards are lacking to ensure or prove the integrated
performance of systems with capabilities that are not found in today’s windows.
19 The payback for R-7 window technology is based on a cost premium of $25/ft2. This cost is an estimate that is between the
costs of R-10 windows and R-5 windows shown in Appendix C.

R&D Roadmap For Emerging Window And Building Envelope Technologies 19
Windows Highest Priority R&D Topic 1: Highly Insulating
Windows
Overview
Highly insulating windows have the potential for substantial energy savings relative to existing windows,
which typically possess R-values ranging from R-1 (single glass) to R-3 (double glazing with low-E) and
R-4 (triple or quadruple glazing). R-factors are a measure of thermal conductivity; a higher R-value
signifies a more insulating window.20
For example, BTO internal analysis shows that the technical
potential of R-10 windows is 2 quads by 2030, but the unstaged and staged21
maximum adoption potential
by 2030 is only 1.4 and 0.23 quads, respectively, because the stock of existing windows is slow to turn over.
The targeted outcome for R&D is a cost-effective, highly insulating window with reduced installation
cost. Separate cost and performance targets have been identified for windows in the residential and
commercial sectors. In the residential sector, the target is to develop R-10 windows with less than $6/ft2
installed cost premium over the 2010 installed base of windows (R-1.61 for residential windows). In the
commercial sector, the target is to develop R-7 windows with less than $3/ft2 installed cost premium over
the 2010 installed base of windows (R-1.86 for commercial windows). In both cases, sufficient VT must
be maintained to provide daylighting, approximately >0.6 for the residential sector and >0.4 for the
commercial sector, based on center-of-glass measurements. The weight and thickness of these windows
must be comparable to the existing stock of windows to enable retrofits of existing buildings. Commercial
windows must also meet much more demanding structural tests (design pressures, deflection limits,
torsion, and other hurricane ratings, operability, etc.) as well as very different market demands for design
flexibility, durability, and integration into different wall facades in order to ensure market acceptability.
The R&D roadmap for moving toward next-generation residential and commercial window deployment is
shown in Table 11. Key technical and market barriers preventing achievement of this target are discussed
below, while detailed R&D barriers are also discussed in Table 9.
Performance improvement needed for highly insulating windows –
o Glass/glazing: high performance glass and glazings require next-generation, low-E
coatings; multi-pane glazing systems; and highly insulated translucent panels. Durability
improvements are needed for vacuum glazing edge seals to maintain gas retention and
soft low-E coatings to maintain performance over the expected lifetime of a window.
o Frames: For typical window frames, the glass R-value drops significantly at the IGU
edge. Improved frame materials can reduce demand for ultra-high-performance glass and
lead to super-low-conductivity frames. Advanced window frames should be able to pass
20 A similar metric to the R-value (units: ft²·°F·hr/Btu) is the U-factor, which is generally presented as the inverse of the R-value
(
, where k is material thermal conductivity and L is the material thickness). U-factors express the insulation value of
windows, while R-values are used to express the insulation value of both window and opaque building envelope elements (i.e.,
walls, roofs). As such, R-values are used throughout this report in order to use a consistent metric across window and envelope
technologies. 21 Staged Maximum Adoption Potential (TBtu) assumes that measures with the lowest cost of conserved energy are the first to
capture their share of the market to avoid double counting. The staged maximum adoption potential represents the energy savings
that would result if the technology is deployed only for all end-of-life replacements and new purchases, and does not include
savings that result from other technologies with a lower cost of conserved energy.

R&D Roadmap For Emerging Window And Building Envelope Technologies 20
long-term air infiltration and structural requirements in order to gain a high-performance
window label.
Window construction cost reductions – Cost reductions are needed for the overall assembly of
triple-glazed units with a thin glass middle layer, krypton gas fill22
, and multiple low-E coatings.
Cost savings will likely come from manufacturing advances that enable automated, high-
throughput product manufacturing and installation while still being able to produce custom sizes
required in diverse building applications.
Amenability to retrofits – Highly insulating windows must be developed at reduced or at least
comparable thickness and weight to the currently installed window base so that they are amenable
for commercial and residential building retrofit applications. A bulky/heavy window is also more
costly to transport.
Simplified window installation – Window installation is currently labor intensive, expensive,
and variable. In order to enable mass-scale and possibly automated retrofits, window installation
must be simplified to be “snap-in” or “dummy-proof.” Effectively, the entire window system,
including all components and insulation, must be easily installed with the “snap-in” capability.
BTO internal analysis shows that if the R&D roadmap cost and performance targets are achieved, the
payback period would be reduced from 12 to 5.3 years and 66 to 8 years for the residential and
commercial sectors, respectively. BTO projections show that energy savings from highly insulating
windows would become even more substantial beyond 2030 as the installed base of windows turns over.
Windows are generally a once-in-a-lifetime purchase, and as such the diffusion of new window
technologies into the market will take longer than other energy-efficiency technologies.
Figure 14. R-5 window, schematic diagram (left) and commercial product (right) (images courtesy of
Alcoa/TRACO)
Figure 15 (with corresponding data shown in Table 8) shows the results of an economic sensitivity
analysis for highly thermally insulating residential windows, considering the projected impacts of high
($18/ft2), medium ($12/ft
2) and low ($6/ft
2) installed cost premiums. The payback period is more heavily
dependent on the installed cost of the window than on the R-value. For example, the payback of R-10
windows decreases by a factor of 3 when reducing the installed cost premium from $18/ft2 to $6/ft
2.
22 Due to its higher molecular mass, krypton is a more effective insulator than argon (
√
, where k = thermal
conductivity, cv = constant volume specific heat capacity of gas, = molecular radius, T = temperature and MW = molar mass of
gas). The thermal conductivity of krypton is 0.0053 Btu/ft²·°F·hr, while the thermal conductivity of argon is 0.0093 Btu/ft²·°F·hr.
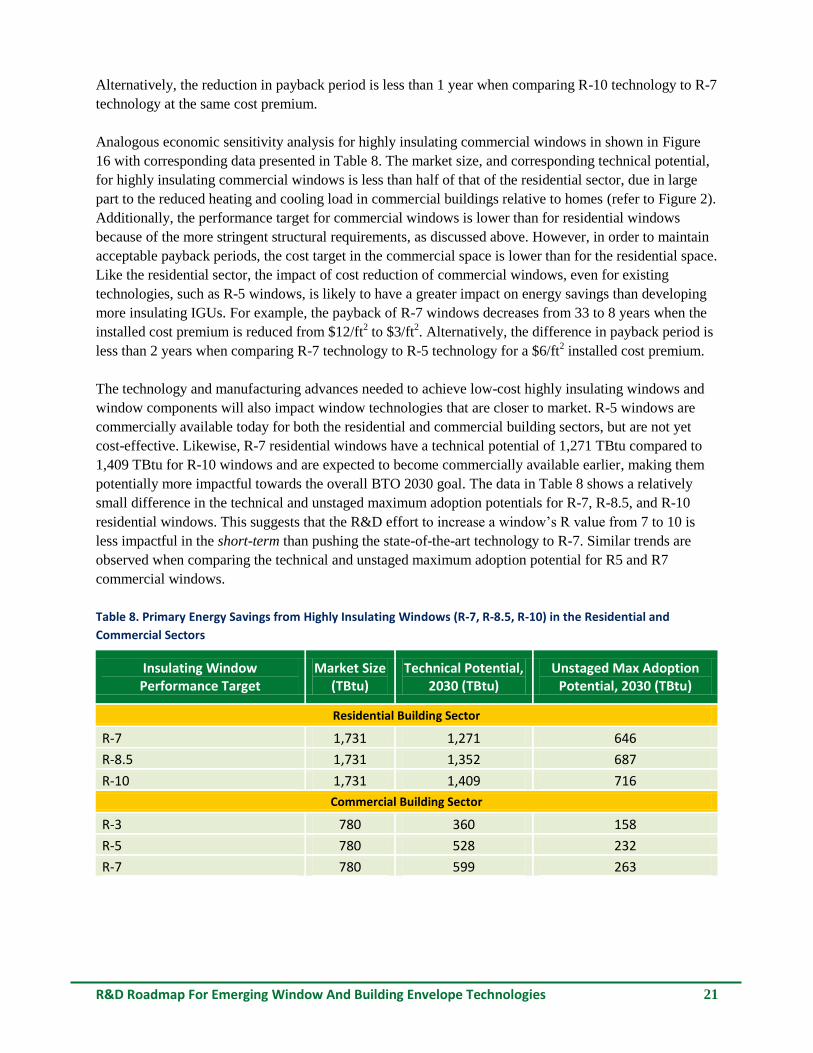
R&D Roadmap For Emerging Window And Building Envelope Technologies 21
Alternatively, the reduction in payback period is less than 1 year when comparing R-10 technology to R-7
technology at the same cost premium.
Analogous economic sensitivity analysis for highly insulating commercial windows in shown in Figure
16 with corresponding data presented in Table 8. The market size, and corresponding technical potential,
for highly insulating commercial windows is less than half of that of the residential sector, due in large
part to the reduced heating and cooling load in commercial buildings relative to homes (refer to Figure 2).
Additionally, the performance target for commercial windows is lower than for residential windows
because of the more stringent structural requirements, as discussed above. However, in order to maintain
acceptable payback periods, the cost target in the commercial space is lower than for the residential space.
Like the residential sector, the impact of cost reduction of commercial windows, even for existing
technologies, such as R-5 windows, is likely to have a greater impact on energy savings than developing
more insulating IGUs. For example, the payback of R-7 windows decreases from 33 to 8 years when the
installed cost premium is reduced from $12/ft2 to $3/ft
2. Alternatively, the difference in payback period is
less than 2 years when comparing R-7 technology to R-5 technology for a $6/ft2 installed cost premium.
The technology and manufacturing advances needed to achieve low-cost highly insulating windows and
window components will also impact window technologies that are closer to market. R-5 windows are
commercially available today for both the residential and commercial building sectors, but are not yet
cost-effective. Likewise, R-7 residential windows have a technical potential of 1,271 TBtu compared to
1,409 TBtu for R-10 windows and are expected to become commercially available earlier, making them
potentially more impactful towards the overall BTO 2030 goal. The data in Table 8 shows a relatively
small difference in the technical and unstaged maximum adoption potentials for R-7, R-8.5, and R-10
residential windows. This suggests that the R&D effort to increase a window’s R value from 7 to 10 is
less impactful in the short-term than pushing the state-of-the-art technology to R-7. Similar trends are
observed when comparing the technical and unstaged maximum adoption potential for R5 and R7
commercial windows.
Table 8. Primary Energy Savings from Highly Insulating Windows (R-7, R-8.5, R-10) in the Residential and
Commercial Sectors
Insulating Window Performance Target
Market Size (TBtu)
Technical Potential, 2030 (TBtu)
Unstaged Max Adoption Potential, 2030 (TBtu)
Residential Building Sector
R-7 1,731 1,271 646
R-8.5 1,731 1,352 687
R-10 1,731 1,409 716
Commercial Building Sector
R-3 780 360 158
R-5 780 528 232
R-7 780 599 263

R&D Roadmap For Emerging Window And Building Envelope Technologies 22
0
2
4
6
8
10
12
14
16
18
20
R-7 Windows R-8.5 Windows R-10 Windows
Pay
bac
k (y
ear
s)
Insulating Windows - Residential Sector
$6/ft² Premium $12/ft² Premium $18/ft² Premium
Figure 15. Sensitivity analysis of simple payback time for highly insulating windows (R-7, R-8.5, R-10) in the
residential sector
0
10
20
30
40
50
60
R-3 Windows R-5 Windows R-7 Windows
Pay
bac
k (y
ear
s)
Insulating Windows - Commercial Sector
$3/ft² Premium $6/ft² Premium $12/ft² Premium
Figure 16. Sensitivity analysis of simple payback time for highly insulating windows (R-3, R-5, R-7) in the
commercial sector

R&D Roadmap For Emerging Window And Building Envelope Technologies 23
Technical Barriers and Challenges
Table 9. Technical Barriers and Challenges to the Development and Cost-Reduction of Highly Insulating Windows
Topic/Barrier Description R
&D
Bar
rie
rs
Low-cost, inert gases for multilayer insulated glazings
Krypton is currently too expensive for mass adoption in windows
Cost-effective, improved performance vacuum insulated glass (VIG)
Expansion/contraction of interior/exterior lites (i.e., panes of glass) to increase VIG durability
Novel materials and designs for aesthetically pleasing windows and window films
Multilayer reflections need to be reduced while controlling glare and maintaining visible light transmittance (VT) to achieve market-acceptable aesthetics
Improved performance framing materials
The R-factor of a highly insulated frame needs to be reduced by a factor of two
Low-cost materials to increase the R value at the glass/frame interface while achieving higher durability and stability specifications
Highly insulating frame technology that meets the North American Fenestration Standard (NAFS-12) governing windows, doors, and skylights (NAFS 2012).
Performance improvements are needed for existing high-performance technologies
Technologies in need of performance improvements include:
Spacer system for thin center lite triple
Pillars, edge-effect conductivity
Thermal simulation methods (3-D)
Improved durability for soft-coat, low-E coatings
Man
ufa
ctu
rin
g
and
Sca
le-U
p
Bar
rie
rs
New equipment and manufacturing methods
Innovative and new cost-effective manufacturing methods are needed for:
High-precision automated manufacturing processes capable of handling triple-pane windows with thin glass
Manufacturing processes capable of handling custom-size and large-size windows
VIG manufacturing processes
Market and Deployment Barriers
Table 10. Market and Deployment Barriers to the Adoption of Highly Insulating Windows
Market/Deployment Barrier Description
Codes and Enforcement
A lack of code enforcement could hinder market deployment. More stringent and
regularly enforced building energy codes that support the use of highly insulating
(>R-7) windows will drive demand.
Consumer Education Readily available and easy to understand information must be made available to
consumers interested in the latest in energy-efficient window technology.

R&D Roadmap For Emerging Window And Building Envelope Technologies 24
Table 11. Highly Insulating Windows R&D Technology Roadmap
Topic Description: Highly Insulating Windows 1) Residential Windows: R-10 window with sufficient VT to provide daylighting, approximately >0.6 based
on center-of-glass measurements and a ≤$6/ft2 projected installed cost premium compared to 2010
standard base windows (R-1.61). 2) Commercial Windows: R-7 window with sufficient VT to provide daylighting, approximately >0.4 based
on center-of-glass measurements and ≤$3/ft2 projected installed cost premium compared to 2010
standard base windows (R-1.86).
For both the residential and commercial sectors, the weight and thickness of these windows must be comparable to the existing stock of windows to enable retrofits of existing buildings.
Roadmap Action Plan Activities Milestones
Ne
ar T
erm
(<5
yrs
)
Develop durable VIG materials, such as flexible edge seals
Improve advanced frame materials and designs
Develop multi-pane glazing systems, including non-VIG
Develop a high-performance, low-E coating that can withstand higher manufacturing temperatures
Develop spacer design for triple pane systems with thin glass
Optimize low-conductivity edge seal/pillars
Develop highly insulating translucent panels
Residential: R-7 window ≤$10/ft2
projected installed cost premium by 2018
Commercial: R-5 window ≤$8/ft2
projected installed cost premium by 2018
ASTM International/industry standard for durability passed
Commercial and residential window structural requirements met
Mid
Te
rm
(6 –
9 y
rs)
Optimize durable VIG materials, such as flexible edge seals
Optimize advanced frame materials and designs
Optimize multi-pane glazing systems, including non-VIG
Optimize a high-performance, low-E coating that can withstand higher manufacturing temperatures
Optimize spacer design for triple pane systems with thin glass
Residential: R-10 window ≤$10/ft2
projected installed cost premium by 2021
Commercial: R-7 window ≤$8/ft2
projected installed cost premium by 2021
ASTM International/industry standard for durability passed
Commercial and residential window structural requirements met
Lon
g Te
rm
(9 –
12
yrs
)
Field demonstrations to prove payback
Scale-up and optimize manufacturing
Residential: R-10 window ≤$6/ft2
projected installed cost premium by 2025
Commercial: R-7 window ≤$3/ft2
projected installed cost premium by 2025
Benefits and Impacts
Factor Impact Description
New Buildings High Drive higher use of these products to impact other aspects of building design (e.g.,
reduced HVAC size daylight optimization)
Retrofit Buildings High
Energy impacts would not be as high for retrofits as new buildings because retrofits
do not always allow capturing of all potential benefits (e.g., HVAC size reduction,
daylight capturing). However, the large number of existing buildings may offset that
difference on a national or global scale
Industry
Competitiveness High
Manufacturers would strive to improve their product performance in their portfolios
to stay competitive
Cost Reduction High
Residential: The payback period for currently available R-10 windows is estimated at
12 years. Meeting cost reduction targets will reduce payback to 5 years.
Commercial: The payback period for currently available R-10 windows or R-7
windows is estimated to be greater than 50 years. Meeting the roadmap cost
reduction targets will reduce payback to 8 years.

R&D Roadmap For Emerging Window And Building Envelope Technologies 25
$10/ft2 $10/ft2
$6/ft2
R-7
R-10 R-10
0
2
4
6
8
10
0
2
4
6
8
10
12
14
16
18
20
2014 2016 2018 2020 2022 2024 2026
Win
do
w T
her
mal
Re
sist
ance
R-V
alu
e (h
r·ft
2·°
F/B
tu)
Inst
alle
d C
ost
Pre
miu
m
com
par
ed t
o 2
01
0 B
ase
Win
do
w$
/ft2
Year
Figure 17. Highly insulating window installed cost and performance targets (residential sector)23
$8/ft2 $8/ft2
$3/ft2
R-5
R-7 R-7
0
2
4
6
8
10
0
2
4
6
8
10
12
14
16
18
20
2014 2016 2018 2020 2022 2024 2026
Win
do
w T
her
mal
Re
sist
ance
R-V
alu
e (h
r·ft
2·°
F/B
tu)
Inst
alle
d C
ost
Pre
miu
m
com
par
ed t
o 2
01
0 B
ase
Win
do
w$
/ft2
Year
Figure 18. Highly insulating window installed cost and performance targets (commercial sector)24
23 Residential sector highly insulating window: baseline installed cost premium = $29/ft2. Source: BTO Prioritization Tool,
Measure 421. References of all Prioritization Tool measures are located in Appendix C. 24 Commercial sector highly insulating window: baseline installed cost premium = $29/ft2. Source: BTO Prioritization Tool,
Measure 422. References of all Prioritization Tool measures are located in Appendix C.

R&D Roadmap For Emerging Window And Building Envelope Technologies 26
Windows High Priority R&D Topic 1: Dynamic Windows or
Window Films
Overview
Dynamic window and shade technologies improve window energy performance by adding beneficial
solar heat gain in cold climates to offset heating and by reducing solar heat gain in the hot climates to
reduce cooling loads. The pioneers in the field of dynamic fenestration systems produce electrochromic
and thermochromic windows. For example, SageGlass and View are producing products today on a small
scale and thermochromic fenestration technologies from Pleotint and Ravenbrick have also recently
become commercially available. However, today’s state-of-the-art dynamic fenestration systems are too
expensive for mass adoption in either the commercial or residential sectors. While improving the
performance of these dynamic systems is desirable, it is critical to drastically reduce the installed cost by
focusing on materials cost, improved manufacturing processes, and the ease of installation.
Figure 19. Highly insulating, dynamic windows with automated shading, schematic diagram (left) and prototype
(right) (images courtesy of LBNL)
Recent advances in materials science and chemistry have led to the investigation of dynamic window
films that can be used to retrofit existing fenestration or can be incorporated into IGU manufacturing
(Environmental Energy Technology Division 2012; ITN Energy 2013; Office of the Vice President 2011).
Similarly, these new chemistries allow dynamic window functionality to be incorporated into existing
glass or IGU manufacturing lines, reducing capital investment for manufacturers, and reducing risks.
Automated energy-efficient window attachments, such as those that are insulating and reflective, are
competitive with dynamic windows in that they are also capable of modulating solar heat gain to offset
heating and cooling loads. BTO internal analysis presented in Chapter 2 shows that today’s manually
operated insulating and reflective interior window attachments are cost effective for residential buildings.
Exterior window attachment technologies also have great potential for energy savings. Energy-efficient

R&D Roadmap For Emerging Window And Building Envelope Technologies 27
window attachment technologies do not require government R&D investment into next-generation
technologies, but instead would benefit from efforts to drive the market towards increasing adoption.
Recently, BTO has used prioritization tool analysis to identify the value proposition from an energy
savings potential perspective for dynamic window technologies across the building sector. Electrochromic
windows with a SHGC ~ 0.4 (SHGCbleached = 0.46 to 0.47 and SHGCtinted = 0.09) represent today’s state-
of-the-art dynamic window technologies.25
While there are commercially (or near commercially
available) dynamic window technologies that are able to hit the performance targets for replacement
windows, there are no dynamic window film technologies on the market that can do so. Window films are
particularly appealing for retrofitting existing buildings, particularly in hot climates that are dominated by
cooling loads.
BTO prioritization tool analysis shows that today’s state-of-the-art electrochromic windows have the
potential to save 1,222 and 724 TBtu from the residential and commercial sectors by 2030, respectively, if
all the windows in new and existing buildings are replaced, regardless of the cost of the windows. This
accounts for the energy savings achieved from the SHGC as well as possible improvements in the
window R-value, not accounting for additional savings from daylighting.26
Approximately 61% of the
technical savings potential is the result of increasing the R-value in the window to approximately 3,
achievable with double glazing with low-E, and 39% of the savings is from the SHGC. The most
impactful energy savings market for dynamic window technologies (relative to static windows with
similar insulating properties) is in hot climates where solar heat gain through windows contributes to 1.14
and 1.38 quads of lost space cooling energy in the residential and commercial sectors, respectively. Note
that energy savings from daylighting technologies can be especially large in commercial buildings
because recent changes to building energy codes now require automatic daylight controls in many more
spaces.
The R&D target for dynamic windows or window films is the development of a technology that is either
actively or passively controlled with a VT in the bleached state > 0.6 for the residential sector and > 0.4
for the commercial sector. The VT in the bleached state for a double pane IGU with state-of-the-art
dynamic window technologies is approximately 0.6.27
As for highly insulating windows, the VT targets
for dynamic windows are guidelines intended to provide sufficient daylighting. In the case of the
commercial sector, it is extremely difficult, if not impossible, to achieve both VT = 0.4 and SHGC = 0.4.
We expect to require VT > 0.4 in order to achieve the SHGC > 0.4. However, BTO is interested in
technologies with comparable energy savings and market penetration in the commercial sector that can be
achieved with SHGC < 0.4 and VT 0.4. The R&D energy savings performance target is mostly
unchanged relative to the state-of-the-art performance (SHGC > 0.4). Instead, the focus of R&D for
dynamic windows and window films is on installed cost reductions. The R&D cost target is ≤$8/ft2 and
≤$2/ft2 installed cost premium (at scale) over a standard IGU installation for dynamic windows and
25 View Dynamic Glass panes are available with SHGC ranging from 0.09 to 0.46 (viewglass.com/pdf/IGU_DataSheet_US.pdf),
while SageGlass panes are available with SHGC ranging from 0.09 to 0.47
(glassolutions.co.uk/sites/default/files/products/documents/SageGlass%20Product%20Guide.pdf). 26 The energy savings for dynamic windows includes savings from SHGC and from an improvement in the window R-value from
a base value of 1.61 (1.86 for commercial windows) to an R-value over 3. 27 View Dynamic Glass panes are available with VT in the bleached state equal to 0.58 (viewglass.com/specifying-your-dynamic-
glass.php), while SageGlass panes are available with VT in the bleached state equal to 0.62 (sageglass.com/sageglass/double-
pane-glazing/).

R&D Roadmap For Emerging Window And Building Envelope Technologies 28
window film technologies, respectively. BTO internal analysis shows that achieving the R&D roadmap
installed cost target of <$8/ft2 premium over existing IGUs, including the cost of sensors and controls, for
dynamic windows reduces the payback periods to a minimum of 10 years for new residential buildings
and a maximum of 22 years for new commercial buildings. Similarly, achieving the R&D cost target of
≤$2/ft2 installed cost premium for dynamic window films leads to a reduction in the payback period to 7
and 21 years in the residential and commercial building sectors, respectively. Note that the dynamic
windows and window film targets discussed herein do not prescribe whether the technologies operate by
electrochromic, thermochromic or other mechanisms. The technical and market barriers to achieving the
cost and performance targets for dynamic windows are discussed below.
Technical Barriers and Challenges
Table 12. Technical Barriers and Challenges to the Development and Cost Reduction of Dynamic Windows or
Window Films
Topic/Barrier Description
R&
D B
arri
ers
Improved materials
performance
Color control in visible- and low-contrast ratio in the infrared (IR)
Spectral and thermal truncation
Glare mitigation
Switching speed (particularly to reach fully dark [block-out])
Materials cost reductions
Transparent, conducting materials (e.g., transparent conducting oxides such as indium tin oxide)
Photovoltaics, batteries, and actuators to improve the ease of installation of electrochromic technologies
Daylighting performance
improvement
Solar hear gain modulation without adverse impacts on daylighting
Ability to redirect or reflect, not absorb, light to reduce thermal damage in window and surrounding structures
Coating manufacturing
processes
Reduce cost of glazing coating processes o Coatings with improved yields, durability, and quality o Faster deposition methods o Alternatives to indium tin oxide
Customized product
manufacturing at high
throughputs
Ability to produce fabricator-friendly products that are adaptable to a range of sizes.
Lacking mass production technologies (homogenizes electric field, reduced irising) for electrochromic materials
Market and Deployment Barriers
Table 13. Market and Deployment Barriers to the Adoption of Dynamic Windows or Window Films
Market/Deployment Barrier Description
Cost High upfront costs are dependent on overcoming materials constraints and close
integration with existing value channels in the fenestration industry.
Acceptance
Architect, fabricator, and consumer acceptance will be critical to market deployment. Consumer adoption is dependent on the integration of wireless devices for each window with manual override capabilities and the integration with operable window designs.
Lack of Standardization
Dynamic window technology needs to be standardized in order for consumers to
make more informed decisions. Testing and certification costs are a barrier to
broader standardization.

R&D Roadmap For Emerging Window And Building Envelope Technologies 29
Table 14. Dynamic Window and Window Film R&D Technology Roadmap
Topic Description: Windows or window films capable of automatically modulating solar heat gain with installed cost premium targets of ≤$8/ft
2 and ≤$2/ft
2 for windows and window films, including sensors and controls,
over a standard IGU. Performance targets for both windows and window films are SHGC > 0.4 with VT bleached state >0.6 for the residential sector and >0.4 for the commercial sector. VT targets are guidelines and are intended to be sufficient for daylighting.
Roadmap Action Plan Activities Milestones
Ne
ar T
erm
(<5
yrs
)
Identify abundant, low-cost materials with low
contrast, high SHGC, VT in the clear state sufficient for daylighting and fast switching speeds
Identify low capital production equipment and low-cost manufacturing processes
Achieve smart automation for active dynamic solutions (automated home energy monitoring)
Realize a non-hard-wired power solution for retrofits
Dynamic windows: Demonstration of bench-scale
dynamic window (SHGC >0.4 with VT sufficient for daylighting) manufacturing process at installed costs ≤$25/ft
2 (including sensors and controls)
Dynamic window films: Demonstration of bench-
scale dynamic window film (SHGC >0.4 with VT sufficient for daylighting) manufacturing process with projected installed costs ≤$15/ft
2 (including
sensors and controls)
Mid
Te
rm
(6 –
9 y
rs)
Improve performance of next-generation materials
Develop next-generation production and manufacturing processes
Collaborate with the Institute of Electrical and Electronics Engineers to develop wireless communication protocol
Dynamic windows: Demonstration of dynamic
window (SHGC >0.4 with VT sufficient for daylighting) manufacturing process for areas >10 ft
2
with a projected installed cost premium ≤$15/ft2
compared to a standard IGU (including sensors and controls)
Dynamic window films: Demonstration of dynamic
window film (SHGC >0.4 with VT sufficient for daylighting) manufacturing process for areas >10 ft
2
with a projected installed cost premium ≤$8/ft2
compared to a standard IGU (including sensors and controls)
Lon
g Te
rm
(9 –
12
yrs
)
Integrate window with energy storage, energy generation and control technologies
Achieve complete control of visible to near-IR electromagnetic spectrum
Dynamic windows: Dynamic window (SHGC >0.4 with VT sufficient for daylighting) manufacturing process demonstrated for areas >30 ft
2 with a
projected installed cost premium ≤$8 ft2
compared to a standard IGU (including sensors and controls)
Dynamic window films: Window film (SHGC >0.4 with VT sufficient for daylighting) manufacturing process demonstrated for areas >30 ft
2 with a
projected installed cost premium ≤$2/ft2
compared to a standard IGU (including sensors & controls)
Benefits and Impacts
Factor Impact Description
New Buildings High Market driver through increased sales, especially if required by code
Retrofit Buildings Medium Dependent on capacity for wiring or availability of wireless solutions, window films
will be more impactful in the retrofit space than replacement windows
Industry
Competitiveness High
Dynamic solutions are the next-generation solution, but they must be competitive
domestically, otherwise other countries will seize technology leadership
Cost Reduction High
The high cost of the state-of-the-art technology is the largest market barrier for
dynamic window technologies. For residential buildings, present-day dynamic
window payback period is estimated at 26 to 33 years. Meeting cost reduction
targets will reduce payback to 10 to 12 years. For commercial buildings, present-
day dynamic window payback period is estimated at 57 to 61 years. Meeting cost
reduction targets will reduce payback to 21 to 22 years.

R&D Roadmap For Emerging Window And Building Envelope Technologies 30
$20/ft2
$15/ft2
$8/ft2$15/ft2
$8/ft2 $2/ft2
0.4 0.4 0.4
0
0.1
0.2
0.3
0.4
0
5
10
15
20
25
30
35
2014 2016 2018 2020 2022 2024 2026
Ch
ange
in S
HG
C b
etw
een
B
leac
hed
an
d T
inte
d S
tate
s(Δ
SHG
C)
Inst
alle
d C
ost
Pre
miu
m
com
par
ed t
o S
tan
dar
d I
GU
($/f
t2)
Year
Cost Targets: Dynamic Windows
Cost Targets: Dynamic Window Films
Performance Targets: Dynamic Windows and Window Films
Figure 20. Dynamic window and window film installed cost and performance targets28,29
28 Dynamic windows: baseline installed cost premium = $22/ft2. Source: BTO Prioritization Tool, Measures 889, 890, 891, 892.
References of all Prioritization Tool measures are located in Appendix C. 29 Dynamic window films: cost of an insulating and reflective window attachment = $13/ft2. Source: BTO Prioritization Tool,
Measure 575, 576. References of all Prioritization Tool measures are located in Appendix C.

R&D Roadmap For Emerging Window And Building Envelope Technologies 31
Windows High Priority R&D Topic 2: Visible Light Redirection
Overview
Window light redirection technology has the potential to reduce energy consumed for interior lighting in
some types of commercial buildings. BTO internal analysis shows that existing daylighting technologies,
such as light louvers and tubular daylighting devices, have a technical potential to save 345 TBtu in the
commercial sector when integrated with lighting controls.30
Market penetration of these devices is
currently limited in part because of aesthetic issues. Next-generation light redirection technology
distributes light into the interior of the building and provides shade when appropriate. The use of spectral
coatings allows for further control of the amount of light and solar heat that penetrates through the
window. Summer months, with high sun angles, allows less heat into buildings, while in winter months,
with low sun angles, the light redirection technology allows both light and heat in.
The targeted outcome of R&D is a technology to reduce lighting energy by 50% for a 50-ft. floor plate, at
an installed cost premium of ≤5/ft2 over a typical window/blind installation (including the cost of lighting
controls31
). This will require new materials and simulation tools for product evaluation (e.g., glare and
system integration). Daylighting technologies must be integrated with lighting controls to save energy.
The R&D roadmap for a cost-competitive visible light redirection technology that can be widely deployed
is shown in Table 17.
Figure 21. Picture of LightLouver unit product (left), interior view of Caltrans District 3 Headquarters atrium with
LightLouver installed on clerestory windows (right). Visible light redirection technology intercepts and redirects
sunlight onto the ceiling or deep into the interior of the building, reducing glare and electric lighting and
mechanical cooling requirements.32
(image courtesy of LBNL)
30 Energy savings based entirely on lighting load. 31 The cost of lighting controls, which is not the focus of R&D, is included in the cost target because daylighting technologies
will only save energy if the lights get turned off. 32 More information on the LightLouver product can be found at lightlouver.com/uploads/LightLouver_lunch_and_learn.pdf.

R&D Roadmap For Emerging Window And Building Envelope Technologies 32
Technical Barriers and Challenges
Table 15. Technical Barriers and Challenges to the Development of Commercial Windows with Visible Light
Redirection
Topic/Barrier Description
R&
D B
arri
ers
Lack of new, cost-
effective materials
Deep light redirection efficiency at low cost and without glare is needed
Materials for dynamic controls are lacking (redirection, visible transmittance)
Limited
computational and
experimental
evaluation tools
Demonstration to determine energy-savings impact versus season and time of
day and appropriate integration with building controls and operation
Demonstration of market-acceptable performance with respect to glare and
appearance of films
Man
ufa
ctu
rin
g an
d
Scal
e-U
p B
arri
ers
Development of cost-
effective processing
High-volume patterning processes
High-quality, thin-film coating technology
Market and Deployment Barriers
Table 16. Market and Deployment Barriers to the Adoption of Commercial Windows with Visible Light Redirection
Market/Deployment Barrier Description
Architect Acceptance
Window aesthetics (e.g., quality of vision area), demonstration/assurance of
performance, architectural flexibility, applicability to retrofit, and new
construction will drive adoption
Occupant Acceptance Cost, comfort, and aesthetics all impact consumer acceptance
Codes and Standards
Codes on daylighting are still developing and adoption and implementation will
take time. ASHRAE 90.1-2010 has mandatory daylighting requirements for some
spaces, and this requirement is being expanded in ASHRAE 90.1-2013 and the
2015 IECC. Daylighting requirements are also included in the green construction
codes (ASHRAE 189.1-2011 and the 2012 International Green Construction
Code), but adoption of these standards has been slow.
Table 17. Visible Light Redirection R&D Technology Roadmap
Topic Description: Reduce lighting energy use by 50% for a 50-ft floor plate with a projected installed cost premium of ≤$5/ft
2 over a typical window and blind installation (including the cost of lighting controls).
Roadmap Action Plan Activities Milestones
Ne
ar T
erm
(<5
yrs
)
Develop light redirection materials research
Optimize simulation tools (product evaluation)
Demonstrate technology integration potential
Identify low capital production equipment and low-cost manufacturing processes
Demonstrate a 25% lighting energy reduction with lab scale prototype
Simulations that demonstrate that prototype can achieve savings over a 25-ft floor plate with glare control (no downward daylight)
Macro-scale solution simulation capability to demonstrate micro- and macro-scale solutions
Manufacturing process demonstrated for areas >10 ft2 at a
projected installed cost premium of ≤$20/ft2 (including for the cost of lighting controls)

R&D Roadmap For Emerging Window And Building Envelope Technologies 33
Mid
Te
rm
(6 –
9 y
rs) Conduct prototyping and testing
Conduct initial prototype scale-up to areas larger than 10 ft2
Develop simulation tools (glare, system integration)
Demonstrate a 35% lighting energy reduction with lab-scale prototype at >10 ft2
Simulations and experimental data that prototype can achieve savings over a 50-ft floor plate with glare control (no downward daylight)
Lon
g Te
rm
(9 –
12
yrs
)
Achieve scale-up of potential new solutions
Optimize solutions with a combination of controls, dynamic solutions, and other approaches
50% potential lighting energy reduction for a 50-ft floor plate with glare control (no downward daylight) demonstrated in field tests
Dynamic panel manufacturing process demonstrated for areas >30
ft2 at a projected installed cost premium of ≤$5/ft2 (accounting for cost of lighting controls necessary to achieve 50% savings)
Benefits and Impacts
Factor Impact Description
New Buildings High Maximum likelihood of new buildings designed to take full advantage of the daylight redirecting solutions.
Retrofit Buildings Medium A subset of all existing building stock will benefit from a daylight redirecting retrofit, higher burden on lighting controls to dim or turn off electric lighting to claim benefit.
Industry
Competitiveness High
Daylight impacts occupant productivity and sense of well-being. Real estate owners will adopt redirection technology to reduce operating costs, but also to attract and retain tenants.
Cost Reduction High Increased market penetration is dependent on substantial cost reductions. Meeting the cost reduction target will reduce payback from 10 to 5 years.
$20/ft2
$13/ft2$5/ft2
25%
35%
50%
0%
10%
20%
30%
40%
50%
60%
0
10
20
30
40
50
60
2014 2016 2018 2020 2022 2024 2026
Ligh
tin
g En
ergy
Re
du
ctio
n
for
a 5
0-f
t Fl
oo
r P
late
w
ith
Gla
re M
itig
atio
n (
%)
Inst
alle
d C
ost
Pre
miu
m
of
Win
do
w (
$/f
t2)
Year
Figure 22. Visible light redirection technologies installed cost and performance targets

R&D Roadmap For Emerging Window And Building Envelope Technologies 34
Early-Stage R&D Topic: Dynamic Windows with Energy
Harvesting
Overview
In addition to the window technologies discussed earlier in this chapter, other less-mature emerging
technologies have great potential for high impact and large energy savings if and when they are
commercialized; however, associated with that potential are longer investment timelines and a greater
technical risk. One such early-stage technology is discussed in more detail below.
Dynamic window performance has typically been defined as the dynamic control of solar transmittance,
glare, solar gain, and daylighting at any time to manage energy, comfort, and view. However, dynamic
windows may also be able to be augmented with energy harvesting technology (Chun-Chao 2012).
The targeted outcome for R&D on dynamic window energy harvesting is a technology with a power
conversion efficiency (PCE) of 10% with the same performance goals for dynamic windows in the
Dynamic Windows and Window Films section above. R&D will focus on new materials, packaging, and
ensuring ease of integration (including electronic systems). Barriers to technology development are
shown below and the R&D roadmap for this technology is shown in Table 20.
Technical Barriers and Challenges
Table 18. Technical Barriers and Challenges to the Development of Dynamic Windows with Energy Harvesting
Topic/Barrier Description
R&
D B
arri
ers
Materials chemistry Materials chemistry issues (e.g., simple synthesis, achieving high-quantum efficiency)
to be resolved for material cost-reduction and performance improvement gains
Conductive materials High-performance electrolytes (conductivity) and robust active PV components (TCO
and active layer transparency) are needed
High system costs Low-cost, invisible interconnection schemes
Packaging and integration with highly insulating windows
Durability Polymer degradation issues lead to lifetime, durability, and cycling concerns
(Jorgensen 2008)
Man
ufa
ctu
rin
g an
d
Scal
e-U
p B
arri
ers
High manufacturing
costs
Manufacturing process needs to achieve defect tolerance with minimal resistive
losses
Cost-effective, high-yielding production at a large scale
Assuring quality and
performance
High visible transmittance (VT >0.6 for residential sector and VT >0.4 for commercial
sector) without distortion.

R&D Roadmap For Emerging Window And Building Envelope Technologies 35
Market and Deployment Barriers
Table 19. Market and Deployment Barriers to the Adoption of Dynamic Windows with Energy Harvesting
Market/Deployment Barrier Description
Window Aesthetics VT >0.6 for residential sector and VT >0.4 for commercial sector with power
generation capability
Balance of System Costs Opportunity to reduce BOS cost by coupling power generation capability to dynamic
windows, automated window attachments, or sensors
Table 20. Dynamic Window with Energy Harvesting R&D Technology Roadmap
Roadmap Action Plan Activities Milestones
Ne
ar T
erm
Develop proof-of-concept lab work for light-harvesting with other dynamic window functions (e.g., color change, switching, etc.)
Develop materials for the active layer, TCO, and electrolytes
Prototype packaging and simulations for orientation and installation
PCE: 5% lab scale (3 in by 3 in glass sample)
Power buffering electrons
Aesthetics: VT >50%–60% or selective color (delta change transmittance 40%)
Prototype with (SHGC)*(VT clear state) = 0.3 with VT clear state >0.55
Mid
Te
rm
Scale lab and work to larger areas
Develop solar harvesting laminates (e.g. flexibility)
Optimize packaging and ease of integration (retrofit, framing sizes, circuit design)
Integrate electronic systems (e.g., battery, super capacitor, and room framing)
PCE: 8% lab scale (3 in by 3 in glass sample), 5% PCE scaled to 1 ft2 glass sample
Durability: lifetime target of 5 years
Scalability: 1–2 ft2
Simultaneous heat gain and aesthetics with VT >75%
Lon
g Te
rm
Scale to full window sizes
Deploy more stringent codes for energized surfaces, certificates, and standardized testing
PCE: 10% lab scale (3” by 3” glass sample), 8% PCE scaled to full window
Durability: lifetime target of 10 years
Scalability to full window size
Topic Description: Dynamic windows with energy harvesting technology (e.g., transparent PVs or switchable dye PVs), with 10% PCE and a 10-year lifetime

R&D Roadmap For Emerging Window And Building Envelope Technologies 36
4. ROADMAP FOR EMERGING
BUILDING ENVELOPE
TECHNOLOGIES Priority R&D Topics Summary
Improving building energy performance will require R&D to produce cost-effective building envelope
technologies such as insulating materials and air-sealing system technologies. To enable mass market
adoption, these next-generation technologies must maintain or improve building enclosure durability,
including moisture, fire, indoor air quality, acoustic, and structural requirements. In the case of retrofitting
existing buildings, the installation must be fast and easy so that there is minimal impact on building
occupants. The focus of this roadmap report is to accelerate these R&D efforts.
Table 21. Residential and Commercial Building Envelope Priority Research Topics
Technology
Description
Target
Sector(s) 2025 Cost Target33 2025 Performance Target
Highest Priority R&D Areas
Building
envelope
material
Commercial
and
Residential
Sectors
Projected installed cost premium
≤$0.25/ft2, including insulation
material and associated labor,
assuming an R-12/in performance
to enable a payback period less
than 10 years.
Building envelope thermal insulation material with R-
value ≥R-12/in that can be added to walls to retrofit
existing buildings and can also be applicable to other
portions of the building enclosure (e.g., reduce the
impact of thermal bridging between building
components). The material must meet durability
requirements and minimize occupant disturbance.
Air-sealing
technologies
(systems-level
approach)
Commercial
and
Residential
Sectors
Projected installed cost ≤$0.5/ft2
finished floor (25% of current
average costs, including
mechanical ventilation costs).
A system capable of concurrently regulating heat, air,
and moisture flow to achieve the following
performance specifications.
Residential sector: <1 ACH50
Commercial sector: <0.25 CFM75/ft2 (5-
sided envelope)
High Priority R&D Area
Highly insulating
Roofs
Commercial
Sector
Projected incremental cost
increase ≤$1/ft2 compared to
standard roof costs
An energy use reduction equivalent to doubling
current ASHRAE R-values
Taking into consideration traditional development schedules, wall and roof R&D topics will need to be
identified and initiated in the near term so that technologies are ready for mass-market adoption by 2030.
These technologies will need to be applicable to retrofitting existing buildings in order to have the greatest
energy savings impact, but can also be applicable to new construction. The R&D topic areas listed in Table
33 Cost targets in this report are quantified in order to provide a viable critical pathway from current technology R&D status to a
cost target that, at scale, will facilitate mass-market technology adoption.

R&D Roadmap For Emerging Window And Building Envelope Technologies 37
21 apply to the entire building envelope space (applicable to both residential and commercial) and are
anticipated to have the largest potential for energy savings. They will be expounded in more detail
individually. When appropriate, topics that focus on the residential or commercial space are noted.
Table 2 shows the energy lost from heating and cooling for opaque building envelope components (walls,
roofs, and foundations) and infiltration in 2010 and projected for 2035. In 2010 the largest contributors to
heating energy loss in the residential and commercial sectors were infiltration (residential: 2.26 quads,
commercial: 1.29 quads) and walls (residential: 1.54 quads, commercial: 1.48 quads). Overall, the space
cooling energy lost for the opaque portions of the envelope is less substantial than the space heating energy
loss in both the residential and commercial sectors. In the residential sector, infiltration accounts for the
greatest space cooling loss (0.59 quads), followed by roofs (0.49 quads). Overall, the data in Table 2 show
that walls and infiltration are the most substantial contributors to energy losses in both sectors.
Table 22. Roadmap Target Prioritization Tool Analysis Results for Building Envelope Technologies, Including Thermal Insulation Materials, Air-Sealing System Technologies, and Commercial Roofing Technologies
Building Envelope Technologies
Roadmap Target Technology Description
Market Size34 (TBtu)
Technical Potential35,
2030 (TBtu)
Unstaged Max Adoption
Potential36, 2030 (TBtu)
Payback in 2030 (years)
Prioritization Tool
Measure Number37
Building Envelope Material
R-12/in building envelope thermal insulation material, with an installed cost premium ≤$0.25/ft
2 (R)
1,610 836 267 3.2 658
Air-Sealing Technologies (systems-level approach)
Air-sealing systems that reduce air leakage to <1 ACH50 at a cost of ≤$0.5/ft
2 finished
floor (R)
1,768 1,591 1,591 1.7 856
Air-sealing systems that reduce air leakage to ≤0.25 CFM75/ft
2 (5-sided envelope) at a
cost of ≤$0.5/ft2 (C)
982 805 805 2.7 834
Roofs for Commercial Buildings
Highly insulating roof that doubles the R-value of existing ASHRAE standards with incremental cost increase ≤$1/ft
2 compared to
standard roof costs (C)
257 129 129 12 741
Table 22 summarizes the BTO PT analysis for building envelope technologies, including building
envelope materials, air-sealing technologies, and roofs. For building envelope materials, the roadmap
target does not specify which wall surface the insulation material should be applied to, i.e., the insulation
34 Market Size represents the energy consumption associated with a building component (e.g., windows), within a particular
buildings market segment (e.g., commercial, residential, new or existing buildings). 35 Technical Potential assumes existing stock is immediately replaced with the new measure. The technical potential represents
the theoretical maximum energy savings available if the technology is implemented in the U.S. buildings sector (free of practical
constraints such as financing and deployment considerations). 36 Unstaged Maximum Adoption Potential (TBtu) assumes a ‘stock and flow’ model accounting for unit replacement, elimination
or addition. The unstaged maximum adoption potential represents the energy savings that would result if the technology is
deployed only for all end-of-life replacements and new purchases. 37 Detailed sources for each measure number are shown in Appendix C.

R&D Roadmap For Emerging Window And Building Envelope Technologies 38
material may be added to either the internal or external surface of the walls. However, the roadmap target
is specifically focused on adding insulation to existing buildings, rather than new buildings.
The data from Table 22 is illustrated graphically in Figure 24, which shows technical potential and
unstaged maximum adoption potential for the building envelope technology roadmap targets. This figure
clearly shows air-sealing systems have the greatest potential to save energy with a combined technical
potential of 2,396 TBtu in the residential and commercial sectors. Figure 25 compares the projected
payback period of the roadmap target technologies with the existing baseline technologies. As illustrated
in this figure, the technology with the greatest reduction in payback period is the R-12/in. thermal
insulation material (which is compared against a baseline payback period that results from installing
exterior insulation finish system (EIFS) technology, PT measure #660).
Figure 23. The VIP in the foreground has an R-value three times higher than the fibrous batt insulation in the
background at one-third the thickness.
0
200
400
600
800
1,000
1,200
1,400
1,600
1,800
R-12/in Thermal InsulationMaterial
(R)
Air Sealing Systems(reduces air leakage to
<1ACH50)(R)
Air Sealing Systems(reduces air leakage to <0.25
CFM75/ft²)(C)
Highly Insulating Roof(doubles roof R-value of
existing ASHRAE standards)(C)
Pri
mar
y En
ergy
Sav
ings
, 203
0 (T
Btu
)
Technical Potential, 2030 (TBtu)
Unstaged Max Adoption Potential, 2030 (TBtu)
Figure 24: Prioritization tool analysis results for building envelope technologies roadmap targets, including
thermal insulation, air-sealing, and roof technologies

R&D Roadmap For Emerging Window And Building Envelope Technologies 39
0
5
10
15
20
25
R-12/in Thermal InsulationMaterial
(R)
Air Sealing Systems(reduces air leakage to
<1ACH50)(R)
Air Sealing Systems(reduces air leakage to <0.25
CFM75/ft²)(C)
Highly Insulating Roof(doubles roof R-value of
existing ASHRAE standards)(C)
Pay
bac
k P
eri
od
(ye
ars)
Payback in 2030, Baseline Technology (years)
Payback in 2030, Roadmap Target (years)
Figure 25: Comparison of payback periods for baseline technologies and technologies that achieve the roadmap
cost and performance targets38
38 The baseline technology for roofs is increased non-cool roof insulation for new commercial buildings.

R&D Roadmap For Emerging Window And Building Envelope Technologies 40
Barriers for Next-Generation Building Envelope Technologies
The commercial and residential building sectors often have unique markets and consumers, which must
be understood and analyzed in parallel with technology development to accelerate market penetration.
Key barriers and challenges for next-generation building envelope technologies are summarized below:
Commercial Building Envelope
Envelope materials that enable smooth transitions between functional areas (roof and walls)
to ensure high-level performance – The composition/makeup of roof systems are often much
different than wall materials. As such, the joints are abrupt, leading to thermal bridges and
undesirable aesthetic characteristics, especially in large commercial buildings. Sealing between
these envelope functions can be difficult during construction and often impossible during retrofits.
As such, the development of envelope materials that can function both as walls and roofs is greatly
desired to enable architecturally acceptable air seals between the roof and the walls.
Inadequate building design and diagnostics tools – Computational tools are critically important
for the design and construction of commercial buildings with energy-efficient envelope materials.
As new technologies are developed, models and simulation tools must be updated to account for
increased performance and durability. This is discussed in more detail in Chapter 5.
Lack of measurement technique for infiltration measurements in large-commercial
buildings – While blower door tests can be used to assess infiltration in residential buildings, no
analogous technology exists for large-commercial buildings. As a result, commercial building
codes do not include infiltration.
Residential Building Envelope
Lack of clear performance criteria and metrics – As residential building envelope
technologies are developed and put into service, it is often challenging to clearly define certain
performance criteria, particularly in ways that are easily understood by homeowners. For
example, building material durability, specifically moisture tolerance, and occupant comfort are
both lacking metrics to adequately evaluate. The ability to easily verify cost metrics is also more
challenging in this topic than others because of variations in existing residential buildings.
Figure 26. Fibrous glass loose fill insulation installed in a test attic in a climate simulator just prior to evaluating
its R-value.

R&D Roadmap For Emerging Window And Building Envelope Technologies 41
Crosscutting Commercial and Residential Building Envelope Quick and easy building envelope retrofit solutions – Energy-efficiency retrofits of
commercial and residential buildings must be performed quickly. Commercial sector building
occupants cannot afford to shut their business down and lose business for days or weeks. This
effectively increases payback time for energy-efficiency measures. Similarly, consumers in the
residential sector are more likely to perform energy-efficiency upgrades that do not disrupt their
lives by requiring extensive construction. Building envelope retrofits that can be accomplished in
less than 2 days also reduce labor costs, the most substantial cost driver for most building
envelope retrofits.
Costly and complex installation methods – The installation of building envelope technologies
are dominated by labor costs associated with complex installation methods that are low-tech and
generally done on a case-by-case basis. Novel manufacturing and installation methods that could
reduce onsite installation costs have the potential to change the cost structure and reduce the
overall installation cost for building envelope upgrades, specifically for existing buildings.
Additionally, complicated construction reduces the speed at which buildings or building
components can be erected and installed, which increases the possibility of installation errors that
can negate any efficiency gains achieved from using advanced materials. High-quality
standardized construction subcomponents (e.g., plug-and-play panels) may help reduce
installation time and costs, as would the increased use of non-intrusive and non-destructive
retrofit installation approaches. Furthermore, if materials and products can be developed with a
high tolerance for error in installation, installation requirements can be less stringent and costly.
Lack of standardized test methods for evaluating envelope materials’ performance metrics
over service life for R-values, energy-efficiency performance, and other factors – While there
are a number of ASTM International standards for the evaluation of envelope assemblies, there is
always a need to develop methods that better predict and confirm the behavior/performance of
envelope material during a typical service life (ASTM 2013; TC 4.4 2013). That performance
profile can be used to more accurately estimate the potential energy savings and other metrics as
they relate to the envelope system.
Impractical performance verification of air and moisture infiltration/exfiltration – The
uncontrolled exchange of heat, air, and moisture are constant phenomena in building structures and
significant influences on building energy consumption, as shown quantitatively in Table 2
(Woloszyn 2008). Existing flow verification measurement methods and tools need improvement
before viable infiltrations/exfiltrations can be realized. The increased use of prescriptive packages
may help show performance proof without having to consistently re-measure. In particular, there is
also a great need for low-cost/no-cost uncontrolled heat and mass-flow diagnostics (e.g., test
methods and characteristics).

R&D Roadmap For Emerging Window And Building Envelope Technologies 42
Building Envelope Highest Priority R&D Topic 1: Envelope
Insulation Material
Overview
A primary function of building insulation material is to control the flow of heat across the structure. More
energy is lost through walls than any other building envelope component. Specifically, as shown in Table
2, 1.54 and 1.48 quads of space heating energy was lost through walls in the residential sector and
commercial sectors, respectively, in 2010. Similarly, 0.34 of space cooling energy was lost through walls
in the residential sector. Similar trends are projected for 2035. As a result, in order to have the greatest
impact on energy savings, next-generation building envelope insulation materials must be applicable to
walls and would ideally also be applicable to other parts of the envelope, such as the roof and foundation,
both to increase the energy savings impact at a component level, but also increase energy savings by
reducing thermal bridging when integrated throughout a building. The roadmap target does not specify
which surface the insulation material should be applied to, i.e., the insulation material may be added to
either the internal or external surface of the walls. In the design of new envelope systems to meet long-
term goals, a holistic approach needs to be considered in order to achieve the desired energy,
performance, and dimensional expectations. In particular, novel energy-efficient building envelope
materials (i.e. with high R-values) that are designed to be simultaneously durable (structural, fire, and
ultraviolet and moisture resistance) and energy efficient. Also desired, though at an earlier stage of
development, are materials with dynamic properties (e.g., resistivity) to transfer heat or moisture and
materials that are responsive to a variety of external conditions. For example, advanced polymeric
material systems (e.g., fibers) could replace thick film systems. The development and adoption of any of
these high-performance materials will require low-cost manufacturing processes and, to ensure wide-
spread technology adoption, should enable fast and low labor-cost installation methods.
BTO internal analysis, detailed in Table 23 below, shows that the technical potential in 2030 for R-6/in,
R-8/in and R-12/in thermal insulation materials for walls is 1101, 951, and 836 TBtu (assuming that in all
cases 2 inches of insulation is added to existing walls). Because insulation upgrades to existing buildings
typically happen infrequently, the unstaged maximum adoption potential for these technologies in 2030 is
substantially reduced to 352, 304, and 267 TBtu respectively. This analysis does not account for
additional energy savings if the thermal insulation is added to other components of the building envelope.
Table 23. Primary Energy Savings from Thermal Insulation Materials Added to Walls of Existing Buildings
Thermal Insulation Technology Performance Target
Market Size (TBtu)
Technical Potential, 2030 (TBtu)
Unstaged Max Adoption Potential, 2030 (TBtu)
Residential Building Sector
R-6/in 1,610 836 267
R-8/in 1,610 951 304
R-12/in 1,610 1,101 352
Figure 27 shows a sensitivity analysis of a simple payback period for adding R-6/in to R-12/in thermal
insulation materials to either surface (interior or exterior) of walls in existing buildings (assuming that 2
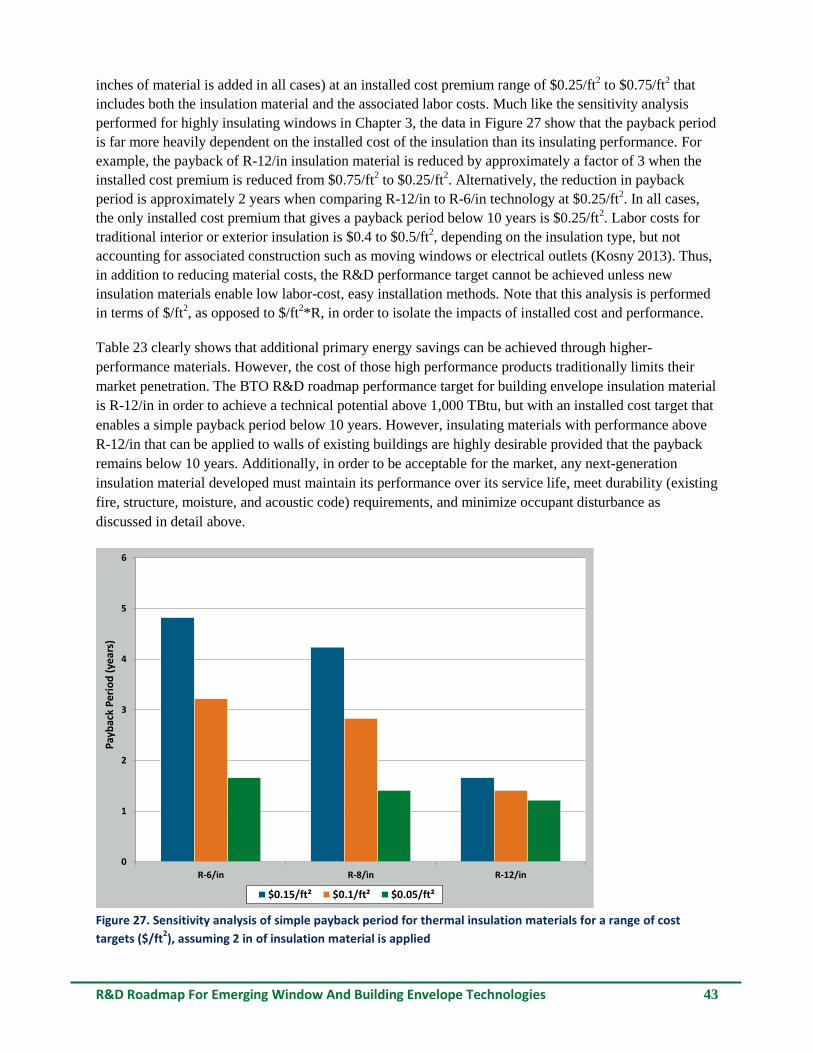
R&D Roadmap For Emerging Window And Building Envelope Technologies 43
inches of material is added in all cases) at an installed cost premium range of $0.25/ft2 to $0.75/ft
2 that
includes both the insulation material and the associated labor costs. Much like the sensitivity analysis
performed for highly insulating windows in Chapter 3, the data in Figure 27 show that the payback period
is far more heavily dependent on the installed cost of the insulation than its insulating performance. For
example, the payback of R-12/in insulation material is reduced by approximately a factor of 3 when the
installed cost premium is reduced from $0.75/ft2 to $0.25/ft
2. Alternatively, the reduction in payback
period is approximately 2 years when comparing R-12/in to R-6/in technology at $0.25/ft2. In all cases,
the only installed cost premium that gives a payback period below 10 years is $0.25/ft2. Labor costs for
traditional interior or exterior insulation is $0.4 to $0.5/ft2, depending on the insulation type, but not
accounting for associated construction such as moving windows or electrical outlets (Kosny 2013). Thus,
in addition to reducing material costs, the R&D performance target cannot be achieved unless new
insulation materials enable low labor-cost, easy installation methods. Note that this analysis is performed
in terms of $/ft2, as opposed to $/ft
2*R, in order to isolate the impacts of installed cost and performance.
Table 23 clearly shows that additional primary energy savings can be achieved through higher-
performance materials. However, the cost of those high performance products traditionally limits their
market penetration. The BTO R&D roadmap performance target for building envelope insulation material
is R-12/in in order to achieve a technical potential above 1,000 TBtu, but with an installed cost target that
enables a simple payback period below 10 years. However, insulating materials with performance above
R-12/in that can be applied to walls of existing buildings are highly desirable provided that the payback
remains below 10 years. Additionally, in order to be acceptable for the market, any next-generation
insulation material developed must maintain its performance over its service life, meet durability (existing
fire, structure, moisture, and acoustic code) requirements, and minimize occupant disturbance as
discussed in detail above.
0
1
2
3
4
5
6
R-6/in R-8/in R-12/in
Pay
bac
k P
eri
od
(ye
ars)
$0.15/ft² $0.1/ft² $0.05/ft²
Figure 27. Sensitivity analysis of simple payback period for thermal insulation materials for a range of cost
targets ($/ft2), assuming 2 in of insulation material is applied

R&D Roadmap For Emerging Window And Building Envelope Technologies 44
Barriers to technology development are discussed below, and the R&D roadmap for moving this
technology forward is shown in Table 26.
Technical Barriers and Challenges
Table 24. Technical Barriers and Challenges to the Development of Envelope Insulation Materials
Topic/Barrier Description
R&
D B
arri
ers
Development of low-cost
materials
Core materials of particular importance include:
High R-values, such as low-cost nanoporous solids, with pore sizes that are less than the mean free path of air
Exceptional moisture/mold control
Low pressure alternate filler gas with reliable long-term performance
IR radiation control New insulation systems need to take advantage of new materials and
additives to effectively reflect thermal radiation
Understanding of material
failure modes, service-life test
protocol
A full identification analysis of how and on what timescale next-generation materials degrade
Tests against conditions designed to simulate the environments they would be subjected to during their period of service, testing conditions must be developed to enable improved correlation between testing and true performance
Man
ufa
ctu
rin
g an
d
Scal
e-U
p B
arri
ers
Integrated supply chain
Low-cost manufacturing will be contingent on the emergence of an integrated supply chain of materials
Modular manufacturing and
standardization
Modular manufacturing with greater material performance control for increased yields.
Seamless interfacing between elements of the manufacturing system will enable the production of low-cost, standardized products, simplifying installation and reducing soft costs
Market and Deployment Barriers
Table 25. Market and Deployment Barriers to the Adoption of Envelope Insulation Material
Market/Deployment Barrier Description
System integration to envelope Innovative insulation assemblies need to fit seamlessly into existing fabrication
methods
Standardization of sizes Novel insulation materials in existing form-factors will facilitate market adoption
Moisture management Products with insufficient moisture management will have limited market adoption
Blowing agent restrictions Low-cost blowing agents with low global warming potential
Lack of third-party verification
of capabilities and flammability
Validating material performance by an independent party will lead to quicker
utilization throughout the building industry

R&D Roadmap For Emerging Window And Building Envelope Technologies 45
Table 26. Envelope Insulation Material R&D Technology Roadmap
Topic Description: Develop ≥R-12/in building envelope thermal insulation material that can be added to walls to retrofit
existing buildings with a projected installed cost premium ≤$0.25/ft2 (per service life R). The materials must meet durability
(existing fire, structure, moisture, and acoustic codes) requirements and minimize occupant disturbance. This material must be applicable for wall insulation, but can also apply to other portions of the envelope to reduce the impact of thermal bridging.
Roadmap Action Plan Activities Milestones
Ne
ar T
erm
(<5
yrs
)
Decrease IR transfer in the temperature range of 0°–100°C
Replace hydrofluorocarbon blowing agents with more environmentally benign materials without reducing R-per-inch values
Develop advanced vacuum insulation technology that is cost effective both in production and maintenance
Candidate IR materials identified
Materials with R-values ≥R-6/in with moisture tolerance at a bench scale
Prototype of continuous manufacturing process for ≥R-6/in materials that can be produced and installed at a cost premium ≤$0.50/ft
2 compared to standard
technology
Validated modeling tools for materials, components, and systems with techno-economic analysis
Mid
Te
rm
(6 –
9 y
rs)
Develop new nucleating method(s) to increase initial nuclei population and control bubble coalescence
Design new composite resin system with higher radiation heat resistance and capability of internal (inert) gas generation
Develop test protocols for service life
Develop system integration approaches
Optimize core and barrier materials
Optimize next-generation vacuum insulation technology
Materials with R-values ≥R-8/in and moisture tolerance demonstrated in a small field demonstration
Demonstration of the continuous manufacturing process for ≥R-8/in materials that can be produced and installed at a cost premium ≤$0.35/ft
2
compared to standard technology
Demonstration of building standards for performance of lifetime analysis
Demonstration of materials for internal and external applications
Lon
g Te
rm
(9 –
12
yrs
)
Develop next-generation composite materials and assemblies that utilize multiple methods to mitigate heat transfer
Develop advanced vacuum insulation technology that is cost effective both in production and maintenance
Develop affordable advanced composite materials and assemblies that utilize multiple methods to mitigate heat transfer and reduce peak thermal load
Develop insulation with controllable conductivity and thermal mass
Demonstrate a continuous manufacturing process for a ≥R-12/in material that can be produced and installed with a cost premium ≤$0.25/ft
2 compared
to standard technology
Demonstrate materials with R-values ≥R-12/in and moisture tolerance in the field
Benefits and Impacts
Factor Impact Description
New Buildings Med Focus is on existing buildings, but the technology is expected to impact new buildings
as well, specifically if added to code requirements.
Retrofit Buildings High Ease and cost of installation is key for high market penetration from re-siding and re-
roofing
Industry
Competitiveness High
Increased energy conservation via thermal insulation will enhance the industry’s
competitiveness in emission and production cost controls
Cost Reduction High
A large reduction in the payback period is needed for this technology to be cost-
effective. Achieving the roadmap cost target is projected to reduce the payback
period of R-12/in thermal insulation material to 3 years. If this target can be
achieved, significant operating cost reductions from reduced building energy use will
result.

R&D Roadmap For Emerging Window And Building Envelope Technologies 46
$0.5/ft2
$0.35/ft2
$0.25/ft2
R-6
R-8
R-12
0
2
4
6
8
10
12
14
0
0.2
0.4
0.6
0.8
1
1.2
1.4
2014 2016 2018 2020 2022 2024 2026
Insu
lati
on
R-v
alu
e/in
ch(h
r·ft
2·°
F/B
tu)
Inst
alle
d C
ost
Pre
miu
m($
/ft2
)
Year
Figure 28. Envelope insulation material cost and performance targets39
39 Baseline installed cost premium = $5/ft2, which corresponds to the estimated cost premium of installing an exterior installation
finishing system (EIFS, PT measure 660), compared to standard technology. The whole wall R-value of this technology is greater
than R-30 (apps1.eere.energy.gov/buildings/publications/pdfs/building_america/high-r_value_walls_case_study_2011.pdf). This
technology is just one of several technologies that could be used as a baseline to R-12/in insulation.
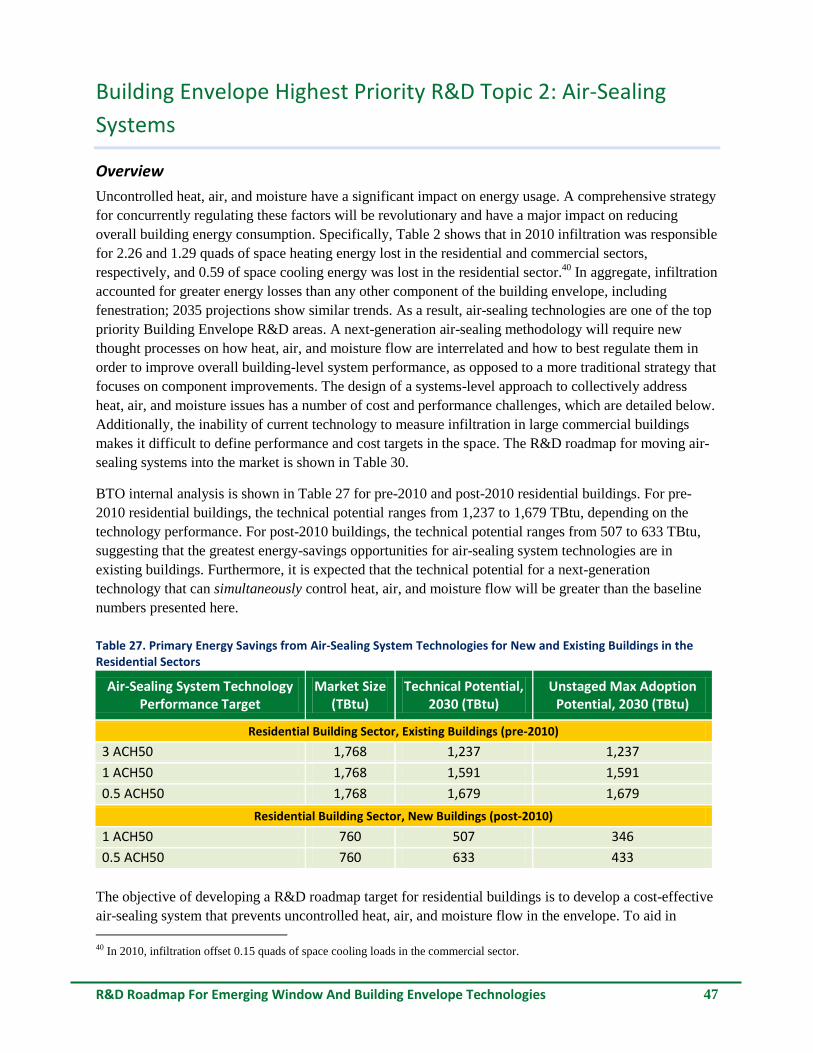
R&D Roadmap For Emerging Window And Building Envelope Technologies 47
Building Envelope Highest Priority R&D Topic 2: Air-Sealing
Systems
Overview
Uncontrolled heat, air, and moisture have a significant impact on energy usage. A comprehensive strategy
for concurrently regulating these factors will be revolutionary and have a major impact on reducing
overall building energy consumption. Specifically, Table 2 shows that in 2010 infiltration was responsible
for 2.26 and 1.29 quads of space heating energy lost in the residential and commercial sectors,
respectively, and 0.59 of space cooling energy was lost in the residential sector.40
In aggregate, infiltration
accounted for greater energy losses than any other component of the building envelope, including
fenestration; 2035 projections show similar trends. As a result, air-sealing technologies are one of the top
priority Building Envelope R&D areas. A next-generation air-sealing methodology will require new
thought processes on how heat, air, and moisture flow are interrelated and how to best regulate them in
order to improve overall building-level system performance, as opposed to a more traditional strategy that
focuses on component improvements. The design of a systems-level approach to collectively address
heat, air, and moisture issues has a number of cost and performance challenges, which are detailed below.
Additionally, the inability of current technology to measure infiltration in large commercial buildings
makes it difficult to define performance and cost targets in the space. The R&D roadmap for moving air-
sealing systems into the market is shown in Table 30.
BTO internal analysis is shown in Table 27 for pre-2010 and post-2010 residential buildings. For pre-
2010 residential buildings, the technical potential ranges from 1,237 to 1,679 TBtu, depending on the
technology performance. For post-2010 buildings, the technical potential ranges from 507 to 633 TBtu,
suggesting that the greatest energy-savings opportunities for air-sealing system technologies are in
existing buildings. Furthermore, it is expected that the technical potential for a next-generation
technology that can simultaneously control heat, air, and moisture flow will be greater than the baseline
numbers presented here.
Table 27. Primary Energy Savings from Air-Sealing System Technologies for New and Existing Buildings in the Residential Sectors
Air-Sealing System Technology Performance Target
Market Size (TBtu)
Technical Potential, 2030 (TBtu)
Unstaged Max Adoption Potential, 2030 (TBtu)
Residential Building Sector, Existing Buildings (pre-2010)
3 ACH50 1,768 1,237 1,237
1 ACH50 1,768 1,591 1,591
0.5 ACH50 1,768 1,679 1,679
Residential Building Sector, New Buildings (post-2010)
1 ACH50 760 507 346
0.5 ACH50 760 633 433
The objective of developing a R&D roadmap target for residential buildings is to develop a cost-effective
air-sealing system that prevents uncontrolled heat, air, and moisture flow in the envelope. To aid in
40 In 2010, infiltration offset 0.15 quads of space cooling loads in the commercial sector.

R&D Roadmap For Emerging Window And Building Envelope Technologies 48
determining a roadmap performance and cost target, a sensitivity analysis was run, with results shown in
Figure 29 and Figure 30. This sensitivity analysis varies simple payback period for air-sealing
technologies (3 ACH50 – 0.5 ACH50) for pre-2010 and post-2010 buildings in the residential building
sector, respectively. The analysis shows that current technologies achieving <3 ACH50 have payback
periods less than 5 years at 75% of current installed cost premiums. Moreover, the difference in payback
periods for a system achieving 3 ACH50 and 1 ACH50 at 50% or 25% of the current average installed
costs42
is less than 2 months. Thus, there is little economic benefit to pushing the performance from 3
ACH50 to 1 ACH50. However, Table 27 shows that systems that can achieve 1 ACH50 have an unstaged
maximum economic adoption potential for pre-2010 residential buildings that is 350 TBtu higher than
systems that can achieve 3 ACH50. But increasing performance further from 1 ACH50 to 0.5 ACH50
only increases the unstaged maximum adoption potential by 88 TBtu. A 0.5 ACH50 system also has
much longer payback times than a 1 ACH50 system because of higher current costs. Accordingly, to
achieve less than a 5 year simple payback period, the installed cost premium must be reduced by greater
than 50%.
The desired technology must reduce air leakage to ≤ 1 ACH50 at a cost of < $0.5/ft2 finished floor,
including mechanical ventilation. At this target, the payback period is 1.7 years in pre-2010 buildings and
3 years in post-2010 buildings. This 2025 air-tightness goal is not significantly tighter than some existing
high performance home requirements such as the DOE Challenge Home and the Passive House.41
The
sensitivity analysis results shown in Figure 29 show that the marginal benefit of setting a goal below 1
ACH50 is more than offset by the costs to achieve this level of air tightness. The target goal was thus set
to 1 ACH50 in order to result in a target with a more economically viable solution.
While this sensitivity analysis is useful in informing performance and cost targets, it is critical to note that
these technologies do not directly capture the benefit of the proposed R&D target because there is no
single existing technology capable of simultaneously controlling heat, air, and moisture. An integrated
technology capable of achieving this would certainly have an increased energy savings impact relative to
the state-of-the-art technologies, but to achieve substantial market penetration in the residential sector, the
payback period of such a technology should be less than 5 years.
41 The DOE Challenge Home (eere.energy.gov/buildings/residential/ch_index.html) requires an air-tightness of 1.5 ACH50 in
climate zone 8, while the Passive House (passivehouse.us/passiveHouse/PassiveHouseInfo.html) requires 0.6 ACH50 in all
climate zones.

R&D Roadmap For Emerging Window And Building Envelope Technologies 49
0
1
2
3
4
5
6
7
8
9
10
3 ACH50 1 ACH50 0.5 ACH50
Pay
bac
k P
eri
od
(ye
ars)
75% of current costs 50% of current costs 25% of current costs
Figure 29. Sensitivity analysis of simple payback period for air-sealing technologies (3 ACH50 – 0.5 ACH50) for
pre-2010 buildings in the residential building sector42
0
1
2
3
4
5
6
7
8
1 ACH50 0.5 ACH50
Pay
bac
k P
eri
od
(ye
ars)
75% of current costs 50% of current costs 25% of current costs
Figure 30. Sensitivity analysis of simple payback period for air-sealing technologies (1 ACH50 and 0.5 ACH50) for
post-2010 buildings in the residential building sector
42 Current average costs for air-sealing technologies are available at the National Renewable Energy Laboratory measure
database. The average cost for 0.5 ACH50 technology was linearly extrapolated from 1 ACH50 costs.
nrel.gov/ap/retrofits/measures.cfm?gId=10&ctId=376&scId=6160&acId=6164.

R&D Roadmap For Emerging Window And Building Envelope Technologies 50
Table 28 shows the BTO analysis for air-sealing systems in new and existing commercial buildings. In
this case, the baseline tightness (1.38 CFM75/ft2 5-sided envelope) is a national average for buildings in
the commercial sector (Emmerich 2011). Table 28 shows the impact of reducing leakage by 10% to 1.24
CFM75/ft2 (achieved by sealing large, concentrated leaks using today’s cost-effective technologies) and
by roughly 80% to 0.25 CFM/ft2 (requires sealing more smaller, more distributed leaks). The technical
and unstaged maximum adoption potential varies substantially between these two cases, from 44 to 805
TBtu. In addition, it is expected that the technical potential for a next-generation technology that can
simultaneously control heat, air, and moisture flow will be even greater than these baseline numbers.
Table 28. Primary Energy Savings from Air-Sealing System Technologies for New and Existing Buildings in the Commercial Sectors
Air-Sealing System Technology Performance Target
Market Size (TBtu)
Technical Potential, 2030 (TBtu)
Unstaged Max Adoption Potential, 2030 (TBtu)
Commercial Building Sector, New and Existing Buildings
1.24 CFM75/ft2 982 44 44
0.25 CFM75/ft2 982 805 805
Emmerich (2011) reports a national average tightness for 227 U.S. commercial and industrial buildings of
1.38 CFM75/ft2, and that tighter buildings are generally found in colder climates (Emmerich 2005). This
metric is dominated by the tightness of existing buildings, which dominate the commercial building
floorspace (Table 5). Table 28 shows the BTO internal analysis for new and existing commercial
buildings with 1.38 CFM75/ft2 being used as the baseline tightness (Emmerich 2011, Bohac 2013). Not
surprisingly, new buildings are tighter. For example, the current ASHRAE 189.1 standard requirement is
0.4 CFM75/ft2.43
In addition, the Army Core of Engineers recently set a maximum building envelope air
leakage requirement of 0.25 CFM75/ft2 (USACE 2012).
A study by Bohac (2013) shows that existing cost-effective air-sealing technologies, such as foam sealing
of wall/roof joints and exterior weather-stripping, leads to an average leakage reduction of 10% in
commercial buildings (26,927 to 246,365 ft2) in cold climates. These measures are most impactful for
leaky buildings with large, concentrated leaks that are inexpensive to seal. Table 28 shows that the
technical potential and unstaged maximum adoption potential of achieving this level of leakage reduction
(from 1.38 to 1.24 CFM75/ft2) with existing technologies is only 44 TBtu. Bohac’s analysis shows that
the cost of sealing these large, concentrated leaks is $0.17 per 5-sided envelope, leading to a simple
payback of approximately 6 years. This analysis shows that while sealing commercial buildings with
existing technologies is economically attractive, there is a relatively small energy savings potential.
In order to determine R&D cost and performance metrics for an air-sealing system, we have considered
the opportunity for reducing the national average tightness of commercial buildings from 1.38 CFM75/ft2
(Emmerich, 2011) to 0.25 CFM75/ft2, an 83% reduction. This requires both sealing large, concentrated
leaks with existing, cost-effective approaches, as discussed above, and sealing more dispersed and
difficult-to-find leaks. Table 28 shows that the technical and unstaged maximum potential for this
technology measure is 805 TBtu. Assuming an average cost of $0.5/ft2 (5-sided envelope) for achieving
this 83% leakage reduction, the 2030 simple payback is 2.7 years. We assume that the cost sensitivity is
not linear because of the costs of sealing different leakage sources. The cost of sealing large, concentrated
43 More information can be found at ashrae.org/resources--publications/bookstore/standard-189-1

R&D Roadmap For Emerging Window And Building Envelope Technologies 51
leaks is not expected to change substantially from the cost metrics presented in Bohac’s analysis (~$0.17
per 5-sided envelope), but instead that the majority of costs will be the result of sealing more dispersed,
costly leaks needed to achieve the final performance target.
In addition, the size and design of U.S. commercial buildings varies substantially, from small main-street
storefronts to large office buildings in major cities. While blower-door tests can be used to measure
infiltration in small commercial buildings, there is no comparable technology for measuring infiltration in
large commercial buildings, limiting the data available to analyze this opportunity. Clearly, a technology
capable of measuring infiltration losses in large commercial buildings is a technology-development
opportunity that would be extremely impactful for reducing building energy losses. This opportunity is
discussed in more detail in Chapter 5. Like the residential sector, the analysis we present here does not
directly capture the benefit of the proposed R&D target because the technology is not capable of
simultaneously controlling heat, air, and moisture.
Technical Barriers and Challenges
Table 28. Technical Barriers and Challenges to the Development of Cost-Effective Advanced Air-Sealing
Technologies
Topic/Barrier Description
R&
D B
arri
ers
System simplification High cost for three separate systems to control heat, air, and
moisture, viable integrated systems will be more cost effective
Selective sealing with spray-applied sealers Existing spray-sealing technologies need improved sealing
capabilities at reduced costs
Inadequate quality control and verification of
completeness during application process,
inadequate visual or other indicators of
installation flaws
Techniques that can be used during application to ensure
consistent implementation—simple, non-destructive
techniques to quickly and properly detect flaws and remediate
Man
ufa
ctu
rin
g an
d
Scal
e-U
p B
arri
ers
Manufacturing quality control to ensure
performance
Single control systems will require screening upon being
manufactured to ensure consistent viability during service life
A coordinated systems approach is inhibited
by the sequence of building trades involved in
installations
Improved coordination between different trades involved in
the installation of environmental control equipment could
enable a systems approach
Inability to install and seal the system
immediately after or during construction
System installed (e.g., sealed) after or during construction in
order to mitigate all of the flaws created during construction
Market and Deployment Barriers
Table 29. Market and Deployment Barriers to the Adoption of a Systems-Level Approach to Air-Sealing
Market/Deployment Barrier Description
System price-point Systems-level approaches need to show value-add benefits beyond that of the
individuals systems installed together
Climate dependent air and
moisture barrier co-location
Sealing solutions must have the capability to be added “à la carte,” depending on the
environment conditions they will be installed in
Low-cost verification and
validation
Low-cost validation techniques need to be performed prior to or immediately after
the completion of building construction so that remediation can be applied more
cost-effectively
Variability of Market Different builders vary in their product choices and solutions, solutions are different
for new and existing construction
Inspector Training Improved inspector training to ensure consistency in application and validation

R&D Roadmap For Emerging Window And Building Envelope Technologies 52
Table 30. Air-Sealing Systems R&D Technology Roadmap
Topic Description: Develop a systems-level approach to prevent uncontrolled heat, air, and moisture flow in the envelope at an appropriate price point to facilitate mass-market adoption in the commercial and residential sectors. Develop a system with air leakage <1 ACH50, at a cost of ≤$0.5 per ft
2 finished floor for use in
residential buildings and a system with air leakage <0.25 CFM75 per ft2
(5-sided envelope), at a cost of ≤$0.5 per ft
2 (5-sided envelope) for use in commercial buildings. Costs include mechanical ventilation costs.
Roadmap Action Plan Activities Milestones
Ne
ar T
erm
(<5
yrs
)
Develop improved (i.e., reduced leakage) integrated sealing at joints and interfaces between assemblies
Perform accelerated performance tests
Collect air-sealing cost data and develop a database of envelope sealing costs
Establishment of a database of envelope sealing costs to complement existing databases of leakage levels
Commercial buildings: Air-sealing systems for new and renovated buildings with air leakage reduced to 0.25 CFM75 per ft
2 5-sided envelope (USACE 2012), at a
projected installed cost of ≤$1.25 per ft2 5-sided
envelope (Bohac 2013)
Residential buildings: Air-sealing systems with air leakage reduced to 5 ACH50, at a projected installed cost of ≤$0.9 per ft
2 finished floor (National Residential
Efficiency Measures Database 2013)
Mid
Te
rm
(6 –
9 y
rs)
Develop methods to reduce installation cost of self-adhering field-applied air barriers by 25%
Develop methods to reduce installation cost of fluid-applied air barriers by 25%
Develop envelope joint sealing methods and technologies to improve leakage rates by 15% with projected installed cost of 85% of current industry standard mean
Develop and implement leakage testing technologies to cost-effectively test portions of in-situ building envelopes to enable quality assurance during construction sequence
Develop a listing of key air leakage sites so that the applicator knows where to focus efforts
Determine a method to air seal in a retrofit application that does not require the disassembly of the entire envelope component
Develop products that can be installed in a variety of environmental conditions
Commercial buildings: Air-sealing systems with air leakage reduced to 0.25 CFM75 per ft
2 5-sided envelope
(USACE 2012) at a projected installed cost of ≤$0.75 per ft
2 5-sided envelope (Bohac 2013)
Residential buildings: Air-sealing systems with air leakage reduced to 3 ACH50, at a projected installed cost of ≤$0.5 per ft
2 finished floor (National Residential
Efficiency Measures Database 2013)
Lon
g Te
rm
(9 –
12
yrs
)
Develop methods to reduce installation cost of self-adhering field-applied air barriers by 50%
Develop methods to reduce installation cost of fluid-applied air barriers by 50%
Develop envelope joint sealing methods and technologies with to improve leakage rates by 25% with projected installed cost of 65% of current industry standard mean
Develop and commercialize air-sealing technologies with improved cost and performance including self-detecting, self-repairing, integrated, and other novel air-sealing methods
Develop new techniques to apply to retrofit applications
Commercial buildings: Air-sealing systems with air leakage reduced to 0.25 CFM75 per ft
2 5-sided envelope
at a projected installed cost of ≤$0.5 per ft2 5-sided
envelope (including mechanical ventilation costs) (Bohac 2013)
Residential buildings: Air-sealing systems with air leakage reduced to 1 ACH50, at a projected installed cost of ≤$0.5 ft
2 finished floor (including mechanical
ventilation costs) (National Residential Efficiency Measures Database 2013)

R&D Roadmap For Emerging Window And Building Envelope Technologies 53
Benefits and Impacts
Factor Impact Description
New Buildings Med Envelope infiltration can offset the benefits of other energy efficiency technologies.
Retrofit
Buildings High
Large energy savings from potential stock of existing buildings—the systems-level approach is an additional capability beyond the state-of-the-art technology, which may further extend energy-savings potential.
Industry
Competitiveness High
A systems-level approach is a capability beyond what is available from currently available technologies; this system will redefine the state-of-the-art for the industry.
Cost Reduction Medium
Cost reductions will enable wider adoption, but many existing building-wrap technologies are currently cost competitive. However, today’s technologies do not provide a systems-level approach to controlling heat, air, and moisture flow in the envelope. A systems-level approach that achieves the technology cost and performance targets is projected to lower payback to below 3 years.
$0.9/ft2
$0.5/ft2$0.5/ft25
3
1
0.0
1.0
2.0
3.0
4.0
5.0
6.0
7.0
8.0
9.0
10.0
$0.0
$0.1
$0.2
$0.3
$0.4
$0.5
$0.6
$0.7
$0.8
$0.9
$1.0
2014 2016 2018 2020 2022 2024 2026
Air
Ch
ange
s p
er H
ou
r (A
CH
50
)A
ir In
filt
rati
on
aft
er
Air
Sea
ling
Co
st
$/f
t2Fi
nis
hed
Flo
or
Year
Figure 31. Air-sealing systems installed cost and performance targets (residential sector)44
$1.25/ft2
$0.75/ft2
$0.50/ft2 $0.50/ft2
0.25 0.25 0.25 0.25
0.00
0.05
0.10
0.15
0.20
0.25
0.30
$0.0
$0.5
$1.0
$1.5
$2.0
2014 2016 2018 2020 2022 2024 2026
Air
Le
akag
e p
er 5
-sid
ed e
nve
lop
e ar
ea (
CFM
75
/ft2
)
Co
st p
er p
er 5
-sid
ed e
nve
lop
e($
/ft2
)
Year
Figure 32. Air-sealing systems installed cost and performance targets (commercial sector)45
44 Residential air-sealing: baseline cost of infiltration reduction = $1.5/ft2. Source: BTO Prioritization Tool, Measure 391.
References of all Prioritization Tool measures are located in Appendix C. 45 Air tightness and improvement cost data from cited literature are used as state-of-the-industry benchmarks (Bohac 2013,
Emmerich 2013). Cost targets have been normalized to a per-ft2-of-building-envelope basis (5-sided area index), consistent with
current industry practice. Cost sensitivity is not linear because of the costs of sealing different leakage sources. The cost of sealing
large, concentrated leaks (to reduce leakage from 1.38 to 1.24 CFM75/ft2) is not expected to change substantially from the cost
metrics presented in Bohac’s analysis (~$0.17/ft2), but the majority of costs will result from sealing more dispersed, costly leaks
needed to achieve the final performance targets (0.25 CFM75/ft2).

R&D Roadmap For Emerging Window And Building Envelope Technologies 54
Building Envelope High Priority R&D Topic: Highly Insulating
Roofs for Commercial Buildings
Overview
Roof systems may contribute to up to 33% of building losses, depending on the building zone (Roof
2013). Table 2 shows that, in the commercial sector, roofs contributed to 0.88 and 0.05 quads of energy
lost for space heating and cooling, respectively, in 2010. While the residential sector loses more energy to
roofs than the commercial sector, R&D focus is on commercial sector roofs because typical residential
homes have attics that can insulate effectively with existing technologies by adding thermal resistance
between the roof and the conditioned space of the home.46
However, because less energy is lost through
roofs than through walls and infiltration in the commercial space, this is a secondary R&D priority
relative to thermal insulation materials for walls and infiltration control. The R&D goal is to develop a
roof system that exhibits a reduction in energy use equivalent to doubling the R-value of current
ASHRAE values (90.1-2010) at an incremental cost increase of ≤$1/ft2 ($100/100 ft
2) compared to
standard roof technology. The R&D roadmap for moving this technology forward is shown in Table 33.
Technical Barriers and Challenges
Table 31. Technical Barriers and Challenges to the Development of Cost-Effective Highly Insulating Commercial Roofs
Topic/Barrier Description
R&
D B
arri
ers
Novel materials to reduce roofing
heat flux
Reducing heat flux by 50% will likely require exploiting new materials, such
as nanomaterials, or novel arrangements of existing roofing materials.
Sustainability of product to
maintain performance goal
Roofs must maintain their flux properties over their service lives in order to
achieve predicted energy savings.
Chemical compatibility and
moisture resistance
Any new roof system will need to maintain existing chemical and physical
properties despite exposure to extreme temperature, moisture fluctuations,
and other environmental factors.
Rating and characterization at
delivery temperature
Because roofs in different ASHRAE environmental zones require different
performance requirements, it is important to identify the necessary
capabilities at those conditions and the method by which those are identified.
Man
ufa
ctu
rin
g an
d
Scal
e-U
p B
arri
ers
Thermal bridging reduction
To achieve the performance goal for the overall roof system, new roof
materials and roofing structures need to be designed to optimize
temperature gradients through roof components and between the roof and
the wall (Seaverson 2008)
Compressive and tensile strength Novel roof systems must not sacrifice basic mechanical requirements for
building roofs.
Benign (environmentally friendly)
blowing agents and raw materials
Considerations in occupational safety must be a significant aspect in the
design of advanced roof systems.
In-situ characterization of
performance (field demonstration)
Large area true-service life performance characterization will be important
in order to validate the performance of the enhanced roof product.
46 Typical commercial roofs are a mix between low-slope water impermeable materials (thermoplastic polyolefin, polyvinyl
chloride, ethylene propylene diene monomer, bitumen, built-up roof membranes, spray foam, and metal panel) and steep-slope
(metal panel, shingle, tile, and synthetic). Commercial roofs are typically more expensive than residential roofs because a low-
slope roof must be water tight and must include a drainage system in the roof assembly to prevent water ponding on the roof.
Current commercial roof technology costs are in the range of $5–$10/ft2.

R&D Roadmap For Emerging Window And Building Envelope Technologies 55
Market and Deployment Barriers
Table 32. Market and Deployment Barriers to the Adoption of Highly Insulating Commercial Roofs
Market/Deployment Barrier Description
New Technology Adoption and
Proof of Concept
Inherent resistance to using newly developed building materials in construction
necessitates targeted training of installers and contractors on the benefits of utilizing
the new systems as well as of sharing performance data from the proof of concept
demonstrations. (Goldsberry 2013)
Table 33. Highly Insulating Roof R&D Technology Roadmap
Roadmap Action Plan Activities Milestones
Ne
ar T
erm
(<5
yrs
)
Survey existing and potential insulation materials for cost effective: o thermal conductivity o moisture tolerant performance
Develop simulation models to identify optimal material systems and roofing designs across various ASHRAE climate zones
Develop methodology to create and integrate low-flux roof systems
Prototype hydrophobic roof for climate zone 6 (cold climates) with an R value equal to 45 (Standard 2013; ASHRAE 2013)
Prototype hydrophobic roof for climate zone 2 (hot climates) with an R value equal to 35
Manufacturing processes demonstrated for roof areas >10 ft
2 with an increased cost <$10/ft
2 and a critical
path determined to achieve final cost targets
Mid
Te
rm
(6 –
9 y
rs)
Develop improved systems and methods for accurately evaluating the performance of new versus existing roofing materials
Perform failure mode examinations to ascertain system performance under service conditions and identify aspects for material optimization
Simulation of roof material models’ performance with accuracy within 10% of experimental results
Validation of developed roof material systems against ASHRAE 90.1-2010 standards to performance metrics at each climate zone, compared to existing roof systems
Small-scale field testing of a hydrophobic roof (>50ft2)
for climate zone 6 with an R value equal to 60 (50% reduction in heat flux compared to ASHRAE 90.1-2010)
Small-scale field testing of a hydrophobic roof (>50ft2)
for climate zone 2 with an R value equal to 50 (50% reduction in heat flux compared to ASHRAE 90.1-2010)
Demonstrate manufacturing process for >50ft2 at an
increased cost < $3/ft2
Lon
g Te
rm
(9 –
12
yrs
)
Conduct performance testing
Conduct acceleration testing and calibrate against weather/environment phenomena
Field testing of a hydrophobic roof (>50ft2) for climate
zone 6 with an R value equal to 60 (50% reduction in heat flux compared to ASHRAE 90.1-2010)
Field testing of hydrophobic roof (>50ft2) for climate
zone 2 with an R value equal to 50 (50% reduction in heat flux compared to ASHRAE 90.1-2010)
Demonstrate the manufacturing process for >50ft2 at
an increased cost of < $1/ft2
Benefits and Impacts
Factor Impact Description
New Buildings High Enhances envelope insulation and positively impacts active equipment
Retrofit
Buildings Medium
Limited impacts due to the high cost of roof retrofits, which results in a market size of highly insulating roofs for existing buildings that is only 10 TBtu higher than the market size of roofs for new buildings, despite the larger stock of existing buildings (Table 5).
Industry
Competitiveness High Support domestic roofing technology manufactures and building contractors
Cost Reduction Medium The R&D performance target doubles energy performance with a modest increase in cost to ensure reasonable payback for consumers. Meeting the roadmap cost and performance targets will lower payback from approximately 19 years to 12 years.
Topic Description: A roof exhibiting energy use reduction that doubles ASHRAE 90.1-2010 R-values at an increased cost limited to ≤$1/ft
2 compared to standard roof technology.
46

R&D Roadmap For Emerging Window And Building Envelope Technologies 56
$10/ft2
$3/ft2 $1/ft2
25
35
50
30
45
60
0
10
20
30
40
50
60
70
$-
$2
$4
$6
$8
$10
$12
2014 2016 2018 2020 2022 2024 2026
Ro
of
R-V
alu
e (h
r·ft
2·°
F/B
tu)
Incr
ease
d R
oo
f C
ost
co
mp
ared
to
St
and
ard
Ro
of
Tech
no
logy
($
/ft2
)
YearCost Targets
Performance Targets: Climate Zone 2
Performance Targets: Climate Zone 6
Figure 33. Highly insulating roof technology installed cost and performance targets47, 48
47 Baseline cost of increased roof insulation = $1/ft2. Source: BTO Prioritization Tool, Measure 741. References of all
Prioritization Tool measures are located in Appendix C. 48 ASHRAE climate zones divide the United States into temperature-oriented climate zones. Climate zone 2 covers portions of
the southern United States that typically experience hot temperatures, including parts of Florida, Texas, and Arizona. Climate
zone 6 covers portions of the United States that typically experience cold temperatures, including parts of New York, Wisconsin,
and Michigan. Climate zones are described and illustrated in more detail in volume 7.1 of DOE’s Building America Best
Practices Series, which can be found here:
apps1.eere.energy.gov/buildings/publications/pdfs/building_america/ba_climateguide_7_1.pdf.

R&D Roadmap For Emerging Window And Building Envelope Technologies 57
5. CROSSCUTTING DRIVERS AND
CHALLENGES Overview
There are numerous market drivers beyond energy savings and cost effectiveness that facilitate rapid
technology adoption of next-generation building energy efficiency technology. Similarly, there are many
non-energy and non-cost factors that hinder the mass-market adoption of these technologies. Many of
these market barriers cross-cut windows and building envelope technologies and can apply to both the
residential and commercial sectors; others are more specific to the technology type and the sector. In
order to promote mass-market adoption of next-generation, energy-efficient technologies, it is important
to better understand the issues that would limit or accelerate mass-market adoption, addressing challenges
in parallel to technology development. The main challenge areas include:
1) Identifying which technology areas would benefit most from reducing balance of system (BOS)
costs and approaches to achieve BOS cost reductions.
2) Developing diagnostic technologies that will help make a business case for building energy
upgrades and changes in building codes
3) Understanding methods for strengthening the business case for retrofits and developing
appropriate and innovative business plans
Soft Costs
In residential and commercial buildings, soft costs, or BOS costs, include factors such as labor costs, ease
of installation, transportation issues, wiring, wireless, etc. As discussed in detail in Chapter 4, in many
cases, these factors dominate the installed cost. For example, the installed cost (materials + labor) of 3.5
inches of fiberglass batt insulation to an interior wall is estimated to cost $0.57/ft2 (Kosny 2013). The
labor portion of this cost is estimated to vary from $0.43/ft2 to $0.47/ft
2 (Kosny 2013). For ENERGY
STAR rated windows, installation cost varies, but is approximately 50% of the total installed cost
(Checklist 2013). The BOS costs must be minimized to enable the adoption of next-generation, energy-
efficient technologies. In order to reduce these costs, it is important to consider which technology areas
within the windows and building envelope space (e.g., dynamic windows and façades) and similarly
which applications (e.g., building retrofits vs. new construction) would benefit most from BOS cost
reductions.
BOS costs are particularly important for the retrofit market. Walls, roofs, and windows make up the
structure of the building. They vary widely from building to building, and as a result, retrofits must be
done on a case-by-case basis. This leads to long construction times, high labor costs, and energy-
efficiency improvements that are poorly suited to the building and have negative impacts on building
performance metrics, such as the indoor air-quality or moisture control.
BOS costs dominate the total installed costs for many sealing and insulation technologies. Possible
approaches to reducing these costs include low-cost advanced thermal insulation with reduced thickness

R&D Roadmap For Emerging Window And Building Envelope Technologies 58
to enable quick interior retrofits that do not require construction tasks, such as rearranging outlets and re-
adjusting pipes; combining exterior continuous insulation with siding or roofing products; and producing
an airtight and watertight envelope with automated sealing verification.
Dynamic façades, including dynamic windows, attachments, films, and glazing, are one area where
reductions in soft costs would reduce a substantial portion of the total installed cost. These dynamic
window technologies that are self-contained, easy to install, and autonomous with wireless
communications and powering and a reduced footprint, could be installed without changing the methods
currently used by practitioners. Conversely, if the installation method is more complicated than current
methods, market adoption of dynamic facades would be diminished, despite the merits of the technology.
Common communication standards and interception protocols for dynamic windows would also help to
reduce soft costs and encourage interoperability. Other approaches specific to achieving reduced soft
costs for dynamic windows include reducing sensor costs and the cost of a warranty in the window’s base
cost.
Designing and manufacturing insulation products, walls, roofs, and windows that are simple and quick to
install would help to reduce the labor costs. This could be done by developing systems that either come
complete as a kit, easily snap into place, or are pre-cut for quick installation. Modular, pre-fabricated
assemblies, components, and envelope or window sections would involve less installation and
commissioning costs while promoting higher-performance systems. Similarly, access to the insulation
space needs to be less intrusive, allowing for quick optimization opportunities at convenient times. An
alternative approach to reducing soft costs would be to standardize installer workforce training through
the development of uniform best practices, with trainings offered at community colleges across the
country. This training could be focused on the installation, operation, and/or maintenance of specific
systems or devoted to specific topics, such as weatherization. Other methods to reduce soft costs could
come from improvements in logistical, non-technology areas. This would include improving project
initiative methods to prevent delays and higher costs; improving marketing and community-based efforts;
and focusing on reducing product weight, handling, and shipping, and using local or distributed shipping
approaches. The development of regional centers could allow for more accessible information solutions
on a local, rather than federal level.

R&D Roadmap For Emerging Window And Building Envelope Technologies 59
Building Diagnostics
Existing buildings offer great potential for
energy savings from the implementation of
energy efficiency building retrofits. Table 4 in
Chapter 2 shows that in 2010, 1.193 million
new buildings were constructed in the United
States compared to 82.7 million existing
buildings. Similarly, in 2035, 1.114 million
are projected to be built compared to 104.85
million existing buildings. This data clearly
shows that the market, and therefore the
energy savings opportunity, for retrofitting
existing buildings is far greater than for
constructing new buildings. Additionally, new
buildings generally have better energy
performance than existing buildings due to
improving codes and energy-efficiency performance degradation over time. A lack of awareness of these
energy saving opportunities often leads to inaction, even when it is simple and cost-effective to perform
retrofits. A more convincing business case for retrofits can be made with improved building diagnostic
and measurement technologies, such as improved sensors and new modeling methods, as well as more
effective methods to disseminate this critical information to residential and commercial building owners
and code officials. Existing diagnostic technologies, such as IR cameras and blower door tests, are not
broadly utilized to inform consumers about the energy savings potential in wide-scale building retrofits.
For example, IR camera images of buildings can be a persuasive method to visually show areas of high
building losses and identify the highest-priority retrofit projects. However, consumers are often unaware
of what their building thermal image may look like, and unaware of energy savings opportunities. One
method to address this issue is to develop an informational website, such as something similar to Google
Street View, that allows consumers to see their home’s existing thermal image and compare it to an image
showing the results of different improvements or retrofits (as well as the resulting annual energy cost
savings that would result) (LaMonica 2013). Alternatively, a low-cost (i.e., <$100) infrared camera that
can quickly and accurately scan buildings and is easily available to consumers or contractors would also
help to raise awareness of the savings available from building retrofits. Moreover, in large commercial
buildings, there is no available technology to identify infiltration, and as a result it is omitted from the
codes and standards for commercial buildings.
The development of real-time displays that show whole building energy use status and identify how little
or how much energy is being lost through windows or envelopes through infiltration is another method to
help build the business case for building retrofits, as well as promote a culture of energy efficiency in
daily building use. Placing similar displays in public spaces in both commercial and residential buildings
would likely encourage awareness among building occupants, who are not directly responsible for the
payment of building energy bills. The ability of these self-diagnostic building displays to show accurate,
real-time data is contingent on the development of low-cost, automated, and non-intrusive sensor
technologies. Sensors will be able to detect failures or problems before or immediately after they occur,
allowing consumers to understand acceptable rates of air leakage and to alert consumers to immediately
take action if problem areas emerge. Sensors and controls can also be embedded in components during
Figure 34. Infrared image of a residential home, showing
parts of building with high energy losses (red)

R&D Roadmap For Emerging Window And Building Envelope Technologies 60
the manufacturing process so they can provide immediate automated sensing of building aspects, such as
lighting and shade control or measuring in-situ thermal performance. Widespread adoption of sensors in
building components is contingent on these low-cost sensors being developed.
Other related strategies can help consumers be more aware of energy consumption issues within
buildings. Simple and tactile sensor technologies can be sold directly to the consumer for placement in
and around buildings. Currently available sensor technologies will need to be easier and more inexpensive
to integrate with lighting, air filtration, and other systems. Specifically, sensor technologies that can
measure properties such as air leakage, temperature, and moisture within the building envelope should be
developed so that energy efficiency, energy consumption, and IAQ can be easily monitored. IAQ sensors
and diagnostics that can provide feedback to building occupants and managers can help maintain optimal
air quality and remove any chemical pollutants as soon as they are detected. Another specific example is
the need for an SHGC sensor for windows that has both interior and exterior components. With the
development of these sensor technologies, it is important to also develop the appropriate software tools to
manage the large amounts of resulting data and give consumers appropriate action recommendations to
achieve cost-effective energy savings.
These building self-diagnostic technologies will be able to identify areas of high energy losses and
recommend actions to save energy. It is also important to develop complementary modeling software and
control logic to compare the costs and expected energy savings of different retrofit options, including the
complete replacement of technologies with energy-efficient upgrades, as well as identifying how space
can be optimized after retrofits are completed (Selkowitz 2013). A public database, which could be
accessed via smart phones, could also provide a range of retrofit options based on orientation, geography,
and the base system used. Other tools that are currently needed include an occupant comfort feedback and
sensing tool, as well as imaging technology that can probe the sub-wall surface. For testing, there is a lack
of portable testing kits for homeowners to identify existing problems with windows, as well as a
standardized field-testing protocol for window retrofits. Software or tools that provide field-verified
guidance or performance verification during the construction stage is an example of another need.
The creation of smarter building components, which is even further down the development pathway, such
as walls, roofs, and windows composed of self-sensing materials could enable the self-regulation of
attributes such as thermal flow, light, and humidity, in addition to the self-diagnosis of any fluctuations in
any of the self-regulated building properties. Research in this field is still in the very early stages (He
2012), but the use of these types of smart materials would result in increased energy savings, as well as
reduced soft costs for building component installation and maintenance.
Technology Deployment Strategies
Because achieving targeted energy consumption reductions through commercial and residential building
envelopes requires the adoption of next-generation energy efficiency technologies, it is important to
consider and understand the market drivers that can enable or hinder their mass-market adoption.
Enabling market drivers must be identified in parallel with the development of next-generation
technologies in order to foster mass-market adoption and reduce their time to market. The extent to which
specific drivers should be considered during technology development and what, if any, price premiums
they could command in the market will likely vary by market and technology.

R&D Roadmap For Emerging Window And Building Envelope Technologies 61
Aesthetics In the residential buildings sector, aesthetics is a top market driver and the driver for which consumers are
most likely willing to pay the greatest price premiums. Also, aesthetics are especially important for
windows, as they play a large role in the aesthetics of buildings. For the commercial sector, providing a
range of available colors for dynamic windows will allow the architect to have more design control. Other
examples of improvements that can enable mass-market energy efficiency technology adoption include
the visual aesthetics of static glazing, cool roofs and walls that will remain clean, and aesthetically
pleasing or dark-colored cool roofs and walls.
Simulation Tools Researchers, manufacturers,
building designers and operators
rely on accurate simulation tools
to understand, promote and
develop new energy efficient
technologies. DOE supports the
development of modeling tools
that simulate the thermal and/or
optical performance of
individual building components,
such as a window or a wall, as
well as integrated façade
systems. These tools are used to
aid in the development of more
efficient products by saving time
and money for product design
and development. These tools
also feed into EnergyPlus, a
DOE-supported whole building simulation program, as illustrated with the windows and daylighting tools
shown in Figure 35. EnergyPlus allows for the optimization of building design and operation to minimize
energy use and peak demand as well as thermal and visual comfort. Tools have a substantial base of
regular users and must be constantly improved and upgraded to reflect technology advances and to meet
the evolving needs of end-users.
Role of Architect/Contractor Architects and contractors are more indirectly involved during the development of energy-efficient
technology, but can play an important role in the mass-market adoption of these technologies. There are
both quantitative and qualitative aspects (e.g., human behavior and style trends) that the architect or
contractor has to consider. As such, closer communications between architects and vendors or trade
groups may help foster wider adoption of the technologies. With new technologies, there is more risk for
the contractor compared to the architect, so it is necessary to convince the contractor/owner to take that
risk. New products need to be able to fit seamlessly with an architect’s design tools; the development of a
rating system would better help architects understand the benefits or risks of specific new technologies.
Finally, developing or offering training in building science for the architect or contractor would also be
beneficial to the goal of driving the use of new energy-efficient technologies.
Figure 35. Selection of currently available windows and daylighting
simulation tools, including the Complex Glazing Database (CGDB),
EnergyPlus, International Glazing Database (IGDB), Optics, Two-
Dimensional Building Heat-Transfer Modeling (THERM), Radiance and
WINDOW. These tools and others are available for download at
windows.lbl.gov/software/.

R&D Roadmap For Emerging Window And Building Envelope Technologies 62
Acoustics and Soundproofing In commercial buildings, acoustics and soundproofing can be considered a driver for the airtight
construction of both windows and walls. Improvements in soundproofing could drive the adoption of multi-
pane windows and encourage the development of thinner and more visually appealing products. When
compared to other residential building market drivers, soundproofing was considered to be less important.
Thermal Comfort The thermal comfort of building occupants is another key driver for the residential and commercial
sectors and one of the largest drivers for change. Improved thermal comfort can be used as a selling point
for technologies. When considering building technology solutions that result in greater thermal comfort, it
is important to also focus on solutions that will reduce energy use rather than increase it. New
technologies and methods to consider include composite thermal comfort models that are easy to use and
being able to better understand human perception and personalized comfort.
Regulations and Codes Building regulations and codes drive the market for energy efficiency technologies, especially for
commercial buildings. In general, it takes a significant amount of time for codes to change; even though
they are essential, they can cause challenges for energy-efficient technology development and adoption.
Identifying code discrepancies that are barriers to new technologies and imposing rate structures that are
energy based with end-use ceilings could increase the rate of adoption of next-generation technologies.
Payback/Return on Investment Payback/return on investment is an important market driver for both the commercial and residential
sectors. Specific areas where payback times should be focused on include façades and retrofits for
existing buildings. For example, when retrofitting existing buildings, improving the comfort, acoustics,
and heating would improve the quality of life for building occupants and could also be reflected in rental
rates, allowing for additional selling points and quicker paybacks.

R&D Roadmap For Emerging Window And Building Envelope Technologies 63
APPENDIX A: R&D ROADMAP
WORKSHOP PARTICIPANTS April 5, 2013 – Washington, DC
Omar Abdelaziz
U.S. Department of Energy, Building Technologies
Office (on detail from Oak Ridge National
Laboratory)
Kyle Alvine
Pacific Northwest National Laboratory
Andre Anders
Lawrence Berkeley National Laboratory
Mehran Arbab
PPG Industries, Inc.
Bas Baskaran
National Research Council Canada
Greg Bergtold
The Dow Chemical Company
Brian Berland
ITN Energy Systems, Inc.
John Breshears
Architectural Applications
An Chen
University of Idaho
Daniel Chung
Philadelphia University
Walter Clevenstine
Bayer Material Science
Thomas Culp
Birch Point Consulting
Charlie Curcija
Lawrence Berkeley National Laboratory
André Desjarlais
Oak Ridge National Laboratory
Hugo Destaillats
Lawrence Berkeley National Laboratory
John Gant
Glen Raven, Inc.
Guillermo Garcia
Heliotrope Technologies, Inc.
Ashok Gidwani
Booz Allen Hamilton
David Hawn
Dedicated Roof and Hydro-Solutions, LLC
Jason Holt
Heliotrope Technologies, Inc.
Patrick Hughes
Oak Ridge National Laboratory
Diana Hun
Oak Ridge National Laboratory
Eric Jackson
Quanex Building Products
Roderick Jackson
Oak Ridge National Laboratory
Mack Jeremy
SAGE Electrochromics, Inc.
Achilles Karagiozis
Owens Corning
Chris Ketchum
RavenBrick
Rob Kistler
The Facadegroup
James Klausner
U.S. Department of Energy
Advanced Research Projects Agency
Frank Klink
3M
Christian Kohler
Lawrence Berkeley National Laboratory
Jason Koman
Formerly U.S. Department of Energy, currently
with Green Strategies Inc.
Sneh Kumar
Traco/Kawneer/Alcoa
B. Leo Kwak
Applied Materials, Inc.

R&D Roadmap For Emerging Window And Building Envelope Technologies 64
Ian LaHiff
Formerly U.S. Department of Energy, currently
with the City of Orlando
Eleanor S. Lee
Lawrence Berkeley National Laboratory
Marcus Linde
Quanex Building Products, Inc.
Richard Lunt
Michigan State University
Colin McCormick
U.S. Department of Energy
Ray McGowan
National Fenestration Rating Council
William Miller
Oak Ridge National Laboratory
Mark Modera
University of California, Davis
Patrick More
VPI Quality Windows
Paul Nahass
Aspen Aerogels, Inc.
Chris Nolt
ProVia Door, Inc.
Raghu Padiyath
3M Company
Pat Phelan
U.S. Department of Energy
Building Technologies Office
Ming Qu
Purdue University
Elizabeth Santori
U.S. Department of Energy
Advanced Research Projects Agency
Karma Sawyer
U.S. Department of Energy
Building Technologies Office
Jennifer Scheib
National Renewable Energy Laboratory
Stephen Selkowitz
Lawrence Berkeley National Laboratory
Max Sherman
Lawrence Berkeley National Laboratory
Ming Shiao
CertainTeed Corp.
Morgan Sibbald
Sherwin-Williams Company
Douglas Smith
NanoPore Incorporated
Timothy Snow
National Renewable Energy Laboratory
Edgar Stach
Philadelphia University
Yong Tao
University of North Texas
Minoru Taya
University of Washington
Robert Tenent
National Renewable Energy Laboratory
Howard Turner
Kinestral Technologies
Thanos Tzempelikos
Purdue University
Kevin Vilhauer
Milgard Manufacturing, Inc.
Eric Werling
U.S. Department of Energy
Theresa Weston
DuPont Building Innovatons
Lisa Winckler
International Window Film Association
Arthur Yang
Industrial Science & Technology Network, Inc.
Hongxi Yin
Southeast University, Nanjing, China
Robert Zarr
National Institute of Standards and Technology

R&D Roadmap For Emerging Window And Building Envelope Technologies 65
Appendix B: Acronyms and Abbreviations
ACH50 Air changes per hour at 50 Pascals
ASHRAE American Society of Heating, Refrigerating and Air Conditioning Engineers
BOS balance of system
BTO Building Technologies Office
Btu British thermal unit
C commercial
CFM75 Cubic feet per minute at 75 Pascals
DOE U.S. Department of Energy
EIFS Exterior Installation Finishing System
ET Emerging Technologies
ft2
square foot
HVAC heating, ventilation, and air conditioning
IAQ indoor air quality
IGU insulated glass unit
IR infrared
LBNL Lawrence Berkeley National Laboratory
low-E low-emissivity
PCE power conversion efficiency
PV photovoltaic
quads quadrillion Btu
R residential
R&D research and development
SHGC solar heat gain coefficient
TBtu trillion Btu
TCO transparent conductive oxide
VIG vacuum insulated glass
VIP vacuum insulated panel
VT visible transmittance

R&D Roadmap For Emerging Window And Building Envelope Technologies 66
APPENDIX C: PRIORITIZATION TOOL
RESULTS BTO has used the Prioritization Tool to analyze a wide range of windows and building envelope
technologies. The results for the technologies at development level49
3, 2, or 1 that are most relevant to
the roadmap R&D targets are summarized in Table 34 and Table 35, and shown graphically in Figure 8,
Figure 9, Figure 10, and Figure 11. The applicable buildings market segment, residential (R) and/or
commercial (C) is shown in the technology description column. The PT results assume current costs of
installed measures at the time of significant market adoption, as described in more detail in (Farese 2012b).
Table 34. Prioritization Tool Analysis Results for Select Windows Technologies at Development Levels 1, 2, or 3
Window Technologies
Technology Description Market Size50 (TBtu)
Technical Potential51,
2030 (TBtu)
Unstaged Max
Adoption Potential52, 2030 (TBtu)
Staged Max Adoption
Potential53, 2030 (TBtu)
Payback in 2030 (years)
Prioritization Tool
Measure Number
Highest Priority: Highly Insulating Windows
R-10 windows (R) 1,589 1,409 969 760 12 421
R-10 windows (C) 839 599 263 N/A 66 422
Dynamic Window Technologies
Window attachments (R)54
1,380 530 530 528 3 575
Window attachments (C)54 842 461 122 122 2 576
Dynamic windows, existing buildings (R) 1,961 1,010 571 164 26 401
Dynamic windows, new buildings (R) 532 212 138 36 33 400
Dynamic windows, existing buildings (C) 947 416 73 31 61 402
Dynamic windows, new buildings (C) 911 308 215 92 57 399
Visible Light Redirection Technologies
Daylighting (50-ft. floor plate) 682 345 168 126 10 816
49 Level 1 is defined as early stage R&D (i.e., lab bench scale, beyond basic science), level 2 is defined as late stage R&D (cost
reduction and performance improvements still needed, but technology may be available to early adopters), and level 3 is defined
as early deployment (energy savings are not yet proven in a whole building context). 50 Market Size represents the energy consumption associated with a building component (e.g., windows), within a particular
buildings market segment (e.g., commercial, residential, new or existing buildings). 51 Technical Potential assumes existing stock is immediately replaced with the new measure. The technical potential represents
the theoretical maximum energy savings available if the technology is implemented in the U.S. buildings sector (free of practical
constraints such as financing and deployment considerations). 52 Unstaged Maximum Adoption Potential (TBtu) assumes a ‘stock and flow’ model accounting for unit replacement, elimination
or addition. The unstaged maximum adoption potential represents the energy savings that would result if the technology is
deployed only for all end-of-life replacements and new purchases. 53 Staged Maximum Adoption Potential (TBtu) assumes that measures with the lowest cost of conserved energy are the first to
capture their share of the market to avoid double counting. The staged maximum adoption potential represents the energy savings
that would result if the technology is deployed only for all end-of-life replacements and new purchases, and does not include
savings that result from other technologies with a lower cost of conserved energy. 54 Energy-efficient window attachment products, such as low-E storm windows, cellular shades and low-E window films, do exist in
the market. But these products have limited market penetration and are in need of market-driving initiatives to accelerate adoption.

R&D Roadmap For Emerging Window And Building Envelope Technologies 67
Table 35. Prioritization Tool Analysis Results for Select Building Envelope Technologies at Development Levels 1,
2, or 3
Envelope Technologies
Technology Description Market Size50 (TBtu)
Technical Potential51, 2030 (TBtu)
Unstaged Max
Adoption Potential52, 2030 (TBtu)
Staged Max Adoption
Potential53, 2030 (TBtu)
Payback in 2030 (years)
Prioritization Tool
Measure Number
Thermal Insulation Materials
R-6 sheathing with sealing (R) 1,550 738 738 725 4.2 659
Sheathing with siding, no insulation (R) 620 111 111 52 27 658
Sheathing to exterior installation finishing system (EIFS) upgrade (R)
941 496 496 101 >100 660
EIFS with sealing (R) 1,163 791 791 217 71 657
EIFS R-30 walls (C) 857 547 336 64 25 592
R-30 walls, existing homes (R) 941 785 785 160 >100 591
R-30 walls, new homes (R) 443 277 259 0 5.8 590
VIPs in walls, existing buildings (R) 1,609 1,098 584 55 >100 667
VIPs in walls, existing buildings (C) 855 575 353 0 61 668
VIPs in walls, new buildings (C) 418 215 215 0 >100 808
R-10 slab edge in existing homes (R) 277 213 100 50 12 661
Air-Sealing System Technologies
Building wrap (C) 479 289 278 80 18 427
Building wrap (infiltration reduction of 40% in 47% of drafty homes) (R)
1,767 706 706 653 6.8 391
Air-sealing systems (infiltration reduction of 10% in commercial buildings (C)
982 44 44 0 5.9 834
Commercial Roofing Technologies
Increase roof insulation, new buildings (C) 257 129 129 44 19 741
Increase roof insulation, existing buildings
(C) 267 90 90 53 4.6 746
Cool Roofs, 0.75 SR, only hottest two U.S.
climate zones (C) 1,291 100 100 55 1.9 381

R&D Roadmap For Emerging Window And Building Envelope Technologies 68
Table 36. Sources and Notes for Prioritization Tool Energy Efficiency Measures
Prioritization Tool Measure
Number Source(s) used for Measure Relevant Notes
Window Technologies
399
Lee, E.S., Yazdanian, M. & Selkowitz, S.E. The Energy-Savings Potential of
Electrochromic Windows in the US Commercial Buildings Sector. Building 1-42
(2004). Cost: Personal communication - manufacturers and experts
Other Supporting Sources: Arasteh, D.; Selkowitz, S.; Apte, J.; "Zero Energy
Windows"; 2006 ACEEE Summer Study on Energy Efficiency in Buildings
BTP Tool: Impact from Lee paper scaled to full market
Appendix B: ~95 TBTUs savings at 40% market penetration
400
Program
Primary Source: Arasteh, D.; Selkowitz, S.; Apte, J.; "Zero Energy Windows"; 2006
ACEEE Summer Study on Energy Efficiency in Buildings
Other Supporting Sources: Lee, E.S., Yazdanian, M. & Selkowitz, S.E. The Energy-
Savings Potential of Electrochromic Windows in the US Commercial Buildings Sector.
Building 1-42 (2004). Cost: Personal communication - manufacturers and experts
BTP Tool: Includes system benefits as cost reduction (i.e.,
blinds, HVAC)
Appendix B: Table 4; adjusted for new building codes
401
Program
Primary Source: Arasteh, D.; Selkowitz, S.; Apte, J.; "Zero Energy Windows"; 2006
ACEEE Summer Study on Energy Efficiency in Buildings
Other Supporting Sources: Lee, E.S., Yazdanian, M. & Selkowitz, S.E. The Energy-
Savings Potential of Electrochromic Windows in the US Commercial Buildings Sector.
Building 1-42 (2004). Cost: Personal communication - manufacturers and experts
BTP Tool: Does not include system benefits
Appendix B: Table 4; baseline updated to 2010 stock
402
Program
Primary Source: Lee, E.S., Yazdanian, M. & Selkowitz, S.E. The Energy-Savings
Potential of Electrochromic Windows in the US Commercial Buildings Sector.
Building 1-42 (2004). Cost: Personal communication - manufacturers and experts
Other Supporting Sources: Arasteh, D.; Selkowitz, S.; Apte, J.; "Zero Energy
Windows"; 2006 ACEEE Summer Study on Energy Efficiency in Buildings
BTP Tool: Does not include system benefits
Appendix B: ~95 TBTUs savings at 40% market penetration
421 Southwall, Alpeninc, PNNL Lost Opportunities Primary Source: 6. Apte, J. & Arasteh, D. Window-Related Energy Consumption in the US Residential and Commercial Building Stock. Buildings 1-38 (Berkeley, CA, 2006). Personal communication: various window experts Other Supporting Sources: Arasteh, Dariush; Selkowitz, Steve; Apte, Josh; LaFrance, Marc. Energy Impacts of Today’ s Window Stock
BTP Tool: Does not include system benefits Appendix B: See tables 4 and 7 for use and savings Calculated from first principles; costs from NREL bottom-up VIG build 422
575 DOE-EPA Attachmentsindustry presentation; solar-components.com/comfortex.htm
Primary Source: Savings: first principles calculation from R- and SHGC- impacts of
product
Price: Comfortex. Manufacturer & expert interviews
Other Supporting Sources: Kotey, N.A., Wright, J.L., Barnaby, C.S., Collins, M.R.,
"Solar Gain Through Windows with Shading Devices: Simulation versus
Measurement," ASHRAE Transactions, Vol. 115, Pt. 2, (2009)
Appendix B: Savings: adding R-value of 1.75 and reducing SHGC
to 0.35
Price: Comfortex current prices compressed 1/3rd to represent
learning curve
576
Appendix B: Savings: adding R-value of 1.75 and reducing SHGC
to 0.35
Price: Comfortex current prices compressed 1/3rd to represent
learning curve
Market: assumes 50% of windows benefit from attachments
651
Selkowitz, first principles
Primary Source: Huang, J. Computer Simulation Analysis of the Energy Impact of
Window Films In Existing Houses
Selkowitz, S. Personal communication
BTP Tool: Savings only for single pain radiation
Appendix B: Tables 12-16 used to generate estimate of
population average
Simplified to SHGF and used vs. existing baseline
Improving SHGF from 0.74 to 0.30 on windows incurring the
greatest load
652
Selkowitz, first principles
Primary Source: Huang, J. Computer Simulation Analysis of the Energy Impact of
Window Films In Existing Houses
Selkowitx, S. Personal communication
BTP Tool: Savings only for single pain radiation
Appendix B: Tables 12-16 used to generate estimate of
population average
Simplified to SHGF and used vs. existing baseline
Improving SHGF from 0.74 to 0.30 on windows incurring the
greatest load
816 Program
Cost calculations: $8/ 1 sqft of window * sqft of window/sqft of
floor (0.36) * sqft of floor/ fluorescent lamp (1/0.024). Window
to floor ratio: 0.4 * 0.9(space filled by glass) = 0.36; 0.024
lamps/sqft (LMC 2010, NCI: 811 xcl file calc.)

R&D Roadmap For Emerging Window And Building Envelope Technologies 69
Prioritization Tool Measure
Number Source(s) used for Measure Relevant Notes
Building Envelope Technologies
381
eetd.lbl.gov/EA/Reports/40673/, roofcalc.com (broken); Energy Efficiency (2010)
3:53–109; fseer.com/DuroLastFacts.aspx; NEW SOURCE: coolrooftoolkit.org/wp-
content/uploads/2012/07/CEC-Non-Res-Cool-Roof-Cost-summary.pdf
Primary Source: Konopacki, S., Akbari, H., Pomerantz, M., Gabersek, S. & Gartland, L.
Cooling Energy Savings of Light-Colored Roofs for Residential and Commercial
Buildings in 11 U.S. Metropolitan Areas. 117 (1997).
BTP Tool: See added sheet at end
Appendix B: Supporting calculations in tool
391
Savings and cost is based on RS Mean 2010 data. Other documents: DOE's BTP's Air
Sealing Report 2010. Cost: pg. 18 (leaky house - max cost)
apps1.eere.energy.gov/buildings/publications/pdfs/building_america/ba_airsealing
_report.pdf. NREL measure database. Savings:
energystar.gov/index.cfm?c=home_sealing.hm_improvement_methodology
BTP Tool: DQ 0: Experts agree 50% savings is most reflective of
typical benefit and cost
427
NREL 46100 building research
Primary Source: Elaine Hale, Matthew Leach, Adam Hirsch, and Paul Torcellini,
"General Merchandise 50% Energy Savings Technical Support Document"; NREL/TP-
550-46100 September 2009
BTP Tool: Peer Review Note: There are some possible ways to
drive cost to $3.40/SF.
Appendix B: The air barrier is assumed to reduce the envelope
infiltration from 0.038 to 0.015 ACH… The cost of the air barrier
is estimated at $1.40/ft2 of exterior wall area.
MTG2: A few market barriers present.
590
Building Science, research report 0903, LaFrance
Primary Source: Straube, J. and Smegal, J.; Building America Special Research
Project: High-R Walls Case Study Analysis; Building Science Corporation 2009
(updated 2011)
Appendix B: Costs calculated from manufacturer quotes;
savings calculated from first principles
591
Building Science, research report 0903, LaFrance
Primary Source: Straube, J. and Smegal, J.; Building America Special Research
Project: High-R Walls Case Study Analysis; Building Science Corporation 2009
(updated 2011)
Appendix B: Costs calculated from manufacturer quotes;
savings calculated from first principles
592 Building Science, research report 0903, LaFrance and LBNL "Overview of US Building
Stock", http://eetd.lbl.gov/ie/pdf/LBNL-43640.pdf No notes
657 Jan Kośny, Nitin Shukla, and Ali Fallahi
BTP Tool: Savings is weighted average of walls and infiltration
Appendix B: Costs calculated from manufacturer quotes;
savings calculated from first principles
658
Building Science, research report 0903, LaFrance
Primary Source: Straube, J. and Smegal, J.; Building America Special Research
Project: High-R Walls Case Study Analysis; Building Science Corporation 2009
(updated 2011)
No notes
659
Building Science, research report 0903, LaFrance
Primary Source: Straube, J. and Smegal, J.; Building America Special Research
Project: High-R Walls Case Study Analysis; Building Science Corporation 2009
(updated 2011)
BTP Tool: Savings is weighted average of walls and infiltration
Appendix B: Costs calculated from manufacturer quotes;
savings calculated from first principles
660
Building Science, research report 0903, LaFrance
Primary Source: Straube, J. and Smegal, J.; Building America Special Research
Project: High-R Walls Case Study Analysis; Building Science Corporation 2009
(updated 2011)
No notes
661
Kanasas: buildersguide.pdf; slab insulation technology factsheet.pdf
Primary Source: "A Builder’s Guide to Residential Foundation Insulation" King, J.;
Meyer, G
Other Supporting Sources: FEMP Technology Fact Sheet: Slab Insulation", Southface
Energy Institute, Oak Ridge National Laboratory
Appendix B: Supporting calculations in tool take savings
calculated from Kansas climate zones then scaled nationally
667 Cost and Performance Data: Kosny, Jan. et al. Cold Climate Building Enclosure
Solutions. 2013. Figure 3 & Table 1, nrel.gov/docs/fy13osti/55875.pdf
Target R value of 35; punctured VIP area would be reduced to
R22
668 Cost and Performance Data: Kosny, Jan. et al. Cold Climate Building Enclosure
Solutions. 2013. Figure 3 & Table 1, nrel.gov/docs/fy13osti/55875.pdf Cost from Table 1 of nrel.gov/docs/fy13osti/55875.pdf
741
50% Grocery Store TSD (nrel.gov/docs/fy09osti/46101.pdf), 50% Large Office TSD
(nrel.gov/docs/fy10osti/49213.pdf), 50% Medium Box Retail
(nrel.gov/docs/fy08osti/42828.pdf)
Primary Source: Leech, M. et. al.; "Grocery Store 50% Energy Savings Technical
Support Document", National Renewable Energy Laboratory (2009)
Leech, M. et. al.; "Technical Support Document: Strategies for 50% Energy Savings in
Large Office Buildings", National Renewable Energy Laboratory (2010)
Hale E. et. al.; "Technical Support Document: Development of the Advanced Energy
Design Guide for Medium Box Retail—50% Energy Savings", National Renewable
Energy Laboratory (2008)
BTP Tool: Based on upgrade from R-15 to R-30 c.i., cost is
average of all 3 TSDs
Appendix B: Costs and performance drawn from upgrading
ASHRAE code roof insulation to most cost effective point from
indicated source
R-15 to R-30 upgrade, $0.88/sqft average cost

R&D Roadmap For Emerging Window And Building Envelope Technologies 70
746 AERG for K-12 Schools (unpublished)
Primary Source: NREL. 2011. Advanced Energy Retrofit Guide for K-12 Schools
(Draft). EERE Report DOE/GO-102011-3467. Project Lead: Robert Hendron
BTP Tool: Assumes roof replacement is needed. Not close to
cost-effective if roof is relatively new. Cost based on removing
old roof assembly and replacing insulation with 6-in EPS (R-24).
Appendix B: $108,2915 total cost, $59,858 incremental cost for
replacing insulating sheathing with R-24 for 210,800 ft2 school
in Chicago,
Assumes roof is being replaced anyway. Energy savings based
on increasing R-14 to R-24 EPS.
808 Cost and Performance Data: Kosny, Jan. et al. Cold Climate Building Enclosure
Solutions. 2013. Figure 3 & Table 1, nrel.gov/docs/fy13osti/55875.pdf
Cost from Table 1 of nrel.gov/docs/fy13osti/55875.pdf ; RS
means for cost of existing insulation (including installation).
Costs for residential and commercial applications are assumed
to be the same. (Data saved in supplemental documentation.)
834
Bohac, D. et al. (2013). Leakage Reductions for Large Building Air Sealing and HVAC
System Pressure Effects. Minneapolis, MN: Center for Energy and Environment.
Accessed July 17, 2013: mncee.org/getattachment/3fb02fdf-6654-4276-b1a2-
1294574f482a/
Emmerich, Steve; Persily, Andrew. (2013). “Analysis of the NIST Commercial and
Institutional Building Envelope Leakage Database.” Accessed November 7, 2013:
nist.gov/customcf/get_pdf.cfm?pub_id=913709
As in the Bohac et al paper, this analysis uses a 1.38 CFM75/ft2
stock average. A cost of $0.5/ft2 of floor space is assumed
rather than the average cost in the Bohac et al paper
($0.17/ft2), which is considered to be limited to "cold climates."
In addition, the cost of the ~10% air tightness improvement in
the Bohac paper is expected to be less than the cost of a much
more substantial reduction in air leakage to the target of 0.25
CFM75/ft2.
856
NREL measure database;
eia.gov/consumption/residential/data/2009/xls/HC10.9%20Average%20Square%20
Footage%20of%20U.S.%20Homes.xlsx
Primary Source: Savings: first principles (i.e. ,50% target)
Cost: NREL retrofit measure database for this performance level
BTP Tool: The average New US homes are 2400 sqft
(census.gov/const/C25Ann/sftotalmedavgsqft.pdf); but the
average stock is 1971 sqft (Table HC10.9 Average Square
Footage of U.S. Homes, By Housing Characteristics, 2009 you
can find at
eia.gov/consumption/residential/data/2009/xls/HC10.9%20Ave
rage%20Square%20Footage%20of%20U.S.%20Homes.xlsx).

R&D Roadmap For Emerging Window And Building Envelope Technologies 71
APPENDIX D: REFERENCES “ANSI/ASHRAE/IESNA Standard 90.1-2010.” (2010). American Society of Heating, Refrigerating, and
Air-Conditioning Engineers, Accessed June 13, 2013:
ashrae.org/resources--publications/bookstore/standard-90-1.
“ASHRAE Climate Zones Map.” (2013). Green Zone. Accessed June 13, 2013:
greenzone.com/general.php?section_url=12.
“ASTM C1363 – 11.” (2013). ASTM International. Accessed May 21, 2013:
astm.org/Standards/C1363.htm.
Bohac, D. et al. (2013). Leakage Reductions for Large Building Air Sealing and HVAC System Pressure
Effects. Minneapolis, MN: Center for Energy and Environment. Accessed July 17, 2013:
mncee.org/getattachment/3fb02fdf-6654-4276-b1a2-1294574f482a/.
“Checklist.” Consumers Checkbook. (2013). Accessed July 13, 2013:
checkbook.org/interactive/window/other/w/article.cfm.
Chun-Chao, Chen et al. (2012). “Visibly Transparent Polymer Solar Cells Produced by Solution
Processing.” ACS Nano (6:8). yylab.seas.ucla.edu/papers/nn3029327.pdf.
Emmerich, Steve; McDowell, Tim; Anis, Wagdy. (2005). “Investigation of the Impact of Commercial
Building Envelope Airtightness on HVAC Energy Use.” Accessed December 11, 2013:
fire.nist.gov/bfrlpubs/build05/PDF/b05007.pdf
Emmerich, Steve; Persily, Andrew. (2011). “U.S. Commercial Building Airtightness Requirements and
Measurements.” Accessed December 4, 2013: nist.gov/customcf/get_pdf.cfm?pub_id=909521
Emmerich, Steve; Persily, Andrew. (2013). “Analysis of the NIST Commercial and Institutional Building
Envelope Leakage Database.” Accessed November 7, 2013:
nist.gov/customcf/get_pdf.cfm?pub_id=913709
Environmental Energy Technology Division. (November 2012). “Heliotrope Technologies Speeds to
Victory as the 2012 NOVA Innovation Competition Winner.” Lawrence Berkley National Laboratory.
Accessed July 12, 2013: eetd.lbl.gov/news/article/30465/heliotrope-technologies-speeds-to-victory-as-
the-2012-nova-innovation-competition.
Energy Information Administration. (2010). Annual Energy Outlook 2010. Washington, DC: Energy
Information Administration. eia.gov/oiaf/archive/aeo10/pdf/0383(2010).pdf.
Energy Information Agency. (2013a). 2009 Residential Energy Consumption Survey, Table HC9.3.
Washington, DC: Energy Information Agency.
eia.gov/consumption/residential/data/2009/xls/HC9.3%20Household%20Demographics%20by%20Year
%20of%20Construction.xls.

R&D Roadmap For Emerging Window And Building Envelope Technologies 72
Energy Information Agency. (2013b). Annual Energy Outlook 2013, Table A4. Washington, DC: Energy
Information Agency. eia.gov/forecasts/aeo/er/pdf/tbla5.pdf.
Energy Information Agency. (2013c). Annual Energy Outlook 2013, Table A5. Washington, DC: Energy
Information Agency. eia.gov/forecasts/aeo/er/pdf/tbla4.pdf.
Energy Information Agency. (2013d). Monthly Energy Review September 2013, Table 2.1. Washington,
DC: Energy Information Agency. eia.gov/totalenergy/data/monthly/archive/00351309.pdf.
Farese, Philip. (August 2012a). “Technology: How to Build a Low-Energy Future.” Nature (488); pp.
275–277. nature.com/nature/journal/v488/n7411/full/488275a.html.
Farese, Philip; Gelman, Rachel; Hendron, Robert. (August 2012b). A Tool to Prioritize Energy Efficiency
Investments. Washington, DC: National Renewable Energy Laboratory. nrel.gov/docs/fy12osti/54799.pdf.
Goldsberry, Clare. (31 January 2013). “Polymer Building Materials Make Gains Despite Builder
Reluctance to Adopt New Technology.” Plastics Today. Accessed June 13, 2013:
plasticstoday.com/blogs/polymer-building-materials-make-gains-despite-builder-reluctance-adopt-new-
technology.
He, Ximin et al. (12 July 2012). “Synthetic Homeostatic Materials with Chemo-Mechano-Chemical Self-
Regulation.” Nature. (487); pp. 214–218. aizenberglab.seas.harvard.edu/papers/He.Nature2012.pdf.
International Energy Agency, (2013). Technology Roadmap Energy efficient building envelopes, Paris:
International Energy Agency.
iea.org/publications/freepublications/publication/TechnologyRoadmapEnergyEfficientBuildingEnvelopes.pdf
“ITN Energy Systems Low-Cost Electrochromic Film on Plastic for Net-Zero Energy Building.” (2013).
ARPAE-E. Accessed July 12, 2013: arpa-e.energy.gov/?q=arpa-e-projects/electrochromic-film-more-
efficient-windows.
Jorgensen, Mikkel et al. (July 2008). “Stability/Degradation of Polymer Solar Cells.” Solar Energy
Materials and Solar Cells (92:7).
web.mit.edu/3.042/team1_10/NanoSol/References_files/PPCefficiency.pdf.
Kosny, Jan; Fallahi, Ali; Shukla, Nitin. (January 2013). Cold Climate Building Enclosure Solutions.
Washington, DC: U.S. Department of Energy.
cse.fraunhofer.org/Portals/55819/docs/ba_cold_climate_enclosure_solutions.pdf.
LaMonica, Martin. (28 March 2013). “How to Create Thermal Images for Millions of Homes.” MIT
Technology Review. Accessed June 25, 2013: technologyreview.com/view/512611/how-to-create-
thermal-images-for-millions-of-homes/.
National Residential Efficiency Measures Database. (2013) “Retrofit Measures for Air Leakage.”
National Renewable Energy Laboratory. Accessed July 17, 2013:
nrel.gov/ap/retrofits/measures.cfm?gId=10&ctId=376&scId=6157&acId=6160.
R&D Roadmap For Emerging Window And Building Envelope Technologies 73
“North American Fenestration Standard (NAFS).” (2012), American Architectural Manufacturers
Association. Accessed August 4, 2013. aamanet.org/general/1/461/nafs-overview.
Office of Energy Efficiency and Renewable Energy. (2011a). “Table 1.4.1 – Carbon Dioxide Emissions
for U.S. Buildings, by Year (Million Metric Tons).” Building Energy Data Book. Washington, DC: U.S.
Department of Energy. buildingsdatabook.eren.doe.gov/TableView.aspx?table=1.4.1.
Office of Energy Efficiency and Renewable Energy. (2011b). “Table 2.1.5 - 2010 Residential Energy
End-Use Splits, by Fuel Type (Quadrillion Btu).” Building Energy Data Book. Washington, DC: U.S.
Department of Energy. buildingsdatabook.eren.doe.gov/TableView.aspx?table=2.1.5.
Office of Energy Efficiency and Renewable Energy. (2011c). “Table 2.1.8 - 2035 Residential Energy
End-Use Splits, by Fuel Type (Quadrillion Btu).” Building Energy Data Book. Washington, DC: U.S.
Department of Energy. buildingsdatabook.eren.doe.gov/TableView.aspx?table=2.1.8.
Office of Energy Efficiency and Renewable Energy. (2011d). “2.1.15 - Aggregate Residential Building
Component Loads as of 1998”. Building Energy Data Book. Washington, DC: U.S. Department of
Energy. buildingsdatabook.eren.doe.gov/TableView.aspx?table=2.1.15.
Office of Energy Efficiency and Renewable Energy. (2011e). “Table 3.1.4 - 2010 Commercial Energy
End-Use Splits, by Fuel Type (Quadrillion Btu).” Building Energy Data Book. Washington, DC: U.S.
Department of Energy. buildingsdatabook.eren.doe.gov/TableView.aspx?table=3.1.4.
Office of Energy Efficiency and Renewable Energy. (2011f). “Table 3.1.7 - 2035 Commercial Energy
End-Use Splits, by Fuel Type (Quadrillion Btu).” Building Energy Data Book. Washington, DC: U.S.
Department of Energy. buildingsdatabook.eren.doe.gov/TableView.aspx?table=3.1.7.
Office of Energy Efficiency and Renewable Energy. (2011g). “Table 3.1.12 - Aggregate Commercial
Building Component Loads as of 1998.” Building Energy Data Book. Washington, DC: U.S. Department
of Energy. buildingsdatabook.eren.doe.gov/TableView.aspx?table=3.1.12.
Office of Energy Efficiency and Renewable Energy. (2011h). “Table 3.2.1 - Total Commercial
Floorspace and Number of Buildings, by Year.” Building Energy Data Book. Washington, DC: U.S.
Department of Energy. buildingsdatabook.eren.doe.gov/docs/xls_pdf/3.2.1.pdf.
Office of Energy Efficiency and Renewable Energy. (2012). “Table 2.6 - 2010 Transportation Energy Use
by Mode, 2009-2010 (trillion Btu),” Transportation Energy Data Book: Edition 31. Washington, DC:
U.S. Department of Energy cta.ornl.gov/data/tedb31/Spreadsheets/Table2_06.xls.
Office of the Vice President. (May 20, 2011). “Vice President Biden Visits National Renewable Energy
Laboratory, Announces First Agreement Under ‘America’s Next Top Energy Innovator’ Challenge.” The
White House. Accessed July 12, 2013: whitehouse.gov/the-press-office/2011/05/20/vice-president-biden-
visits-national-renewable-energy-laboratory-announc.
“Remarks by the President in the State of the Union Address.” (12 February 2013). The White House.
Accessed August 5, 2013: whitehouse.gov/the-press-office/2013/02/12/remarks-president-state-union-
address.

R&D Roadmap For Emerging Window And Building Envelope Technologies 74
Romm, Joseph J. (1996). “Testimony for the Hearing of the Subcommittee on Energy and Environment,
Committee on Science, U.S. House of Representatives.” U.S. Energy Outlook and Implications for
Energy Research and Development. 104th Congress. (March 14, 1996).
ia700502.us.archive.org/16/items/usenergyoutlooki00unit/usenergyoutlooki00unit.pdf.
“Roof.” (2013). Green 3D Home. Accessed May 21, 2013: green3dhome.com/yourhouse/roof.aspx.
Seaverson, Eric J. (August 2008). “Building Envelope: Sealing Leaks and Stopping Thermal Bridging.”
Facilities Net. Accessed June 13, 2013: facilitiesnet.com/energyefficiency/article/Building-Envelope-
Sealing-Leaks-and-Stopping-Thermal-Bridging--9429#.
Selkowitz, Stephen; Lee, Eleanor. (2013). “Integrating Automated Shading and Smart Glazings with
Daylight Controls, International Symposium on Daylighting Buildings.” Presented at the International
Symposium on Daylighting Buildings. Accessed August 2, 2013:
windows.lbl.gov/comm_perf/Electrochromic/refs/attachmt17.3_ieat31.pdf.
“TC 4.4 Building Materials and Building Envelope Performance.” (2013). ASHRAE. Accessed May 21,
2013: ashrae.org/standards-research--technology/technical-committees/section-4-0-load-calculations-and-
energy-requirements/tc-4-4-building-materials-and-building-envelope-performance.
U.S. Army Corps of Engineers ERDC (11 May 2012). “U.S. Army Corps of Engineers Air Leakage Test
Protocol for Envelope Buildings Version 3,” Accessed July 17 2013:
wbdg.org/pdfs/usace_airleakagetestprotocol.pdf
Woloszyn, Monika and Rode, Carsten. (2008). Tools for Performance Simulation of Heat, Air and
Moisture Conditions of Whole Buildings. DOI 10.1007/s12273-008-8106-z. Beijing: Tsinghua Press and
Springer-Verlag. stanford.edu/group/narratives/classes/08-
09/CEE215/ReferenceLibrary/BIM%20and%20Building%20Simulation%20Research/Tools%20for%20P
erformance%20Simulation%20of%20Heat,%20Air%20and%20Moisture.pdf.


R&D Roadmap For Emerging Window And Building Envelope Technologies 76