Embed Size (px)
Citation preview
NREL is a national laboratory of the U.S. Department of Energy, Office of Energy Efficiency & Renewable Energy, operated by the Alliance for Sustainable Energy, LLC.
Contract No. DE-AC36-08GO28308
Wind Turbine Generator System Acoustic Noise Test Report for the Gaia Wind 11-kW Wind Turbine Arlinda Huskey
Technical Report NREL/TP-5000-51828 November 2011

NOTICE
This report was prepared as an account of work sponsored by an agency of the United States government. Neither the United States government nor any agency thereof, nor any of their employees, makes any warranty, express or implied, or assumes any legal liability or responsibility for the accuracy, completeness, or usefulness of any information, apparatus, product, or process disclosed, or represents that its use would not infringe privately owned rights. Reference herein to any specific commercial product, process, or service by trade name, trademark, manufacturer, or otherwise does not necessarily constitute or imply its endorsement, recommendation, or favoring by the United States government or any agency thereof. The views and opinions of authors expressed herein do not necessarily state or reflect those of the United States government or any agency thereof.
Available electronically at http://www.osti.gov/bridge
Available for a processing fee to U.S. Department of Energy and its contractors, in paper, from:
U.S. Department of Energy Office of Scientific and Technical Information P.O. Box 62 Oak Ridge, TN 37831-0062 phone: 865.576.8401 fax: 865.576.5728 email: mailto:[email protected]
Available for sale to the public, in paper, from:
U.S. Department of Commerce National Technical Information Service 5285 Port Royal Road Springfield, VA 22161 phone: 800.553.6847 fax: 703.605.6900 email: [email protected] online ordering: http://www.ntis.gov/help/ordermethods.aspx
Cover Photos: (left to right) PIX 16416, PIX 17423, PIX 16560, PIX 17613, PIX 17436, PIX 17721
Printed on paper containing at least 50% wastepaper, including 10% post consumer waste.
Page 1 of 44
Wind Turbine Generator System
Acoustic Noise Test Report for the
Gaia Wind 11-kW Wind Turbine in
Boulder, CO
Conducted for
National Renewable Energy Laboratory
1617 Cole Blvd. Golden, CO 80401
Conducted by
Wind Energy Program
DOE / NREL
Arlinda Huskey
March 31, 2011
Notice
This report was prepared by the National Renewable Energy Laboratory (NREL), operated for the United States Department of Energy (DOE) by the Alliance for Sustainable Energy, LLC (Alliance), as an account of work sponsored by the United States government. The test results documented in this report define the characteristics of the test article as configured and under the conditions tested .. THIS REPORT IS PROVIDED "AS IS" AND NEITHER THE GOVERNMENT, ALLIANCE, NREL NOR ANY OF THEIR EMPLOYEES, MAKES ANY WARRANTY, EXPRESS OR IMPLIED, INCLUDING THEW ARRANTIES OF MERCHANTABILITY AND FITNESS FOR A PARTICULAR PURPOSE, OR ASSUMES ANY LEGAL LIABILITY OR RESPONSIBILITY FOR THE ACCURACY, COMPLETENESS, OR USEFULNESS OF ANY SUCH INFORMATION DISCLOSED IN THE REPORT, OR OF ANY APPARATUS, PRODUCT, OR PROCESS DISCLOSED, OR REPRESENTS THAT ITS USE WOULD NOT INFRINGE PRIVATELY OWNED RIGHTS. Neither Alliance nor the U.S. Government shall be liable for special, consequential or incidental damages. Reference herein to any specific conunercial product, process, or service by trade name, trademark, manufacturer, or otherwise does not necessarily constitute or imply its endorsement, recommendation, or favoring by the United States government or any agency thereof. The views and opinions of the authors expressed herein do not necessarily state or reflect those of the United States government or any agency thereof or Alliance. NREL is a DOE Laboratory, and as an adjunct of the United States government, cannot certify wind turbines. The information in this report is limited to NREL's knowledge and understanding as of this date. NREL is accredited by the American Association for Laboratory Accreditation (A2LA) and the results shown in this test report have been determined in accordance with the NREL' s terms of accreditation unless stated otherwise in the report. This report shall not be reproduced, except in full, without the written approval of Alliance or successor operator of NREL. "' · .. -
Approval By: Date
Review By: Jeroen van Dam, NREL Test Engineer Date
Page 2 444
Page 3 of 44
Table of Contents 1.0 Background ............................................................................................................................................. 4 2.0 Test Summary ......................................................................................................................................... 4 3.0 Test Turbine ............................................................................................................................................ 4 4.0 Test Site ................................................................................................................................................... 7 5.0 Test Equipment ....................................................................................................................................... 8
5.1 Equipment Descriptions ....................................................................................................................... 8 5.2 Instrumentation Locations .................................................................................................................. 10
6.0 Results ................................................................................................................................................... 10 6.1 Test Conditions .................................................................................................................................. 10 6.2 Apparent Sound Power Level............................................................................................................. 10 6.3 One-Third Octave Analysis ................................................................................................................ 12 6.4 Tonality .............................................................................................................................................. 15 6.5 Uncertainty ......................................................................................................................................... 16
7.0 Exceptions ............................................................................................................................................. 17 7.1 Exceptions to the Standard ................................................................................................................. 17 7.2 Exceptions to the Quality Assurance System ..................................................................................... 18
8.0 References ............................................................................................................................................. 18 Appendix A. Picture of the soundboard ................................................................................................... 19 Appendix B. Equipment Calibration Sheets ............................................................................................ 20
List of Tables Table 1. Test turbine Configuration and Operational Data ............................................................................ 6 Table 2. Structures close to test turbine .......................................................................................................... 8 Table 3. Equipment list for acoustic test ........................................................................................................ 9 Table 4. Microphone positions for turbine and background measurements ................................................. 10 Table 5. Sound power levels for integer wind speeds 6 m/s through 12 m/s ................................................ 11 Table 6. One-third octave analysis for wind speed bins 6 through 9 m/s ..................................................... 13 Table 6 (continued). One-third octave analysis for wind speed bins 10 and 11 m/s .................................... 14 Table 7. Tonality results ............................................................................................................................... 16 Table 8. Type B uncertainty components for sound power levels and tonality ............................................ 17
List of Figures
Figure 1. Gaia-Wind 11-kW test turbine at the NWTC. PIX #15705. ........................................................... 5 Figure 2. Test turbine location ........................................................................................................................ 7 Figure 3. Sound power levels as a function of the standardized wind speed ................................................ 11 Figure 4. Measured sound pressure levels as a function of the standardized wind speed. ............................ 12 Figure 5. One-third octave levels ................................................................................................................. 15 Figure 6. Picture of sound board during the test. .......................................................................................... 19
Page 4 of 44
1.0 Background This test is being conducted as part of the U.S. Department of Energy’s (DOE) Independent Testing project. This project was established to help reduce the barriers of wind energy expansion by providing independent testing results for small turbines. In total, four turbines are being tested at the National Wind Technology Center (NWTC) as a part of this project. Acoustic noise testing is one of up to five tests that may be performed on the turbines; other tests may include duration, safety and function, power performance, and power quality tests.
2.0 Test Summary The Gaia-Wind 11-kW wind turbine was installed at the National Wind Technology Center located south of Boulder, Colorado. The test turbine is a two-bladed, downwind wind turbine with a rated power of 11 kW. The test turbine was tested in accordance with the International Electrotechnical Commission standard, IEC 61400-11 Ed 2.1 2006-11 Wind Turbine Generator Systems – Part 11Acoustic Noise Measurement Techniques, hereafter referred to as the Standard. Noise and meteorological data were collected on two days, 28 February 2009 and 11 March 2010. Standardized wind speed (at 10 meters) was determined from wind speed measured at hub height (at 18.2 meters).
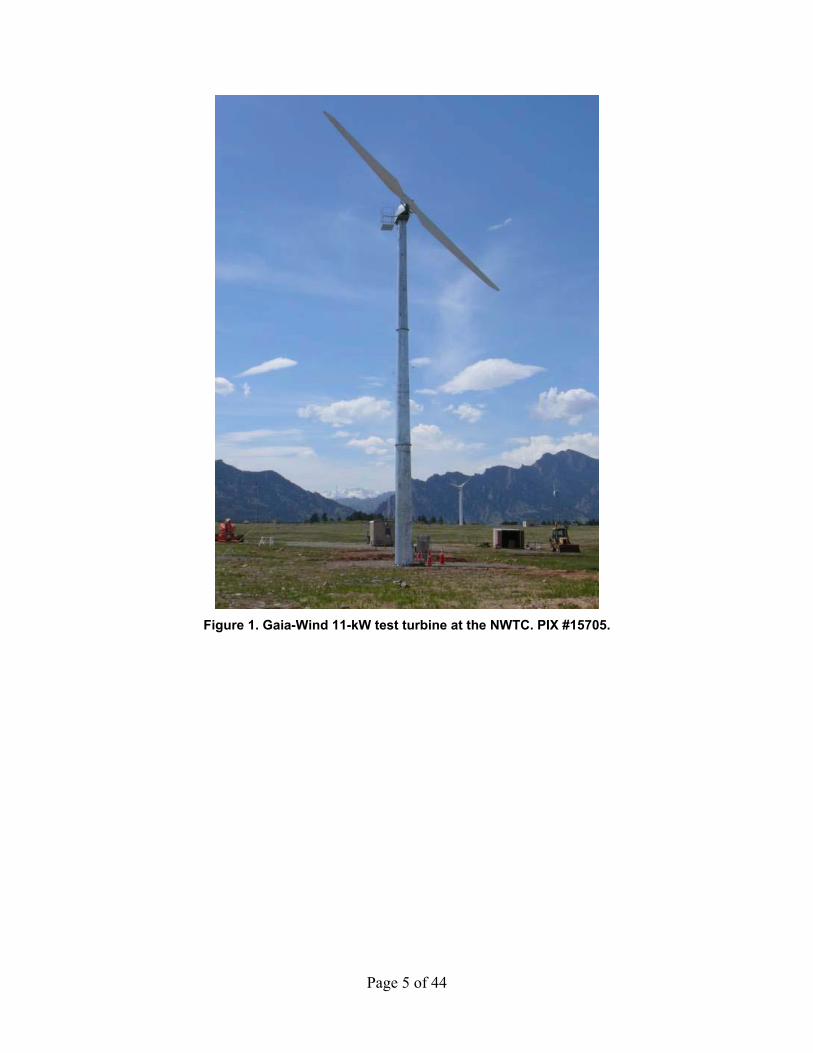
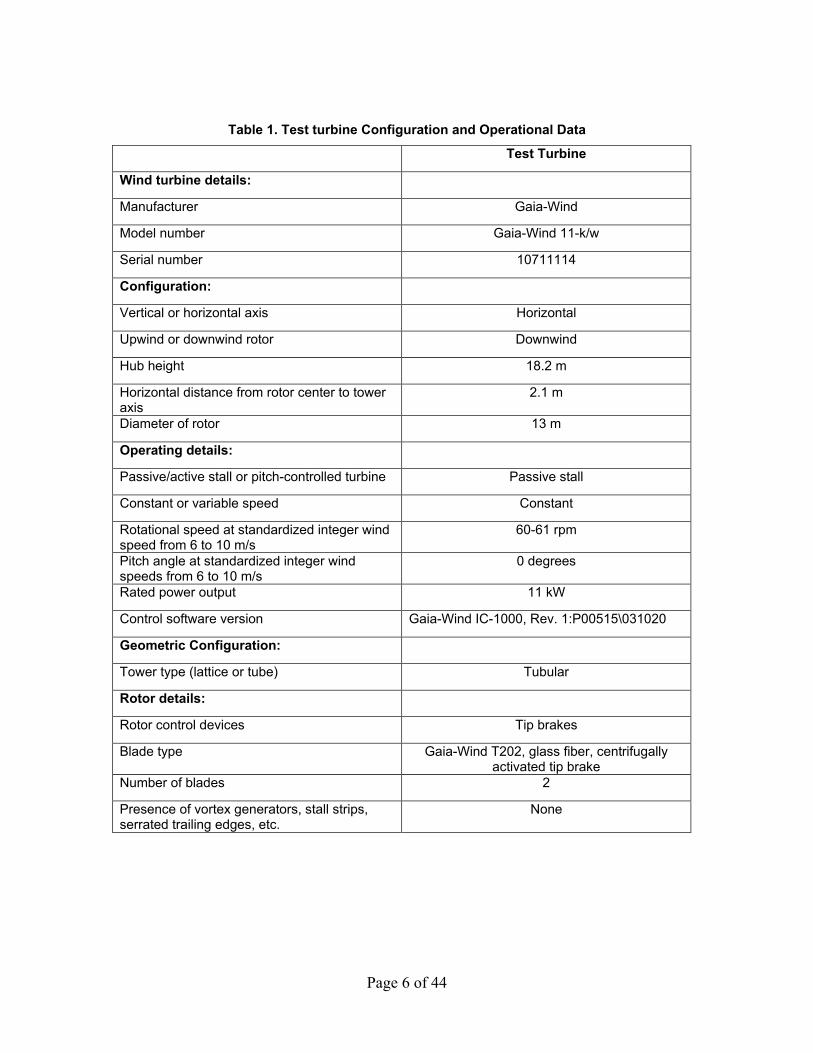
3.0 Test Turbine Figure 1 shows a picture of the test turbine and Table 1 lists the turbine configuration.
Page 5 of 44
Figure 1. Gaia-Wind 11-kW test turbine at the NWTC. PIX #15705.
Page 6 of 44
Table 1. Test turbine Configuration and Operational Data
Test Turbine
Wind turbine details:
Manufacturer Gaia-Wind
Model number Gaia-Wind 11-k/w
Serial number 10711114
Configuration:
Vertical or horizontal axis Horizontal
Upwind or downwind rotor Downwind
Hub height 18.2 m
Horizontal distance from rotor center to tower axis
2.1 m
Diameter of rotor 13 m
Operating details:
Passive/active stall or pitch-controlled turbine Passive stall
Constant or variable speed Constant
Rotational speed at standardized integer wind speed from 6 to 10 m/s
60-61 rpm
Pitch angle at standardized integer wind speeds from 6 to 10 m/s
0 degrees
Rated power output 11 kW
Control software version Gaia-Wind IC-1000, Rev. 1:P00515\031020
Geometric Configuration:
Tower type (lattice or tube) Tubular
Rotor details:
Rotor control devices Tip brakes
Blade type Gaia-Wind T202, glass fiber, centrifugally activated tip brake
Number of blades 2
Presence of vortex generators, stall strips, serrated trailing edges, etc.
None
Page 7 of 44
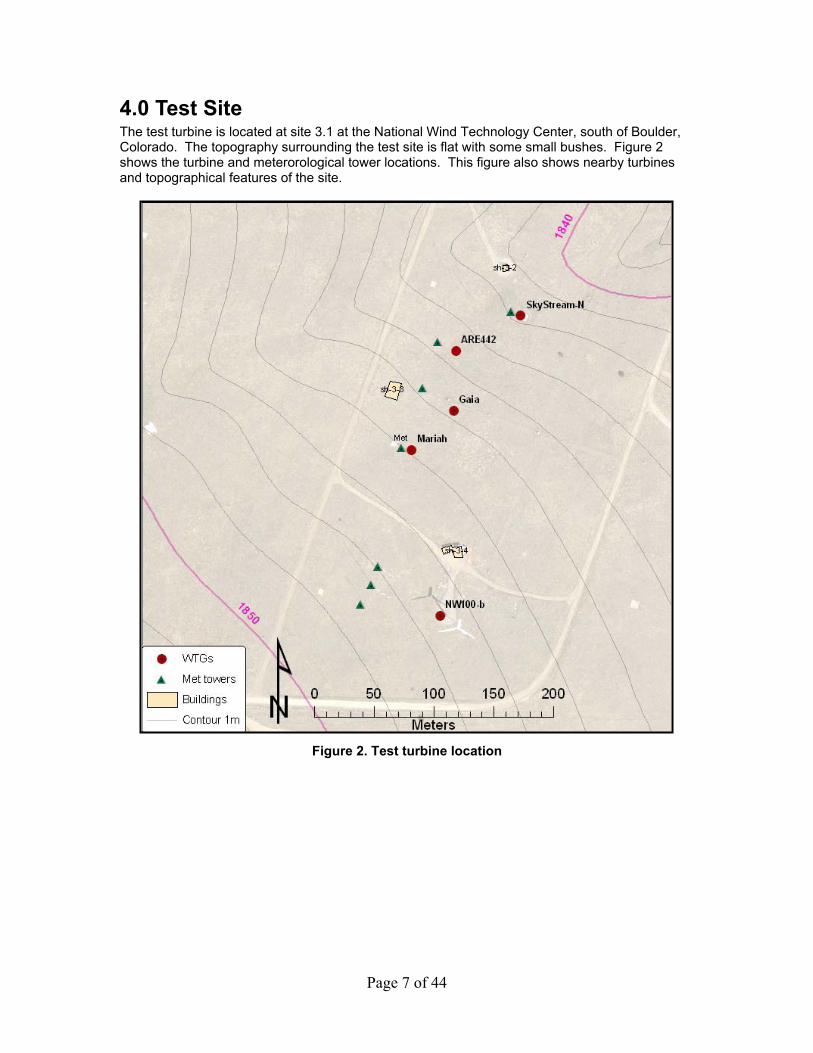
4.0 Test Site The test turbine is located at site 3.1 at the National Wind Technology Center, south of Boulder, Colorado. The topography surrounding the test site is flat with some small bushes. Figure 2 shows the turbine and meterorological tower locations. This figure also shows nearby turbines and topographical features of the site.
Figure 2. Test turbine location
Page 8 of 44
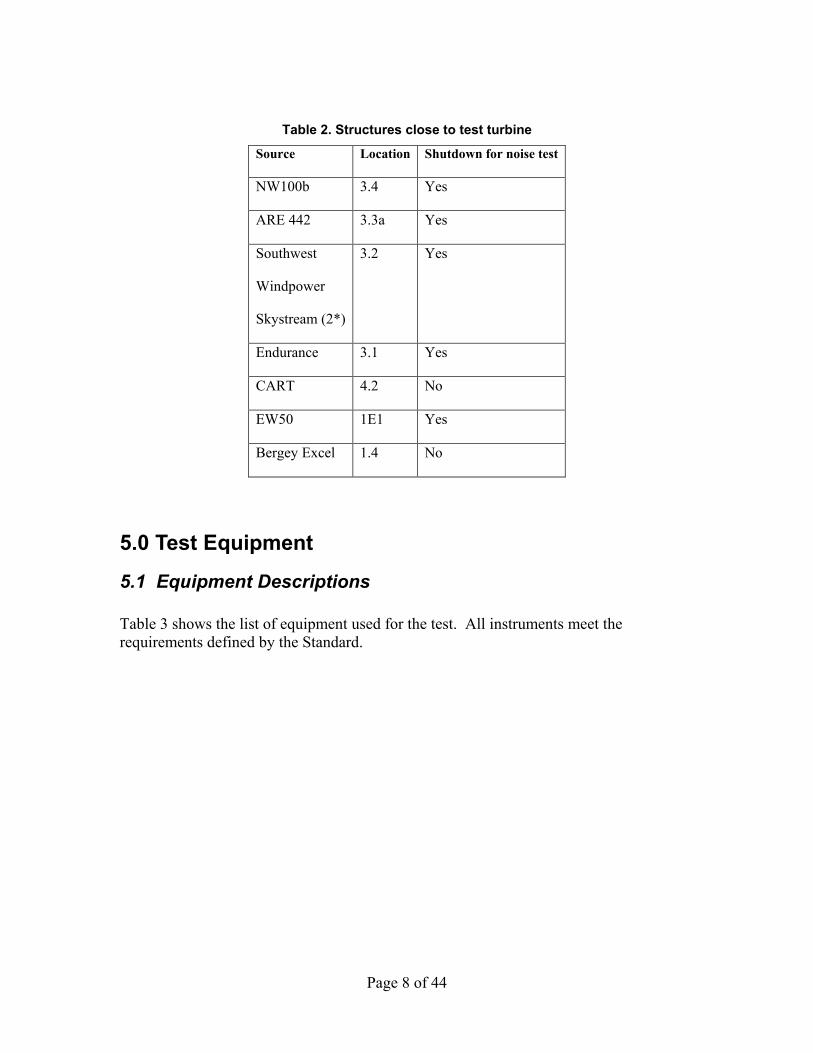
Table 2. Structures close to test turbine
Source Location Shutdown for noise test
NW100b 3.4 Yes
ARE 442 3.3a Yes
Southwest
Windpower
Skystream (2*)
3.2 Yes
Endurance 3.1 Yes
CART 4.2 No
EW50 1E1 Yes
Bergey Excel 1.4 No
5.0 Test Equipment
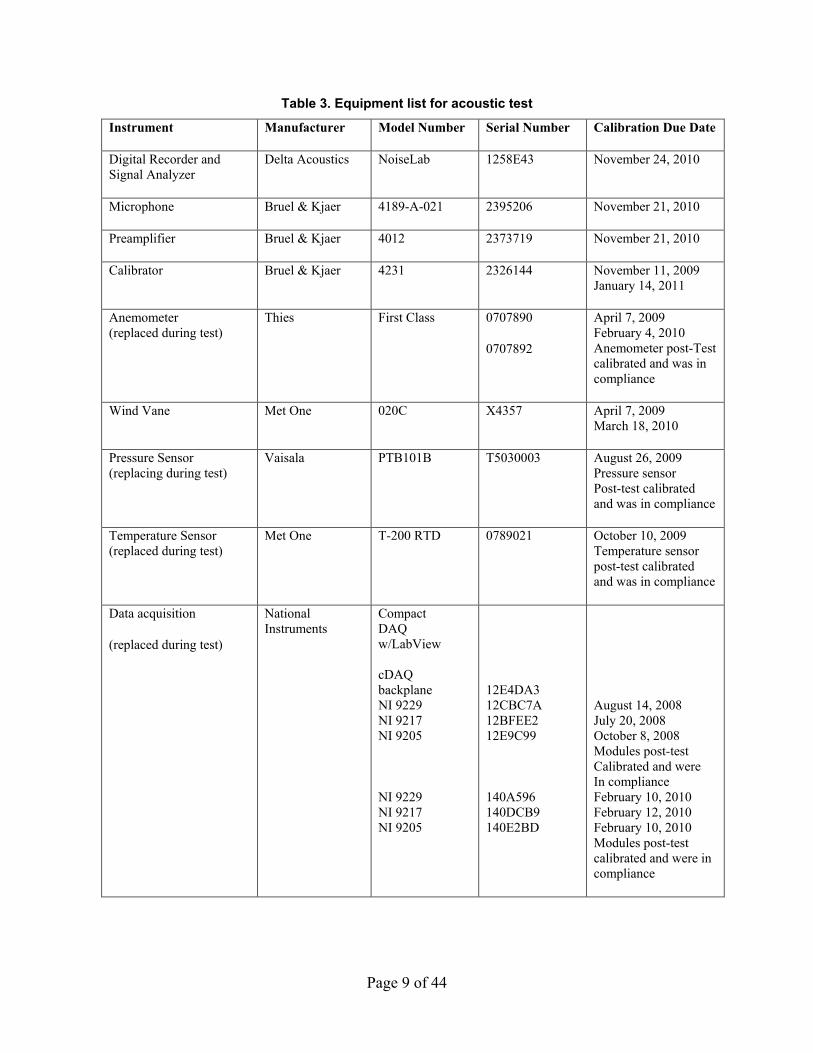
5.1 Equipment Descriptions Table 3 shows the list of equipment used for the test. All instruments meet the requirements defined by the Standard.
Page 9 of 44
Table 3. Equipment list for acoustic test
Instrument Manufacturer Model Number Serial Number Calibration Due Date
Digital Recorder and Signal Analyzer
Delta Acoustics NoiseLab 1258E43 November 24, 2010
Microphone Bruel & Kjaer 4189-A-021 2395206 November 21, 2010
Preamplifier Bruel & Kjaer 4012 2373719 November 21, 2010
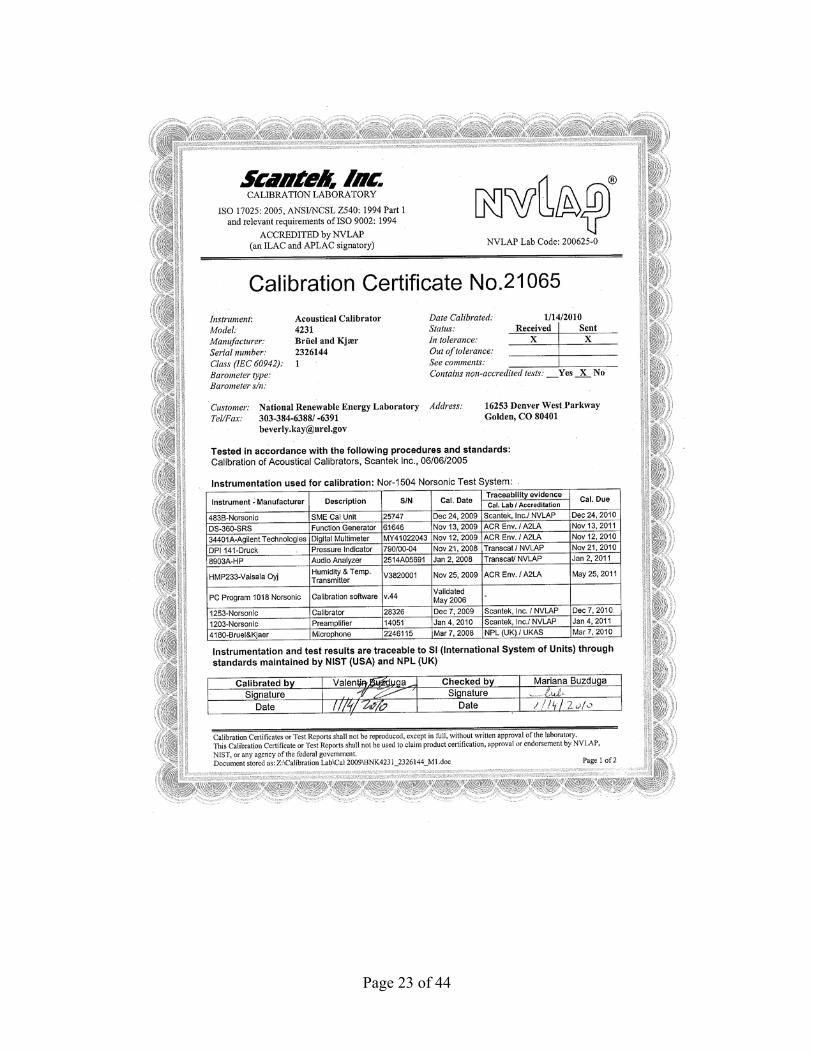
Calibrator Bruel & Kjaer 4231 2326144 November 11, 2009 January 14, 2011
Anemometer (replaced during test)
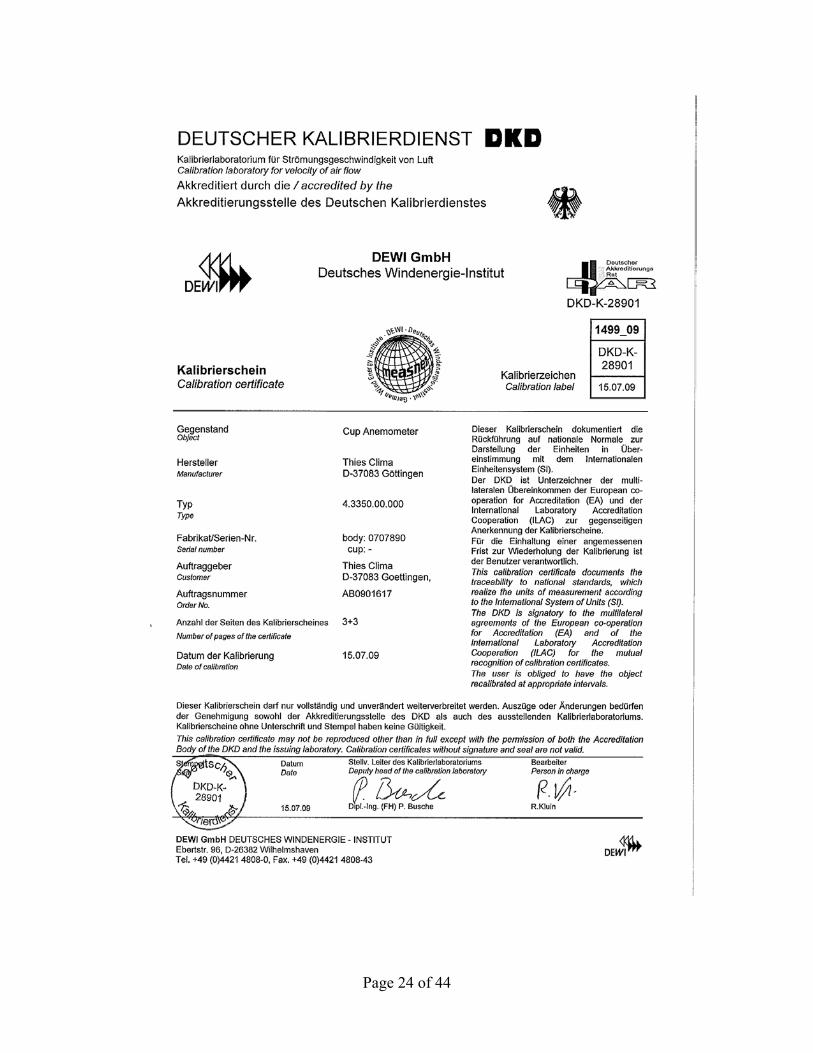
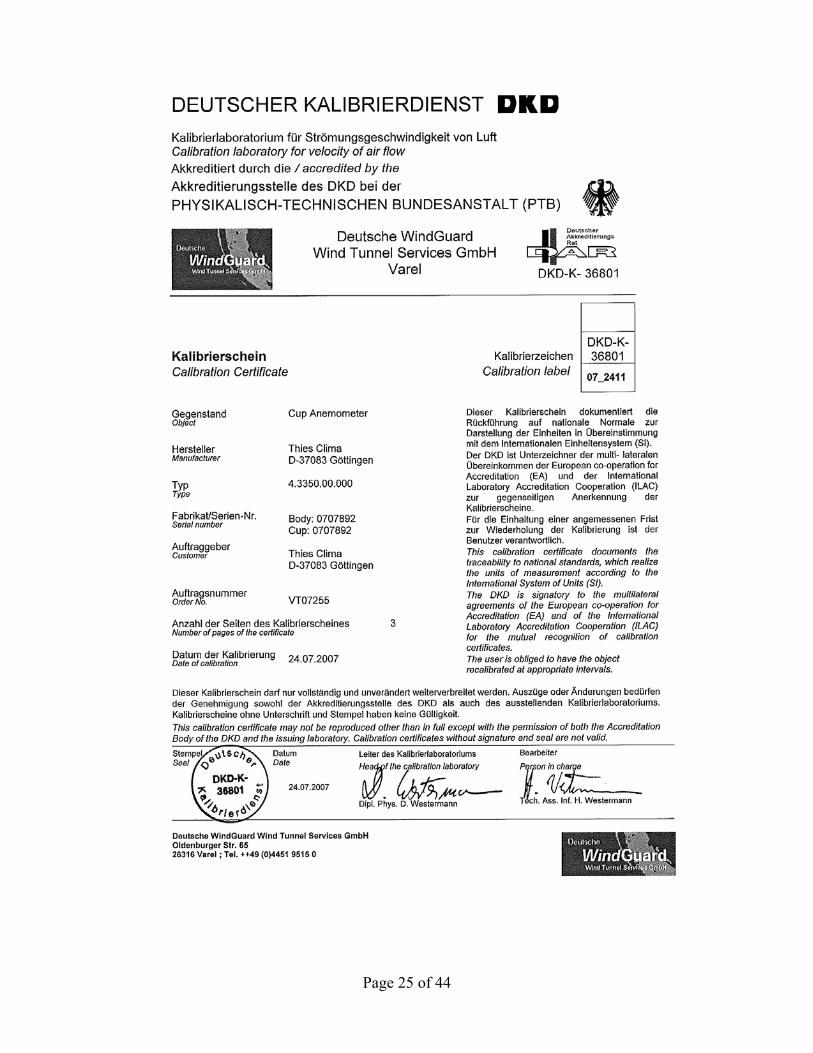
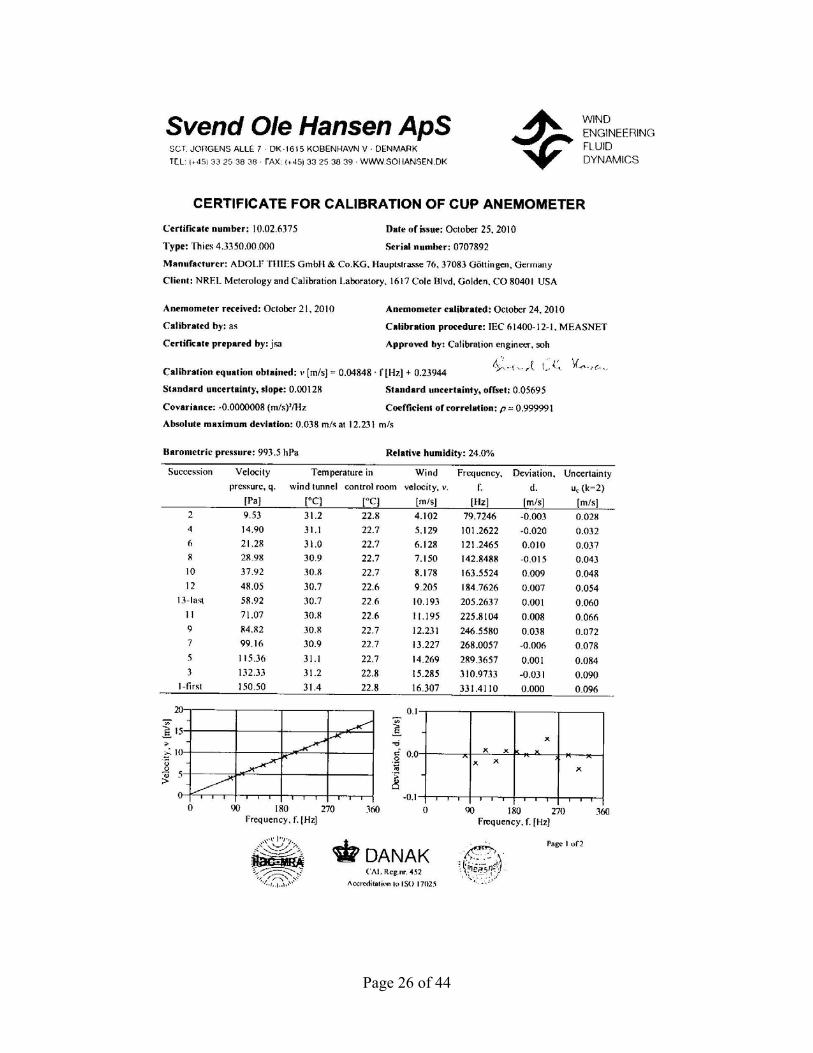
Thies First Class 0707890
0707892
April 7, 2009 February 4, 2010 Anemometer post-Test calibrated and was in compliance
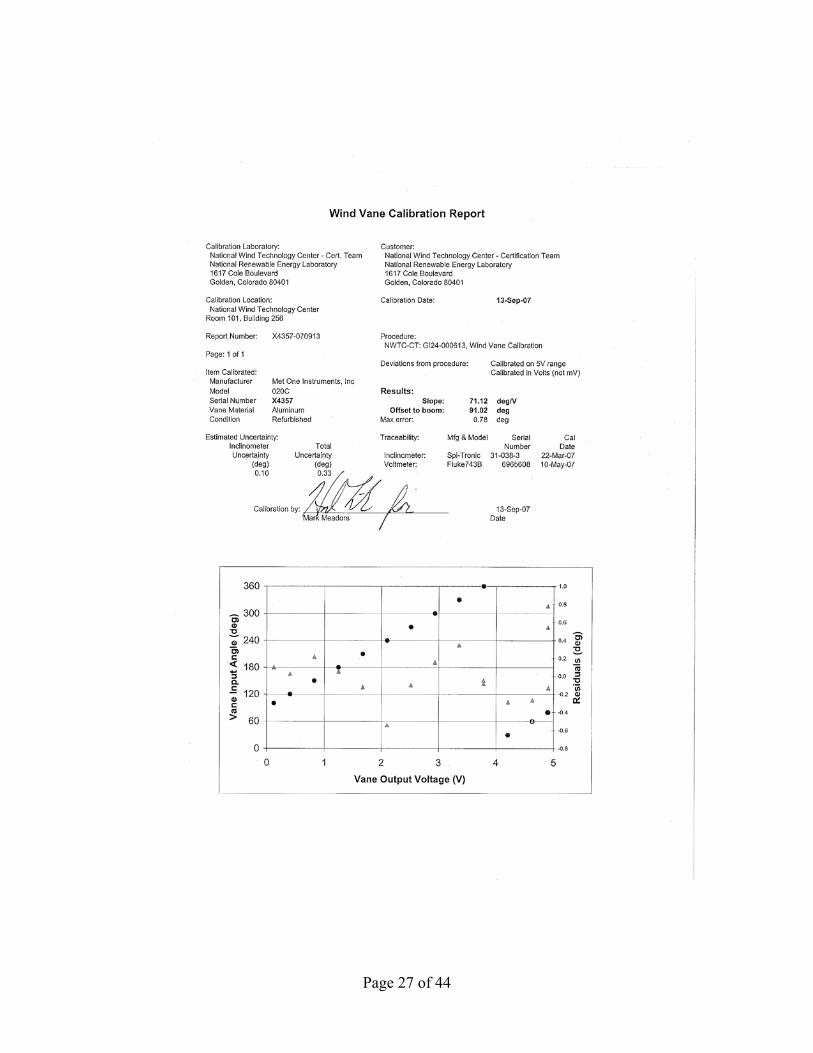
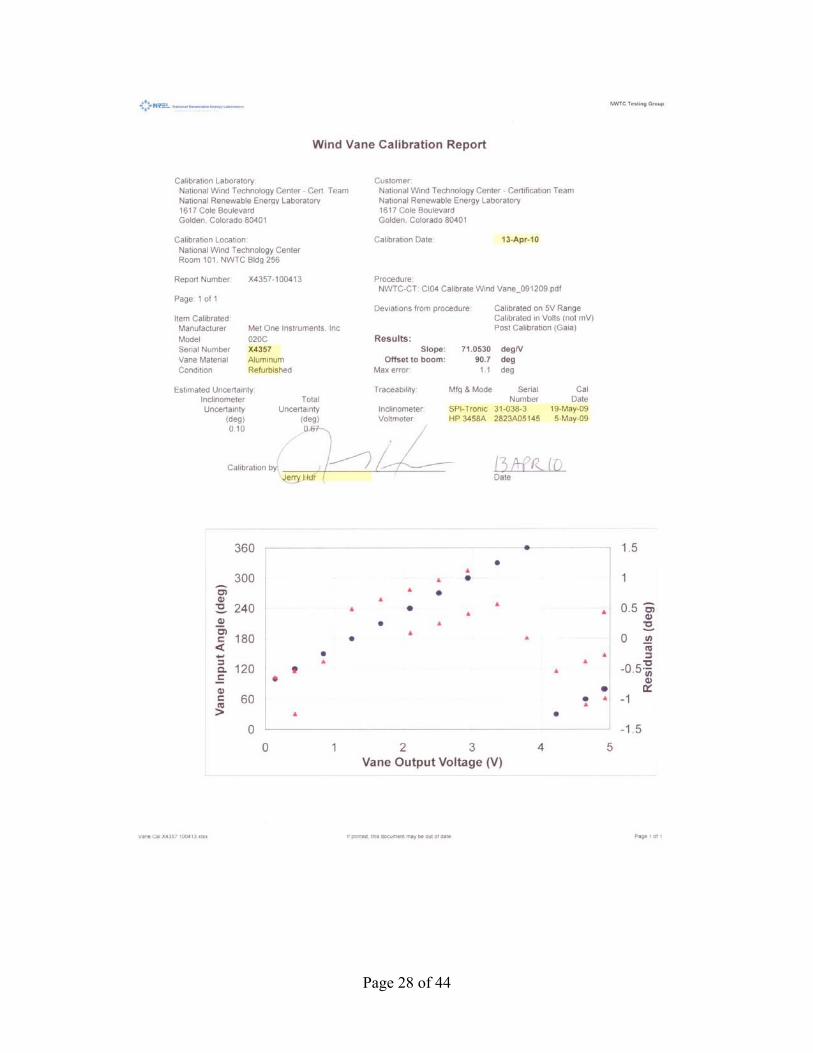
Wind Vane Met One 020C X4357 April 7, 2009 March 18, 2010
Pressure Sensor (replacing during test)
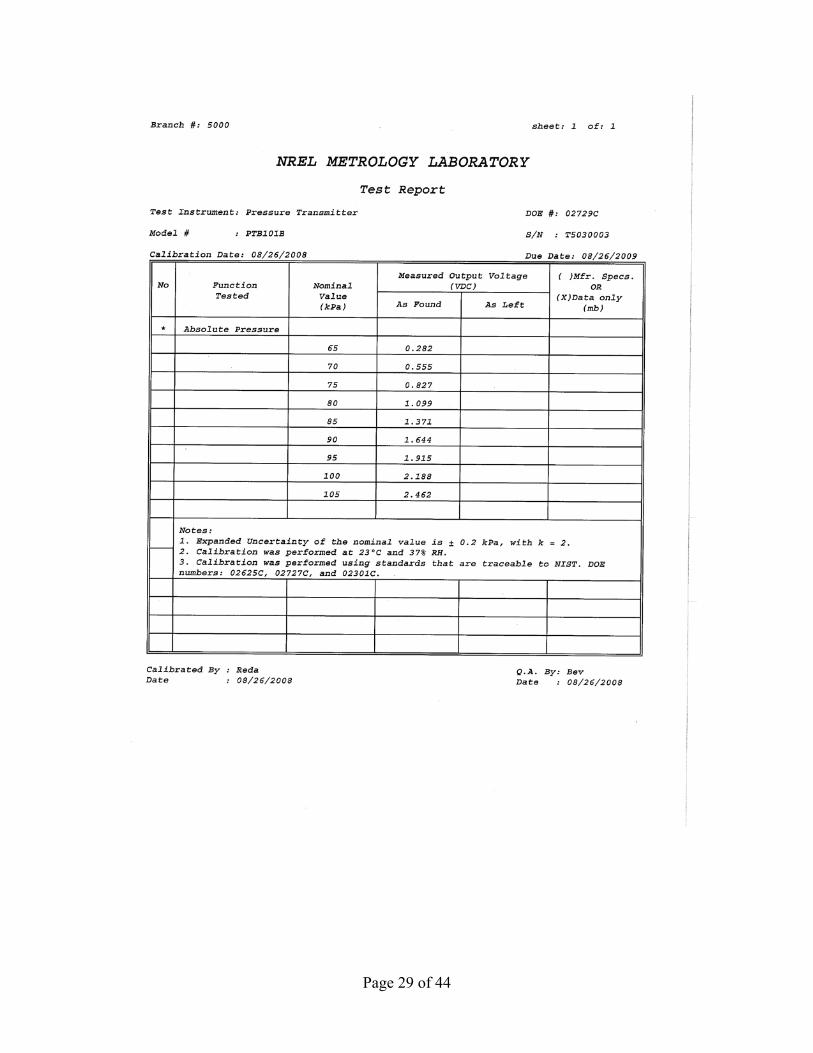
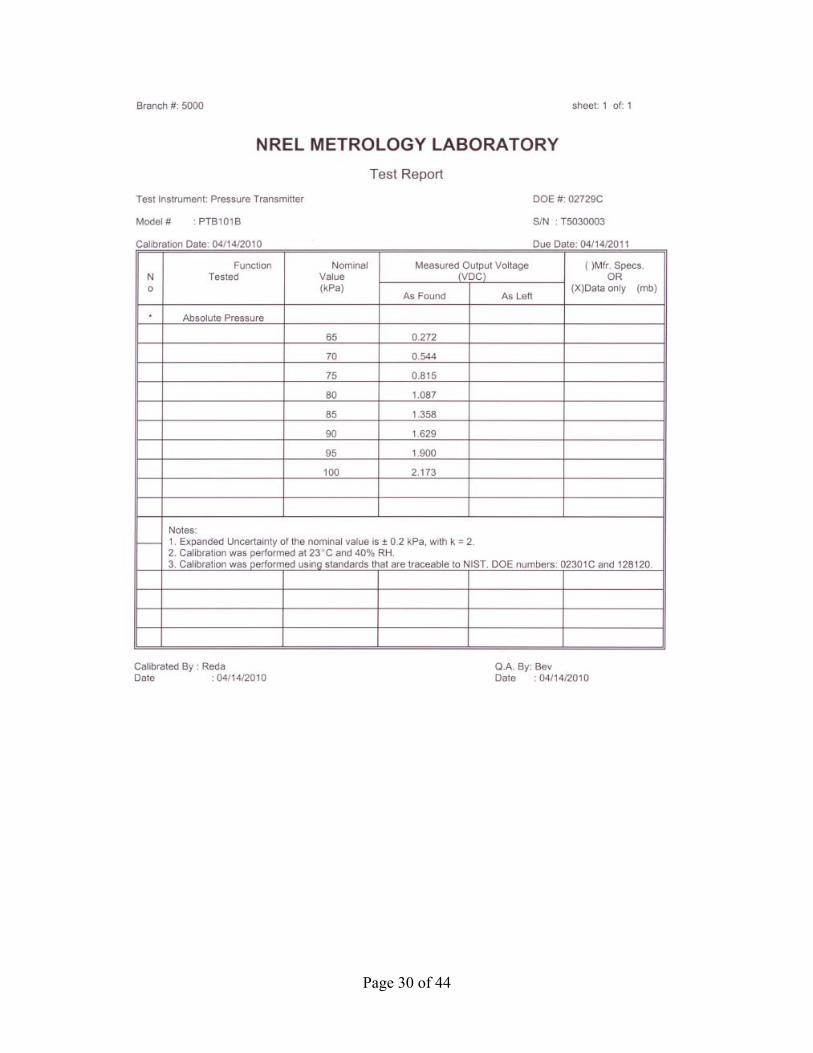
Vaisala PTB101B T5030003 August 26, 2009 Pressure sensor Post-test calibrated and was in compliance
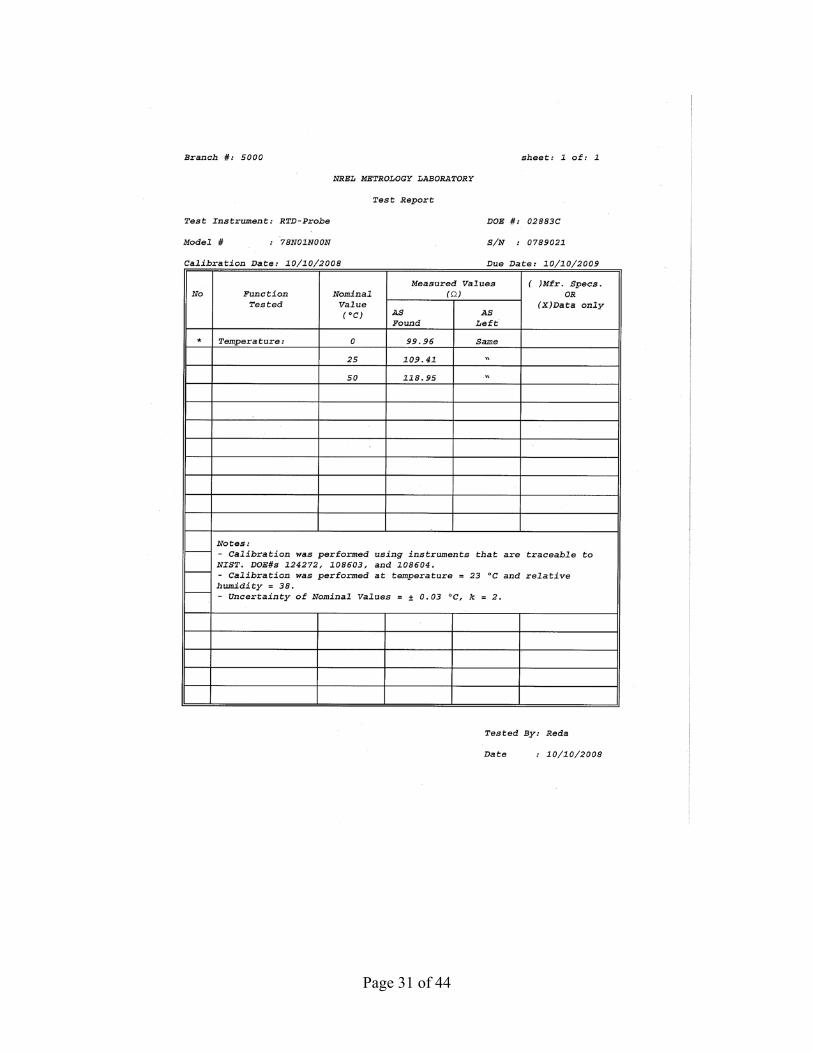
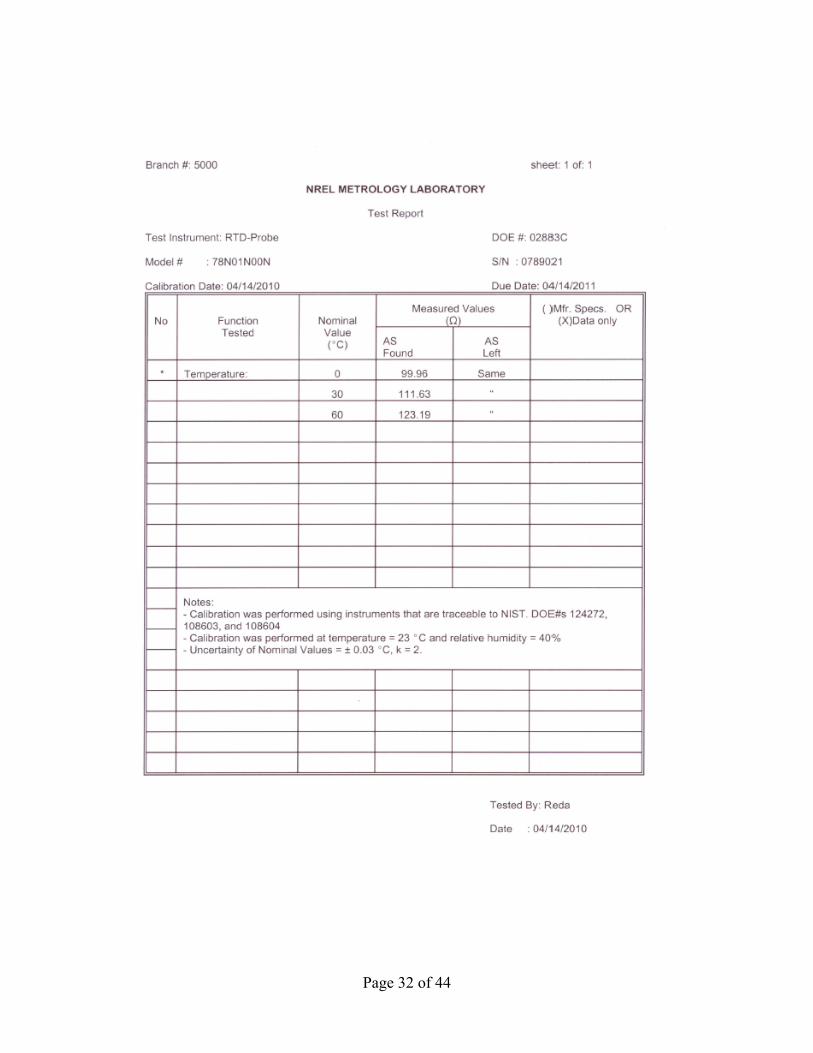
Temperature Sensor (replaced during test)
Met One T-200 RTD 0789021 October 10, 2009 Temperature sensor post-test calibrated and was in compliance
Data acquisition
(replaced during test)
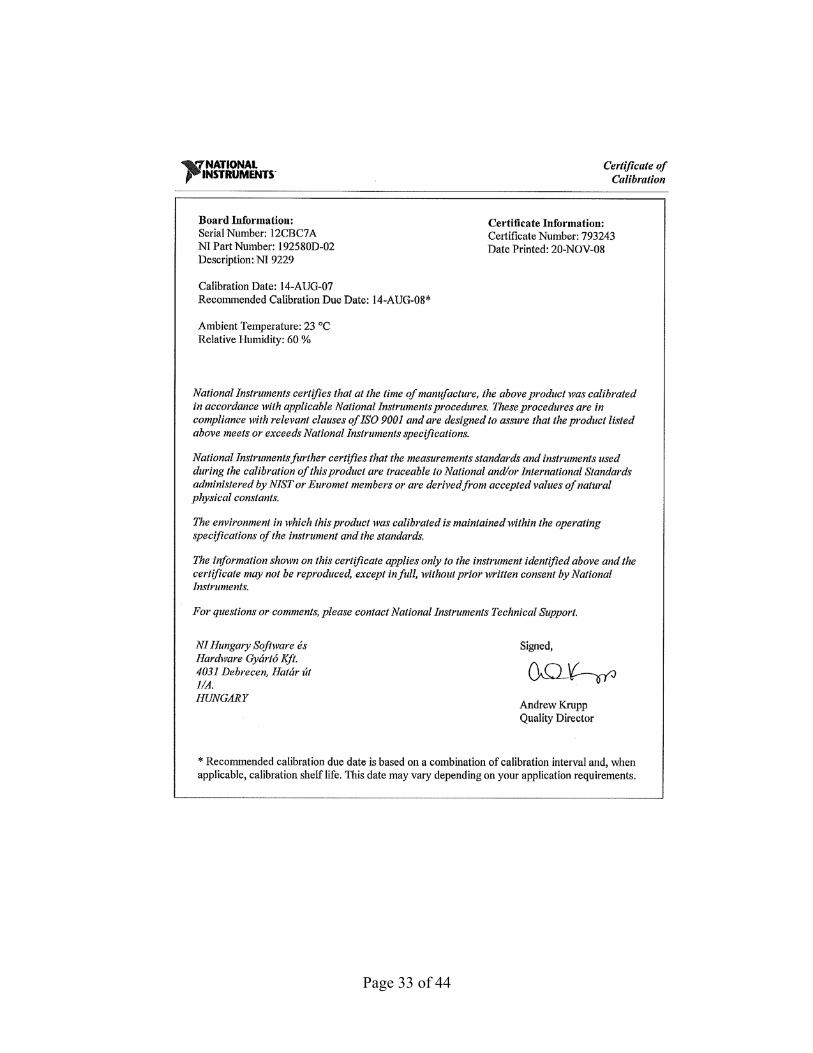
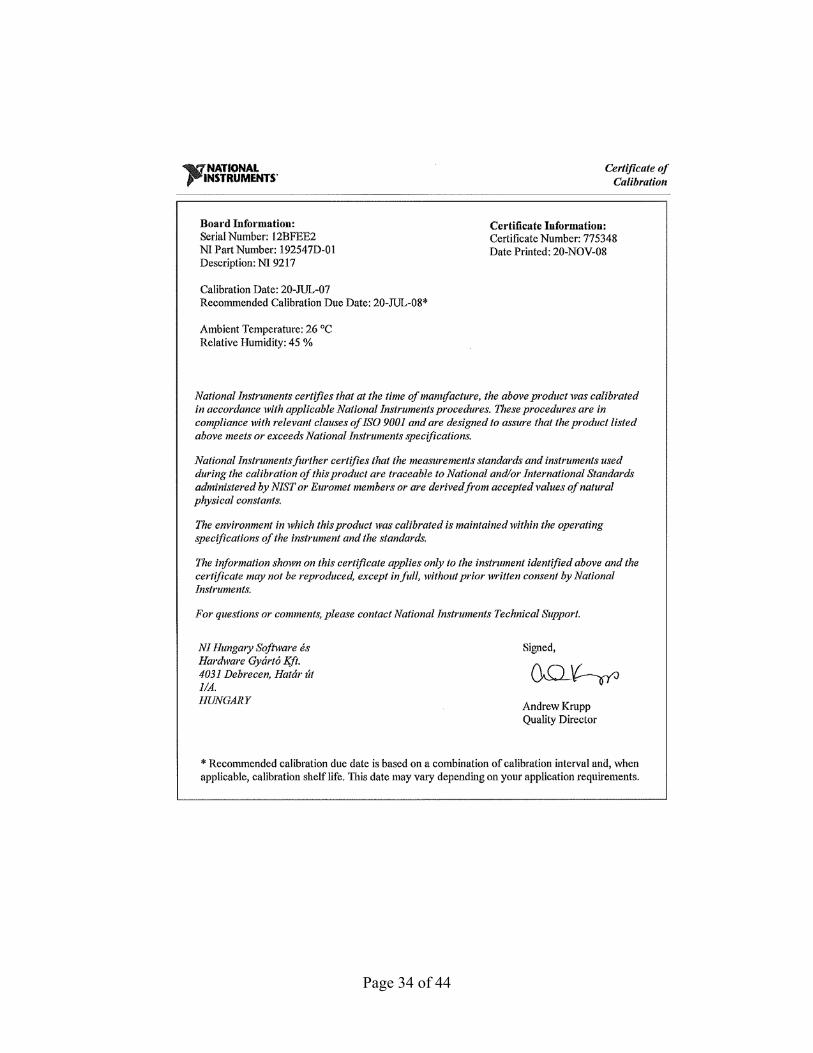
National Instruments
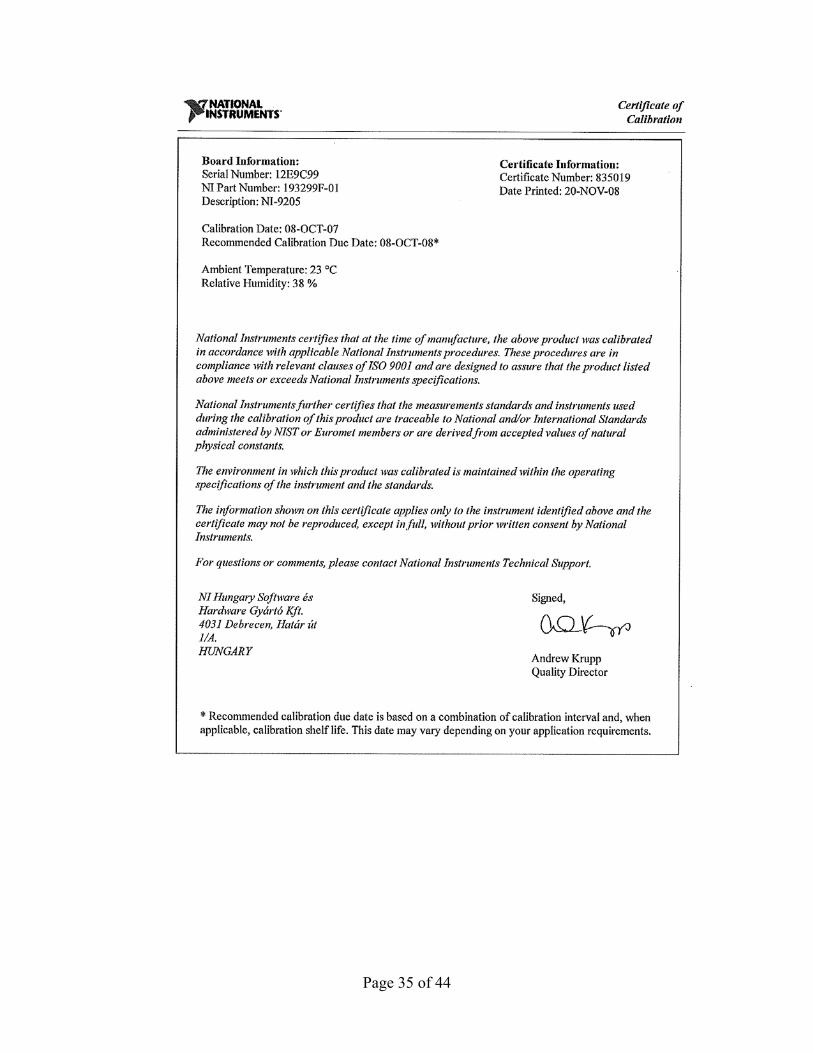
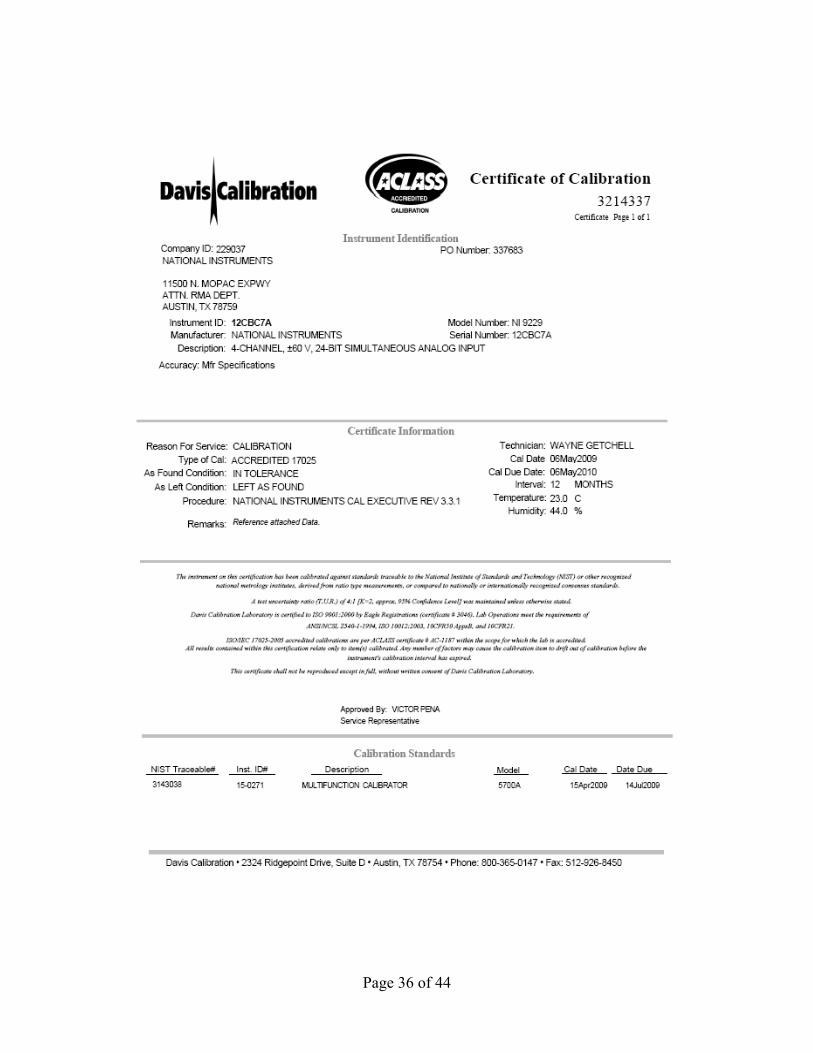
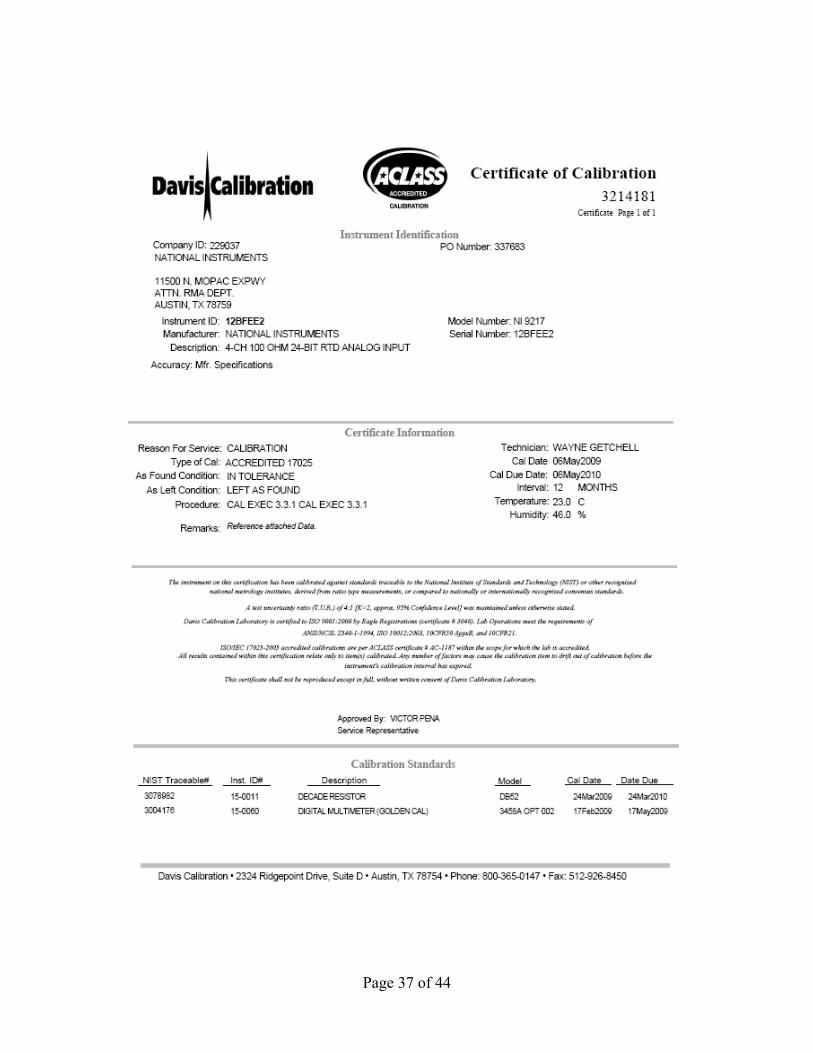
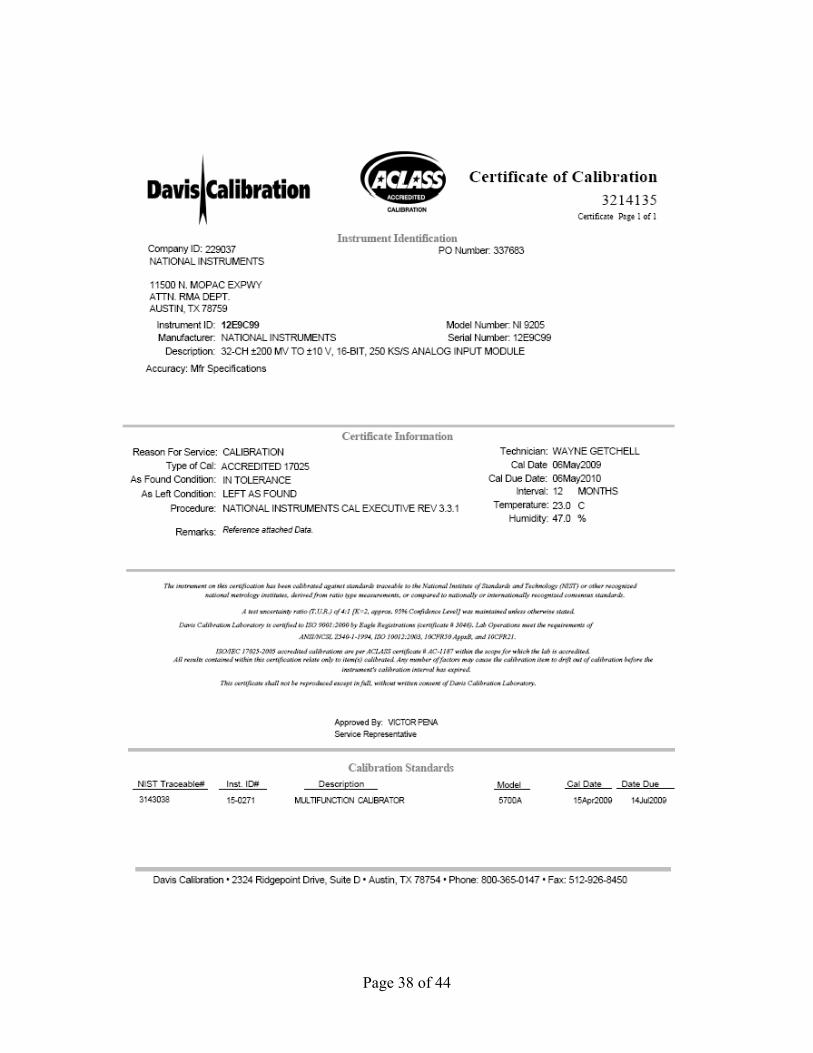
Compact DAQ w/LabView cDAQ backplane NI 9229 NI 9217 NI 9205 NI 9229 NI 9217 NI 9205
12E4DA3 12CBC7A 12BFEE2 12E9C99 140A596 140DCB9 140E2BD
August 14, 2008 July 20, 2008 October 8, 2008 Modules post-test Calibrated and were In compliance February 10, 2010 February 12, 2010 February 10, 2010 Modules post-test calibrated and were in compliance
Page 10 of 44
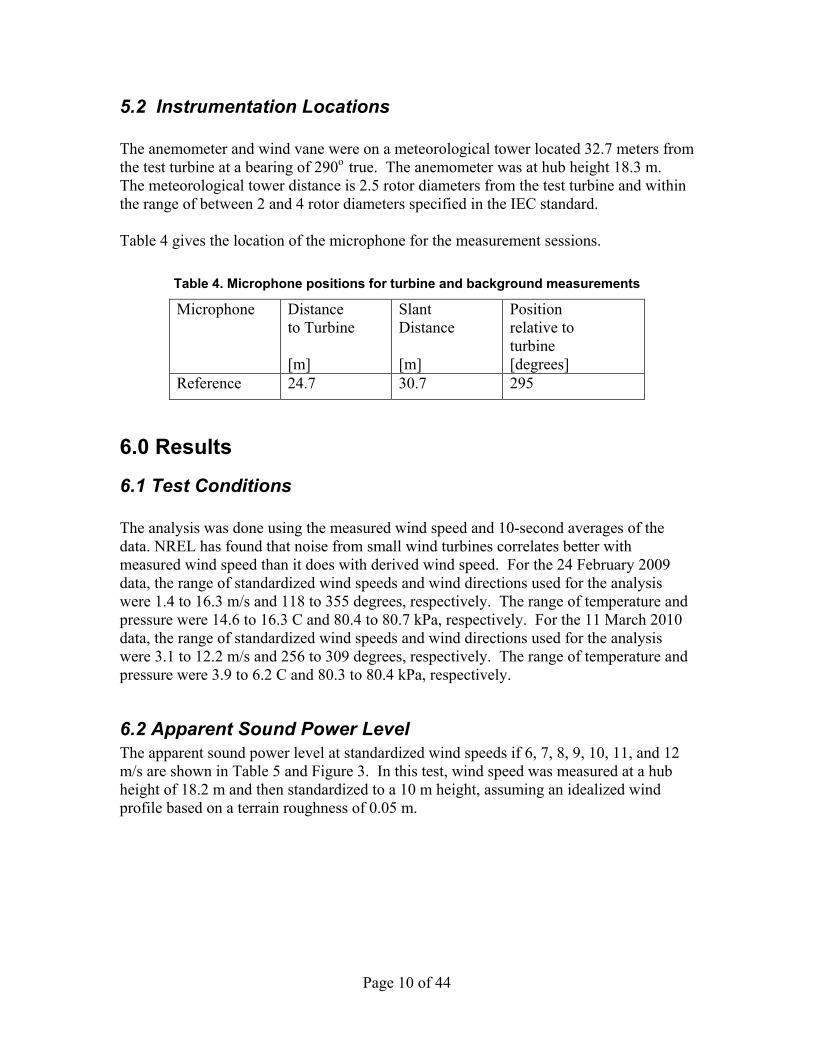
5.2 Instrumentation Locations The anemometer and wind vane were on a meteorological tower located 32.7 meters from the test turbine at a bearing of 290o true. The anemometer was at hub height 18.3 m. The meteorological tower distance is 2.5 rotor diameters from the test turbine and within the range of between 2 and 4 rotor diameters specified in the IEC standard. Table 4 gives the location of the microphone for the measurement sessions.
Table 4. Microphone positions for turbine and background measurements
Microphone Distance to Turbine [m]
Slant Distance [m]
Position relative to turbine [degrees]
Reference 24.7 30.7 295
6.0 Results
6.1 Test Conditions The analysis was done using the measured wind speed and 10-second averages of the data. NREL has found that noise from small wind turbines correlates better with measured wind speed than it does with derived wind speed. For the 24 February 2009 data, the range of standardized wind speeds and wind directions used for the analysis were 1.4 to 16.3 m/s and 118 to 355 degrees, respectively. The range of temperature and pressure were 14.6 to 16.3 C and 80.4 to 80.7 kPa, respectively. For the 11 March 2010 data, the range of standardized wind speeds and wind directions used for the analysis were 3.1 to 12.2 m/s and 256 to 309 degrees, respectively. The range of temperature and pressure were 3.9 to 6.2 C and 80.3 to 80.4 kPa, respectively.
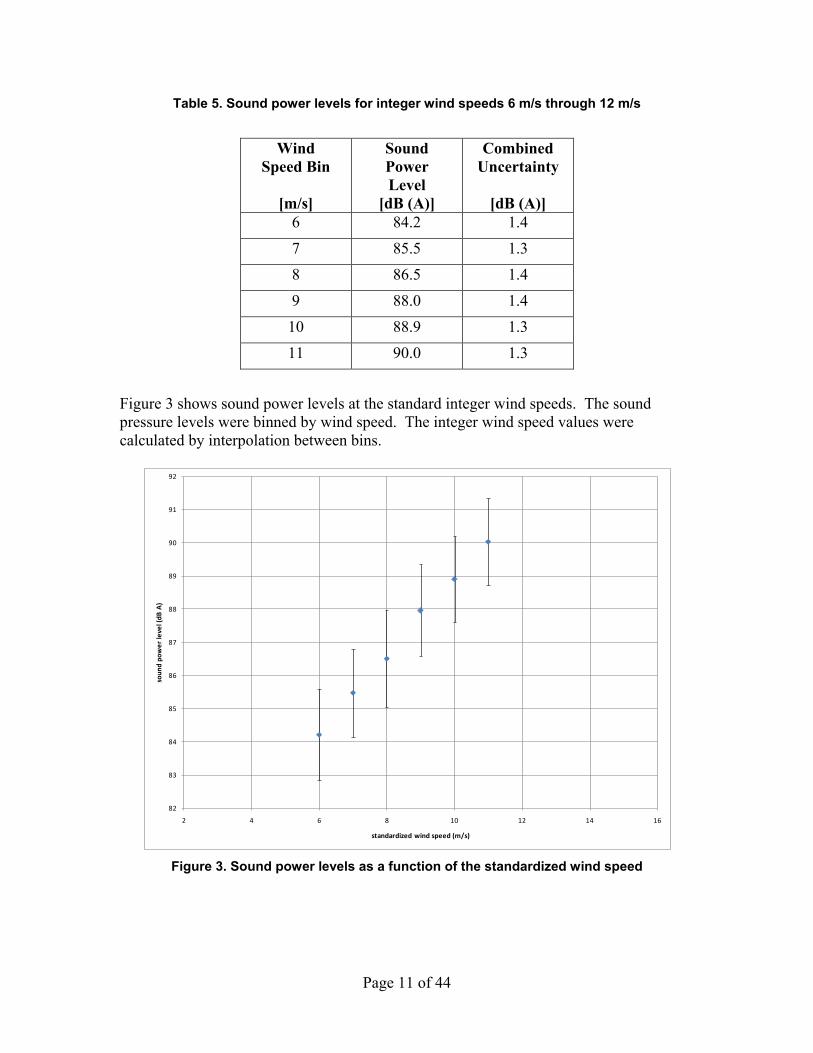
6.2 Apparent Sound Power Level The apparent sound power level at standardized wind speeds if 6, 7, 8, 9, 10, 11, and 12 m/s are shown in Table 5 and Figure 3. In this test, wind speed was measured at a hub height of 18.2 m and then standardized to a 10 m height, assuming an idealized wind profile based on a terrain roughness of 0.05 m.
Page 11 of 44
Table 5. Sound power levels for integer wind speeds 6 m/s through 12 m/s
Figure 3 shows sound power levels at the standard integer wind speeds. The sound pressure levels were binned by wind speed. The integer wind speed values were calculated by interpolation between bins.
Figure 3. Sound power levels as a function of the standardized wind speed
82
83
84
85
86
87
88
89
90
91
92
2 4 6 8 10 12 14 16
soun
d po
wer
leve
l (dB
A)
standardized wind speed (m/s)
Wind Speed Bin
[m/s]
Sound Power Level
[dB (A)]
Combined Uncertainty
[dB (A)]
6 84.2 1.4 7 85.5 1.3 8 86.5 1.4 9 88.0 1.4 10 88.9 1.3 11 90.0 1.3
Page 12 of 44
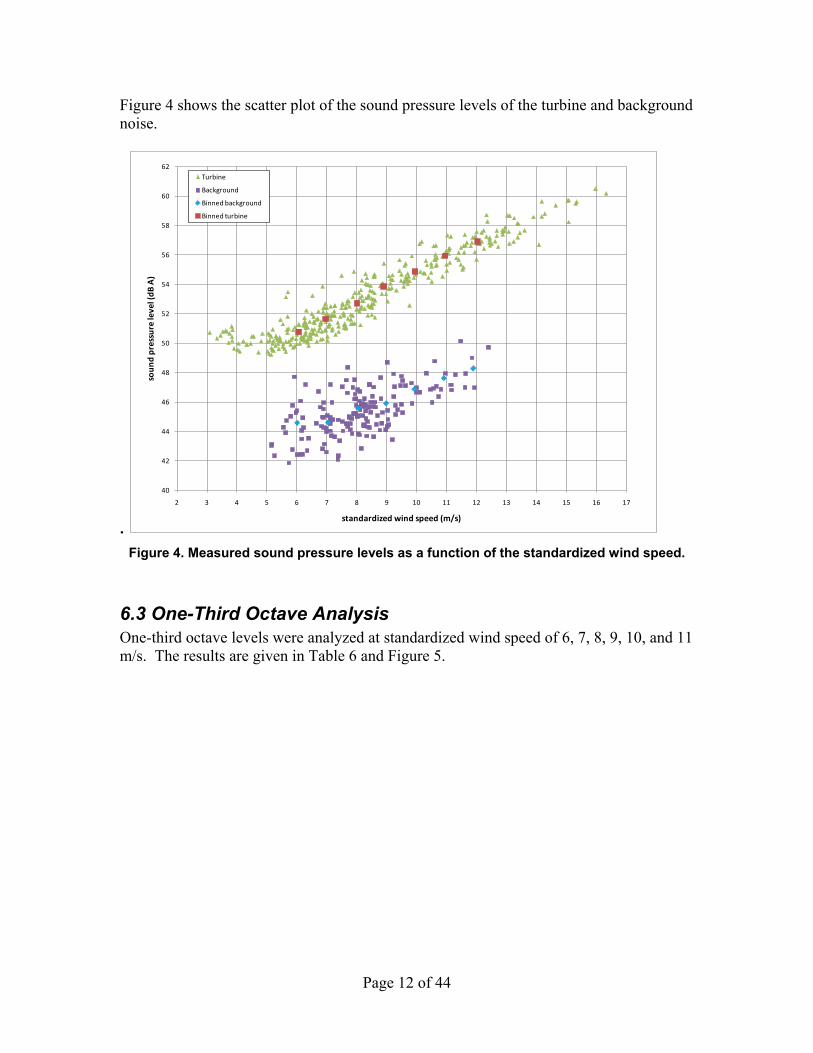
Figure 4 shows the scatter plot of the sound pressure levels of the turbine and background noise.
. Figure 4. Measured sound pressure levels as a function of the standardized wind speed.
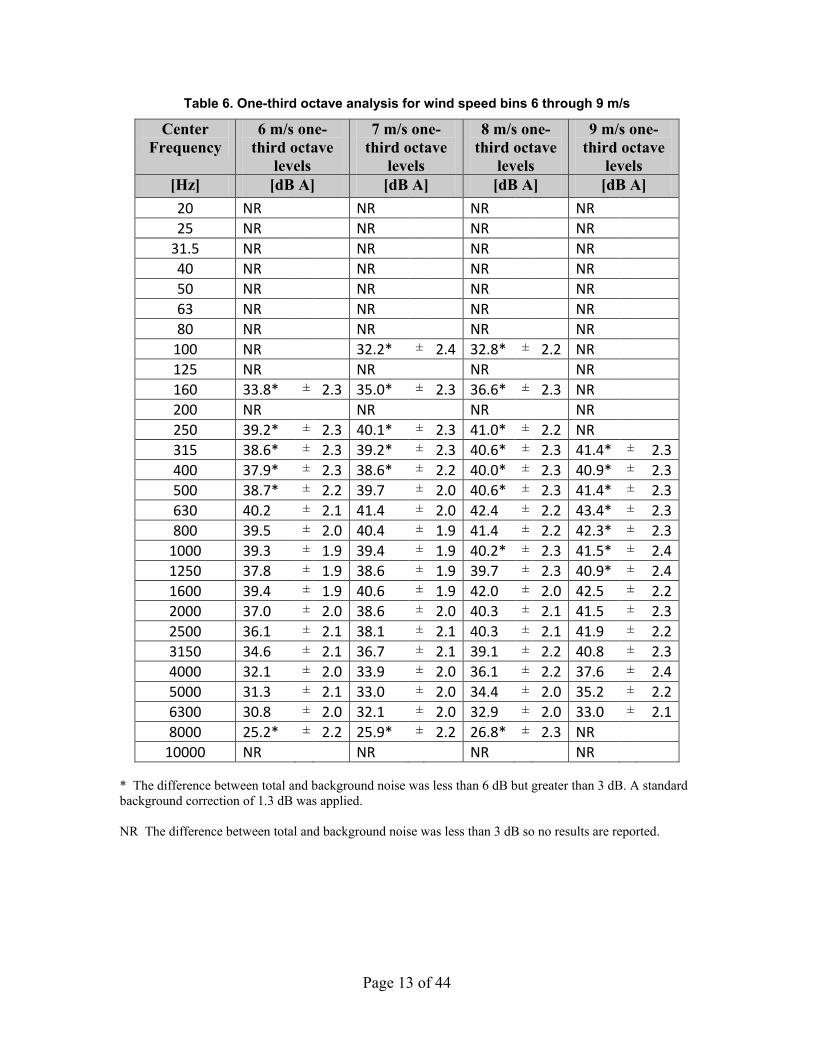
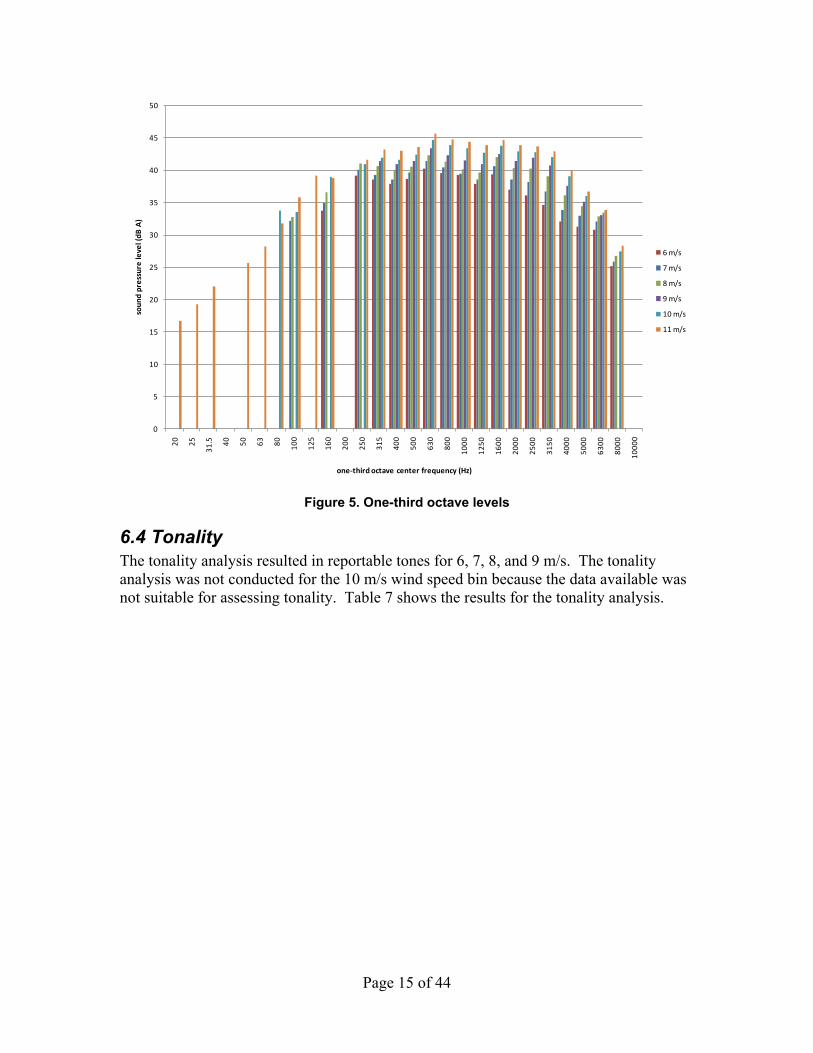
6.3 One-Third Octave Analysis One-third octave levels were analyzed at standardized wind speed of 6, 7, 8, 9, 10, and 11 m/s. The results are given in Table 6 and Figure 5.
40
42
44
46
48
50
52
54
56
58
60
62
2 3 4 5 6 7 8 9 10 11 12 13 14 15 16 17
soun
d pr
essu
re le
vel (
dB A
)
standardized wind speed (m/s)
Turbine
Background
Binned background
Binned turbine
Page 13 of 44
Table 6. One-third octave analysis for wind speed bins 6 through 9 m/s
Center Frequency
6 m/s one-third octave
levels
7 m/s one-third octave
levels
8 m/s one-third octave
levels
9 m/s one-third octave
levels [Hz] [dB A] [dB A] [dB A] [dB A] 20 NR NR NR NR 25 NR NR NR NR
31.5 NR NR NR NR 40 NR NR NR NR 50 NR NR NR NR 63 NR NR NR NR 80 NR NR NR NR
100 NR 32.2* ± 2.4 32.8* ± 2.2 NR 125 NR NR NR NR 160 33.8* ± 2.3 35.0* ± 2.3 36.6* ± 2.3 NR 200 NR NR NR NR 250 39.2* ± 2.3 40.1* ± 2.3 41.0* ± 2.2 NR 315 38.6* ± 2.3 39.2* ± 2.3 40.6* ± 2.3 41.4* ± 2.3 400 37.9* ± 2.3 38.6* ± 2.2 40.0* ± 2.3 40.9* ± 2.3 500 38.7* ± 2.2 39.7 ± 2.0 40.6* ± 2.3 41.4* ± 2.3 630 40.2 ± 2.1 41.4 ± 2.0 42.4 ± 2.2 43.4* ± 2.3 800 39.5 ± 2.0 40.4 ± 1.9 41.4 ± 2.2 42.3* ± 2.3
1000 39.3 ± 1.9 39.4 ± 1.9 40.2* ± 2.3 41.5* ± 2.4 1250 37.8 ± 1.9 38.6 ± 1.9 39.7 ± 2.3 40.9* ± 2.4 1600 39.4 ± 1.9 40.6 ± 1.9 42.0 ± 2.0 42.5 ± 2.2 2000 37.0 ± 2.0 38.6 ± 2.0 40.3 ± 2.1 41.5 ± 2.3 2500 36.1 ± 2.1 38.1 ± 2.1 40.3 ± 2.1 41.9 ± 2.2 3150 34.6 ± 2.1 36.7 ± 2.1 39.1 ± 2.2 40.8 ± 2.3 4000 32.1 ± 2.0 33.9 ± 2.0 36.1 ± 2.2 37.6 ± 2.4 5000 31.3 ± 2.1 33.0 ± 2.0 34.4 ± 2.0 35.2 ± 2.2 6300 30.8 ± 2.0 32.1 ± 2.0 32.9 ± 2.0 33.0 ± 2.1 8000 25.2* ± 2.2 25.9* ± 2.2 26.8* ± 2.3 NR
10000 NR NR NR NR * The difference between total and background noise was less than 6 dB but greater than 3 dB. A standard background correction of 1.3 dB was applied. NR The difference between total and background noise was less than 3 dB so no results are reported.
Page 14 of 44
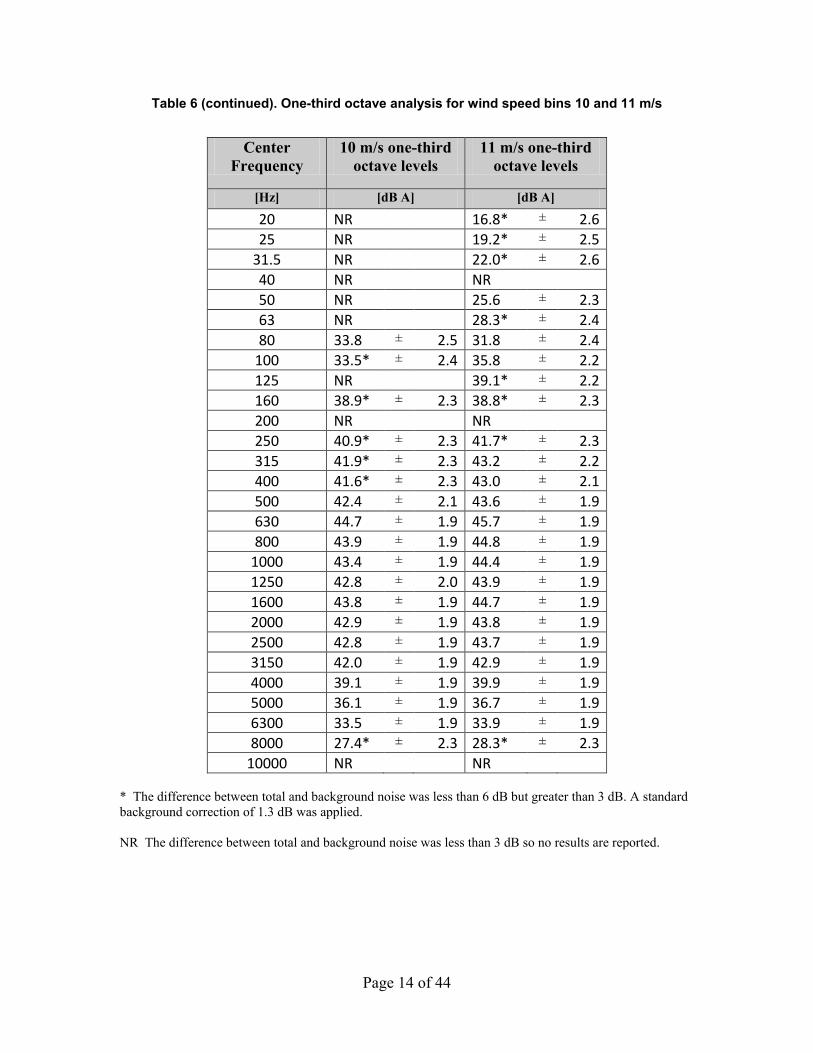
Table 6 (continued). One-third octave analysis for wind speed bins 10 and 11 m/s
Center
Frequency 10 m/s one-third
octave levels 11 m/s one-third
octave levels
[Hz] [dB A] [dB A]
20 NR 16.8* ± 2.6 25 NR 19.2* ± 2.5
31.5 NR 22.0* ± 2.6 40 NR NR 50 NR 25.6 ± 2.3 63 NR 28.3* ± 2.4 80 33.8 ± 2.5 31.8 ± 2.4
100 33.5* ± 2.4 35.8 ± 2.2 125 NR 39.1* ± 2.2 160 38.9* ± 2.3 38.8* ± 2.3 200 NR NR 250 40.9* ± 2.3 41.7* ± 2.3 315 41.9* ± 2.3 43.2 ± 2.2 400 41.6* ± 2.3 43.0 ± 2.1 500 42.4 ± 2.1 43.6 ± 1.9 630 44.7 ± 1.9 45.7 ± 1.9 800 43.9 ± 1.9 44.8 ± 1.9
1000 43.4 ± 1.9 44.4 ± 1.9 1250 42.8 ± 2.0 43.9 ± 1.9 1600 43.8 ± 1.9 44.7 ± 1.9 2000 42.9 ± 1.9 43.8 ± 1.9 2500 42.8 ± 1.9 43.7 ± 1.9 3150 42.0 ± 1.9 42.9 ± 1.9 4000 39.1 ± 1.9 39.9 ± 1.9 5000 36.1 ± 1.9 36.7 ± 1.9 6300 33.5 ± 1.9 33.9 ± 1.9 8000 27.4* ± 2.3 28.3* ± 2.3
10000 NR NR * The difference between total and background noise was less than 6 dB but greater than 3 dB. A standard background correction of 1.3 dB was applied. NR The difference between total and background noise was less than 3 dB so no results are reported.
Page 15 of 44
Figure 5. One-third octave levels
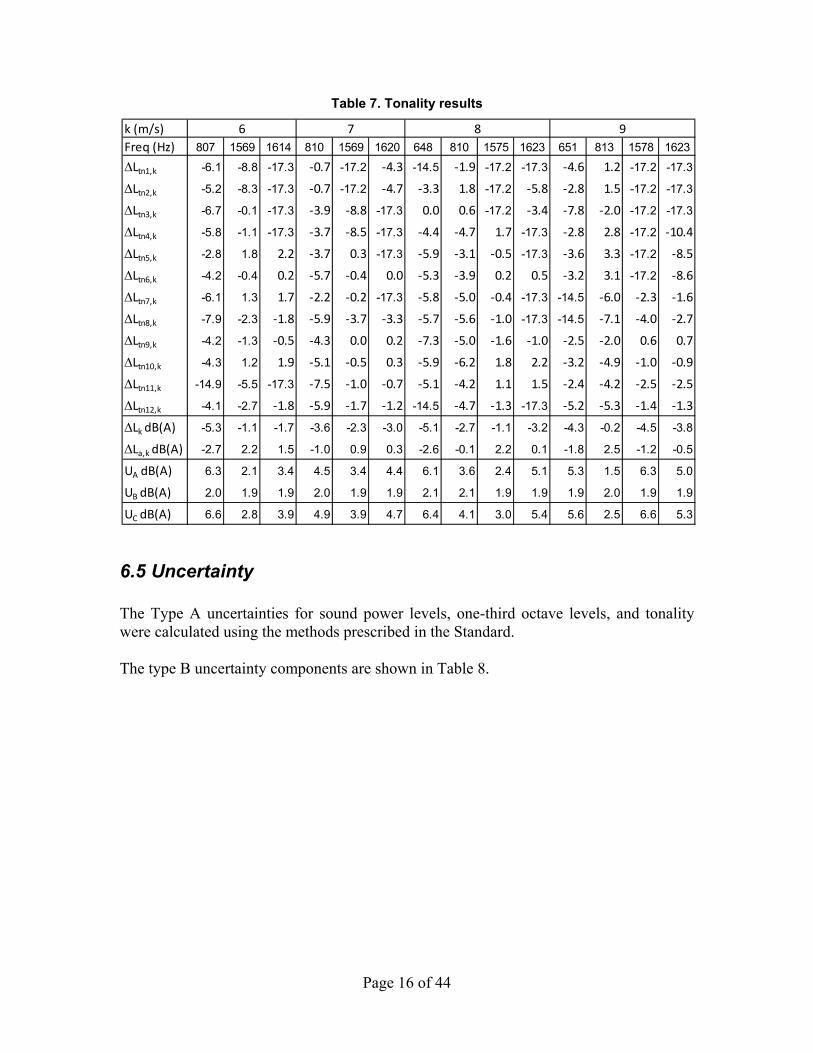
6.4 Tonality The tonality analysis resulted in reportable tones for 6, 7, 8, and 9 m/s. The tonality analysis was not conducted for the 10 m/s wind speed bin because the data available was not suitable for assessing tonality. Table 7 shows the results for the tonality analysis.
0
5
10
15
20
25
30
35
40
45
50
20 25
31.5 40 50 63 80 100
125
160
200
250
315
400
500
630
800
1000
1250
1600
2000
2500
3150
4000
5000
6300
8000
1000
0
soun
d pr
essu
re le
vel (
dB A
)
one-third octave center frequency (Hz)
6 m/s
7 m/s
8 m/s
9 m/s
10 m/s
11 m/s
Page 16 of 44
Table 7. Tonality results
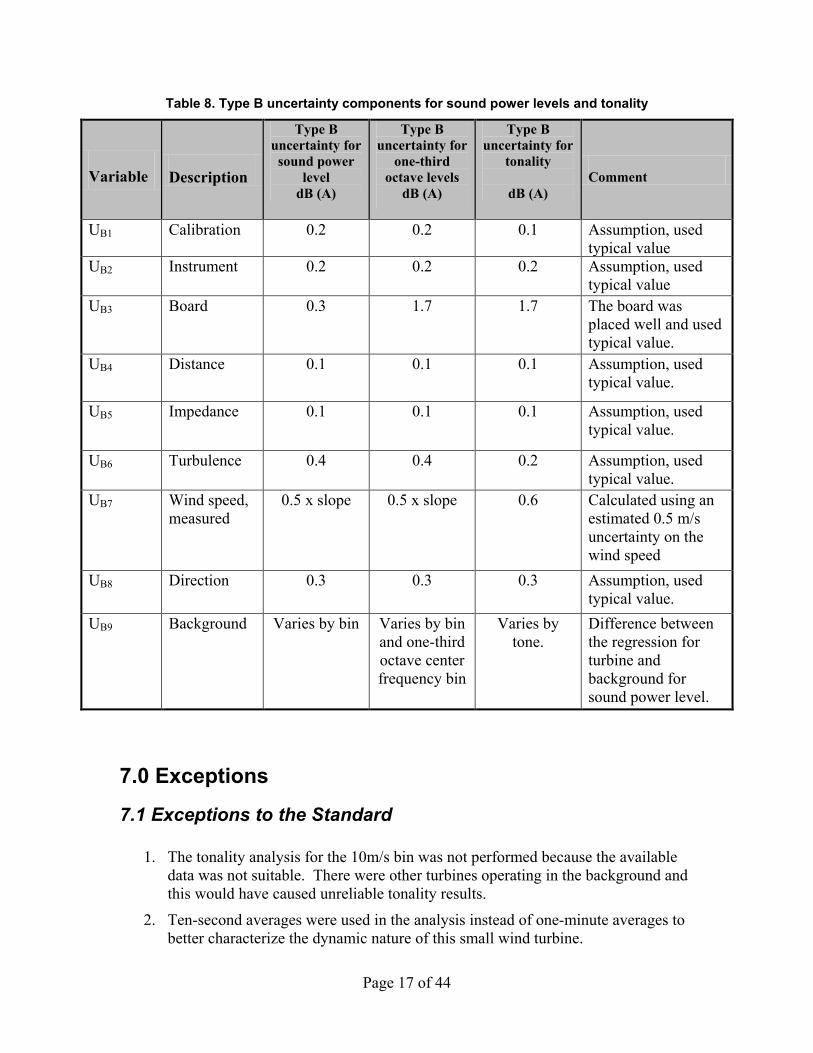
6.5 Uncertainty The Type A uncertainties for sound power levels, one-third octave levels, and tonality were calculated using the methods prescribed in the Standard. The type B uncertainty components are shown in Table 8.
k (m/s)Freq (Hz) 807 1569 1614 810 1569 1620 648 810 1575 1623 651 813 1578 1623
∆Ltn1,k -6.1 -8.8 -17.3 -0.7 -17.2 -4.3 -14.5 -1.9 -17.2 -17.3 -4.6 1.2 -17.2 -17.3
∆Ltn2,k -5.2 -8.3 -17.3 -0.7 -17.2 -4.7 -3.3 1.8 -17.2 -5.8 -2.8 1.5 -17.2 -17.3
∆Ltn3,k -6.7 -0.1 -17.3 -3.9 -8.8 -17.3 0.0 0.6 -17.2 -3.4 -7.8 -2.0 -17.2 -17.3
∆Ltn4,k -5.8 -1.1 -17.3 -3.7 -8.5 -17.3 -4.4 -4.7 1.7 -17.3 -2.8 2.8 -17.2 -10.4
∆Ltn5,k -2.8 1.8 2.2 -3.7 0.3 -17.3 -5.9 -3.1 -0.5 -17.3 -3.6 3.3 -17.2 -8.5
∆Ltn6,k -4.2 -0.4 0.2 -5.7 -0.4 0.0 -5.3 -3.9 0.2 0.5 -3.2 3.1 -17.2 -8.6
∆Ltn7,k -6.1 1.3 1.7 -2.2 -0.2 -17.3 -5.8 -5.0 -0.4 -17.3 -14.5 -6.0 -2.3 -1.6
∆Ltn8,k -7.9 -2.3 -1.8 -5.9 -3.7 -3.3 -5.7 -5.6 -1.0 -17.3 -14.5 -7.1 -4.0 -2.7
∆Ltn9,k -4.2 -1.3 -0.5 -4.3 0.0 0.2 -7.3 -5.0 -1.6 -1.0 -2.5 -2.0 0.6 0.7
∆Ltn10,k -4.3 1.2 1.9 -5.1 -0.5 0.3 -5.9 -6.2 1.8 2.2 -3.2 -4.9 -1.0 -0.9
∆Ltn11,k -14.9 -5.5 -17.3 -7.5 -1.0 -0.7 -5.1 -4.2 1.1 1.5 -2.4 -4.2 -2.5 -2.5
∆Ltn12,k -4.1 -2.7 -1.8 -5.9 -1.7 -1.2 -14.5 -4.7 -1.3 -17.3 -5.2 -5.3 -1.4 -1.3
∆Lk dB(A) -5.3 -1.1 -1.7 -3.6 -2.3 -3.0 -5.1 -2.7 -1.1 -3.2 -4.3 -0.2 -4.5 -3.8
∆La,k dB(A) -2.7 2.2 1.5 -1.0 0.9 0.3 -2.6 -0.1 2.2 0.1 -1.8 2.5 -1.2 -0.5
UA dB(A) 6.3 2.1 3.4 4.5 3.4 4.4 6.1 3.6 2.4 5.1 5.3 1.5 6.3 5.0
UB dB(A) 2.0 1.9 1.9 2.0 1.9 1.9 2.1 2.1 1.9 1.9 1.9 2.0 1.9 1.9
UC dB(A) 6.6 2.8 3.9 4.9 3.9 4.7 6.4 4.1 3.0 5.4 5.6 2.5 6.6 5.3
6 7 8 9
Page 17 of 44
Table 8. Type B uncertainty components for sound power levels and tonality
Variable Description
Type B uncertainty for
sound power level
dB (A)
Type B uncertainty for
one-third octave levels
dB (A)
Type B uncertainty for
tonality
dB (A) Comment
UB1 Calibration 0.2 0.2 0.1 Assumption, used typical value
UB2 Instrument 0.2 0.2 0.2 Assumption, used typical value
UB3 Board 0.3 1.7 1.7 The board was placed well and used typical value.
UB4 Distance 0.1 0.1 0.1 Assumption, used typical value.
UB5 Impedance 0.1 0.1 0.1 Assumption, used typical value.
UB6 Turbulence 0.4 0.4 0.2 Assumption, used typical value.
UB7 Wind speed, measured
0.5 x slope 0.5 x slope 0.6 Calculated using an estimated 0.5 m/s uncertainty on the wind speed
UB8 Direction 0.3 0.3 0.3 Assumption, used typical value.
UB9 Background Varies by bin Varies by bin and one-third octave center frequency bin
Varies by tone.
Difference between the regression for turbine and background for sound power level.
7.0 Exceptions
7.1 Exceptions to the Standard
1. The tonality analysis for the 10m/s bin was not performed because the available data was not suitable. There were other turbines operating in the background and this would have caused unreliable tonality results.
2. Ten-second averages were used in the analysis instead of one-minute averages to better characterize the dynamic nature of this small wind turbine.
Page 18 of 44
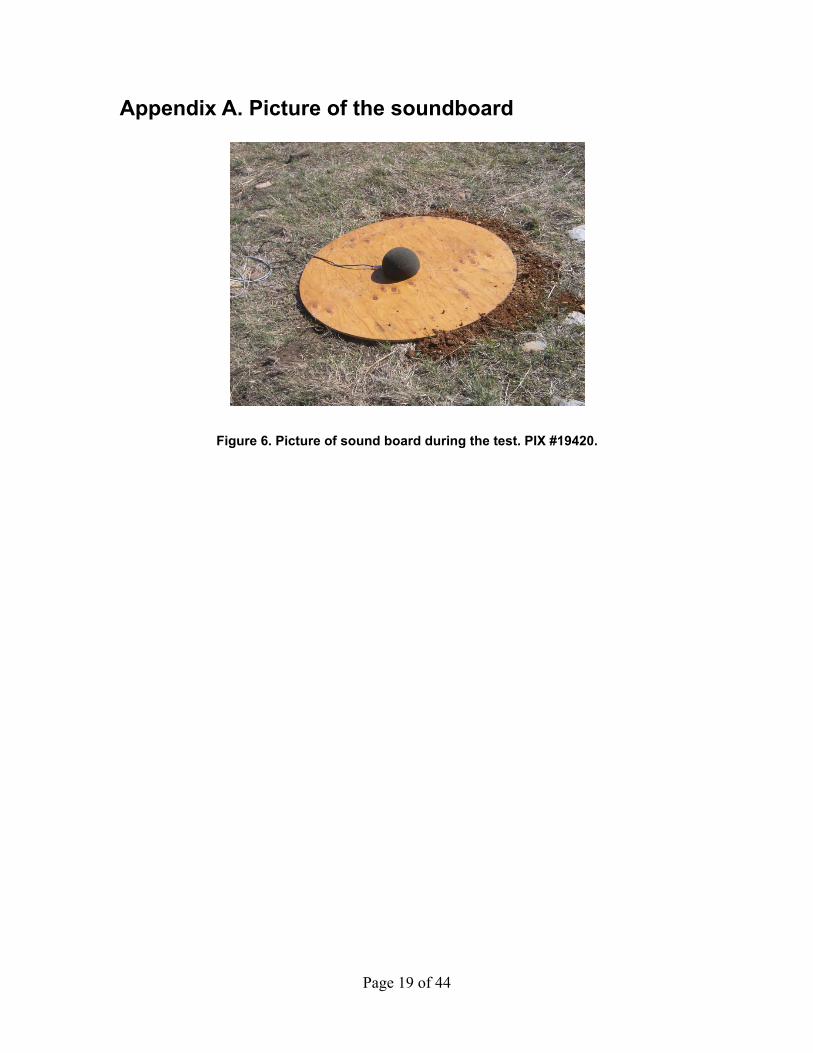
3. Pictures were not taken of the soundboard, turbine, and meteorological tower during the test. A picture of a soundboard is included that is representative of conditions during the test.
7.2 Exceptions to the Quality Assurance System Meteorological instruments were used past the calibration due dates. The instruments were post-test calibrated to assure the instruments were within their tolerances.
8.0 References IEC 61400-11 Ed 2.1 2006-11 Wind Turbine Generator Systems – Part 11 Acoustic Noise Measurement Techniques
Page 19 of 44
Appendix A. Picture of the soundboard
Figure 6. Picture of sound board during the test. PIX #19420.

Page 20 of 44
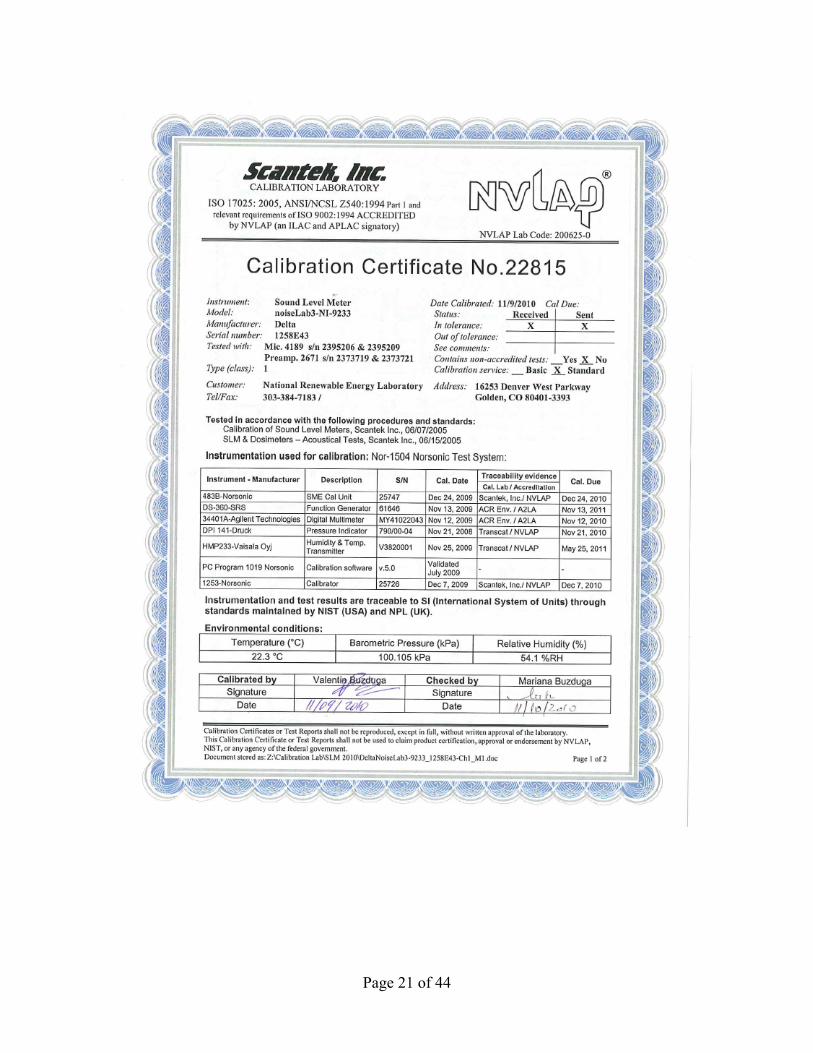
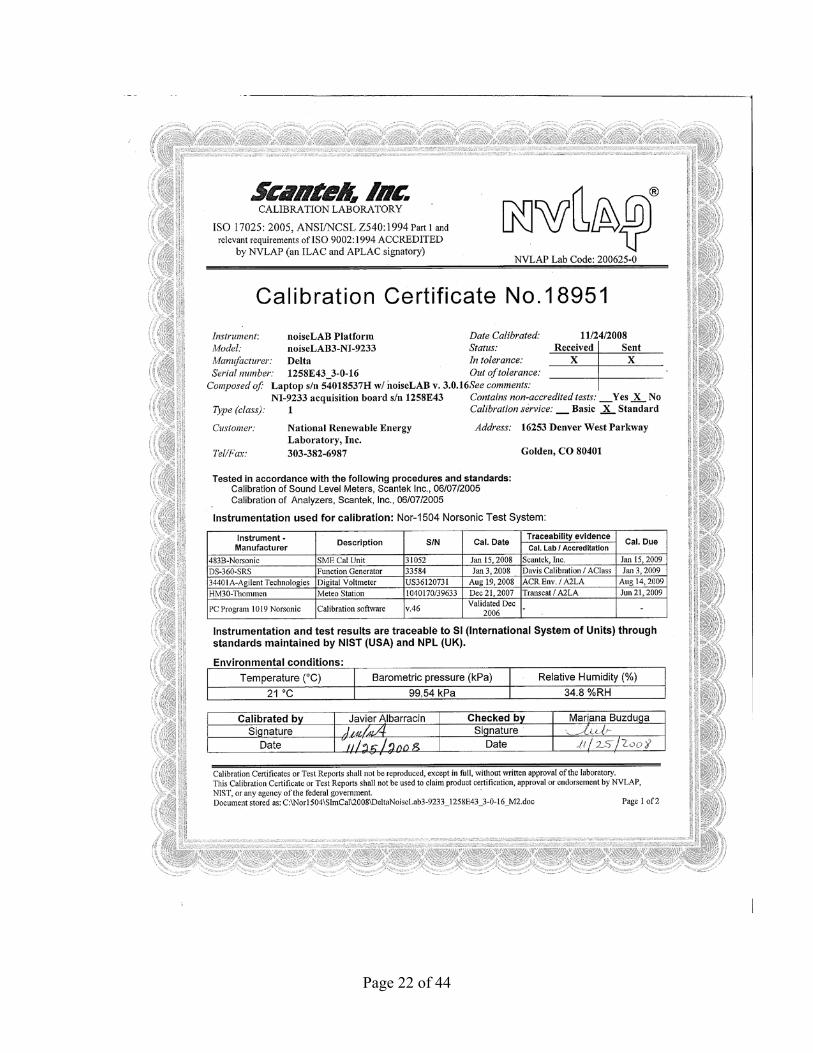
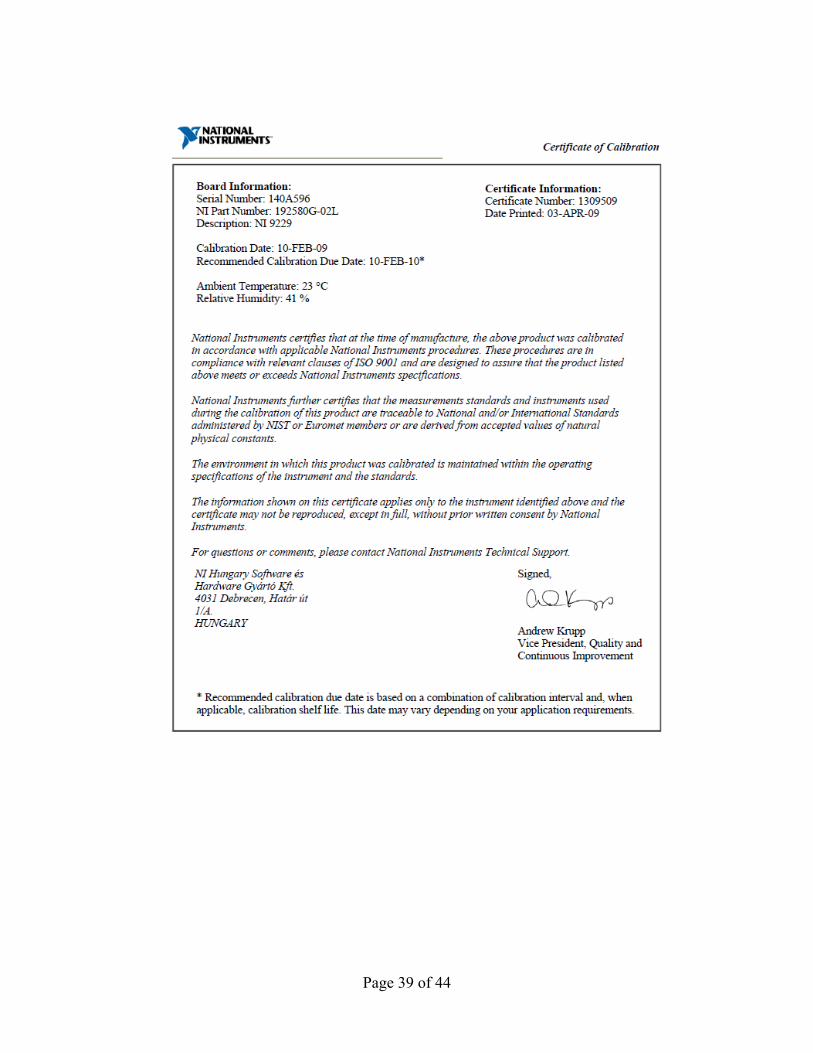
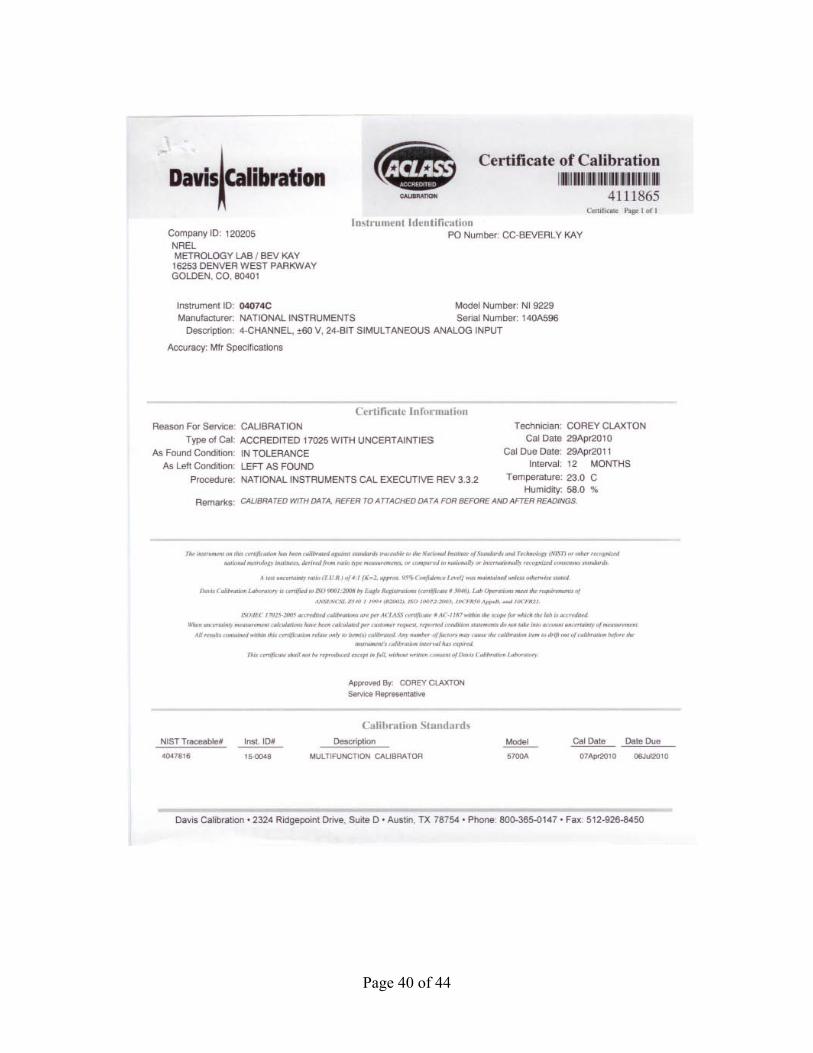
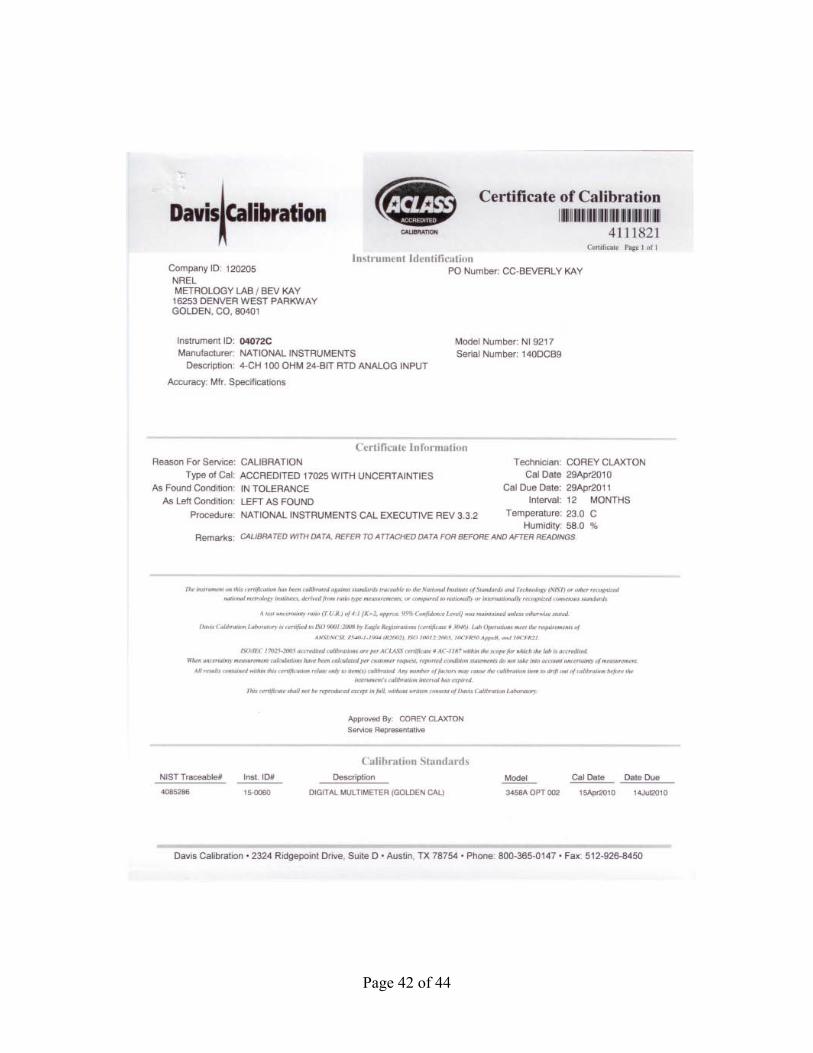
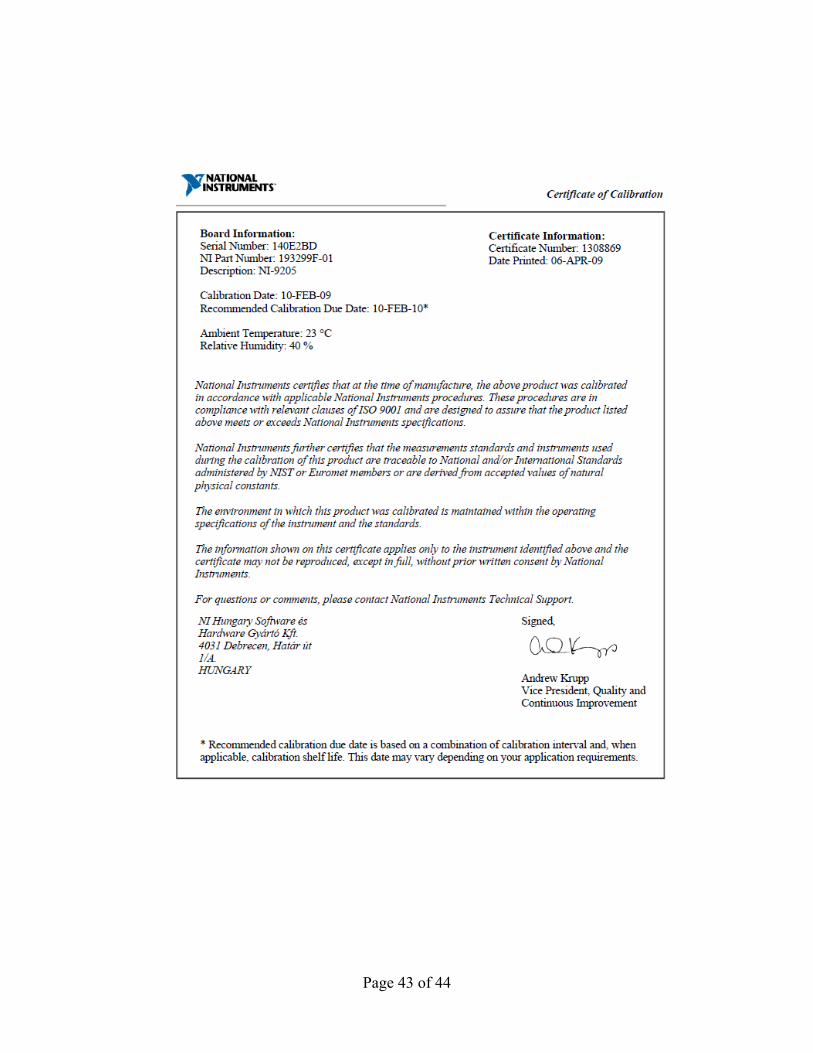
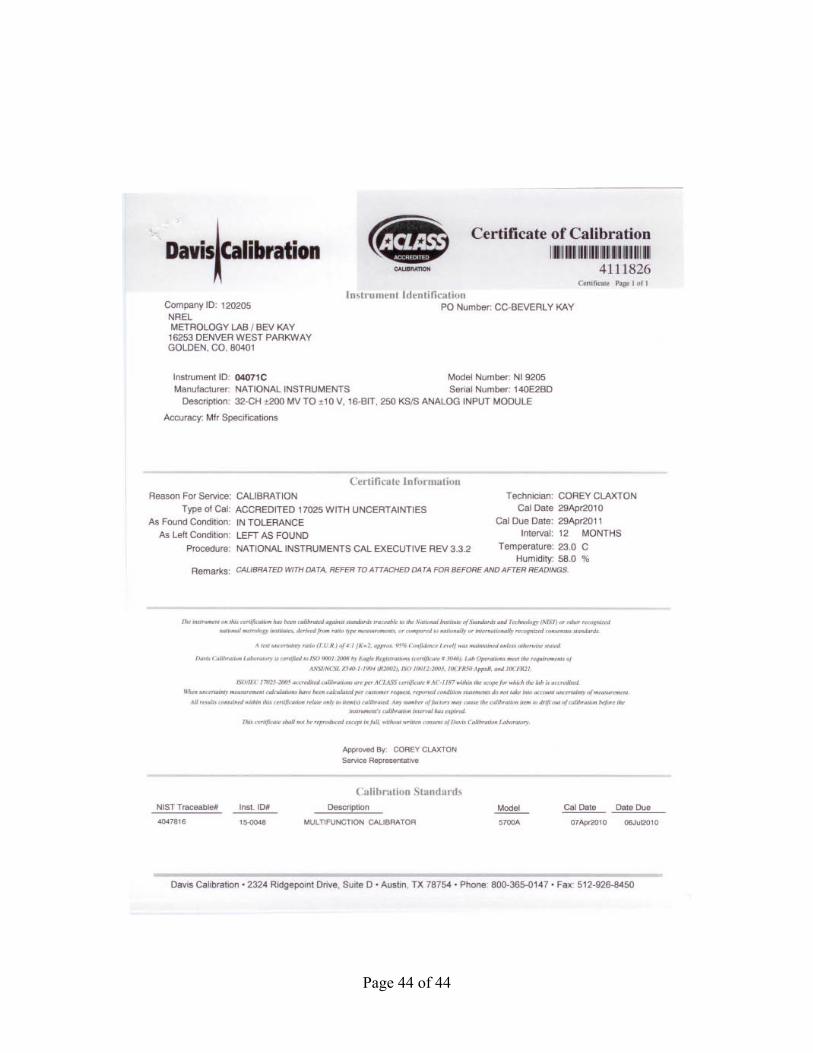
Appendix B. Equipment Calibration Sheets
Page 21 of 44
Page 22 of 44
Page 23 of 44
Page 24 of 44
Page 25 of 44
Page 26 of 44
Page 27 of 44
Page 28 of 44
Page 29 of 44
Page 30 of 44
Page 31 of 44
Page 32 of 44
Page 33 of 44
Page 34 of 44
Page 35 of 44
Page 36 of 44
Page 37 of 44
Page 38 of 44
Page 39 of 44
Page 40 of 44

Page 41 of 44
Page 42 of 44
Page 43 of 44
Page 44 of 44