Embed Size (px)
Citation preview
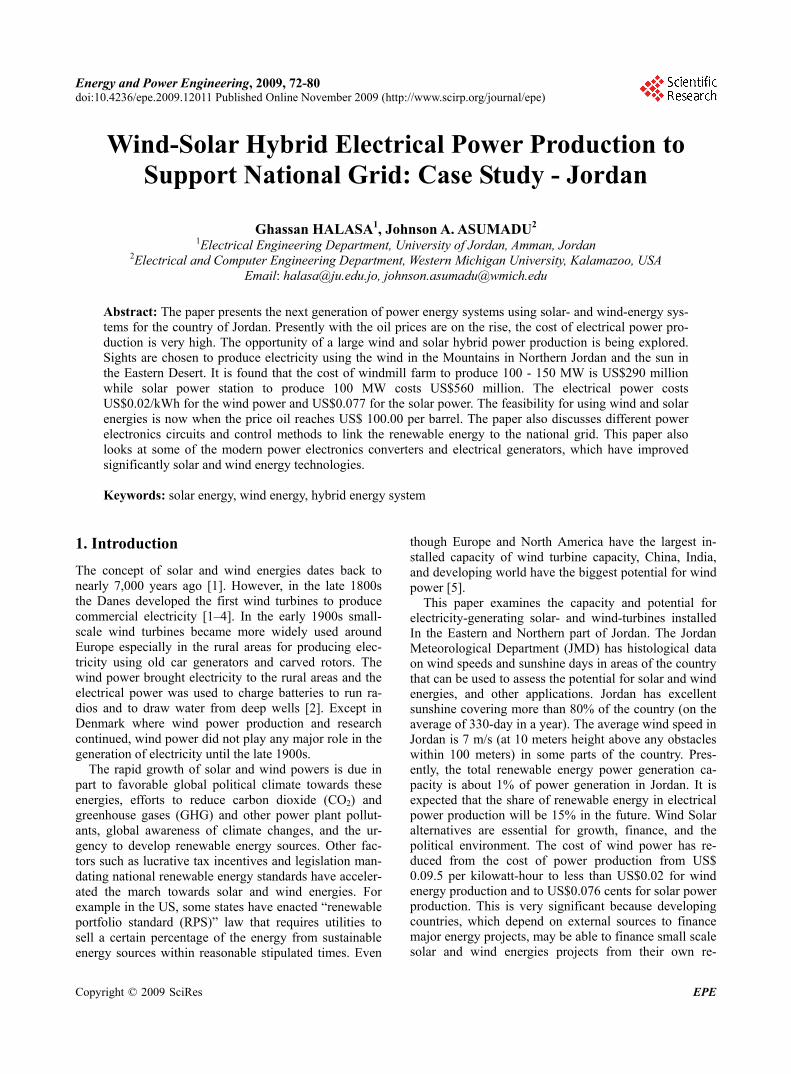
Energy and Power Engineering, 2009, 72-80 doi:10.4236/epe.2009.12011 Published Online November 2009 (http://www.scirp.org/journal/epe)
Copyright © 2009 SciRes EPE
Wind-Solar Hybrid Electrical Power Production to Support National Grid: Case Study - Jordan
Ghassan HALASA1, Johnson A. ASUMADU2 1Electrical Engineering Department, University of Jordan, Amman, Jordan
2Electrical and Computer Engineering Department, Western Michigan University, Kalamazoo, USA Email: [email protected], [email protected]
Abstract: The paper presents the next generation of power energy systems using solar- and wind-energy sys-tems for the country of Jordan. Presently with the oil prices are on the rise, the cost of electrical power pro-duction is very high. The opportunity of a large wind and solar hybrid power production is being explored. Sights are chosen to produce electricity using the wind in the Mountains in Northern Jordan and the sun in the Eastern Desert. It is found that the cost of windmill farm to produce 100 - 150 MW is US$290 million while solar power station to produce 100 MW costs US$560 million. The electrical power costs US$0.02/kWh for the wind power and US$0.077 for the solar power. The feasibility for using wind and solar energies is now when the price oil reaches US$ 100.00 per barrel. The paper also discusses different power electronics circuits and control methods to link the renewable energy to the national grid. This paper also looks at some of the modern power electronics converters and electrical generators, which have improved significantly solar and wind energy technologies. Keywords: solar energy, wind energy, hybrid energy system
1. Introduction
The concept of solar and wind energies dates back to nearly 7,000 years ago [1]. However, in the late 1800s the Danes developed the first wind turbines to produce commercial electricity [1–4]. In the early 1900s small- scale wind turbines became more widely used around Europe especially in the rural areas for producing elec-tricity using old car generators and carved rotors. The wind power brought electricity to the rural areas and the electrical power was used to charge batteries to run ra-dios and to draw water from deep wells [2]. Except in Denmark where wind power production and research continued, wind power did not play any major role in the generation of electricity until the late 1900s.
The rapid growth of solar and wind powers is due in part to favorable global political climate towards these energies, efforts to reduce carbon dioxide (CO2) and greenhouse gases (GHG) and other power plant pollut-ants, global awareness of climate changes, and the ur-gency to develop renewable energy sources. Other fac-tors such as lucrative tax incentives and legislation man-dating national renewable energy standards have acceler-ated the march towards solar and wind energies. For example in the US, some states have enacted “renewable portfolio standard (RPS)” law that requires utilities to sell a certain percentage of the energy from sustainable energy sources within reasonable stipulated times. Even
though Europe and North America have the largest in-stalled capacity of wind turbine capacity, China, India, and developing world have the biggest potential for wind power [5].
This paper examines the capacity and potential for electricity-generating solar- and wind-turbines installed In the Eastern and Northern part of Jordan. The Jordan Meteorological Department (JMD) has histological data on wind speeds and sunshine days in areas of the country that can be used to assess the potential for solar and wind energies, and other applications. Jordan has excellent sunshine covering more than 80% of the country (on the average of 330-day in a year). The average wind speed in Jordan is 7 m/s (at 10 meters height above any obstacles within 100 meters) in some parts of the country. Pres-ently, the total renewable energy power generation ca-pacity is about 1% of power generation in Jordan. It is expected that the share of renewable energy in electrical power production will be 15% in the future. Wind Solar alternatives are essential for growth, finance, and the political environment. The cost of wind power has re-duced from the cost of power production from US$ 0.09.5 per kilowatt-hour to less than US$0.02 for wind energy production and to US$0.076 cents for solar power production. This is very significant because developing countries, which depend on external sources to finance major energy projects, may be able to finance small scale solar and wind energies projects from their own re-
G. HALASA ET AL. 73
sources and faster. In this paper the electrical and power calculations for solar and wind utilization to support the national grid in Jordan will be analyzed. This paper also looks at some of the modern power electronics convert-ers and electrical machines, which have improved sig-nificantly solar and wind energy technologies to make them acceptable and embraced as cost effective and re-newable energy.
2. The Existing Jordan’s National Grid
Jordan is interconnected in one national grid. The grid covers most of the populated areas of the country from Aqaba, on the far south to Irbid in the far north. Over-head transmission line link Syria in the north, Palestine in the west, while undersea cable links Egypt in the south. Future countries to be connected to the Jordan national grid include Lebanon, Iraq and Turkey.
The major generation centers are the Aqaba Thermal Power Station in the far south, Al-Hussein Thermal Power Station in Zarka near Amman, and Al-Risha near the Iraqi border. The Aqaba Power Station uses gas sup-plied through pipelines from Egypt. The pipeline extends to Amman. Future expansion of this gas line is expected to go to Syria and eventually Turkey. Al-Hussein power station uses fuel oil imported from Iraq. Al-Risha power station uses locally produced gas. There are several small units scattered in different districts belonging to older utilities. These units are used during peak demands.
The oldest and the highest power production plant in Jordan is the Al-Hussein Thermal Power Station. It is the most expensive because it uses imported oil and also uses air-cooling systems, that consume quite amount of energy, to cool the turbines. A small pilot plant uses biogas produced by sewerage treatment plant. Another pilot plant uses wind energy near the sight proposed in North Jordan. Aqaba Power Station uses Egyptian gas supplied by gas pipeline. This pipeline already extended to Amman. Future expansion of this gas line is expected to go to Syria, and eventually Turkey. Al-Hussein power station uses fuel oil imported fro Iraq. Al-Risha power station uses locally produced gas. There are several small units scattered in different districts belonging to older utilities. These units are used in peak demands.
3. Conventional Electrical Production Cost
The Kingdom of Jordan is considered an emerging coun-try in the Middle East; it has almost no natural resources. The country imports most of its oil needs from neigh- boring countries at market prices. Oil and gas imports are huge burden on the country’s national economy. Electric-ity is generated by burning imported gas and oil, limited generation from hydro, windmills, and biogas. When oil prices rose to extremely high levels last summer, Jorda-nians experienced continuous increases in electricity
prices. It is now urgent and essential to deploy other al-ternatives for electrical generation, which is the use of solar and wind energy for electrical generation.
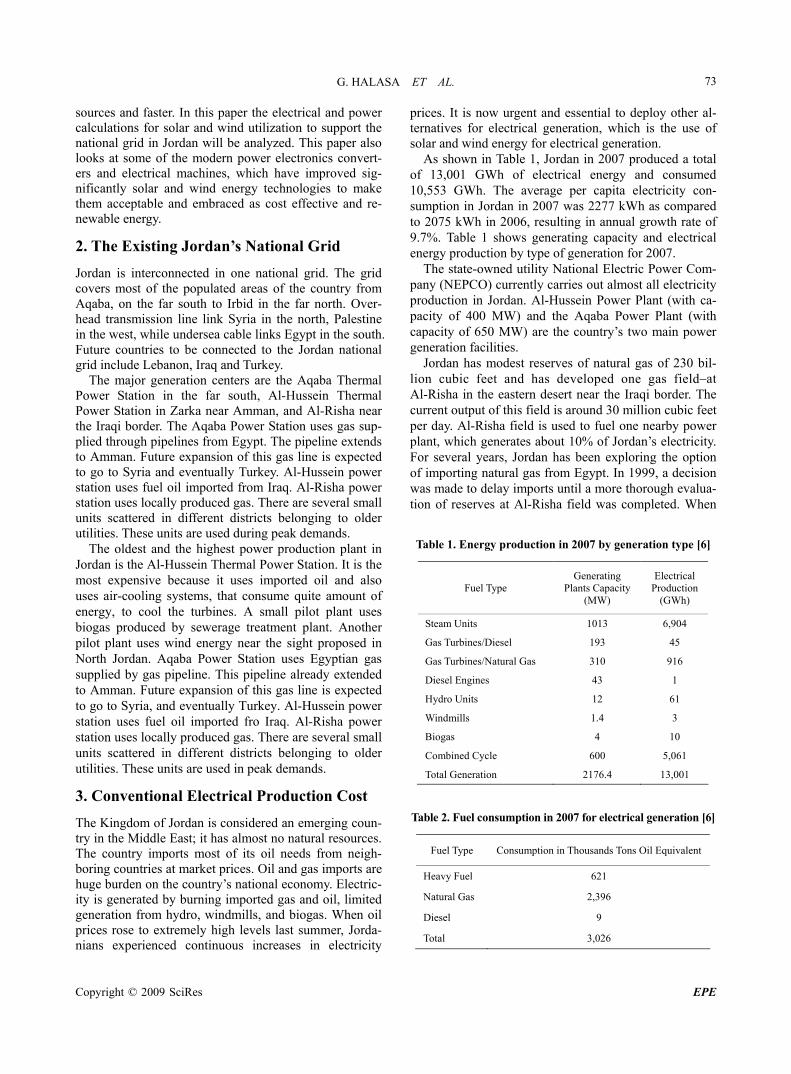
As shown in Table 1, Jordan in 2007 produced a total of 13,001 GWh of electrical energy and consumed 10,553 GWh. The average per capita electricity con-sumption in Jordan in 2007 was 2277 kWh as compared to 2075 kWh in 2006, resulting in annual growth rate of 9.7%. Table 1 shows generating capacity and electrical energy production by type of generation for 2007.
The state-owned utility National Electric Power Com-pany (NEPCO) currently carries out almost all electricity production in Jordan. Al-Hussein Power Plant (with ca-pacity of 400 MW) and the Aqaba Power Plant (with capacity of 650 MW) are the country’s two main power generation facilities.
Jordan has modest reserves of natural gas of 230 bil-lion cubic feet and has developed one gas field at Al-Risha in the eastern desert near the Iraqi border. The current output of this field is around 30 million cubic feet per day. Al-Risha field is used to fuel one nearby power plant, which generates about 10% of Jordan’s electricity. For several years, Jordan has been exploring the option of importing natural gas from Egypt. In 1999, a decision was made to delay imports until a more thorough evalua-tion of reserves at Al-Risha field was completed. When
Table 1. Energy production in 2007 by generation type [6]
Fuel Type Generating
Plants Capacity (MW)
Electrical Production
(GWh)
Steam Units 1013 6,904
Gas Turbines/Diesel 193 45
Gas Turbines/Natural Gas 310 916
Diesel Engines 43 1
Hydro Units 12 61
Windmills 1.4 3
Biogas 4 10
Combined Cycle 600 5,061
Total Generation 2176.4 13,001
Table 2. Fuel consumption in 2007 for electrical generation [6]
Fuel Type Consumption in Thousands Tons Oil Equivalent
Heavy Fuel 621
Natural Gas 2,396
Diesel 9
Total 3,026
Copyright © 2009 SciRes EPE
G. HALASA ET AL. 74
this review showed that quantities available were not sufficient to meet the country’s needs, Jordan decided to reopen talks on imports from Egypt. A pipeline was con-structed and completed in 2006. Aqaba thermal power station, a major generating center, currently uses Egyp-tian gas. Jordan imports about 150,000 barrels of oil per day mostly from Iraq and Saudi Arabia. The Zarka refin-ery near Amman, the only refinery in the country, refines the imported oil. Table 2 shows electrical generation fuel consumption in 2007. Gas and oil imports pose a huge burden on the national economy. It is evident that the country is in need for renewable energy projects.
According to 2007 data supplied by NEPCO [6], elec-trical production cost is US$0.073 per KWh: out of which fuel cost is US$ 0.0386 per KWh. This figure is considered expensive as compared to production cost in other countries. As the oil prices surged to more than double in the summer of 2008, accordingly the produc-tion cost increased to US$0.11 per kWh. If it is assumed that the true value of oil price is $100 per barrel, the production cost would be about US$0.095 per kWh. This figure will be used in cost comparison.
4. Assessment of Wind and Solar Energies
In Jordan electricity demand grew at the rate of 9.7% in 2007. The Jordanian government has been seeking ways to attract foreign capital to fund additional capacity. Wind and solar energies as main source of electricity generation are currently set as government priorities. The government implemented the following actions [7]: Developing new wind and solar maps for Jordan. Developing a legal framework for renewable en-
ergy. Developing incentives for renewable energy pro-
jects. Securing appropriate funding to implement the first
commercial wind energy project in Jordan. Secure appropriate funding to implement the feasi-
bility study of the hybrid solar power plant. Because of the government enthusiasm to promote re-
newable energy, a thorough investigation has been con-ducted to study the possibility for a hybrid system of windmills and solar arrays for electricity generation. Data collected over many years by the JMD [8] has helped in locating the sights for both windmills and solar arrays.
The wind farm location was set in the area of Ras- Munif where the annual wind speed average is 5.5 me-ters/sec according to data collected by the Meteorologi-cal Department in Jordan. With the exception of the months of September and October, where the wind speed is low, the other 10 months the speed varies from 6 to 6.5 meter/sec. This speed represents the village ground level speed. If the windmills are sighted at higher elevation and in the valley curvature between mountains running
west to east where wind tunnel effect exists, the average wind speed might rise to comfortable levels where windmills run near full capacity. The windmill tower height of 100 meters also increases wind speed to levels close to the 7-9 meter/sec [9], which might bring the wind turbine power output to 1.0 MW or more. Experi-ence indicates that wind speed tend to be higher during the nighttime. Therefore, during the daytime the defi-ciency in windmills’ power output can be augmented by solar cells. The average sunshine hours throughout the year are 8.5 hours per day. In the summer months, May through September, the average sunshine hours are more than 10 hours per day. In winter months, November through February, the average sunshine hours are about 6 hours per day. This means that the solar arrays can sup-plement the wind turbines daily for 10 hours in the summer and 6 hours in the winter months. The solar ar-rays can be scattered between the windmill towers.
5. The Windmill-Solar Hybrid System
5.1. Proposed Windmill-Solar Hybrid
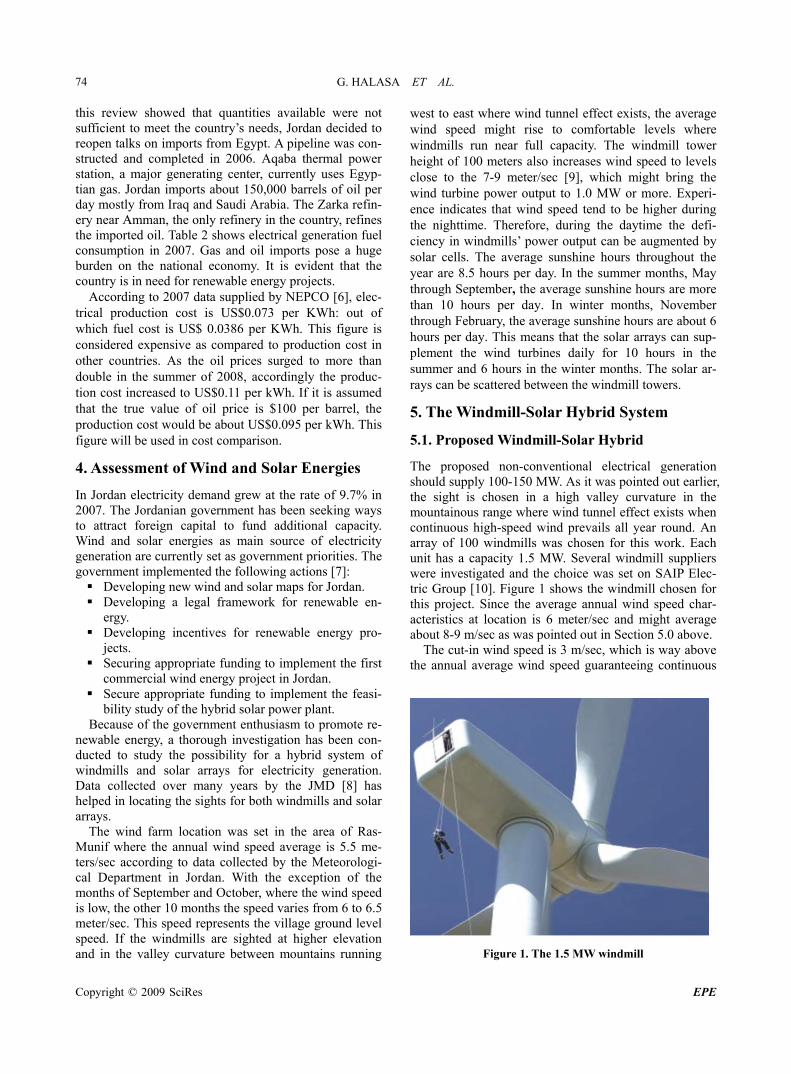
The proposed non-conventional electrical generation should supply 100-150 MW. As it was pointed out earlier, the sight is chosen in a high valley curvature in the mountainous range where wind tunnel effect exists when continuous high-speed wind prevails all year round. An array of 100 windmills was chosen for this work. Each unit has a capacity 1.5 MW. Several windmill suppliers were investigated and the choice was set on SAIP Elec-tric Group [10]. Figure 1 shows the windmill chosen for this project. Since the average annual wind speed char-acteristics at location is 6 meter/sec and might average about 8-9 m/sec as was pointed out in Section 5.0 above.
The cut-in wind speed is 3 m/sec, which is way above the annual average wind speed guaranteeing continuous
Figure 1. The 1.5 MW windmill
Copyright © 2009 SciRes EPE
G. HALASA ET AL. 75
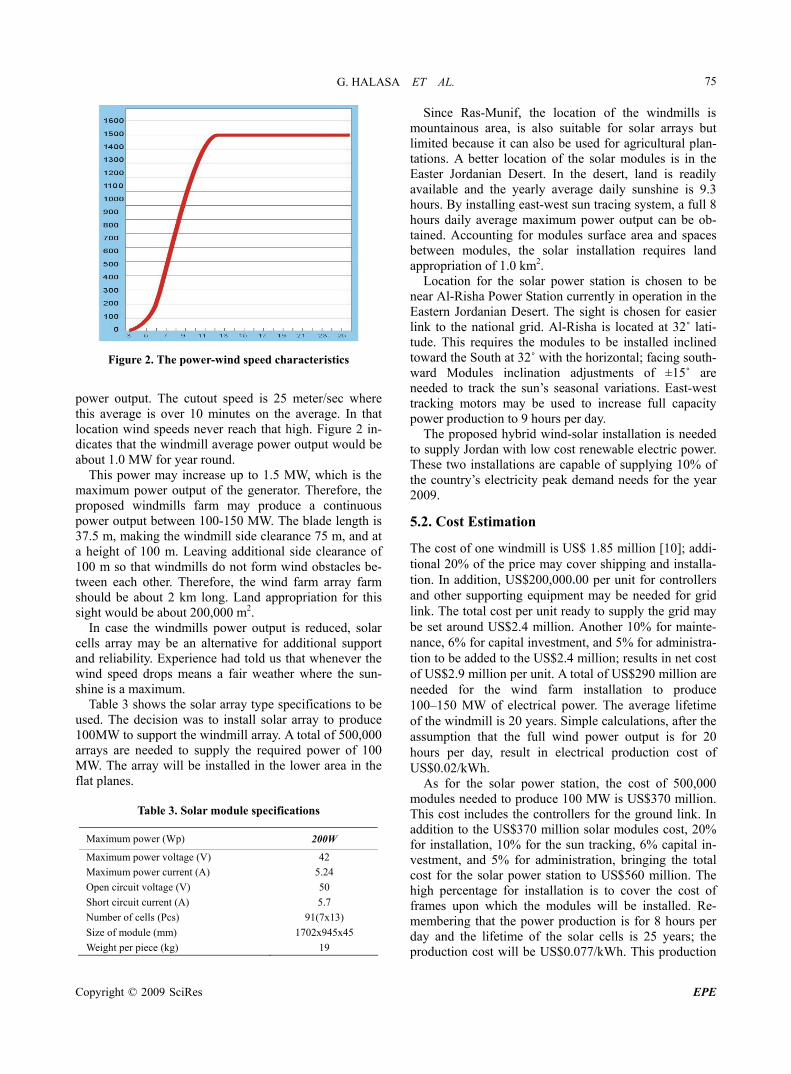
Figure 2. The power-wind speed characteristics
power output. The cutout speed is 25 meter/sec where this average is over 10 minutes on the average. In that location wind speeds never reach that high. Figure 2 in-dicates that the windmill average power output would be about 1.0 MW for year round.
This power may increase up to 1.5 MW, which is the maximum power output of the generator. Therefore, the proposed windmills farm may produce a continuous power output between 100-150 MW. The blade length is 37.5 m, making the windmill side clearance 75 m, and at a height of 100 m. Leaving additional side clearance of 100 m so that windmills do not form wind obstacles be-tween each other. Therefore, the wind farm array farm should be about 2 km long. Land appropriation for this sight would be about 200,000 m2.
In case the windmills power output is reduced, solar cells array may be an alternative for additional support and reliability. Experience had told us that whenever the wind speed drops means a fair weather where the sun-shine is a maximum.
Table 3 shows the solar array type specifications to be used. The decision was to install solar array to produce 100MW to support the windmill array. A total of 500,000 arrays are needed to supply the required power of 100 MW. The array will be installed in the lower area in the flat planes.
Table 3. Solar module specifications
Maximum power (Wp) 200W
Maximum power voltage (V) 42
Maximum power current (A) 5.24
Open circuit voltage (V) 50
Short circuit current (A) 5.7
Number of cells (Pcs) 91(7x13)
Size of module (mm) 1702x945x45
Weight per piece (kg) 19
Since Ras-Munif, the location of the windmills is mountainous area, is also suitable for solar arrays but limited because it can also be used for agricultural plan-tations. A better location of the solar modules is in the Easter Jordanian Desert. In the desert, land is readily available and the yearly average daily sunshine is 9.3 hours. By installing east-west sun tracing system, a full 8 hours daily average maximum power output can be ob-tained. Accounting for modules surface area and spaces between modules, the solar installation requires land appropriation of 1.0 km2.
Location for the solar power station is chosen to be near Al-Risha Power Station currently in operation in the Eastern Jordanian Desert. The sight is chosen for easier link to the national grid. Al-Risha is located at 32˚ lati-tude. This requires the modules to be installed inclined toward the South at 32˚ with the horizontal; facing south- ward Modules inclination adjustments of ±15˚ are needed to track the sun’s seasonal variations. East-west tracking motors may be used to increase full capacity power production to 9 hours per day.
The proposed hybrid wind-solar installation is needed to supply Jordan with low cost renewable electric power. These two installations are capable of supplying 10% of the country’s electricity peak demand needs for the year 2009.
5.2. Cost Estimation
The cost of one windmill is US$ 1.85 million [10]; addi-tional 20% of the price may cover shipping and installa-tion. In addition, US$200,000.00 per unit for controllers and other supporting equipment may be needed for grid link. The total cost per unit ready to supply the grid may be set around US$2.4 million. Another 10% for mainte-nance, 6% for capital investment, and 5% for administra-tion to be added to the US$2.4 million; results in net cost of US$2.9 million per unit. A total of US$290 million are needed for the wind farm installation to produce 100–150 MW of electrical power. The average lifetime of the windmill is 20 years. Simple calculations, after the assumption that the full wind power output is for 20 hours per day, result in electrical production cost of US$0.02/kWh.
As for the solar power station, the cost of 500,000 modules needed to produce 100 MW is US$370 million. This cost includes the controllers for the ground link. In addition to the US$370 million solar modules cost, 20% for installation, 10% for the sun tracking, 6% capital in-vestment, and 5% for administration, bringing the total cost for the solar power station to US$560 million. The high percentage for installation is to cover the cost of frames upon which the modules will be installed. Re-membering that the power production is for 8 hours per day and the lifetime of the solar cells is 25 years; the production cost will be US$0.077/kWh. This production
Copyright © 2009 SciRes EPE
G. HALASA ET AL.
Copyright © 2009 SciRes EPE
76
cost is almost the same as the present conventional cost but lower than the projected cost of US$0.09/kWh when the price of oil reaches US$100 per barrel.
Comparing the wind and solar power production costs, it seems that wind power production cost is lower than the solar power production. Therefore, wind energy pro-duction is feasible now even with oil prices at US$40 per barrel. In the future when oil prices rise, even with the high cost of solar energy, solar power is important for power floe reliability.
6. Ras-Munif – Village of ‘Ebelin Hybrid Power Project
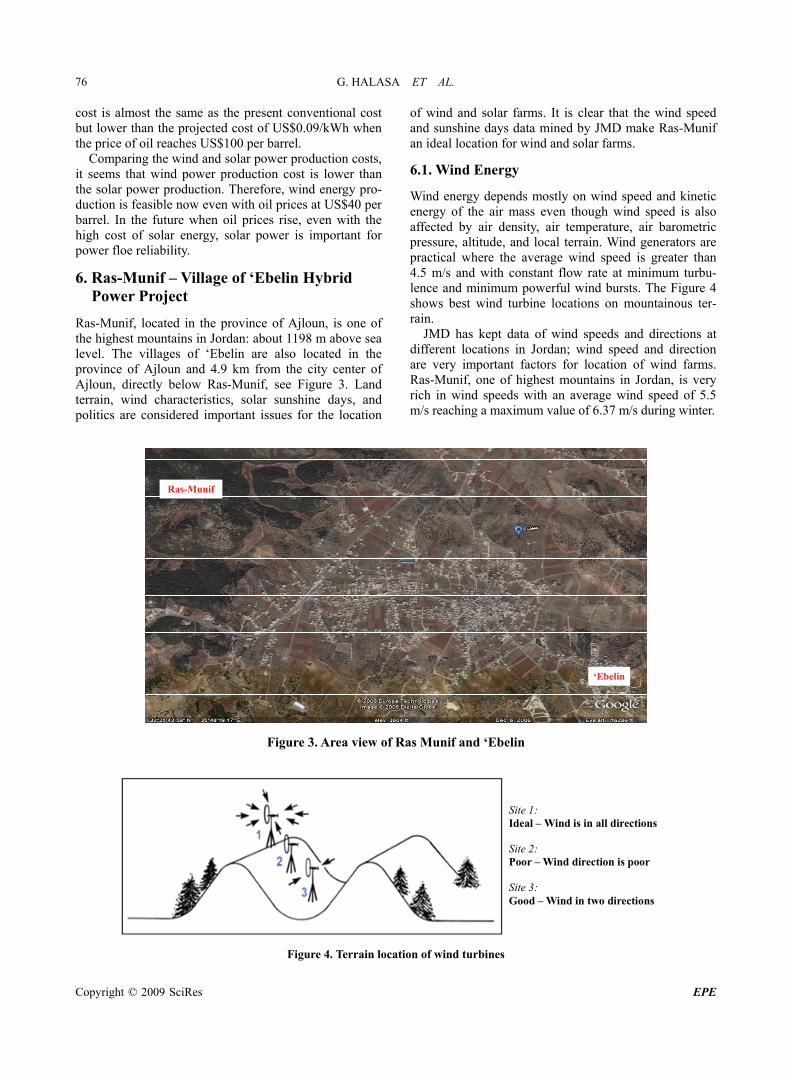
Ras-Munif, located in the province of Ajloun, is one of the highest mountains in Jordan: about 1198 m above sea level. The villages of ‘Ebelin are also located in the province of Ajloun and 4.9 km from the city center of Ajloun, directly below Ras-Munif, see Figure 3. Land terrain, wind characteristics, solar sunshine days, and politics are considered important issues for the location
of wind and solar farms. It is clear that the wind speed and sunshine days data mined by JMD make Ras-Munif an ideal location for wind and solar farms.
6.1. Wind Energy
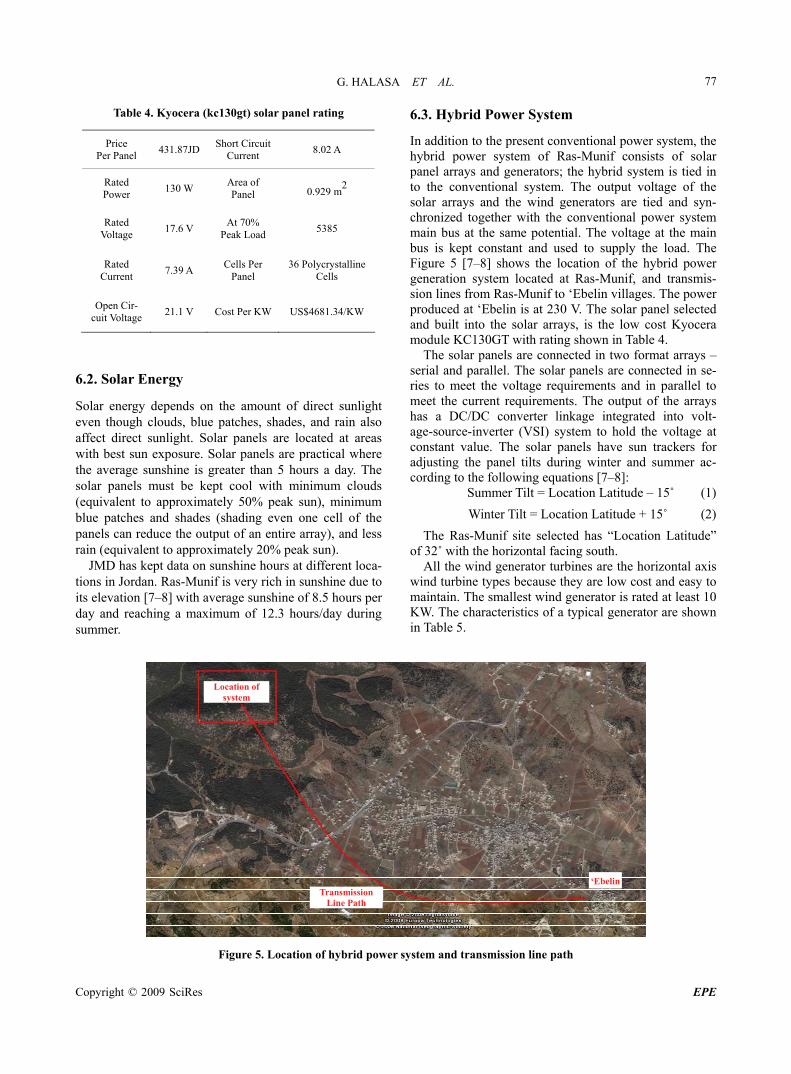
Wind energy depends mostly on wind speed and kinetic energy of the air mass even though wind speed is also affected by air density, air temperature, air barometric pressure, altitude, and local terrain. Wind generators are practical where the average wind speed is greater than 4.5 m/s and with constant flow rate at minimum turbu-lence and minimum powerful wind bursts. The Figure 4 shows best wind turbine locations on mountainous ter-rain.
JMD has kept data of wind speeds and directions at different locations in Jordan; wind speed and direction are very important factors for location of wind farms. Ras-Munif, one of highest mountains in Jordan, is very rich in wind speeds with an average wind speed of 5.5 m/s reaching a maximum value of 6.37 m/s during winter.
Ras-Munif
‘Ebelin
Figure 3. Area view of Ras Munif and ‘Ebelin
Site 1: Ideal – Wind is in all directions Site 2: Poor – Wind direction is poor Site 3: Good – Wind in two directions
Figure 4. Terrain location of wind turbines
G. HALASA ET AL. 77
Table 4. Kyocera (kc130gt) solar panel rating
Price Per Panel
431.87JD Short Circuit
Current 8.02 A
Rated Power
130 W Area of Panel 0.929 m
2
Rated Voltage
17.6 V At 70%
Peak Load 5385
Rated Current
7.39 A Cells Per
Panel 36 Polycrystalline
Cells
Open Cir-cuit Voltage
21.1 V Cost Per KW US$4681.34/KW
6.2. Solar Energy
Solar energy depends on the amount of direct sunlight even though clouds, blue patches, shades, and rain also affect direct sunlight. Solar panels are located at areas with best sun exposure. Solar panels are practical where the average sunshine is greater than 5 hours a day. The solar panels must be kept cool with minimum clouds (equivalent to approximately 50% peak sun), minimum blue patches and shades (shading even one cell of the panels can reduce the output of an entire array), and less rain (equivalent to approximately 20% peak sun).
JMD has kept data on sunshine hours at different loca-tions in Jordan. Ras-Munif is very rich in sunshine due to its elevation [7–8] with average sunshine of 8.5 hours per day and reaching a maximum of 12.3 hours/day during summer.
6.3. Hybrid Power System
In addition to the present conventional power system, the hybrid power system of Ras-Munif consists of solar panel arrays and generators; the hybrid system is tied in to the conventional system. The output voltage of the solar arrays and the wind generators are tied and syn-chronized together with the conventional power system main bus at the same potential. The voltage at the main bus is kept constant and used to supply the load. The Figure 5 [7–8] shows the location of the hybrid power generation system located at Ras-Munif, and transmis-sion lines from Ras-Munif to ‘Ebelin villages. The power produced at ‘Ebelin is at 230 V. The solar panel selected and built into the solar arrays, is the low cost Kyocera module KC130GT with rating shown in Table 4.
The solar panels are connected in two format arrays – serial and parallel. The solar panels are connected in se-ries to meet the voltage requirements and in parallel to meet the current requirements. The output of the arrays has a DC/DC converter linkage integrated into volt-age-source-inverter (VSI) system to hold the voltage at constant value. The solar panels have sun trackers for adjusting the panel tilts during winter and summer ac-cording to the following equations [7–8]:
Summer Tilt = Location Latitude – 15˚ (1)
Winter Tilt = Location Latitude + 15˚ (2)
The Ras-Munif site selected has “Location Latitude” of 32˚ with the horizontal facing south.
All the wind generator turbines are the horizontal axis wind turbine types because they are low cost and easy to maintain. The smallest wind generator is rated at least 10 KW. The characteristics of a typical generator are shown in Table 5.
Location of system
Transmission Line Path
‘Ebelin
Figure 5. Location of hybrid power system and transmission line path
Copyright © 2009 SciRes EPE
G. HALASA ET AL. 78
Table 5. Typical wind turbine characteristics
Power Rating
>10 KW Blade Material Fiberglass-reinforced
Epoxy
Rated Wind Speed
13 m/s Yaw Control Passive Aligned
by Tail vane
Cut-in Wind Speed
3 m/s Rate RPM 25 - 300
Rotor Diameter
> 7 m Tower Height 12 – 40 m
Number of Blades
3 Weight Minimum 7540 kg
Collection of
Windmills or
Solar Array
Voltage Regulation
Transformer To
Grid Voltage Grid Bus
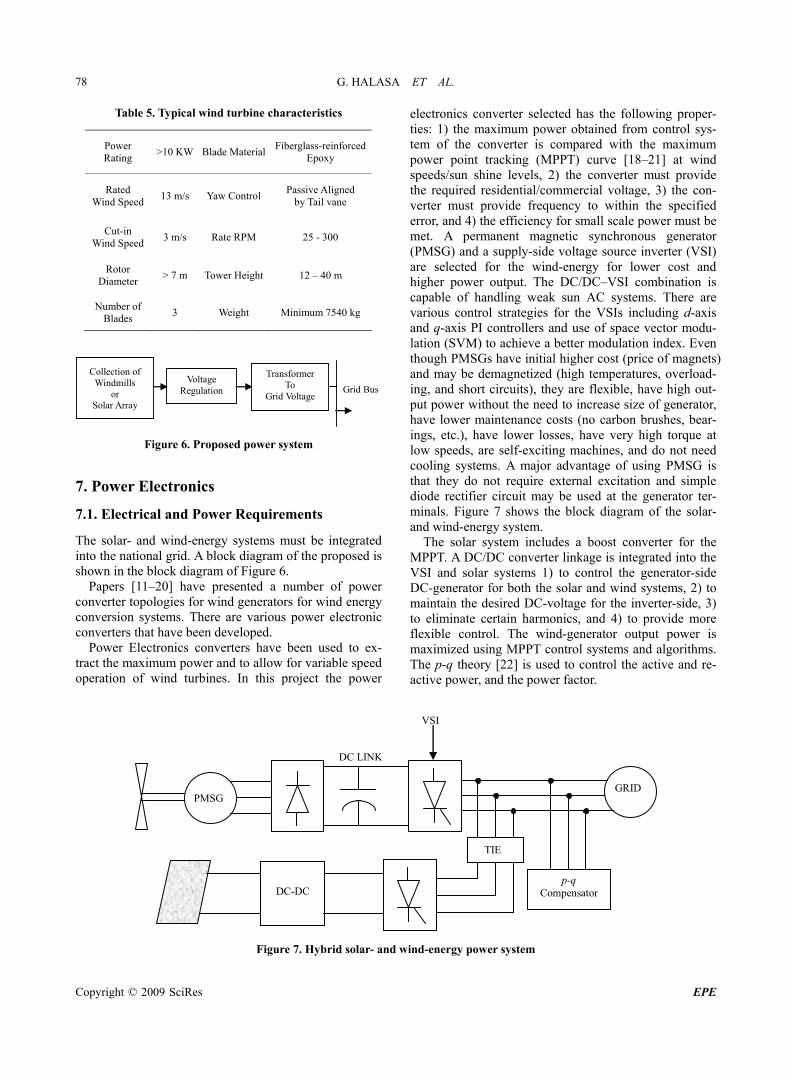
Figure 6. Proposed power system
er Electronics
Requirements
tegrated
mber of power co
been used to ex-tra
7. Pow
7.1. Electrical and Power
The solar- and wind-energy systems must be ininto the national grid. A block diagram of the proposed is shown in the block diagram of Figure 6.
Papers [11–20] have presented a nunverter topologies for wind generators for wind energy
conversion systems. There are various power electronic converters that have been developed.
Power Electronics converters havect the maximum power and to allow for variable speed
operation of wind turbines. In this project the power
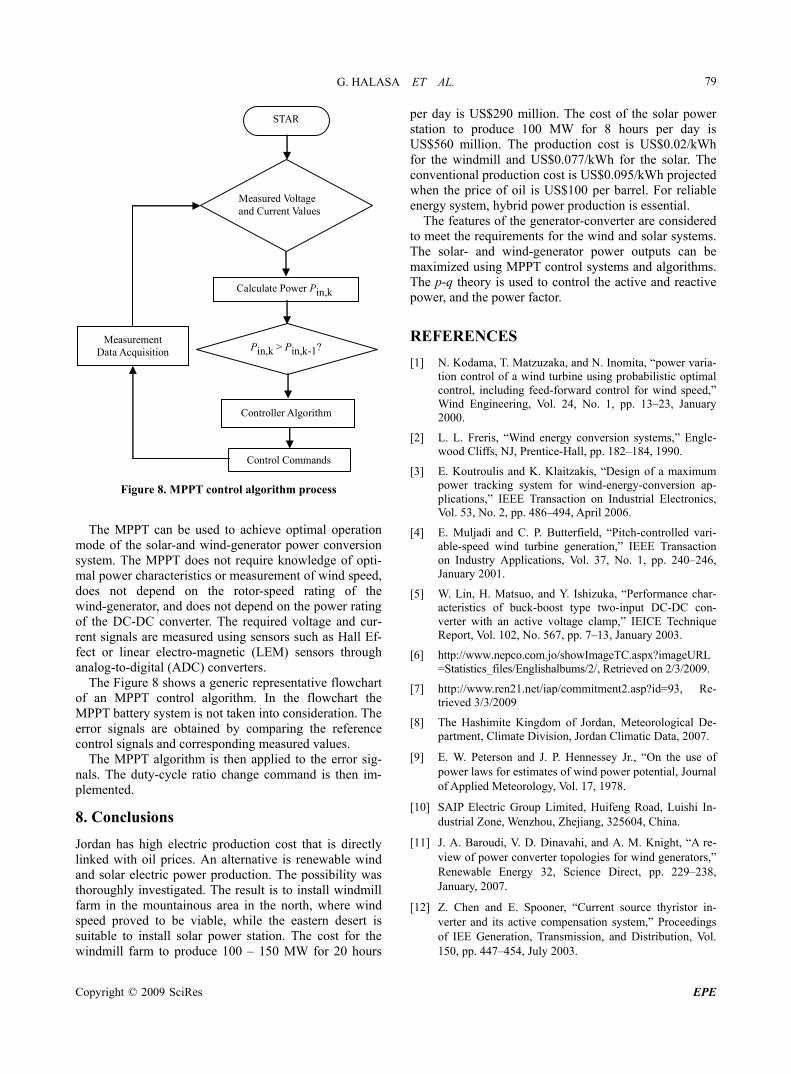
electronics converter selected has the following proper-ties: 1) the maximum power obtained from control sys-tem of the converter is compared with the maximum power point tracking (MPPT) curve [18–21] at wind speeds/sun shine levels, 2) the converter must provide the required residential/commercial voltage, 3) the con-verter must provide frequency to within the specified error, and 4) the efficiency for small scale power must be met. A permanent magnetic synchronous generator (PMSG) and a supply-side voltage source inverter (VSI) are selected for the wind-energy for lower cost and higher power output. The DC/DC–VSI combination is capable of handling weak sun AC systems. There are various control strategies for the VSIs including d-axis and q-axis PI controllers and use of space vector modu-lation (SVM) to achieve a better modulation index. Even though PMSGs have initial higher cost (price of magnets) and may be demagnetized (high temperatures, overload-ing, and short circuits), they are flexible, have high out-put power without the need to increase size of generator, have lower maintenance costs (no carbon brushes, bear-ings, etc.), have lower losses, have very high torque at low speeds, are self-exciting machines, and do not need cooling systems. A major advantage of using PMSG is that they do not require external excitation and simple diode rectifier circuit may be used at the generator ter-minals. Figure 7 shows the block diagram of the solar- and wind-energy system.
The solar system includes a boost converter for the MPPT. A DC/DC converter linkage is integrated into the VSI and solar systems 1) to control the generator-side DC-generator for both the solar and wind systems, 2) to maintain the desired DC-voltage for the inverter-side, 3) to eliminate certain harmonics, and 4) to provide more flexible control. The wind-generator output power is maximized using MPPT control systems and algorithms. The p-q theory [22] is used to control the active and re-active power, and the power factor.
PMSG GRID
DC LINK
VSI
DC-DC
TIE
p-q Compensator
Figure 7. Hybrid solar- and wind-energy power system
Copyright © 2009 SciRes EPE
G. HALASA ET AL. 79
Measured Voltage and Current Values
Calculate Power Pin,k
Pin,k > Pin,k-1?
Controller Algorithm
Control Commands
Measurement Data Acquisition
STAR
Win
Figure 8. MPPT control algorithm process
The MPPT can be used to achieve optimal operatio
sions
ctric production cost that is directly
on. The cost of the solar power
[1] N. Kodama, T. Matzuzaka, and N. Inomita, “power varia-ind turbine using probabilistic optimal
feed-forward control for wind speed,”
troulis and K. Klaitzakis, “Design of a maximum
Re-
. Hennessey Jr., “On the use of
. Knight, “A re-
–238,
ion, Transmission, and Distribution, Vol. 150, pp. 447–454, July 2003.
n V
mode of the solar-and wind-generator power conversion system. The MPPT does not require knowledge of opti-mal power characteristics or measurement of wind speed, does not depend on the rotor-speed rating of the wind-generator, and does not depend on the power rating of the DC-DC converter. The required voltage and cur-rent signals are measured using sensors such as Hall Ef-fect or linear electro-magnetic (LEM) sensors through analog-to-digital (ADC) converters.
The Figure 8 shows a generic representative flowchart of an MPPT control algorithm. In the flowchart the MPPT battery system is not taken into consideration. The error signals are obtained by comparing the reference control signals and corresponding measured values.
The MPPT algorithm is then applied to the error sig-nals. The duty-cycle ratio change command is then im-plemented.
8. Conclu
Jordan has high elelinked with oil prices. An alternative is renewable wind and solar electric power production. The possibility was thoroughly investigated. The result is to install windmill farm in the mountainous area in the north, where wind speed proved to be viable, while the eastern desert is suitable to install solar power station. The cost for the windmill farm to produce 100 – 150 MW for 20 hours
station to produce 100 MW for 8 hours per day is US$560 million. The production cost is US$0.02/kWh for the windmill and US$0.077/kWh for the solar. The conventional production cost is US$0.095/kWh projected when the price of oil is US$100 per barrel. For reliable energy system, hybrid power production is essential.
The features of the generator-converter are considered to meet the requirements for the wind and solar systems. The solar- and wind-generator power outputs can be m
per day is US$290 milli
aximized using MPPT control systems and algorithms. The p-q theory is used to control the active and reactive power, and the power factor.
REFERENCES
tion control of a wcontrol, including
d Engineering, Vol. 24, No. 1, pp. 13–23, January2000.
[2] L. L. Freris, “Wind energy conversion systems,” Engle-wood Cliffs, NJ, Prentice-Hall, pp. 182–184, 1990.
[3] E. Koupower tracking system for wind-energy-conversion ap-plications,” IEEE Transaction on Industrial Electronics,
ol. 53, No. 2, pp. 486–494, April 2006.
[4] E. Muljadi and C. P. Butterfield, “Pitch-controlled vari-able-speed wind turbine generation,” IEEE Transaction on Industry Applications, Vol. 37, No. 1, pp. 240–246, January 2001.
[5] W. Lin, H. Matsuo, and Y. Ishizuka, “Performance char-acteristics of buck-boost type two-input DC-DC con-verter with an active voltage clamp,” IEICE Technique Report, Vol. 102, No. 567, pp. 7–13, January 2003.
[6] http://www.nepco.com.jo/showImageTC.aspx?imageURL=Statistics_files/Englishalbums/2/, Retrieved on 2/3/2009.
[7] http://www.ren21.net/iap/commitment2.asp?id=93, trieved 3/3/2009
[8] The Hashimite Kingdom of Jordan, Meteorological De-partment, Climate Division, Jordan Climatic Data, 2007.
[9] E. W. Peterson and J. Ppower laws for estimates of wind power potential, Journal of Applied Meteorology, Vol. 17, 1978.
[10] SAIP Electric Group Limited, Huifeng Road, Luishi In-dustrial Zone, Wenzhou, Zhejiang, 325604, China.
[11] J. A. Baroudi, V. D. Dinavahi, and A. Mview of power converter topologies for wind generators,” Renewable Energy 32, Science Direct, pp. 229January, 2007.
[12] Z. Chen and E. Spooner, “Current source thyristor in-verter and its active compensation system,” Proceedings of IEE Generat
Copyright © 2009 SciRes EPE

G. HALASA ET AL. 80
[13] K. Tan and S. Islam, “Optimum control strategies in en-ergy conversion of PSMG wind turbine system without mechanical sensors,” IEEE Transaction on Energy Con-version, Vol. 10, pp. 392–399, 2004.
[14] Z. Chen and E. Spooner, “Grid power quality with vari-able speed wind turbines,” IEEE Transaction on Energy Conversion, Vol. 16, 2001, pp. 148–154.
[15] Z. Chen and E. Spooner, “Wind turbine power converters:
r converter
performance of small-scaled wind power gene
A comparative study,” Proceedings of IEE Seventh Inter-national Conference on Power Electronics and Variable Speed Drives, pp. 471–476, September 1998.
[16] S. H. Song, S. Kang, and N. Hahm, “Implementation and control of grid connected AC-DC-AC powe
for variable speed wind energy conversion system,” Pro-ceedings of IEEE AIPEC’03, Vol. 1, pp. 154–158, Febru-ary 2003.
[17] Y. Higuchi, N. Yamamura, M. Ishida, and T. Hori, “An improvement of
rating with permanent magnetic type synchronous generator,” Proceedings of IEEE IECON’00, Vol. 2, pp. 1037–1043, October 2000.
Copyright © 2009 SciRes EPE