Embed Size (px)
Citation preview

Wind Power Update
Larry Flowers – NREL
January 15, 2002
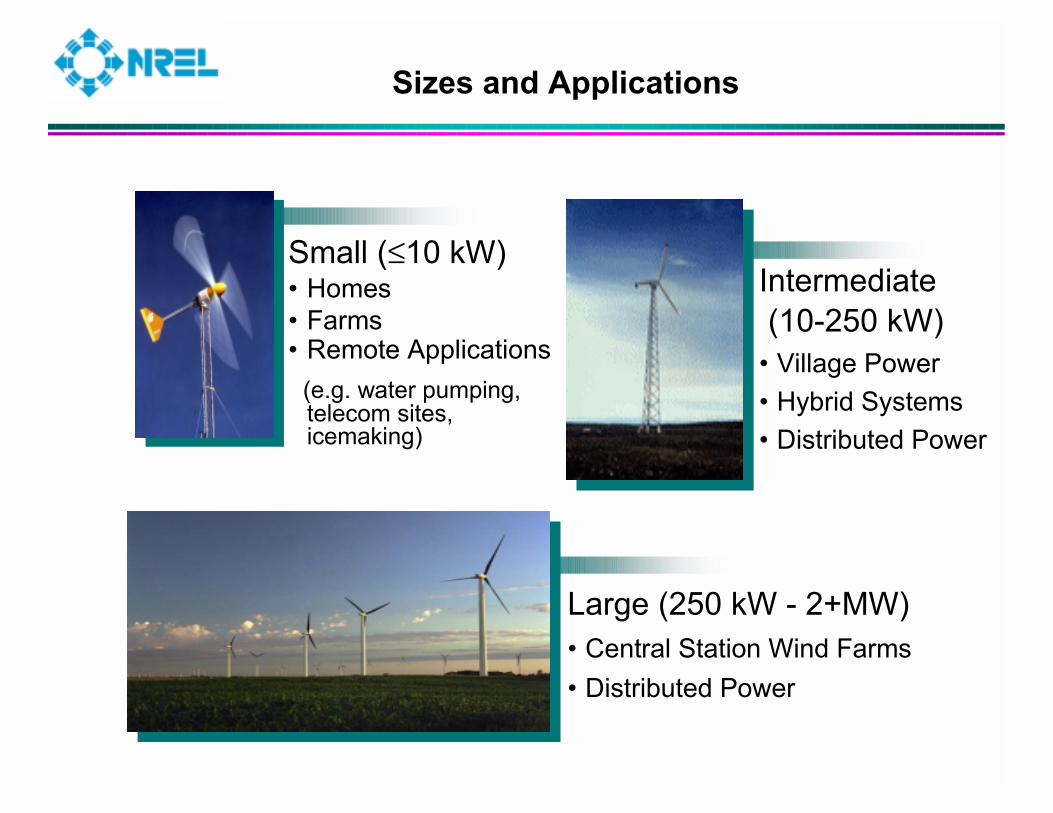
Sizes and Applications
Small (≤10 kW)• Homes• Farms• Remote Applications
(e.g. water pumping, telecom sites, icemaking)
Intermediate(10-250 kW)
• Village Power• Hybrid Systems• Distributed Power
Large (250 kW - 2+MW)• Central Station Wind Farms• Distributed Power
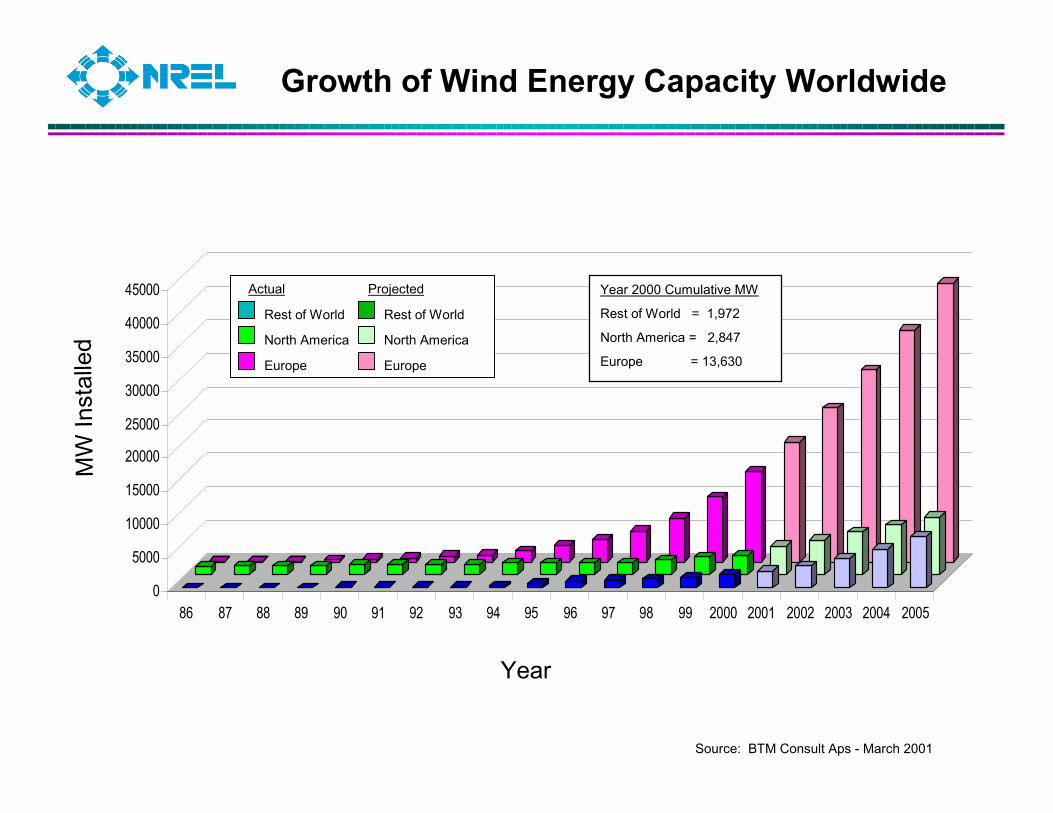
Growth of Wind Energy Capacity Worldwide
0
5000
10000
15000
20000
25000
30000
35000
40000
45000
86 87 88 89 90 91 92 93 94 95 96 97 98 99 2000 2001 2002 2003 2004 2005
MW
Inst
alle
d
Year
Year 2000 Cumulative MW
Rest of World = 1,972
North America = 2,847
Europe = 13,630
Source: BTM Consult Aps - March 2001
Actual Projected
Rest of World Rest of World
North America North America
Europe Europe

International Market Trends
• $5 billion/year in sales
• Fastest growing electric technology: 29% worldwide
• 45% world market from Danish companies
• European future in off-shore open installations
• 86 MW in 2000
• Growing to 2400 MW’s in 2005*
*Source BTM Consult ApS - March 2001
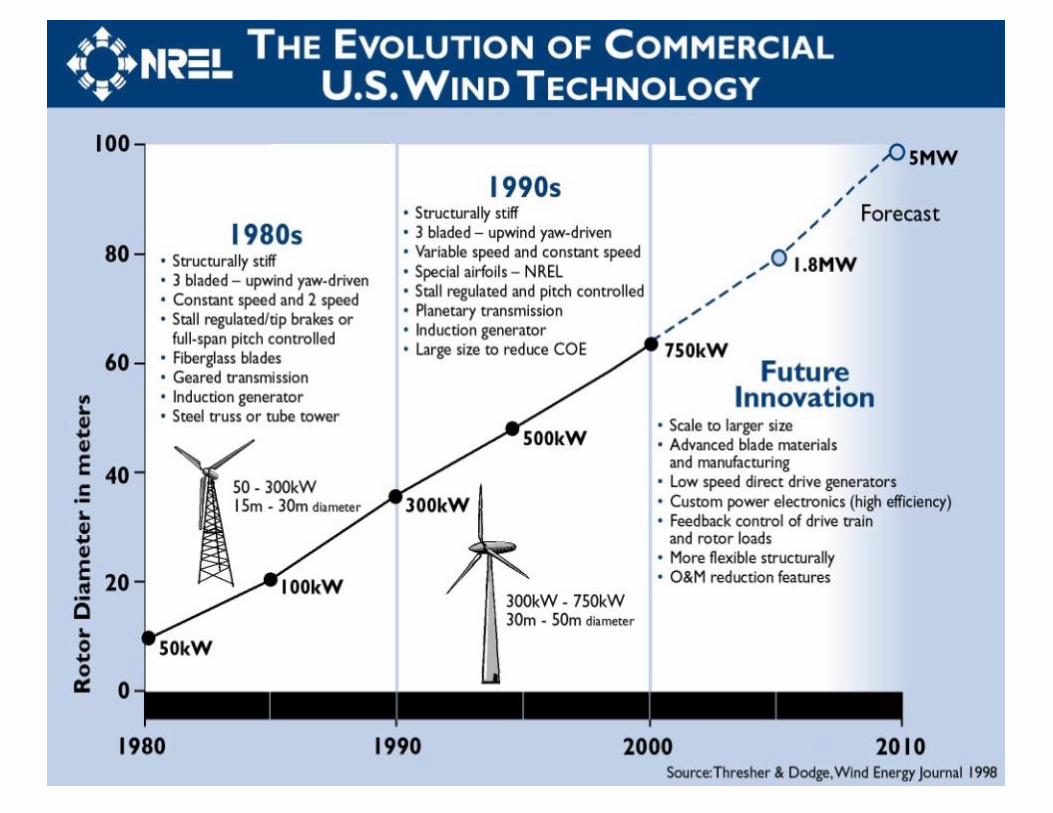

Cost of Energy Trend
1979: 40 cents/kWh
• Increased Turbine Size
• R&D Advances• Manufacturing
Improvements
NSP 107 MW Lake Benton wind farm4 cents/kWh (unsubsidized)
2004: 3 - 5 cents/kWh
2000:4 - 6 cents/kWh

A Maturing Wind Technology
� Technology has matured over 25 years of learning experiences
� Availabilities reported of 98-99%� Certification to international
standards helps to avoid “show stoppers”
� Performance and cost have dramatically improved� hardware issues are being promptly
addressed
� New hardware is being developed on multiple fronts:� higher productivity and lower costs� larger sized for both land and off-
shore installations� tailored designs for high capacity
factor, low wind speed and extreme weather conditions

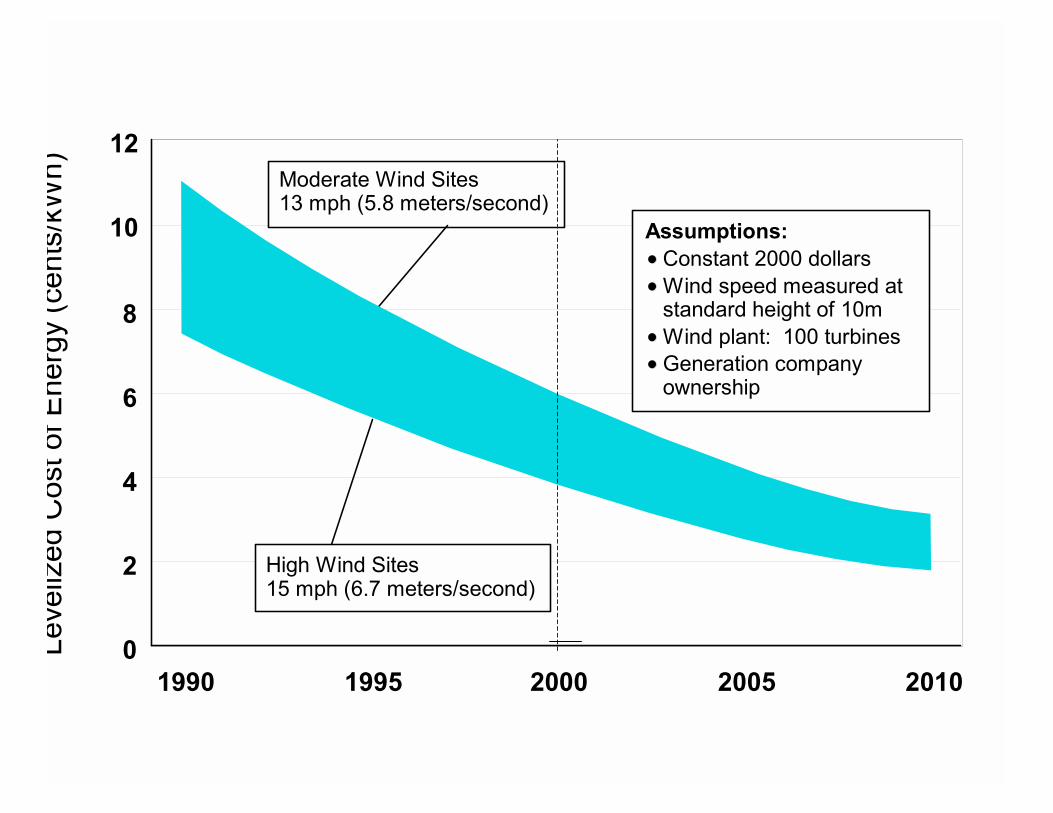
Leve
lized
Cos
t of E
nerg
y (c
ents
/kW
h)
1990 1995 2000 2005 20100
2
4
6
8
10
12
Assumptions:Constant 2000 dollarsWind speed measured at standard height of 10mWind plant: 100 turbinesGeneration company ownership
Moderate Wind Sites13 mph (5.8 meters/second)
High Wind Sites15 mph (6.7 meters/second)
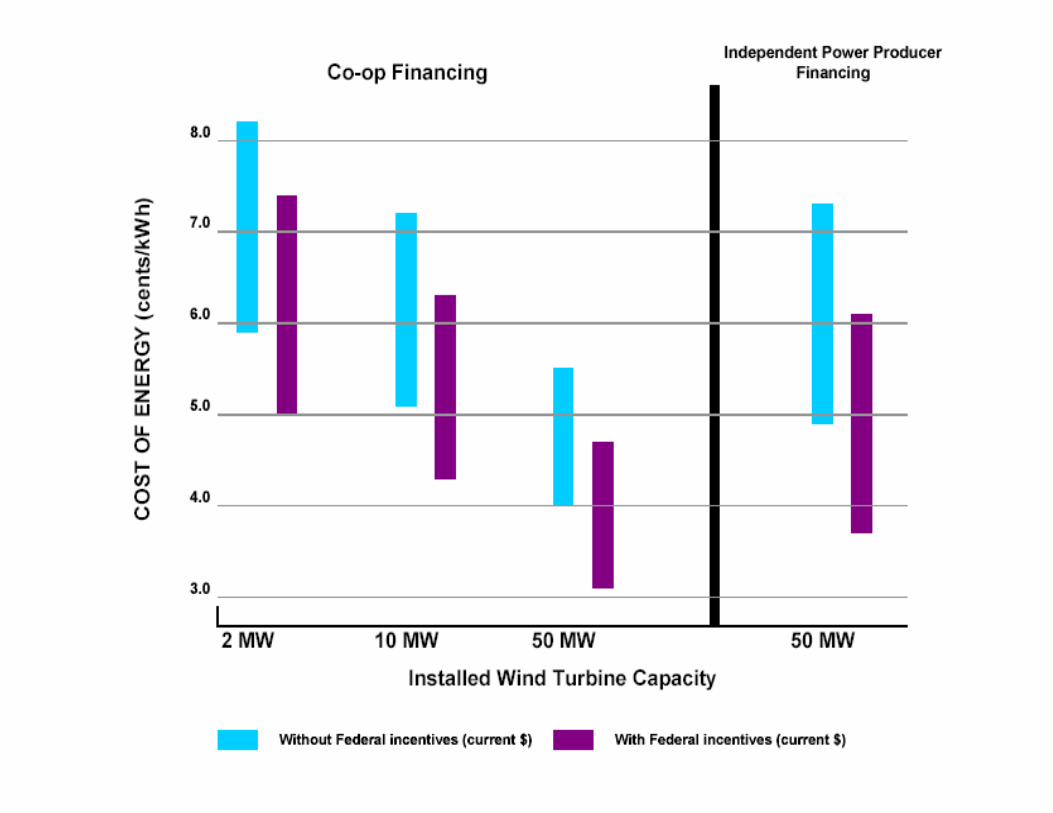
Cost of Energy for Large Wind Farms
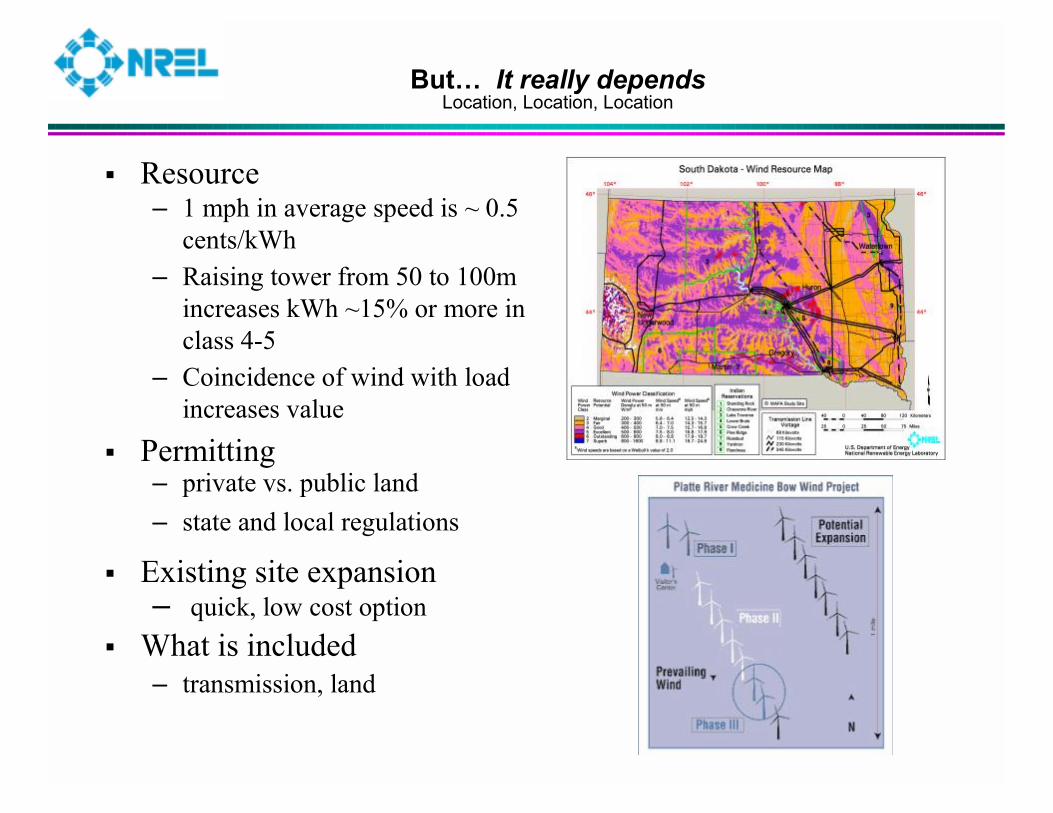
But… It really dependsLocation, Location, Location
� Resource– 1 mph in average speed is ~ 0.5
cents/kWh– Raising tower from 50 to 100m
increases kWh ~15% or more in class 4-5
– Coincidence of wind with load increases value
� Permitting– private vs. public land– state and local regulations
� Existing site expansion– quick, low cost option
� What is included– transmission, land

Plant and Turbine Size
� Spread “nearly fixed” costs: permitting, crane, legal and other soft costs
� Volume discount from manufacturer
� Economies of scale may bring O&M to under 0.2 cents/kWh
� Next generation of 1.2-2.0 MW machines are 10-15% cheaper/kW
Finances and Incentives
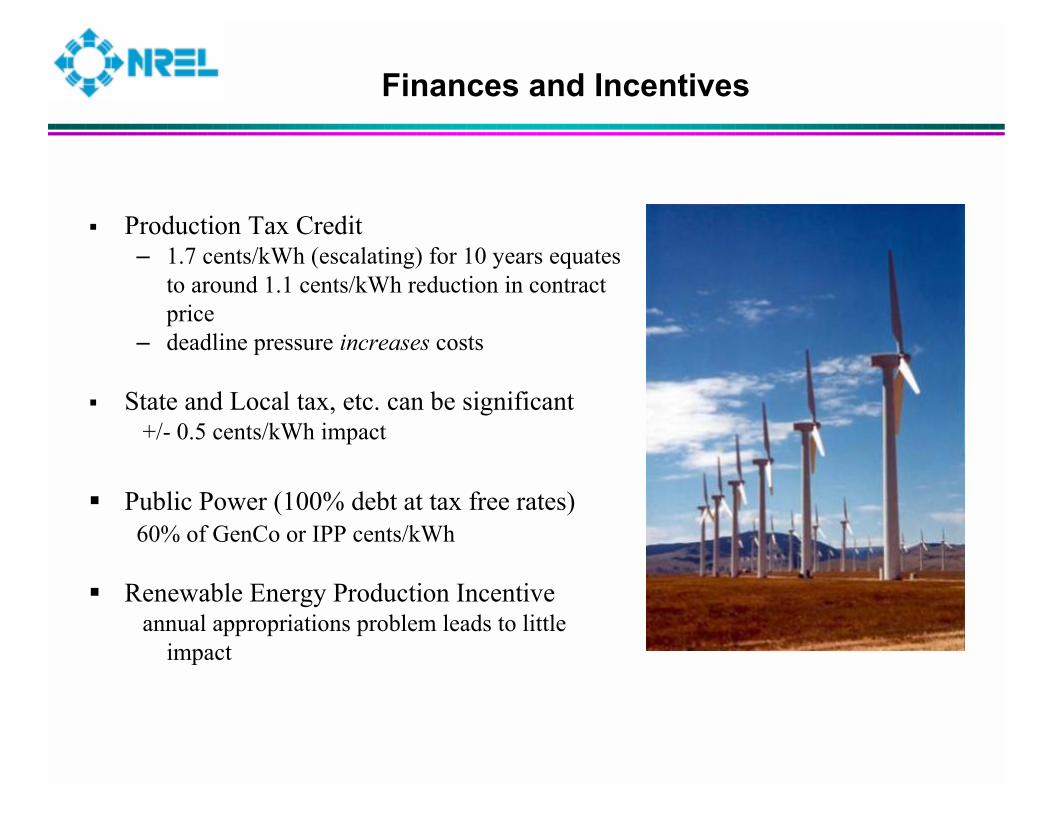
� Production Tax Credit – 1.7 cents/kWh (escalating) for 10 years equates
to around 1.1 cents/kWh reduction in contract price
– deadline pressure increases costs
� State and Local tax, etc. can be significant+/- 0.5 cents/kWh impact
� Public Power (100% debt at tax free rates)60% of GenCo or IPP cents/kWh
� Renewable Energy Production Incentiveannual appropriations problem leads to little
impact
Wind Energy Value
� Fuel/Resource diversity and risk
� Intermittency– non-dispatchable (different types of
kWh)– ancillary service costs ??
� Emissions free power beginning to have additional value– green markets– emissions credits
� Reliability/capacity value

Recent Developments
• The wind industry is delivering ~3 cent/kWh contracts, including PTC for large projects
• Several large projects under developments– 300 MW Stateline (WA/OR)– 109 MW Utilicorp (KS)– 4>100 MW under development in West
Texas
• Gas price increases and the power crisis– CO: 162 MW of wind wins all-source bid on
economics alone– “wind is the lowest cost resource”– serious consideration of GW (BPA, Austin) – transmission and grid impacts to the
forefront
• RUS loan to Basin Electric for Green Pricing program in S. Dakota
• NPPD RFP for 20 MW
Conclusions
• The wind industry is delivering ~ 3 cent/kWh contracts, including PTC for large projects
• This price will likely be higher for small projects in new locations
• Value side important: but cost dominates in domestic markets today
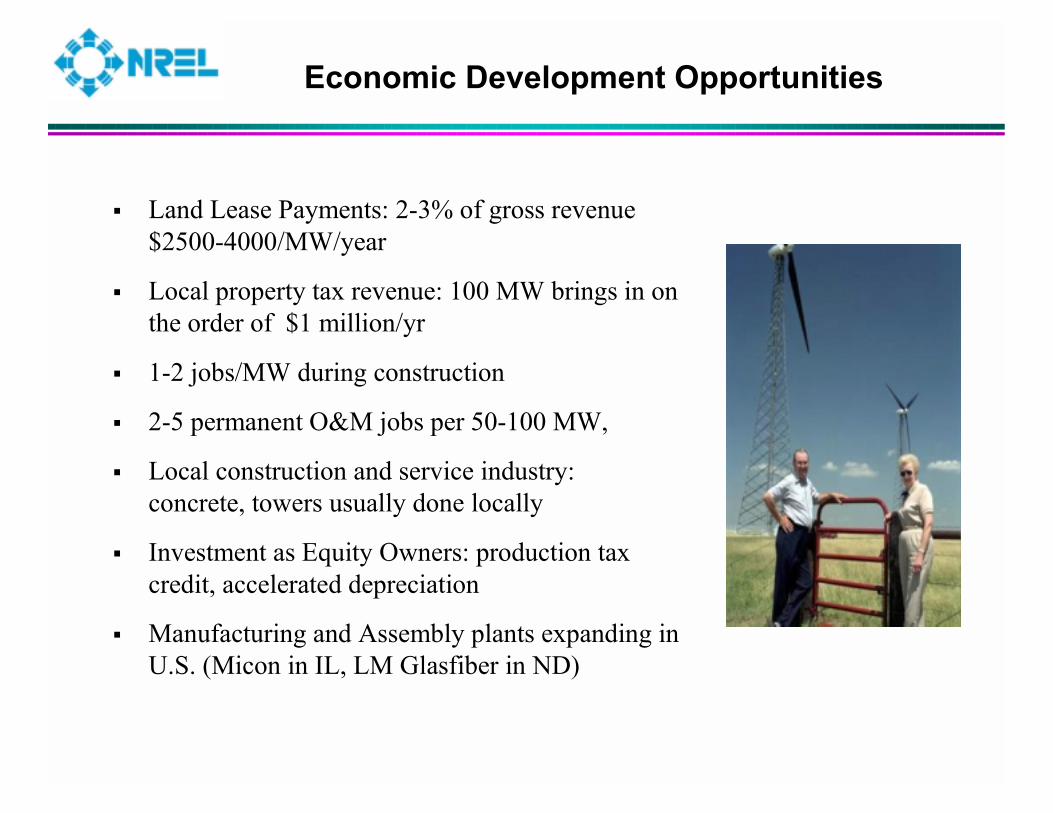
Economic Development Opportunities
� Land Lease Payments: 2-3% of gross revenue $2500-4000/MW/year
� Local property tax revenue: 100 MW brings in on the order of $1 million/yr
� 1-2 jobs/MW during construction
� 2-5 permanent O&M jobs per 50-100 MW,
� Local construction and service industry: concrete, towers usually done locally
� Investment as Equity Owners: production tax credit, accelerated depreciation
� Manufacturing and Assembly plants expanding in U.S. (Micon in IL, LM Glasfiber in ND)
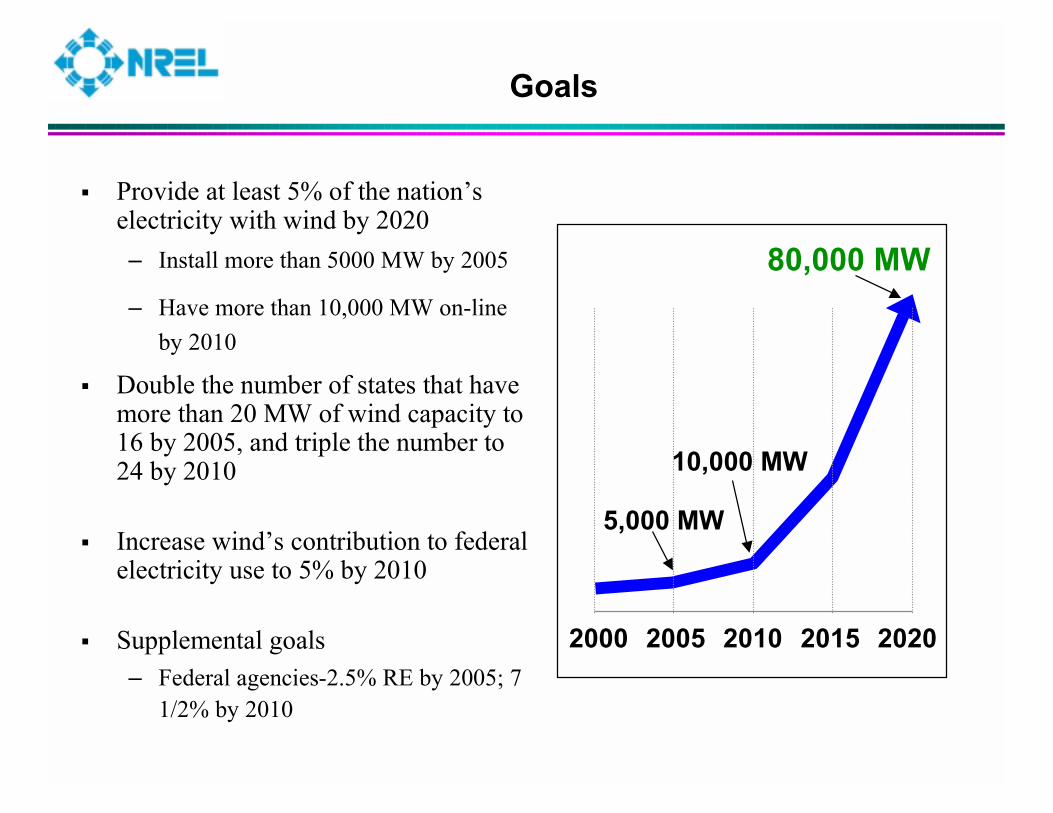
Goals
� Provide at least 5% of the nation’s electricity with wind by 2020– Install more than 5000 MW by 2005
– Have more than 10,000 MW on-line by 2010
� Double the number of states that have more than 20 MW of wind capacity to 16 by 2005, and triple the number to 24 by 2010
� Increase wind’s contribution to federal electricity use to 5% by 2010
� Supplemental goals– Federal agencies-2.5% RE by 2005; 7
1/2% by 2010
202020102000 2005
5,000 MW
10,000 MW
80,000 MW
2015
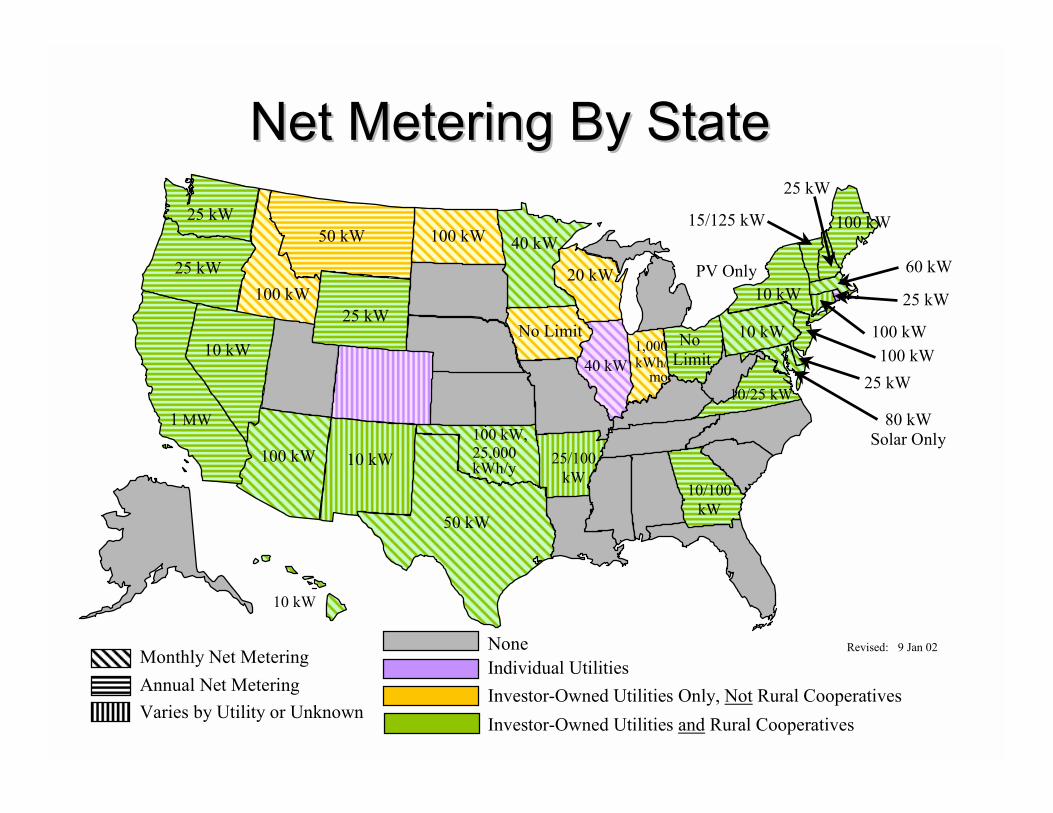
Net Metering By StateNet Metering By State
Revised: 9 Jan 02
100 kW
50 kW
1 MW
100 kW
No Limit
100 kW
10 kW100 kW,25,000kWh/y
40 kW
20 kW100 kW
1,000 kWh/
mo
60 kW
10 kW
10 kWPV Only
NoneIndividual UtilitiesInvestor-Owned Utilities Only, Not Rural CooperativesInvestor-Owned Utilities and Rural Cooperatives
25 kW 15/125 kW
25 kW
10/25 kW
50 kW
25 kW
NoLimit
25 kW
100 kW100 kW
25 kW
80 kWSolar Only
40 kW
10 kW
Monthly Net MeteringAnnual Net MeteringVaries by Utility or Unknown
25 kW
25/100kW
10/100kW
10 kW

1987 2000
Comparison of Digital Wind Map from 1987 U.S. Wind Atlasand New (2000) High-Resolution (1-km2) Wind Map
North and South Dakota