Embed Size (px)
Citation preview

Wind Power Based Hydrogen
Production - Kökar Island
Case Study
Helka Martinoff
Master’s Thesis
University of Jyväskylä, Department of Chemistry
Masters Degree Programme in Renewable Energy
17.12.2007

2
ABSTRACT
Wind power is currently one of the fastest growing energy sources in the world
and Finland has good potential of wind power partly because of its long
coastline. If wind power is combined with energy storage system, wind power
will also be a realistic energy source in isolated energy systems. This paper
focuses on wind hydrogen system, where hydrogen is the storage medium. The
components required in wind hydrogen system, which uses electrolyser to form
hydrogen from water and fuel cell to form electricity from hydrogen, are
discussed. Also hydrogen storage with external hydrogen load and fuel cell
vehicles are introduced. Self-sufficiency with wind hydrogen system of Kökar
island on the west coast of Finland was examined in the case study, and the
sofware used in modeling was HOMER (Hybrid Optimization Model for
Electric Renewables). The results show that an island like this could be entirely
self-sufficient in terms of power with relatively competitive cost. Kökar island
could be self-sufficient with 3 MW of wind power combined with 3.000 kW
electrolyser, 10.000 kg hydrogen storage and 400 kW fuel cell. Economical
profitability of this system is directly proportional to the distance of existing
grid.
3
1 INTRODUCTION .................................................................................................. 5
2 WIND ENERGY PRODUCTION......................................................................... 7
2.1 GENERAL ........................................................................................................... 7
2.2 WIND SPEED DISTRIBUTION................................................................................ 8
2.3 OPERATION CHARACTERISTICS........................................................................ 10
2.4 WIND TURBINES............................................................................................... 11
2.5 THE LOSS OF VALUE OF WIND ENERGY AT HIGH PENETRATION......................... 12
3 ENERGY CONVERSION INTO H2 .................................................................. 14
3.1 GENERAL ......................................................................................................... 14
3.2 ELECTROLYZER ............................................................................................... 15
3.2.1 Alkaline Electrolyzer .............................................................................. 16
4 H2 STORAGE ....................................................................................................... 18
4.1 COMPRESSED HYDROGEN ................................................................................ 18
4.2 LIQUID HYDROGEN.......................................................................................... 18
4.3 METAL HYBRIDES ........................................................................................... 19
5 H2 USE IN A FUEL CELL .................................................................................. 20
5.1 FUEL CELL ....................................................................................................... 20
5.1.1 Fuel cells in general ............................................................................... 20
5.1.2 Fuel cell types ......................................................................................... 22
5.1.3 Bipolar plates.......................................................................................... 24
5.2 PEM FUEL CELL .............................................................................................. 25
5.3 SOFC .............................................................................................................. 26
6 SYSTEM INTEGRATION AND CONTROL ................................................... 29
6.1 WIND HYDROGEN SYSTEM CONCEPT .............................................................. 30
6.2 SHORT-TERM STORAGE .................................................................................... 32
6.3 DC-DC CONVERTERS...................................................................................... 34
6.3.1 Buck converter ........................................................................................ 35
6.3.2 Boost controller ...................................................................................... 35
6.4 ELECTROLYZER ............................................................................................... 36

4
6.5 PEMFC ........................................................................................................... 38
6.6 DESIGN TOOLS FOR RE SYSTEMS ..................................................................... 40
7 FUEL CELL VEHICLES .................................................................................... 41
7.1 DIRECT-HYDROGEN FUEL CELL VEHICLE MODEL ............................................. 42
7.2 FUEL CELL VEHICLE CHALLENGES ................................................................... 44
8 CASE STUDY: KÖKAR ISLAND...................................................................... 46
8.1 STAND-ALONE SYSTEM DESCRIPTION............................................................... 47
8.2 COMPONENT SIZING ......................................................................................... 48
8.3 RESULTS .......................................................................................................... 50
9 CONCLUSIONS................................................................................................... 54
ACKNOWLEDGEMENT ........................................................................................... 55
REFERENCES ............................................................................................................. 56
APPENDIX I ................................................................................................................. 61
APPENDIX II ............................................................................................................... 66
APPENDIX III .............................................................................................................. 72
5
1 INTRODUCTION
Renewable means of producing and storing electricity are expected to be
increasingly important in the future, because fossil fuel supplies are expected to
be less available, more expensive and of increasing environmental concern. The
main concern in using renewable sources is their unpredictable nature. The
electricity production can not be adjusted with load demand and, thus, energy
storage should be added to solve the problem. Fossil fuels currently supply
most of the world’s energy needs, and traditionally the ideal energy storing has
been realized by storing fossil and biofuels.
Often other energy sources have been used side by side renewable energy
systems to smooth out the intermittent supply. For example, a diesel generator
is supplying the load in case of insufficient output of a wind turbine. In cases
like this, however, the excess power of the wind turbine is not exploited.
By connecting wind turbine to hydrogen storage system the excess energy from
the wind is converted to hydrogen, and when the wind power is insufficient,
the hydrogen is utilized in power production to meet the load demand. The
hydrogen can also be used in other applications, such as transportation. Finland
has a large potential of wind power, especially in coast line where the average
wind speed is about 7 m/s (NASA). Therefore this study focuses on combining
wind and hydrogen systems. The the basic wind power parameters are
introduced in Chapter 2.
This study introduces applications needed in wind hydrogen system, such as
fuel cell and electrolyser. Also connections and operation of these components
is studied.

6
Fuel cell vehicles are also in consideration. The stand-alone system in this study
produces hydrogen, and fuel cell vehicles form the external hydrogen load. Fuel
cell vehicles are a clean and sustainable alternative for today’s cars using fossil
fuels. Their structure and working principles are introduced in Chapter 7.
A case study is introduced in Chapter 8. It considers the island Kökar in Åland
archipelago, which has a population of 320 and already an existing 500 kW
wind turbine. The feasibility to attach this kind of hydrogen system to the
existing wind turbine is studied using the Hybrid Optimization Model for Electric
Renewables (HOMER) software.
7
2 WIND ENERGY PRODUCTION
Wind energy is the kinetic energy of moving air. The amount of available
energy depends mainly on wind speed, but is also affected slightly by the
density of the air. For any wind turbine, the power and energy output increases
as the wind speed increases. Wind speed increases with height above the
ground, so wind turbines are usually mounted on tall towers. In the next
chapters basic parameters and working principles of wind power are
introduced.
2.1 General
The power in the wind can be extracted by allowing it to blow past moving
wings that exert torque on a rotor. The amount of power transferred is directly
proportional to the density of the air, the swept area of the rotor, and the cube
of the wind speed:
3
21 AVP ρ= , (1)
where ρ is the air density (kg/m3), A is the rotor swept area (m2) and V is the
wind velocity (m/s). Rotor swept area can be calculated from A= π (D/2)2,
where D is the rotor diameter (m). The air density varies with pressure and
temperature which can in some cases be described by the ideal-gas law:
pV=RT, (2)
where p is the air pressure (Pa), T is the absolute temperature (K) and R is the
gas constant for air (287 J/kgK).
8
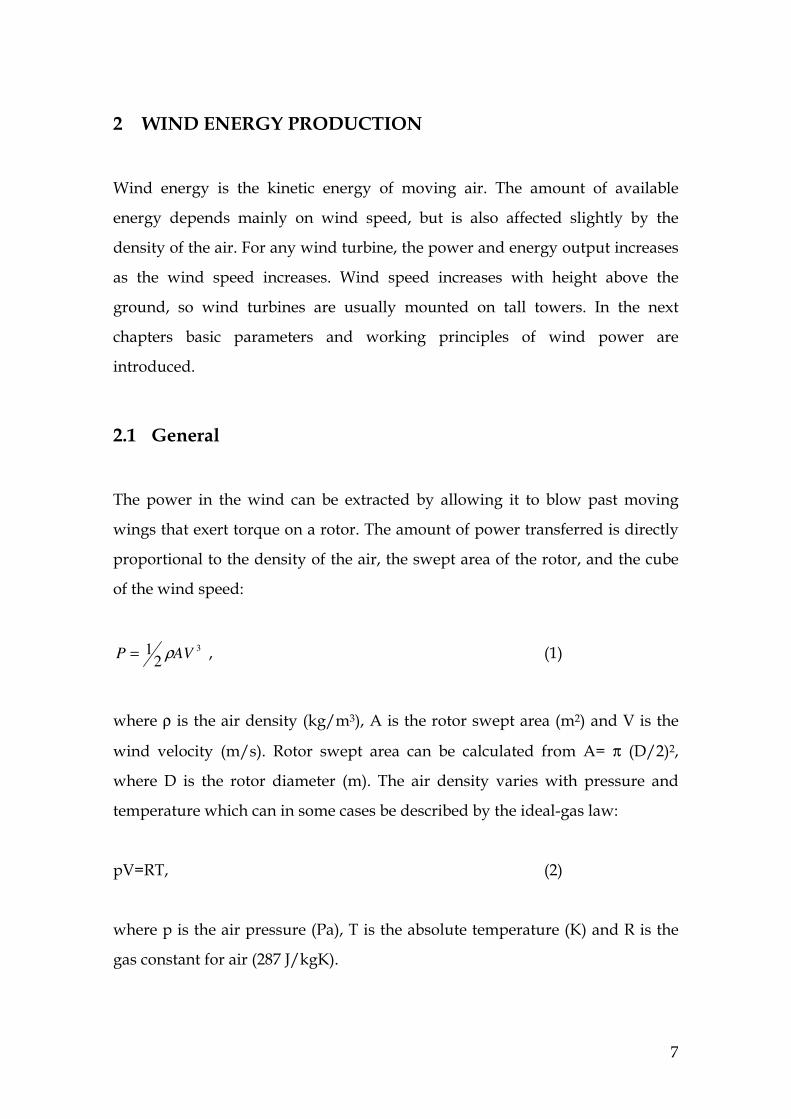
Theoretically, if all the kinetic energy (100%) in the wind is captured, the wind
would stop and the turbine wouldn’t capture any energy. The other opposite is
that if the wind speed doesn’t change at all, it would flow throught the blades
and again no energy is captured. The maximum power in the wind that can
theoretically be extracted is given by the Betz limit and it is 16/27 (59,3%) of the
power available in the wind. The power that can be converted to electrical
power from the wind is illustrated in Figure 1. [1]
Figure 1. The relation between the total power in the wind, the usable power input and turbine power output in a typical wind turbine as a function of the wind speed.
2.2 Wind speed distribution
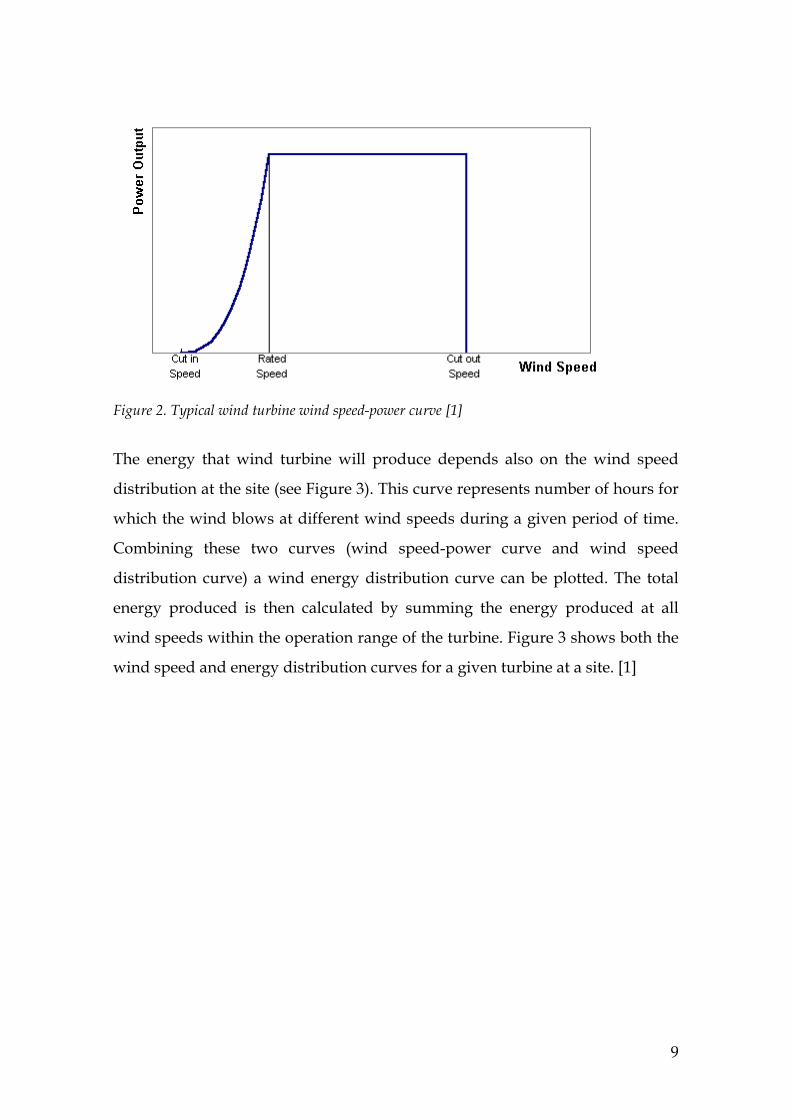
The power output of a wind turbine varies with wind speed and every turbine
has a characteristic wind speed-power curve (Figure 2). The power curve is
used to determine how much energy can be produced by a particular turbine
on a given site under given wind conditions.
9
Figure 2. Typical wind turbine wind speed-power curve [1]
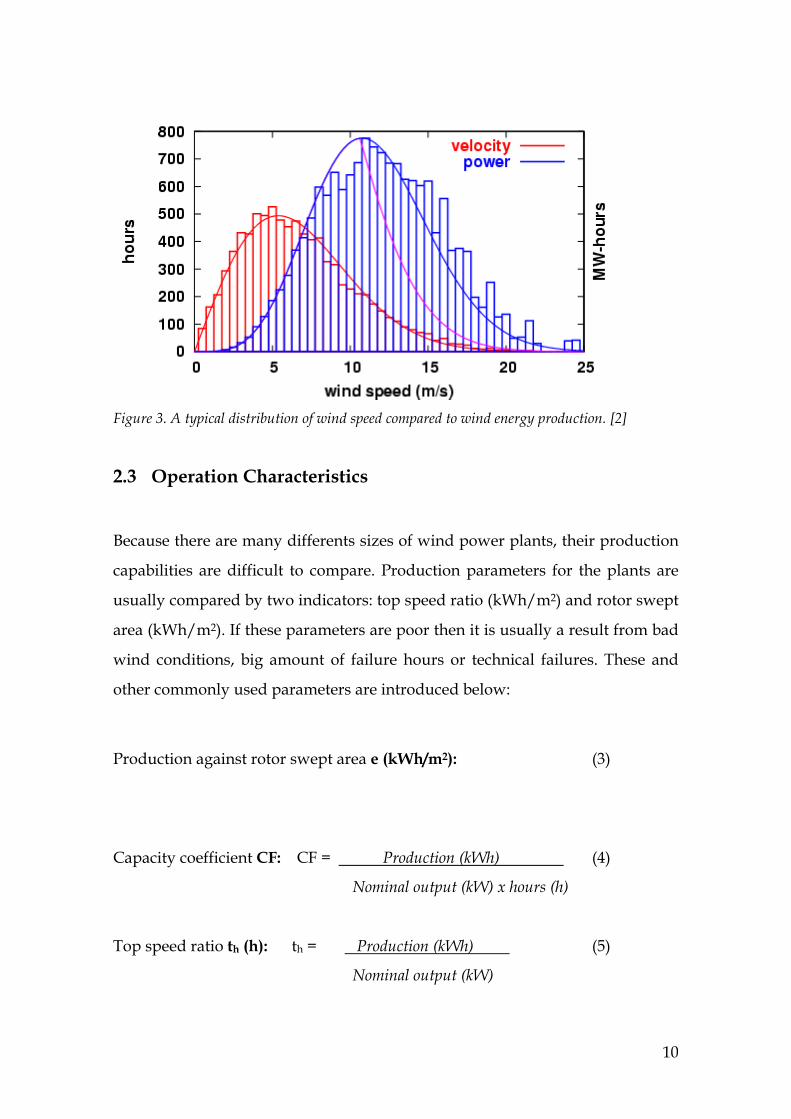
The energy that wind turbine will produce depends also on the wind speed
distribution at the site (see Figure 3). This curve represents number of hours for
which the wind blows at different wind speeds during a given period of time.
Combining these two curves (wind speed-power curve and wind speed
distribution curve) a wind energy distribution curve can be plotted. The total
energy produced is then calculated by summing the energy produced at all
wind speeds within the operation range of the turbine. Figure 3 shows both the
wind speed and energy distribution curves for a given turbine at a site. [1]
10
Figure 3. A typical distribution of wind speed compared to wind energy production. [2]
2.3 Operation Characteristics
Because there are many differents sizes of wind power plants, their production
capabilities are difficult to compare. Production parameters for the plants are
usually compared by two indicators: top speed ratio (kWh/m2) and rotor swept
area (kWh/m2). If these parameters are poor then it is usually a result from bad
wind conditions, big amount of failure hours or technical failures. These and
other commonly used parameters are introduced below:
Production against rotor swept area e (kWh/m2): (3)
Capacity coefficient CF: CF = Production (kWh) (4)
Nominal output (kW) x hours (h)
Top speed ratio th (h): th = Production (kWh) (5)
Nominal output (kW)
11
Failure time (h): The time, when wind power plant has operation break due to
maintenance, failure, transient disturbance or other stop. The normal operation
of wind power plant includes times, when wind speed is below cut-in speed (3-
5 m/s) or over storm-limit (20-25 m/s), or when temperature is below plant
operation temperature (-15…-30 °C). These figures are not counted on the
failure time.
Technical usability (%)Hours - (Disturbance time – electric network disturbances) (6)
Hours
Production index (%): Production against average long-term observations based
on weather station information about wind speeds.
Height Z (m): Height from earth surface to the centre of the rotor
2.4 Wind turbines
Wind energy has been used for thousands of years first in sailing boats and
later in windmills. Therefore, today there is a variety of machines that use wind
as an energy source. Modern wind turbines are electricity generating devices
and can be devided into horizontal axis and vertical axis wind turbines.
Vertical axis turbines have an axis of rotation that is vertical, and they can
exploit winds from any direction without the need to change the position of the
rotor. Horizontal axis wind turbines usually have two, three or more blades.
The three bladed wind turbines are the most common turbines manufactured
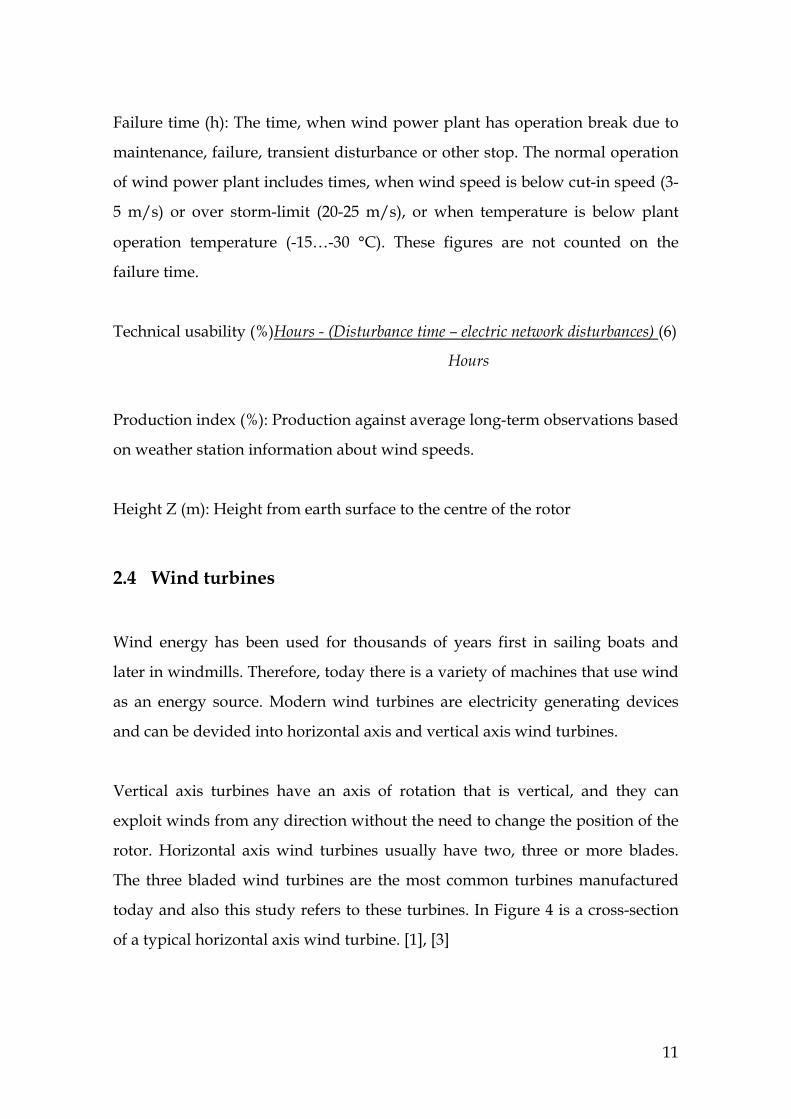
today and also this study refers to these turbines. In Figure 4 is a cross-section
of a typical horizontal axis wind turbine. [1], [3]
12
Figure 4. A cross-section of a typical horizontal axis wind turbine [3]
From the outside, horizontal axis wind turbines consist of three parts: The
tower, the blades, and a box behind the blades, called the nacelle. Inside the
nacelle is where most of the action takes place, where motion is turned into
electricity. Blades rotate around a horizontal hub that is attached to an axle that
runs into a gearbox. The gearbox increases the rotation speed for the generator,
which converts the rotational energy to electrical energy. Brake is needed to
stop rotation in case of over-speed. [1], [3]
2.5 The loss of value of wind energy at high penetration
At high penetration levels of the wind energy production the electricity
produced is greater than the load demand. Uncontrollability of wind poses
operational problems on the electricity supply system at high penetration
levels, lessening the value of wind-generated electricity extensively. Ensuring
power reliability and quality and maintaining the necessary reserve capacity
requires changes in system management, and usually demands costly grid
reinforcements. These factors reduce remarkably the value of wind energy in
high penetration levels. [4]

13
Efficiency of the wind power has been improved by new technologies and
strategies, such as forecasting, geographical dispersion, interconnections and
new materials. In spite of that, a large scale wind energy production will
ultimately require the uptake of energy storage, because of the fluctuating
nature of the wind. [4]
14
3 ENERGY CONVERSION INTO H2
In the future, wind-powered water electrolysis is envisaged as an important
source of zero-emissions hydrogen. Hydrogen systems can help to overcome
problems arising in the electric systems with high wind energy penetration and
offset the gradual reduction in value of this energy. The hydrogen produced
and stored can either be supplied to stationery fuel cells, in order to generate
power again when needed, or used for transportation. [4]
3.1 General
Hydrogen production using wind power via electrolyzer has many attractive
features. It can be stored as “energy”, which can either be converted back into
electricity by fuel cell, or used as a non-polluting fuel for other applications,
such as transport. All over the world, transportation is very dependent on fossil
fuels, so hydrogen can find its market as a clean, sustainable fuel. [4]
Using hydrogen as an energy storage medium provides a manner of storing
energy that has many advantages compared to conventional batteries that are
not appropriate for long-term energy storage because of their low energy
density, self-discharge, and leakage. The energy that is stored as hydrogen can
be retained for long periods of time and is insensitive to cycle life, temperature,
or self-discharge.
In off-grid applications, where batteries are coupled to diesel generator,
batteries supply power until their stored energy is depleted after which the
generator provides additional power while recharging the batteries. For these
off-grid applications, the fuel cell could replace most of the batteries and greatly
reduce or eliminate the need for a back-up generator. Compared to battery
storage, fuel cells used as a back-up or standby power systems can provide a

15
higher degree of utility providing longer periods of back-up power with less
installation impact at lower overall cost. [5], [6]
3.2 Electrolyzer
The decomposition of water into hydrogen and oxygen can be achieved by
passing an electric current (DC) between two electrodes separated by an
aqueous electrolyte with good ionic conductivity. The anodic and cathodic
reactions taking place there are:
Anode: 2 OH-(aq) ½O2(g) + H2O(l) + 2 e- (7)
Cathode: 2 H2O(l) + 2 e- H2(g) + 2 OH-(aq) (8)
Thus, the total reaction of splitting water is
H2O(l) + electrical energy H2(g) + ½O2(g) (9)
For this reaction to occur a minimum electric voltage must be applied to the two
electrodes. This minimum voltage can be determined by Gibbs energy for water
splitting, which is dependent on temperature. For example, to split 10 kg of
water to hydrogen and oxygen at 25°C requires 36,6 kWh energy (And fuel cell
used in case study produces 39,5 kWh energy from that same amount of
hydrogen). [7]
In alkaline solution the electrodes must be resistant to corrosion and must have
good electric conductivity and catalytic properties, as well as good structural
integrity, while the diaphragm should have low electrical resistance. This can
be achieved by using anodes based on nickel, cobalt and iron (Ni, Co, Fe),
cathodes based on nickel with a platinum activated carbon catalyst (Ni, C-Pt),
and nickel oxide (NiO) diaphragms. [8]
16
Electrolyser is the key to the functionality of a regenerative fuel cell as this must
both generate and pressurize the hydrogen to allow it to be easily stored. Water
is introduced in the anode where it is electrolytically decomposed to oxygen,
protons, and electrons. The oxygen evolves as gaseous O2 at the surface of the
electrode while the protons are driven through the membrane. The electrons
move through the external circuit. The protons combine with the electrons to
evolve into gaseous hydrogen at the cathode. Since electrolyzer is a crucial
component in storing energy as hydrogen, the technical challenge is to make it
to operate smoothly with intermittent power from renewable energy source. [5],
[8]
3.2.1 Alkaline Electrolyzer
In conventional alkaline water electrolyzers the electrolyte has traditionally
been aqueous potassium hydroxide (KOH), mostly with solutions of 20-30%
because of the optimal conductivity and remarkable corrosion resistance of
stainless steel in this concentration range. The typical operation temperatures
and pressures of these electrolyzers are 70-100°C and 1-30 bar, respectively. [8]
The most common alkaline electrolyzers manufactured today have a bipolar
design, where the individual cells are linked electrically and geometrically in
series. In monopolar design the electrodes are either negative or positive with
parallel electrical connection of the individual cells. Bipolar electrolyzer stacks
are more compact than monopolar systems, and the advantage of this is that it
gives shorter current paths in the electrical wires and electrodes. This reduces
the losses due to internal ohmic resistance of electrolyte and, therefore,
increases the electrolyser efficiency. Bipolar design has also some
disadvantages. One example is the parasitic currents that can cause corrosion
problems. Furthermore, the compactness and high pressures of the bipolar

17
electrolysers require relatively sophisticated and complex system designs,
which consequently increase the manufacturing costs. [8]
In the new advanced alkaline electrolyzers the operational cell voltage has been
reduced and the current density increased compared to conventional
electrolyzers. Reducing the cell voltage reduces the unit cost of electrical power
and thereby operation costs, while increasing current density reduces the
investment costs. However, there is a conflict of interest because the ohmic
resistance in the electrolyte increases with increasing current due to increasing
gas bubbling. [8]
18
4 H2 STORAGE
The hydrogen is produced through electrolyser. The electrolyser input power is
controlled, with respect to the energy available at the DC bus, the power line in
which wind turbine produces electricity. The H2 is temporarily stored in a
water-sealed tank of the electrolyser system. When this tank is full, the
electrolyser compressor starts automatically and sends the H2 at high pressure
through the purification and drying processes. The stored electrolytic hydrogen
can then be utilized later to produce electrical energy as per load requirement
through fuel cell.
Practical implementation of a stand-alone system needs an effective hydrogen
storage that achieves both technical and commercial success. Effective storage
should optimize cost, lifetime, installation and other factors to a degree that is
acceptable for a given application. Available methods of storing hydrogen are
as liquid hydrogen, compressed hydrogen and as metal hybrids.
4.1 Compressed Hydrogen
Compressed hydrogen needs a high-pressure tank. The energy required to
compress the hydrogen amounts to 4-15 % of the energy that the stored
hydrogen contains. High-pressure tanks are fitted to 700-1000 bar, which
reduces the volume of the tank. High pressure though causes safety issues and
requires enhanced security measures.
4.2 Liquid Hydrogen
Liquid hydrogen is usually stored at 20 K (-263 ˚C). Compressing and cooling
hydrogen into its liquid state requires considerable energy costs. This consumes
19
about 30 % of the energy that the stored hydrogen contains. Liquid hydrogen is
expensive form of storing hydrogen compared to other forms.
4.3 Metal Hybrides
Metal hybrids can incorporate hydrogen into their surface, emitting heat in the
process. When the metal hybrid vessel is heated, the hydrogen is released. By
weight, the absorbed hydrogen is only 1-2 % of the total weight of the storage,
and this is due to the high weight of metal alloys and low weight of hydrogen.
In terms of volumetric storage capacity, metal hybrid tanks store approximately
60 kg H2/m3. Some metal hybrids can absorb hydrogen 6-7 % of their weight,
but these require the unloading temperature to be at least 250 ˚C.
Hybrids offer a safe alternative to store hydrogen as they can deliver hydrogen
at constant pressure (30-60 bar) over a broad range of discharging levels. The
disadvantage of metal hybrid vessels is their mass and the lifetime of these
vessels that is directly related to the purity of hydrogen. [9], [10]
20
5 H2 USE IN A FUEL CELL
5.1 Fuel cell
Fuel cells are combined with a fuel generation device, commonly an
electrolyzer, when used as an energy storage device to create a regenerative fuel
cell system. Regenerative fuel cell system can convert electrical energy to a
storable fuel and then use this fuel in a fuel cell to provide electricity when
needed. Most common fuel cell types use hydrogen, which is generated via
electrolysis of water, as the energy storage medium. This kind of a system
provides full back-up power for extended time periods. By contrast, storage of
equivalent amounts of energy via traditional lead-acid batteries requires an
environmentally controlled room, which leads to significant quantities of lead
and acid being present in the facility and also typical loss of batteries is 1-5 % of
their energy content per hour. [5], [11]
5.1.1 Fuel cells in general
Fuel cells are electrochemical devices that convert a fuel's chemical energy
directly to electrical energy with high efficiency. Electricity is produced from
hydrogen and oxygen through an electrochemical reaction. Chemical reactions
can be the same as in batteries, but the main difference is that fuel cells produce
electricity as long as there is fuel, made by reactive chemicals, and the
electrodes are functional. As the reagents are hydrogen and oxygen, the
emissions are only water and heat. [12]
Fuel cell operates like a conventional galvanic cell with the exception that the
reactants are supplied from outside rather than forming an integral part of it. A
typical fuel cell is based on the reaction of hydrogen and oxygen to form water.
Hydrogen gas is diffused through the anode, a porous electrode with a catalyst.
21
Oxygen is diffused through the cathode that is a porous electrode impregnated
with a catalyst. The two electrodes are separated by an electrolyte. The anode
half-reaction is the oxidation:
H2(g) + 2OH-(aq) 2H2O(l) + 2e- E= -0,83 V (10)
And the cathode half-rection is the reduction:
O2(g) + 2H2O(l) + 4e- 4OH-(aq) E= +0,40 V (11)
Since the overall reaction
2H2(g) + O2(g) 2H2O(l) E= +1,23 V (12)
is exothermic as well as spontaneous, it is less favourable thermodynamically at
200°C than at 25°C, so the cell potential is lower at the higher temperature. The
flow of electrons from anode to cathode represents the direct generation of
electric power from flameless oxidation of the hydrogen fuel. [13], [14], [15]
An advantage of fuel cells is that they are expected to be highly reliable because
of the absence of moving parts. The other important advantage of fuel cells is
zero or close to zero pollution emissions: water is the only waste stream. [15]
The expected life span of the fuel cells range from 15-20 years with minimal
maintenance. Hydrogen safety is an issue, although hydrogen quickly disperses
into the environment, making it less of a fire hazard than gasoline.
Disadvantages include the high cost of fuel cells, although this is expected to
decline as fuel cells are mass-produced. [15]

22
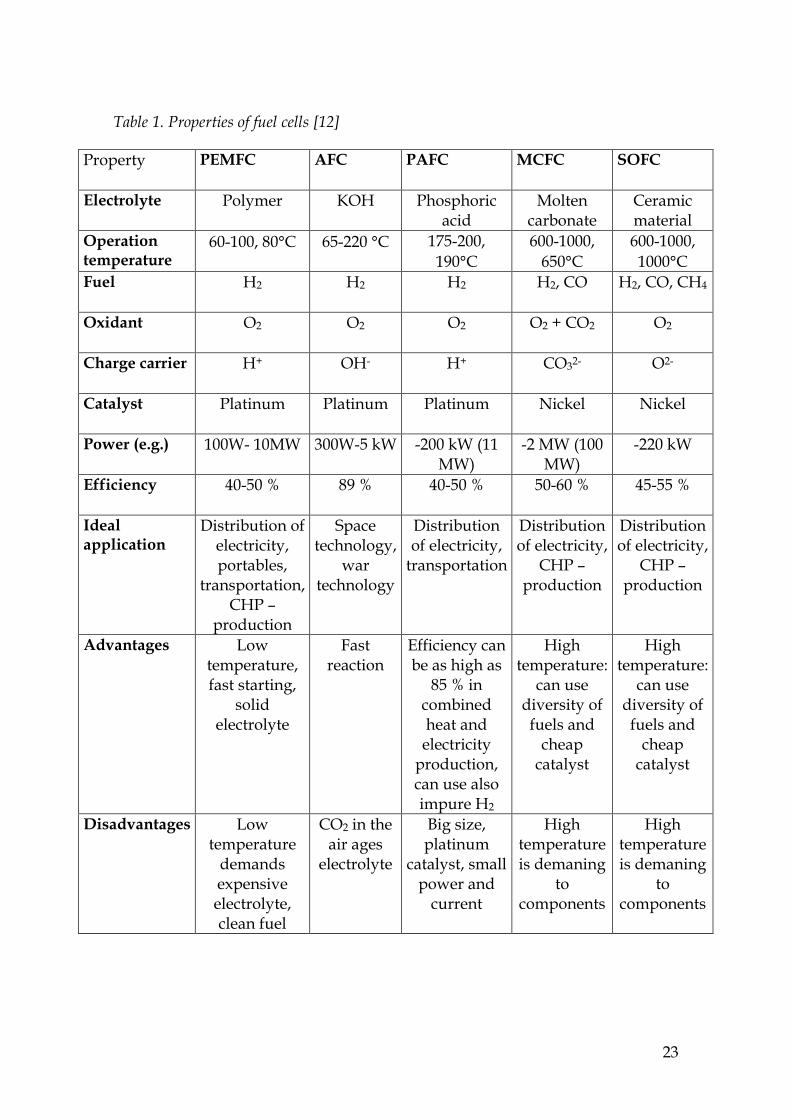
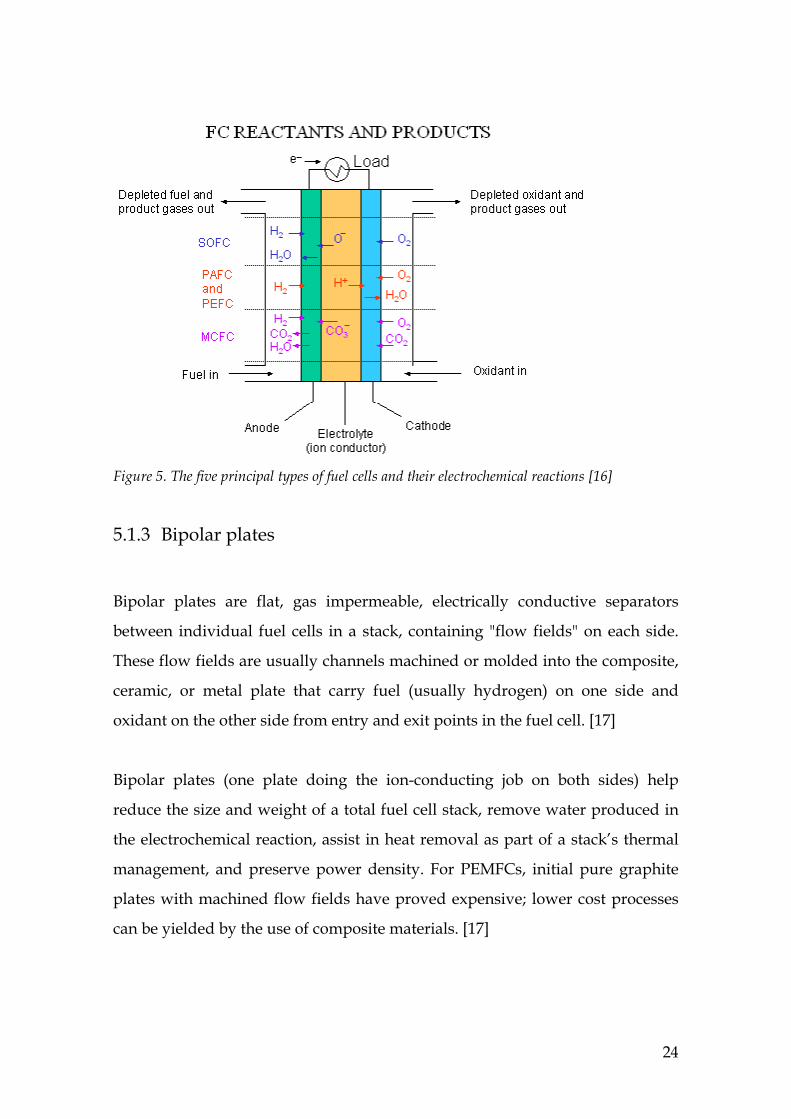
5.1.2 Fuel cell types
Several types of fuel cells have been developed or are under development. Fuel
cell types are generally characterized by the electrolyte material: proton
exchange membrane fuel cell (PEMFC), alkaline fuel cell (AFC), phosphoric
acid fuel cell (PAFC), molten carbonate fuel cell (MCFC) and solid oxide fuel
cell (SOFC). Despite differences in materials and operating conditions, all of
these fuel cells are based on the electrochemical reaction of hydrogen and
oxygen and the only by-products are water and heat. PEMFC and SOFC are the
most studied fuel cell types today. Bipolar plates are used between fuel cell
stacks to reduce the stack size. The properties of different types of fuel cells are
described in Table 1 and in Figure 5 and more precise information of the
PEMFC and SOFC in Chapters 5.2 and 5.3. [15]
23
Table 1. Properties of fuel cells [12]
Property PEMFC AFC PAFC MCFC SOFC
Electrolyte Polymer KOH Phosphoric acid
Molten carbonate
Ceramic material
Operation temperature
60-100, 80°C 65-220 °C 175-200, 190°C
600-1000, 650°C
600-1000, 1000°C
Fuel H2 H2 H2 H2, CO H2, CO, CH4
Oxidant O2 O2 O2 O2 + CO2 O2
Charge carrier H+ OH- H+ CO32- O2-
Catalyst Platinum Platinum Platinum Nickel Nickel
Power (e.g.) 100W- 10MW 300W-5 kW -200 kW (11 MW)
-2 MW (100 MW)
-220 kW
Efficiency 40-50 % 89 % 40-50 % 50-60 % 45-55 %
Ideal application
Distribution of electricity, portables,
transportation, CHP –
production
Space technology,
war technology
Distribution of electricity, transportation
Distribution of electricity,
CHP –production
Distribution of electricity,
CHP –production
Advantages Low temperature, fast starting,
solid electrolyte
Fast reaction
Efficiency can be as high as
85 % in combined heat and electricity production, can use also impure H2
High temperature:
can use diversity of fuels and cheap catalyst
High temperature:
can use diversity of fuels and cheap catalyst
Disadvantages Low temperature demands expensive electrolyte, clean fuel
CO2 in the air ages
electrolyte
Big size, platinum
catalyst, small power and current
High temperature is demaning
to components
High temperature is demaning
to components
24
Figure 5. The five principal types of fuel cells and their electrochemical reactions [16]
5.1.3 Bipolar plates
Bipolar plates are flat, gas impermeable, electrically conductive separators
between individual fuel cells in a stack, containing "flow fields" on each side.
These flow fields are usually channels machined or molded into the composite,
ceramic, or metal plate that carry fuel (usually hydrogen) on one side and
oxidant on the other side from entry and exit points in the fuel cell. [17]
Bipolar plates (one plate doing the ion-conducting job on both sides) help
reduce the size and weight of a total fuel cell stack, remove water produced in
the electrochemical reaction, assist in heat removal as part of a stack’s thermal
management, and preserve power density. For PEMFCs, initial pure graphite
plates with machined flow fields have proved expensive; lower cost processes
can be yielded by the use of composite materials. [17]

25
5.2 PEM fuel cell
Proton Exchange Membrane (PEM) fuel cell is also known as the solid polymer
or polymer electrolyte fuel cell. It usually operates at lower temperatures
around 80°C. A PEM fuel cell contains an electrolyte that is a layer of solid
polymer. The polymer is chemically inert, mechanically stable, a good proton
conductor, a good absorbator for water and its pH is below 7 (usually a sulfonic
acid polymer). Best electrolyte for both anode and cathode is platinum and in
most PEM –fuel cells the anodes and cathodes are similar. The high cost of
platinum has been considered a constraint in fuel cell production, but at the
present price of platinum, about 10 €/kWh it is not a restricting factor anymore.
[5], [15], [16]
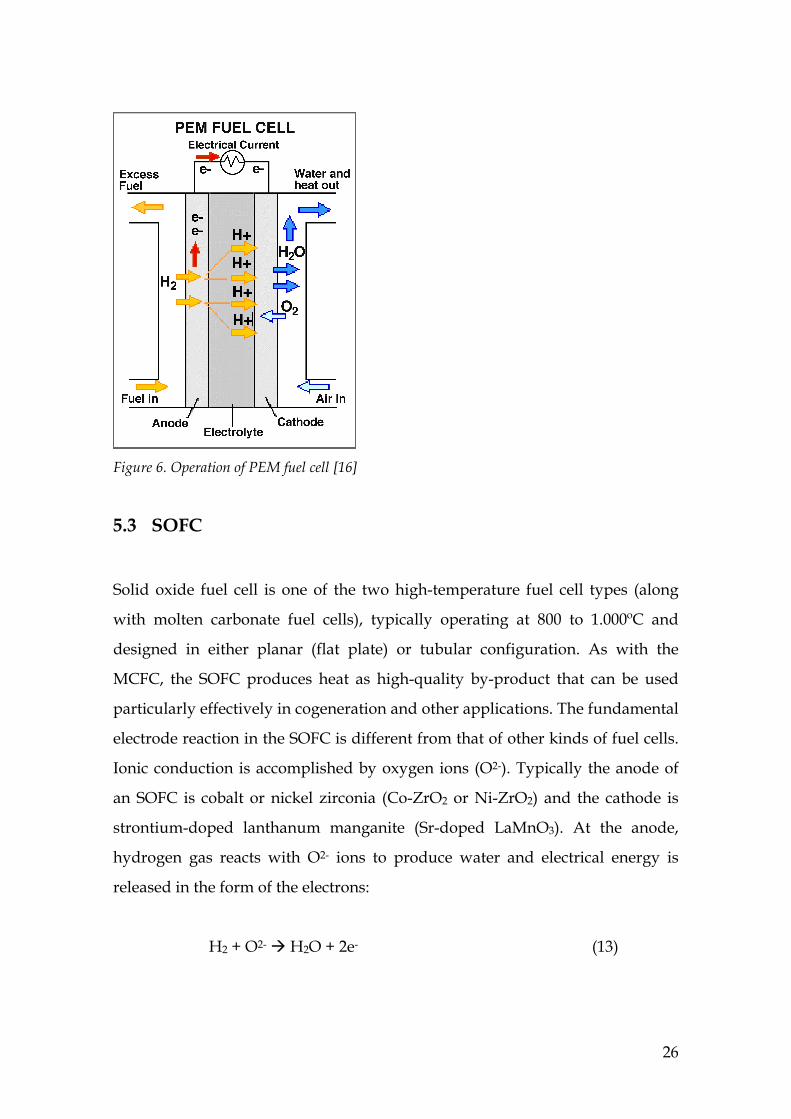
The operation of the PEM fuel cell is illustrated in Figure 6. PEM fuel cells
require hydrogen and oxygen as inputs, though the oxidant may also be
ambient air, and these gases must be humidified. Water is formed in cathode,
and both anode and cathode needs little humidity to work ideally. However,
water should not block the gas diffusion layer in neither electrode. Water is
moving in the cell both directions. Water may back-diffuse from the cathode to
the anode, if the cathode holds more water. Water will also move from anode to
cathode by protons moving through the electrolyte. Water will be removed
from the cathode by evaporation into the air circulating over the cathode.
Externally humidifying the hydrogen supply in the anode and externally
humidifying the air supply in the cathode may supply water. The air that flows
through cathode dries the cell more quickly than the reaction produces water.
Therefore the gasous hydrogen fuel is humidified with water. [16]
26
Figure 6. Operation of PEM fuel cell [16]
5.3 SOFC
Solid oxide fuel cell is one of the two high-temperature fuel cell types (along
with molten carbonate fuel cells), typically operating at 800 to 1.000ºC and
designed in either planar (flat plate) or tubular configuration. As with the
MCFC, the SOFC produces heat as high-quality by-product that can be used
particularly effectively in cogeneration and other applications. The fundamental
electrode reaction in the SOFC is different from that of other kinds of fuel cells.
Ionic conduction is accomplished by oxygen ions (O2-). Typically the anode of
an SOFC is cobalt or nickel zirconia (Co-ZrO2 or Ni-ZrO2) and the cathode is
strontium-doped lanthanum manganite (Sr-doped LaMnO3). At the anode,
hydrogen gas reacts with O2- ions to produce water and electrical energy is
released in the form of the electrons:
H2 + O2- H2O + 2e- (13)
27
At the cathode, oxygen reacts with the electrons taken from the electrode, and
oxygen ion O2- is formed:
½O2 + 2e- O2- (14)
Solid Oxide Fuel Cells (SOFCs) are currently being demonstrated in sizes from
1 kW up to 250 kW plants, with plans to reach the multi-MW range. Hardware
materials tend to be ceramic or metallic or a mixture of both. SOFCs utilize a
non-porous metal oxide (usually yttria-stabilized zirconia, Y2O3-stabilized
ZrO2) electrolyte material. SOFCs have traditionally been operated at ~1000°C
because the cell support was a thick doped-zirconia electrolyte layer. Recently,
the operating temperature has been lowered to 650-800 °C by supporting the
cell on a thick ceramicmetal (cermet) anode layer and decreasing the thickness
of the electrolyte layer to <20 µm, thus decreasing its resistance. [16], [17], [18],
[19]
SOFCs offer the stability and reliability of all-solid-state ceramic construction.
High-temperature operation, up to 1000 °C, allows more flexibility in the choice
of fuels and can produce very good performance in combined-cycle
applications. SOFCs approach 60 percent electrical efficiency in the simple cycle
system, and 85 percent total thermal efficiency in co-generation applications.
The flat plate and monolithic designs are at a much earlier stage of
development typified by sub-scale, single cell and short stack development (kW
scale). At this juncture, tubular SOFC designs are closer to commercialization.
[16]
However, there are still barriers to the use of SOFCs for these applications,
including (1) susceptibility to cracking due to vibration, impact, and thermal
shock; (2) contact resistance between the cell components; and (3) high
materials and manufacturing costs. The bulk of the material costs of the anode-

28
supported SOFC lie in the large amount of zirconia in the thick anode support
and the cost of expensive alloys in the bipolar plate. SOFCs are more fuel
flexible than PEMFCs, but sealing technology of individual planar ceramic cells
requires additional research and enhancement. [18]
29
6 SYSTEM INTEGRATION AND CONTROL
The electrolyzer and the fuel cell system are major components of a self-
sufficient wind hydrogen system. The excess energy produced, with respect to
load requirement, is being sent to the electrolyzer, which splits water into
hydrogen and oxygen. The oxygen is released into the atmosphere and the
hydrogen is stored in a tank under pressure. When the input power is
insufficient to feed the system load, stored hydrogen is reconverted through a
fuel cell to the required electricity. The energy available for storage depends on
the load profile and meteorological parameters. [6], [15], [20]
A typical self-sufficient renewable energy system must include both short-term
and long-term energy storage. Typical renewable energy system designs rely on
battery for short-term energy storage, and hydrogen is used for long-term
energy storage. In stand-alone systems the electrolyser, the fuel cell, the
batteries, the buck and boost converters and the storage system are integrated
together. These components are described in later chapters. More detailed
equations required in the modeling of the system are also introduced. Modeling
softwares (also HOMER used in the case study –chapter) use these equations.
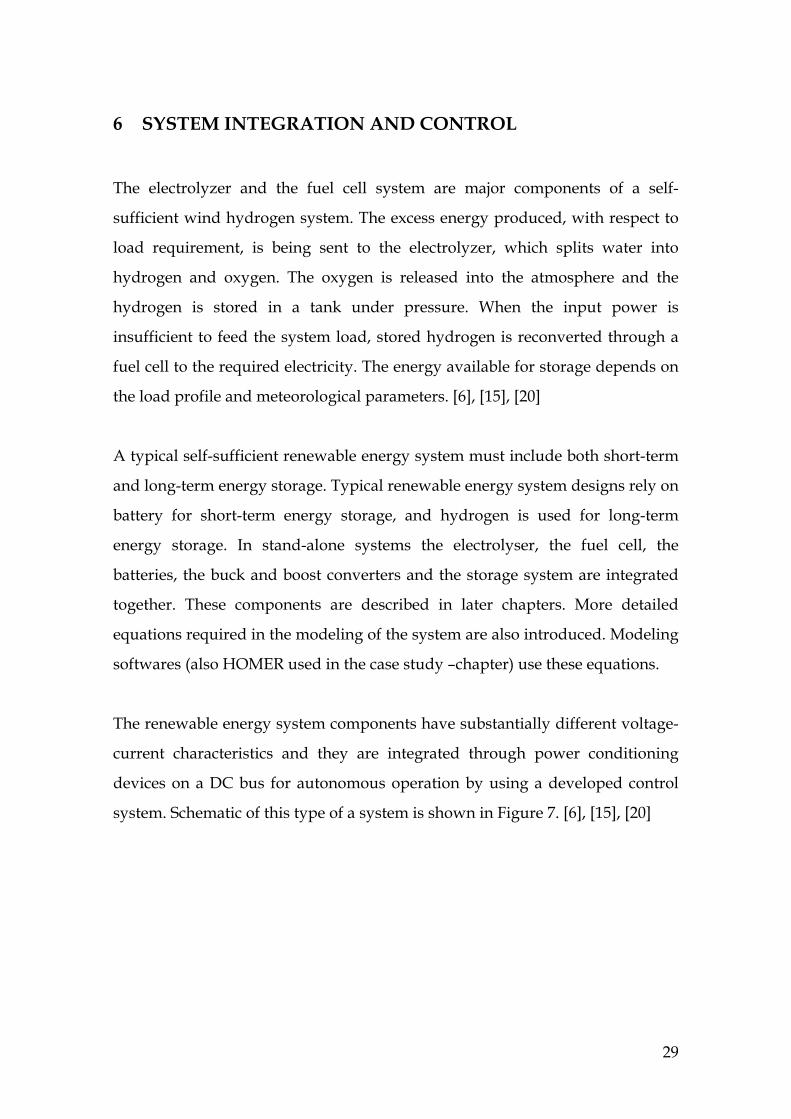
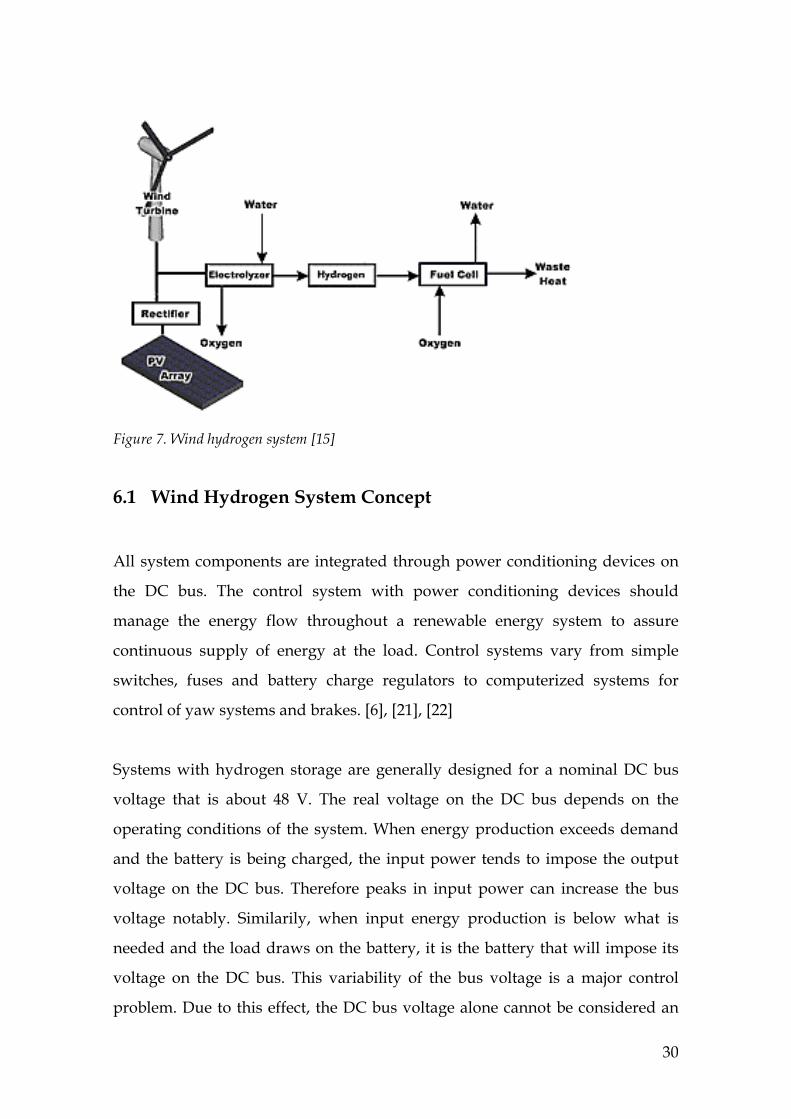
The renewable energy system components have substantially different voltage-
current characteristics and they are integrated through power conditioning
devices on a DC bus for autonomous operation by using a developed control
system. Schematic of this type of a system is shown in Figure 7. [6], [15], [20]
30
Figure 7. Wind hydrogen system [15]
6.1 Wind Hydrogen System Concept
All system components are integrated through power conditioning devices on
the DC bus. The control system with power conditioning devices should
manage the energy flow throughout a renewable energy system to assure
continuous supply of energy at the load. Control systems vary from simple
switches, fuses and battery charge regulators to computerized systems for
control of yaw systems and brakes. [6], [21], [22]
Systems with hydrogen storage are generally designed for a nominal DC bus
voltage that is about 48 V. The real voltage on the DC bus depends on the
operating conditions of the system. When energy production exceeds demand
and the battery is being charged, the input power tends to impose the output
voltage on the DC bus. Therefore peaks in input power can increase the bus
voltage notably. Similarily, when input energy production is below what is
needed and the load draws on the battery, it is the battery that will impose its
voltage on the DC bus. This variability of the bus voltage is a major control
problem. Due to this effect, the DC bus voltage alone cannot be considered an
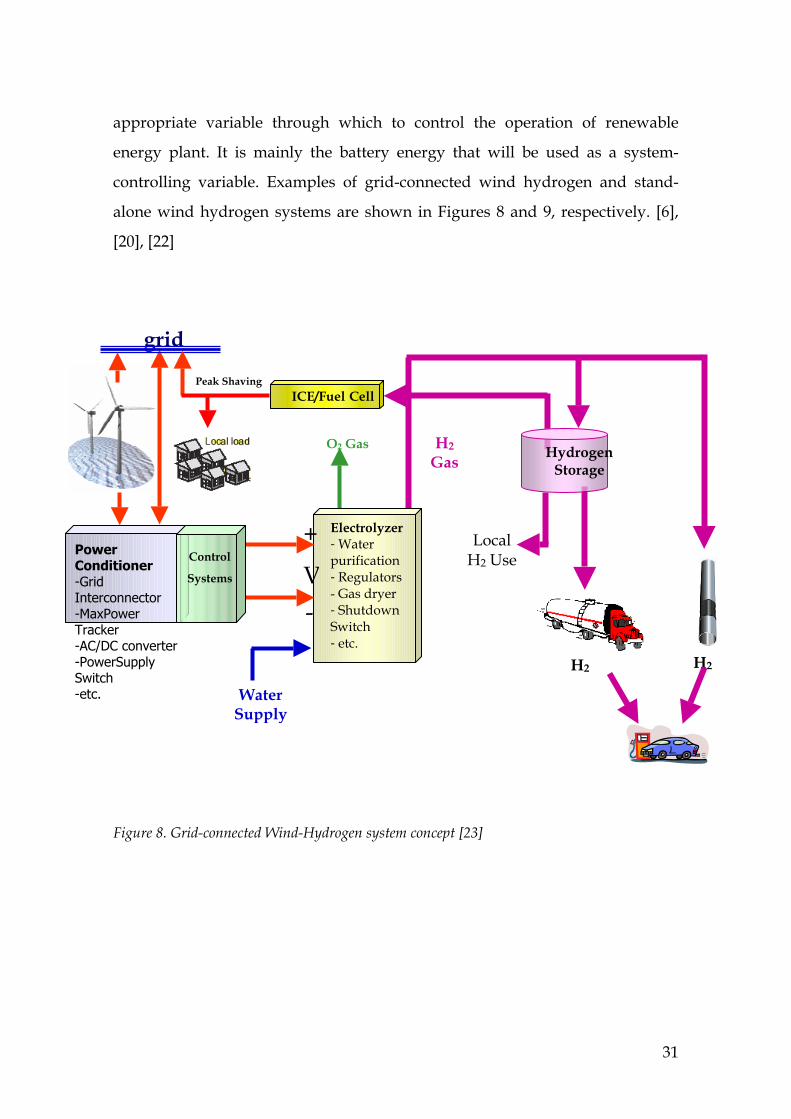
31
appropriate variable through which to control the operation of renewable
energy plant. It is mainly the battery energy that will be used as a system-
controlling variable. Examples of grid-connected wind hydrogen and stand-
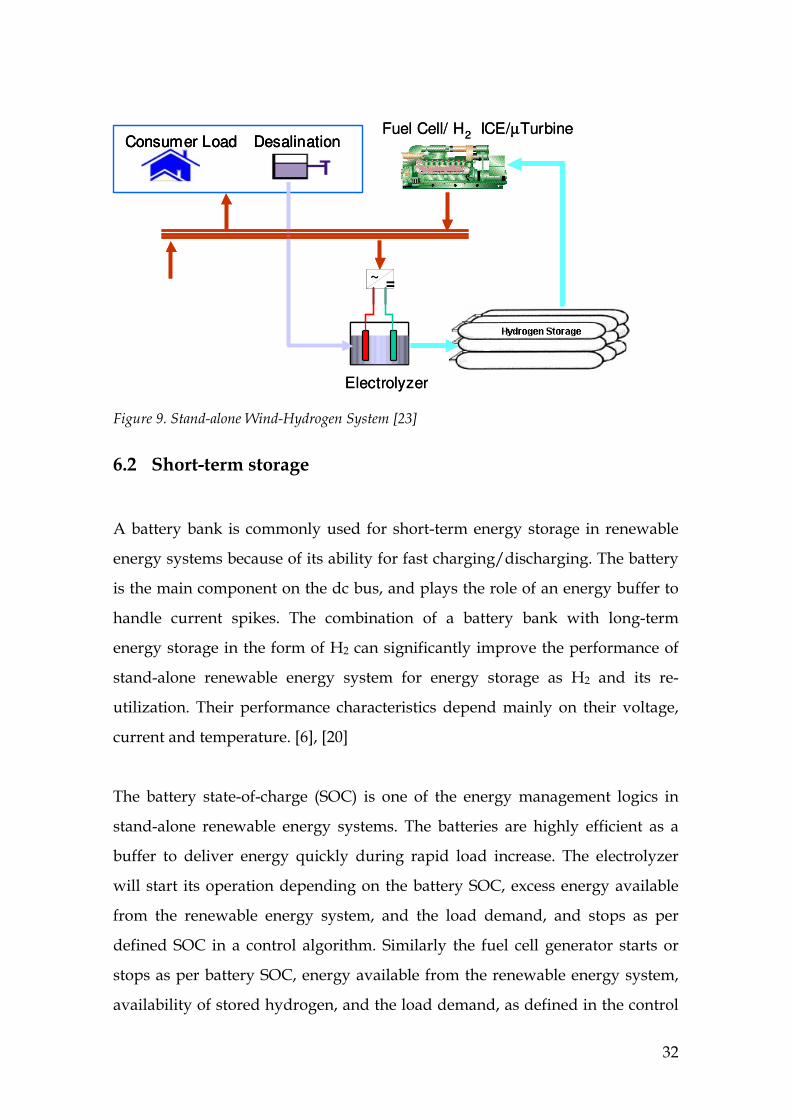
alone wind hydrogen systems are shown in Figures 8 and 9, respectively. [6],
[20], [22]
Figure 8. Grid-connected Wind-Hydrogen system concept [23]
Electrolyzer - Water purification - Regulators - Gas dryer - Shutdown Switch - etc.
Hydrogen Storage
grid
H2 Gas
+
- V
Water Supply
H2 H2
O2 Gas
Peak Shaving
ICE/Fuel Cell
Power Conditioner
-Grid
Interconnector
-MaxPower
Tracker
-AC/DC converter
-PowerSupply
Switch
-etc.
Control
Systems
Local H2 Use
32
=~
Fuel Cell/ H2 ICE/µTurbine
Electrolyzer
Consumer Load Desalination
=~ =~
Fuel Cell/ H2 ICE/µTurbine
Electrolyzer
Consumer LoadConsumer Load DesalinationDesalination
Figure 9. Stand-alone Wind-Hydrogen System [23]
6.2 Short-term storage
A battery bank is commonly used for short-term energy storage in renewable
energy systems because of its ability for fast charging/discharging. The battery
is the main component on the dc bus, and plays the role of an energy buffer to
handle current spikes. The combination of a battery bank with long-term
energy storage in the form of H2 can significantly improve the performance of
stand-alone renewable energy system for energy storage as H2 and its re-
utilization. Their performance characteristics depend mainly on their voltage,
current and temperature. [6], [20]
The battery state-of-charge (SOC) is one of the energy management logics in
stand-alone renewable energy systems. The batteries are highly efficient as a
buffer to deliver energy quickly during rapid load increase. The electrolyzer
will start its operation depending on the battery SOC, excess energy available
from the renewable energy system, and the load demand, and stops as per
defined SOC in a control algorithm. Similarly the fuel cell generator starts or
stops as per battery SOC, energy available from the renewable energy system,
availability of stored hydrogen, and the load demand, as defined in the control
33
algorithm. The SOC levels to start and stop the electrolyzer and fuel cell system
are defined as: SOCstart, electrolyzer > SOCstop, electrolyzer and SOCstart, fuel cell < SOCstop,
fuel cell with SOCstop, fuel cell < SOCstart, electrolyzer . As the specified energy levels of
the batteries are reached, the control algorithm sends a conditioned signal to the
DC/DC (Buck/Boost) converter for effective operation of the electrolyser and
fuel cell generator sub-systems. The battery SOC thresholds in the control
algorithm have been selected in such way that the fuel cell should not operate
simultaneously with the electrolyser. [24], [25]
The main parameters, which determine battery´s performance, are its internal
resistance, the polarization effect, and the long-term self-discharge rate. The
battery voltage UB(t), which takes these three parameters into account is given
by:
)()()()1()( 0, tQKtItRUttU RiiBB +++= α , (15)
where α is the self-discharge rate (s-1); UB,0 is the open circuit voltage (V) at t=0;
Ri(t) is the internal resistance (Ω), Ki is the polarization coefficient (Ωh-1); and
QR(t) is the rate of accumulated ampere hours. If I(t)>0 then the battery is
charging; if I(t)<0 then the battery is discharging. The battery energy is then:
∫ ′′+=t
in tdtPWtW0
0 )()( , (16)
where Pin(t´)= UB(t)I(t) is the input power to the battery and W0 is the battery´s
initial energy. Battery´s state of charge (SOC) is defined by:
, (17)
where Wmax is the maximum battery energy without overcharge. [20]
34
6.3 DC-DC Converters
The renewable energy system components have substantially different voltage-
current characteristics, and they are integrated on a 48V DC bus through proper
power conditioning devices for effective power management. The excess energy
provided to the electrolyzer for energy storage as H2 is controlled through a
buck converter connected between the DC bus and the electrolyzer. Similarly, a
boost converter has been used to control the fuel cell system output to provide
the required energy at the DC bus. The boost converter has been connected
between the PEM - fuel cell system and the DC bus. [22]
These secondary micro-controllers manage the power flow with respect to the
energy availability at DC bus through the digitally controlled DC-DC
converters. These DC-DC converters use a multiphase technique to generate
pulse width modulation signals to control the power flow. The DC-DC
converters are important components in the system for effective operation and
power flow control of the electrolyzer and fuel cell system. [22]
The limits of the energy levels in the control algorithm at which the electrolyzer
and fuel cell system kick in or out in response to variations in the systems
(source power, load demand, etc.) are implemented through a double hysteresis
strategy, meaning that the energy level at which either device is turned on is
not the same as the level at which is turned off. The developed control
algorithm needs to take into account that the PEM– fuel cell system and the
electrolyzer cannot operate at the same time. The proper choice of pre-defined
energy levels at the DC bus should produce effective operation of the
electrolyzer and the PEM –fuel cell systems. This choice depends on the
environmental conditions, the load profile, etc. In Figure 10 (page 40) are
system components with the control units. [22], [24]
35
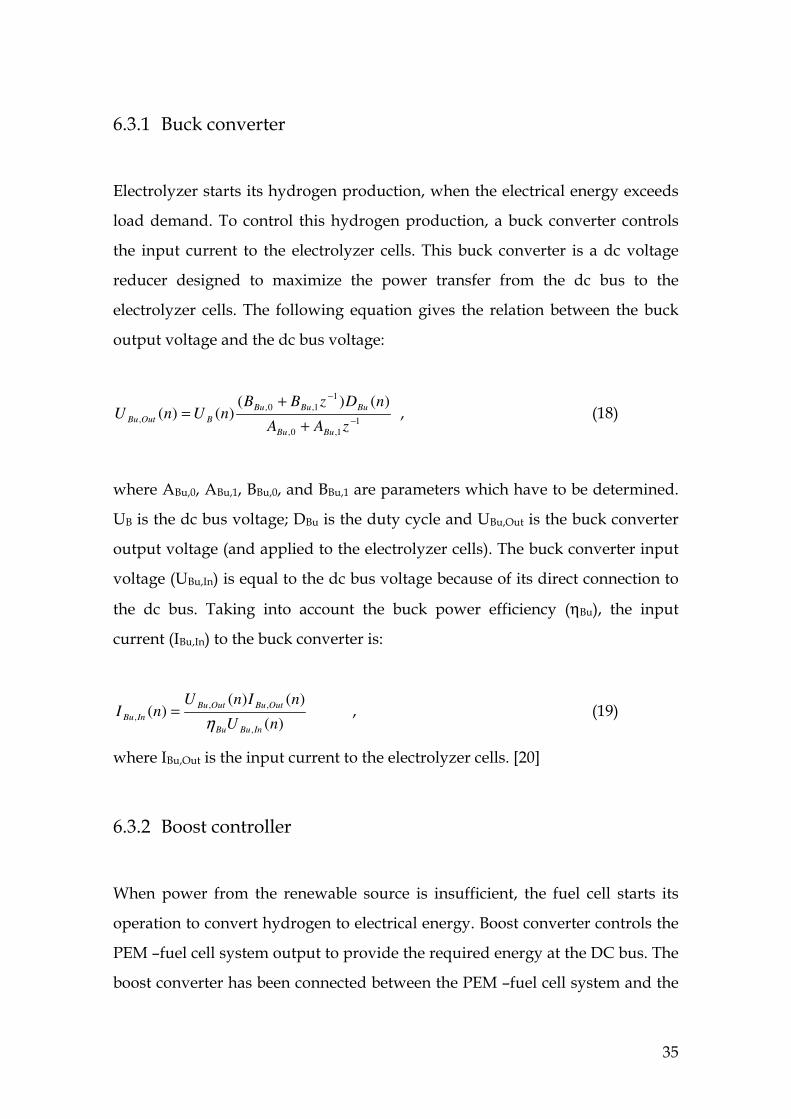
6.3.1 Buck converter
Electrolyzer starts its hydrogen production, when the electrical energy exceeds
load demand. To control this hydrogen production, a buck converter controls
the input current to the electrolyzer cells. This buck converter is a dc voltage
reducer designed to maximize the power transfer from the dc bus to the
electrolyzer cells. The following equation gives the relation between the buck
output voltage and the dc bus voltage:
1
1,0,
1
1,0,
,
)()()()(
−
−
+
+=
zAA
nDzBBnUnU
BuBu
BuBuBu
BOutBu , (18)
where ABu,0, ABu,1, BBu,0, and BBu,1 are parameters which have to be determined.
UB is the dc bus voltage; DBu is the duty cycle and UBu,Out is the buck converter
output voltage (and applied to the electrolyzer cells). The buck converter input
voltage (UBu,In) is equal to the dc bus voltage because of its direct connection to
the dc bus. Taking into account the buck power efficiency (ηBu), the input
current (IBu,In) to the buck converter is:
)(
)()()(
,
,,
,nU
nInUnI
InBuBu
OutBuOutBu
InBuη
= , (19)
where IBu,Out is the input current to the electrolyzer cells. [20]
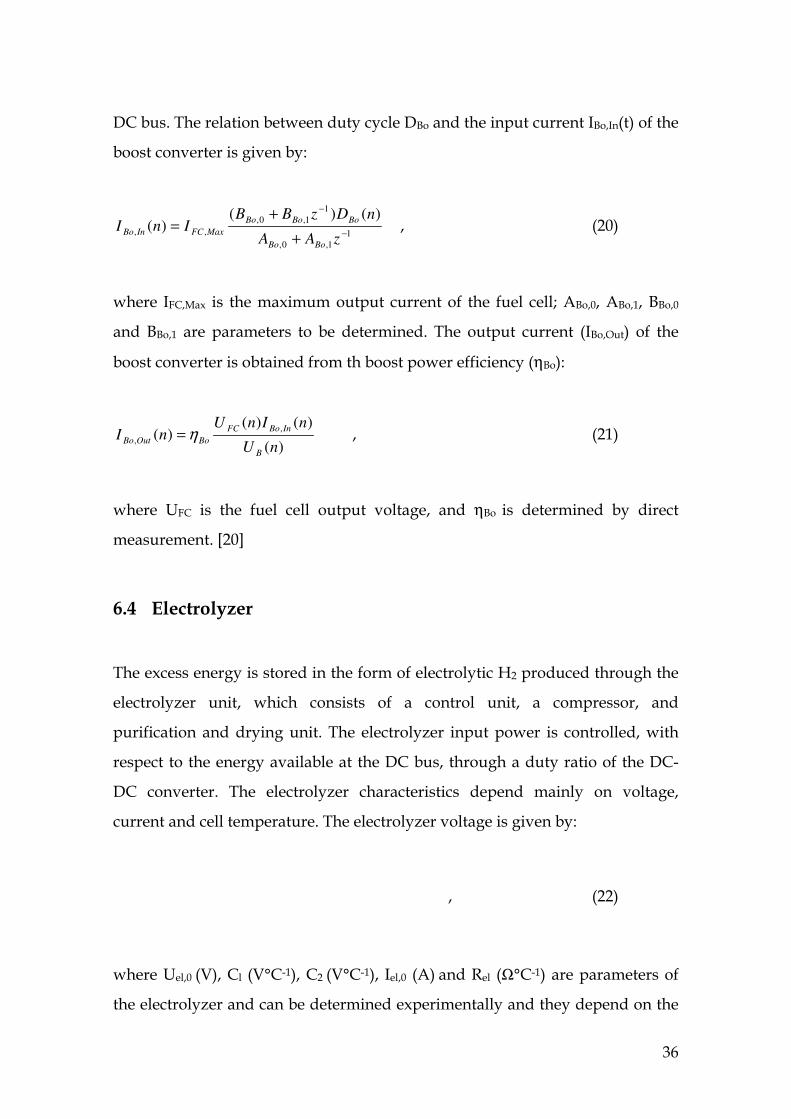
6.3.2 Boost controller
When power from the renewable source is insufficient, the fuel cell starts its
operation to convert hydrogen to electrical energy. Boost converter controls the
PEM –fuel cell system output to provide the required energy at the DC bus. The
boost converter has been connected between the PEM –fuel cell system and the
36
DC bus. The relation between duty cycle DBo and the input current IBo,In(t) of the
boost converter is given by:
1
1,0,
1
1,0,
,,
)()()(
−
−
+
+=
zAA
nDzBBInI
BoBo
BoBoBo
MaxFCInBo , (20)
where IFC,Max is the maximum output current of the fuel cell; ABo,0, ABo,1, BBo,0
and BBo,1 are parameters to be determined. The output current (IBo,Out) of the
boost converter is obtained from th boost power efficiency (ηBo):
)(
)()()(
,
,nU
nInUnI
B
InBoFC
BoOutBo η= , (21)
where UFC is the fuel cell output voltage, and ηBo is determined by direct
measurement. [20]
6.4 Electrolyzer
The excess energy is stored in the form of electrolytic H2 produced through the
electrolyzer unit, which consists of a control unit, a compressor, and
purification and drying unit. The electrolyzer input power is controlled, with
respect to the energy available at the DC bus, through a duty ratio of the DC-
DC converter. The electrolyzer characteristics depend mainly on voltage,
current and cell temperature. The electrolyzer voltage is given by:
, (22)
where Uel,0 (V), Cl (V°C-1), C2 (V°C-1), Iel,0 (A) and Rel (Ω°C-1) are parameters of
the electrolyzer and can be determined experimentally and they depend on the
37
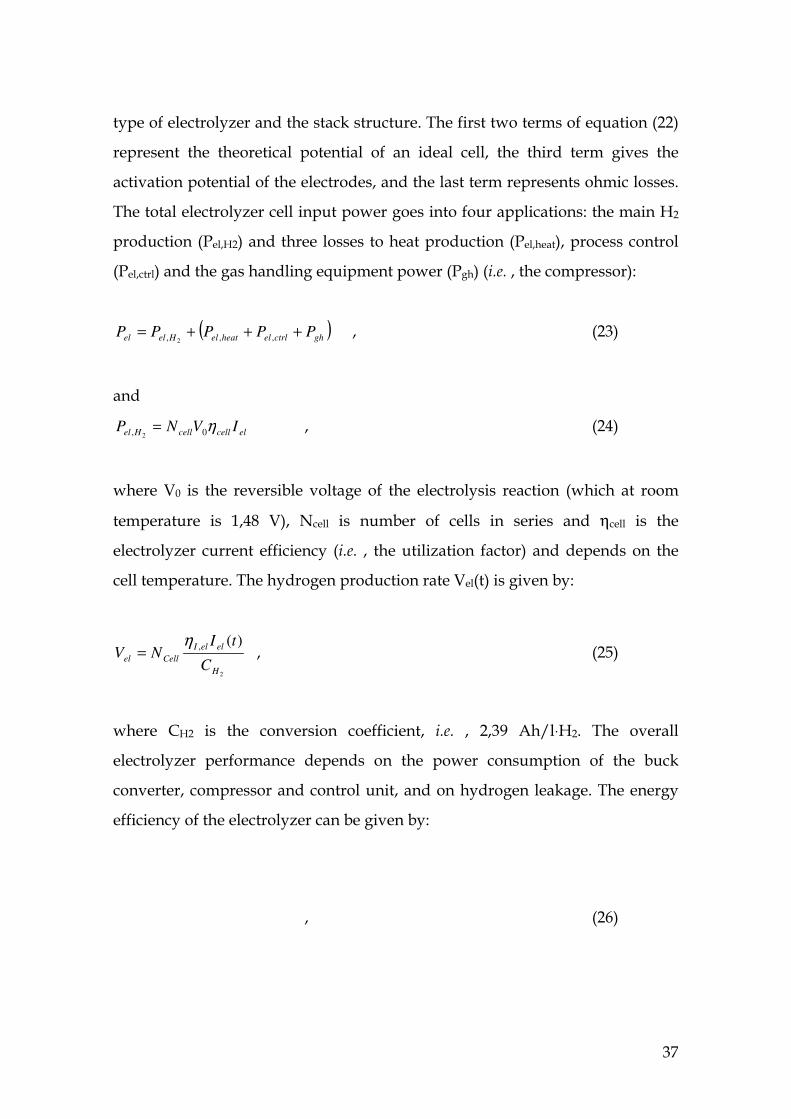
type of electrolyzer and the stack structure. The first two terms of equation (22)
represent the theoretical potential of an ideal cell, the third term gives the
activation potential of the electrodes, and the last term represents ohmic losses.
The total electrolyzer cell input power goes into four applications: the main H2
production (Pel,H2) and three losses to heat production (Pel,heat), process control
(Pel,ctrl) and the gas handling equipment power (Pgh) (i.e. , the compressor):
( )ghctrlelheatelHelel PPPPP +++= ,,, 2
, (23)
and
elcellcellHel IVNP η0, 2= , (24)
where V0 is the reversible voltage of the electrolysis reaction (which at room
temperature is 1,48 V), Ncell is number of cells in series and ηcell is the
electrolyzer current efficiency (i.e. , the utilization factor) and depends on the
cell temperature. The hydrogen production rate Vel(t) is given by:
2
)(,
H
elelI
CellelC
tINV
η= , (25)
where CH2 is the conversion coefficient, i.e. , 2,39 Ah/l⋅H2. The overall
electrolyzer performance depends on the power consumption of the buck
converter, compressor and control unit, and on hydrogen leakage. The energy
efficiency of the electrolyzer can be given by:
, (26)
38
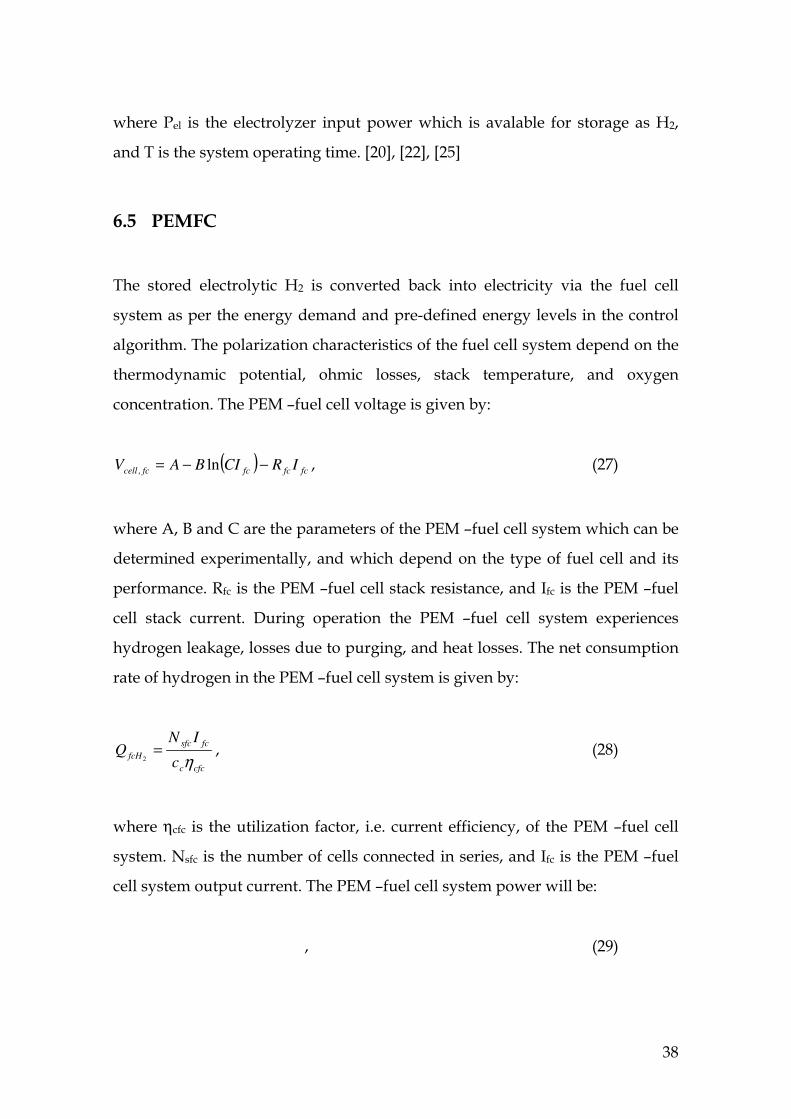
where Pel is the electrolyzer input power which is avalable for storage as H2,
and T is the system operating time. [20], [22], [25]
6.5 PEMFC
The stored electrolytic H2 is converted back into electricity via the fuel cell
system as per the energy demand and pre-defined energy levels in the control
algorithm. The polarization characteristics of the fuel cell system depend on the
thermodynamic potential, ohmic losses, stack temperature, and oxygen
concentration. The PEM –fuel cell voltage is given by:
( )fcfcfcfccell IRCIBAV −−= ln, , (27)
where A, B and C are the parameters of the PEM –fuel cell system which can be
determined experimentally, and which depend on the type of fuel cell and its
performance. Rfc is the PEM –fuel cell stack resistance, and Ifc is the PEM –fuel
cell stack current. During operation the PEM –fuel cell system experiences
hydrogen leakage, losses due to purging, and heat losses. The net consumption
rate of hydrogen in the PEM –fuel cell system is given by:
cfcc
fcsfc
fcHc
INQ
η=
2, (28)
where ηcfc is the utilization factor, i.e. current efficiency, of the PEM –fuel cell
system. Nsfc is the number of cells connected in series, and Ifc is the PEM –fuel
cell system output current. The PEM –fuel cell system power will be:
, (29)
39
where Pfc,H2 is the net power needed for hydrogen conversion, Pfc,heat is the
heat loss in the PEM –fuel cell system, and Pfc,ctl is the power required for the
PEM –fuel cell system control process. The losses in the PEM –fuel cell system
are given by:
outfcfcHcfcloss PQcVP ,0, 2−= (30)
The instantaneous efficiency of the PEM –fuel cell is obtained from:
fclossoutfc
outfc
fcPP
P
,,
,
+=η (31)
The energy conversion efficiency of the PEM –fuel cell system over the
operation time T is given by:
∫
∫=
T
fcHc
T
netoutfc
convH
dtQVc
dtP
0
0
0
,,
,
2
2η (32)
The hydrogen energy storage efficiency depends on the combined efficiency of
electrolyzer, PEM –fuel cell system, storage system, and power conditioning
device effincies. Figure 10 shows the system components. [6], [22], [25]
40
DC Bus
Buck
Converter
Electro-
lyser
Press. H2
Storage
PEM
Fuel Cell
Boost
Converter
Load
Wind
Turbine
Battery
Bank
~
- ~-
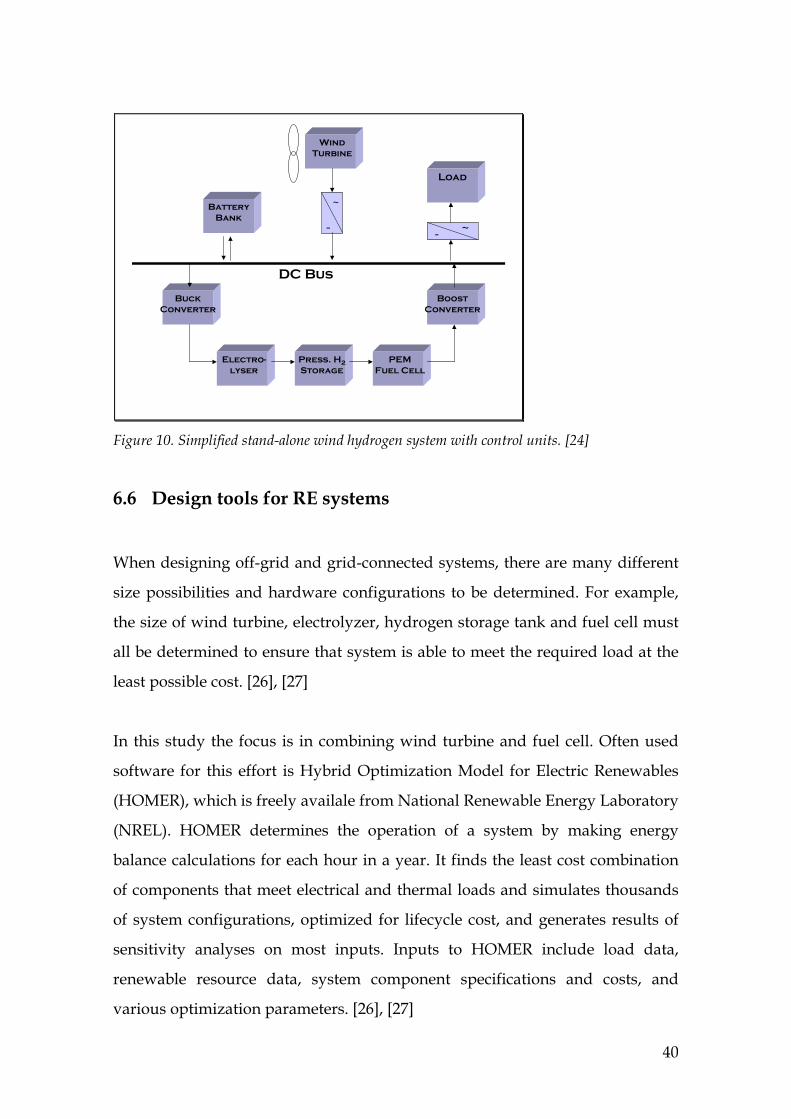
Figure 10. Simplified stand-alone wind hydrogen system with control units. [24]
6.6 Design tools for RE systems
When designing off-grid and grid-connected systems, there are many different
size possibilities and hardware configurations to be determined. For example,
the size of wind turbine, electrolyzer, hydrogen storage tank and fuel cell must
all be determined to ensure that system is able to meet the required load at the
least possible cost. [26], [27]
In this study the focus is in combining wind turbine and fuel cell. Often used
software for this effort is Hybrid Optimization Model for Electric Renewables
(HOMER), which is freely availale from National Renewable Energy Laboratory
(NREL). HOMER determines the operation of a system by making energy
balance calculations for each hour in a year. It finds the least cost combination
of components that meet electrical and thermal loads and simulates thousands
of system configurations, optimized for lifecycle cost, and generates results of
sensitivity analyses on most inputs. Inputs to HOMER include load data,
renewable resource data, system component specifications and costs, and
various optimization parameters. [26], [27]
41
7 FUEL CELL VEHICLES
The high dependency of transportation on fossil fuels, the raising awareness to
many environmental problems and the fact that oil is actually diminishing and
the price of it is increasing, will demand a clean, sustainable alternative fuel in
the future. Governments, car manufactures and energy enterprises are realising
the increasing need of an alternative fuel. It is in these mobile applications that
hydrogen will find its first and largest market. [4]
Internal combustion engines for automotive industry can be replaced with
environmentally friendly fuel cells using electrolytic hydrogen. Fuel cell
vehicles fueled with pure hydrogen emit no pollutants, only water and heat.
The benefits of using hydrogen will be fully realized when produced from
renewable energies. [28]
Fuel cell vehicles are propelled with electric motors, like battery-electric
vehicles. The main difference in these is that a fuel cell vehicle creates its own
electricity, while battery electric vehicles use electricity from an external source
and store it in a battery. Fuel cells in the vehicle can be fueled with pure
hydrogen gas, which is stored in a high-pressure tank in the vehicle. These
vehicles can also use hydrogen-rich fuels, such as methanol or natural gas, but
these fuels must first be converted into hydrogen gas. This conversion needs a
special device in the vehicle, which turns the hydrogen-rich fuels into hydrogen
gas. The vehicles using hydrogen-rich fuels emit in addition to water and heat,
also small amounts of pollutants (mainly carbon dioxide). [29]
The shift from a transport system based on fossil fuels to hydrogen requires
huge investments and involves major infrastructural changes both in the fuel
distribution and supply and in the vehicles. Iceland has already undertaken the
42
ambitious goal to become the first hydrogen economy in the world, producing
hydrogen by electrolysis using excess renewable energy.[4]
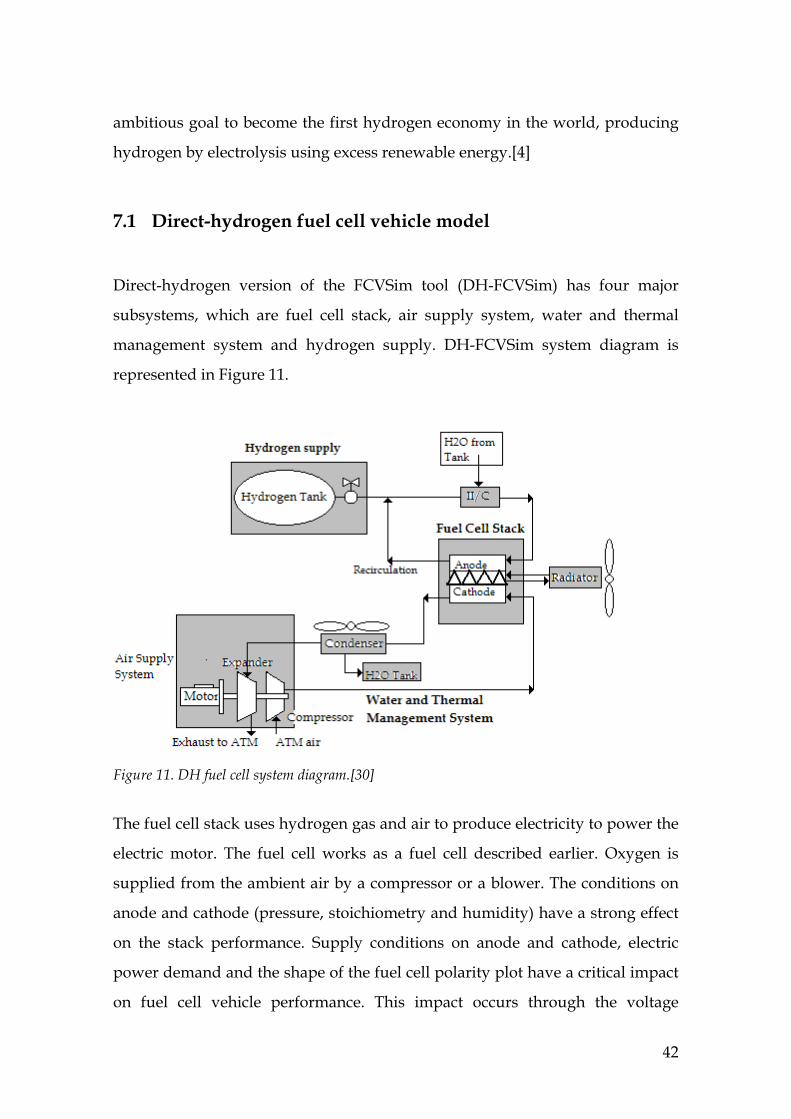
7.1 Direct-hydrogen fuel cell vehicle model
Direct-hydrogen version of the FCVSim tool (DH-FCVSim) has four major
subsystems, which are fuel cell stack, air supply system, water and thermal
management system and hydrogen supply. DH-FCVSim system diagram is
represented in Figure 11.
Figure 11. DH fuel cell system diagram.[30]
The fuel cell stack uses hydrogen gas and air to produce electricity to power the
electric motor. The fuel cell works as a fuel cell described earlier. Oxygen is
supplied from the ambient air by a compressor or a blower. The conditions on
anode and cathode (pressure, stoichiometry and humidity) have a strong effect
on the stack performance. Supply conditions on anode and cathode, electric
power demand and the shape of the fuel cell polarity plot have a critical impact
on fuel cell vehicle performance. This impact occurs through the voltage
43
feedback effect and is due to the depedence of the available motor torque on the
supply voltage at the terminals of the power electronics. The fuel cell stack
typically consists of over 400 individual fuel cells. [29], [30]
The air supply system illustrated in Figure 11 includes compressor with a
variable speed electric motor. The compressor drives pressure and mass flow to
the cathode, where oxygen is depleted for power generation. The air
compressor controls the rate at which air is supplied to the stack according to
the need for power. The exhaust path from cathode includes a condenser to
recover liquid water to H2O tank, but no humidifier is included. It is necessary
to recover liquid water for recirculation into the anode fuel loop. The air supply
system also interacts with water and thermal managemant system components.
[29], [30]
Water and thermal management system includes the radiator and the
condenser, for heat transfer and water recovery, respectively. Water and
thermal management system consideres all other component in the system, but
only in the context of heat and water balance. The heat load in the system is
given by the combination of the stack heat rejection due to inefficiency and due
to water condensation in the stack. Relatively little heat is carried away in the
exhaust of the fuel cell (<10%). The required flow rates of coolant through the
radiator can be substantial, because the fuel cell stack has a small temperature
range for optimal operation.
The hydrogen is generally stored as a gas in high-pressure tanks, so that
enough fuel can be stored to give the vehicle a suitable driving range. In most
current fuel cell vehicles, the fuel tank is cabable of storing hydrogen at about
35 bar, and even higher pressure tanks are under development. This current 35
bar tank can store enough hydrogen to allow vehicles go more than 300 km
before refuelling. The hydrogen supply system also includes a recirculation of
44
hydrogen from the anode back to the flow from the hydrogen tank. The
compressed hydrogen does not effect on the dynamic response of the fuel cell
system, nor on the energy conversion efficiency. [29], [30]
Some fuel cell vehicles contain a battery to store electricity produced from
regerative braking or from the fuel cell stack. Battery can be used to help power
the electric motor or other electrical devices.
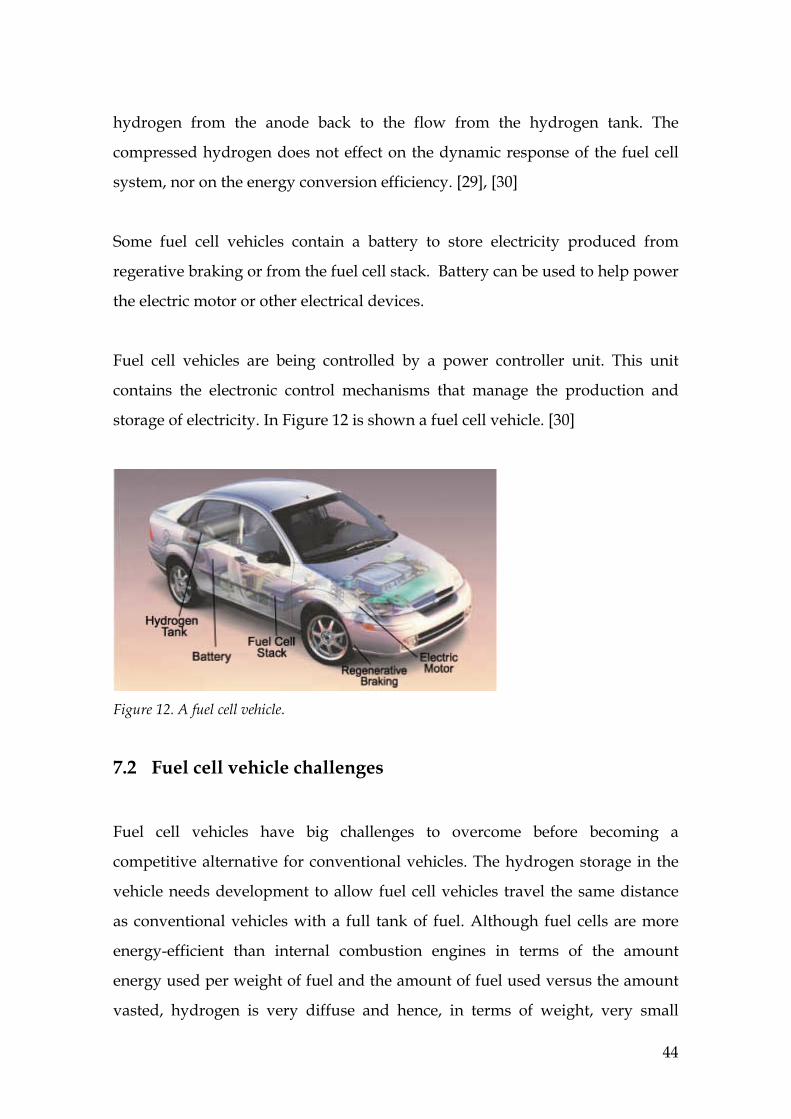
Fuel cell vehicles are being controlled by a power controller unit. This unit
contains the electronic control mechanisms that manage the production and
storage of electricity. In Figure 12 is shown a fuel cell vehicle. [30]
Figure 12. A fuel cell vehicle.
7.2 Fuel cell vehicle challenges
Fuel cell vehicles have big challenges to overcome before becoming a
competitive alternative for conventional vehicles. The hydrogen storage in the
vehicle needs development to allow fuel cell vehicles travel the same distance
as conventional vehicles with a full tank of fuel. Although fuel cells are more
energy-efficient than internal combustion engines in terms of the amount
energy used per weight of fuel and the amount of fuel used versus the amount
vasted, hydrogen is very diffuse and hence, in terms of weight, very small
45
amount can be stored in reasonable size tank. This can be overcome by
increasing the pressure under which the hydrogen is stored or through the
development of chemical or metal hybride storage options. Also new facilities
and systems will be required to get hydrogen to consumers, because the
existing gasoline delivery and filling stations cannot be used for transporting or
storing hydrogen.
The operation of fuel cell at cold weather is also a great challenge. Fuel cell
system always contains water, both as a byproduct and for humidifying the fuel
cell, and water freezes at cold temperatures. Also the efficiency of the fuel cell is
best at certain temperature. The handling of hydrogen has safety risks, which
are different from conventional gasoline. Therefore, safe storing and
transportation systems of hydrogen must be optimized.
Fuel cell vehicles are more expensive than conventional vehicles, mainly
because of the expensive catalyst (platinum) and electrolyte membrane. To
survive in the competitive market, fuel cell vehicles will have to offer
consumers a viable alternative, in terms of performance, durability and cost.
[30]

46
8 CASE STUDY: KÖKAR ISLAND
Remote areas can be considered as those that lie outside of “grid” systems.
Those areas are typically geografically remote and characterised by sparse
populations. In such areas the energy supplies are susceptible to interruption
and improved utilization of locally available renewable resources would offer
significant benefit.
This study focuses on a small island in the Åland archipelago in Finland, which
already has a 500 kW wind turbine. The aim of this study is to evaluate in
which configuration the island could be self-sufficient in terms of power with a
system including wind turbines, electrolyser, hydrogen tank and a fuel cell.
Software used for this effort is Hybrid Optimization Model for Electric Renewables
(HOMER). Data from the existing turbine is shown on Table 2.
The energy demand of the island is estimated based on an assumption that
average energy consumption is 5 MWh/person/year. The population in the
island is 320, so the load demand is approximately 1600 MWh/year. It is seen
from the statistics that the island can not be completely self-sufficient with only
the existing turbine.
47
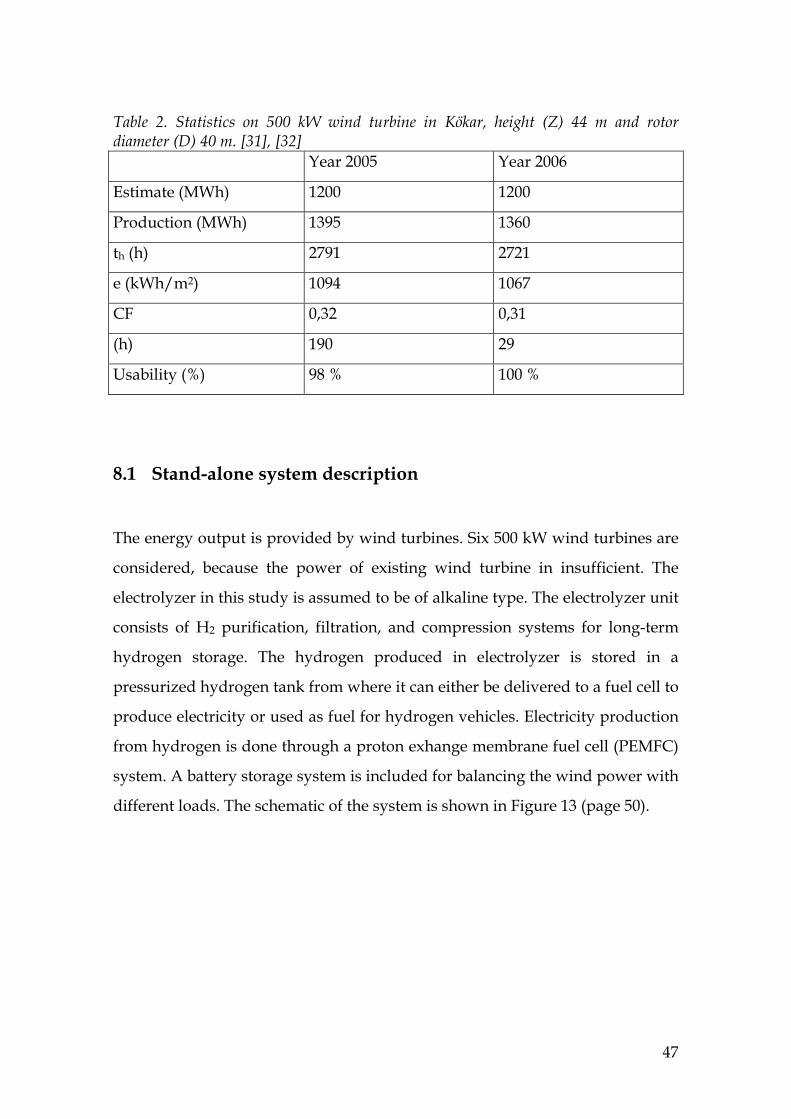
Table 2. Statistics on 500 kW wind turbine in Kökar, height (Z) 44 m and rotor diameter (D) 40 m. [31], [32]
Year 2005 Year 2006
Estimate (MWh) 1200 1200
Production (MWh) 1395 1360
th (h) 2791 2721
e (kWh/m2) 1094 1067
CF 0,32 0,31
(h) 190 29
Usability (%) 98 % 100 %
8.1 Stand-alone system description
The energy output is provided by wind turbines. Six 500 kW wind turbines are
considered, because the power of existing wind turbine in insufficient. The
electrolyzer in this study is assumed to be of alkaline type. The electrolyzer unit
consists of H2 purification, filtration, and compression systems for long-term
hydrogen storage. The hydrogen produced in electrolyzer is stored in a
pressurized hydrogen tank from where it can either be delivered to a fuel cell to
produce electricity or used as fuel for hydrogen vehicles. Electricity production
from hydrogen is done through a proton exhange membrane fuel cell (PEMFC)
system. A battery storage system is included for balancing the wind power with
different loads. The schematic of the system is shown in Figure 13 (page 50).
48
8.2 Component sizing
On that precise area there is no wind speed statistics. Therefore, wind speed
data for that location was obtained from NASA website according to latitude
and lognitude (N59°56’25.5’’ E20°55’9.70’’). The existing data is used for the
wind turbines.
The software uses values in dollars for economic calculations and therefore
most values are in dollars. Currency convertion was made with the exchange
rate 1 $ = 0,6717 € (27.11.2007, Reuters website).
The initial cost of 500 kW wind turbine is assumed to be 400.000 $, and the
operation and maintenance cost 4 % (16.000 $/year). It has been taken into
consideration that Kökar island already has one 500 kW wind turbine. [33]
Electrolyzer is assumed to be of unit size 1.000 kW and the cost per unit 50.000
$. Sizes of 1.000, 3.000 and 5.000 kW are considered. Fuel cell is assumed to be
of unit size 400 kW and the cost 280.000 $, according the medium cost case in
research of T.E. Lipman et al. [34]. Hydrogen consumption is set to 40 kg/h
when fuel cell output power is 400 kW, and 32 kg/h when output is 300 kW,
which gives fuel curve parameters: intercept coefficient 0,02 kg/h/kW rated
and slope 0,08 kg/h/kW output.
The unit size for hydrogen tank is assumed to be 1.000 kg, which stands for
about 33.000 kWh. The cost for hydrogen tank is 5 $/kW. Sizes 4.000, 8.000 and
10.000 kg are considered. The hydrogen tank would also serve as fuelling
station for vehicles. The average hydrogen load is assumed to be 0,13 kg/hr,
which is calculated from assumptions that there is 100 vehicles in the island,
each of them drives 5.000 km/y, the tank size is 50 l, the pressure in the tank is
5000psi(~345 bar) and that you can drive 300 km with one tank of hydrogen.
49
Converter is placed between AC and DC bus and the unit size is 20 kW. The
price for converter is 50 $/kW and sizes 20 and 40 kW are considered.
Batteries selected to the system are the biggest in HOMER, 3.000 Ah. The price
for batteries is assumed to be approximately the same as in car batteries, 1
$/Ah. One battery unit would cost then 3.000 $ and the system is considered
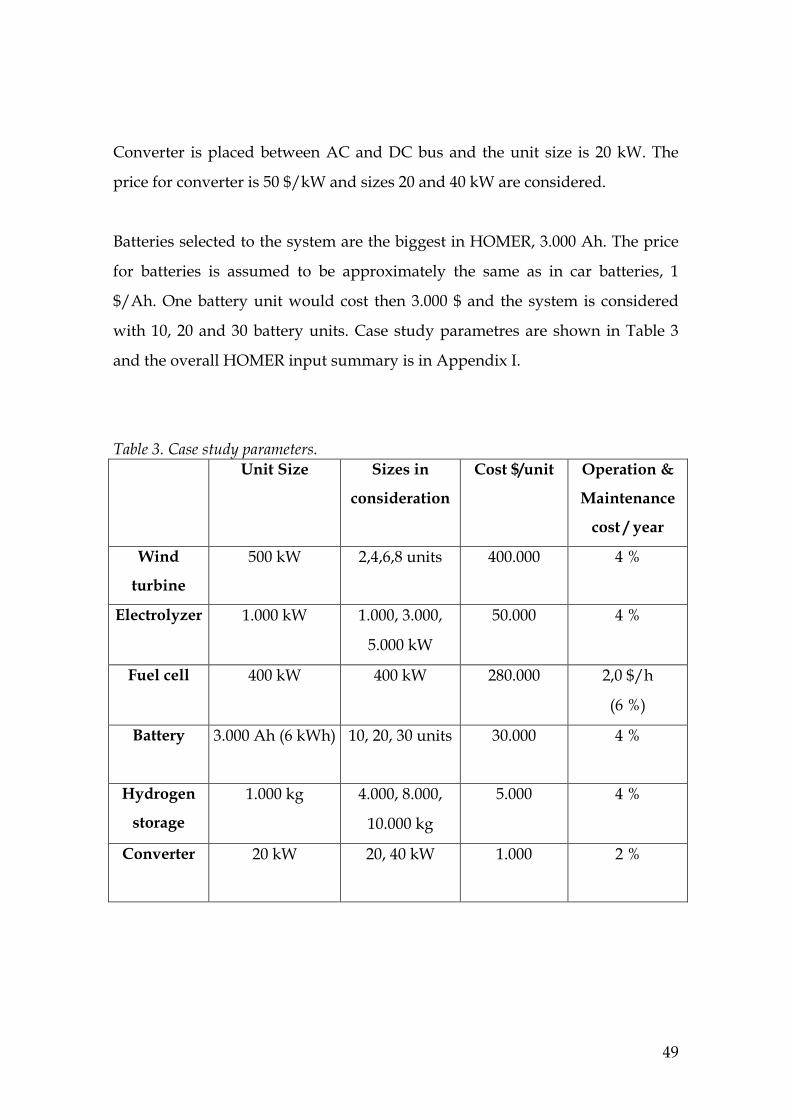
with 10, 20 and 30 battery units. Case study parametres are shown in Table 3
and the overall HOMER input summary is in Appendix I.
Table 3. Case study parameters.
Unit Size Sizes in
consideration
Cost $/unit Operation &
Maintenance
cost / year
Wind
turbine
500 kW 2,4,6,8 units 400.000 4 %
Electrolyzer 1.000 kW 1.000, 3.000,
5.000 kW
50.000 4 %
Fuel cell
400 kW 400 kW 280.000 2,0 $/h
(6 %)
Battery
3.000 Ah (6 kWh) 10, 20, 30 units 30.000 4 %
Hydrogen
storage
1.000 kg 4.000, 8.000,
10.000 kg
5.000 4 %
Converter
20 kW 20, 40 kW 1.000 2 %
50
8.3 Results
The different component sizes were fed to HOMER, which then calculated all
possible combinations with the given figures. There were 216 combinations
with these different component sizes, starting from 2 x 500 kW wind power
where the capacity shortage was 38 %, to 8 x 500 kW wind power where 37 % of
the total electrical energy production was excess electricity. The criterion to the
chosen combination of component sizes was that there should be no capacity
shortage with the most affordable cost.
The results suggest the stand-alone system to be most cost-effective and
without capacity shortage, with 3 MW wind power, 3.000 kW electrolyser,
10.000 kg hydrogen tank, 400 kW fuel cell, 20 kW converter and 10 units of
3.000 Ah batteries. System components in and sizes are shown in Figure 13.
Figure 13. Case study system components and sizes.
51
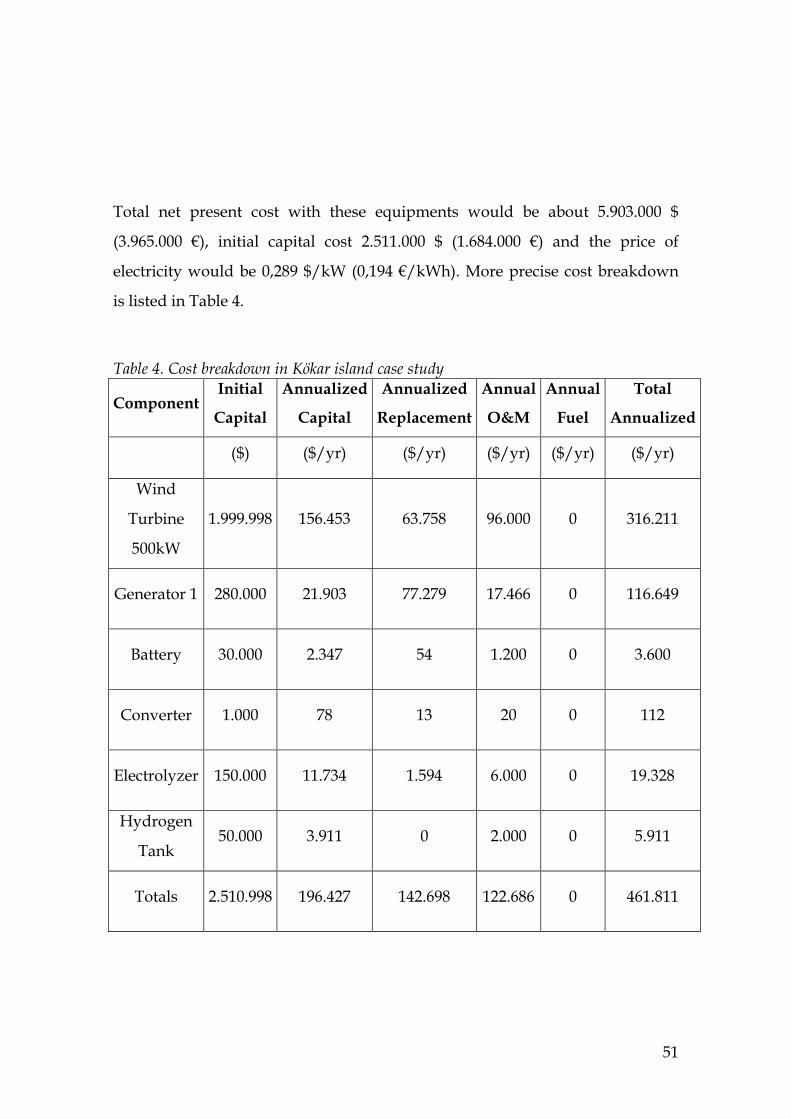
Total net present cost with these equipments would be about 5.903.000 $
(3.965.000 €), initial capital cost 2.511.000 $ (1.684.000 €) and the price of
electricity would be 0,289 $/kW (0,194 €/kWh). More precise cost breakdown
is listed in Table 4.
Table 4. Cost breakdown in Kökar island case study
Component Initial
Capital
Annualized
Capital
Annualized
Replacement
Annual
O&M
Annual
Fuel
Total
Annualized
($) ($/yr) ($/yr) ($/yr) ($/yr) ($/yr)
Wind
Turbine
500kW
1.999.998 156.453 63.758 96.000 0 316.211
Generator 1 280.000 21.903 77.279 17.466 0 116.649
Battery 30.000 2.347 54 1.200 0 3.600
Converter 1.000 78 13 20 0 112
Electrolyzer 150.000 11.734 1.594 6.000 0 19.328
Hydrogen
Tank 50.000 3.911 0 2.000 0 5.911
Totals 2.510.998 196.427 142.698 122.686 0 461.811
52
Kökar Island already has a grid connection, but if compared to a place without
grid connection, it would be economically more beneficial to build this kind of
system if existing grid would be further than 287 km. This result is based on the
assumptions that electricity price in grid is 0,10 € (0,148 $), capital cost for
building a grid 8.000 $/km and operation and maintenance cost 160
$/km/year.
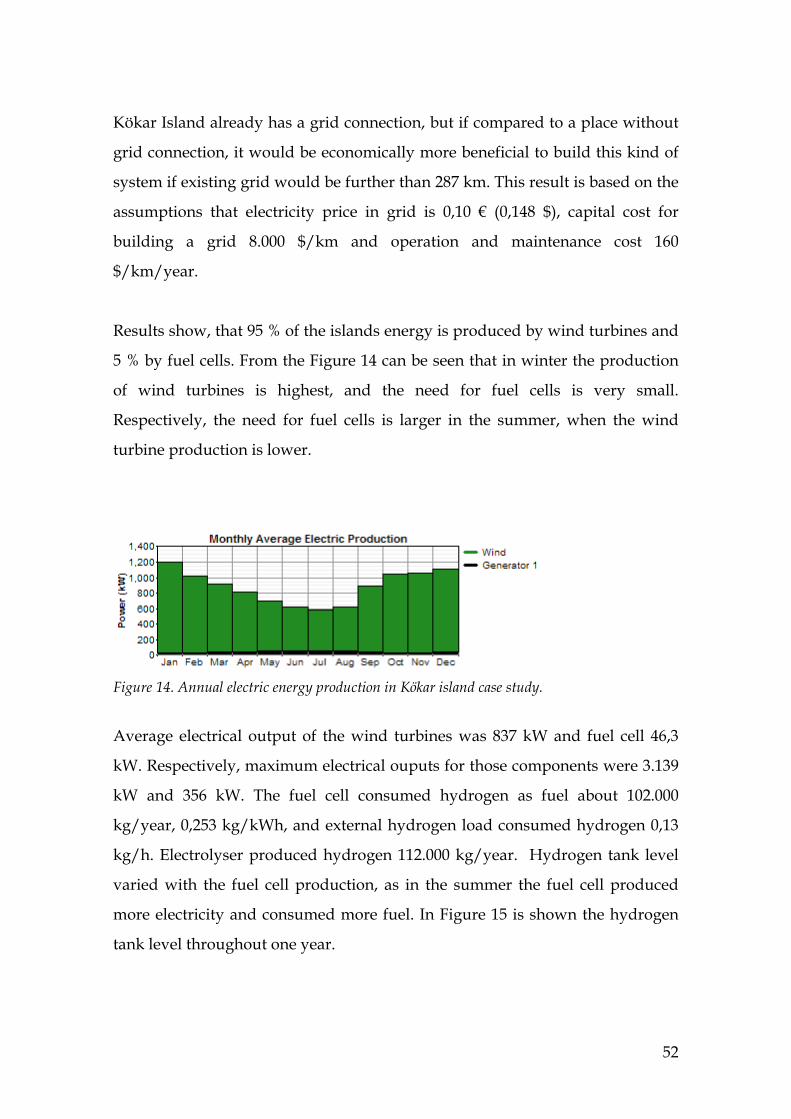
Results show, that 95 % of the islands energy is produced by wind turbines and
5 % by fuel cells. From the Figure 14 can be seen that in winter the production
of wind turbines is highest, and the need for fuel cells is very small.
Respectively, the need for fuel cells is larger in the summer, when the wind
turbine production is lower.
Figure 14. Annual electric energy production in Kökar island case study.
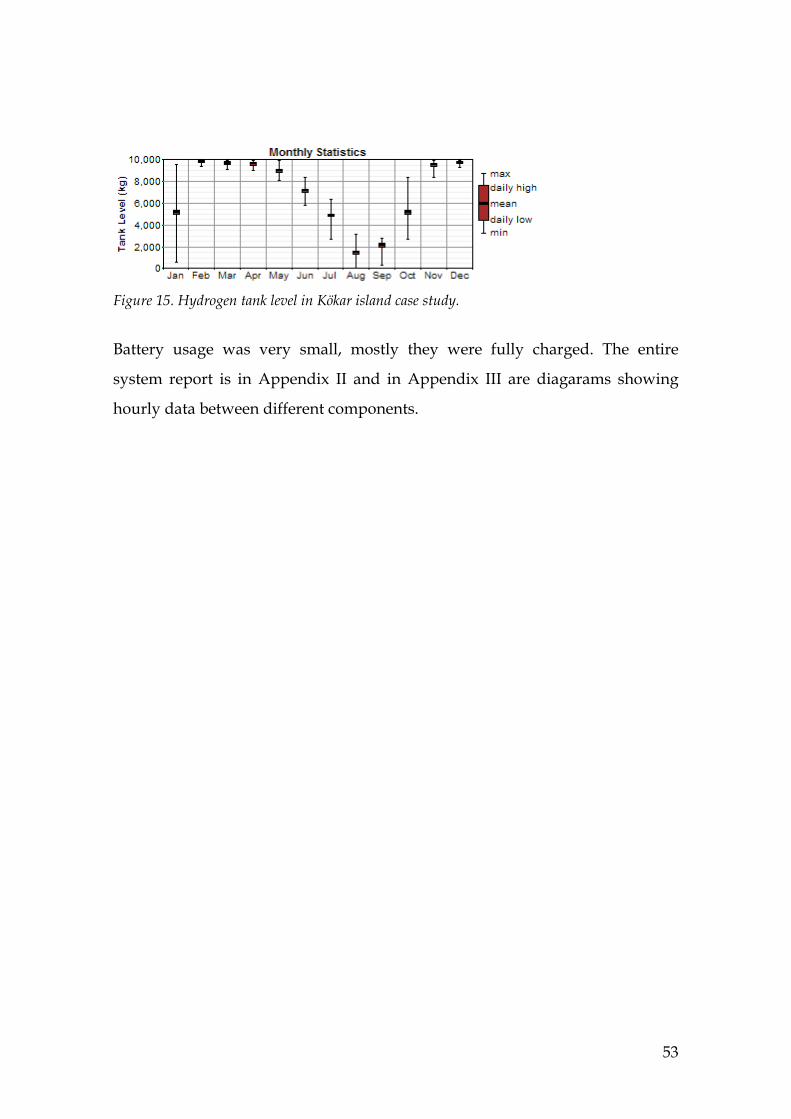
Average electrical output of the wind turbines was 837 kW and fuel cell 46,3
kW. Respectively, maximum electrical ouputs for those components were 3.139
kW and 356 kW. The fuel cell consumed hydrogen as fuel about 102.000
kg/year, 0,253 kg/kWh, and external hydrogen load consumed hydrogen 0,13
kg/h. Electrolyser produced hydrogen 112.000 kg/year. Hydrogen tank level
varied with the fuel cell production, as in the summer the fuel cell produced
more electricity and consumed more fuel. In Figure 15 is shown the hydrogen
tank level throughout one year.
53
Figure 15. Hydrogen tank level in Kökar island case study.
Battery usage was very small, mostly they were fully charged. The entire
system report is in Appendix II and in Appendix III are diagarams showing
hourly data between different components.
54
9 CONCLUSIONS
The imminent climate change forces us to cut up large scale use of fossil fuels
and replace them with alternative energy sources. Renewable means of
producing energy are ancient, but the modern study of them has begun no
more than few decades ago. Today technology is quite ready, although it still
needs large investment from governments. Finland has a great capacity to
produce wind power, especially in coastlines.
The Kökar island case study in this research gives an example of a fully
renewable system in remote areas. The results show that the island can not be
self-sufficient in terms of power with the existing 500 kW wind turbine. If a fuel
cell system were used with the existing turbine, the island would need 60-70 %
of the total electricity consumption from the grid. By adding wind power to six
units (3 MW) and building fuel cell system with it, the island could be entirely
self-sufficient with power. Results suggests the price of electricity to be 0,191
€/kWh, which is slightly more than electricity price from the grid. Dominant
figure in cost calculations is the price of wind turbines, followed by fuel cell
costs. Costs of these renewable systems are about to decrease within the next
years by technology developments, standardisation, mass-production, and
greater competitivness.
The results of the case study show that this type of wind hydrogen system is
ideal for remote areas, which are far away from the existing grid. Particularly
when the place in question is an island and the grid would need to be built
under sea or lake. This type of system would also be good in smaller scale, for
example in summer/winter cottages, where the other resource of power could
be solar cell.

55
ACKNOWLEDGEMENT
I would like to thank everyone who has helped me along the way. Especially
Jussi Maunuksela for guidance and support. I also express my gratitude for
Professor Korppi-Tommola from giving me the idea of this topic and kindly red
this draft and adviced me.
56
REFERENCES
[1] G. Boyle, Renewable energy – Power for a sustainable future, Oxford
University Press, 1996
[2] Power Stations, Lee Ranch wind speed frecuency,
http://www.powerstations.cn/2007/07/19/lee-ranch-wind-speed-frequency ,
sited 20.10.2007
[3] Iowa Energy Center, Wind Energy Manual, Main components of a wind
turbine, http://www.energy.iastate.edu/renewable/wind/wem/wem-
07_systems.html
[4] A. Gonzalez, E. McKeogh, B. O. Gallachoir, The role in high wind energy
penetration systems: The Irish case, Renewable Energy vol. 29, issue 4, April
2004, p. 471-489
[5] W. Smith, The role of fuel cells in energy storage, Journal of power sources,
Volume 86, Issues 1-2, March 2000, pages 74-83
[6] K. Agbossou, M. Kolhe, J. Hamelin, T.K. Bose, Performance of a stand alone
renewable energy system based on energy storage as hydrogen, IEEE
Transactions on Energy Conversion, vol. 19, no. 3, september 2004
[7] Laboratory of Advanced Energy Systems, New & Renewable Energy
Systems Group, Theoretical Cell Voltage,
http://www.tkk.fi/Units/AES/projects/renew/fuelcell/fc_3.html , sited
02.11.2007
57
[8] O. Ulleberg, Modeling of advanced alkaline electrolyzers: a system
simulation approach, International Journal of Hydrogen Energy, Volume 28,
Issue 1, January 2003, pages 21-33
[9] T. Ackermann, Wind power in power systems, John Wiley & Sons, 2005
[10] Committee on alternatives and strategies for future hydrogen production
and use(CB), Hydrogen Economy: Opportunities, Costs, Barriers and R & D
Needs, National Academies Press, 2004
[11] K. Agbossou, R. Chahine, J. Hamelin, F. Laurencelle, A. Anouar, J.-M. St-
Arnaud, T.K. Bose, Renewable energy systems based on hydrogen fo remote
applications, Journal of Power Sources, Volume 96, 2001, pages 168-172
[12] R. Alanen, T. Koljonen, S. Hukari, P. Saari. Energian varastoinnin nykytila
[Current Trends in Energy Storage Technology]. Espoo 2003. VTT Tiedotteita –
Research Notes 2199. 169s. + liitt. 60s
[13] P. W. Atkins, Physical Chemistry 6th addition, Oxford; 1999
[14] O. Robinson, Holtzclaw, General Cheistry with Qualitative analysis, 10th
addition, Houghton miffin Company, Boston, New York; 1997
[15] Iowa Department of Natural Resources, Energy and Waste Management
Assistance Bureau, Emerging technologies: Fuel Cells, 2002, Internet:
http://www.state.ia.us/dnr/energy/MAIN/PUBS/WHEA/EMERGING.HT
M, siten 03.11.2007
58
[16] NFRC, National Fuel Cell Research Center. “Fuel Cell Types”. Internet:
http://www.nfcrc.uci.edu/fcresources/FCexplained/FC_Types.htm. Sited
03.11.06
[17] Fuel Cell Publications, Fuel Cell Glossary, Internet:
http://www.sanewsletters.com/FCIR/glossary3.asp#M
[18] D. Myers, J. D. Carter, J. Ralph, T. Cruse, R. Kumar, Bipolar Plate-
Supported Solid Oxide Fuel Cell, Argonne national laboratory,
FY 2003 Progress report, Internet:
http://www.eere.energy.gov/hydrogenandfuelcells/pdfs/ivf3_myers.pdf
[19] Y.H. Li, S. S. Choi, S. Rajakaruna, An Analysis of the Control and Operation
of a Solid Oxide Fuel-Cell Power Plant in an Isolated System, IEEE transactions
on energy conversion, Volume 20, no. 2, June 2005
[20] S. Kelouwani, K. Agbossou, R. Chahine, Model for energy conversion in
renewable energy system with hydrogen storage, Journal of Power Sources,
Volume 140, Issue 2, February 2005, pages 392-399
[21] Natural Resources Canada, Stand-alone Wind Energy Systems; A Buyer´s
Guide, Her Majesty the Queen in Right of Canada, 2000
[22] K. Agbossou, M. Kolhe, J. Hamelin, E. Bernier, T.K. Bose, Electrolytic
hydrogen based renewable energy system with oxygen recovery and re-
utilization, Renewable Energy 29 (2004), 1305-1318
[23] Ellen Liu, Large Scale Wind Hydrogen Systems, GE Global Research, sept,
2003
59
[24] M. Kolhe, K. Agbossou, J. Hamelin, T.K. Bose, Analytical model for
predicting the performance of photovoltaic array coupled with a wind turbine
in a stand alone renewable energy system based on hydrogen, Renewable
Energy 28 (2003), 727-742
[25] K. Agbossou, M. Kolhe, T.K. Bose, Autonomous operation and control of
stand-alone renewable energy system with hydrogen storage, 22nd IASTED
International Conference Modelling, Identification, and Control (MIC2003), Feb
2003
[26] J. Cotrell, W. Pratt, Modeling the feasibility of using fuel cells, and
hydrogen internal combustion engines in remote renewable energy systems
(Preprint), National Renewable Energy Laboratory (NREL) Conference paper,
May 2003
[27] National Renewable Energy Laboratory (NREL), HOMER Brochure,
Internet:
http://www.nrel.gov/homer/downloads/HOMERBrochure_English.pdf,
sited 03.11.2007
[28] E. Bernier, J. Hamelin, K. Agbossou, T.K. Bose, Electric round-trip
efficiency of hydrogen and oxygen based energy storage, International Journal
of Hydrogen Energy, Volume 30, Issue 2, February 2005, pages 105-111
[29] United States Department of Energy, Energy Efficiency and Renewable
Energy, Fuel Cell Vehicles, http://www.fueleconomy.gov/feg/fuelcell.shtml,
sited 07.08.2007
60
[30] R.M. Moore, K.H. Hauer, D. Friedman, J. Cunningham, P. Badrinarayanan,
S. Ramaswamy, A. Eggert, A dynamic simulation tool for hydrogen fuel cell
vehicles, Journal of Power Sources, Volume 141, 2005, pages 272-285
[31] H. Holttinen, Tuulivoiman tuotantotilastot, vuosiraportti 2005, Espoo 2006,
VTT prosessit, VTT Working Papers 55
[32] H. Holttinen, Tuulivoiman tuotantotilastot, vuosiraportti 2006, Espoo 2007,
VTT prosessit, VTT Working Papers 80
[33] Danish Wind Industry Assosiation, What does a wind turbine cost?,
http://www.windpower.org/en/tour/econ/index.htm, sited 28.11.2007
[34] T.E. Lipman et al., Fuel Cell System Economics: Comparing the costs of
generating power with stationary and motor vehicle Pem fuel cell systems,
Energy Policy 32 (2004) 101-125
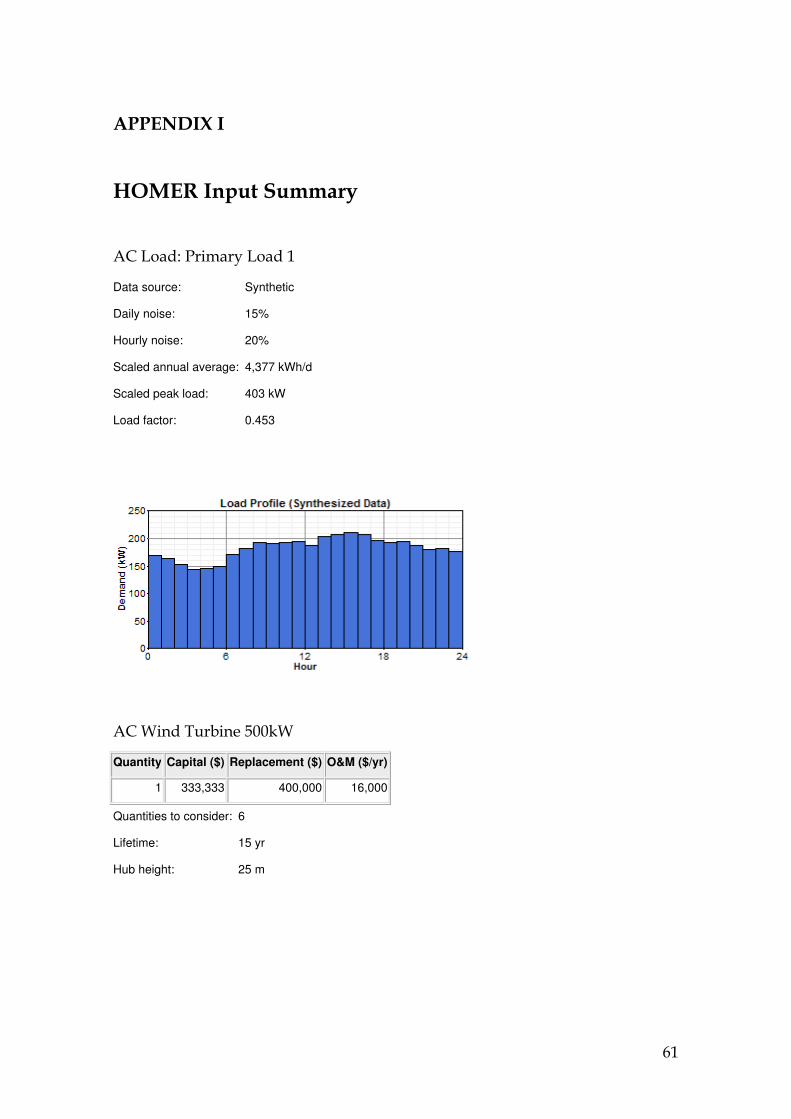
61
APPENDIX I
HOMER Input Summary
AC Load: Primary Load 1
Data source: Synthetic
Daily noise: 15%
Hourly noise: 20%
Scaled annual average: 4,377 kWh/d
Scaled peak load: 403 kW
Load factor: 0.453
AC Wind Turbine 500kW
Quantity Capital ($) Replacement ($) O&M ($/yr)
1 333,333 400,000 16,000
Quantities to consider: 6
Lifetime: 15 yr
Hub height: 25 m
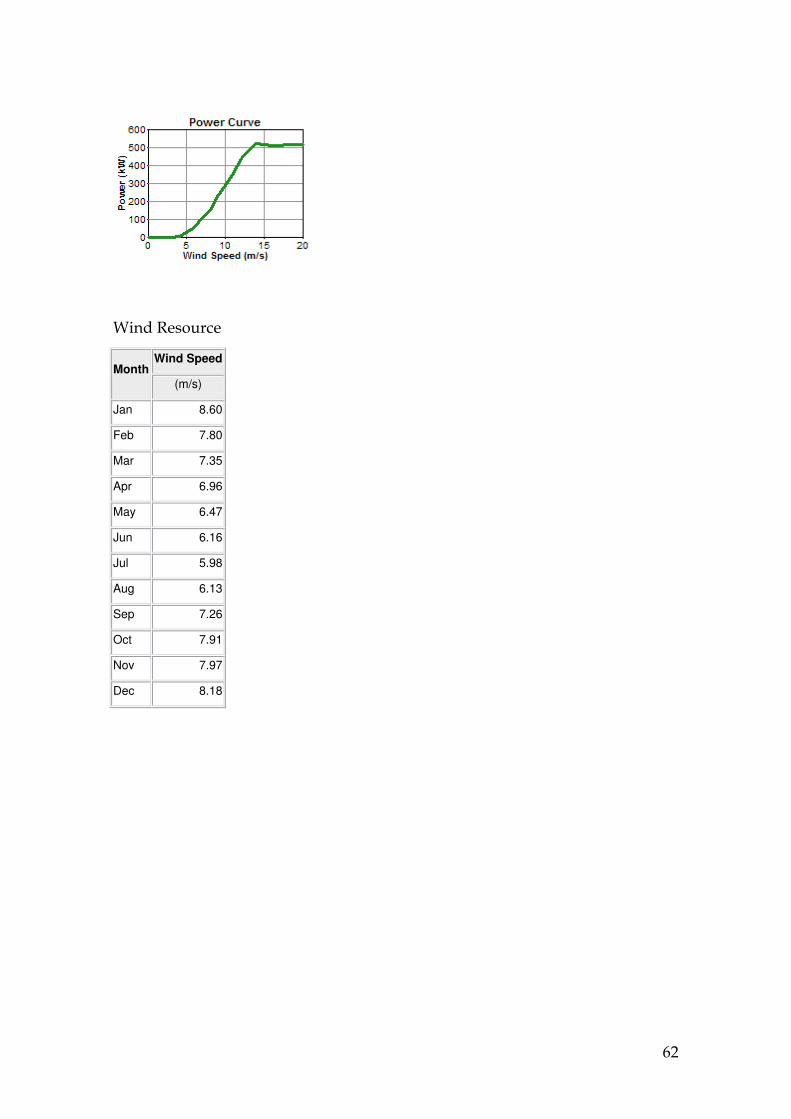
62
Wind Resource
Wind Speed Month
(m/s)
Jan 8.60
Feb 7.80
Mar 7.35
Apr 6.96
May 6.47
Jun 6.16
Jul 5.98
Aug 6.13
Sep 7.26
Oct 7.91
Nov 7.97
Dec 8.18
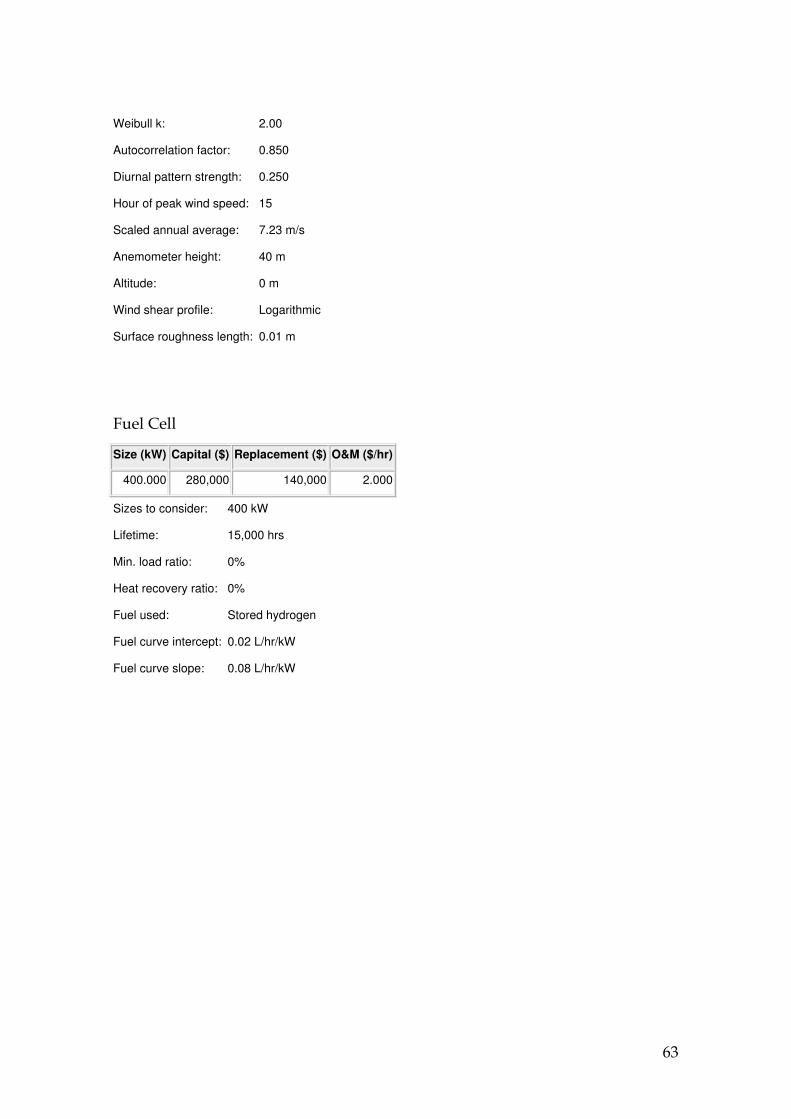
63
Weibull k: 2.00
Autocorrelation factor: 0.850
Diurnal pattern strength: 0.250
Hour of peak wind speed: 15
Scaled annual average: 7.23 m/s
Anemometer height: 40 m
Altitude: 0 m
Wind shear profile: Logarithmic
Surface roughness length: 0.01 m
Fuel Cell
Size (kW) Capital ($) Replacement ($) O&M ($/hr)
400.000 280,000 140,000 2.000
Sizes to consider: 400 kW
Lifetime: 15,000 hrs
Min. load ratio: 0%
Heat recovery ratio: 0%
Fuel used: Stored hydrogen
Fuel curve intercept: 0.02 L/hr/kW
Fuel curve slope: 0.08 L/hr/kW
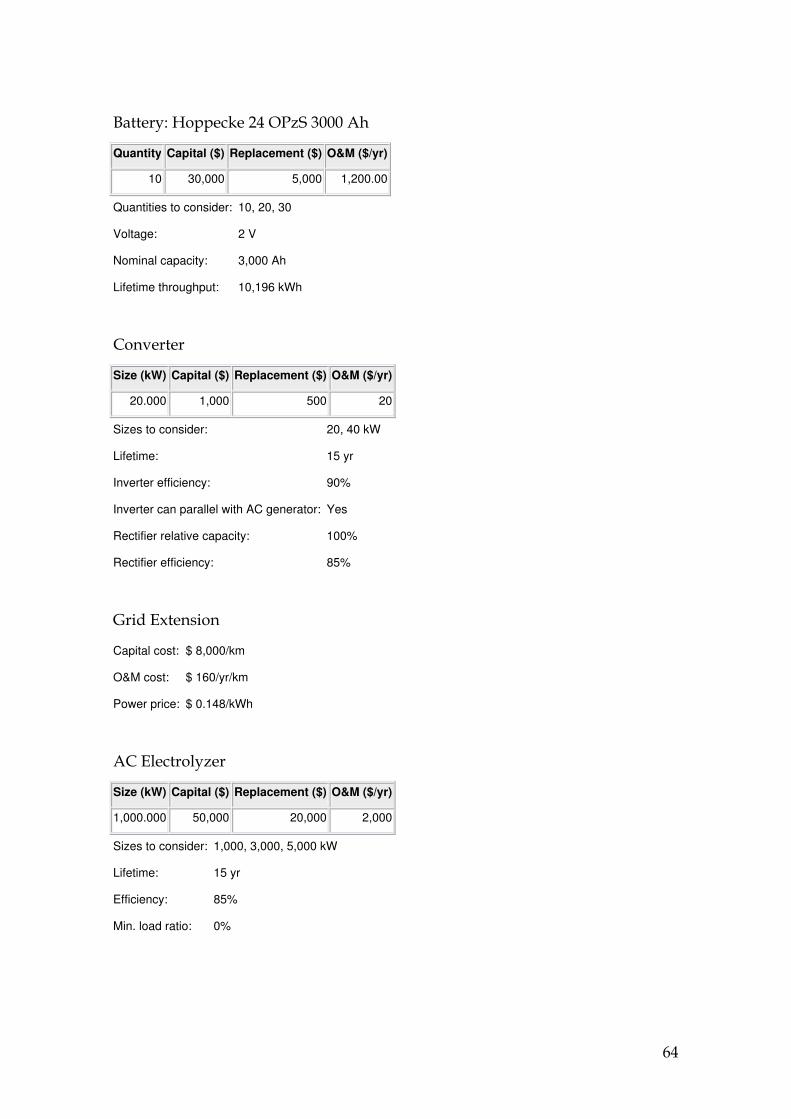
64
Battery: Hoppecke 24 OPzS 3000 Ah
Quantity Capital ($) Replacement ($) O&M ($/yr)
10 30,000 5,000 1,200.00
Quantities to consider: 10, 20, 30
Voltage: 2 V
Nominal capacity: 3,000 Ah
Lifetime throughput: 10,196 kWh
Converter
Size (kW) Capital ($) Replacement ($) O&M ($/yr)
20.000 1,000 500 20
Sizes to consider: 20, 40 kW
Lifetime: 15 yr
Inverter efficiency: 90%
Inverter can parallel with AC generator: Yes
Rectifier relative capacity: 100%
Rectifier efficiency: 85%
Grid Extension
Capital cost: $ 8,000/km
O&M cost: $ 160/yr/km
Power price: $ 0.148/kWh
AC Electrolyzer
Size (kW) Capital ($) Replacement ($) O&M ($/yr)
1,000.000 50,000 20,000 2,000
Sizes to consider: 1,000, 3,000, 5,000 kW
Lifetime: 15 yr
Efficiency: 85%
Min. load ratio: 0%
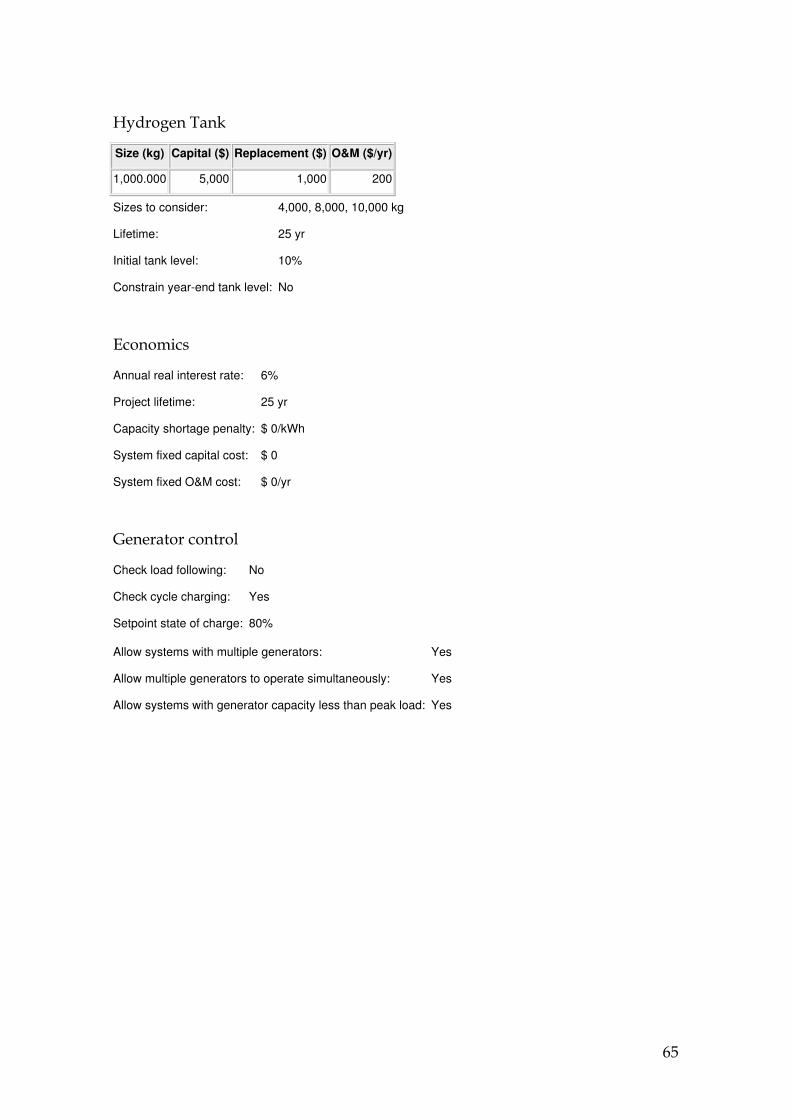
65
Hydrogen Tank
Size (kg) Capital ($) Replacement ($) O&M ($/yr)
1,000.000 5,000 1,000 200
Sizes to consider: 4,000, 8,000, 10,000 kg
Lifetime: 25 yr
Initial tank level: 10%
Constrain year-end tank level: No
Economics
Annual real interest rate: 6%
Project lifetime: 25 yr
Capacity shortage penalty: $ 0/kWh
System fixed capital cost: $ 0
System fixed O&M cost: $ 0/yr
Generator control
Check load following: No
Check cycle charging: Yes
Setpoint state of charge: 80%
Allow systems with multiple generators: Yes
Allow multiple generators to operate simultaneously: Yes
Allow systems with generator capacity less than peak load: Yes
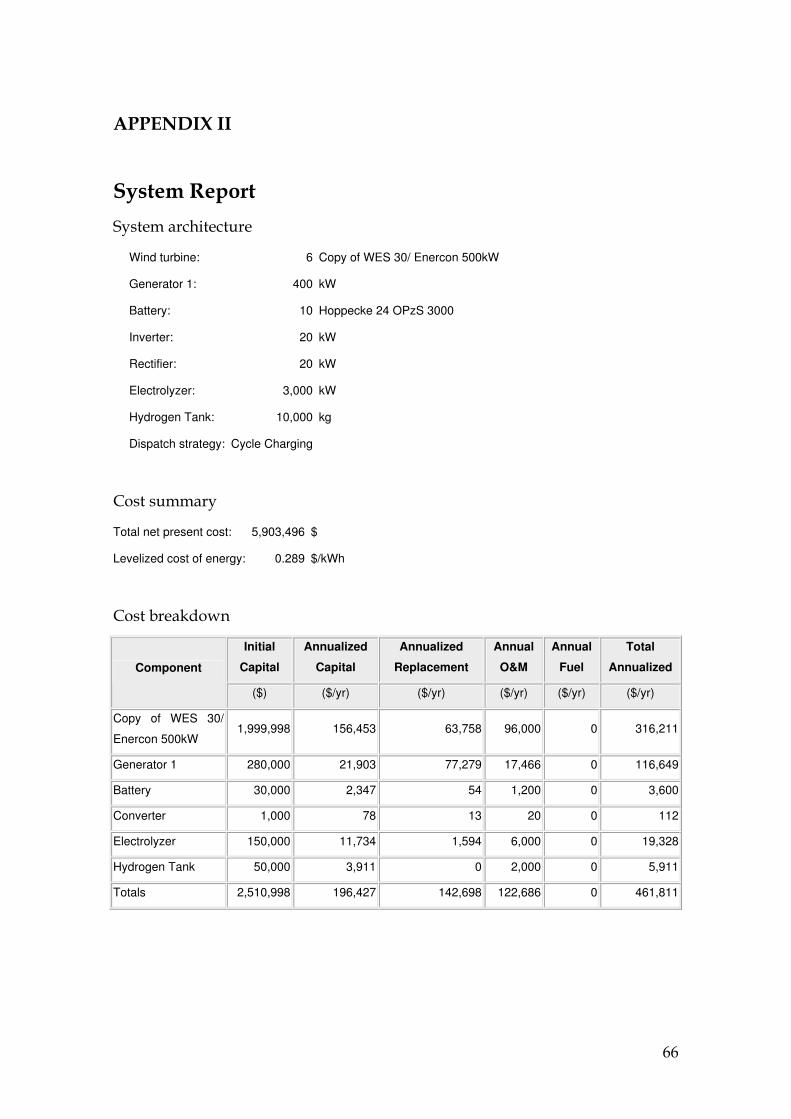
66
APPENDIX II
System Report
System architecture
Wind turbine: 6 Copy of WES 30/ Enercon 500kW
Generator 1: 400 kW
Battery: 10 Hoppecke 24 OPzS 3000
Inverter: 20 kW
Rectifier: 20 kW
Electrolyzer: 3,000 kW
Hydrogen Tank: 10,000 kg
Dispatch strategy: Cycle Charging
Cost summary
Total net present cost: 5,903,496 $
Levelized cost of energy: 0.289 $/kWh
Cost breakdown
Initial
Capital
Annualized
Capital
Annualized
Replacement
Annual
O&M
Annual
Fuel
Total
Annualized Component
($) ($/yr) ($/yr) ($/yr) ($/yr) ($/yr)
Copy of WES 30/
Enercon 500kW 1,999,998 156,453 63,758 96,000 0 316,211
Generator 1 280,000 21,903 77,279 17,466 0 116,649
Battery 30,000 2,347 54 1,200 0 3,600
Converter 1,000 78 13 20 0 112
Electrolyzer 150,000 11,734 1,594 6,000 0 19,328
Hydrogen Tank 50,000 3,911 0 2,000 0 5,911
Totals 2,510,998 196,427 142,698 122,686 0 461,811
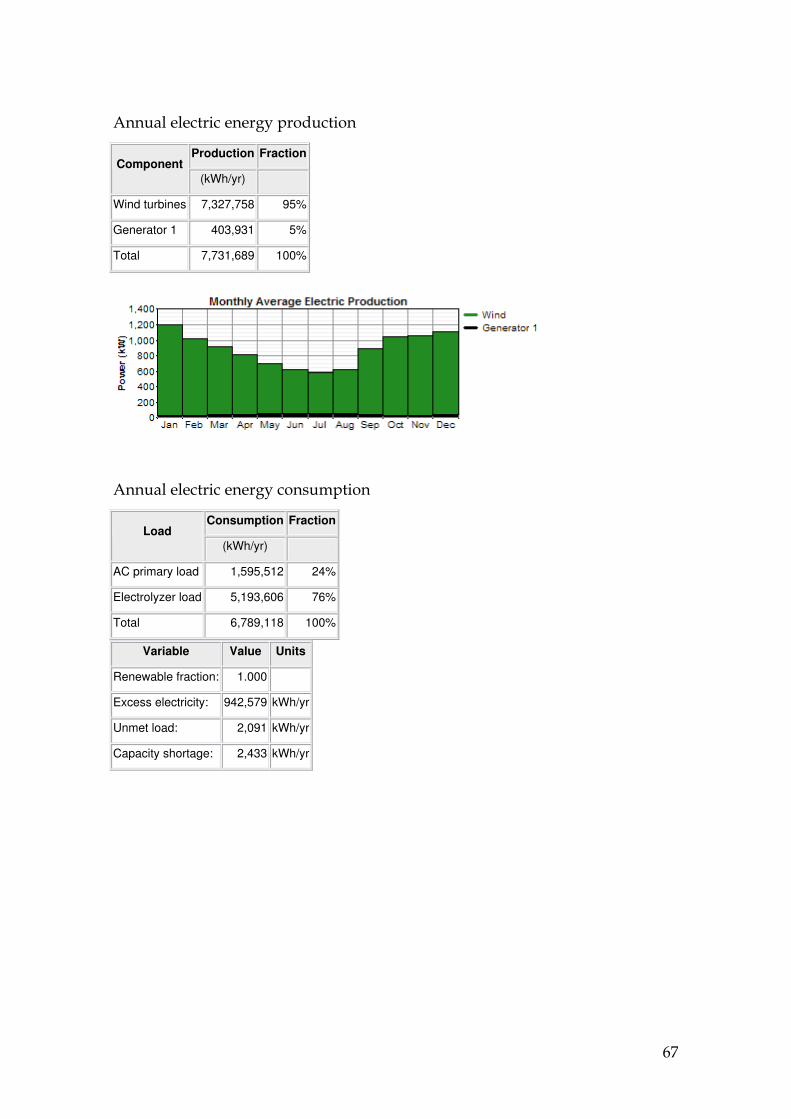
67
Annual electric energy production
Production Fraction Component
(kWh/yr)
Wind turbines 7,327,758 95%
Generator 1 403,931 5%
Total 7,731,689 100%
Annual electric energy consumption
Consumption Fraction Load
(kWh/yr)
AC primary load 1,595,512 24%
Electrolyzer load 5,193,606 76%
Total 6,789,118 100%
Variable Value Units
Renewable fraction: 1.000
Excess electricity: 942,579 kWh/yr
Unmet load: 2,091 kWh/yr
Capacity shortage: 2,433 kWh/yr
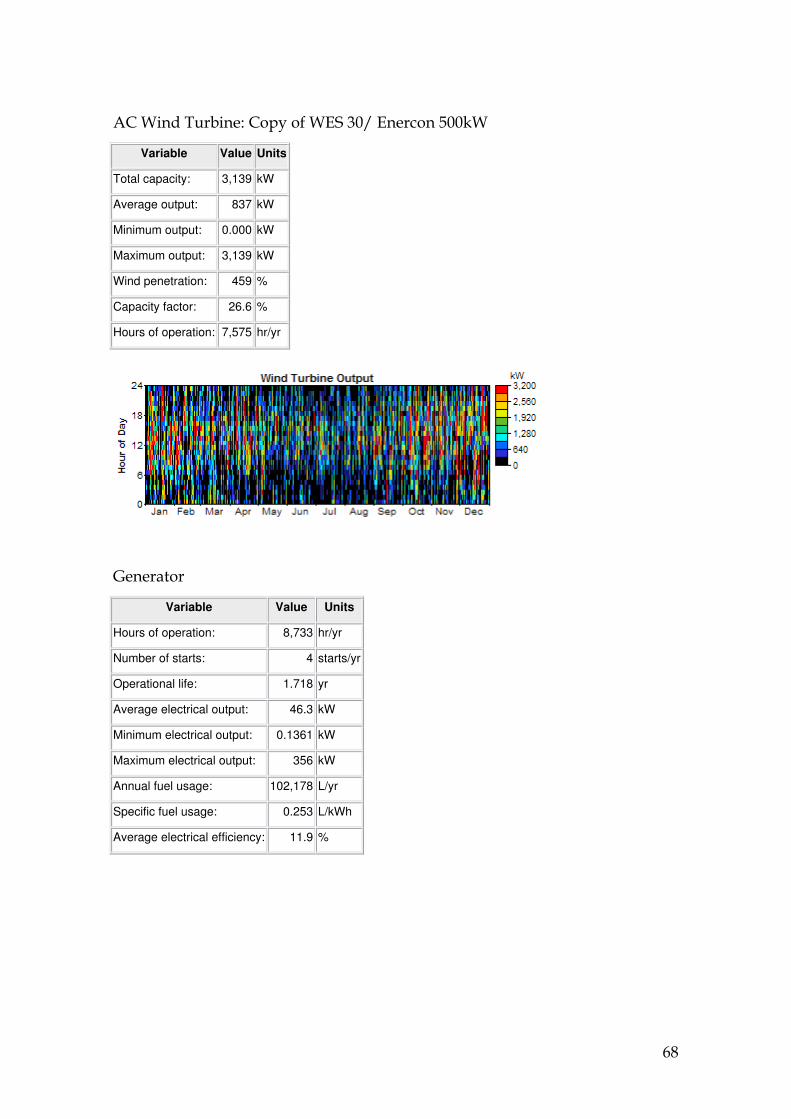
68
AC Wind Turbine: Copy of WES 30/ Enercon 500kW
Variable Value Units
Total capacity: 3,139 kW
Average output: 837 kW
Minimum output: 0.000 kW
Maximum output: 3,139 kW
Wind penetration: 459 %
Capacity factor: 26.6 %
Hours of operation: 7,575 hr/yr
Generator
Variable Value Units
Hours of operation: 8,733 hr/yr
Number of starts: 4 starts/yr
Operational life: 1.718 yr
Average electrical output: 46.3 kW
Minimum electrical output: 0.1361 kW
Maximum electrical output: 356 kW
Annual fuel usage: 102,178 L/yr
Specific fuel usage: 0.253 L/kWh
Average electrical efficiency: 11.9 %
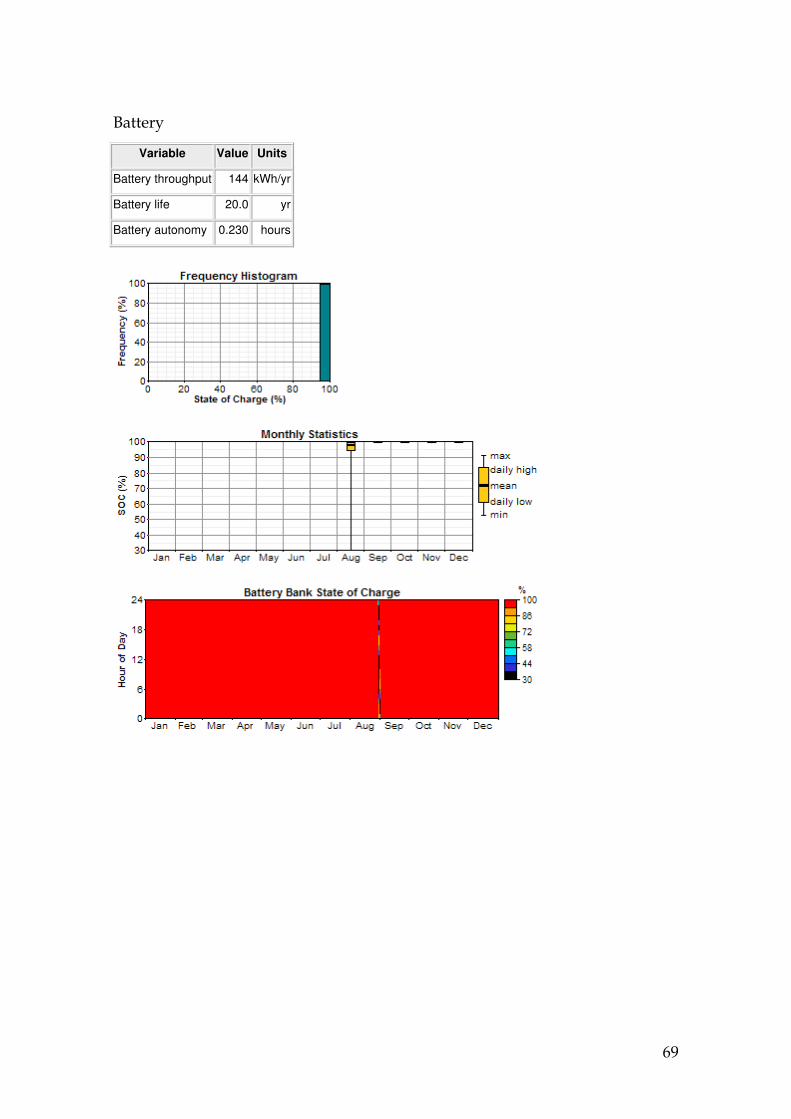
69
Battery
Variable Value Units
Battery throughput 144 kWh/yr
Battery life 20.0 yr
Battery autonomy 0.230 hours
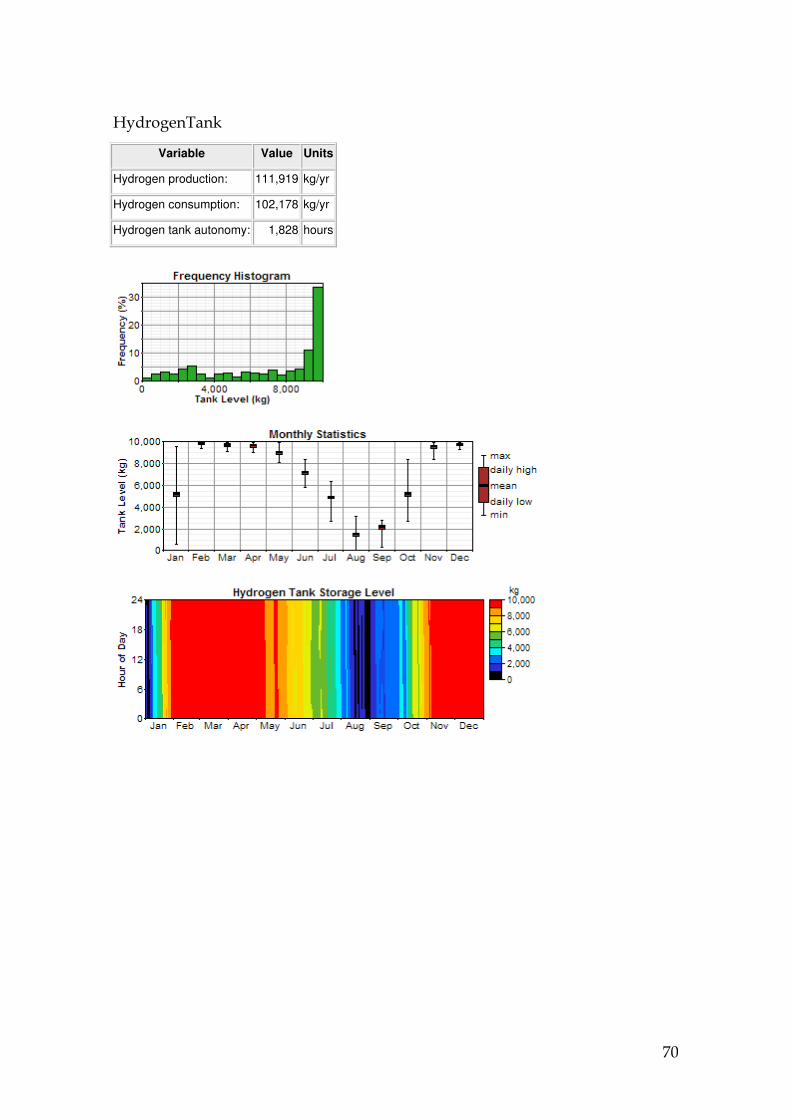
70
HydrogenTank
Variable Value Units
Hydrogen production: 111,919 kg/yr
Hydrogen consumption: 102,178 kg/yr
Hydrogen tank autonomy: 1,828 hours
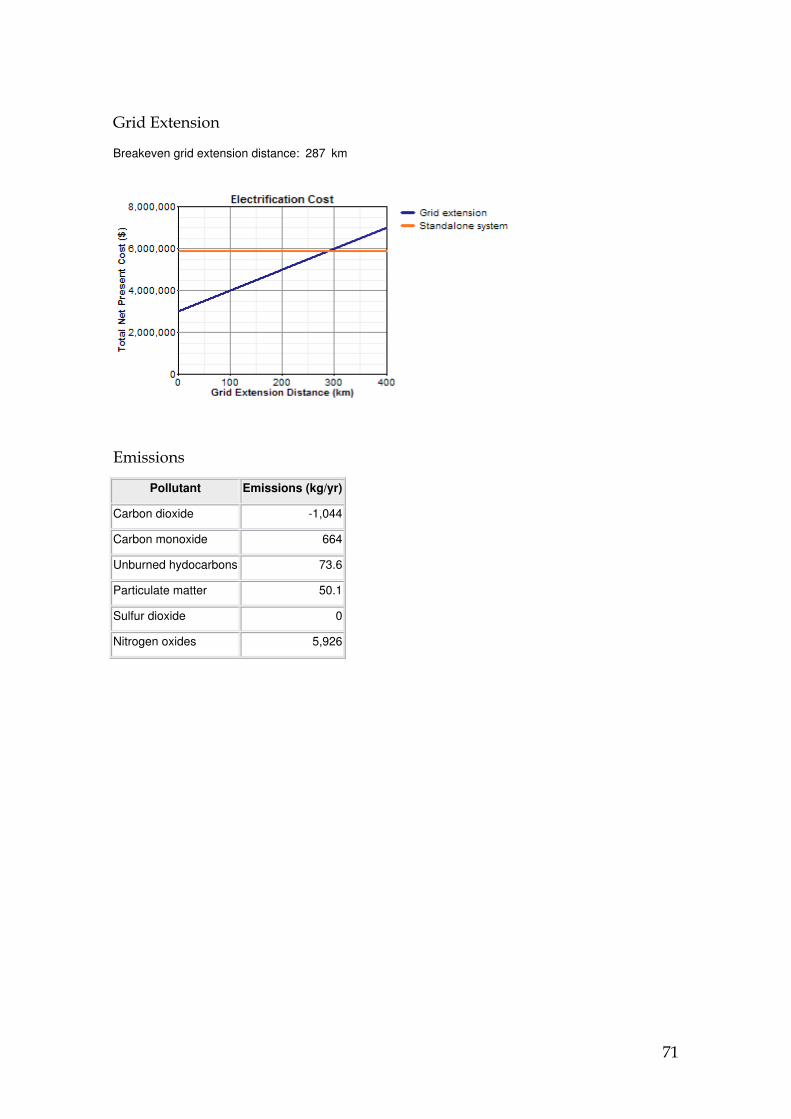
71
Grid Extension
Breakeven grid extension distance: 287 km
Emissions
Pollutant Emissions (kg/yr)
Carbon dioxide -1,044
Carbon monoxide 664
Unburned hydocarbons 73.6
Particulate matter 50.1
Sulfur dioxide 0
Nitrogen oxides 5,926
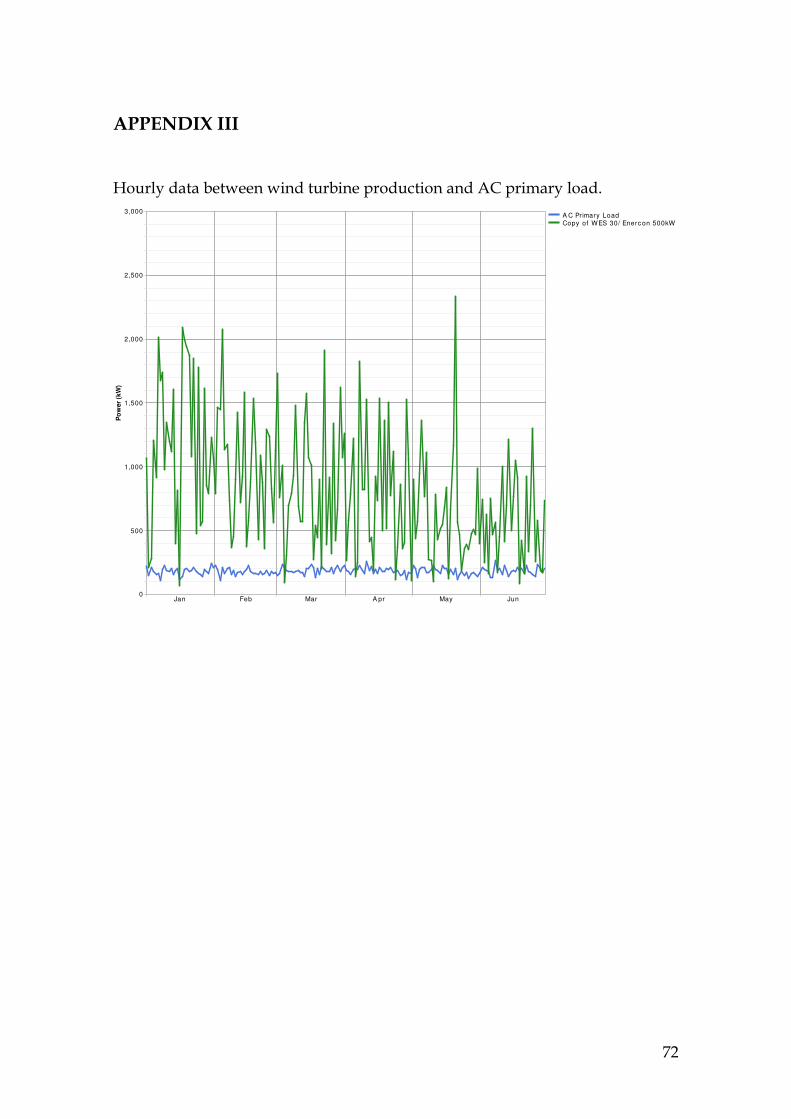
72
APPENDIX III
Hourly data between wind turbine production and AC primary load.
Jan Feb Mar A pr May Jun0
500
1,000
1,500
2,000
2,500
3,000
Po
wer
(kW
)
A C Primary LoadCopy of WES 30/ Enerc on 500kW
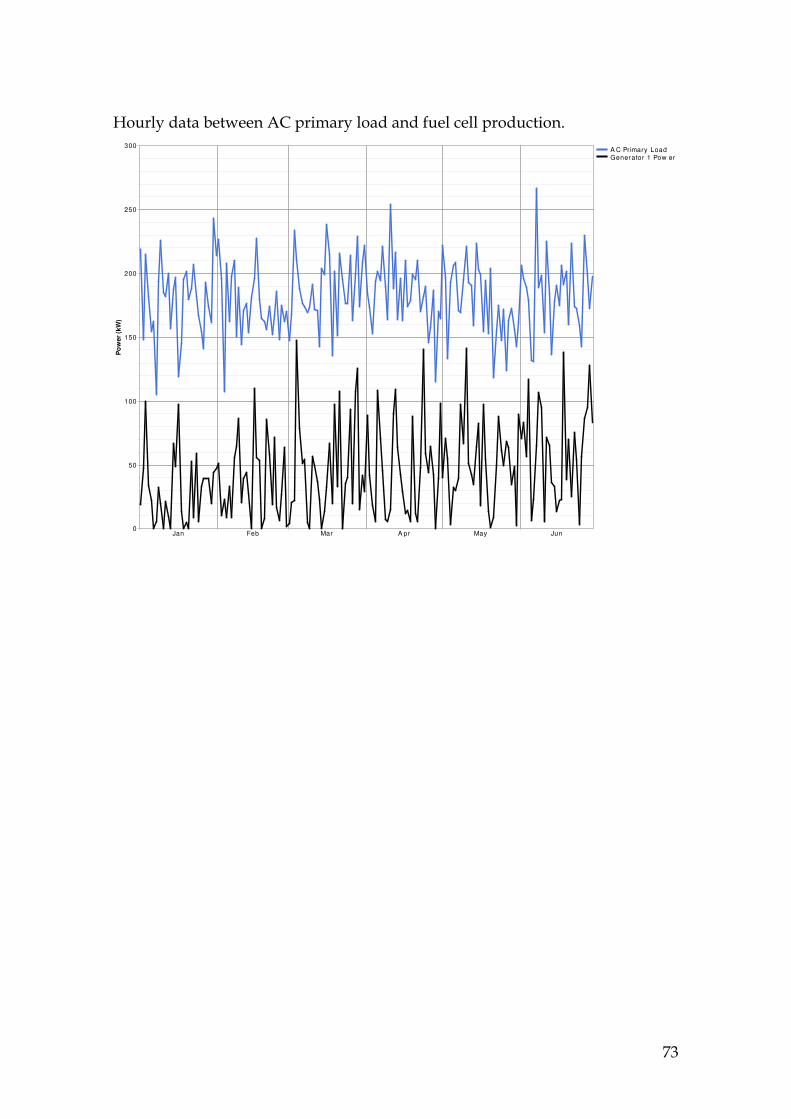
73
Hourly data between AC primary load and fuel cell production.
Jan Feb Mar A pr May Jun0
50
100
150
200
250
300
Po
wer
(kW
)
A C Primary LoadGenerator 1 Pow er
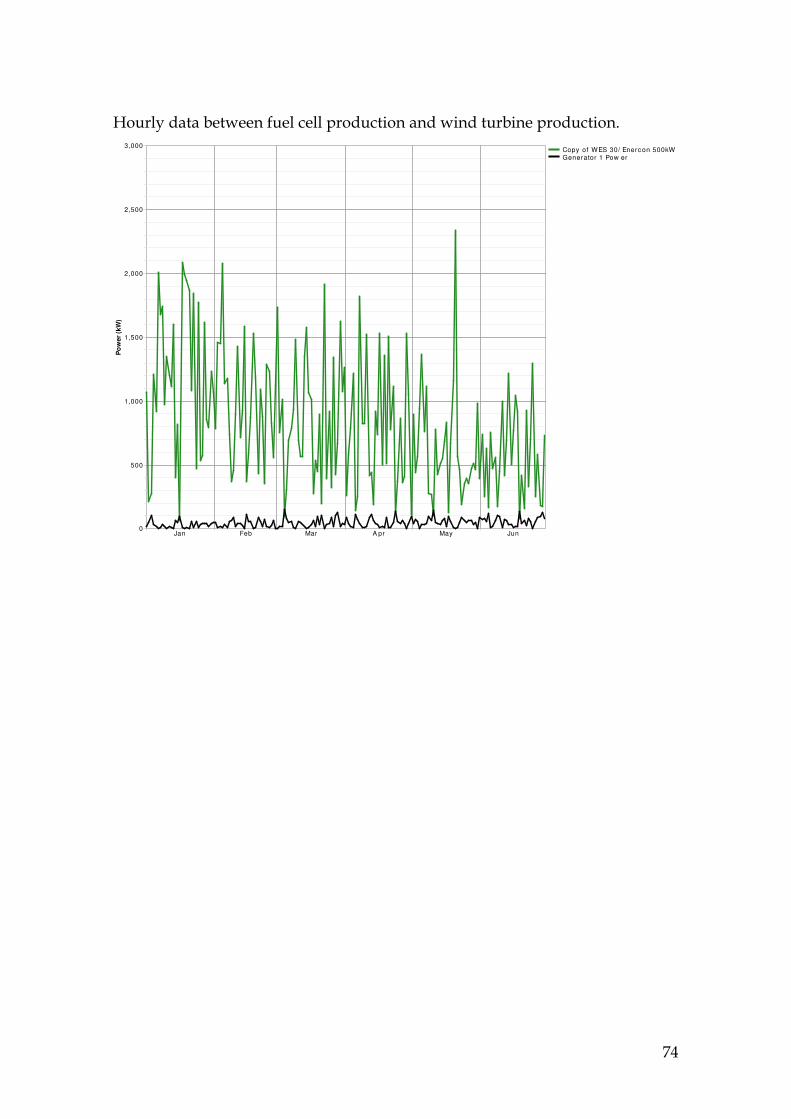
74
Hourly data between fuel cell production and wind turbine production.
Jan Feb Mar A pr May Jun0
500
1,000
1,500
2,000
2,500
3,000
Po
wer
(kW
)
Copy of WES 30/ Enerc on 500kWGenerator 1 Pow er
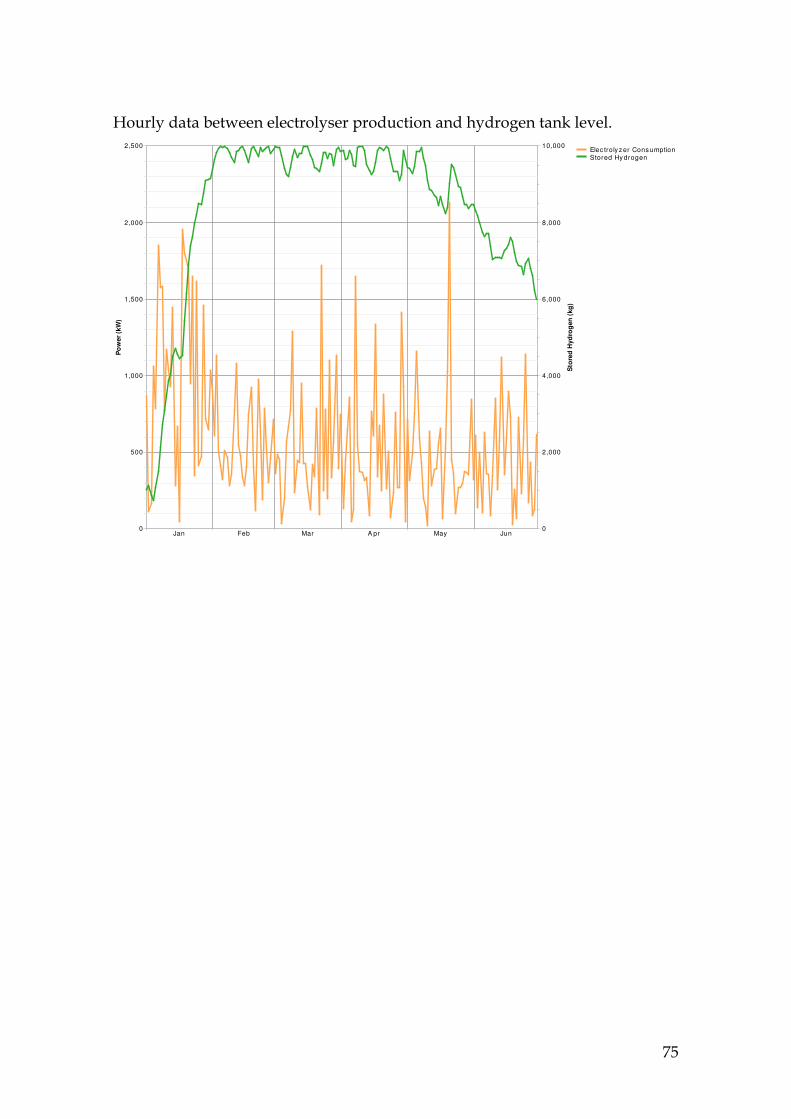
75
Hourly data between electrolyser production and hydrogen tank level.
0
2,000
4,000
6,000
8,000
10,000
Jan Feb Mar A pr May Jun0
500
1,000
1,500
2,000
2,500
Po
wer
(kW
)
Sto
red
Hyd
rog
en
(kg
)
Elec troly z er Cons umptionStored Hy drogen
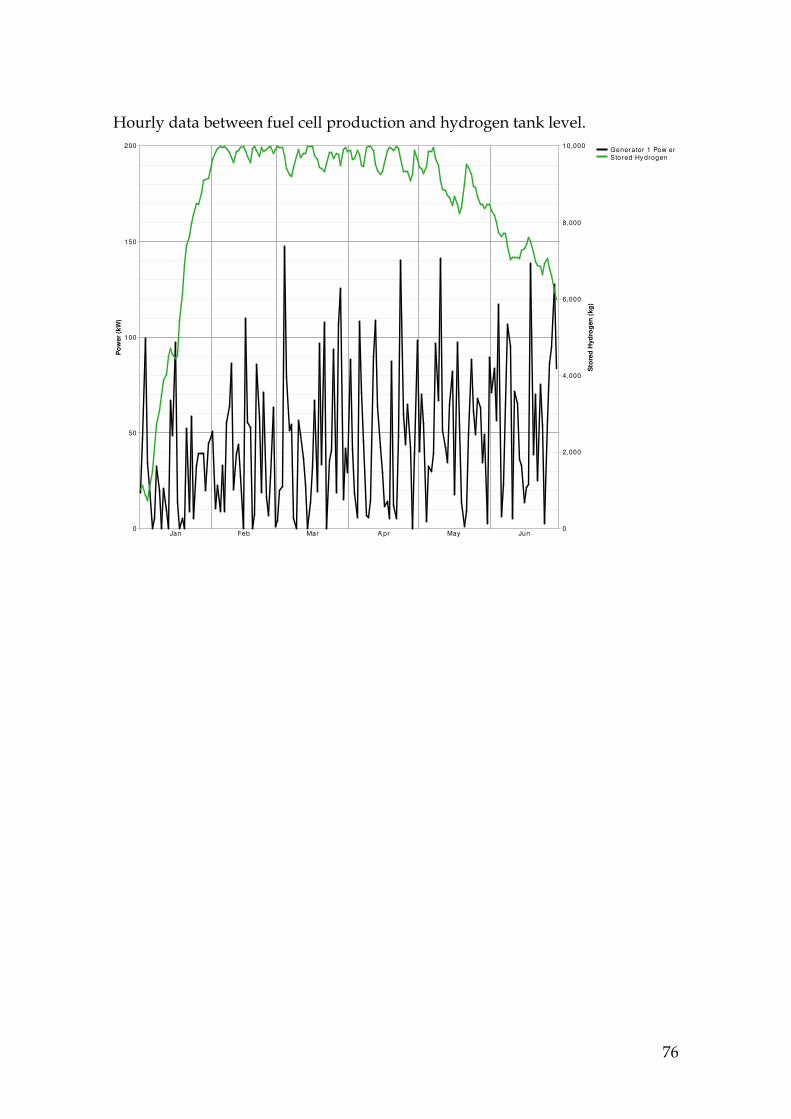
76
Hourly data between fuel cell production and hydrogen tank level.
0
2,000
4,000
6,000
8,000
10,000
Jan Feb Mar A pr May Jun0
50
100
150
200
Po
wer
(kW
)
Sto
red
Hyd
rog
en
(kg
)
Generator 1 Pow erStored Hy drogen