Embed Size (px)
Citation preview
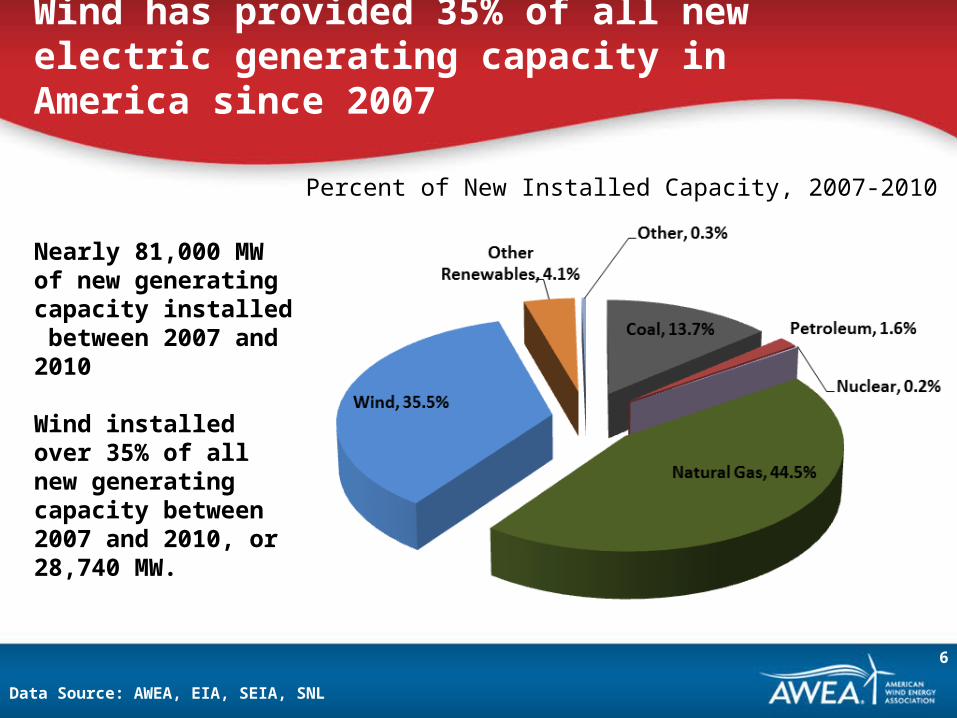
Wind has provided 35% of all new electric generating capacity in America since 2007
Data Source: AWEA, EIA, SEIA, SNL
Nearly 81,000 MW of new generating capacity installed between 2007 and 2010
Wind installed over 35% of all new generating capacity between 2007 and 2010, or 28,740 MW.
Percent of New Installed Capacity, 2007-2010
6
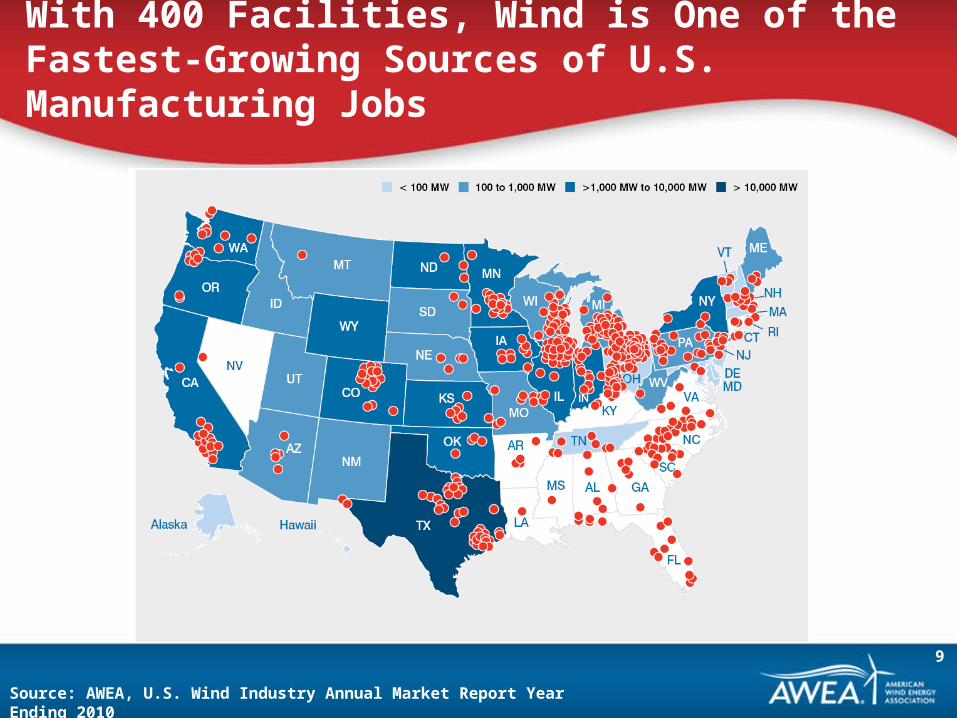
With 400 Facilities, Wind is One of the Fastest-Growing Sources of U.S. Manufacturing Jobs
Source: AWEA, U.S. Wind Industry Annual Market Report Year Ending 2010
9
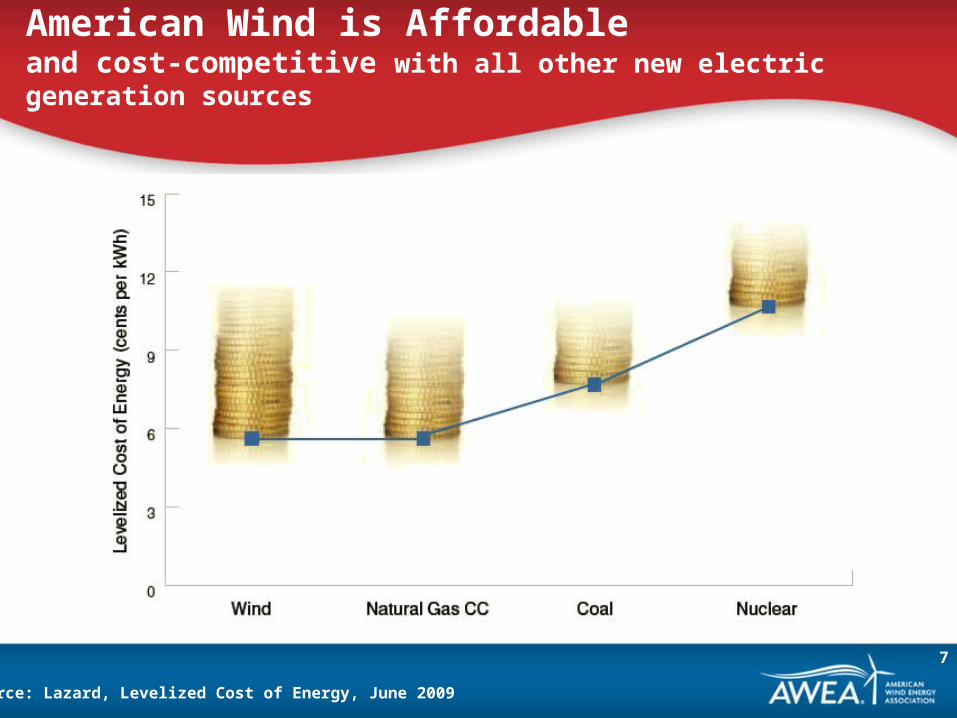
American Wind is Affordableand cost-competitive with all other new electric generation sources
Source: Lazard, Levelized Cost of Energy, June 2009
7
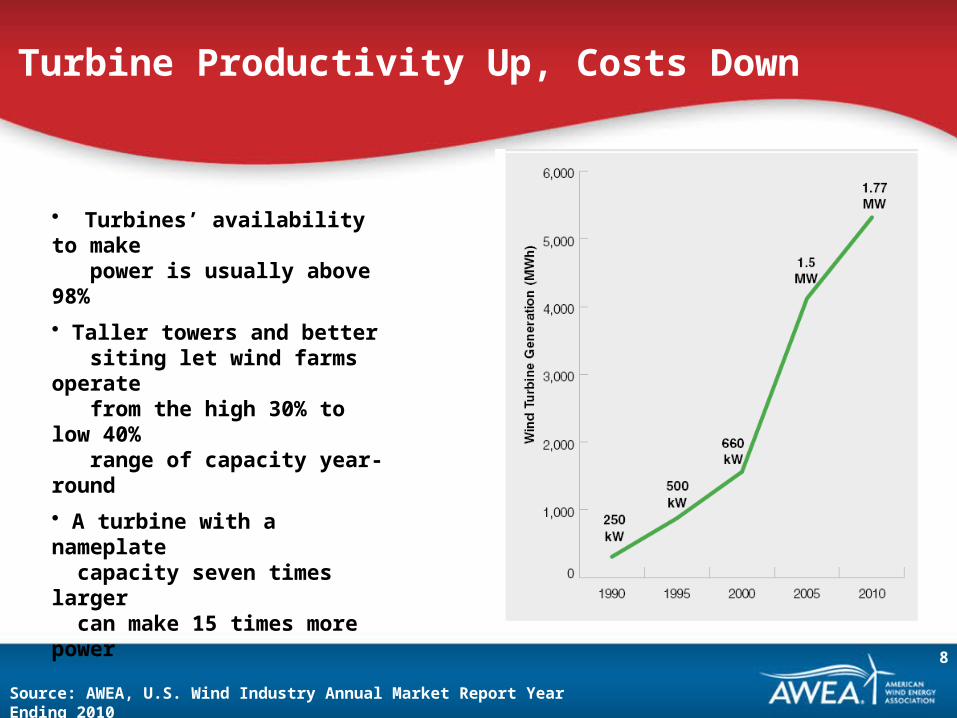
Turbine Productivity Up, Costs Down
Source: AWEA, U.S. Wind Industry Annual Market Report Year Ending 2010
• Turbines’ availability to make power is usually above 98%
• Taller towers and better siting let wind farms operate from the high 30% to low 40% range of capacity year-round
• A turbine with a nameplate capacity seven times larger can make 15 times more power
8
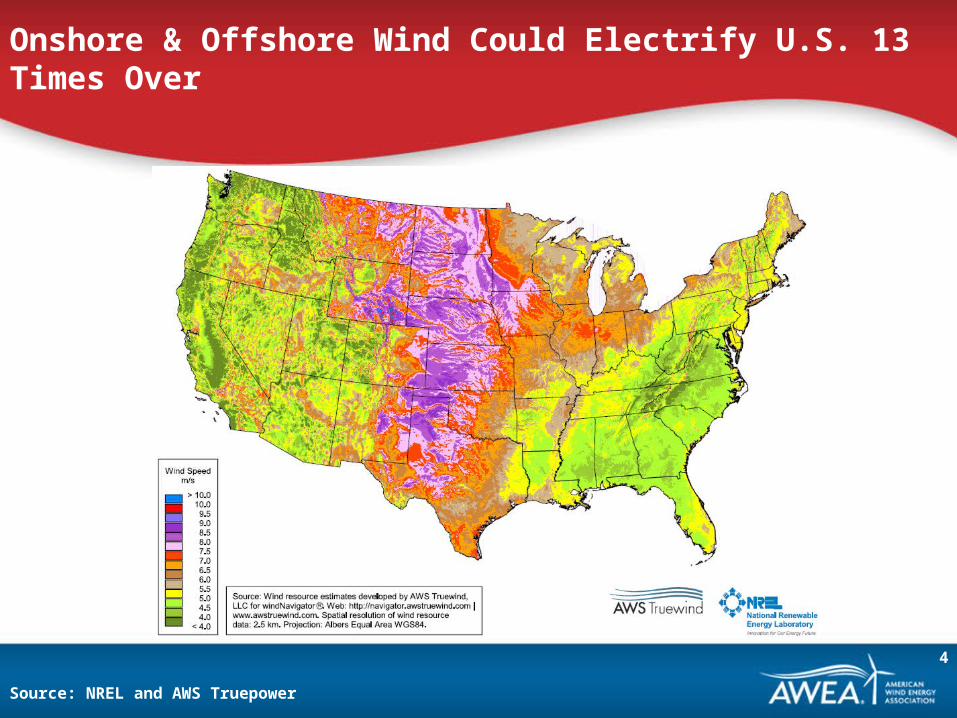
Onshore & Offshore Wind Could Electrify U.S. 13 Times Over
Source: NREL and AWS Truepower
4
2004
2006
2008
2010
2012
2014
2016
2018
2020
2022
2024
2026
2028
2030
0
50
100
150
200
250
300
350
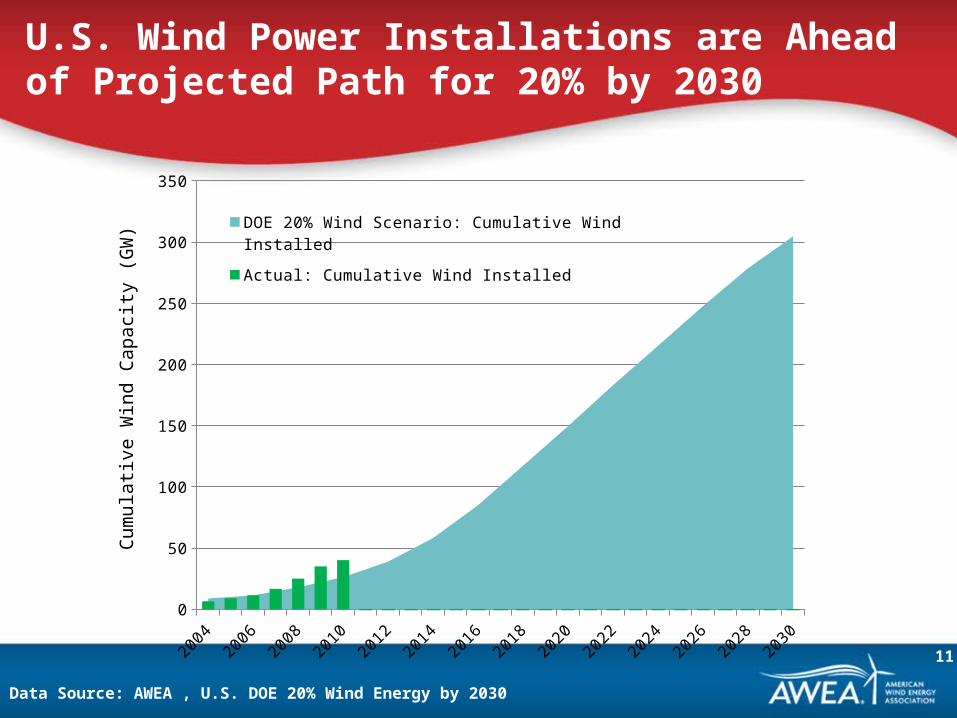
DOE 20% Wind Scenario: Cumulative Wind Installed
Actual: Cumulative Wind Installed
U.S. Wind Power Installations are Ahead of Projected Path for 20% by 2030
Data Source: AWEA , U.S. DOE 20% Wind Energy by 2030
Cum
ula
tive
Win
d C
apac
ity (
GW
)
11
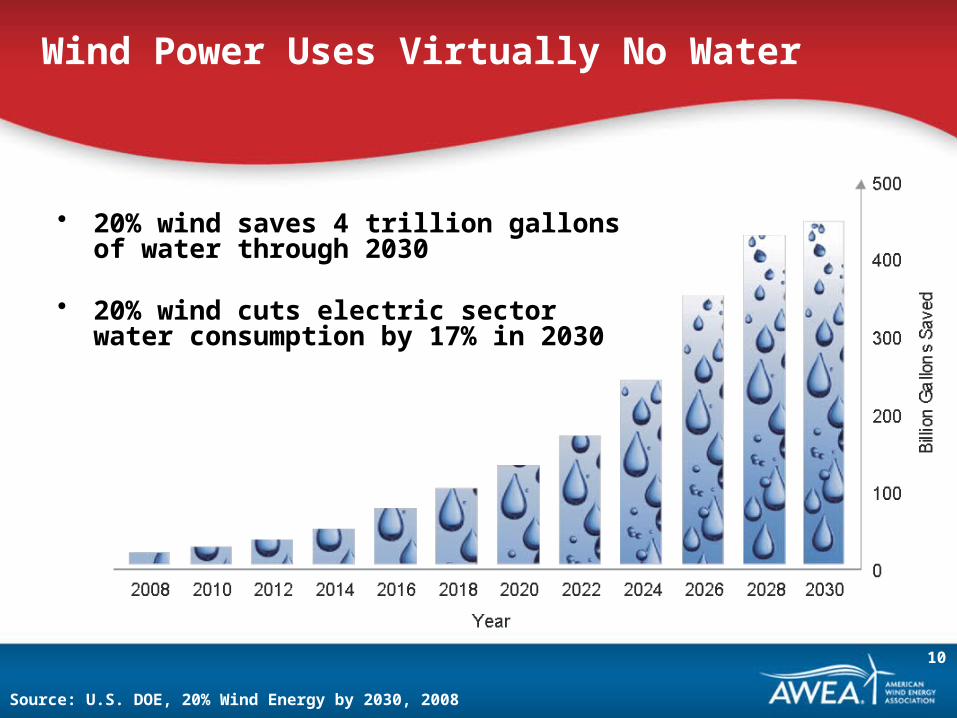
Wind Power Uses Virtually No Water
• 20% wind saves 4 trillion gallons of water through 2030
• 20% wind cuts electric sector water consumption by 17% in 2030
Source: U.S. DOE, 20% Wind Energy by 2030, 2008
10
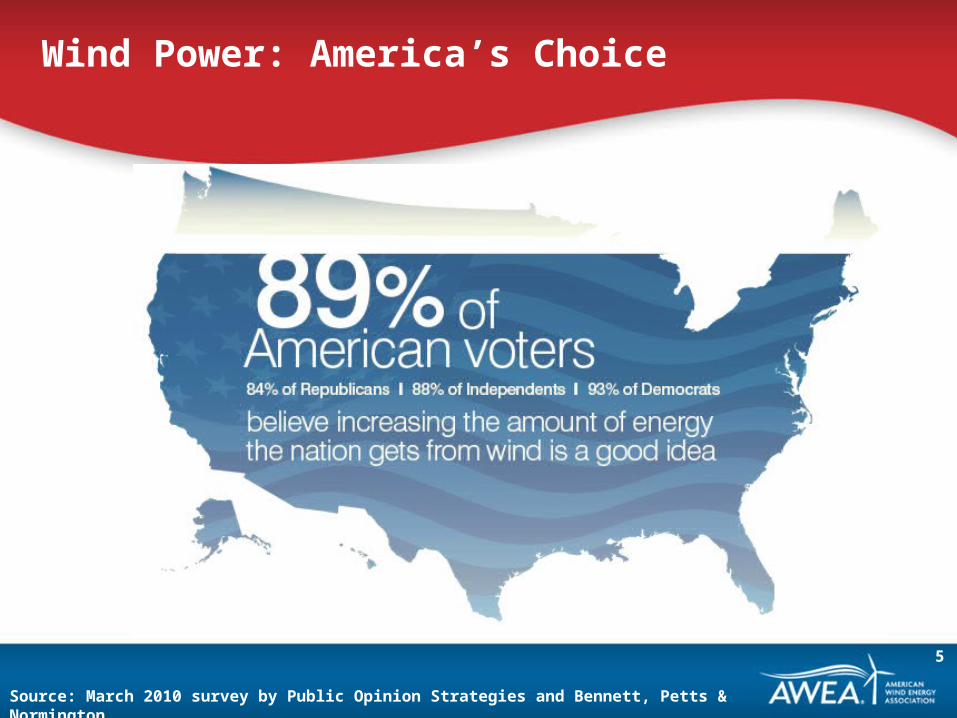
Wind Power: America’s Choice
Source: March 2010 survey by Public Opinion Strategies and Bennett, Petts & Normington
5
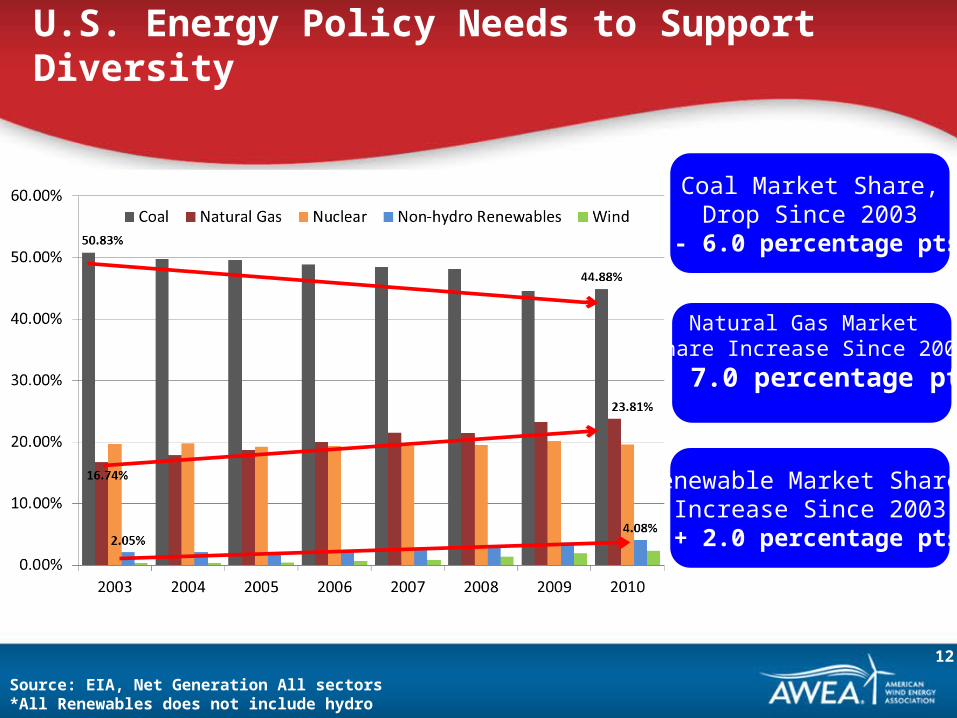
Coal Market Share,Drop Since 2003
- 6.0 percentage pts
Renewable Market Share,Increase Since 2003
+ 2.0 percentage pts
Natural Gas Market Share Increase Since 2003
+ 7.0 percentage pts
Source: EIA, Net Generation All sectors*All Renewables does not include hydro
U.S. Energy Policy Needs to Support Diversity
12
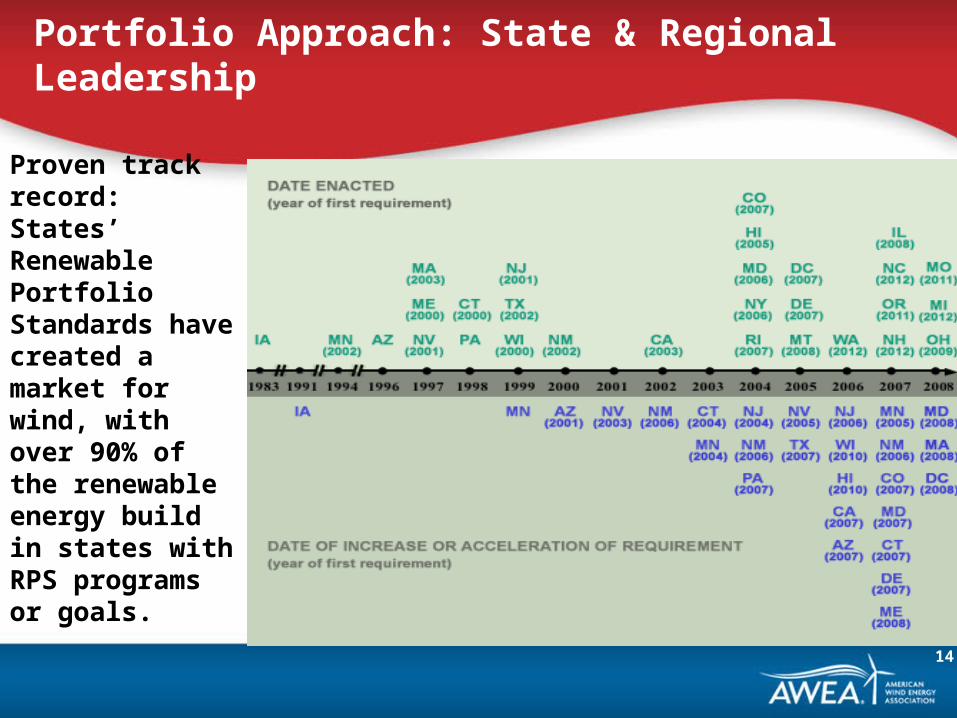
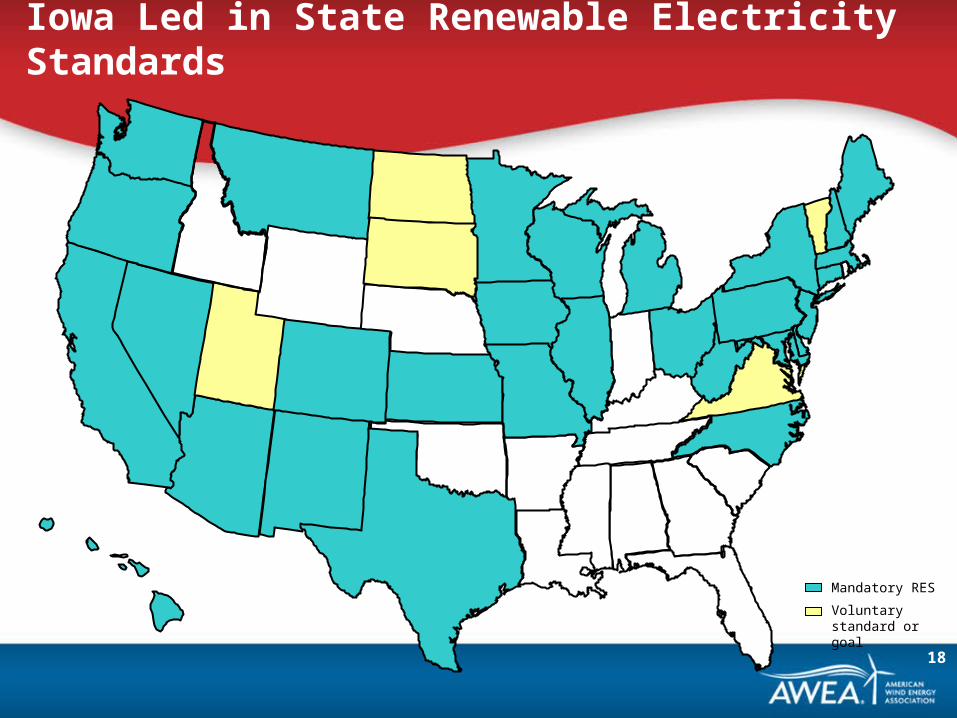
Proven track record: States’ Renewable Portfolio Standards have created a market for wind, with over 90% of the renewable energy build in states with RPS programs or goals.
Portfolio Approach: State & Regional Leadership
14
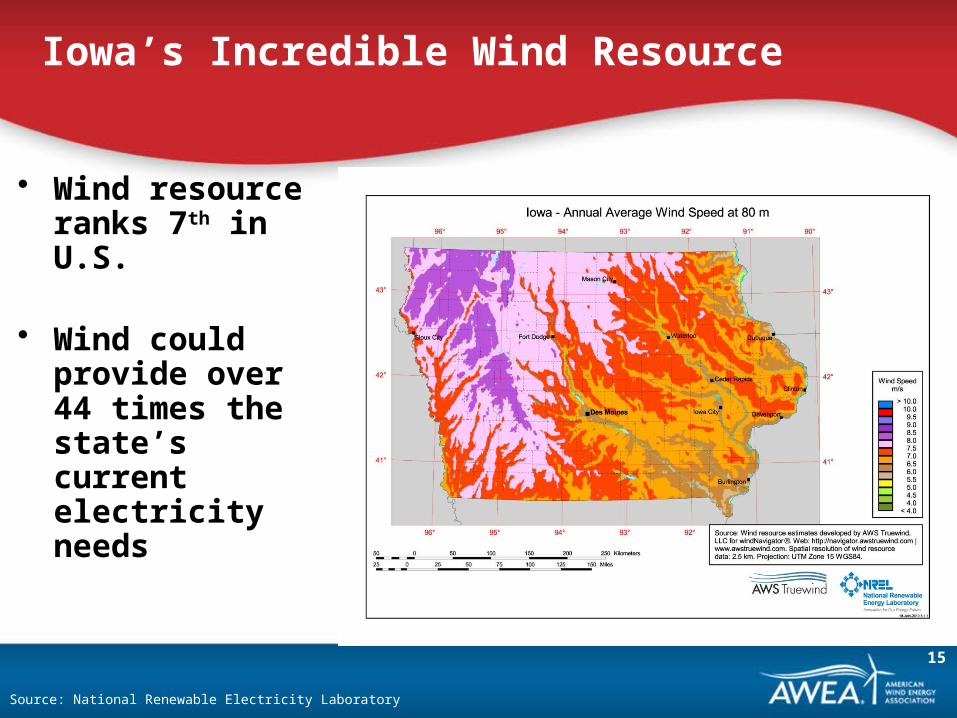
Iowa’s Incredible Wind Resource
• Wind resource ranks 7th in U.S.
• Wind could provide over 44 times the state’s current electricity needs
Source: National Renewable Electricity Laboratory
15
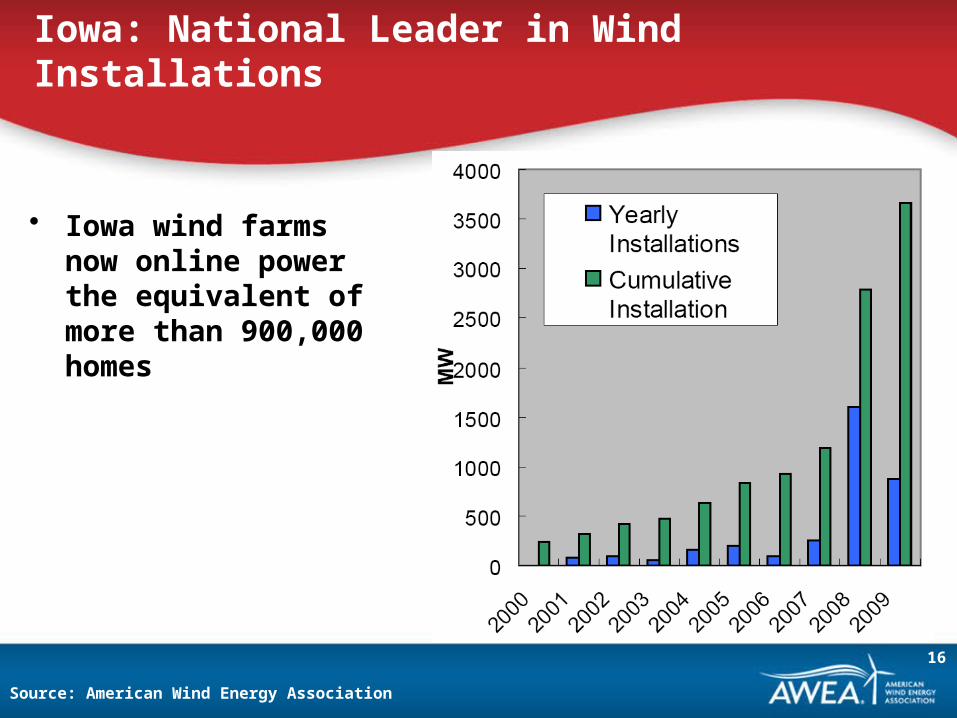
Iowa: National Leader in Wind Installations
• Iowa wind farms now online power the equivalent of more than 900,000 homes
Source: American Wind Energy Association
16
Mandatory RES
Voluntary standard or goal
Iowa Led in State Renewable Electricity Standards
18
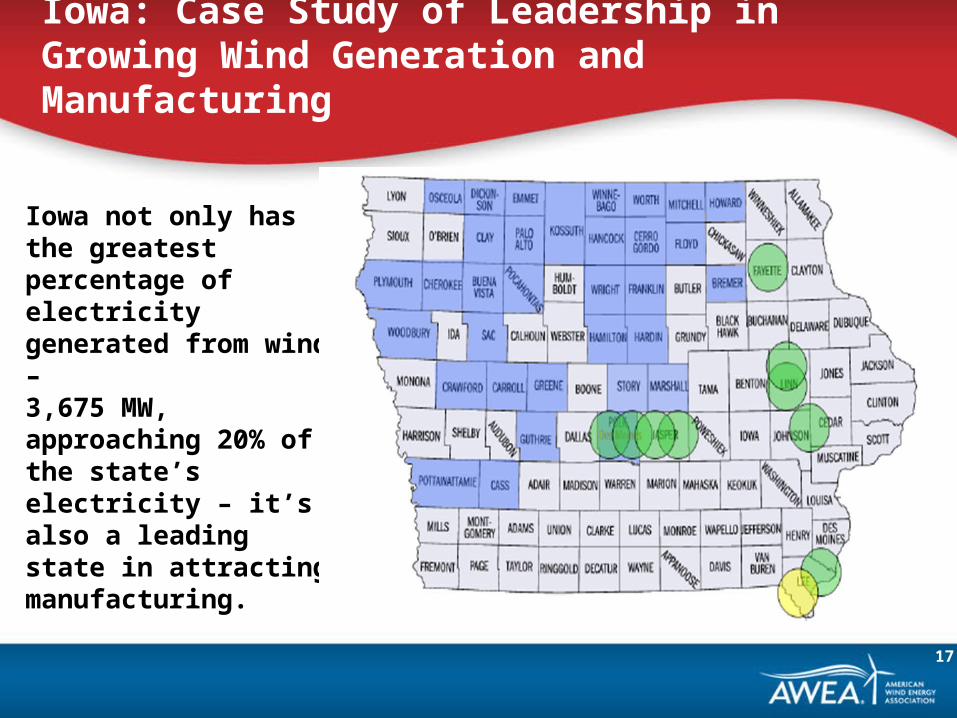
Iowa: Case Study of Leadership in Growing Wind Generation and Manufacturing
Iowa not only has the greatest percentage of electricity generated from wind – 3,675 MW, approaching 20% of the state’s electricity – it’s also a leading state in attracting manufacturing.
17
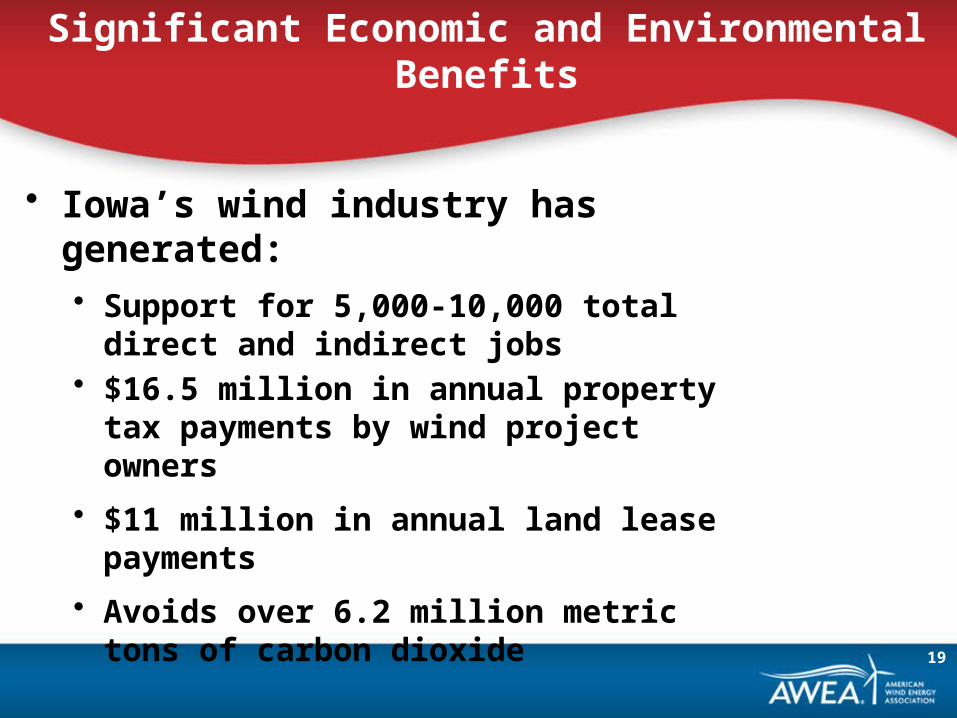
Significant Economic and Environmental Benefits
• Iowa’s wind industry has generated:• Support for 5,000-10,000 total direct and
indirect jobs• $16.5 million in annual property tax
payments by wind project owners
• $11 million in annual land lease payments
• Avoids over 6.2 million metric tons of carbon dioxide
19

Get more information
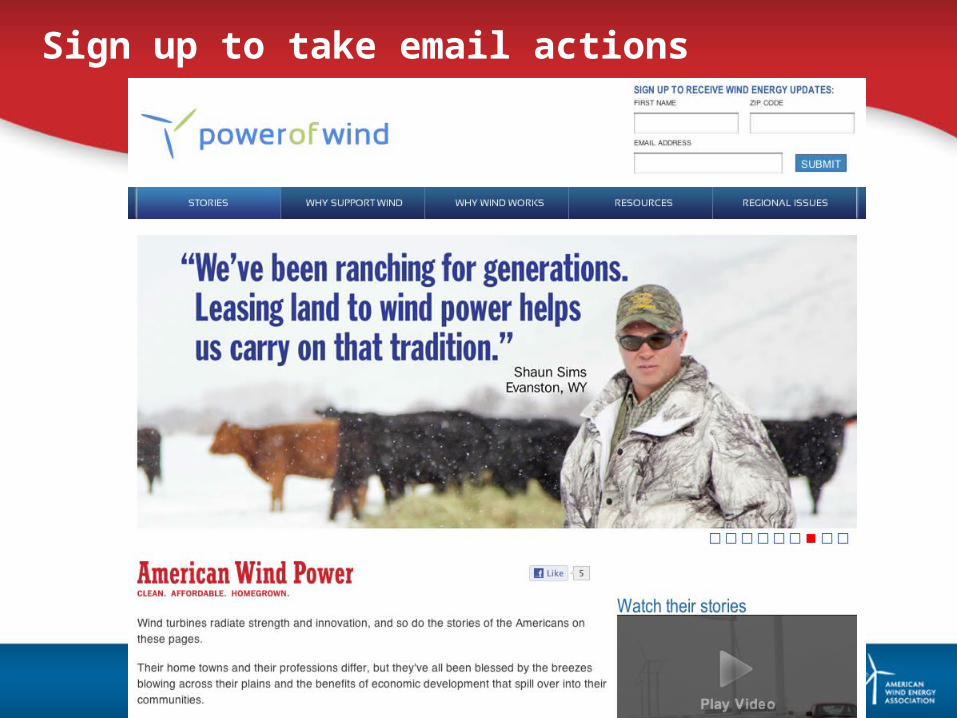
Sign up to take email actions
Attend one of the fastest-growing U.S. tradeshows: WINDPOWER 2012 Conference & ExhibitionAtlanta, GA | June 3-6, 2012
See www.awea.org for more information and events – covering wind farm siting, transmission, offshore wind, small and community wind, the supply chain, education, operations, and investment.
Remember to sign up to get updates and chances to take action at www.powerofwind.com
Attend one of the fastest-growing U.S. tradeshows
21