Embed Size (px)
Citation preview
1
Wind Energy in Cold Climates
Available Technologies - report
Edited by:
Ville Lehtomäki
VTT Technical Research Centre on Finland Ltd
IEA Wind Task 19
May 2016

2
Available Technologies for Wind Energy in
Cold Climates
Andreas Krenn, Energiewerkstatt Verein, Austria
Pieter Jan Jordaens, SIRRIS OWI-LAB, Belgium
Matthew Wadham-Gagnon, Technocentre éolien, Canada
Neil Davis, DTU Wind Energy, Denmark
Niels-Erik Clausen, DTU Wind Energy, Denmark
Ville Lehtomäki, Technical Research Centre of Finland Ltd, Finland
Tuomas Jokela, Technical Research Centre of Finland Ltd, Finland
Saara Kaija, Technical Research Centre of Finland Ltd, Finland
Zouhair Khadiri-Yazami, Fraunhofer IWES, Germany
Göran Ronsten, Windren, Sweden
Helena Wickman, Meventus, Sweden
Rebecka Klintström, Meventus, Sweden
René Cattin, Meteotest, Switzerland
May 2016
Photo: Rivière-au-Renard wind farm owned and operated by Technocentre éolien, Quebec, Canada [1]

3
Foreword: The International Energy Agency Implementing Agreement for Co-
operation in the Research, Development and Deployment of Wind Energy Systems
(IEA Wind) is a vehicle for member countries to exchange information on the planning
and execution of national, large-scale wind system projects and to undertake co-
operative research and development projects called Tasks or Annexes. IEA Wind is part
of IEA’s Technology Collaboration Programme or TCP.
Disclaimer: The IEA Wind agreement, also known as the Implementing Agreement for
Co-operation in the Research, Development, and Deployment of Wind Energy Systems,
functions within a framework created by the International Energy Agency (IEA).
Views, findings, and publications of IEA Wind do not necessarily represent the views or
policies of the IEA Secretariat or of all its individual member countries.
The solutions and technologies presented in this report represent only the findings of the
Task 19 working group, and thus do not represent 100% coverage of all available
technologies worldwide. The listed solutions and technologies are all based on public
data sources or collected via questionnaires from solution providers. In case of missing
solutions or references, please contact the Task Operating Agent for further guidance
how to add missing details to the next edition.

4
Abstract
For the wind industry, cold climate refers to sites that may experience significant
periods of icing events, temperatures below the operational limits of standard wind
turbines, or both. There is vast potential for producing electricity at these often windy
and uninhabited cold climate sites. Consequently, the International Energy Agency
Wind Agreement has, since 2002, operated the international working group Task 19
Wind Energy in Cold Climates. The goal of this cooperation is to gather and
disseminate information about wind energy in cold climates and to establish guidelines
and state-of-the-art information. In this report, the available technologies for cold
climate wind energy are presented.
This, the first Available Technologies report, is a reference report allowing one to
quickly and easily find potential solutions to some of the most demanding challenges in
cold climate wind energy. The target audience for this report is an R&D design
engineer, analyst, researcher, or similar professional with a technical background and
basic knowledge about wind energy. For best practices and recommendations on how to
apply these technologies, please refer to the Recommended Practices report from Task
19.
5
Contents 1 Executive summary .................................................................................................. 7
2 List of abbreviations ................................................................................................. 9
3 Introduction ............................................................................................................ 10
4 Definitions and site classification ........................................................................... 11
5 Resource assessment with respect to icing ............................................................. 16
5.1 Icing Maps ....................................................................................................... 16
5.2 Meteorological models for icing ...................................................................... 19
5.3 Wind measurements ......................................................................................... 22
6 Ice detection ............................................................................................................ 27
7 Ice models ............................................................................................................... 32
7.1 Advanced ice accretion models ....................................................................... 32
7.2 Empirical ice accretion models ........................................................................ 35
7.3 Ice removal models .......................................................................................... 36
8 Cold Climate adaptations of wind turbines ............................................................ 38
8.1 Low temperature adaptations ........................................................................... 38
8.2 Ice protection systems of wind turbines .......................................................... 41
8.3 Control system for operation in icing .............................................................. 43
8.4 Summary of Cold Climate turbine adaptations ................................................ 45
8.4.1 Independent ice protection system providers ........................................... 48
9 Assessment of Ice Throw and Ice Fall.................................................................... 50
10 Operation and Maintenance .................................................................................... 54
10.1 Ice throw risk mitigation .................................................................................. 54
10.2 Road and turbine access ................................................................................... 55
10.3 Icing forecasts .................................................................................................. 58
11 Standards and Certification .................................................................................... 61
12 Testing .................................................................................................................... 63
12.1 Icing Wind Tunnels ......................................................................................... 65
12.2 Climate chambers ............................................................................................ 70
12.3 Prototype test sites ........................................................................................... 73
12.4 Field testing at production sites ....................................................................... 74
13 Further needs for technology research and innovation in cold climate .................. 76
13.1 Standards, certification and recommended practices ....................................... 78
13.2 Assessment of reduced production prior to deployment, financial risks and
uncertainties ................................................................................................................ 79
13.3 Ice protection systems, equipment and procedures ......................................... 79

6
13.4 Testing: test sites, field testing, and lab testing including subcomponents and
ice detection ................................................................................................................ 80
13.5 Health, safety and environment (HSE) incl. ice throw .................................... 81
13.6 Construction, installation, operation, maintenance and repairs ....................... 81
13.7 Market potential and limitations ...................................................................... 81
13.8 Grid issues ........................................................................................................ 82
13.9 Small wind turbines ......................................................................................... 82
14 Bibliography ........................................................................................................... 83
7
1 Executive summary Wind Energy in Cold Climates (CC) refers to sites that may experience frequent icing
events, temperatures below the operational limits of standard wind turbines (WT), or
both. Apart from lower energy production, which directly influences a wind farm’s cash
flow, liability issues, such as ice throw and increased noise, may raise development
risks. Additionally, one needs to consider fatigue loading and operation and
maintenance (O&M) aspects particular to CC. WT operating in cold climates are
located around the world, including sites in Asia, North and South America, Europe and
even in Africa.
Resource assessment with respect to icing – Icing maps are useful as first source of
information for assessing icing related risks. More detailed, site specific meteorological
modelling can reveal more information about site icing conditions and related safety and
financial risks but model validation is critically important. CC sites also have additional
requirements for wind resource measurements and often require special sensors. The
influence of ice on or near the sensors will decrease data coverage and increase the
uncertainty of measurements.
Ice detection - Dedicated and reliable ice detectors are useful for measuring ice effects
for a planned wind farm on safety (ice throw) and potentially reduced energy yield and
for turbine control purposes in operational wind farms. For ice effects to safety and
energy yield, the occurrence of ice (yes/no), icing intensity (kg/m/h), type of ice (rime,
glace) and ice load (kg/m) are useful inputs for analyses. Specific turbine ice detection
solutions are available for turbine control and controlling active ice protection systems.
Ice models – Modelling of ice accretion is important to estimate the impacts of ice on
objects. Advanced models are used for detailed assessment of ice type and shape for
aerodynamic analyses whereas simplified ice accretion models are used to estimate
icing rate and mass on objects typically in weather model applications. Ice removal
models are very important for wind energy but are relatively immature compared to ice
accretion knowledge.
Cold Climate adaptations for wind turbines – Special low temperature adaptions are
needed for turbine materials, lubricants, heating etc. to ensure safe and efficient
operation. Ice accumulation on turbine blades can be mitigated with blade ice protection
systems and many technological solutions exist on the market from both turbine
manufacturers and independent 3rd party system providers. Dedicated turbine control
features for turbines with ice are also needed.
Assessment of ice throw and ice fall – During the approval phase of a project, the risk
of ice throw and ice fall has to be assessed. In some areas, the use of empiric formulas
that give a rough indication of the maximum throw distance is sufficient. However, in
many cases, authorities may demand detailed risk assessments that take into account the
local icing conditions and the likelihood of people in the danger zone. Mitigation
8
measures like warning signs and flashing lights are widely used to lower the actual risk
levels.
Operation and maintenance – The risk of ice injuring service staff or the general
public must be taken very seriously in icing climates. Road and turbine access for
maintenance staff in areas with significant snow fall can prove to be a challenge. Icing
forecasts can improve O&M planning.
Standards and certification – Standards are needed to have the same baseline and
minimum requirements for all actors in the industry from turbine design to site ice
assessment. Icing and cold climate related standards exist for modelling ice, defining ice
induced loads for turbines, and characterizing offshore sea ice effects. Certification
practices typically follow existing standards.
Testing – The testing of new designs and innovations for cold climate regions is an
essential part of a product development cycle. Dedicated test facilities have been set-up
for CC with climate chambers and icing wind tunnels for testing small products like
sensors, and large components like gearboxes or even fully installed wind turbine
assemblies.
Further needs for technology research and innovation – Low temperature and icing
introduces special challenges for wind energy and many technology areas need further
research and new innovations (R&I). In order to streamline and focus new R&I efforts
nationally and internationally, Task 19 proposes a prioritized list of research and
innovation needs for the cold climate wind energy community. Top 3 topics for near
future R&I are:
1. Standards, certification and recommended practices
2. Assessment of reduced production prior to deployment, financial risks and
uncertainties
3. Ice protection systems, equipment and procedures
9
2 List of abbreviations BB Black blades
BF Blade frequency ice detection (or just rotor blade)
CC Cold climate
ET Electro thermal ice protection system
H&S Health & safety
HA Hot air ice protection system
HSE Health, safety and environment
IC Icing climate
IPC Ice phobic coating
ID Ice detection
IEA International Energy Agency
IOM Ice Operation Mode
LTC Low temperature climate
LWC Liquid Water Content
MW Mega Watt
MVD Median Volumetric Diameter
NI Nacelle based ice detection
OEM Original Equipment Manufacturer
PC Power Curve ice detection
PS Preventive shutdown
R&D Research and development
R&I Research and innovation
TH Temperature and humidity
VTT VTT Technical Research Centre of Finland Ltd
WT Wind turbine
10
3 Introduction In 2002, the International Energy Agency (IEA) Wind Program initiated a new Task 19
Wind Energy in Cold Climates. This international collaboration between the
participating countries has the main objective to gather and disseminate information
about wind energy in cold climates and establish guidelines and state-of-the-art
practices.
Information is gathered and disseminated on the project website
http://www.ieawind.org/task_19.html
The operating agent of the task is VTT Technical Research Centre of Finland Ltd and
participating institutes along with VTT are WindREN and Meventus from Sweden,
Meteotest from Switzerland, Technocentre éolien from Canada, Fraunhofer IWES from
Germany, Energiewerkstatt Verein from Austria, CARDC/CWEA form China, OWI
LAB/SIRRIS from Belgium and DTU Wind Energy from Denmark.
According to the 2012 BTM World market update, 69 GW of wind energy were located
in cold climates at the end of 2012, and from 2013 to 2017 a staggering 10 GW/year
installation rate was forecasted for cold climates [2]. This means that cold climate wind
energy is one of the largest “non-standard” markets in wind energy today. However, the
technological solutions for this market are still novel, and there are no uniform means to
compare existing technologies with each other. The vast market size and technology
options were the main drivers for writing this Available Technologies report.
This report is a reference report designed to help the reader quickly and easily find
potential solutions to some of the most demanding challenges in cold climate wind
energy. The target audience for this report are R&D design engineers, analysts,
researchers or similar professionals with a technical background and basic knowledge
about wind energy. For best practices and recommendations on how to apply these
technologies, please refer to the Recommended Practices report from Task 19.
The report is divided into sections that cover specific topics, and each subsection has a
similar structure, so the format will be familiar after reading one subsection. The core
results per subsection are summarized into tables that include the solutions,
advantages/disadvantages or technical specifications, and their references. All
references are divided into three categories starting from scientifically most reliable
sources e.g. peer-reviewed journals (shortly Paper), performance related information
from e.g. conference proceedings (shortly Perf) and other sales oriented material in the
format of website, brochure or similar (shortly Other).
11
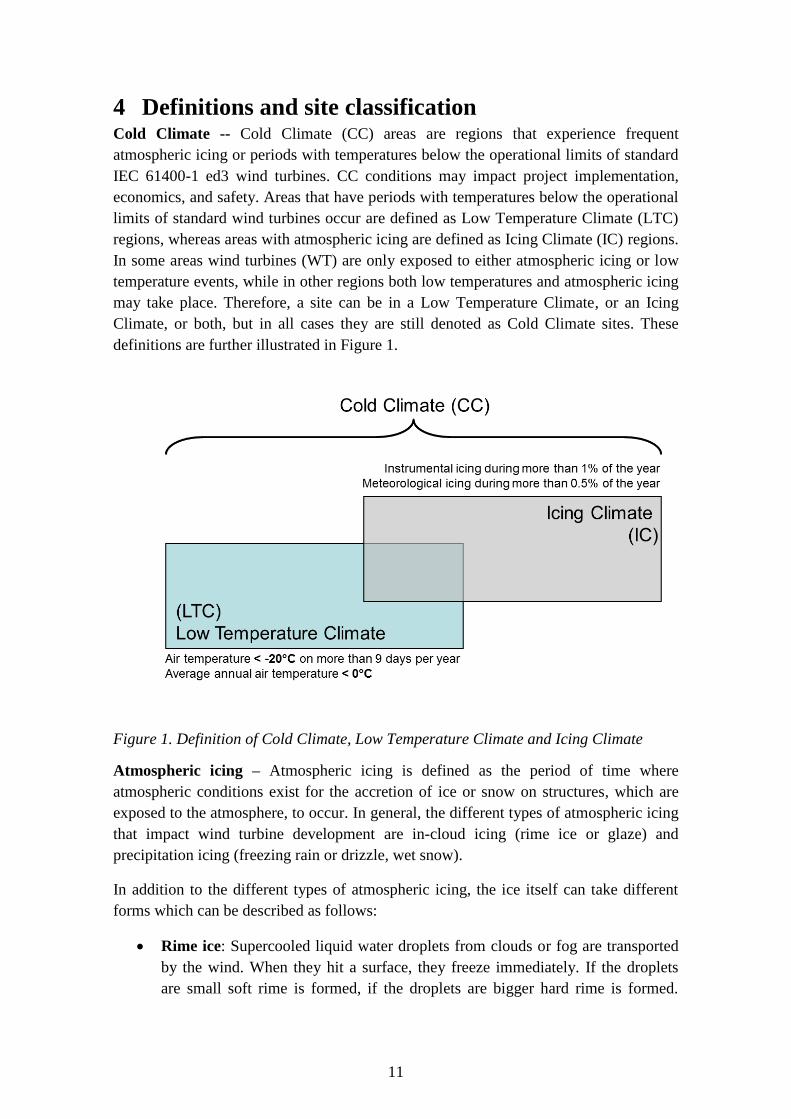
4 Definitions and site classification Cold Climate -- Cold Climate (CC) areas are regions that experience frequent
atmospheric icing or periods with temperatures below the operational limits of standard
IEC 61400-1 ed3 wind turbines. CC conditions may impact project implementation,
economics, and safety. Areas that have periods with temperatures below the operational
limits of standard wind turbines occur are defined as Low Temperature Climate (LTC)
regions, whereas areas with atmospheric icing are defined as Icing Climate (IC) regions.
In some areas wind turbines (WT) are only exposed to either atmospheric icing or low
temperature events, while in other regions both low temperatures and atmospheric icing
may take place. Therefore, a site can be in a Low Temperature Climate, or an Icing
Climate, or both, but in all cases they are still denoted as Cold Climate sites. These
definitions are further illustrated in Figure 1.
Figure 1. Definition of Cold Climate, Low Temperature Climate and Icing Climate
Atmospheric icing – Atmospheric icing is defined as the period of time where
atmospheric conditions exist for the accretion of ice or snow on structures, which are
exposed to the atmosphere, to occur. In general, the different types of atmospheric icing
that impact wind turbine development are in-cloud icing (rime ice or glaze) and
precipitation icing (freezing rain or drizzle, wet snow).
In addition to the different types of atmospheric icing, the ice itself can take different
forms which can be described as follows:
Rime ice: Supercooled liquid water droplets from clouds or fog are transported
by the wind. When they hit a surface, they freeze immediately. If the droplets
are small soft rime is formed, if the droplets are bigger hard rime is formed.
12
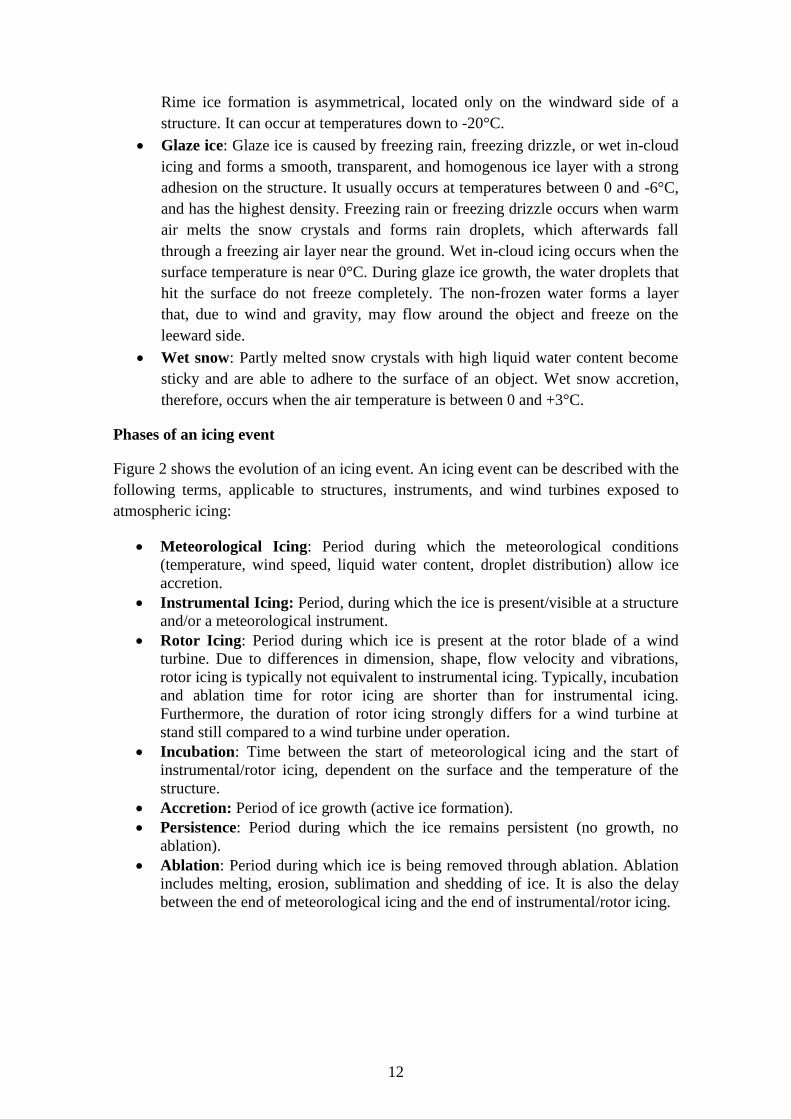
Rime ice formation is asymmetrical, located only on the windward side of a
structure. It can occur at temperatures down to -20°C.
Glaze ice: Glaze ice is caused by freezing rain, freezing drizzle, or wet in-cloud
icing and forms a smooth, transparent, and homogenous ice layer with a strong
adhesion on the structure. It usually occurs at temperatures between 0 and -6°C,
and has the highest density. Freezing rain or freezing drizzle occurs when warm
air melts the snow crystals and forms rain droplets, which afterwards fall
through a freezing air layer near the ground. Wet in-cloud icing occurs when the
surface temperature is near 0°C. During glaze ice growth, the water droplets that
hit the surface do not freeze completely. The non-frozen water forms a layer
that, due to wind and gravity, may flow around the object and freeze on the
leeward side.
Wet snow: Partly melted snow crystals with high liquid water content become
sticky and are able to adhere to the surface of an object. Wet snow accretion,
therefore, occurs when the air temperature is between 0 and +3°C.
Phases of an icing event
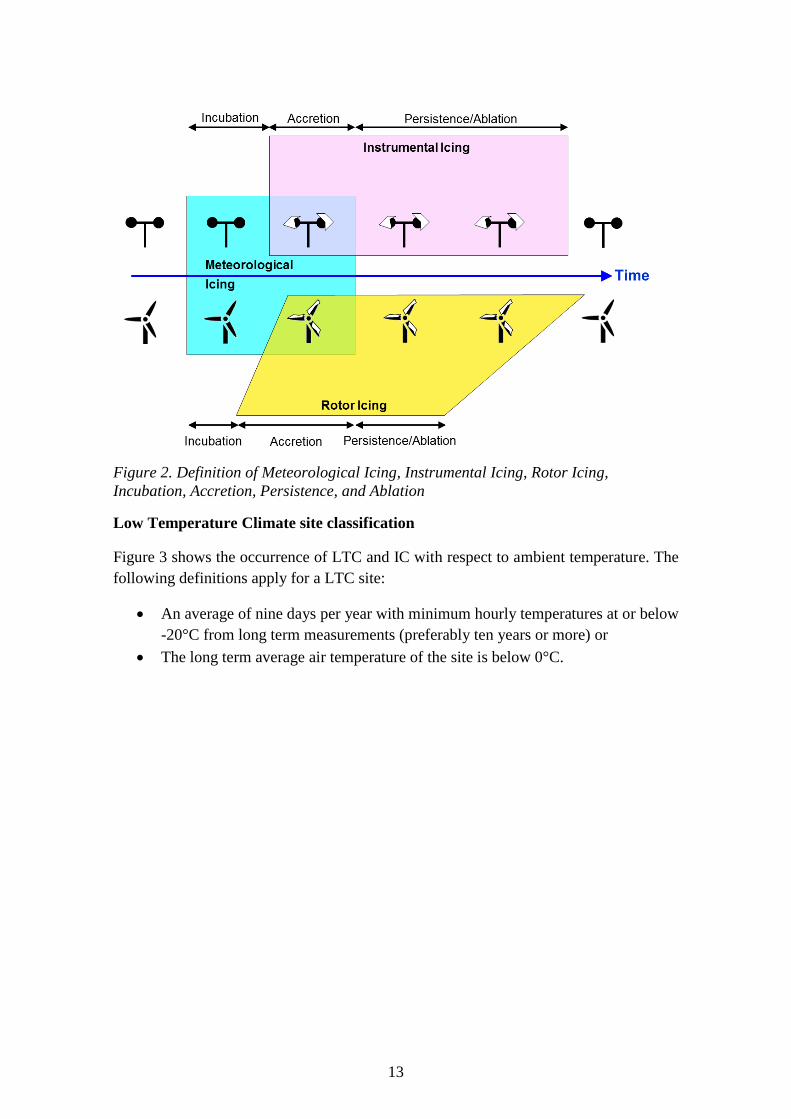
Figure 2 shows the evolution of an icing event. An icing event can be described with the
following terms, applicable to structures, instruments, and wind turbines exposed to
atmospheric icing:
Meteorological Icing: Period during which the meteorological conditions
(temperature, wind speed, liquid water content, droplet distribution) allow ice
accretion.
Instrumental Icing: Period, during which the ice is present/visible at a structure
and/or a meteorological instrument.
Rotor Icing: Period during which ice is present at the rotor blade of a wind
turbine. Due to differences in dimension, shape, flow velocity and vibrations,
rotor icing is typically not equivalent to instrumental icing. Typically, incubation
and ablation time for rotor icing are shorter than for instrumental icing.
Furthermore, the duration of rotor icing strongly differs for a wind turbine at
stand still compared to a wind turbine under operation.
Incubation: Time between the start of meteorological icing and the start of
instrumental/rotor icing, dependent on the surface and the temperature of the
structure.
Accretion: Period of ice growth (active ice formation).
Persistence: Period during which the ice remains persistent (no growth, no
ablation).
Ablation: Period during which ice is being removed through ablation. Ablation
includes melting, erosion, sublimation and shedding of ice. It is also the delay
between the end of meteorological icing and the end of instrumental/rotor icing.
13
Figure 2. Definition of Meteorological Icing, Instrumental Icing, Rotor Icing,
Incubation, Accretion, Persistence, and Ablation
Low Temperature Climate site classification
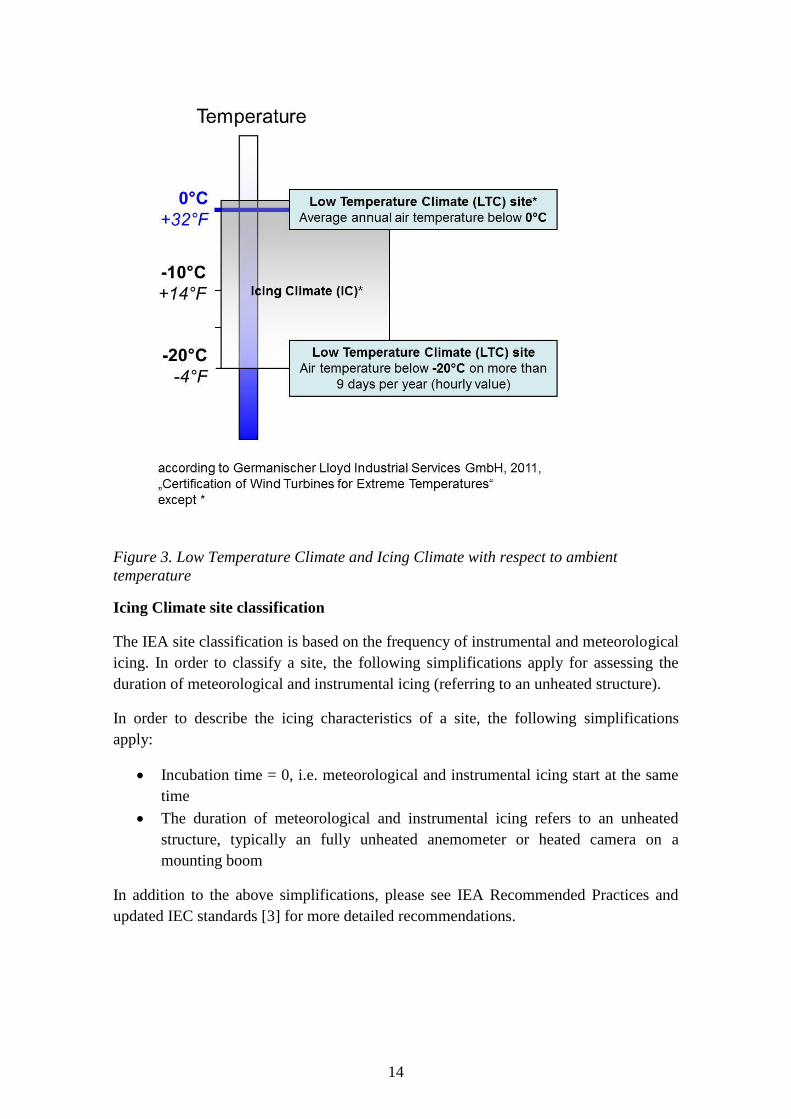
Figure 3 shows the occurrence of LTC and IC with respect to ambient temperature. The
following definitions apply for a LTC site:
An average of nine days per year with minimum hourly temperatures at or below
-20°C from long term measurements (preferably ten years or more) or
The long term average air temperature of the site is below 0°C.
14
Figure 3. Low Temperature Climate and Icing Climate with respect to ambient
temperature
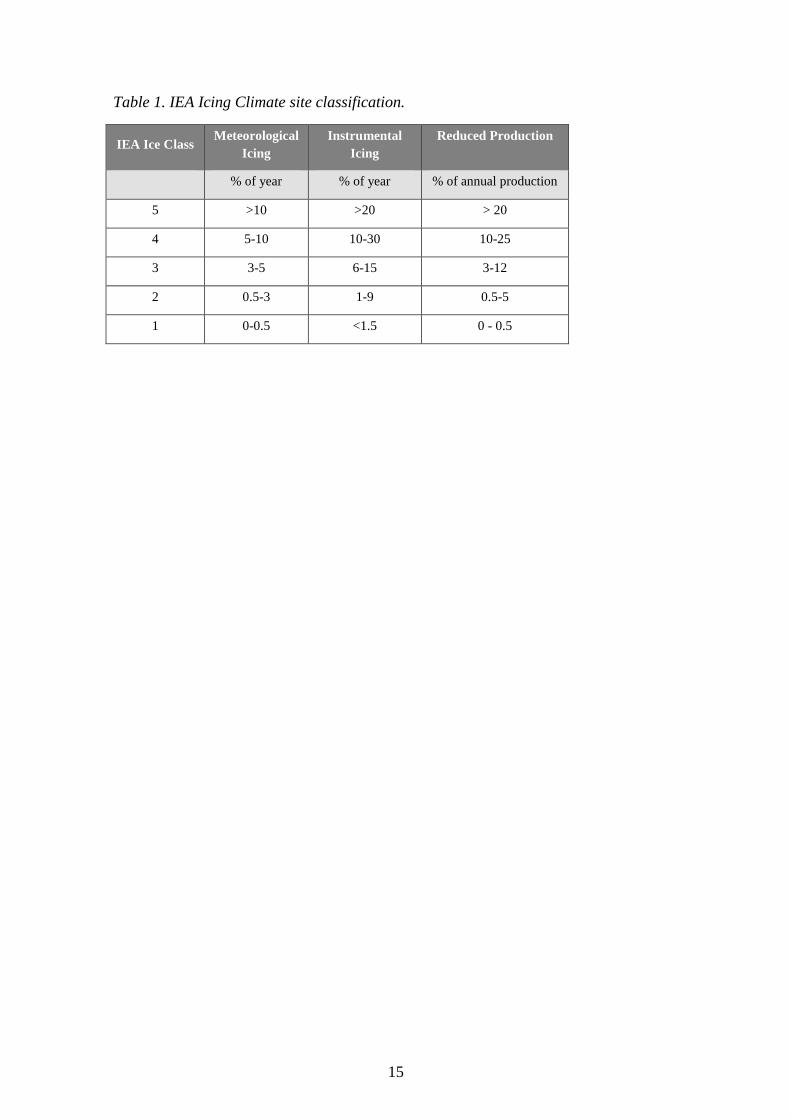
Icing Climate site classification
The IEA site classification is based on the frequency of instrumental and meteorological
icing. In order to classify a site, the following simplifications apply for assessing the
duration of meteorological and instrumental icing (referring to an unheated structure).
In order to describe the icing characteristics of a site, the following simplifications
apply:
Incubation time = 0, i.e. meteorological and instrumental icing start at the same
time
The duration of meteorological and instrumental icing refers to an unheated
structure, typically an fully unheated anemometer or heated camera on a
mounting boom
In addition to the above simplifications, please see IEA Recommended Practices and
updated IEC standards [3] for more detailed recommendations.
15
Table 1. IEA Icing Climate site classification.
IEA Ice Class Meteorological
Icing
Instrumental
Icing
Reduced Production
% of year % of year % of annual production
5 >10 >20 > 20
4 5-10 10-30 10-25
3 3-5 6-15 3-12
2 0.5-3 1-9 0.5-5
1 0-0.5 <1.5 0 - 0.5
16
5 Resource assessment with respect to icing
When developing a wind farm in a cold climate region, it is important to determine the
impact icing may have on its installation, operation and maintenance. During the site
prospecting phase, it can be useful to investigate icing maps. Icing maps (section 5.1)
provide an overview of regions which are likely to experience significant icing impacts.
After identifying a site of interest, a combination of a validated meteorological
modelling approach (section 5.2) and onsite measurements of wind (section 5.3) are
used to evaluate the energy yield potential of a site. Icing conditions affect the
underlying wind resource by reducing the available energy yield that the wind turbines
are able to capture.
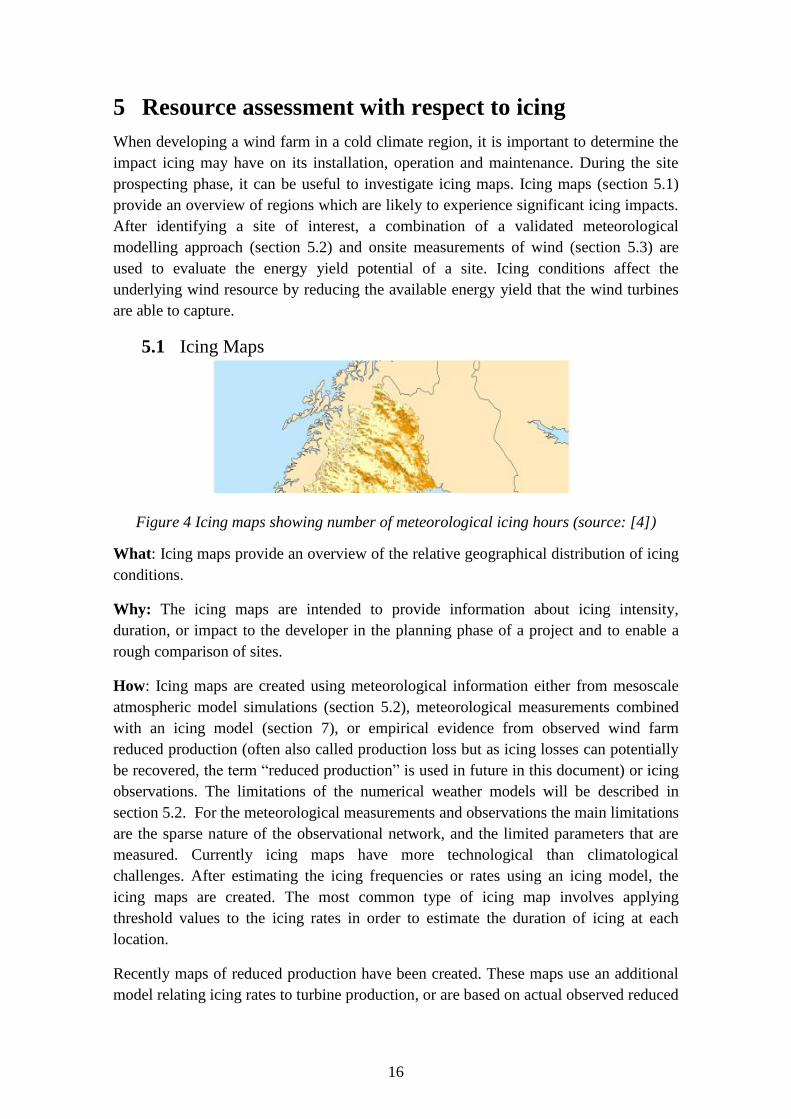
5.1 Icing Maps
Figure 4 Icing maps showing number of meteorological icing hours (source: [4])
What: Icing maps provide an overview of the relative geographical distribution of icing
conditions.
Why: The icing maps are intended to provide information about icing intensity,
duration, or impact to the developer in the planning phase of a project and to enable a
rough comparison of sites.
How: Icing maps are created using meteorological information either from mesoscale
atmospheric model simulations (section 5.2), meteorological measurements combined
with an icing model (section 7), or empirical evidence from observed wind farm
reduced production (often also called production loss but as icing losses can potentially
be recovered, the term “reduced production” is used in future in this document) or icing
observations. The limitations of the numerical weather models will be described in
section 5.2. For the meteorological measurements and observations the main limitations
are the sparse nature of the observational network, and the limited parameters that are
measured. Currently icing maps have more technological than climatological
challenges. After estimating the icing frequencies or rates using an icing model, the
icing maps are created. The most common type of icing map involves applying
threshold values to the icing rates in order to estimate the duration of icing at each
location.
Recently maps of reduced production have been created. These maps use an additional
model relating icing rates to turbine production, or are based on actual observed reduced
17
production from a number of wind farms across a region. Methodologies for creating
icing maps involve to use of generic turbine models (including control features)
,excluding ice protection system impacts and using generic meteorological icing
information that may differ from actual site specific conditions.
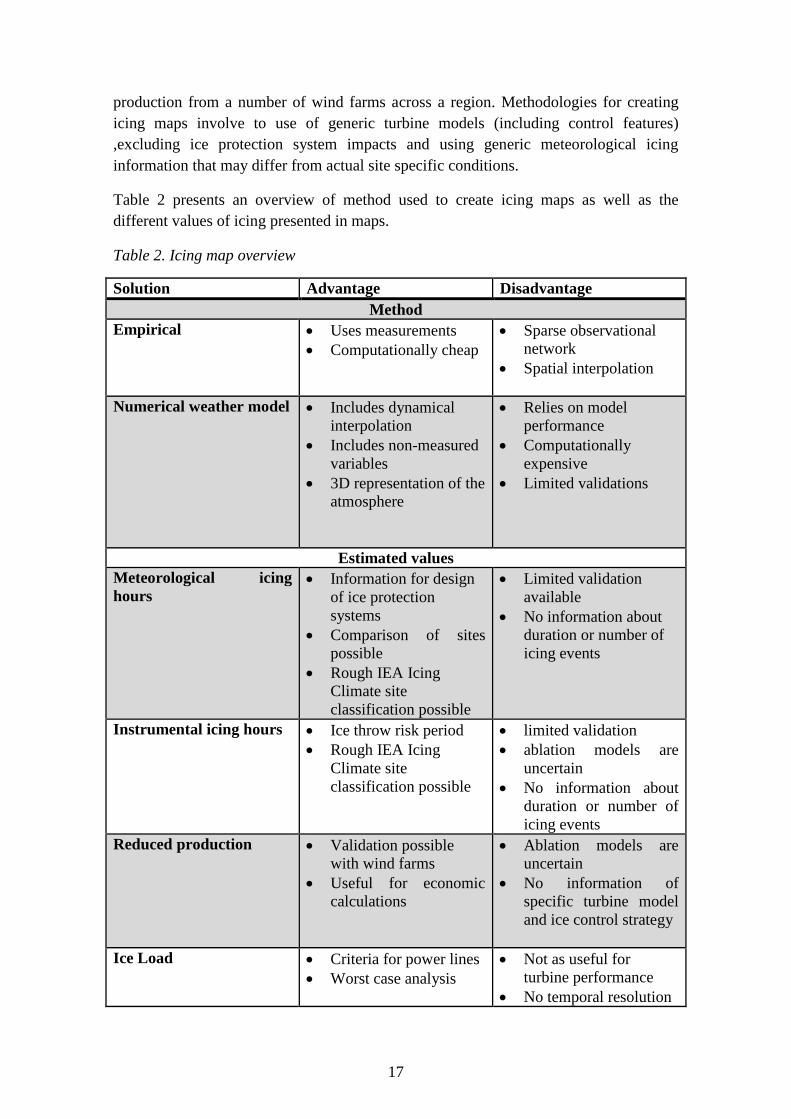
Table 2 presents an overview of method used to create icing maps as well as the
different values of icing presented in maps.
Table 2. Icing map overview
Solution Advantage Disadvantage
Method
Empirical Uses measurements
Computationally cheap
Sparse observational
network
Spatial interpolation
Numerical weather model Includes dynamical
interpolation
Includes non-measured
variables
3D representation of the
atmosphere
Relies on model
performance
Computationally
expensive
Limited validations
Estimated values
Meteorological icing
hours Information for design
of ice protection
systems
Comparison of sites
possible
Rough IEA Icing
Climate site
classification possible
Limited validation
available
No information about
duration or number of
icing events
Instrumental icing hours Ice throw risk period
Rough IEA Icing
Climate site
classification possible
limited validation
ablation models are
uncertain
No information about
duration or number of
icing events
Reduced production Validation possible
with wind farms
Useful for economic
calculations
Ablation models are
uncertain
No information of
specific turbine model
and ice control strategy
Ice Load Criteria for power lines
Worst case analysis
Not as useful for
turbine performance
No temporal resolution
18
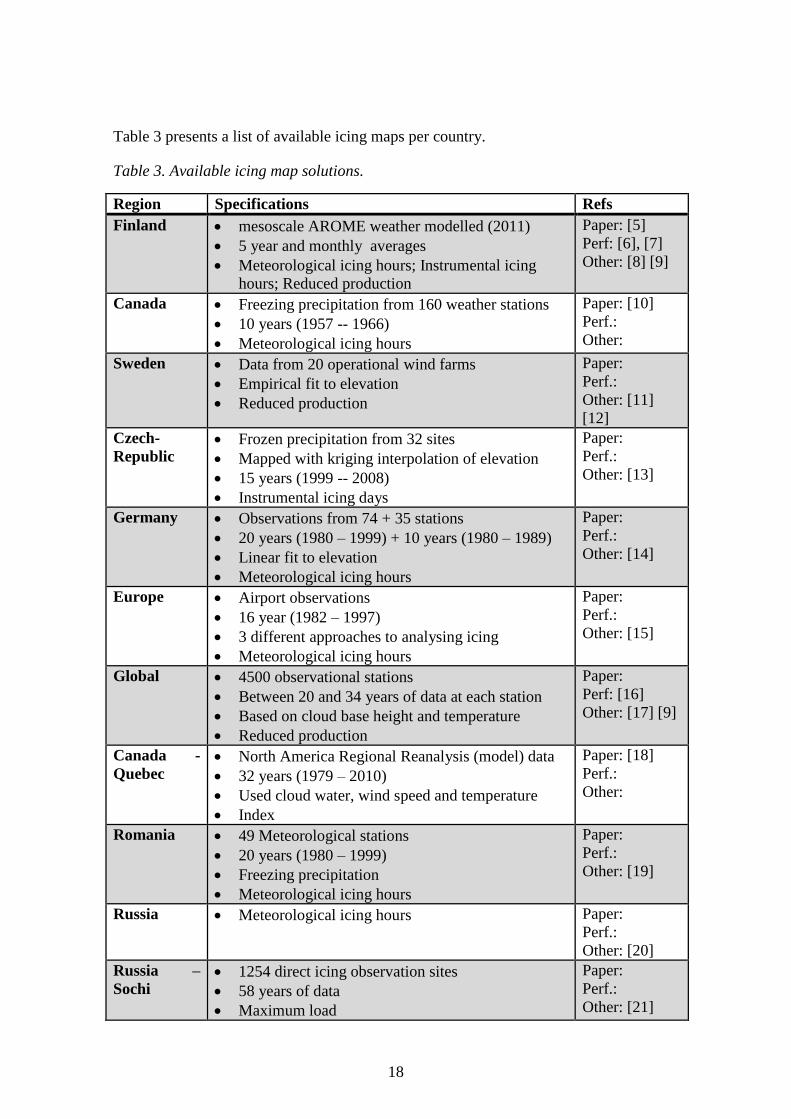
Table 3 presents a list of available icing maps per country.
Table 3. Available icing map solutions.
Region Specifications Refs
Finland mesoscale AROME weather modelled (2011)
5 year and monthly averages
Meteorological icing hours; Instrumental icing
hours; Reduced production
Paper: [5]
Perf: [6], [7]
Other: [8] [9]
Canada Freezing precipitation from 160 weather stations
10 years (1957 -- 1966)
Meteorological icing hours
Paper: [10]
Perf.:
Other:
Sweden Data from 20 operational wind farms
Empirical fit to elevation
Reduced production
Paper:
Perf.:
Other: [11]
[12]
Czech-
Republic Frozen precipitation from 32 sites
Mapped with kriging interpolation of elevation
15 years (1999 -- 2008)
Instrumental icing days
Paper:
Perf.:
Other: [13]
Germany Observations from 74 + 35 stations
20 years (1980 – 1999) + 10 years (1980 – 1989)
Linear fit to elevation
Meteorological icing hours
Paper:
Perf.:
Other: [14]
Europe Airport observations
16 year (1982 – 1997)
3 different approaches to analysing icing
Meteorological icing hours
Paper:
Perf.:
Other: [15]
Global 4500 observational stations
Between 20 and 34 years of data at each station
Based on cloud base height and temperature
Reduced production
Paper:
Perf: [16]
Other: [17] [9]
Canada -
Quebec North America Regional Reanalysis (model) data
32 years (1979 – 2010)
Used cloud water, wind speed and temperature
Index
Paper: [18]
Perf.:
Other:
Romania 49 Meteorological stations
20 years (1980 – 1999)
Freezing precipitation
Meteorological icing hours
Paper:
Perf.:
Other: [19]
Russia Meteorological icing hours Paper:
Perf.:
Other: [20]
Russia –
Sochi 1254 direct icing observation sites
58 years of data
Maximum load
Paper:
Perf.:
Other: [21]
19
Sweden;
Norway;
Finland
WRF mesoscale model
1 year high resolution and lower resolution
adjustment to long-term conditions
Meteorological icing hours
Perf: [22]
Perf.:
Other: [23]
[24] [25] [4]
[26]
Sweden AROME mesoscale model
Multiple time periods
Meteorological icing hours
Paper:
Perf.:
Other: [27]
[28]
Great
Britain WRF mesoscale model
50 year return period load
Paper:
Perf.:
Other: [29]
[30]
Canada -
Gaspé Gaspé airport observations
24 year period (1980 – 2013)
Adjusted for topography
IEA Ice class; Reduced production
Paper:
Perf.:
Other: [31]
Great
Britain Combined mesoscale modelling and weather
station observations
Empirical fit to elevation
Maximum ice load
Paper: [32]
Perf.:
Other:
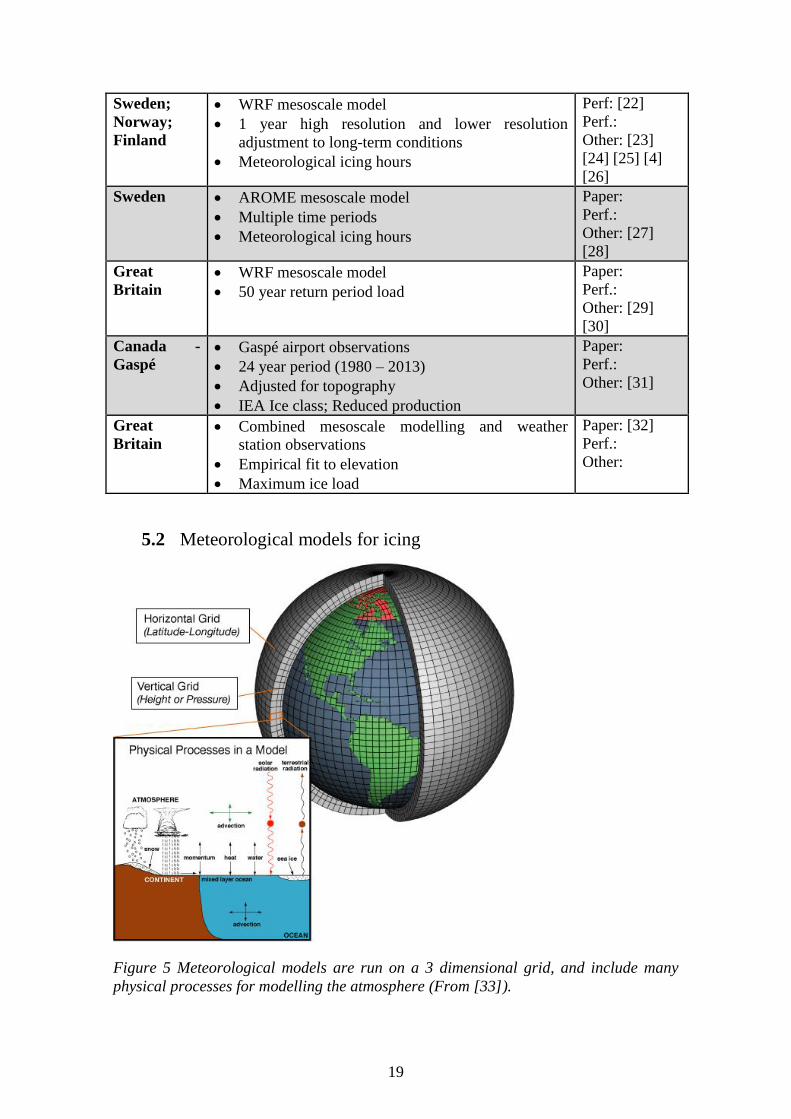
5.2 Meteorological models for icing
Figure 5 Meteorological models are run on a 3 dimensional grid, and include many
physical processes for modelling the atmosphere (From [33]).
20
What: Numerical weather prediction (NWP) models simulate the evolution of
atmospheric conditions based upon a full set of dynamical equations. The model
dynamics are able to simulate processes that occur at scales similar to the models
horizontal grid resolution. To represent sub-grid scale processes, NWP models include
parameterizations. The most common parameterizations are cloud microphysics,
radiative transfer, convective clouds, and turbulence in the atmospheric planetary
boundary layer (PBL).
NWP models can be broken into two broad categories, global models and regional
models. Global models only have boundary inputs from the model surface, while
regional models rely upon output from the global models for horizontal boundary
conditions.
In addition to boundary conditions, NWP models need input conditions to initialize the
state of the numerical atmosphere. For global models this is commonly done through
data-assimilation where global measurements of atmospheric parameters are used to
adjust the model data until the model physics and the measurements are in relative
agreement. Regional (mesoscale) models are commonly initiated either using the data-
assimilation process or directly using outputs from the global models.
Why: NWP models are used to help fill gaps in the measurement of atmospheric
processes that are significant for cold climate wind energy. These gaps can be related to
time, where forecasting using NWP models allows for the prediction of the conditions
that will come in next few days. They can also be related to spatial gaps by providing
estimates of atmospheric conditions in locations where there are not measurements, and
finally they can be used to fill parameter gaps where the key parameters of interest are
not measured. This last form is particularly important for the challenge of atmospheric
icing as cloud parameters are not typically measured.
How: Most commonly, data from a mesoscale atmospheric model simulation are used
to provide the spatial weather information needed to create icing maps. Mesoscale
models are limited by the parameterizations used and the horizontal and vertical
resolution. Simulating clouds, which are discontinuous features that are the result of
sub-grid scale interactions, is an area where model uncertainties are typically large. In
addition, cloud estimates are dependent on the accurate simulation of many other
variables, particularly temperature and moisture. Finally, due to the relatively coarse
resolution of mesoscale model simulations, the surface fields, particularly the
topography, are coarsely represented. The coarse resolution leads to a smoothing of the
topography, underestimating the elevation of hills and overestimating the elevation for
valleys.
Solution alternatives
21
The choice of numerical weather model should not impact the results of a study to a
great degree, but one should ensure that the model domain is reasonable for a site, and
that the model is run at a high enough resolution to capture the topographical features of
the wind farm and surrounding terrain. The smoothing of the terrain can also result in
sheltering effects not being captured correctly if the resolution is too coarse.
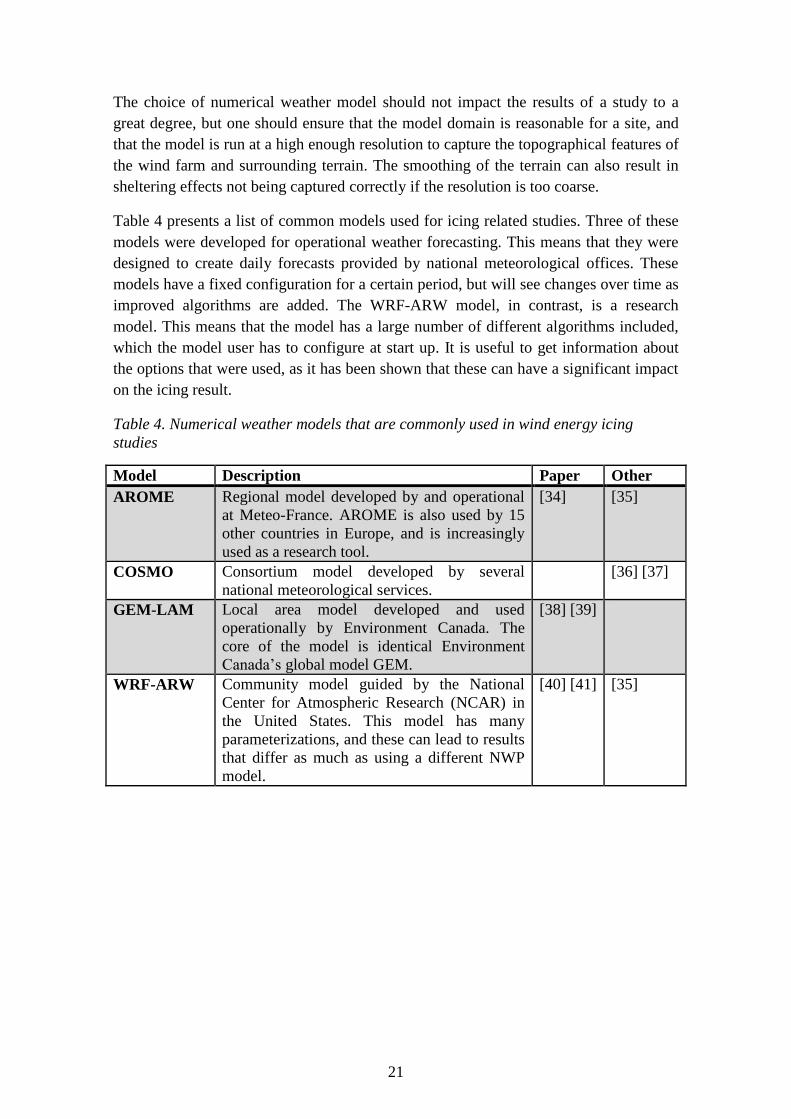
Table 4 presents a list of common models used for icing related studies. Three of these
models were developed for operational weather forecasting. This means that they were
designed to create daily forecasts provided by national meteorological offices. These
models have a fixed configuration for a certain period, but will see changes over time as
improved algorithms are added. The WRF-ARW model, in contrast, is a research
model. This means that the model has a large number of different algorithms included,
which the model user has to configure at start up. It is useful to get information about
the options that were used, as it has been shown that these can have a significant impact
on the icing result.
Table 4. Numerical weather models that are commonly used in wind energy icing
studies
Model Description Paper Other
AROME Regional model developed by and operational
at Meteo-France. AROME is also used by 15
other countries in Europe, and is increasingly
used as a research tool.
[34] [35]
COSMO Consortium model developed by several
national meteorological services.
[36] [37]
GEM-LAM Local area model developed and used
operationally by Environment Canada. The
core of the model is identical Environment
Canada’s global model GEM.
[38] [39]
WRF-ARW Community model guided by the National
Center for Atmospheric Research (NCAR) in
the United States. This model has many
parameterizations, and these can lead to results
that differ as much as using a different NWP
model.
[40] [41] [35]
22
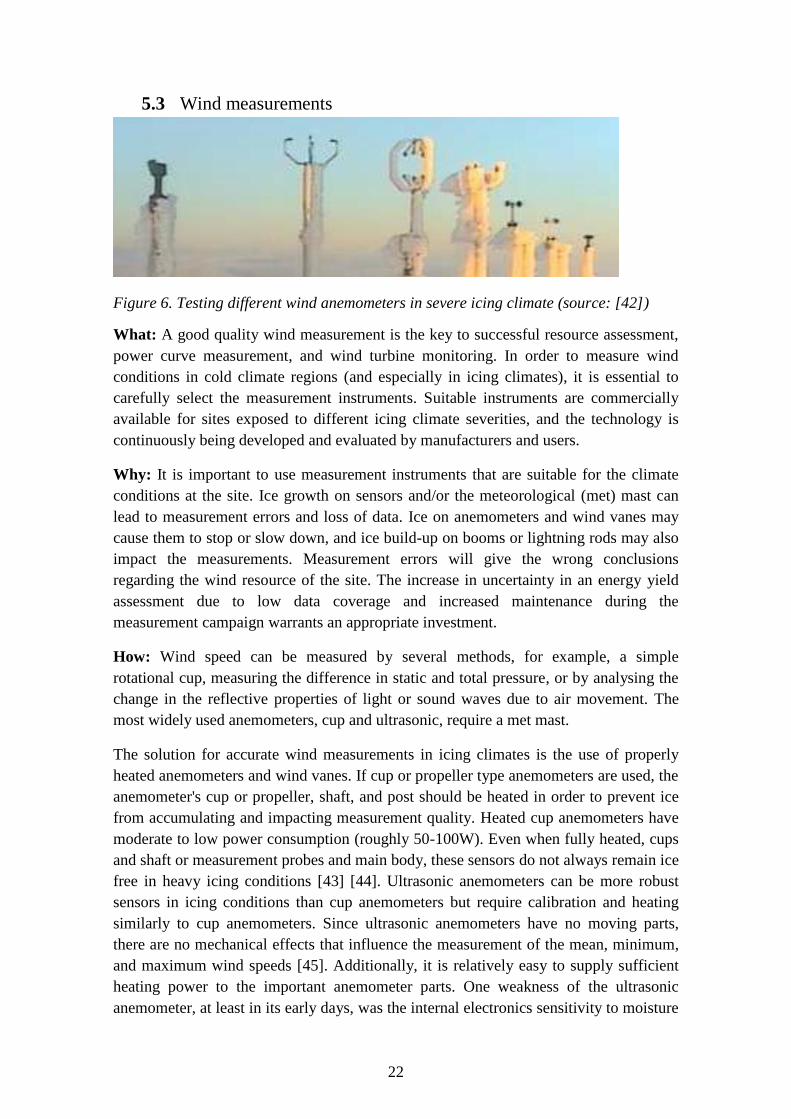
5.3 Wind measurements
Figure 6. Testing different wind anemometers in severe icing climate (source: [42])
What: A good quality wind measurement is the key to successful resource assessment,
power curve measurement, and wind turbine monitoring. In order to measure wind
conditions in cold climate regions (and especially in icing climates), it is essential to
carefully select the measurement instruments. Suitable instruments are commercially
available for sites exposed to different icing climate severities, and the technology is
continuously being developed and evaluated by manufacturers and users.
Why: It is important to use measurement instruments that are suitable for the climate
conditions at the site. Ice growth on sensors and/or the meteorological (met) mast can
lead to measurement errors and loss of data. Ice on anemometers and wind vanes may
cause them to stop or slow down, and ice build-up on booms or lightning rods may also
impact the measurements. Measurement errors will give the wrong conclusions
regarding the wind resource of the site. The increase in uncertainty in an energy yield
assessment due to low data coverage and increased maintenance during the
measurement campaign warrants an appropriate investment.
How: Wind speed can be measured by several methods, for example, a simple
rotational cup, measuring the difference in static and total pressure, or by analysing the
change in the reflective properties of light or sound waves due to air movement. The
most widely used anemometers, cup and ultrasonic, require a met mast.
The solution for accurate wind measurements in icing climates is the use of properly
heated anemometers and wind vanes. If cup or propeller type anemometers are used, the
anemometer's cup or propeller, shaft, and post should be heated in order to prevent ice
from accumulating and impacting measurement quality. Heated cup anemometers have
moderate to low power consumption (roughly 50-100W). Even when fully heated, cups
and shaft or measurement probes and main body, these sensors do not always remain ice
free in heavy icing conditions [43] [44]. Ultrasonic anemometers can be more robust
sensors in icing conditions than cup anemometers but require calibration and heating
similarly to cup anemometers. Since ultrasonic anemometers have no moving parts,
there are no mechanical effects that influence the measurement of the mean, minimum,
and maximum wind speeds [45]. Additionally, it is relatively easy to supply sufficient
heating power to the important anemometer parts. One weakness of the ultrasonic
anemometer, at least in its early days, was the internal electronics sensitivity to moisture
23
when not connected to an uninterrupted power source. In general it is important to note
that heated sensors tend to be less sensitive to low wind speeds and to changes in wind
speed than unheated sensors thus having an impact on the wind measurement quality
and turbulence assessment. Some of the sensors, both heated and non-heated, are also
sensitive to flow that is not horizontal [45]. In icing climates, attention must be paid also
to the positioning of the anemometer and wind vane. In severe icing conditions, the
accuracy gained through heating is quickly lost if neighbouring objects such as booms
and masts are allowed to collect ice. Therefore, these surrounding objects need to be
heated as well.
Remote sensing devices offers an option for parallel or alternative use for anemometers
mounted on masts for obtaining wind measurements. Due to its measurement principle,
LiDAR and SoDAR measurements are not directly influenced by icing [46] [47]. With
an adequate power supply, remote sensing devices perform well in cold climate.
However, the data availability of LiDAR and SoDAR in low temperature climates could
decrease due to the low number of atmospheric particles at very low temperatures under
clear conditions. In contrast, increased air particles from fog or low clouds can influence
the data availability of remote sensing devices at high level by reducing the distance the
signal can reach [46] [48].
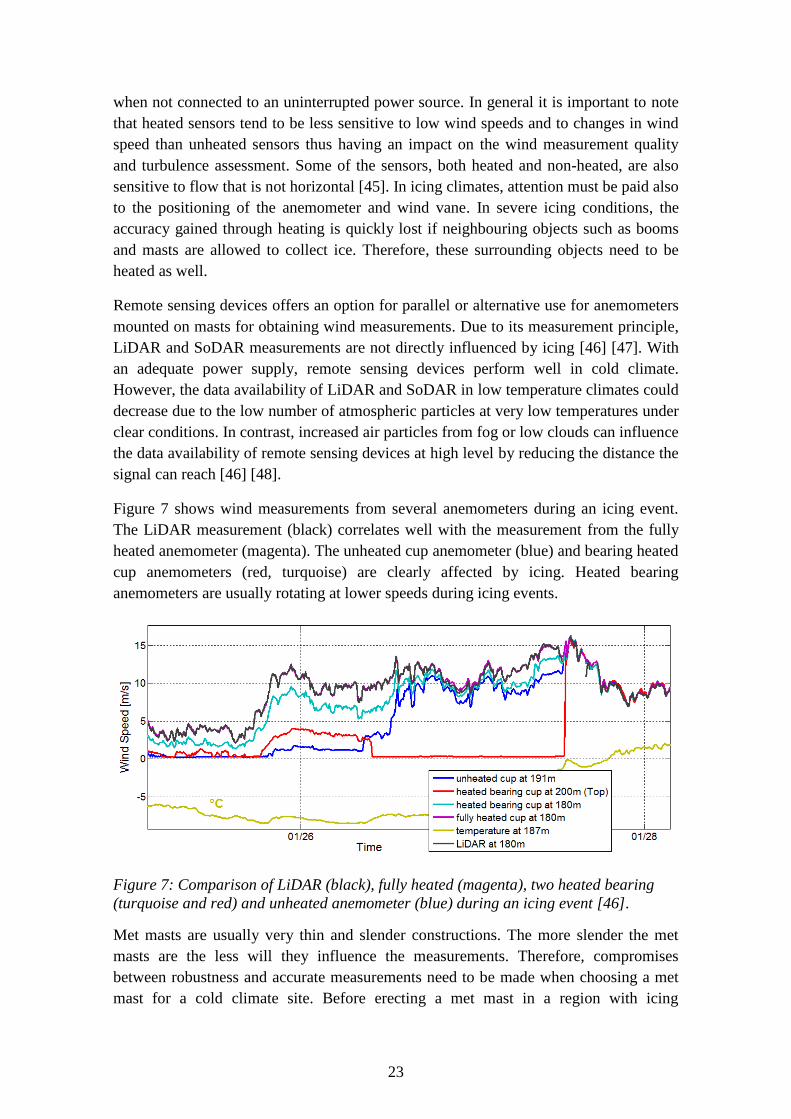
Figure 7 shows wind measurements from several anemometers during an icing event.
The LiDAR measurement (black) correlates well with the measurement from the fully
heated anemometer (magenta). The unheated cup anemometer (blue) and bearing heated
cup anemometers (red, turquoise) are clearly affected by icing. Heated bearing
anemometers are usually rotating at lower speeds during icing events.
Figure 7: Comparison of LiDAR (black), fully heated (magenta), two heated bearing
(turquoise and red) and unheated anemometer (blue) during an icing event [46].
Met masts are usually very thin and slender constructions. The more slender the met
masts are the less will they influence the measurements. Therefore, compromises
between robustness and accurate measurements need to be made when choosing a met
mast for a cold climate site. Before erecting a met mast in a region with icing
24
conditions, calculations of the highest ice load and the highest wind load should be
performed. For permanent masts, the standard ISO 12494 [49] states that a combination
of ice load with a 3 year return period should be combined with a wind speed with 50
year return period. For the non-permanent constructions, the return periods can be
reduced. Lattice towers as well as Tubular (Telescopic) met masts are the most common
types of masts. A properly designed lattice tower is usually a better solution, in cold
climates.
A sufficient power supply system is needed for cold climate site assessment and
measurement campaign. In a perfect world, access to an electricity grid is available. If
there is no grid access, a stand-alone power supply arrangement that is sufficient for
sensor and other heating is a must. Such power supply systems are commercially
available. A cold climate adapted power supply system may consist of batteries and a
diesel generator, solar panels, a small wind generator, and/or a fuel cell [50] [51]. Solar
panels or other weather dependent power sources are usually not sufficient for properly
heated instruments that will maintain their accuracy, as power requirements up to 1500
W are needed.
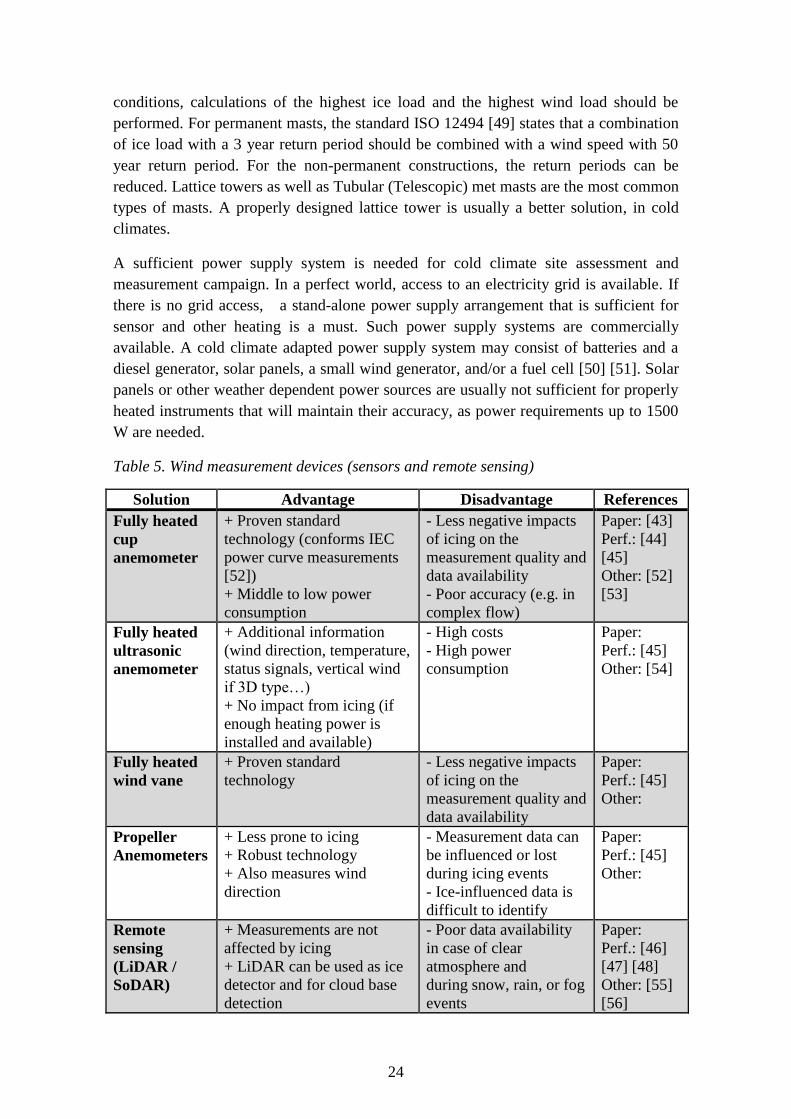
Table 5. Wind measurement devices (sensors and remote sensing)
Solution Advantage Disadvantage References
Fully heated
cup
anemometer
+ Proven standard
technology (conforms IEC
power curve measurements
[52])
+ Middle to low power
consumption
- Less negative impacts
of icing on the
measurement quality and
data availability
- Poor accuracy (e.g. in
complex flow)
Paper: [43]
Perf.: [44]
[45]
Other: [52]
[53]
Fully heated
ultrasonic
anemometer
+ Additional information
(wind direction, temperature,
status signals, vertical wind
if 3D type…)
+ No impact from icing (if
enough heating power is
installed and available)
- High costs
- High power
consumption
Paper:
Perf.: [45]
Other: [54]
Fully heated
wind vane
+ Proven standard
technology
- Less negative impacts
of icing on the
measurement quality and
data availability
Paper:
Perf.: [45]
Other:
Propeller
Anemometers
+ Less prone to icing
+ Robust technology
+ Also measures wind
direction
- Measurement data can
be influenced or lost
during icing events
- Ice-influenced data is
difficult to identify
Paper:
Perf.: [45]
Other:
Remote
sensing
(LiDAR /
SoDAR)
+ Measurements are not
affected by icing
+ LiDAR can be used as ice
detector and for cloud base
detection
- Poor data availability
in case of clear
atmosphere and
during snow, rain, or fog
events
Paper:
Perf.: [46]
[47] [48]
Other: [55]
[56]
25
+ Includes wind direction - No measurement of
meteorological
parameters at the
measuring height (e.g.
temperature, humidity,
etc.)
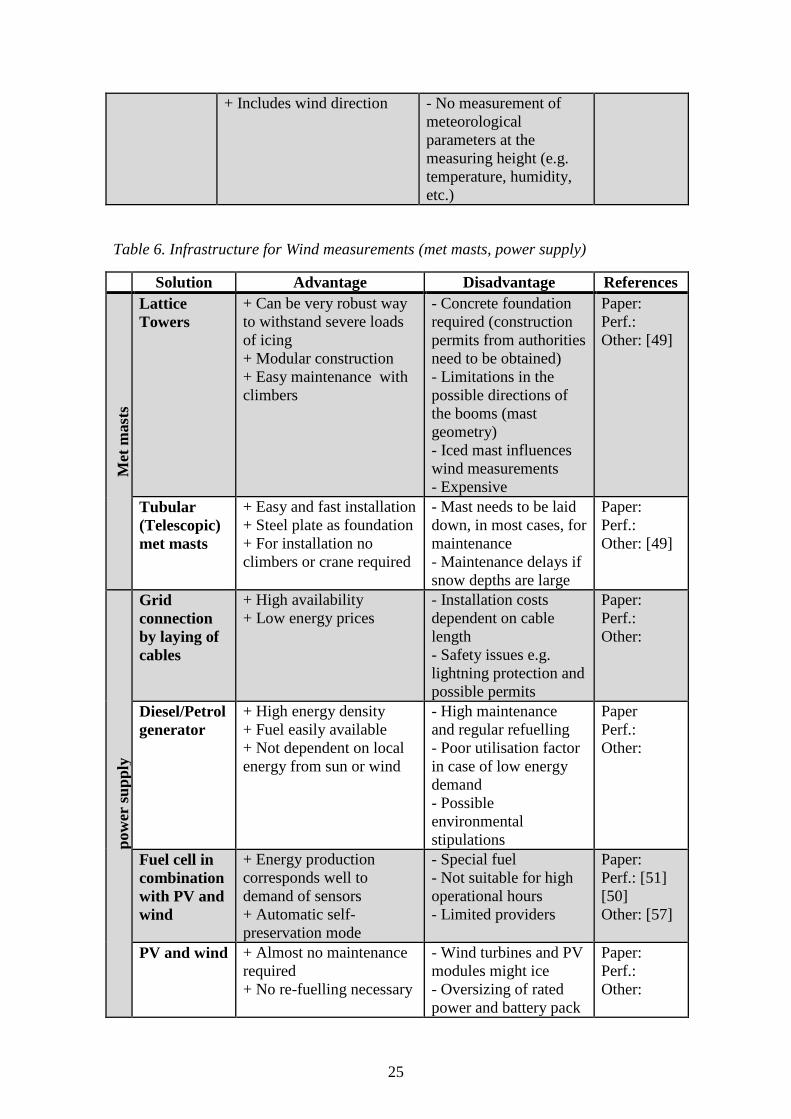
Table 6. Infrastructure for Wind measurements (met masts, power supply)
Solution Advantage Disadvantage References
Met
mast
s
Lattice
Towers
+ Can be very robust way
to withstand severe loads
of icing
+ Modular construction
+ Easy maintenance with
climbers
- Concrete foundation
required (construction
permits from authorities
need to be obtained)
- Limitations in the
possible directions of
the booms (mast
geometry)
- Iced mast influences
wind measurements
- Expensive
Paper:
Perf.:
Other: [49]
Tubular
(Telescopic)
met masts
+ Easy and fast installation
+ Steel plate as foundation
+ For installation no
climbers or crane required
- Mast needs to be laid
down, in most cases, for
maintenance
- Maintenance delays if
snow depths are large
Paper:
Perf.:
Other: [49]
pow
er s
up
ply
Grid
connection
by laying of
cables
+ High availability
+ Low energy prices
- Installation costs
dependent on cable
length
- Safety issues e.g.
lightning protection and
possible permits
Paper:
Perf.:
Other:
Diesel/Petrol
generator
+ High energy density
+ Fuel easily available
+ Not dependent on local
energy from sun or wind
- High maintenance
and regular refuelling
- Poor utilisation factor
in case of low energy
demand
- Possible
environmental
stipulations
Paper
Perf.:
Other:
Fuel cell in
combination
with PV and
wind
+ Energy production
corresponds well to
demand of sensors
+ Automatic self-
preservation mode
- Special fuel
- Not suitable for high
operational hours
- Limited providers
Paper:
Perf.: [51]
[50]
Other: [57]
PV and wind + Almost no maintenance
required
+ No re-fuelling necessary
- Wind turbines and PV
modules might ice
- Oversizing of rated
power and battery pack
Paper:
Perf.:
Other:

26
necessary for 100%
availability
Energy
Managemen
t System
+ Reduced energy demand
+ Heating power required
only during relevant time
periods
+ Highly Advantageous
for locations where access
is hardly possible
- Benefit vs. efforts
depends on site specific
conditions
Paper:
Perf.:
Other:
27
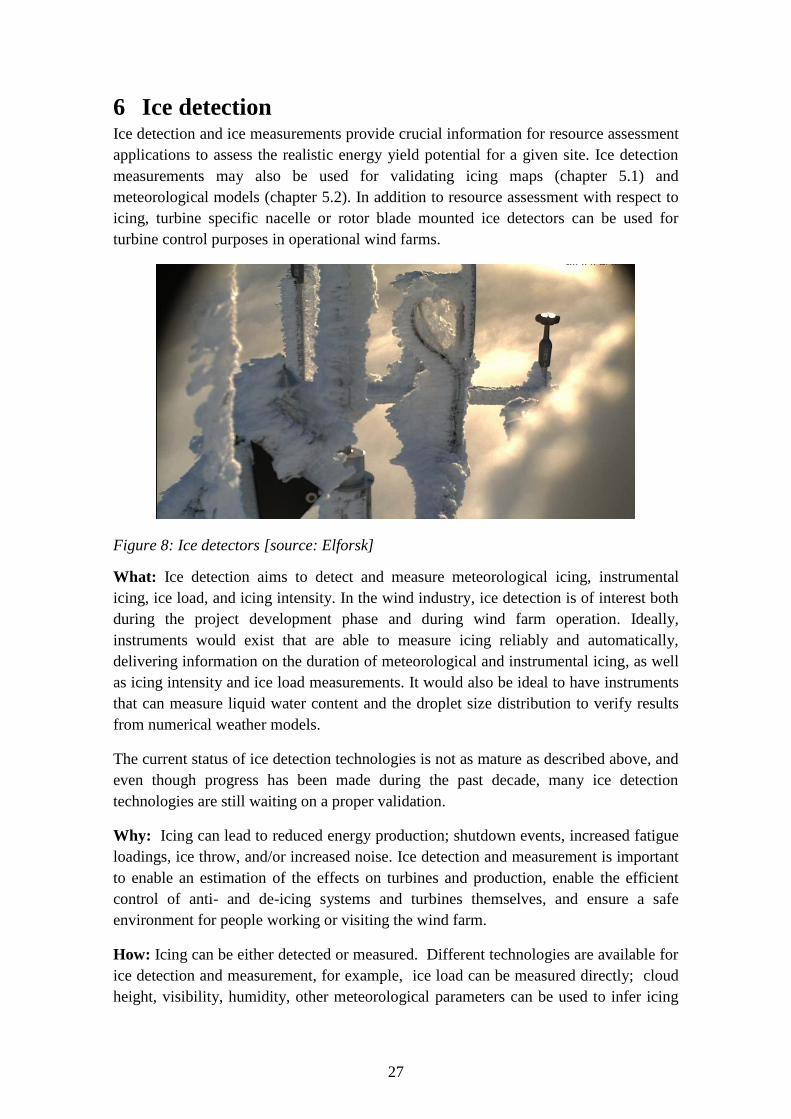
6 Ice detection Ice detection and ice measurements provide crucial information for resource assessment
applications to assess the realistic energy yield potential for a given site. Ice detection
measurements may also be used for validating icing maps (chapter 5.1) and
meteorological models (chapter 5.2). In addition to resource assessment with respect to
icing, turbine specific nacelle or rotor blade mounted ice detectors can be used for
turbine control purposes in operational wind farms.
Figure 8: Ice detectors [source: Elforsk]
What: Ice detection aims to detect and measure meteorological icing, instrumental
icing, ice load, and icing intensity. In the wind industry, ice detection is of interest both
during the project development phase and during wind farm operation. Ideally,
instruments would exist that are able to measure icing reliably and automatically,
delivering information on the duration of meteorological and instrumental icing, as well
as icing intensity and ice load measurements. It would also be ideal to have instruments
that can measure liquid water content and the droplet size distribution to verify results
from numerical weather models.
The current status of ice detection technologies is not as mature as described above, and
even though progress has been made during the past decade, many ice detection
technologies are still waiting on a proper validation.
Why: Icing can lead to reduced energy production; shutdown events, increased fatigue
loadings, ice throw, and/or increased noise. Ice detection and measurement is important
to enable an estimation of the effects on turbines and production, enable the efficient
control of anti- and de-icing systems and turbines themselves, and ensure a safe
environment for people working or visiting the wind farm.
How: Icing can be either detected or measured. Different technologies are available for
ice detection and measurement, for example, ice load can be measured directly; cloud
height, visibility, humidity, other meteorological parameters can be used to infer icing
28
conditions exist; a deviation from a turbines’ normal power curve can be due to icing, or
cameras and image analysis can show icing. The type of technology and the parameter
measured should be adjusted to fit the phase of the wind project. For example, power
curve analysis is only possible when turbines are in operation, whereas, analysis of the
icing climatology by means of measuring ice load, icing intensity, and the length of
icing events is important in the project development phase.
Ice detection sensors can be installed on the turbine nacelle, turbine blade, or on a met
mast. In addition, ice detection can be done using only standard sensors through
algorithms that detect icing signals. The level of maturity differs a lot between different
methods and sensors. The capability of a sensor can range between detecting ice/no ice,
distinguishing between instrumental and meteorological icing, or detecting the severity
and intensity of icing. Some sensors have functionality for detecting all of these, but
with different reliability for the different capabilities. It is common that a sensor with
functionality for measuring both instrumental and meteorological icing, as well as
detecting ice/no ice, is only reliable enough to be used for detection of ice/no ice.
Methods
The available ice detector technologies are listed below in Table 7, for mast and nacelle
based solutions, and Table 8, for turbine rotor based solutions. The information
regarding capabilities (e.g. detection of meteorological or instrumental icing, icing
severity, and whether the detector can be used for turbine control) is based on the
references listed in this document, as well as statistics and user experiences from an ice
detector survey performed by Task 19. The information that a detector has the
possibility to detect, for instance meteorological icing, does not mean that the detector is
suitable to use for detection of meteorological icing in all conditions and environments.
Additionally, detectors identified as suitable for turbine control only means that the
detector type, in one or more known cases, has been used for this application. It does
not mean that the detector is reliable or precise enough for use in controlling anti- or de-
icing systems.
29
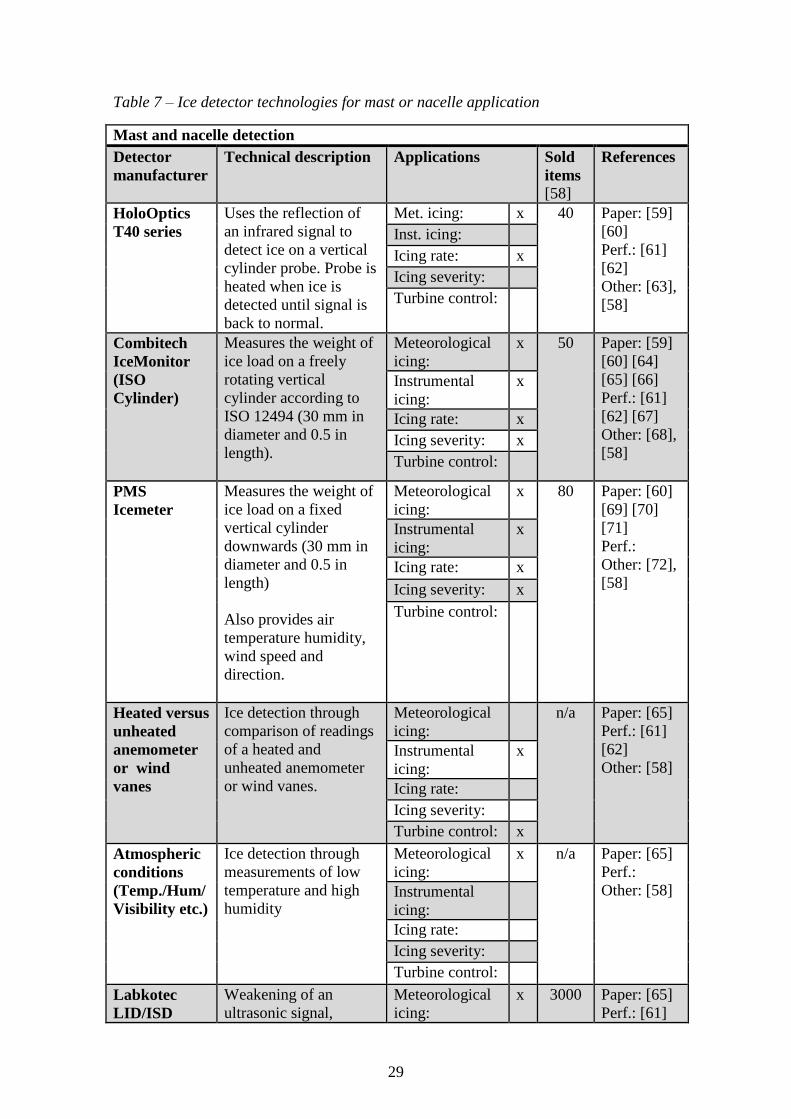
Table 7 – Ice detector technologies for mast or nacelle application
Mast and nacelle detection
Detector
manufacturer
Technical description Applications Sold
items
[58]
References
HoloOptics
T40 series
Uses the reflection of
an infrared signal to
detect ice on a vertical
cylinder probe. Probe is
heated when ice is
detected until signal is
back to normal.
Met. icing: x 40 Paper: [59]
[60]
Perf.: [61]
[62]
Other: [63],
[58]
Inst. icing:
Icing rate: x
Icing severity:
Turbine control:
Combitech
IceMonitor
(ISO
Cylinder)
Measures the weight of
ice load on a freely
rotating vertical
cylinder according to
ISO 12494 (30 mm in
diameter and 0.5 in
length).
Meteorological
icing:
x 50 Paper: [59]
[60] [64]
[65] [66]
Perf.: [61]
[62] [67]
Other: [68],
[58]
Instrumental
icing:
x
Icing rate: x
Icing severity: x
Turbine control:
PMS
Icemeter
Measures the weight of
ice load on a fixed
vertical cylinder
downwards (30 mm in
diameter and 0.5 in
length)
Also provides air
temperature humidity,
wind speed and
direction.
Meteorological
icing:
x 80 Paper: [60]
[69] [70]
[71]
Perf.:
Other: [72],
[58]
Instrumental
icing:
x
Icing rate: x
Icing severity: x
Turbine control:
Heated versus
unheated
anemometer
or wind
vanes
Ice detection through
comparison of readings
of a heated and
unheated anemometer
or wind vanes.
Meteorological
icing:
n/a Paper: [65]
Perf.: [61]
[62]
Other: [58]
Instrumental
icing:
x
Icing rate:
Icing severity:
Turbine control: x
Atmospheric
conditions
(Temp./Hum/
Visibility etc.)
Ice detection through
measurements of low
temperature and high
humidity
Meteorological
icing:
x n/a Paper: [65]
Perf.:
Other: [58]
Instrumental
icing:
Icing rate:
Icing severity:
Turbine control:
Labkotec
LID/ISD
Weakening of an
ultrasonic signal,
Meteorological
icing:
x 3000 Paper: [65]
Perf.: [61]
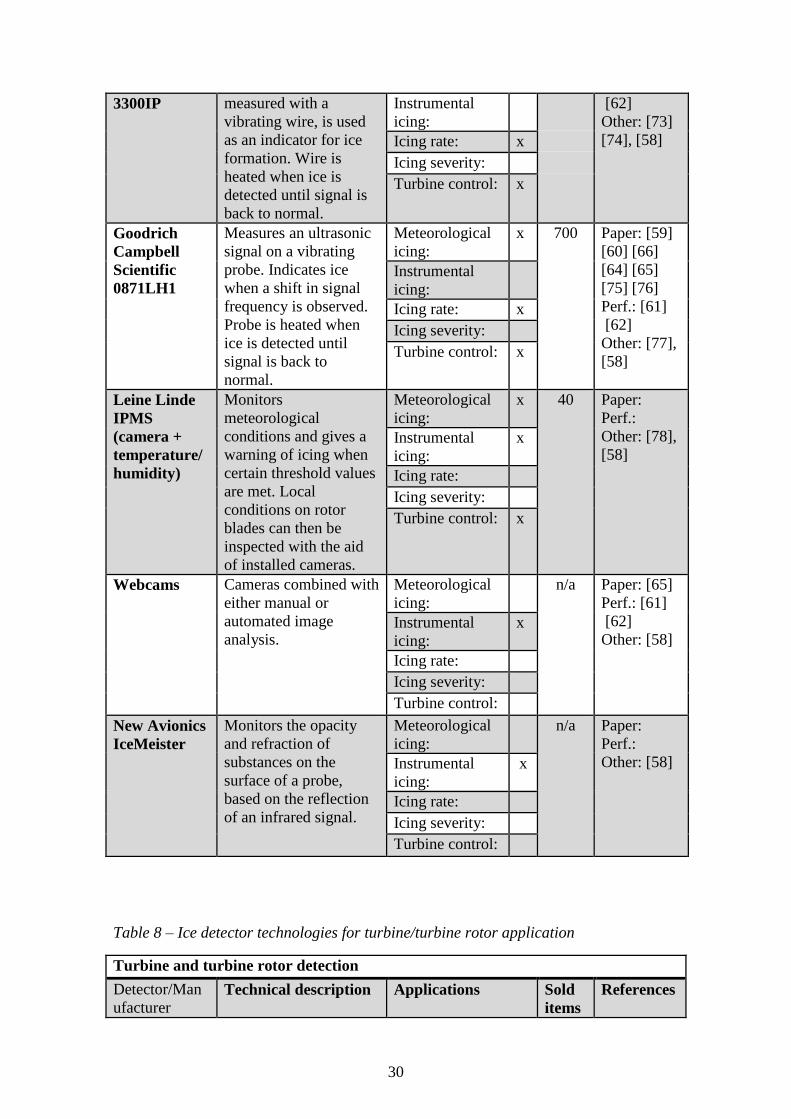
30
3300IP measured with a
vibrating wire, is used
as an indicator for ice
formation. Wire is
heated when ice is
detected until signal is
back to normal.
Instrumental
icing:
[62]
Other: [73]
[74], [58] Icing rate: x
Icing severity:
Turbine control: x
Goodrich
Campbell
Scientific
0871LH1
Measures an ultrasonic
signal on a vibrating
probe. Indicates ice
when a shift in signal
frequency is observed.
Probe is heated when
ice is detected until
signal is back to
normal.
Meteorological
icing:
x 700 Paper: [59]
[60] [66]
[64] [65]
[75] [76]
Perf.: [61]
[62]
Other: [77],
[58]
Instrumental
icing:
Icing rate: x
Icing severity:
Turbine control: x
Leine Linde
IPMS
(camera +
temperature/
humidity)
Monitors
meteorological
conditions and gives a
warning of icing when
certain threshold values
are met. Local
conditions on rotor
blades can then be
inspected with the aid
of installed cameras.
Meteorological
icing:
x 40 Paper:
Perf.:
Other: [78],
[58]
Instrumental
icing:
x
Icing rate:
Icing severity:
Turbine control: x
Webcams Cameras combined with
either manual or
automated image
analysis.
Meteorological
icing:
n/a Paper: [65]
Perf.: [61]
[62]
Other: [58]
Instrumental
icing:
x
Icing rate:
Icing severity:
Turbine control:
New Avionics
IceMeister
Monitors the opacity
and refraction of
substances on the
surface of a probe,
based on the reflection
of an infrared signal.
Meteorological
icing:
n/a Paper:
Perf.:
Other: [58]
Instrumental
icing:
x
Icing rate:
Icing severity:
Turbine control:
Table 8 – Ice detector technologies for turbine/turbine rotor application
Turbine and turbine rotor detection
Detector/Man
ufacturer Technical description Applications Sold
items
References
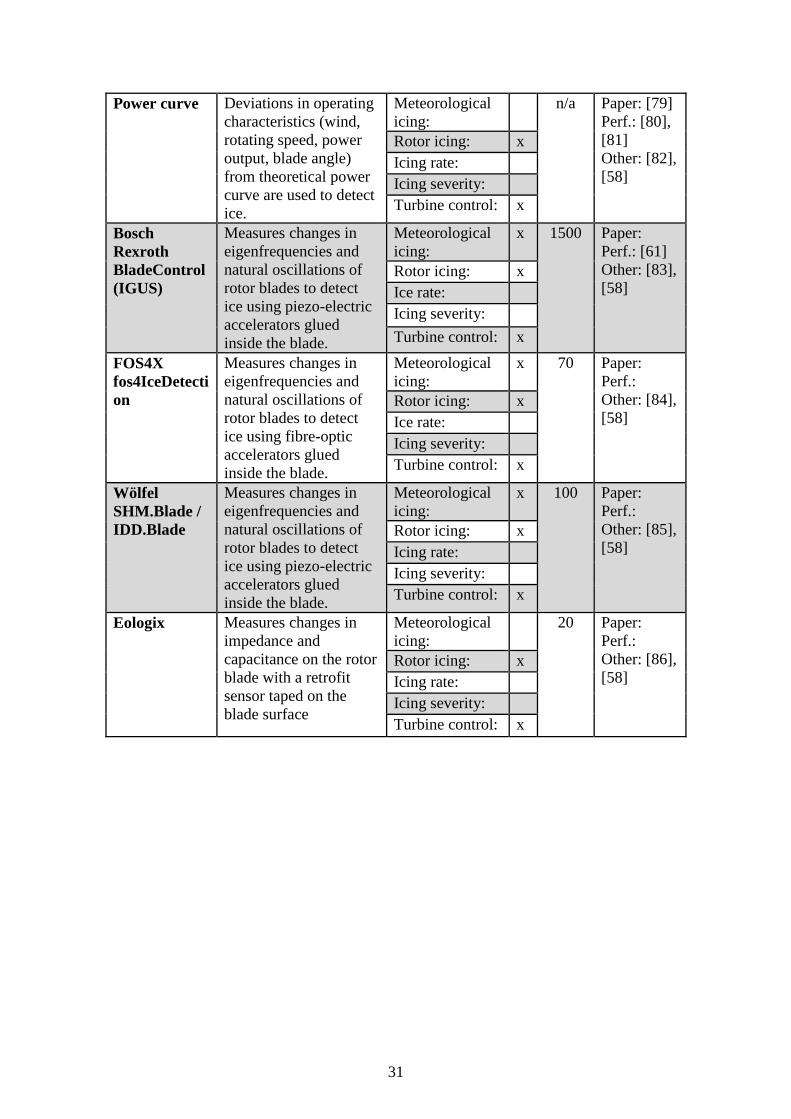
31
Power curve Deviations in operating
characteristics (wind,
rotating speed, power
output, blade angle)
from theoretical power
curve are used to detect
ice.
Meteorological
icing:
n/a Paper: [79]
Perf.: [80],
[81]
Other: [82],
[58]
Rotor icing: x
Icing rate:
Icing severity:
Turbine control: x
Bosch
Rexroth
BladeControl
(IGUS)
Measures changes in
eigenfrequencies and
natural oscillations of
rotor blades to detect
ice using piezo-electric
accelerators glued
inside the blade.
Meteorological
icing:
x 1500 Paper:
Perf.: [61]
Other: [83],
[58]
Rotor icing: x
Ice rate:
Icing severity:
Turbine control: x
FOS4X
fos4IceDetecti
on
Measures changes in
eigenfrequencies and
natural oscillations of
rotor blades to detect
ice using fibre-optic
accelerators glued
inside the blade.
Meteorological
icing:
x 70 Paper:
Perf.:
Other: [84],
[58]
Rotor icing: x
Ice rate:
Icing severity:
Turbine control: x
Wölfel
SHM.Blade /
IDD.Blade
Measures changes in
eigenfrequencies and
natural oscillations of
rotor blades to detect
ice using piezo-electric
accelerators glued
inside the blade.
Meteorological
icing:
x 100 Paper:
Perf.:
Other: [85],
[58]
Rotor icing: x
Icing rate:
Icing severity:
Turbine control: x
Eologix Measures changes in
impedance and
capacitance on the rotor
blade with a retrofit
sensor taped on the
blade surface
Meteorological
icing:
20 Paper:
Perf.:
Other: [86],
[58]
Rotor icing: x
Icing rate:
Icing severity:
Turbine control: x
32
7 Ice models Ice accretion models are important for evaluating the process of ice accretion and
removal on objects. Advanced ice accretion models (7.1) are used to investigate the
detailed physics of the ice accretion process in studies ranging from single supercooled
droplet trajectories to detailed 2D or 3D ice shapes on an object. Simplified, empirical
ice accretion models (7.2) are useful when coupled with other simulation models such
as mesoscale weather models. The newer ice ablation models (7.3) are very important
for wind energy, as an accurate estimate of ice ablation rate is required to determine
when the instrumental or rotor icing periods have ended.
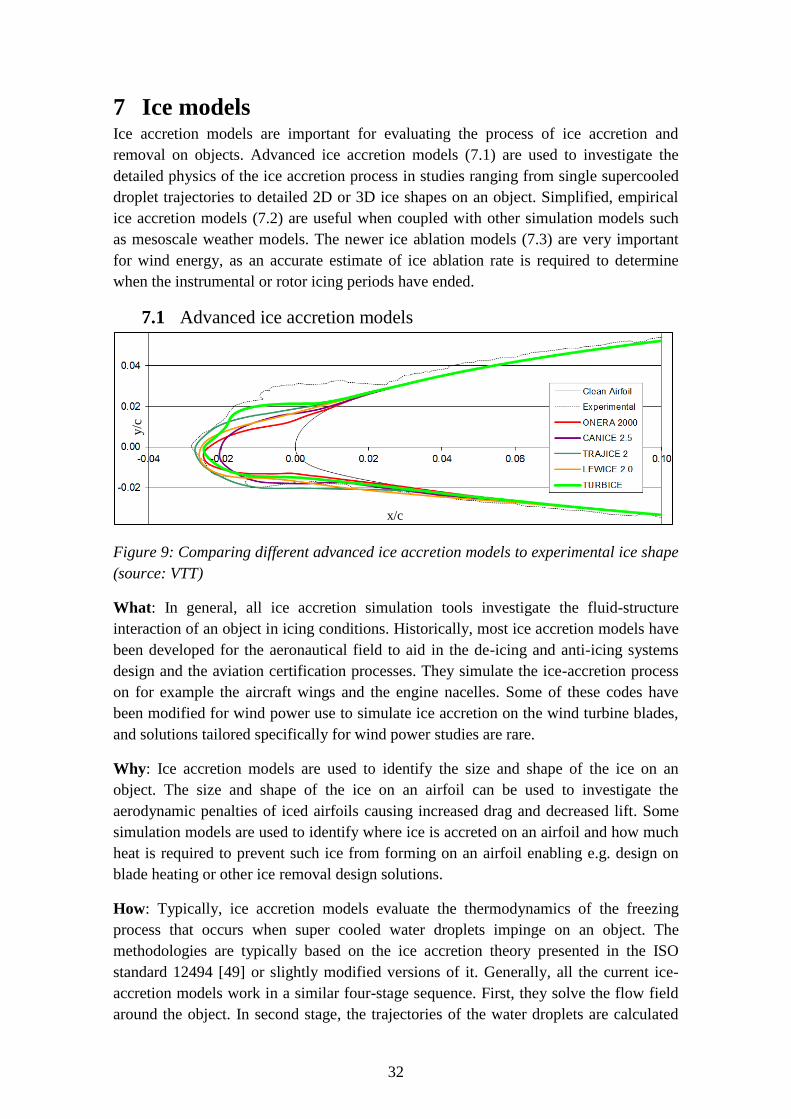
7.1 Advanced ice accretion models
Figure 9: Comparing different advanced ice accretion models to experimental ice shape
(source: VTT)
What: In general, all ice accretion simulation tools investigate the fluid-structure
interaction of an object in icing conditions. Historically, most ice accretion models have
been developed for the aeronautical field to aid in the de-icing and anti-icing systems
design and the aviation certification processes. They simulate the ice-accretion process
on for example the aircraft wings and the engine nacelles. Some of these codes have
been modified for wind power use to simulate ice accretion on the wind turbine blades,
and solutions tailored specifically for wind power studies are rare.
Why: Ice accretion models are used to identify the size and shape of the ice on an
object. The size and shape of the ice on an airfoil can be used to investigate the
aerodynamic penalties of iced airfoils causing increased drag and decreased lift. Some
simulation models are used to identify where ice is accreted on an airfoil and how much
heat is required to prevent such ice from forming on an airfoil enabling e.g. design on
blade heating or other ice removal design solutions.
How: Typically, ice accretion models evaluate the thermodynamics of the freezing
process that occurs when super cooled water droplets impinge on an object. The
methodologies are typically based on the ice accretion theory presented in the ISO
standard 12494 [49] or slightly modified versions of it. Generally, all the current ice-
accretion models work in a similar four-stage sequence. First, they solve the flow field
around the object. In second stage, the trajectories of the water droplets are calculated
x/c
y/c
33
and their impingement rate on the object is determined. The third stage takes the surface
roughness of the accreted ice and the boundary-layer characteristics into account.
Finally, the thermodynamic model determines the amount and the geometry of the
accreting ice.
Most of the models are run in a 2D or quasi-3D environment, but fully 3D models have
also been developed. A 2D solution means that only one airfoil is simulated, whereas
quasi-3D models use 2D solutions to solve for individual airfoils along the blade, and
then combine the results to form ice accretion on a complete blade. Quasi-3D solutions
do not take into account the 3D flow effects. Fully 3D solutions simulate the blade as a
whole and also take the 3D flow effects into account. In 2D and quasi-3D solutions the
flow solvers are usually based on the potential-flow equations whereas for fully 3D
solutions the Navier-Stokes or Euler equations are used.
The main advantage of using dedicated ice accretion models is that they provide the
most realistic and state-of-the-art fluid-structure interaction simulations. The model
results can also reduce expensive testing costs in icing wind tunnels or field
experiments.
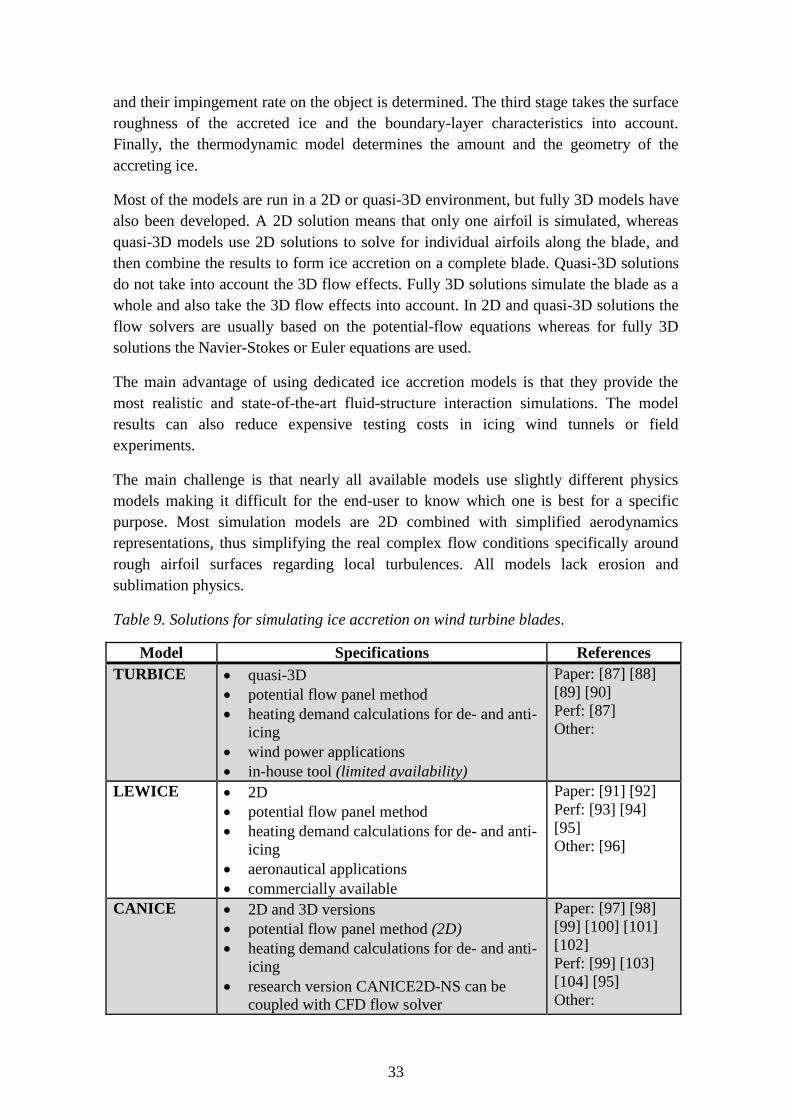
The main challenge is that nearly all available models use slightly different physics
models making it difficult for the end-user to know which one is best for a specific
purpose. Most simulation models are 2D combined with simplified aerodynamics
representations, thus simplifying the real complex flow conditions specifically around
rough airfoil surfaces regarding local turbulences. All models lack erosion and
sublimation physics.
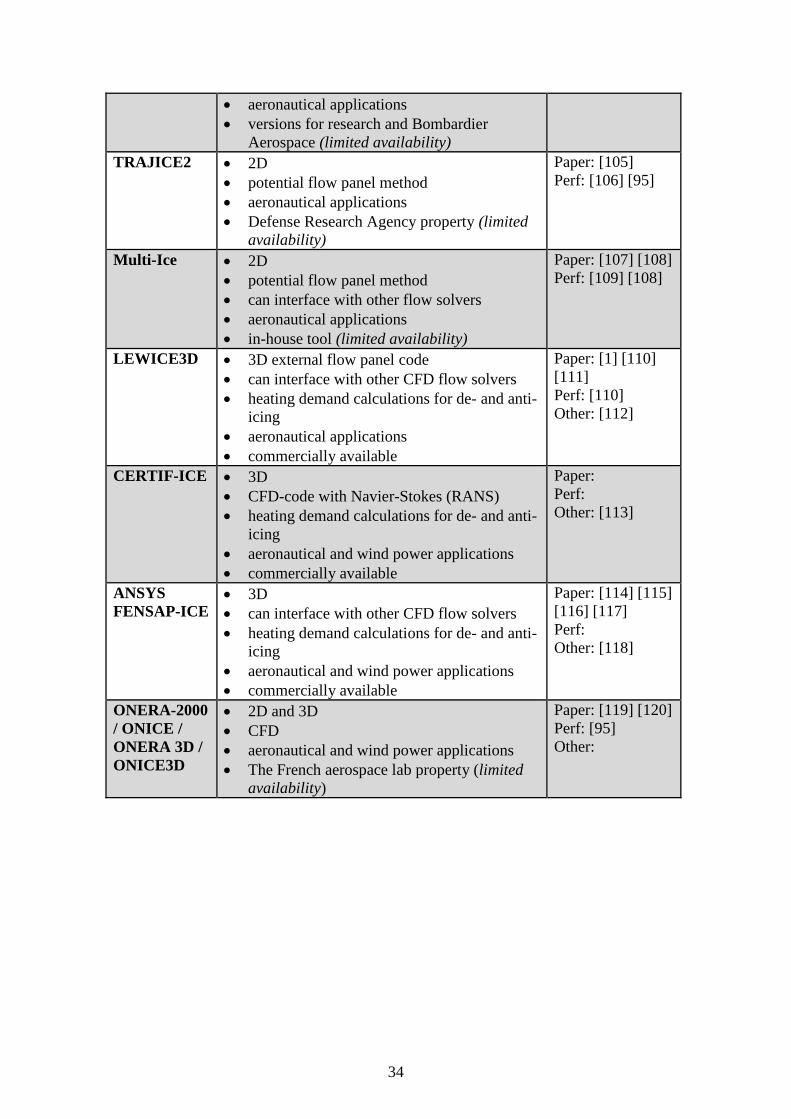
Table 9. Solutions for simulating ice accretion on wind turbine blades.
Model Specifications References
TURBICE quasi-3D
potential flow panel method
heating demand calculations for de- and anti-
icing
wind power applications
in-house tool (limited availability)
Paper: [87] [88]
[89] [90]
Perf: [87]
Other:
LEWICE 2D
potential flow panel method
heating demand calculations for de- and anti-
icing
aeronautical applications
commercially available
Paper: [91] [92]
Perf: [93] [94]
[95]
Other: [96]
CANICE 2D and 3D versions
potential flow panel method (2D)
heating demand calculations for de- and anti-
icing
research version CANICE2D-NS can be
coupled with CFD flow solver
Paper: [97] [98]
[99] [100] [101]
[102]
Perf: [99] [103]
[104] [95]
Other:
34
aeronautical applications
versions for research and Bombardier
Aerospace (limited availability)
TRAJICE2 2D
potential flow panel method
aeronautical applications
Defense Research Agency property (limited
availability)
Paper: [105]
Perf: [106] [95]
Multi-Ice 2D
potential flow panel method
can interface with other flow solvers
aeronautical applications
in-house tool (limited availability)
Paper: [107] [108]
Perf: [109] [108]
LEWICE3D 3D external flow panel code
can interface with other CFD flow solvers
heating demand calculations for de- and anti-
icing
aeronautical applications
commercially available
Paper: [1] [110]
[111]
Perf: [110]
Other: [112]
CERTIF-ICE 3D
CFD-code with Navier-Stokes (RANS)
heating demand calculations for de- and anti-
icing
aeronautical and wind power applications
commercially available
Paper:
Perf:
Other: [113]
ANSYS
FENSAP-ICE 3D
can interface with other CFD flow solvers
heating demand calculations for de- and anti-
icing
aeronautical and wind power applications
commercially available
Paper: [114] [115]
[116] [117]
Perf:
Other: [118]
ONERA-2000
/ ONICE /
ONERA 3D /
ONICE3D
2D and 3D
CFD
aeronautical and wind power applications
The French aerospace lab property (limited
availability)
Paper: [119] [120]
Perf: [95]
Other:
35
7.2 Empirical ice accretion models
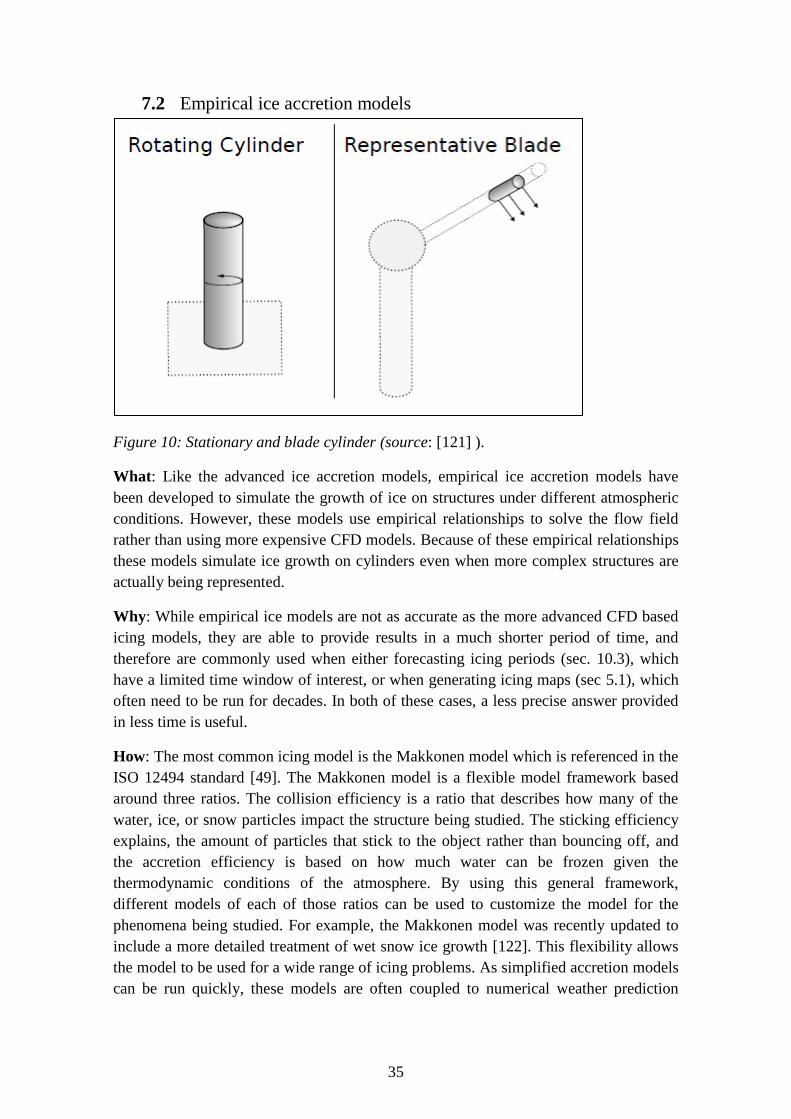
Figure 10: Stationary and blade cylinder (source: [121] ).
What: Like the advanced ice accretion models, empirical ice accretion models have
been developed to simulate the growth of ice on structures under different atmospheric
conditions. However, these models use empirical relationships to solve the flow field
rather than using more expensive CFD models. Because of these empirical relationships
these models simulate ice growth on cylinders even when more complex structures are
actually being represented.
Why: While empirical ice models are not as accurate as the more advanced CFD based
icing models, they are able to provide results in a much shorter period of time, and
therefore are commonly used when either forecasting icing periods (sec. 10.3), which
have a limited time window of interest, or when generating icing maps (sec 5.1), which
often need to be run for decades. In both of these cases, a less precise answer provided
in less time is useful.
How: The most common icing model is the Makkonen model which is referenced in the
ISO 12494 standard [49]. The Makkonen model is a flexible model framework based
around three ratios. The collision efficiency is a ratio that describes how many of the
water, ice, or snow particles impact the structure being studied. The sticking efficiency
explains, the amount of particles that stick to the object rather than bouncing off, and
the accretion efficiency is based on how much water can be frozen given the
thermodynamic conditions of the atmosphere. By using this general framework,
different models of each of those ratios can be used to customize the model for the
phenomena being studied. For example, the Makkonen model was recently updated to
include a more detailed treatment of wet snow ice growth [122]. This flexibility allows
the model to be used for a wide range of icing problems. As simplified accretion models
can be run quickly, these models are often coupled to numerical weather prediction
36
(NWP) models to provide an estimate of the risk under different meteorological
conditions.
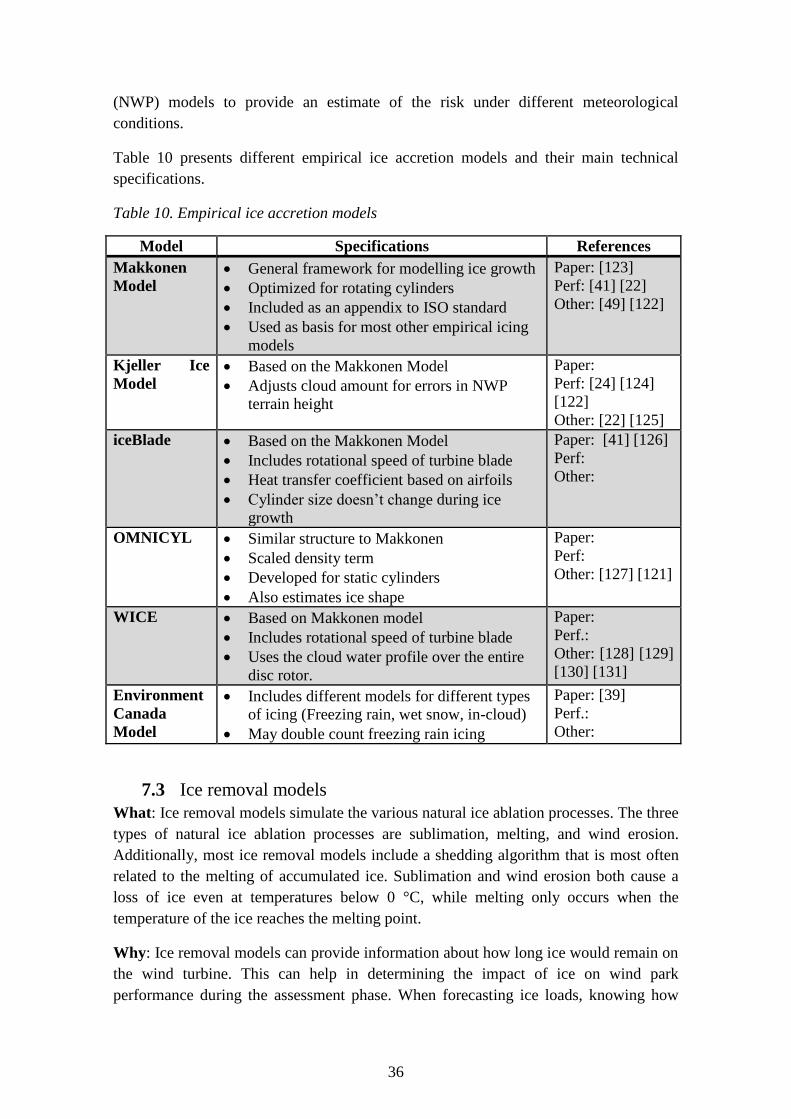
Table 10 presents different empirical ice accretion models and their main technical
specifications.
Table 10. Empirical ice accretion models
Model Specifications References
Makkonen
Model General framework for modelling ice growth
Optimized for rotating cylinders
Included as an appendix to ISO standard
Used as basis for most other empirical icing
models
Paper: [123]
Perf: [41] [22]
Other: [49] [122]
Kjeller Ice
Model Based on the Makkonen Model
Adjusts cloud amount for errors in NWP
terrain height
Paper:
Perf: [24] [124]
[122]
Other: [22] [125]
iceBlade Based on the Makkonen Model
Includes rotational speed of turbine blade
Heat transfer coefficient based on airfoils
Cylinder size doesn’t change during ice
growth
Paper: [41] [126]
Perf:
Other:
OMNICYL Similar structure to Makkonen
Scaled density term
Developed for static cylinders
Also estimates ice shape
Paper:
Perf:
Other: [127] [121]
WICE Based on Makkonen model
Includes rotational speed of turbine blade
Uses the cloud water profile over the entire
disc rotor.
Paper:
Perf.:
Other: [128] [129]
[130] [131]
Environment
Canada
Model
Includes different models for different types
of icing (Freezing rain, wet snow, in-cloud)
May double count freezing rain icing
Paper: [39]
Perf.:
Other:
7.3 Ice removal models
What: Ice removal models simulate the various natural ice ablation processes. The three
types of natural ice ablation processes are sublimation, melting, and wind erosion.
Additionally, most ice removal models include a shedding algorithm that is most often
related to the melting of accumulated ice. Sublimation and wind erosion both cause a
loss of ice even at temperatures below 0 °C, while melting only occurs when the
temperature of the ice reaches the melting point.
Why: Ice removal models can provide information about how long ice would remain on
the wind turbine. This can help in determining the impact of ice on wind park
performance during the assessment phase. When forecasting ice loads, knowing how
37
long the ice will persist can aid in the operation of the wind park, allowing the operator
to either down-rate the turbine to accumulate less ice, or activate de-icing systems. With
this knowledge, the wind park operator can determine the most cost effective way of
preparing for each ice event.
How: Melting and sublimation are both based on the energy balance at the surface of
the ice. When there is incoming energy to the ice surface, either through heat transfer,
humidity differences, or incoming solar radiation, it will cause the ice to be removed
through phase change. When the temperature is above 0°C this will occur through
melting, but when the temperature is below 0°C sublimation will occur. In most of the
models, the ice is removed from the blade rapidly once melting occurs as it is assumed
that the ice de-adheres from the turbine, and be thrown from the blade due to the
rotational forces.
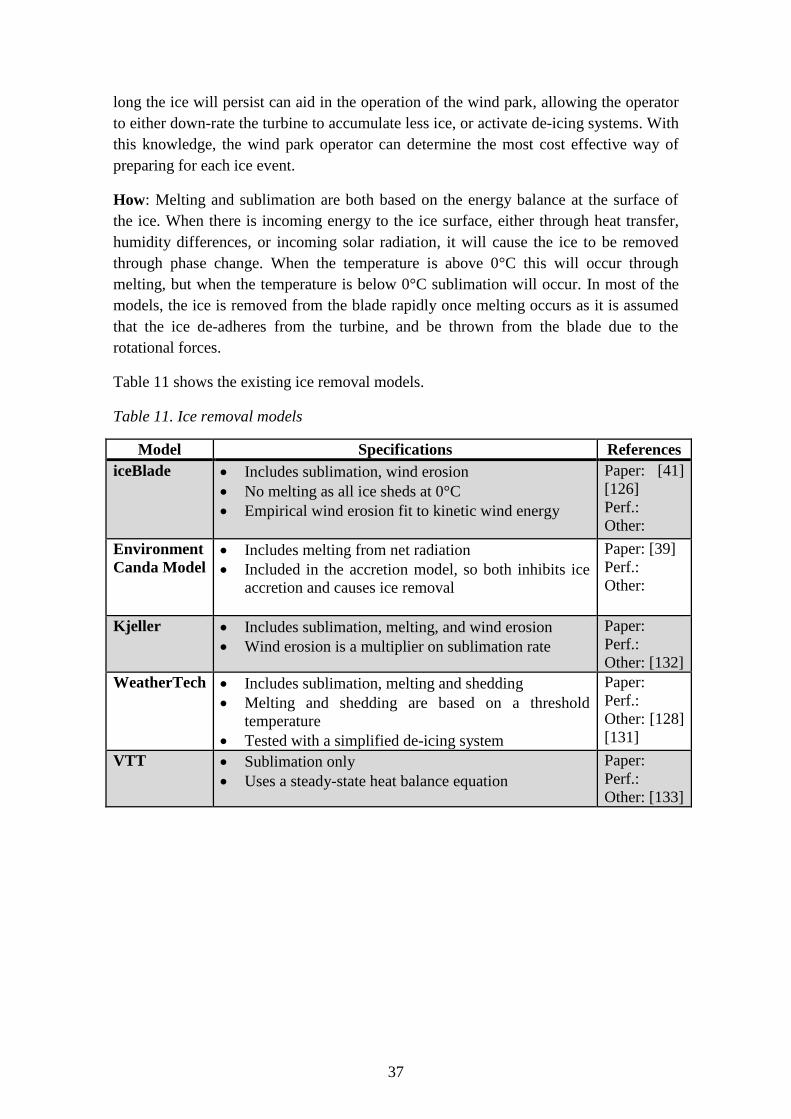
Table 11 shows the existing ice removal models.
Table 11. Ice removal models
Model Specifications References
iceBlade Includes sublimation, wind erosion
No melting as all ice sheds at 0°C
Empirical wind erosion fit to kinetic wind energy
Paper: [41]
[126]
Perf.:
Other:
Environment
Canda Model Includes melting from net radiation
Included in the accretion model, so both inhibits ice
accretion and causes ice removal
Paper: [39]
Perf.:
Other:
Kjeller Includes sublimation, melting, and wind erosion
Wind erosion is a multiplier on sublimation rate
Paper:
Perf.:
Other: [132]
WeatherTech Includes sublimation, melting and shedding
Melting and shedding are based on a threshold
temperature
Tested with a simplified de-icing system
Paper:
Perf.:
Other: [128]
[131]
VTT Sublimation only
Uses a steady-state heat balance equation
Paper:
Perf.:
Other: [133]
38
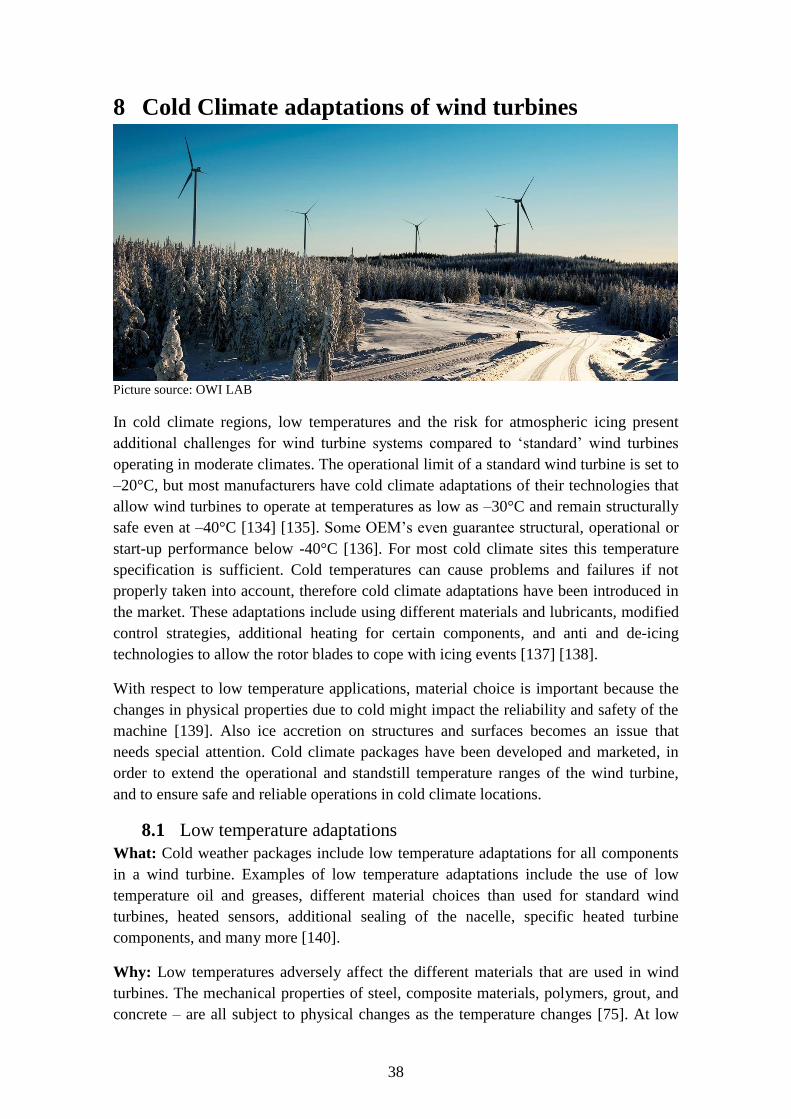
8 Cold Climate adaptations of wind turbines
Picture source: OWI LAB
In cold climate regions, low temperatures and the risk for atmospheric icing present
additional challenges for wind turbine systems compared to ‘standard’ wind turbines
operating in moderate climates. The operational limit of a standard wind turbine is set to
–20°C, but most manufacturers have cold climate adaptations of their technologies that
allow wind turbines to operate at temperatures as low as –30°C and remain structurally
safe even at –40°C [134] [135]. Some OEM’s even guarantee structural, operational or
start-up performance below -40°C [136]. For most cold climate sites this temperature
specification is sufficient. Cold temperatures can cause problems and failures if not
properly taken into account, therefore cold climate adaptations have been introduced in
the market. These adaptations include using different materials and lubricants, modified
control strategies, additional heating for certain components, and anti and de-icing
technologies to allow the rotor blades to cope with icing events [137] [138].
With respect to low temperature applications, material choice is important because the
changes in physical properties due to cold might impact the reliability and safety of the
machine [139]. Also ice accretion on structures and surfaces becomes an issue that
needs special attention. Cold climate packages have been developed and marketed, in
order to extend the operational and standstill temperature ranges of the wind turbine,
and to ensure safe and reliable operations in cold climate locations.
8.1 Low temperature adaptations
What: Cold weather packages include low temperature adaptations for all components
in a wind turbine. Examples of low temperature adaptations include the use of low
temperature oil and greases, different material choices than used for standard wind
turbines, heated sensors, additional sealing of the nacelle, specific heated turbine
components, and many more [140].
Why: Low temperatures adversely affect the different materials that are used in wind
turbines. The mechanical properties of steel, composite materials, polymers, grout, and
concrete – are all subject to physical changes as the temperature changes [75]. At low
39
temperatures, materials tend to become brittle (reduced ability to deform without
damage) and become less tough (capacity to absorb energy upon impact, as expressed
by the Charpy value). Differential thermal expansion of materials must also be
addressed with respect to low temperatures. Certain components may have high internal
temperatures when starting up while the outside is still cold, for example, bearings need
to be able to cope with differential thermal expansions with respect to their tolerances.
Composite materials, for example those used in the rotor blades, can have unequal
shrinkage of the fibre/matrix components leading to residual stress.
Micro-cracking can occur if the stress is sufficient and if this phenomenon is not taken
properly into account. This potential failure applies not only to rotor blades, where both
stiffness and impermeability are reduced, but also to electrical equipment that use
isolation resin. Concrete or grouted structures [141] in a wind turbine need to be
adapted for cold climates, as thermal cracking can affect the permeability of the
structure and increase the risk for water infiltration, with an associated higher risk of
corrosion.
Low temperatures can also damage electrical equipment such as generators, yaw and
pitch drive motors [142], transformers, etc. When starting up a pitch drive in cold
conditions, damage can occur in the stator due to the sudden increase in heat and the
resulting differential thermal expansion in the cold machine. If not properly taken into
account during the design, this can ultimately lead to failure or a decreased motor
lifetime.
In liquid-filled transformers, heat generated by the internal losses generated inside the
transformer windings may not be evacuated fast enough in cold-start scenarios [143].
Liquid filled transformers can be cooled down to -30°C or even -40°C depending on
their location in the wind turbine, which can be either outside, in the base of the tower,
in the mid-section of the tower, or in the nacelle. Due to the higher viscosity of the
cooling liquids at such low temperatures, the natural convection cooling of the internal
windings may be limited, as the oil is too stiff to circulate and loses its ability to remove
heat [143]. Not only do liquid-filled transformer designs have additional reliability and
safety risk in low temperatures, but cast-resin transformers are also at risk. In cast-resin
transformers, the resin of the transformer windings can become brittle at cold
temperatures and thermal stresses can cause micro-cracks.
Gearboxes, bearings, pitch and yaw systems and hydraulic components also suffer when
exposed to cold weather. When temperature drops, the viscosity of the lubricants and
hydraulic fluids increases up to a point when the oil is too stiff to be pumped (high
pump loads), making it unable to lubricate gearboxes and bearings sufficiently.
Insufficient lubrication of such components can damage gears in seconds if the oil is too
thick to freely circulate. Also a higher viscosity of lubricant reduces the power
transmission capacity of the gearbox and thus negatively impacts efficiency [144].
Seals for components dealing with oils and greases also need special attention during
design to prevent leakage, as they tend to lose their flexibility at low temperatures.
40
How: The checklist in Table 14 describes the adaptations and modifications that are
typically found in cold weather packages. As stated, cold weather packages vary
depending on the turbine manufacturer, as does the type of technology used to cope
with specific low temperature challenges. The checklist in Table 14 could be used by
developers to ensure that their cold climate adapted wind turbines are compliant with
the challenging environmental conditions that occur on such sites
Advantage:
Low temperature adaptations and cold weather packages ensure an increased
availability and reliability for wind turbines in cold climate sites. As production yield in
winter time is typically good due to high average wind speeds and a higher air density,
such customization for cold climate is beneficial for production revenues [145].
Challenge:
Although cold weather packages are beneficial for cold climates, they also require
additional power consumption for heating the nacelle space and other turbine
components. Lowering this power consumption and reducing cold-start times by using
new control strategies that increase the efficiency and re-energizing time of the turbine
are still challenges today. During the site evaluation, one should evaluate if such
adaptations will pay-off based on historical climatic data.
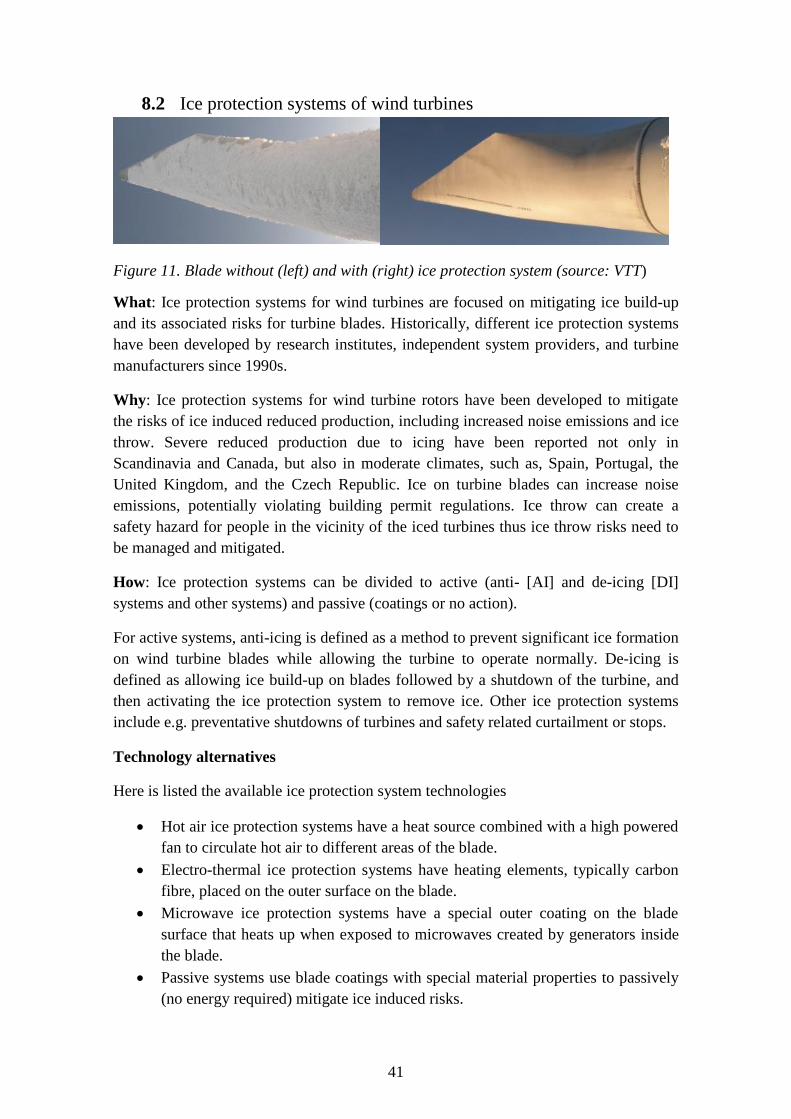
41
8.2 Ice protection systems of wind turbines
Figure 11. Blade without (left) and with (right) ice protection system (source: VTT)
What: Ice protection systems for wind turbines are focused on mitigating ice build-up
and its associated risks for turbine blades. Historically, different ice protection systems
have been developed by research institutes, independent system providers, and turbine
manufacturers since 1990s.
Why: Ice protection systems for wind turbine rotors have been developed to mitigate
the risks of ice induced reduced production, including increased noise emissions and ice
throw. Severe reduced production due to icing have been reported not only in
Scandinavia and Canada, but also in moderate climates, such as, Spain, Portugal, the
United Kingdom, and the Czech Republic. Ice on turbine blades can increase noise
emissions, potentially violating building permit regulations. Ice throw can create a
safety hazard for people in the vicinity of the iced turbines thus ice throw risks need to
be managed and mitigated.
How: Ice protection systems can be divided to active (anti- [AI] and de-icing [DI]
systems and other systems) and passive (coatings or no action).
For active systems, anti-icing is defined as a method to prevent significant ice formation
on wind turbine blades while allowing the turbine to operate normally. De-icing is
defined as allowing ice build-up on blades followed by a shutdown of the turbine, and
then activating the ice protection system to remove ice. Other ice protection systems
include e.g. preventative shutdowns of turbines and safety related curtailment or stops.
Technology alternatives
Here is listed the available ice protection system technologies
Hot air ice protection systems have a heat source combined with a high powered
fan to circulate hot air to different areas of the blade.
Electro-thermal ice protection systems have heating elements, typically carbon
fibre, placed on the outer surface on the blade.
Microwave ice protection systems have a special outer coating on the blade
surface that heats up when exposed to microwaves created by generators inside
the blade.
Passive systems use blade coatings with special material properties to passively
(no energy required) mitigate ice induced risks.
42
Mechanical removal systems include rope access or skylift manual de-icing and
helicopter de-icing using hot liquids.
Most ice protection systems are controlled using a power curve detection method, using
dedicated ice detectors on the nacelle or blade or a combination of these (Table 8). The
power curve detection typically requires the nacelle temperature to be below 0°C, and
requires a simultaneous underperformance from the expected power curve. Dedicated
ice detectors, used for ice protection system control, are typically mounted on top of the
nacelle. Some first studies using blade ice detectors are being done in near future.
Table 12 presents different ice protection systems divided by method and technology
alternatives.
Table 12. Overview of different ice protection systems
Solution Advantage Disadvantage References
Method
Anti-
icing
(AI)
+ maximum AEP gain
+ prevents most ice from
forming
+ no turbine stops
required
- may require a lot of
power from rotating hub
- few technological
options
-
Paper: [146] [147]
Perf. [148]:
Other:
De-icing
(DI)
+ many technological
options
+ less power required
than AI
- turbine stoppage
required resulting in
AEP losses
- allowing ice build-up
may increase turbine
vibrations and noise
Paper: [146] [147]
Perf.: [148]
Other:
Technology alternatives
Hot air
(AI/DI)
+ simple, robust, long
history
+ retrofit options for
certain blade types
+ lightning risks small
- mostly DI, AI options
limited
- low efficiency: long
distance from heat
source to blade tip, and
heat has to travel through
the blade material to
reach the blade surface
Paper: [146] [147]
Perf: [149] [150]
Other: [151] [136]
[137] [152] [153]
[138] [154]
Electro-
thermal
(AI/DI)
+ optimized power
consumption: close to
blade surface and can
have spanwise heat
control
+ long track record
- additional work to
implement to blade
manufacturing process
- increased lightning risk
- expensive repairs if
damaged
Paper: [146] [147]
Perf.: [155] [156]
Other: [157] [158]
[159] [160] [161]
[162] [163] [164]
[165] [166] [167]
Microwa
ves
(AI/DI)
+ optimized power
consumption
+ wireless, repair-
friendly
- unproven in field
- difficult to implement
on the blade
-increased lightning risk
Paper: [146] [147]
Perf.:
Other: [168] [169]
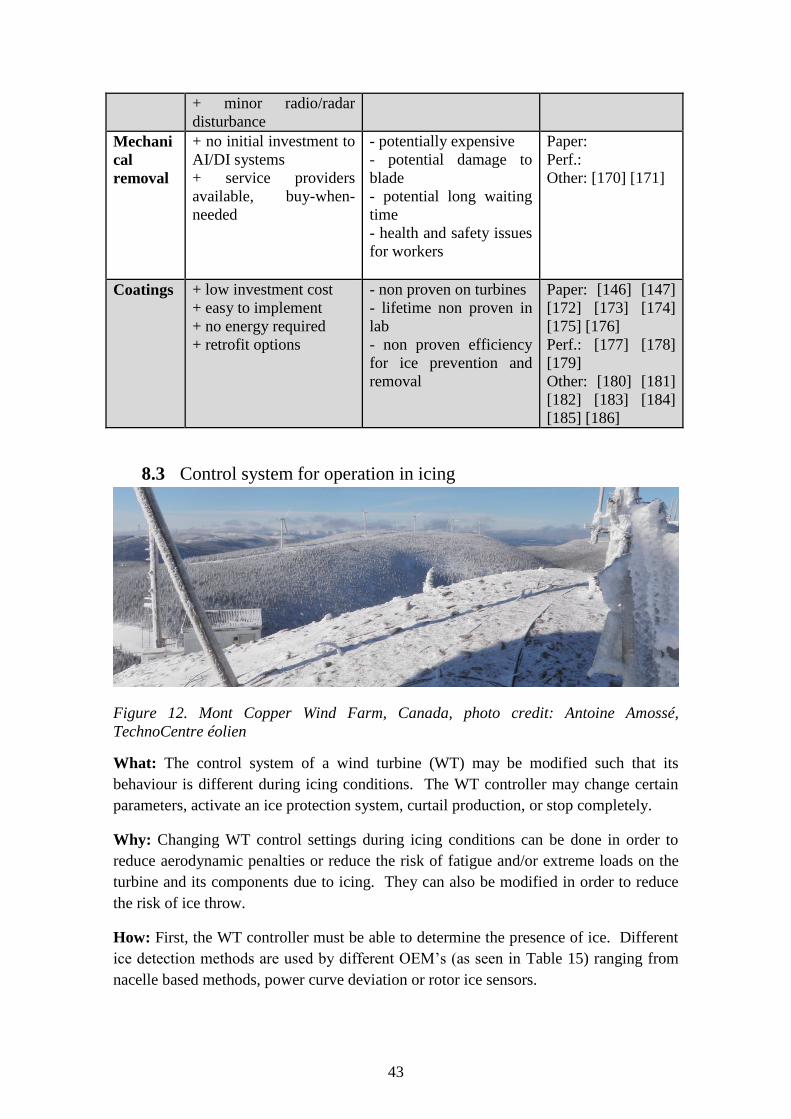
43
+ minor radio/radar
disturbance
Mechani
cal
removal
+ no initial investment to
AI/DI systems
+ service providers
available, buy-when-
needed
- potentially expensive
- potential damage to
blade
- potential long waiting
time
- health and safety issues
for workers
Paper:
Perf.:
Other: [170] [171]
Coatings + low investment cost
+ easy to implement
+ no energy required
+ retrofit options
- non proven on turbines
- lifetime non proven in
lab
- non proven efficiency
for ice prevention and
removal
Paper: [146] [147]
[172] [173] [174]
[175] [176]
Perf.: [177] [178]
[179]
Other: [180] [181]
[182] [183] [184]
[185] [186]
8.3 Control system for operation in icing
Figure 12. Mont Copper Wind Farm, Canada, photo credit: Antoine Amossé,
TechnoCentre éolien
What: The control system of a wind turbine (WT) may be modified such that its
behaviour is different during icing conditions. The WT controller may change certain
parameters, activate an ice protection system, curtail production, or stop completely.
Why: Changing WT control settings during icing conditions can be done in order to
reduce aerodynamic penalties or reduce the risk of fatigue and/or extreme loads on the
turbine and its components due to icing. They can also be modified in order to reduce
the risk of ice throw.
How: First, the WT controller must be able to determine the presence of ice. Different
ice detection methods are used by different OEM’s (as seen in Table 15) ranging from
nacelle based methods, power curve deviation or rotor ice sensors.
44
Power optimisation - Ice build-up on the rotor leads to reduced efficiency of the WT.
Changing parameters such as pitch, tip speed ratio and/or torque can reduce stall due to
icing and keep the turbine operating throughout an icing event.
Preventive stops - A preventive stop strategy consists of shutting down the WTs at the
onset of an icing event in order to minimise ice accretion on blades, which is known to
be worse when the rotor is turning, and resume production when the meteorological
event is over. The underlying principle behind preventive stops is that the WTs will
have a greater overall energy yield compared to running them throughout the icing
event. At the moment, this strategy seems to be controlled manually by the wind farm
operator.
Load reduction - The WT may also be limited in certain cases of severe icing in order to
reduce the risk of fatigue and/or extreme loads on the turbine and its components due to
icing.
Control strategy for ice protection system - All active ice protection systems provided
by OEMs require a certain level of control from the turbine. Some ice protection
systems, usually de-icing systems, will only be activated once the WT is stopped.
While some anti-icing systems may operate independently from other turbine controls
and parameters, they still may require the turbine to stop in specific, often severe icing
conditions. It is also noted that certain OEMs offer farm level power consumption
management to limit the overall consumption of the wind farm “in order to ensure net
stability and avoid unnecessary fees” [151].
Ice throw risk mitigation - Certain WTs, due to local regulations, insurance obligations
or to avoid liability, may shut down during icing events due to risks associated with ice
being projected from the rotor while it is in operation. In these cases, the WT may have
a designated operation mode for ice throw risk mitigation.
Table 13: Summary of turbine control options for operation in icing climate
Solution Specifications References
Power
optimisation Pitch and tip speed ratio adjustments to
increase power output during icing events
Paper:
Perf.: [187], [188]
Other:
Preventive
stops Stop wind turbine during meteorological
icing to get better power output after active
ice accretion is done
Paper:
Perf.: [189], [190]
Other:
Load
reduction Limit power output to ensure structural
integrity
Paper:
Perf.: [187], [191]
Other:
Control of ice
protection
system
Ice protection system control built in to
SCADA
Paper:
Perf.: [153]
Other: [131]
Ice throw
risk shutdown to reduce risk perimeter around the
WT during icing events
Paper:
Perf.: [192], [187]
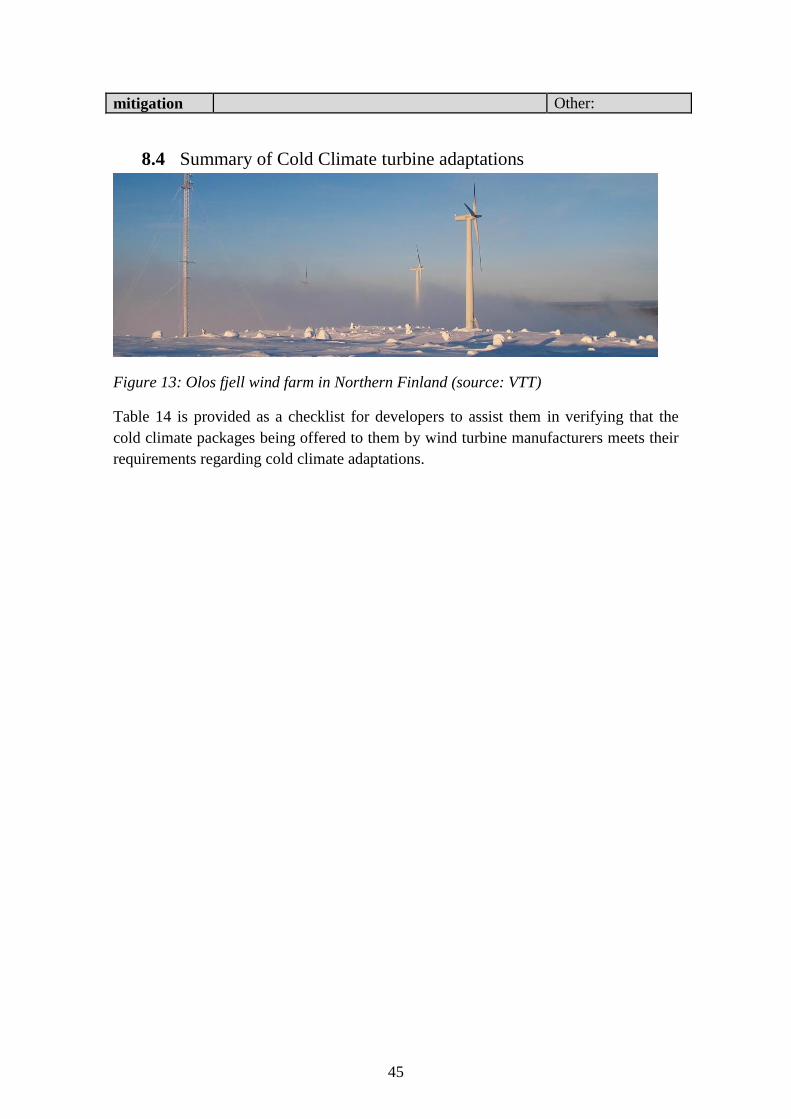
45
mitigation Other:
8.4 Summary of Cold Climate turbine adaptations
Figure 13: Olos fjell wind farm in Northern Finland (source: VTT)
Table 14 is provided as a checklist for developers to assist them in verifying that the
cold climate packages being offered to them by wind turbine manufacturers meets their
requirements regarding cold climate adaptations.
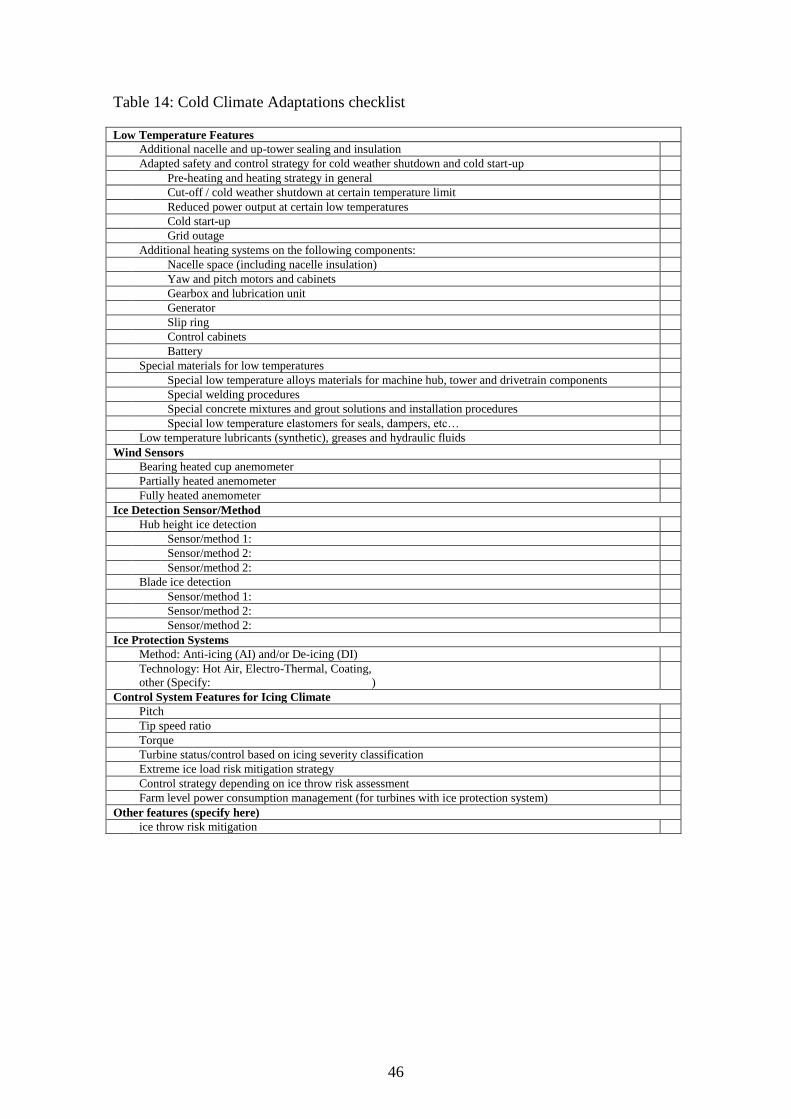
46
Table 14: Cold Climate Adaptations checklist
Low Temperature Features
Additional nacelle and up-tower sealing and insulation
Adapted safety and control strategy for cold weather shutdown and cold start-up
Pre-heating and heating strategy in general
Cut-off / cold weather shutdown at certain temperature limit
Reduced power output at certain low temperatures
Cold start-up
Grid outage
Additional heating systems on the following components:
Nacelle space (including nacelle insulation)
Yaw and pitch motors and cabinets
Gearbox and lubrication unit
Generator
Slip ring
Control cabinets
Battery
Special materials for low temperatures
Special low temperature alloys materials for machine hub, tower and drivetrain components
Special welding procedures
Special concrete mixtures and grout solutions and installation procedures
Special low temperature elastomers for seals, dampers, etc…
Low temperature lubricants (synthetic), greases and hydraulic fluids
Wind Sensors
Bearing heated cup anemometer
Partially heated anemometer
Fully heated anemometer
Ice Detection Sensor/Method
Hub height ice detection
Sensor/method 1:
Sensor/method 2:
Sensor/method 2:
Blade ice detection
Sensor/method 1:
Sensor/method 2:
Sensor/method 2:
Ice Protection Systems
Method: Anti-icing (AI) and/or De-icing (DI)
Technology: Hot Air, Electro-Thermal, Coating,
other (Specify: )
Control System Features for Icing Climate
Pitch
Tip speed ratio
Torque
Turbine status/control based on icing severity classification
Extreme ice load risk mitigation strategy
Control strategy depending on ice throw risk assessment
Farm level power consumption management (for turbines with ice protection system)
Other features (specify here)
ice throw risk mitigation

47
Table 15 summarizes all turbine manufacturers that responded a detailed questionnaire
sent by IEA WIND Task 19. Acciona, Alstom, GE, Gamesa, ENO Energy, Goldwind,
Mervento, Sinovel and Vensys did not respond the questionnaire. The table summarizes
when an original equipment manufacturer (OEM) released their first prototype, the
cumulative quantity of turbines with a low temperature climate (LTC) technologies in
megawatts, the ice detection (ID) method used and if the turbine technology has a
specific SCADA control setting during icing, also known as an ice operation mode
(IOM). The table also lists the method of ice protection system used, the year of the first
prototype installation, and the cumulative capacity of turbines with the ice protection
system, in installed MWs.
Table 15. Summary of available turbine manufacturers with cold climate solutions
Turbine
OEM
LTC ID IOM Ice Protection System References
1st
proto
MW Method 1st
proto
MW
Dongfang 2010 1000 NI +
TH +
PC
ET+HA 2014 100 Paper:
Perf:
Other: [193]
Enercon 2011 1400 PC x HA 1996 3100 Paper:
Perf: [149]
[150] [194]
[195] [196]
[197] [198]
Other: [151]
[136] [137]
[199] [200]
Lagerwey 2009 20 TH &
NI
x PS 2015 Paper:
Perf:
Other: [201]
Nordex 2009 1300 NI &
BF
x ET 2011 600 Paper:
Perf: [155]
[202] [203]
Other: [160]
[161] [204]
Northern
power
systems
1999 5 PC x BB &
IPC
1999 5 Paper:
Perf:
Other: [205]
Senvion 2007 1300 PC +
NI,
NI
x HA 2013 140 Paper:
Perf:
Other: [187]
[206] [207]
[208]
Siemens 1994 6500 NI ET 1994 800 Paper: [209]
Perf: [156]
Other: [162]
[163] [164]
[165]
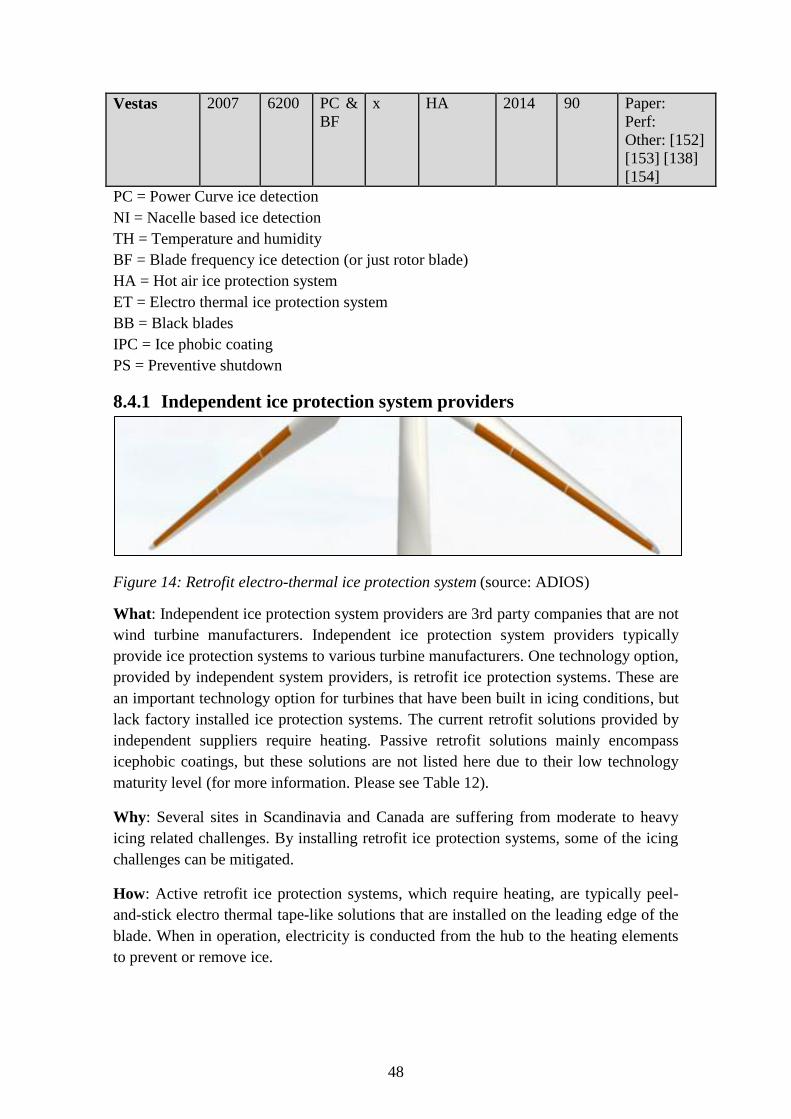
48
Vestas 2007 6200 PC &
BF
x HA 2014 90 Paper:
Perf:
Other: [152]
[153] [138]
[154]
PC = Power Curve ice detection
NI = Nacelle based ice detection
TH = Temperature and humidity
BF = Blade frequency ice detection (or just rotor blade)
HA = Hot air ice protection system
ET = Electro thermal ice protection system
BB = Black blades
IPC = Ice phobic coating
PS = Preventive shutdown
8.4.1 Independent ice protection system providers
Figure 14: Retrofit electro-thermal ice protection system (source: ADIOS)
What: Independent ice protection system providers are 3rd party companies that are not
wind turbine manufacturers. Independent ice protection system providers typically
provide ice protection systems to various turbine manufacturers. One technology option,
provided by independent system providers, is retrofit ice protection systems. These are
an important technology option for turbines that have been built in icing conditions, but
lack factory installed ice protection systems. The current retrofit solutions provided by
independent suppliers require heating. Passive retrofit solutions mainly encompass
icephobic coatings, but these solutions are not listed here due to their low technology
maturity level (for more information. Please see Table 12).
Why: Several sites in Scandinavia and Canada are suffering from moderate to heavy
icing related challenges. By installing retrofit ice protection systems, some of the icing
challenges can be mitigated.
How: Active retrofit ice protection systems, which require heating, are typically peel-
and-stick electro thermal tape-like solutions that are installed on the leading edge of the
blade. When in operation, electricity is conducted from the hub to the heating elements
to prevent or remove ice.
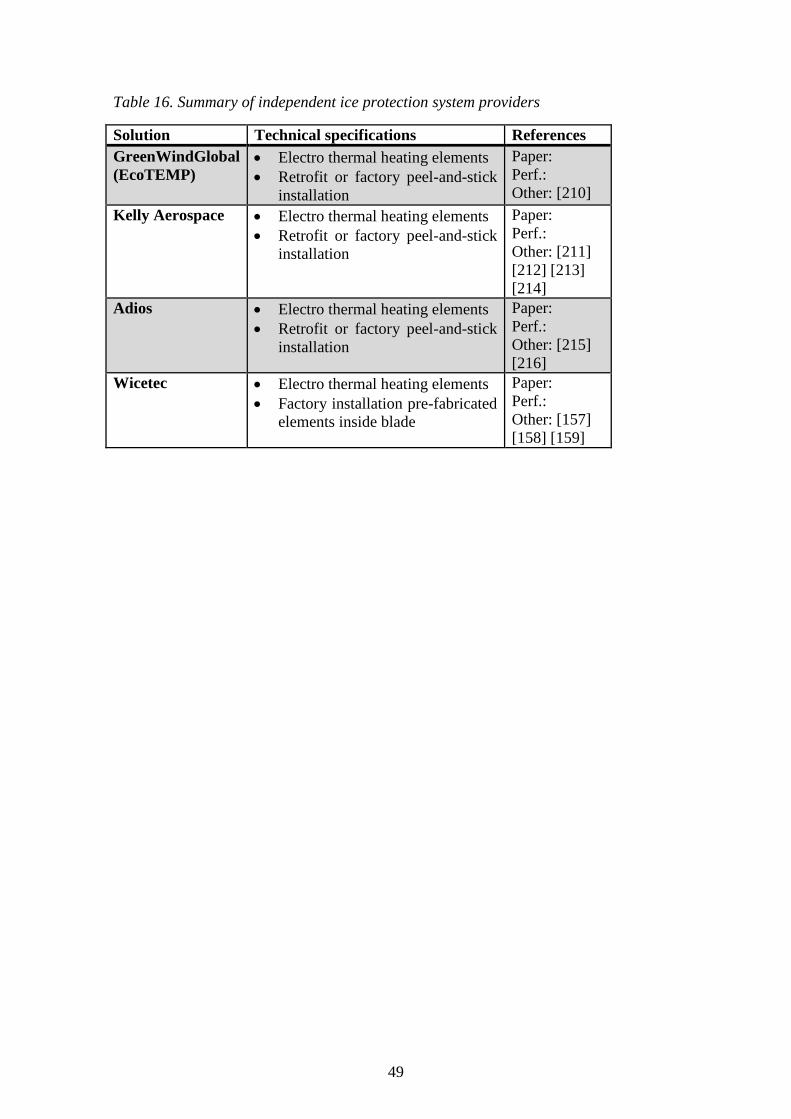
49
Table 16. Summary of independent ice protection system providers
Solution Technical specifications References
GreenWindGlobal
(EcoTEMP) Electro thermal heating elements
Retrofit or factory peel-and-stick
installation
Paper:
Perf.:
Other: [210]
Kelly Aerospace Electro thermal heating elements
Retrofit or factory peel-and-stick
installation
Paper:
Perf.:
Other: [211]
[212] [213]
[214]
Adios Electro thermal heating elements
Retrofit or factory peel-and-stick
installation
Paper:
Perf.:
Other: [215]
[216]
Wicetec Electro thermal heating elements
Factory installation pre-fabricated
elements inside blade
Paper:
Perf.:
Other: [157]
[158] [159]
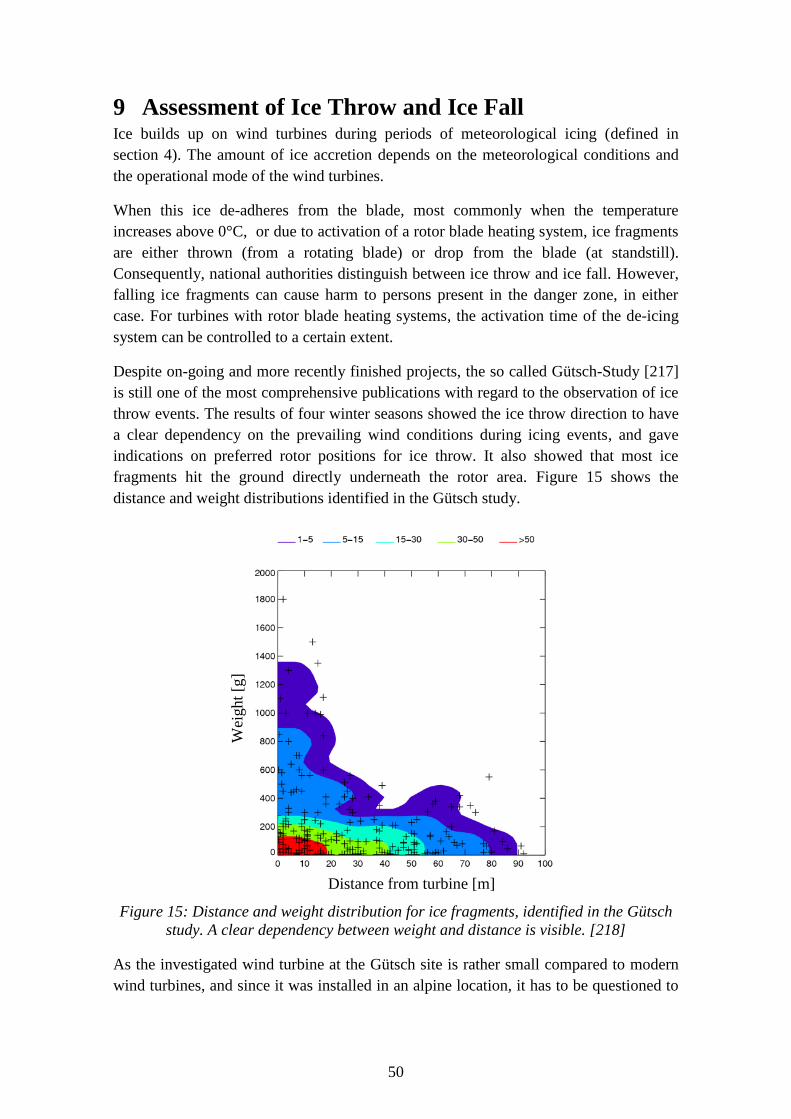
50
9 Assessment of Ice Throw and Ice Fall Ice builds up on wind turbines during periods of meteorological icing (defined in
section 4). The amount of ice accretion depends on the meteorological conditions and
the operational mode of the wind turbines.
When this ice de-adheres from the blade, most commonly when the temperature
increases above 0°C, or due to activation of a rotor blade heating system, ice fragments
are either thrown (from a rotating blade) or drop from the blade (at standstill).
Consequently, national authorities distinguish between ice throw and ice fall. However,
falling ice fragments can cause harm to persons present in the danger zone, in either
case. For turbines with rotor blade heating systems, the activation time of the de-icing
system can be controlled to a certain extent.
Despite on-going and more recently finished projects, the so called Gütsch-Study [217]
is still one of the most comprehensive publications with regard to the observation of ice
throw events. The results of four winter seasons showed the ice throw direction to have
a clear dependency on the prevailing wind conditions during icing events, and gave
indications on preferred rotor positions for ice throw. It also showed that most ice
fragments hit the ground directly underneath the rotor area. Figure 15 shows the
distance and weight distributions identified in the Gütsch study.
Figure 15: Distance and weight distribution for ice fragments, identified in the Gütsch
study. A clear dependency between weight and distance is visible. [218]
As the investigated wind turbine at the Gütsch site is rather small compared to modern
wind turbines, and since it was installed in an alpine location, it has to be questioned to
Wei
ght
[g]
Distance from turbine [m]
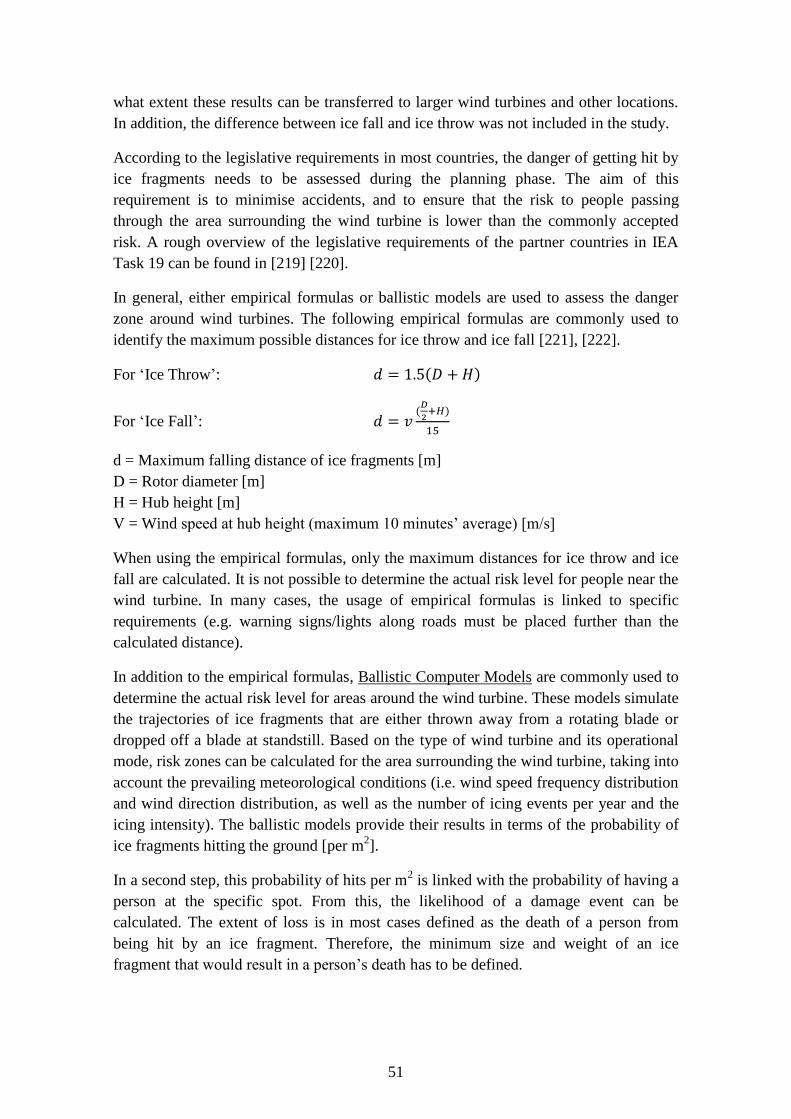
51
what extent these results can be transferred to larger wind turbines and other locations.
In addition, the difference between ice fall and ice throw was not included in the study.
According to the legislative requirements in most countries, the danger of getting hit by
ice fragments needs to be assessed during the planning phase. The aim of this
requirement is to minimise accidents, and to ensure that the risk to people passing
through the area surrounding the wind turbine is lower than the commonly accepted
risk. A rough overview of the legislative requirements of the partner countries in IEA
Task 19 can be found in [219] [220].
In general, either empirical formulas or ballistic models are used to assess the danger
zone around wind turbines. The following empirical formulas are commonly used to
identify the maximum possible distances for ice throw and ice fall [221], [222].
For ‘Ice Throw’: 𝑑 = 1.5(𝐷 + 𝐻)
For ‘Ice Fall’: 𝑑 = 𝑣(
𝐷
2+𝐻)
15
d = Maximum falling distance of ice fragments [m]
D = Rotor diameter [m]
H = Hub height [m]
V = Wind speed at hub height (maximum 10 minutes’ average) [m/s]
When using the empirical formulas, only the maximum distances for ice throw and ice
fall are calculated. It is not possible to determine the actual risk level for people near the
wind turbine. In many cases, the usage of empirical formulas is linked to specific
requirements (e.g. warning signs/lights along roads must be placed further than the
calculated distance).
In addition to the empirical formulas, Ballistic Computer Models are commonly used to
determine the actual risk level for areas around the wind turbine. These models simulate
the trajectories of ice fragments that are either thrown away from a rotating blade or
dropped off a blade at standstill. Based on the type of wind turbine and its operational
mode, risk zones can be calculated for the area surrounding the wind turbine, taking into
account the prevailing meteorological conditions (i.e. wind speed frequency distribution
and wind direction distribution, as well as the number of icing events per year and the
icing intensity). The ballistic models provide their results in terms of the probability of
ice fragments hitting the ground [per m2].
In a second step, this probability of hits per m2 is linked with the probability of having a
person at the specific spot. From this, the likelihood of a damage event can be
calculated. The extent of loss is in most cases defined as the death of a person from
being hit by an ice fragment. Therefore, the minimum size and weight of an ice
fragment that would result in a person’s death has to be defined.
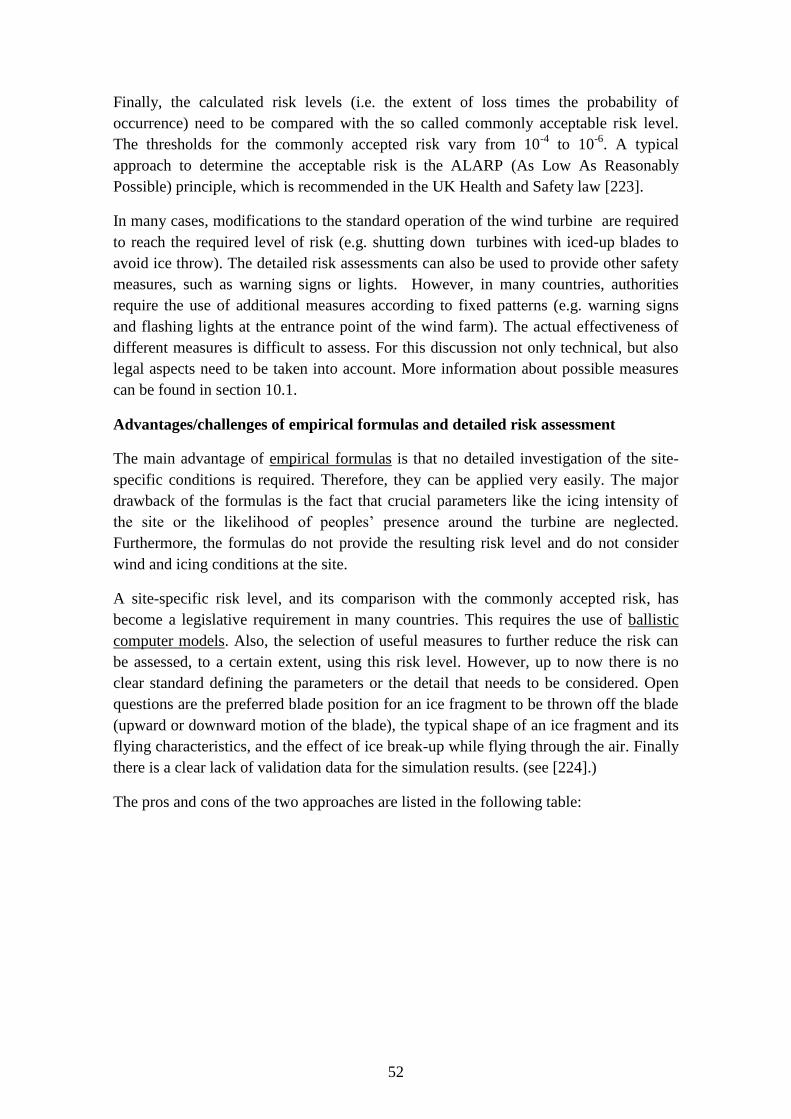
52
Finally, the calculated risk levels (i.e. the extent of loss times the probability of
occurrence) need to be compared with the so called commonly acceptable risk level.
The thresholds for the commonly accepted risk vary from 10-4
to 10-6
. A typical
approach to determine the acceptable risk is the ALARP (As Low As Reasonably
Possible) principle, which is recommended in the UK Health and Safety law [223].
In many cases, modifications to the standard operation of the wind turbine are required
to reach the required level of risk (e.g. shutting down turbines with iced-up blades to
avoid ice throw). The detailed risk assessments can also be used to provide other safety
measures, such as warning signs or lights. However, in many countries, authorities
require the use of additional measures according to fixed patterns (e.g. warning signs
and flashing lights at the entrance point of the wind farm). The actual effectiveness of
different measures is difficult to assess. For this discussion not only technical, but also
legal aspects need to be taken into account. More information about possible measures
can be found in section 10.1.
Advantages/challenges of empirical formulas and detailed risk assessment
The main advantage of empirical formulas is that no detailed investigation of the site-
specific conditions is required. Therefore, they can be applied very easily. The major
drawback of the formulas is the fact that crucial parameters like the icing intensity of
the site or the likelihood of peoples’ presence around the turbine are neglected.
Furthermore, the formulas do not provide the resulting risk level and do not consider
wind and icing conditions at the site.
A site-specific risk level, and its comparison with the commonly accepted risk, has
become a legislative requirement in many countries. This requires the use of ballistic
computer models. Also, the selection of useful measures to further reduce the risk can
be assessed, to a certain extent, using this risk level. However, up to now there is no
clear standard defining the parameters or the detail that needs to be considered. Open
questions are the preferred blade position for an ice fragment to be thrown off the blade
(upward or downward motion of the blade), the typical shape of an ice fragment and its
flying characteristics, and the effect of ice break-up while flying through the air. Finally
there is a clear lack of validation data for the simulation results. (see [224].)
The pros and cons of the two approaches are listed in the following table:
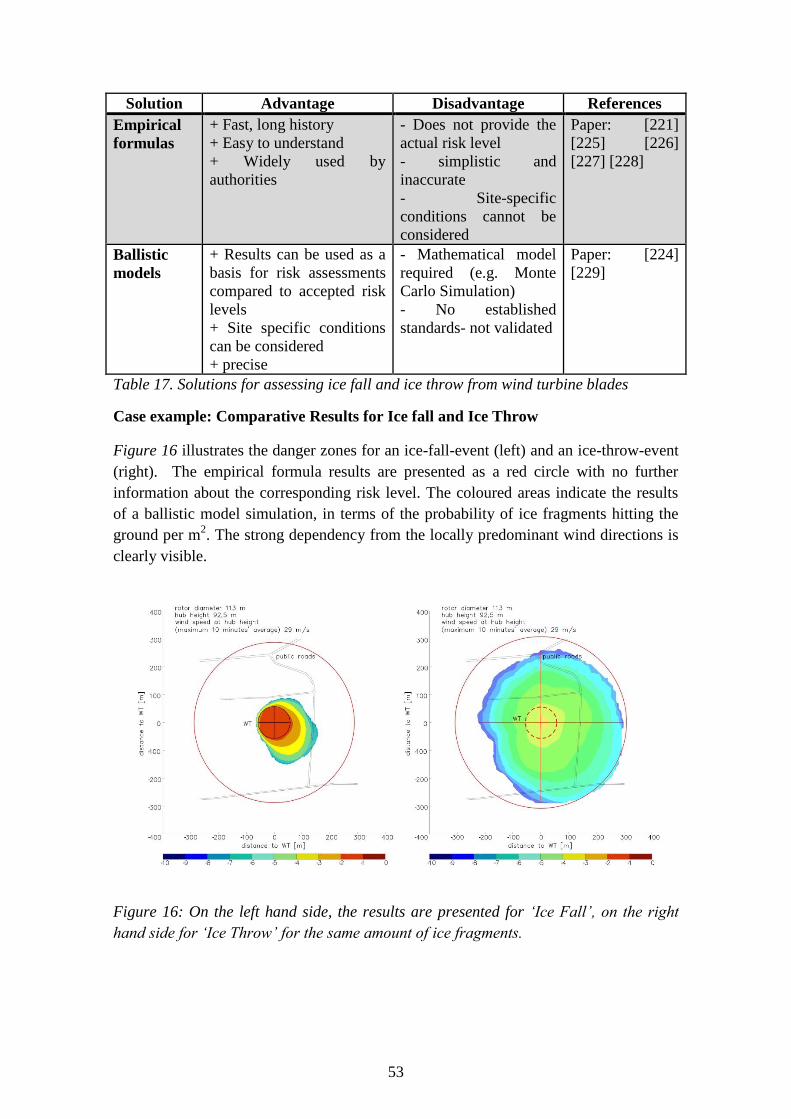
53
Solution Advantage Disadvantage References
Empirical
formulas
+ Fast, long history
+ Easy to understand
+ Widely used by
authorities
- Does not provide the
actual risk level
- simplistic and
inaccurate
- Site-specific
conditions cannot be
considered
Paper: [221]
[225] [226]
[227] [228]
Ballistic
models
+ Results can be used as a
basis for risk assessments
compared to accepted risk
levels
+ Site specific conditions
can be considered
+ precise
- Mathematical model
required (e.g. Monte
Carlo Simulation)
- No established
standards- not validated
Paper: [224]
[229]
Table 17. Solutions for assessing ice fall and ice throw from wind turbine blades
Case example: Comparative Results for Ice fall and Ice Throw
Figure 16 illustrates the danger zones for an ice-fall-event (left) and an ice-throw-event
(right). The empirical formula results are presented as a red circle with no further
information about the corresponding risk level. The coloured areas indicate the results
of a ballistic model simulation, in terms of the probability of ice fragments hitting the
ground per m2. The strong dependency from the locally predominant wind directions is
clearly visible.
Figure 16: On the left hand side, the results are presented for ‘Ice Fall’, on the right
hand side for ‘Ice Throw’ for the same amount of ice fragments.
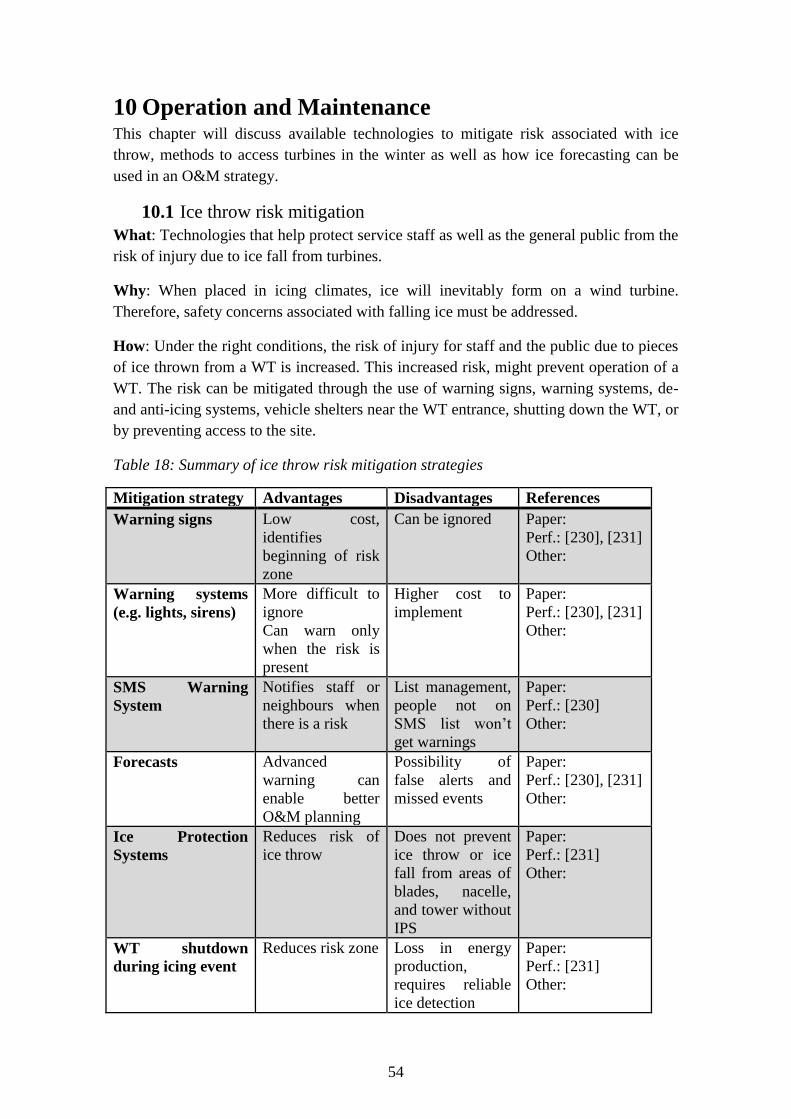
54
10 Operation and Maintenance This chapter will discuss available technologies to mitigate risk associated with ice
throw, methods to access turbines in the winter as well as how ice forecasting can be
used in an O&M strategy.
10.1 Ice throw risk mitigation
What: Technologies that help protect service staff as well as the general public from the
risk of injury due to ice fall from turbines.
Why: When placed in icing climates, ice will inevitably form on a wind turbine.
Therefore, safety concerns associated with falling ice must be addressed.
How: Under the right conditions, the risk of injury for staff and the public due to pieces
of ice thrown from a WT is increased. This increased risk, might prevent operation of a
WT. The risk can be mitigated through the use of warning signs, warning systems, de-
and anti-icing systems, vehicle shelters near the WT entrance, shutting down the WT, or
by preventing access to the site.
Table 18: Summary of ice throw risk mitigation strategies
Mitigation strategy Advantages Disadvantages References
Warning signs Low cost,
identifies
beginning of risk
zone
Can be ignored
Paper:
Perf.: [230], [231]
Other:
Warning systems
(e.g. lights, sirens)
More difficult to
ignore
Can warn only
when the risk is
present
Higher cost to
implement
Paper:
Perf.: [230], [231]
Other:
SMS Warning
System
Notifies staff or
neighbours when
there is a risk
List management,
people not on
SMS list won’t
get warnings
Paper:
Perf.: [230]
Other:
Forecasts Advanced
warning can
enable better
O&M planning
Possibility of
false alerts and
missed events
Paper:
Perf.: [230], [231]
Other:
Ice Protection
Systems
Reduces risk of
ice throw
Does not prevent
ice throw or ice
fall from areas of
blades, nacelle,
and tower without
IPS
Paper:
Perf.: [231]
Other:
WT shutdown
during icing event
Reduces risk zone Loss in energy
production,
requires reliable
ice detection
Paper:
Perf.: [231]
Other:
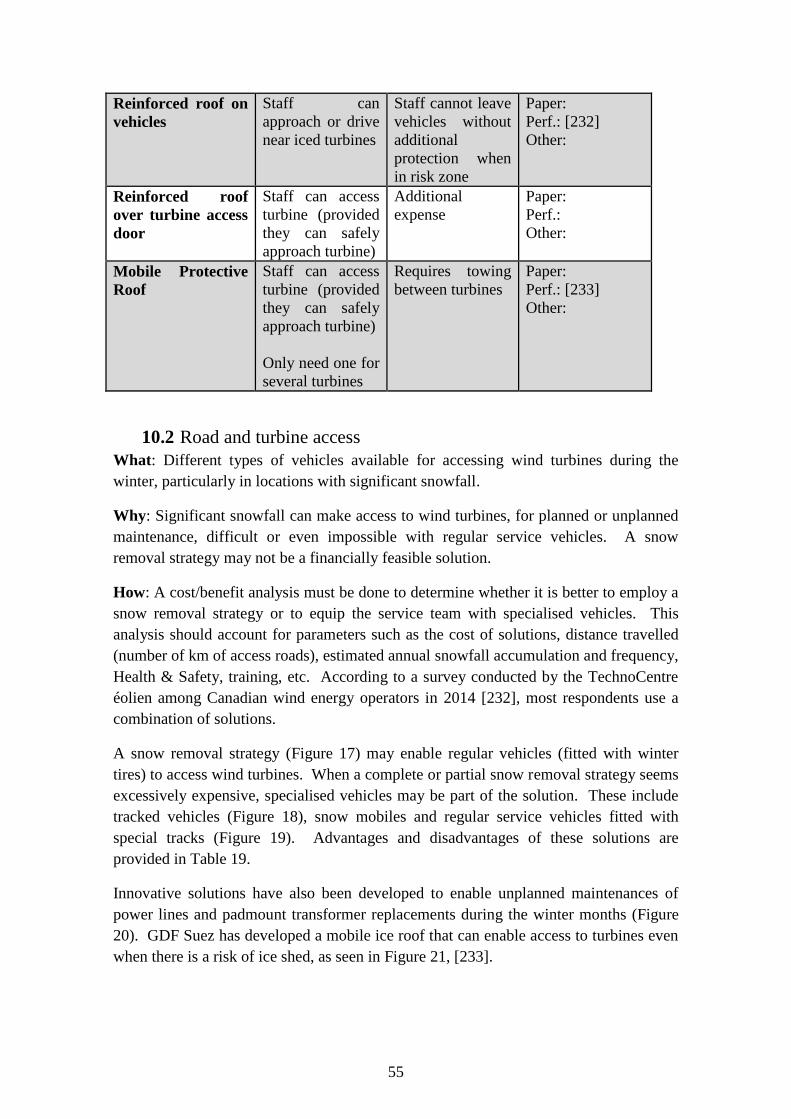
55
Reinforced roof on
vehicles
Staff can
approach or drive
near iced turbines
Staff cannot leave
vehicles without
additional
protection when
in risk zone
Paper:
Perf.: [232]
Other:
Reinforced roof
over turbine access
door
Staff can access
turbine (provided
they can safely
approach turbine)
Additional
expense
Paper:
Perf.:
Other:
Mobile Protective
Roof
Staff can access
turbine (provided
they can safely
approach turbine)
Only need one for
several turbines
Requires towing
between turbines
Paper:
Perf.: [233]
Other:
10.2 Road and turbine access
What: Different types of vehicles available for accessing wind turbines during the
winter, particularly in locations with significant snowfall.
Why: Significant snowfall can make access to wind turbines, for planned or unplanned
maintenance, difficult or even impossible with regular service vehicles. A snow
removal strategy may not be a financially feasible solution.
How: A cost/benefit analysis must be done to determine whether it is better to employ a
snow removal strategy or to equip the service team with specialised vehicles. This
analysis should account for parameters such as the cost of solutions, distance travelled
(number of km of access roads), estimated annual snowfall accumulation and frequency,
Health & Safety, training, etc. According to a survey conducted by the TechnoCentre
éolien among Canadian wind energy operators in 2014 [232], most respondents use a
combination of solutions.
A snow removal strategy (Figure 17) may enable regular vehicles (fitted with winter
tires) to access wind turbines. When a complete or partial snow removal strategy seems
excessively expensive, specialised vehicles may be part of the solution. These include
tracked vehicles (Figure 18), snow mobiles and regular service vehicles fitted with
special tracks (Figure 19). Advantages and disadvantages of these solutions are
provided in Table 19.
Innovative solutions have also been developed to enable unplanned maintenances of
power lines and padmount transformer replacements during the winter months (Figure
20). GDF Suez has developed a mobile ice roof that can enable access to turbines even
when there is a risk of ice shed, as seen in Figure 21, [233].
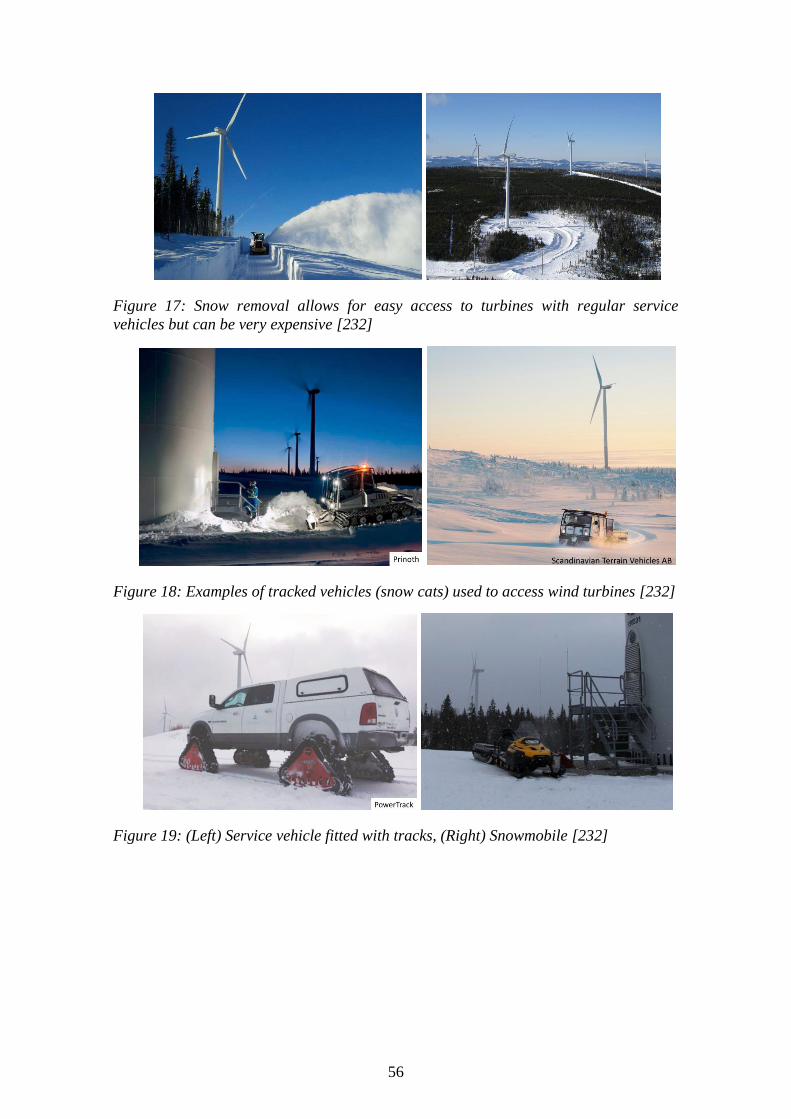
56
Figure 17: Snow removal allows for easy access to turbines with regular service
vehicles but can be very expensive [232]
Figure 18: Examples of tracked vehicles (snow cats) used to access wind turbines [232]
Figure 19: (Left) Service vehicle fitted with tracks, (Right) Snowmobile [232]
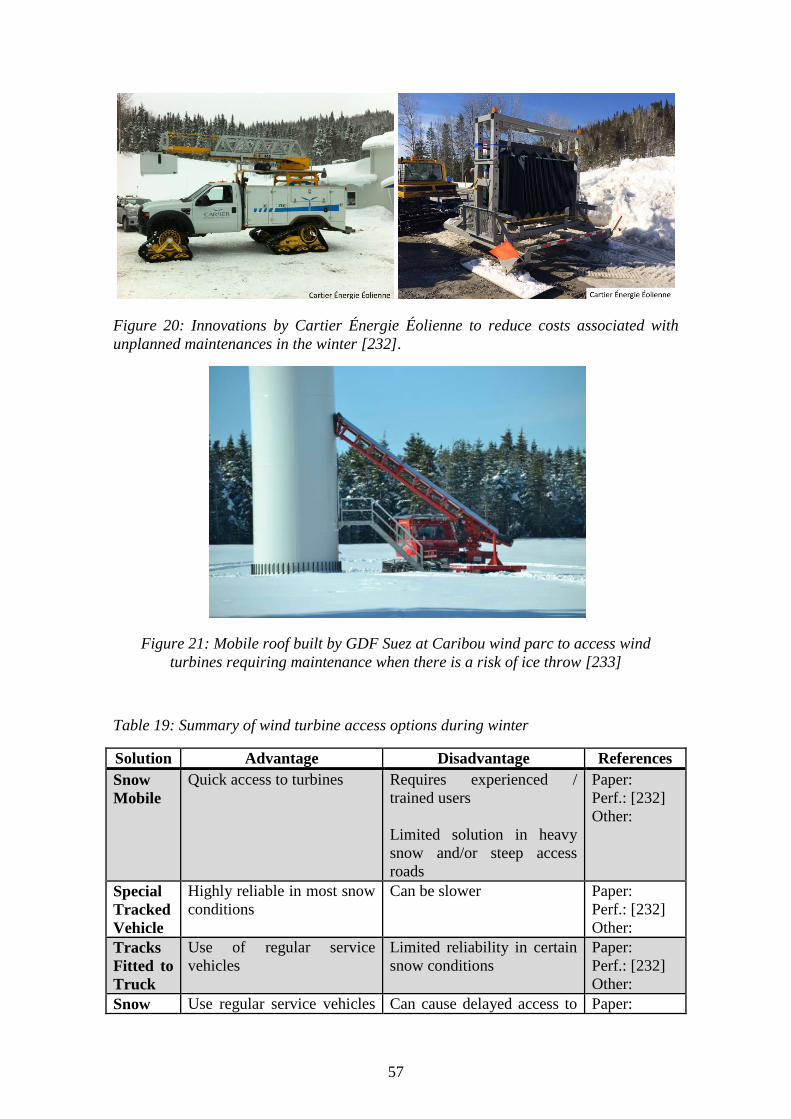
57
Figure 20: Innovations by Cartier Énergie Éolienne to reduce costs associated with
unplanned maintenances in the winter [232].
Figure 21: Mobile roof built by GDF Suez at Caribou wind parc to access wind
turbines requiring maintenance when there is a risk of ice throw [233]
Table 19: Summary of wind turbine access options during winter
Solution Advantage Disadvantage References
Snow
Mobile
Quick access to turbines Requires experienced /
trained users
Limited solution in heavy
snow and/or steep access
roads
Paper:
Perf.: [232]
Other:
Special
Tracked
Vehicle
Highly reliable in most snow
conditions
Can be slower
Paper:
Perf.: [232]
Other:
Tracks
Fitted to
Truck
Use of regular service
vehicles
Limited reliability in certain
snow conditions
Paper:
Perf.: [232]
Other:
Snow Use regular service vehicles Can cause delayed access to Paper:
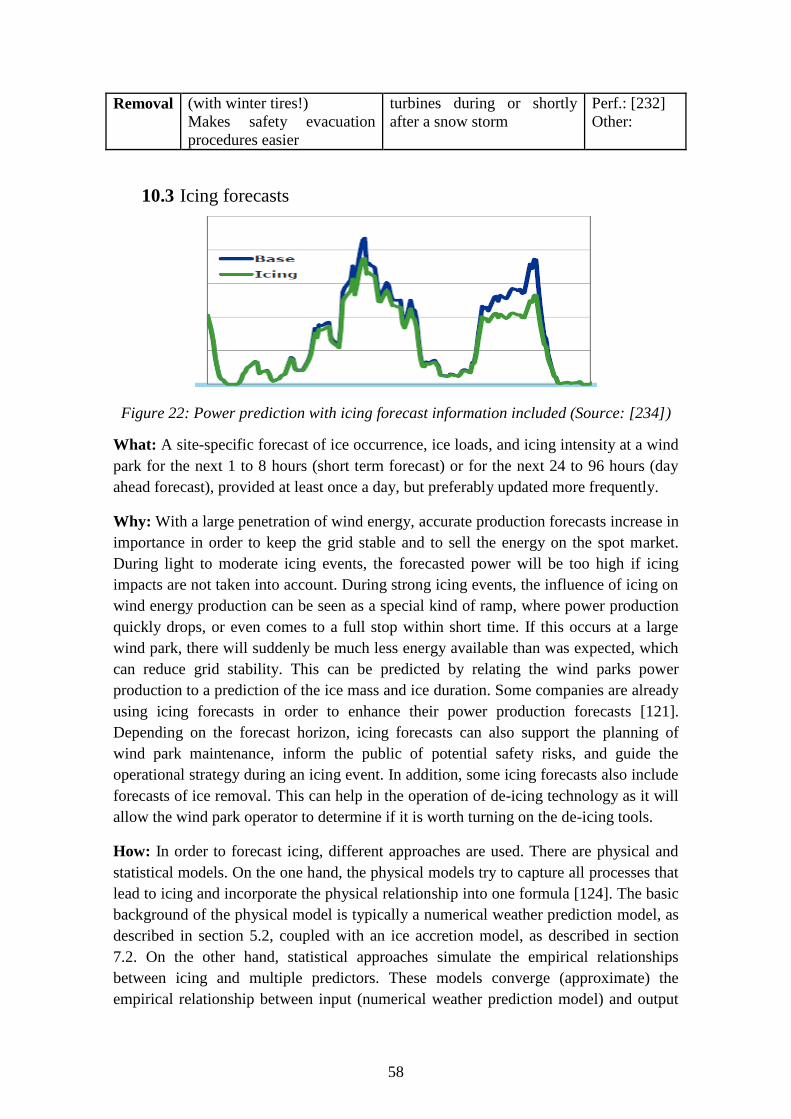
58
Removal (with winter tires!)
Makes safety evacuation
procedures easier
turbines during or shortly
after a snow storm
Perf.: [232]
Other:
10.3 Icing forecasts
Figure 22: Power prediction with icing forecast information included (Source: [234])
What: A site-specific forecast of ice occurrence, ice loads, and icing intensity at a wind
park for the next 1 to 8 hours (short term forecast) or for the next 24 to 96 hours (day
ahead forecast), provided at least once a day, but preferably updated more frequently.
Why: With a large penetration of wind energy, accurate production forecasts increase in
importance in order to keep the grid stable and to sell the energy on the spot market.
During light to moderate icing events, the forecasted power will be too high if icing
impacts are not taken into account. During strong icing events, the influence of icing on
wind energy production can be seen as a special kind of ramp, where power production
quickly drops, or even comes to a full stop within short time. If this occurs at a large
wind park, there will suddenly be much less energy available than was expected, which
can reduce grid stability. This can be predicted by relating the wind parks power
production to a prediction of the ice mass and ice duration. Some companies are already
using icing forecasts in order to enhance their power production forecasts [121].
Depending on the forecast horizon, icing forecasts can also support the planning of
wind park maintenance, inform the public of potential safety risks, and guide the
operational strategy during an icing event. In addition, some icing forecasts also include
forecasts of ice removal. This can help in the operation of de-icing technology as it will
allow the wind park operator to determine if it is worth turning on the de-icing tools.
How: In order to forecast icing, different approaches are used. There are physical and
statistical models. On the one hand, the physical models try to capture all processes that
lead to icing and incorporate the physical relationship into one formula [124]. The basic
background of the physical model is typically a numerical weather prediction model, as
described in section 5.2, coupled with an ice accretion model, as described in section
7.2. On the other hand, statistical approaches simulate the empirical relationships
between icing and multiple predictors. These models converge (approximate) the
empirical relationship between input (numerical weather prediction model) and output
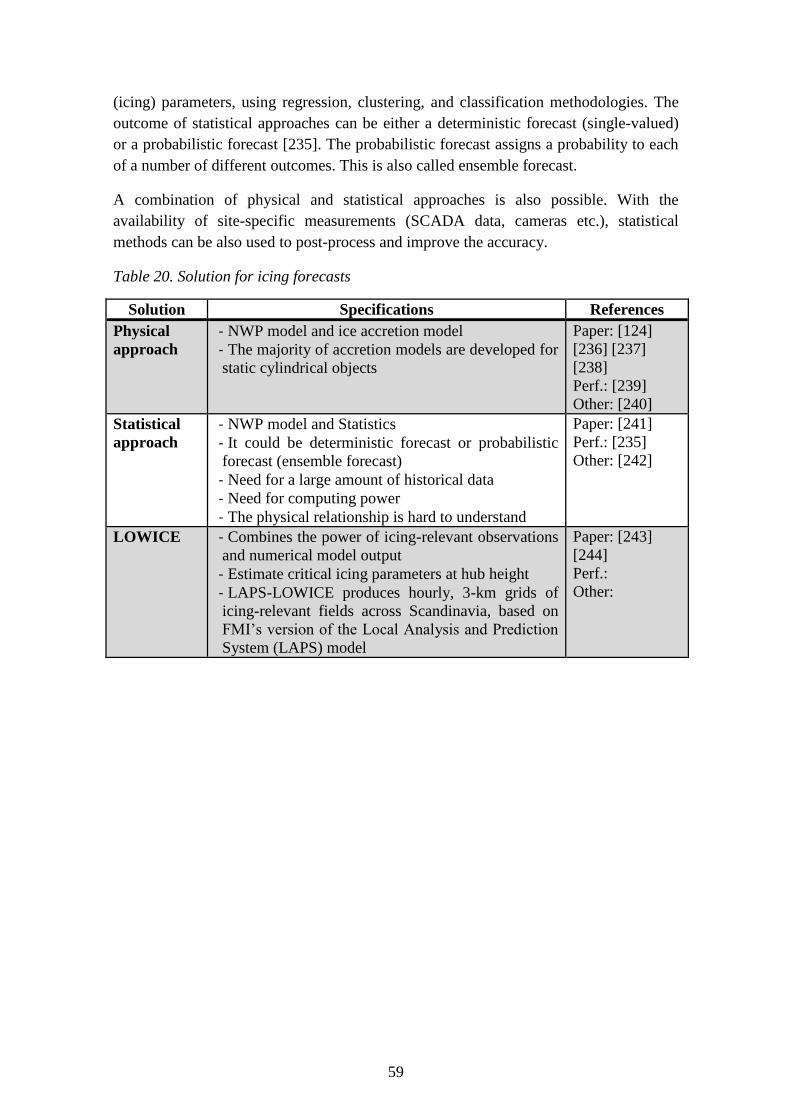
59
(icing) parameters, using regression, clustering, and classification methodologies. The
outcome of statistical approaches can be either a deterministic forecast (single-valued)
or a probabilistic forecast [235]. The probabilistic forecast assigns a probability to each
of a number of different outcomes. This is also called ensemble forecast.
A combination of physical and statistical approaches is also possible. With the
availability of site-specific measurements (SCADA data, cameras etc.), statistical
methods can be also used to post-process and improve the accuracy.
Table 20. Solution for icing forecasts
Solution Specifications References
Physical
approach
- NWP model and ice accretion model
- The majority of accretion models are developed for
static cylindrical objects
Paper: [124]
[236] [237]
[238]
Perf.: [239]
Other: [240]
Statistical
approach
- NWP model and Statistics
- It could be deterministic forecast or probabilistic
forecast (ensemble forecast)
- Need for a large amount of historical data
- Need for computing power
- The physical relationship is hard to understand
Paper: [241]
Perf.: [235]
Other: [242]
LOWICE - Combines the power of icing-relevant observations
and numerical model output
- Estimate critical icing parameters at hub height
- LAPS-LOWICE produces hourly, 3-km grids of
icing-relevant fields across Scandinavia, based on
FMI’s version of the Local Analysis and Prediction
System (LAPS) model
Paper: [243]
[244]
Perf.:
Other:
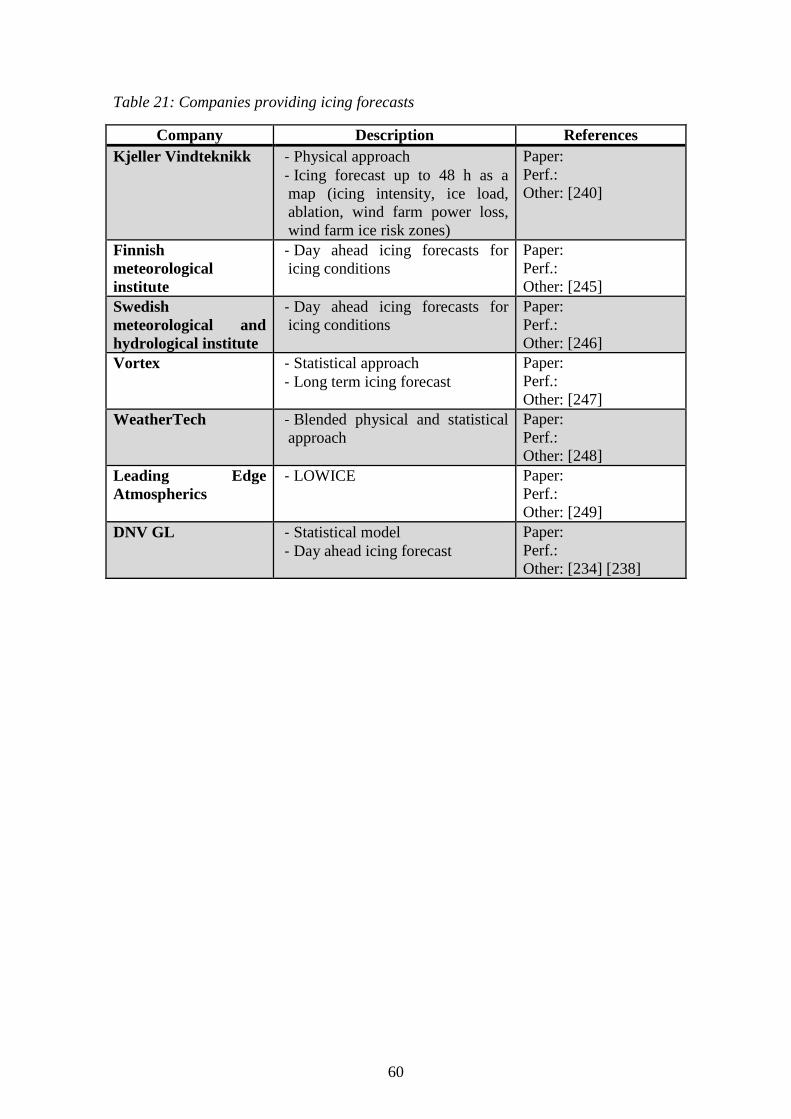
60
Table 21: Companies providing icing forecasts
Company Description References
Kjeller Vindteknikk - Physical approach
- Icing forecast up to 48 h as a
map (icing intensity, ice load,
ablation, wind farm power loss,
wind farm ice risk zones)
Paper:
Perf.:
Other: [240]
Finnish
meteorological
institute
- Day ahead icing forecasts for
icing conditions
Paper:
Perf.:
Other: [245]
Swedish
meteorological and
hydrological institute
- Day ahead icing forecasts for
icing conditions
Paper:
Perf.:
Other: [246]
Vortex - Statistical approach
- Long term icing forecast
Paper:
Perf.:
Other: [247]
WeatherTech - Blended physical and statistical
approach
Paper:
Perf.:
Other: [248]
Leading Edge
Atmospherics
- LOWICE Paper:
Perf.:
Other: [249]
DNV GL - Statistical model
- Day ahead icing forecast
Paper:
Perf.:
Other: [234] [238]
61
11 Standards and Certification What: Standards and certification processes in wind energy are used to ensure safety
and performance of wind turbines and other technological equipment. International
standards are needed to ensure minimum design and safety requirements for wind
turbines and other technological products, to serve as fair, best practice guidelines, and
to ensure sufficient quality of the design for funding sources, such as banks.
Independent certification bodies ensure that the product specifications provided by the
original equipment manufacturers meet the expected performance. On a general level,
the current maturity level for most relevant international standards and certification
processes is low, with regard to specific cold climate wind challenges. However, issues
related to cold climate challenges are being investigated for inclusion through an
updating process of some international standards and certification that is currently on-
going.
Why: Certifying wind turbines for cold climate regions requires reliable procedures for
predicting the amount of ice accretion during standstill and operation. Low temperature
climates may require the installation of cold climate versions that include special
components, materials, lubricants, etc. Iced turbine operation may cause additional
wear-and-tear of components and reduced production (operational and standstill related)
thus specific, iced turbine load cases are important.
How: Some international design standards and certification guidelines take cold climate
effects into account by having lower temperature requirements than standard climate
turbines, and possibly taking icing load cases into consideration. To date, no specific
cold climate wind standard exists, and, for certification, only the Germanischer Lloyd
(GL), today known as DNV GL, guideline for low temperatures is available.
IEC 61400-1 ed4 “Wind turbines – Part 1: Design requirements” is currently under
revision and is an update to the ed3:2005 (amended 2010) standard [3]. This standard
covers the structural integrity of a wind turbine design. The new revision will include
many cold climate related updates, e.g. new iced turbine design load cases and a cold
climate turbine class.
IEC 61400-3 ed1 [250] “Wind turbines - Part 3: Design requirements for offshore
turbines” from 2005 took into account sea ice load effects on fixed and floating
foundations in a very general manner. The latest IEC 61400-3-1:2015 is in a Committee
Draft for fixed offshore foundations and has more extensive sea ice assessment
requirements.
GL Technical Note 067 rev4 [251] includes supplementary information to previous GL
Technical Notes [252] and [253], this includes various assessments and indicators for
low temperature sites and the requirements for wind turbines operating in these regions.
62
A GL Technical Note on Blade Icing is currently under preparation, and it will be an
extension to IEC 61400-1 ed4 regarding the assessment of blade icing impacts on
turbine structural integrity
ISO 12494:2001 [49] describes the general principles of determining ice load on
structures for applications such as met masts, towers, antennas etc. This standard has
defined different ice types and ice severity classes, but it is not widely used in wind
energy.
The GL guideline for certification of wind turbines [253], which extends and refines the
minimum requirements from IEC 61400-1 ed3, includes some iced turbine design load
cases in the form of blade ice mass only.
SAE International has published its own standard AIR5666 “Icing Wind Tunnel
Interfacility Comparison Tests” [254]. The objective of the testing activity was to
establish a benchmark that compared ice shapes produced by icing wind tunnels
available for use by the aviation industry and to use that benchmark as a basis for
dialogue between facility owners to improve the state-of-the-art of icing wind tunnel
technology. However, this standard is for aviation industry and cannot as such be
translated to wind energy applications.
Following national standards have some cold climate related details:
Canadian national standard CSA-S37-01 “Antennas, Towers, and Antenna-
Supporting Structures” includes a design load case for met masts assuming
40mm of ice covering the met mast with a simultaneous gust of 57 m/s [255].
German national standard DIBt “Directive for Wind Turbines Effects and
stability analyses for towers and foundations” [256] has an iced turbine design
load case, which is similar to the GL certification guideline. The German
guideline assumes an ice mass imbalance on the turbine rotor for 7 days per year
when assessing fatigue load.
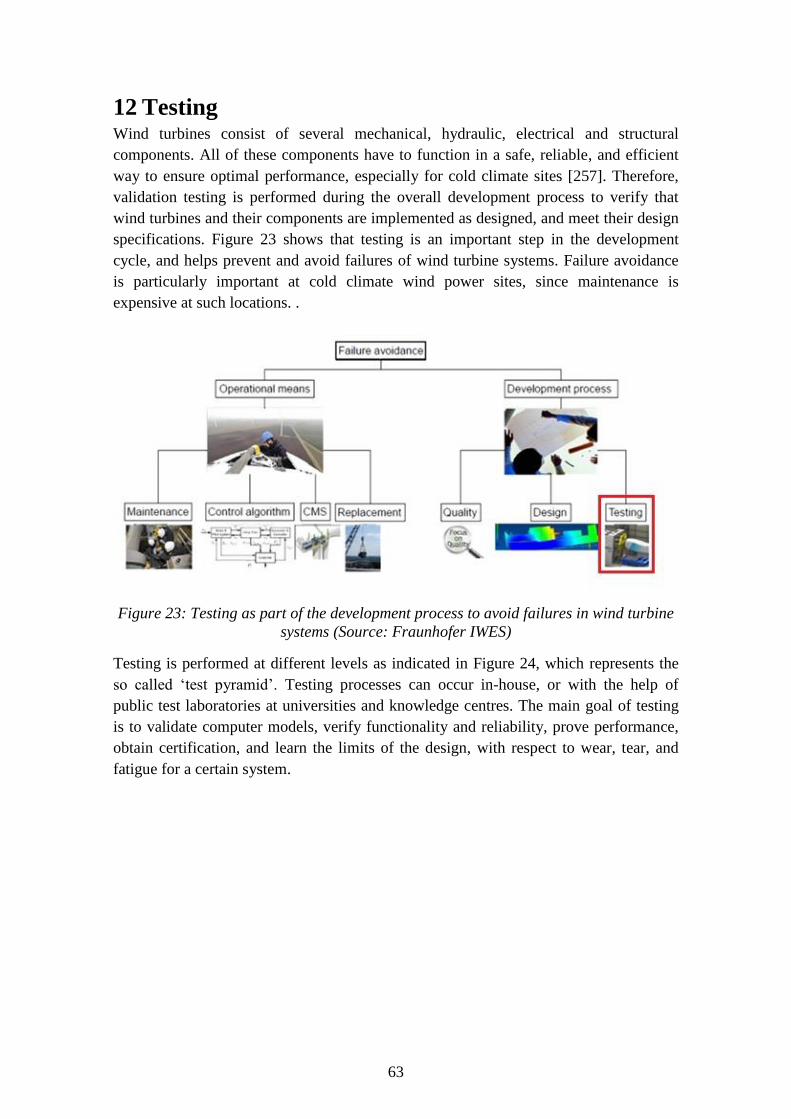
63
12 Testing Wind turbines consist of several mechanical, hydraulic, electrical and structural
components. All of these components have to function in a safe, reliable, and efficient
way to ensure optimal performance, especially for cold climate sites [257]. Therefore,
validation testing is performed during the overall development process to verify that
wind turbines and their components are implemented as designed, and meet their design
specifications. Figure 23 shows that testing is an important step in the development
cycle, and helps prevent and avoid failures of wind turbine systems. Failure avoidance
is particularly important at cold climate wind power sites, since maintenance is
expensive at such locations. .
Figure 23: Testing as part of the development process to avoid failures in wind turbine
systems (Source: Fraunhofer IWES)
Testing is performed at different levels as indicated in Figure 24, which represents the
so called ‘test pyramid’. Testing processes can occur in-house, or with the help of
public test laboratories at universities and knowledge centres. The main goal of testing
is to validate computer models, verify functionality and reliability, prove performance,
obtain certification, and learn the limits of the design, with respect to wear, tear, and
fatigue for a certain system.
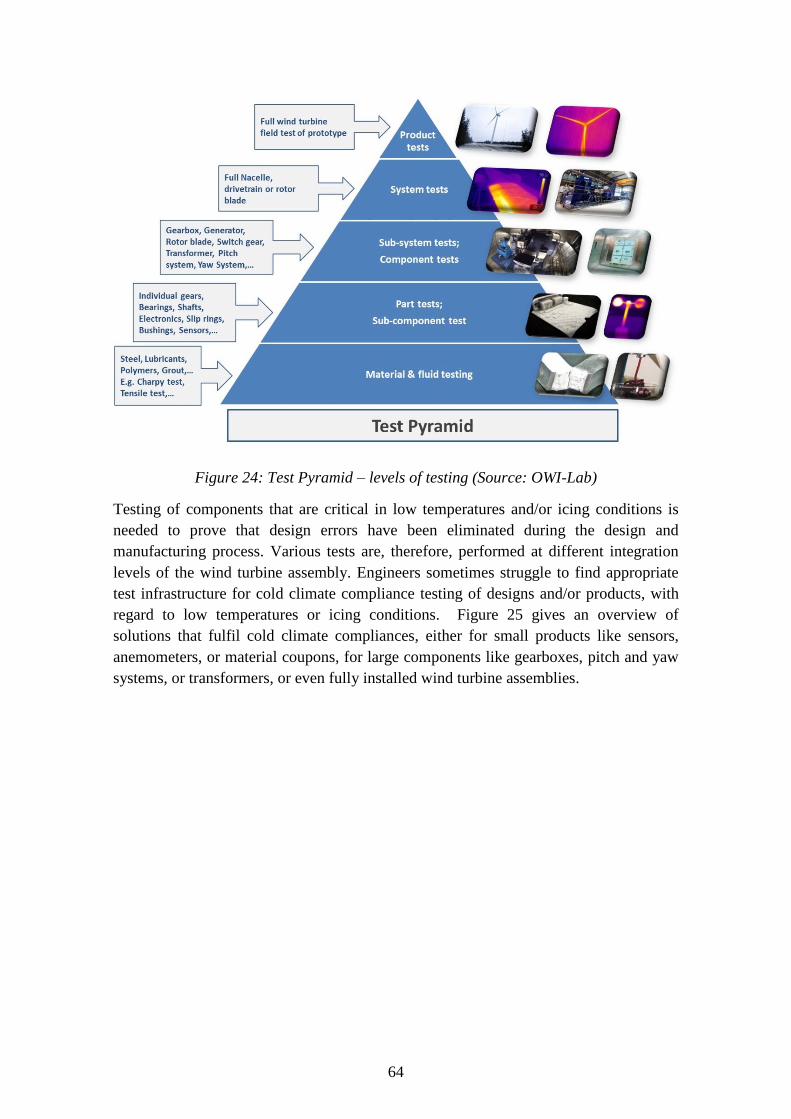
64
Figure 24: Test Pyramid – levels of testing (Source: OWI-Lab)
Testing of components that are critical in low temperatures and/or icing conditions is
needed to prove that design errors have been eliminated during the design and
manufacturing process. Various tests are, therefore, performed at different integration
levels of the wind turbine assembly. Engineers sometimes struggle to find appropriate
test infrastructure for cold climate compliance testing of designs and/or products, with
regard to low temperatures or icing conditions. Figure 25 gives an overview of
solutions that fulfil cold climate compliances, either for small products like sensors,
anemometers, or material coupons, for large components like gearboxes, pitch and yaw
systems, or transformers, or even fully installed wind turbine assemblies.
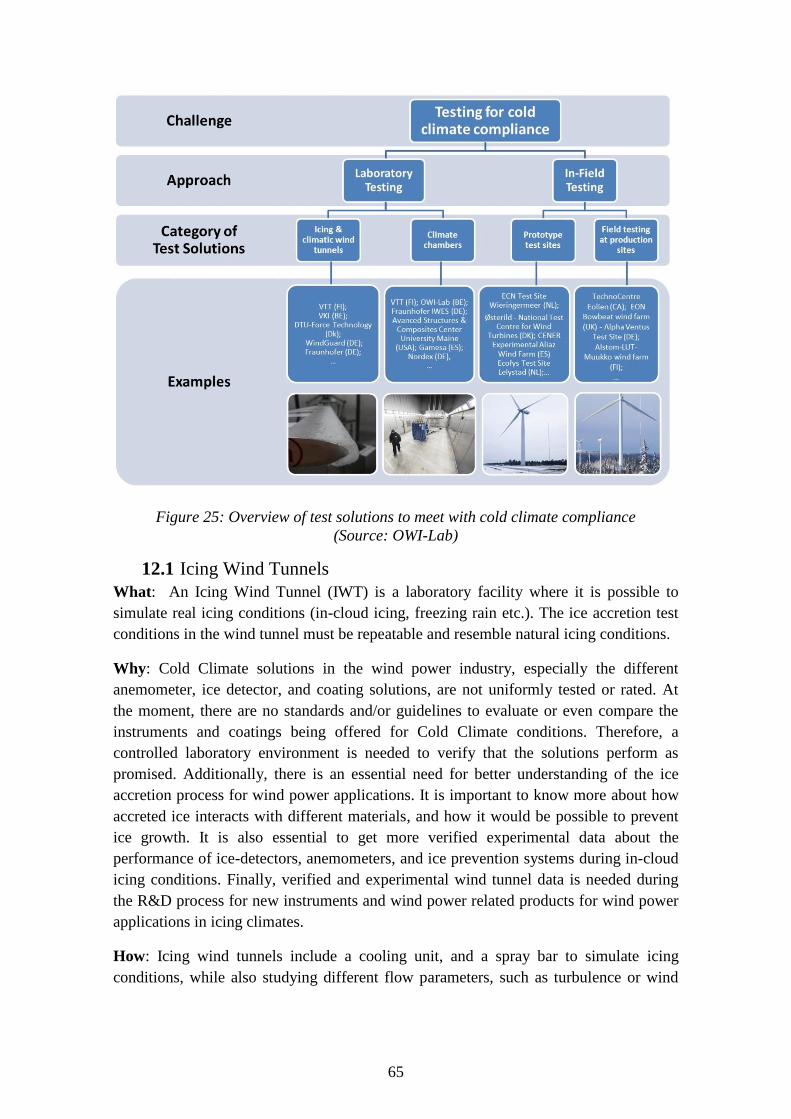
65
Figure 25: Overview of test solutions to meet with cold climate compliance
(Source: OWI-Lab)
12.1 Icing Wind Tunnels
What: An Icing Wind Tunnel (IWT) is a laboratory facility where it is possible to
simulate real icing conditions (in-cloud icing, freezing rain etc.). The ice accretion test
conditions in the wind tunnel must be repeatable and resemble natural icing conditions.
Why: Cold Climate solutions in the wind power industry, especially the different
anemometer, ice detector, and coating solutions, are not uniformly tested or rated. At
the moment, there are no standards and/or guidelines to evaluate or even compare the
instruments and coatings being offered for Cold Climate conditions. Therefore, a
controlled laboratory environment is needed to verify that the solutions perform as
promised. Additionally, there is an essential need for better understanding of the ice
accretion process for wind power applications. It is important to know more about how
accreted ice interacts with different materials, and how it would be possible to prevent
ice growth. It is also essential to get more verified experimental data about the
performance of ice-detectors, anemometers, and ice prevention systems during in-cloud
icing conditions. Finally, verified and experimental wind tunnel data is needed during
the R&D process for new instruments and wind power related products for wind power
applications in icing climates.
How: Icing wind tunnels include a cooling unit, and a spray bar to simulate icing
conditions, while also studying different flow parameters, such as turbulence or wind
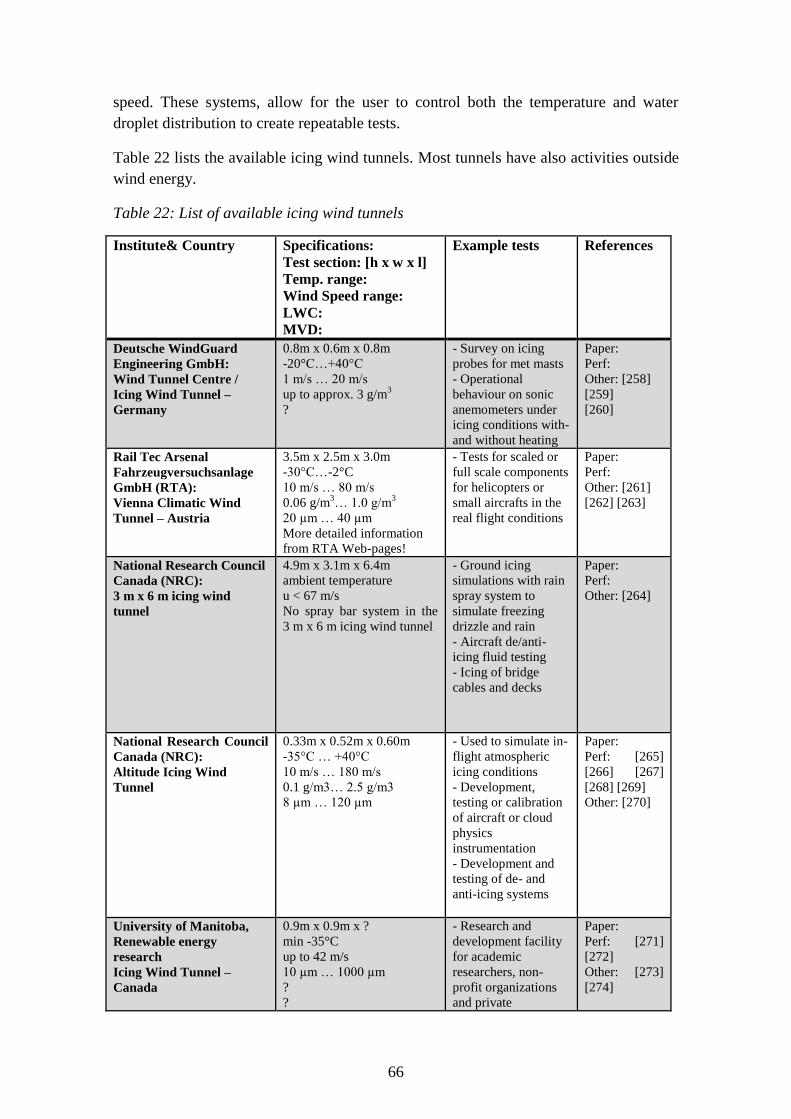
66
speed. These systems, allow for the user to control both the temperature and water
droplet distribution to create repeatable tests.
Table 22 lists the available icing wind tunnels. Most tunnels have also activities outside
wind energy.
Table 22: List of available icing wind tunnels
Institute& Country Specifications:
Test section: [h x w x l]
Temp. range:
Wind Speed range:
LWC:
MVD:
Example tests References
Deutsche WindGuard
Engineering GmbH:
Wind Tunnel Centre /
Icing Wind Tunnel –
Germany
0.8m x 0.6m x 0.8m
-20°C…+40°C
1 m/s … 20 m/s
up to approx. 3 g/m3
?
- Survey on icing
probes for met masts
- Operational
behaviour on sonic
anemometers under
icing conditions with-
and without heating
Paper:
Perf:
Other: [258]
[259]
[260]
Rail Tec Arsenal
Fahrzeugversuchsanlage
GmbH (RTA):
Vienna Climatic Wind
Tunnel – Austria
3.5m x 2.5m x 3.0m
-30°C…-2°C
10 m/s … 80 m/s
0.06 g/m3… 1.0 g/m
3
20 µm … 40 µm
More detailed information
from RTA Web-pages!
- Tests for scaled or
full scale components
for helicopters or
small aircrafts in the
real flight conditions
Paper:
Perf:
Other: [261]
[262] [263]
National Research Council
Canada (NRC):
3 m x 6 m icing wind
tunnel
4.9m x 3.1m x 6.4m
ambient temperature
u < 67 m/s
No spray bar system in the
3 m x 6 m icing wind tunnel
- Ground icing
simulations with rain
spray system to
simulate freezing
drizzle and rain
- Aircraft de/anti-
icing fluid testing
- Icing of bridge
cables and decks
Paper:
Perf:
Other: [264]
National Research Council
Canada (NRC):
Altitude Icing Wind
Tunnel
0.33m x 0.52m x 0.60m
-35°C … +40°C
10 m/s … 180 m/s
0.1 g/m3… 2.5 g/m3
8 µm … 120 µm
- Used to simulate in-
flight atmospheric
icing conditions
- Development,
testing or calibration
of aircraft or cloud
physics
instrumentation
- Development and
testing of de- and
anti-icing systems
Paper:
Perf: [265]
[266] [267]
[268] [269]
Other: [270]
University of Manitoba,
Renewable energy
research
Icing Wind Tunnel –
Canada
0.9m x 0.9m x ?
min -35°C
up to 42 m/s
10 µm … 1000 µm
?
?
- Research and
development facility
for academic
researchers, non-
profit organizations
and private
Paper:
Perf: [271]
[272]
Other: [273]
[274]
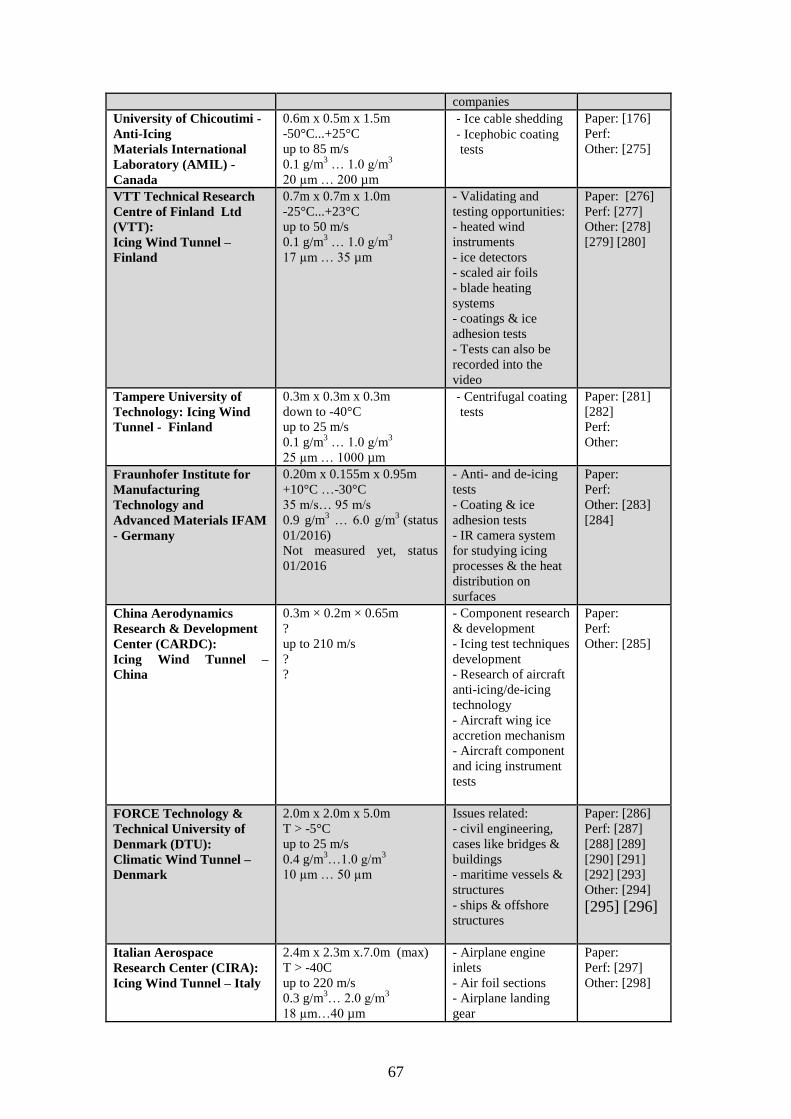
67
companies
University of Chicoutimi -
Anti-Icing
Materials International
Laboratory (AMIL) -
Canada
0.6m x 0.5m x 1.5m
-50°C...+25°C
up to 85 m/s
0.1 g/m3 … 1.0 g/m
3
20 µm … 200 µm
- Ice cable shedding
- Icephobic coating
tests
Paper: [176]
Perf:
Other: [275]
VTT Technical Research
Centre of Finland Ltd
(VTT):
Icing Wind Tunnel –
Finland
0.7m x 0.7m x 1.0m
-25°C...+23°C
up to 50 m/s
0.1 g/m3 … 1.0 g/m
3
17 µm … 35 µm
- Validating and
testing opportunities:
- heated wind
instruments
- ice detectors
- scaled air foils
- blade heating
systems
- coatings & ice
adhesion tests
- Tests can also be
recorded into the
video
Paper: [276]
Perf: [277]
Other: [278]
[279] [280]
Tampere University of
Technology: Icing Wind
Tunnel - Finland
0.3m x 0.3m x 0.3m
down to -40°C
up to 25 m/s
0.1 g/m3 … 1.0 g/m
3
25 µm … 1000 µm
- Centrifugal coating
tests
Paper: [281]
[282]
Perf:
Other:
Fraunhofer Institute for
Manufacturing
Technology and
Advanced Materials IFAM
- Germany
0.20m x 0.155m x 0.95m
+10°C …-30°C
35 m/s… 95 m/s
0.9 g/m3 … 6.0 g/m
3 (status
01/2016)
Not measured yet, status
01/2016
- Anti- and de-icing
tests
- Coating & ice
adhesion tests
- IR camera system
for studying icing
processes & the heat
distribution on
surfaces
Paper:
Perf:
Other: [283]
[284]
China Aerodynamics
Research & Development
Center (CARDC):
Icing Wind Tunnel –
China
0.3m × 0.2m × 0.65m
?
up to 210 m/s
?
?
- Component research
& development
- Icing test techniques
development
- Research of aircraft
anti-icing/de-icing
technology
- Aircraft wing ice
accretion mechanism
- Aircraft component
and icing instrument
tests
Paper:
Perf:
Other: [285]
FORCE Technology &
Technical University of
Denmark (DTU):
Climatic Wind Tunnel –
Denmark
2.0m x 2.0m x 5.0m
T > -5°C
up to 25 m/s
0.4 g/m3…1.0 g/m
3
10 µm … 50 µm
Issues related:
- civil engineering,
cases like bridges &
buildings
- maritime vessels &
structures
- ships & offshore
structures
Paper: [286]
Perf: [287]
[288] [289]
[290] [291]
[292] [293]
Other: [294]
[295] [296]
Italian Aerospace
Research Center (CIRA):
Icing Wind Tunnel – Italy
2.4m x 2.3m x.7.0m (max)
T > -40C
up to 220 m/s
0.3 g/m3… 2.0 g/m
3
18 µm…40 µm
- Airplane engine
inlets
- Air foil sections
- Airplane landing
gear
Paper:
Perf: [297]
Other: [298]
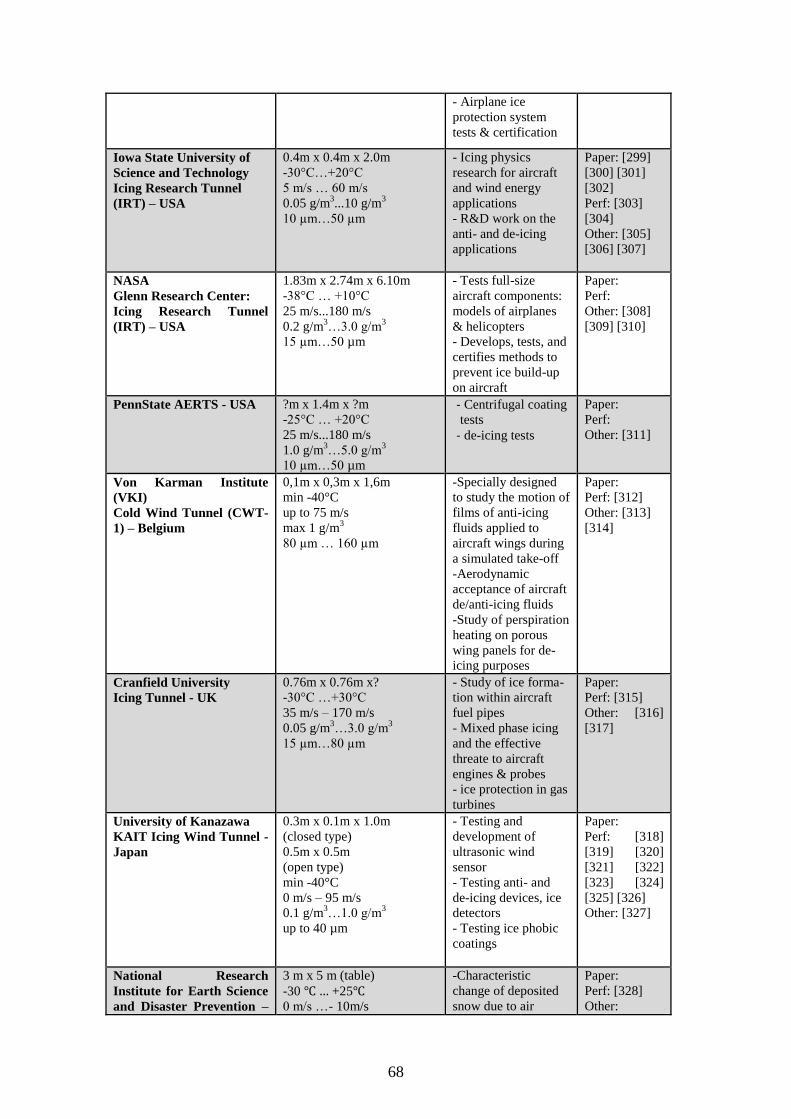
68
- Airplane ice
protection system
tests & certification
Iowa State University of
Science and Technology
Icing Research Tunnel
(IRT) – USA
0.4m x 0.4m x 2.0m
-30°C…+20°C
5 m/s … 60 m/s
0.05 g/m3...10 g/m
3
10 µm…50 µm
- Icing physics
research for aircraft
and wind energy
applications
- R&D work on the
anti- and de-icing
applications
Paper: [299]
[300] [301]
[302]
Perf: [303]
[304]
Other: [305]
[306] [307]
NASA
Glenn Research Center:
Icing Research Tunnel
(IRT) – USA
1.83m x 2.74m x 6.10m
-38°C … +10°C
25 m/s...180 m/s
0.2 g/m3…3.0 g/m
3
15 µm…50 µm
- Tests full-size
aircraft components:
models of airplanes
& helicopters
- Develops, tests, and
certifies methods to
prevent ice build-up
on aircraft
Paper:
Perf:
Other: [308]
[309] [310]
PennState AERTS - USA ?m x 1.4m x ?m
-25°C … +20°C
25 m/s...180 m/s
1.0 g/m3…5.0 g/m
3
10 µm…50 µm
- Centrifugal coating
tests
- de-icing tests
Paper:
Perf:
Other: [311]
Von Karman Institute
(VKI)
Cold Wind Tunnel (CWT-
1) – Belgium
0,1m x 0,3m x 1,6m
min -40°C
up to 75 m/s
max 1 g/m3
80 µm … 160 µm
-Specially designed
to study the motion of
films of anti-icing
fluids applied to
aircraft wings during
a simulated take-off
-Aerodynamic
acceptance of aircraft
de/anti-icing fluids
-Study of perspiration
heating on porous
wing panels for de-
icing purposes
Paper:
Perf: [312]
Other: [313]
[314]
Cranfield University
Icing Tunnel - UK
0.76m x 0.76m x?
-30°C …+30°C
35 m/s – 170 m/s
0.05 g/m3…3.0 g/m
3
15 µm…80 µm
- Study of ice forma-
tion within aircraft
fuel pipes
- Mixed phase icing
and the effective
threate to aircraft
engines & probes
- ice protection in gas
turbines
Paper:
Perf: [315]
Other: [316]
[317]
University of Kanazawa
KAIT Icing Wind Tunnel -
Japan
0.3m x 0.1m x 1.0m
(closed type)
0.5m x 0.5m
(open type)
min -40°C
0 m/s – 95 m/s
0.1 g/m3…1.0 g/m
3
up to 40 µm
- Testing and
development of
ultrasonic wind
sensor
- Testing anti- and
de-icing devices, ice
detectors
- Testing ice phobic
coatings
Paper:
Perf: [318]
[319] [320]
[321] [322]
[323] [324]
[325] [326]
Other: [327]
National Research
Institute for Earth Science
and Disaster Prevention –
3 m x 5 m (table)
-30 ℃ … +25℃ 0 m/s …- 10m/s
-Characteristic
change of deposited
snow due to air
Paper:
Perf: [328]
Other:

69
Snow and Ice Research
Center –
Cryospheric Environment
Simulator(CES) - Japan
?
?
temperature and solar
radiation
- Mechanism of
drifting snow blown
off by wind
- Movement of
deposited snow on a
slope and mechanism
of snow avalanche
generation
- Deposition of snow
on/around a building
under windy
conditions
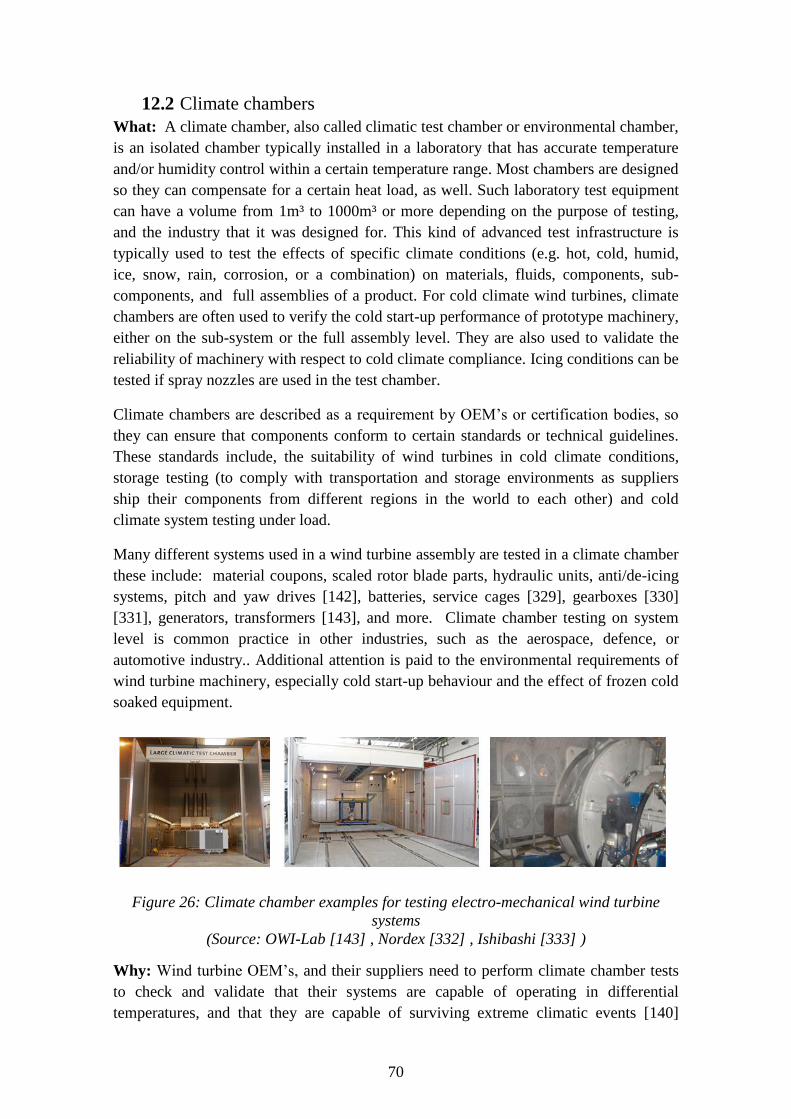
70
12.2 Climate chambers
What: A climate chamber, also called climatic test chamber or environmental chamber,
is an isolated chamber typically installed in a laboratory that has accurate temperature
and/or humidity control within a certain temperature range. Most chambers are designed
so they can compensate for a certain heat load, as well. Such laboratory test equipment
can have a volume from 1m³ to 1000m³ or more depending on the purpose of testing,
and the industry that it was designed for. This kind of advanced test infrastructure is
typically used to test the effects of specific climate conditions (e.g. hot, cold, humid,
ice, snow, rain, corrosion, or a combination) on materials, fluids, components, sub-
components, and full assemblies of a product. For cold climate wind turbines, climate
chambers are often used to verify the cold start-up performance of prototype machinery,
either on the sub-system or the full assembly level. They are also used to validate the
reliability of machinery with respect to cold climate compliance. Icing conditions can be
tested if spray nozzles are used in the test chamber.
Climate chambers are described as a requirement by OEM’s or certification bodies, so
they can ensure that components conform to certain standards or technical guidelines.
These standards include, the suitability of wind turbines in cold climate conditions,
storage testing (to comply with transportation and storage environments as suppliers
ship their components from different regions in the world to each other) and cold
climate system testing under load.
Many different systems used in a wind turbine assembly are tested in a climate chamber
these include: material coupons, scaled rotor blade parts, hydraulic units, anti/de-icing
systems, pitch and yaw drives [142], batteries, service cages [329], gearboxes [330]
[331], generators, transformers [143], and more. Climate chamber testing on system
level is common practice in other industries, such as the aerospace, defence, or
automotive industry.. Additional attention is paid to the environmental requirements of
wind turbine machinery, especially cold start-up behaviour and the effect of frozen cold
soaked equipment.
Figure 26: Climate chamber examples for testing electro-mechanical wind turbine
systems
(Source: OWI-Lab [143] , Nordex [332] , Ishibashi [333] )
Why: Wind turbine OEM’s, and their suppliers need to perform climate chamber tests
to check and validate that their systems are capable of operating in differential
temperatures, and that they are capable of surviving extreme climatic events [140]
71
[257]. Products intended for cold climate sites need additional testing in low
temperatures during the product development cycle, since materials tend to become
brittle and lubricants become thicker in such climatic conditions. Climate chamber
testing helps to identify of potential failures caused by extreme temperatures (e.g.
differential thermal expansion problems, brittle materials and potential cracks, highly
viscous oils and associated additional load on pumping equipment, etc.) early in the
development phase. Laboratory testing is essential to the delivery of robust and reliable
products.
When compared to field tests, laboratory tests in a controlled climatic test chamber
allows for the reproduction of certain climatic conditions, without waiting nature to
provide them. In-field testing is typically more expensive and more time-consuming
than climate chamber testing.
How: Certain wind turbine machinery (e.g. the full nacelle, drivetrain gearbox,
transformer, pitch system assembly, etc.) is placed inside a climate chamber that is set
to specific climatic conditions, and is tested for serval days or even weeks depending
on the test requirements and validation methodology. When a storage test is performed,
no additional test auxiliaries are needed except for the measurement devices that
monitor certain climatic and/or machinery parameters. The required temperature and/or
humidity is set based on requirements provided by the customer or on industry
standards. Depending on the type of machinery and the test standard, temperature and
humidity cycles can also be programmed.
When performing functional system testing in a climate chamber, for example, a cold
start-up test of a gearbox [144] or wind turbine transformer [143], additional testing
infrastructure needs to be included to simulate the real life scenario. Examples of these
additional infrastructure needs are electrical load, rotation and torque, etc.
Advantage
Having a climate chamber, or having access to public laboratories with environmental
test infrastructure, is beneficial for a fast design verification of wind turbine prototypes.
These structures help companies gain insight to the performance and reliability of their
systems during cold events early in the development cycle. In comparison with in-field
testing, laboratory testing is less time consuming, since one does not have to wait for
nature to provide cold snap events, which can take a year or longer. Climate chamber
testing can also be a valuable alternative to simulation modelling, which is time-
consuming, complex, and requires relevant real life data.
Challenge
Depending on the dimensions, temperature and humidity test ranges, weight
requirements, etc., climate chambers are quite expensive when system, nacelle, or
turbine testing is required. Also, climate chamber testing is relatively infrequent
compared to end-of-line testing. Climate chambers also need to be specifically designed
72
for wind turbine applications, since they require additional mechanical and/or electrical
test infrastructure for system testing, and their components tend to be much larger and
heavier than e.g. automotive components. Therefore, publicly assessable climate
chambers designed for the automotive industry cannot be used by the wind industry.
Zarges is a component supplier (service cages and wind turbine lifts) and has
tested a new cold climate version wind turbine lift down to -40°C in a climate
chamber in order to meet customer requirements [329].
Fraunhofer IWES has developed a special offshore test chamber that is able to
simultaneously simulate and test mechanical and environmental loads at the
material level. This climate chamber focusses on small material testing and
can cool down to -30°C [334]. The facility is publicly available for testing and
R&D projects.
OWI-Lab houses one of the largest climatic test chambers (10.6m x 7m x 8m)
in Europe, and has been set-up to test large size and large weight machinery
like gearboxes [144] [331], transformers [143], pitch & yaw systems,
generators, converters, switch gears, etc. The facility is mainly used for cold
start-up testing for cold climate compliance [140]. The test chamber is unique
in that it has the ability to cool down to -60°C, and has a high cooling power
to compensate for heat loads. The facility is publicly available for testing and
R&D projects.
Ishibashi, a wind turbine gearbox supplier, has set-up its own climatic test
chamber that can cool down to -40°C. This chamber is mainly used to inspect
the lubrication system of a speed-up gear under cold conditions. Cold-weather
tests are also performed in this climate chamber to formulate extreme start-up
events [333].
VTT has climate chambers for material testing, in particular building materials
as concrete and grout [335]. The concrete materials laboratory has several
climate chambers that can cool down to -196°C.
Nordex has invested in its in-house climate chamber in order to submit certain
wind turbine parts (slip rings, pitch systems) and components to extreme
climatic endurance testing. The climate chamber can test in a range of -40°C
to +60°C [332].
Gamesa has built its own in-house climate chamber to evaluate the
performance of wind turbines and their components when exposed to extreme
conditions (temperatures ranging from -35ºC to +35ºC) prior to installation.
The climate chamber was used to test a 4.5MW machine that is used in the
Simo wind farm in the north of Finland [336].
73
The Offshore Wind Laboratory of the Advanced Structures and composites
centre at the University of Maine houses an environmental test chamber which
can be used to test structures in extreme climatic conditions. The main purpose
is to perform fatigue testing within the climate chamber. The climate chamber
has large dimensions (6.8m x 6.8m x6.1m) and can cool down to -40°C [337].
12.3 Prototype test sites
What: Wind turbine manufacturers install full prototype versions of their machines
after sub-component, component, and system testing is fully completed at prototype test
sites to verify the full installed wind turbine assembly and obtain certification.
Why: Certain testing can only be done on the full-scale system level, and not in a
laboratory or test bench. For example, load measurements, verification of the technical
availability, power curve verification, power performance, power quality verification,
and certification of the full turbine are typically done prototype test sites [88].
How: OEM’s or wind farm developers lease space at specific test sites for long periods,
often a couple of years at a time. New wind turbine prototypes are installed and tested at
such sites to carry out further research and development on the prototype at full scale.
Advantage
Real life tests on the full-scale product level provide proof of performance, and allow
for the collection of large amounts of real life data that can further optimize the product.
Real life load cases can only occur at such test sites.
Disadvantage
At this moment, there are no specific cold climate test sites. Instead, most of the
test sites are located in moderate climates.
There are no specific certifications for cold climate sites with regard to icing
and/or de-icing.
Changing large and heavy parts of the prototype at a test site is more difficult
and expensive in this stage of the validation process. Therefore, a lot of the lab
and test bench testing is done before taking the prototype into the field.
Field testing is expensive and take significant time.
There is a lack of field test sites.
It is not possible to accurately control the environmental loads, unlike certain
laboratories and test benches.
Challenge
Wind turbine manufacturers need to make sure that design flaws are identified and
eliminated early in the design process, since changing parts in the field can be very
costly. With regard to the topic of cold climate and icing, there are no test sites with
either extreme cold temperatures or heavy icing.
74
DTU operates seven test stands at its Østerild test centre [338], where new wind
turbine prototypes can be tested and validated. The site is located in a moderate
climate, so no information about extreme cold weather or icing is available.
CENER in Spain owns the Experimental Aliaz Wind Farm [339] that has space
for six wind turbine prototypes, and allows for wind turbine certification in
complex terrain conditions with high wind levels. The site is located in a
moderate climate, so no information about extreme cold weather or icing is
available.
ECN and Ecofys each have a wind turbine test site located in the Netherlands.
Ecofys operates the Lelystad test site that has space for 10 wind turbines [340],
[341]. The site is mostly used for certification testing and has a grid connection
that allows for a combined capacity of 30MW. The ECN wind turbine test site
has 11 test turbines installed [89]. Extreme low temperatures and heavy icing
events do not occur at either location as they are located in moderate climates.
12.4 Field testing at production sites
What: Certain products, such as new monitoring tools for ice detection, sensors (for
example anemometers or wind vanes [342]), retrofit de-icing systems, etc., can be tested
by installing them at existing wind farms. The data from existing wind farms can also
be used to optimize the next generation of wind turbine platforms, or to make
modifications and upgrades to existing wind turbine platforms. Data obtained at
production sites can also be used to understand certain icing conditions and are useful
for updating icing and weather models.
Why: Since there are no cold climate test sites, wind farms that are located cold
climates can be used to investigate certain technologies used in the wind turbines.
Additionally, experience from wind farm sites in cold climates, should find its way back
to the manufacturers to optimise the next generation of wind turbines.
How: Wind farm owners allow companies, universities, or knowledge centres to
implement new technologies. Data from the tests is typically shared by both parties.
Advantage
Testing and validation of various technologies at production sites is a good alternative
to traditional test sites. It allows developers, manufacturers, and others to gain
knowledge about the behaviour of different components and technologies at cold
climate sites. Retrofits of certain sensors, monitoring tools, ice-detection systems, and
some de-icing systems are relatively cheap to implement, and the real life experience of
testing them at a certain site is a big advantage over testing them in laboratories.
Disadvantage
75
No control over the environmental parameters being tested, long waiting times until
certain cold snaps or icing events occur. Not all wind farm owners are open to this type
of testing. Approval needed from OEM’s to gain SCADA-data, which is needed to
understand certain events.
Challenge
The implemented new technologies must have a high reliability and may not interrupt
the availability of the wind turbine since downtime is expensive. A high technology
readiness level and proof of laboratory tests will be required to convince park owners.
EON performs research and test projects in its Bowbeat wind farm located in the
UK to benchmark different ice-detection and retrofitted de-icing systems [343] .
Alstom is working together with the Lappeenranta University of Technology
(LUT) in Finland on research and testing at the 21MW Muukko wind farm to
understand how wind turbines respond under arctic climate conditions. The goal
of this research is to further improve operations, performance and reliability
using production experience [344].
TechnoCentre éolien has a 4MW research wind farm consisting of two 2.05
Senvion MM92 CCV wind turbines [345]. Here they have tested several sensors
including different ice detectors, cameras used for ice detection, and
anemometers [342].
Enercon has performed verification tests of its hot air solution de-icing system
for rotor blades at several operational wind farms around the world [346] [347].
BlaikenVind AB is a joint company owned by Skellefteå Kraft and Fortum and
will build one of the largest wind farms in Europe between 2011 and 2016 in the
Blaiken area of northern Sweden [348]. The site has Nordex turbines equipped
with electro thermal anti-icing systems and Dongfang turbines with hybrid hot
air and electro thermal anti-icing systems representing the newest generation of
active ice protection systems. Several research projects in Blaiken wind farm
will start in 2016.
76
13 Further needs for technology research and
innovation in cold climate “The inventor of the second wheel made the discovery of the first wheel useful.”
The priority list presented in this chapter is intended for research organizations and
companies working in the field of cold climate wind energy to focus, harmonize, and
accelerate joint efforts for research and innovation in the field of cold climate. This list
is also intended for national and international funding agencies: please use this list as
guidelines for future research and innovation funding for wind energy. In the absence of
national and especially international funding programs for cold climate wind energy,
almost all research and innovation activities are typically done on national level only
dramatically hindering progress in CC. As Beurskens said in his WinterWind 2015
opening speech [349]:
“Considerable increases to CC R&D budgets are needed!”
A list of priorities for research and innovation (R&I) will undoubtedly be different for
each stakeholder. Investors might not be interested in technical details, but they sure
appreciate measures that decrease the uncertainty. Since the start of IEA Task 19 back
in 2002 we’ve known the importance of market studies for the manufacturing industry
and we can conclude that the interest in cold climate issues soared after May 2013 when
World Market Update 2012, [2], had been published. Consequently, from the wind
turbine manufacturers’ point of view, market studies ought to be the number one top
priority on the list. Here we’re, however, aiming at presenting priorities that reflect the
R&I needs for the entire cold climate wind energy community. As stated by Beurskens
and Thor [350] in WinterWind 2015 closing summary speech:
“We need a common research agenda. And in a coordinated way!”
IEA Task 19 heard this call and is willing to take the lead in proposing prioritized
research topics for cold climate. The list is based on IEA Wind Task 19 observations
from workshops and panels at international conferences and from WinterWind
conferences 2015-2016 and at Québec Wind Energy Conference 2014.
77
The prioritized R&I topics for cold climate are:
1. Standards, certification, and recommended practices
2. Assessment of reduced production prior to deployment, financial risks, and
uncertainties
3. Ice protection systems, equipment, and procedures
4. Testing: test sites, field testing, & lab testing incl. subcomponents and ice detection
5. Health, safety, and environment (HSE) incl. ice throw
6. Construction, installation, operation, maintenance, and repairs
7. Market potential and limitations
8. Grid issues
9. Small wind turbines
These priorities ought not to be misinterpreted. Grid issues and making small wind
turbines function in cold climates are still important. Utilities might not know all the
challenges associated with wind farms in cold climates and they’re not overly keen to
talk about problems regularly encountered. As a substitute for diesel generators and
fuel, which are expensive to transport using helicopters, small wind turbines that are
capable of operating in icing conditions would likely prove to be useful and cost-
efficient in wind resource assessment. Offshore wind farms in cold climates are not on
the priority list but will be important in the future.
According to a WinterWind 2016 pre-conference survey initiated by Lehtomäki, [351],
the three groups most keen to master wind energy in cold climates are
owners/developers, consultants, and the research community. A lack of interest from
government and authorities is either a coincidence or a sign of ignorance. The two most
important issues are considered to be assessing the performance of de-/anti-icing
systems and ice detection. Finally, Lehtomäki indicates the importance of the
forthcoming (forecasted in 2018) release of IEC 61400-15 Ed. 1.0 ”Assessment of site
specific wind conditions for wind power stations” and it’s importance to realistic
resource assessment regarding icing. Vattenfall is the largest utility in Sweden and is
100% owned by the Swedish government. Odemark, [352] p.13 &14, confirms the
interest in assessing the performance of iced up wind turbines as well as ice prevention
systems and the importance of accurately detecting icing, during the pre-construction
phase, by developing sensors in general, and those intended to measure liquid water
content in particular as well as improving methods to evaluate photos of iced up objects.
A Swedish R&I strategy for developing wind energy stands on three legs; Swedish
conditions, sustainability and involvement, and power grid integration, Rigole, [353]
p.8. Swedish conditions of particular interest to master are those found in the forest, at
sea, and in cold climates. The Swedish Energy Agency claims: ”Building in cold
climate with weather conditions many times more extreme than what the wind turbines
are originally designed for is a prerequisite for expansion of wind power in Sweden. …
Sweden has no domestic turbine manufacturer. Therefore, efforts are concentrated on a
few areas where there is a potential to achieve excellence and to create an innovation
cluster”.
78
References: [2] [350] [351] [352] [353] [354] [231]
13.1 Standards, certification and recommended practices
What: Being a new, albeit big, niche market, wind energy deployment in cold climates
has developed rapidly during the past ten years. Many mistakes have been made and the
biggest of them all is probably the initial use of standard wind turbines at ice infested
locations. Here, potential energy is not being captured, not only due to low temperatures
outside the operating range of standard turbines, but also due to iced sensors and blades.
Additionally, blade damages due to falling ice are difficult to detect and expensive to
repair.
Why: The main reason for initially using standard products at these sites was a shortage
of wind turbines, which made the manufacturers unwilling to adapt to these new
meteorological conditions.
How: The market is new and all parties involved seem to have realized that standards,
certification, and recommended practices are useful tools that can decrease the
uncertainties and thereby lower the cost of energy. Lately, different ice protection
systems (mainly active de- and ant-icing systems) have been made available from a
large number of manufacturers. When investors demand functionality and verification
of performance they realize the need for standardized procedures to evaluate both pre-
construction plans and measurements as well as the properties of operating wind farms.
Funding for the development of standards is by authorities expected to be made
available from the industry. In countries without wind turbine manufacturers in which
large-scale wind farms are being deployed there’s strangely enough in general no
funding available for standardization work.
The following tasks will be carried out during 2016-2018 within IEA RD&D Wind’s
Task 19 – Wind Energy in Cold Climates, Lehtomäki, [355] p.16:
a) Market study update for 2016-2020
b) International standard IEC 61400-15 “Site energy yield assessment” CC aspects
c) T19IceLossMethod validation & development
d) Laboratory and full scale testing
e) Ice protection system performance evaluation guidelines
f) Ice mapping
g) Ice sensor classification
h) Development of International ice throw guidelines
All of the above tasks above except a) Market study update for 2016-2020, are targeted
towards standardization of various cold climate challenges.
References: [355] [356] [357] [358] [359]
79
13.2 Assessment of reduced production prior to deployment, financial
risks and uncertainties
What: Methods and tools to evaluate the potential reduction of energy yield due to low
temperature and icing effects are needed in order to secure the financial feasibility of a
planned wind farm project.
Why: Reliable pre-construction assessment of a wind farm’s energy yield is key to
reducing the risk and thereby the cost of capital. Wind farms will only be built provided
there’s a possibility to make a profit.
How: Development of international standards are one of the most effective ways to
mitigate the “Wild West” type of practices currently used when talking about resource
assessment regarding icing and related financing. The new upcoming IEC 61400-15 ed1
standard will provide transparency and guidelines to the cold climate wind community
with regard to assessment of reduced production due to cold climates. Sharing of
knowledge and experiences plays also a critical role.
The ability to forecast production with respect to iced up blades has improved greatly
during the past few years. This is mainly due to the fact that large wind farms have been
built at such locations thereby enabling, for the very first time, evaluation of their
performance in icing conditions. Newly developed methods and models will, when
verified and further developed by correlating present meteorological conditions with
actual production, enable historical data to be used to produce reliable icing maps and
accurate site assessments.
Solutions to mitigate reduced production and resulting uncertainty to the energy yield
are available to lower financial risks and uncertainties. A developer’s dream is to be
able to inform the bank manager that the ice protection system ordered is able to handle
basically any situation if icing turns out to be a more difficult problem than expected.
For sites in Sweden and Finland, the IEA ice classification of operating sites has been
compared to the predicted performance based on icing atlases, Karlsson, [360]. As the
models and measurements only correlate well on long-term trends, it is concluded that
data from multiple sources and from multiple years are required to carry out a
representative classification.
The historical average availability of the studied data sets acquired during mast
measurements in cold climates is shown to be below 95%. Therefore, Liléo proposes a
strategy based on cooperation to achieve 99% data availability by 2020, [361] p. 17.
References: [9] [362] [360] [363] [361] [364] [365] [366] [367] [368] [369] [370] [371]
[372] [373] [374] [11] [375] [376] [377] [378]
13.3 Ice protection systems, equipment and procedures
What: Wind turbine blades can be iced up at ice infested locations.
80
Why: The available wind resource can’t be fully used unless the blades are mostly free
of ice. Ice on the blades also increases the risk of blade damage, ice throw, stall induced
vibrations, and leads to increased noise.
How: Newly developed commercial ice protection systems (mainly active de- and anti-
icing systems) are readily available from a large number of wind turbine manufacturers.
The next generation of such systems are being developed and tested. The operational
strategy of ice protection systems needs to be investigated and optimized and their
actual performance verified.
At WinterWind 2015 and 2016, several wind turbine manufacturers have described the
present status of their ice protection systems.
References: [155] [162] [151] [379] [153] [380] [381] [382] [383] [384] [385] [386]
[387] [181] [171]
13.4 Testing: test sites, field testing, and lab testing including
subcomponents and ice detection
What: Wind turbines consist of several mechanical, hydraulic, electrical, and structural
components. All of these components have to function in a safe, reliable, and efficient
way to ensure optimal performance, especially for cold climate sites [257]. Therefore,
validation testing is performed during the overall development process to verify that
wind turbines and their components are implemented as designed, and meet their design
specifications.
Why: Wind farms were initially built in cold climates using standard wind turbines.
The adapted technologies, required to enable a cost-efficient operation of wind turbines
in cold climates, have recently been developed or are under development.
Consequently, their performance needs to be verified.
How: Testing is carried out on subcomponents, systems, and complete wind turbines.
Such tests are performed both in controlled conditions in laboratories and in the field.
Full scale field testing is extremely important in order to validate any given products
efficiency and reliability, but controlled laboratory testing is also needed prior to
outdoor tests.
The test procedures must be standardized for laboratory and field testing if comparisons
are to be meaningful. Currently, there are no commercial test stations in cold climates
for today’s large wind turbines, only individual test sites exist (see more in chapter 12
on testing).
Most researchers consider camera images to be the most accurate means to detect and
quantify ice build-up on objects. If not automated, the evaluation of photos can,
however, be time consuming and expensive. A summary of properties and evaluation of
a large number of ice detection and measurement methods is presented in [388] p.22.
Relative humidity is shown to be a poor means of detecting icing conditions with a 75%
81
positive false alarm rate, whereas wind direction and wind speed sensors seem to
provide quite reliable and reasonable results.
References: [277] [389] [388] [390] [391] [392] [393] [394] [395] [396] [397] [398]
[399] [400] [401] [402] [403]
13.5 Health, safety and environment (HSE) incl. ice throw
What: Wind energy in cold climates implies low temperatures and icing conditions.
Additionally, these wind farms are often, but not always located at remote, high altitude
sites in complex terrain. These cold climate conditions can pose special health and
safety issues for maintenance personnel as well as the general public that need to be
accounted for.
Why: Low temperatures and iced up surfaces on a wind turbine create potential hazards
for service personal and the public. Remote locations in complex terrain can cause
rescue operations to be delayed.
How: The development of guidelines and technologies for safe and environmentally
friendly operation of wind farms are keys to success.
References: [404] [405] [224] [406] [406] [407] [408] [409] [410] [410] [411] [412]
[413] [414] [414] [415]
13.6 Construction, installation, operation, maintenance and repairs
What: After all contractual and financial matters have been agreed for a wind farm, the
physical development of the actual wind farm can begin.
Why: The climate, complex terrain, and remoteness of wind farms are factors that can
make deployment and operation of wind farms at cold climate sites challenging.
How: If the building season is short, using prefabricated foundations is one way to
shorten the installation time. A developer’s dream is to be able to inform the bank
manager that the ice protection system ordered is able to handle basically any situation,
even if icing turns out to be a more difficult problem than expected. Passing steep and
narrow passages in complex terrain can be accomplished by delivering the wind turbine
in smaller and lighter sections or by using special means of transportation. Energy
production might be optimized and noise reduced by lowering the power and rotational
speed in icing conditions.
References: [405] [416] [417] [418] [419] [420] [418] [421] [422] [423] [424] [133]
[235] [234]
13.7 Market potential and limitations
What: Renewable energy in general and such without cost of fuel in particular is
destined to replace fossil fuel and other sources of energy with a higher marginal cost.
82
Why: It is essential for manufacturers’ and developers’ long-term planning to gain
knowledge of future markets. Market studies are regularly being published, but they
rarely contain data specific for cold climate sites.
How: Market studies covering wind energy potential at cold climate locations ought to
be initiated on a regular basis. According to [425], the wind resource in Mongolia
exceeds 8 PWh/year, which equals roughly 40% of the world’s annual electricity
generation. As HVDC has enabled transfer of electricity over long distances, for
example between Norway and Holland (580 km), similar projects are thought of
between Mongolia and Japan, and according to Fouquet, also planned for in Europe,
[426] p.38.
References: [2] [419] [420]
13.8 Grid issues
“We don’t know very much and we’re not overly keen to talk about what we do know.”
What: Wind energy in cold climates is a young technology and such wind farms are
often remotely located, far away from populated areas.
Why: Although utilities and manufacturers are used to operating their equipment in
cold climate conditions, new challenges are encountered as the technology is being
developed. Icing of power lines seems to be a problem, but utilities, if at all aware, seem
not overly happy to talk about it. Hoar frost, which isn’t a problem for the wind turbine,
can cause significant losses due to the corona effect on power line insulators.
How: A devil’s advocate need to challenge the utilities to study the influence on the
grid from wind farms at remote locations sharing the grid with, for example, hydro
power used to stabilize the grid.
References: [427]
13.9 Small wind turbines
What: Wind resource assessment in general is an expensive business in cold climates,
and power supply for remote sites with additional heated instruments remains a
challenge. In cold climates it might require transportation of equipment and fuel by
means of helicopter.
Why: Provided small wind turbines could cope with icing, their use could decrease or
eliminate the need for transporting fuel.
How: Ice protection systems ought to be developed for small wind turbines.
References:
83
14 Bibliography
[1] C. S. Bidwell and M. G. Potapczuk, “Users Manual for the NASA Lewis Three-
Dimensional Ice Accretion Code (LEWICE3D),” NASA TM 105974, 1993.
[2] Navigant Research, “World Market Update 2012,” Navigant Research, ISBN:
978-87-994438-4-0, Copenhagen, Denmark, 2013.
[3] IEC, IEC 61400-1:2005(E) Wind turbines Part 1 - Design Requirements,
Geneva, Switzerland: IEC, 2005.
[4] Ø. Byrkjedal, “Icing Map of Sweden,” 2012. [Online]. Available:
http://www.vindteknikk.com/services/analyses/wind-power/pre-
construction/icing-map. [Accessed 4 03 2016].
[5] B. Tammelin, T. Vihma, E. Atlaskin, J. Badger, C. Fortelius and e. al,
“Production of the Finnish Wind Atlas,” Wiley Wind Energy (DOI:
10.1002/we.517), vol. 16, no. 1, pp. 19-35, 2011.
[6] V. Lehtomäki, T. Karlsson, S. Rissanen, S. Asplund and T. Hilakivi, “Estimating
icing in Finnish climate conditions,” in Wind Finland 2015 seminar
(http://www.tuulivoimayhdistys.fi/filebank/802-VilleLehtomaki.pdf), Helsinki,
2015.
[7] K. Hämäläinen and S. Niemelä, “Verification of Icing-model, in Finland,” in
IWAIS, Uppsala, 2015.
[8] Finnish Meteorological Institute, “Finnish Icing Atlas,” 2011. [Online].
Available: http://www.tuuliatlas.fi/icingatlas/. [Accessed 2 November 2015].
[9] S. Rissanen and V. Lehtomäki, “Global Wind and icing optimization atlas : case
Finland,” in Winterwind, Åre, Sweden, 2016.
[10] G. A. McKay and H. A. Thompson, “Estimating the Hazard of Ice Accretion in
Canada from Climatological Data,” Journal of Applied Meteorology, vol. 8, no.
6, pp. 927-935, 1969.
[11] S. Lindahl, “Quantification of energy losses caused by blade icing and the
development of an Icing Loss Climatology Using SCADA data from
Scandinavian wind farms,” in WinterWind, Piteå, Sweden, 2015.
[12] T. Beckford, “DNV GL’s empirical icing map of Sweden and methodology for
estimating annual icing losses,” in Winterwind, Åre, Sweden, 2016.
84
[13] J. Hošek, “Synoptic icing observations in central Europe and their applicability
for icing mapping,” in 13th International Workshop on Atmospheric Icing of
Structures, Andermatt, Switzerland, 2009.
[14] B. Wichura, “The Spatial Distribution of Icing in Germany Estimated by the
Analysis of Weather Station Data and of Direct Measurements of Icing,” in 15th
International Workshop on Atmospheric Icing of Structures, St. John's,
Newfoundland and Labrador, Canada, 2013.
[15] B. C. Bernstein, L. Makkonen and E. Järvinen, “Eurpoean Icing Frequency
Derived From Surface Observations,” in IWAIS XIII, Andermatt, Switzerland,
2009.
[16] V. Lehtomäki, T. Karlsson and S. Rissanen, “Wind Power Icing Atlas – tool for
financial risk assessment,” in Winterwind, Sundsvall, Sweden, 2014.
[17] S. Rissanen and V. Lehtomäki, “Wind Power Icing Atlas (WIceAtlas) & icing
map of the world,” in Winterwind, Piteå, Sweden, 2015.
[18] F. Lamraoui, G. Fortin, R. Benoit, J. Perron and C. Masson, “Atmospheric icing
severity: Quantification and mapping,” Atmospheric Research, vol. 128, pp. 57-
75, 2013.
[19] A. Manea, I. Ralita, A. Dumitrescu, A. Sommerfeld and B. Wichura, “Analysis
of spatial and temporal distribution of freezing rain events in Romania and
Germany,” in 13th International Workshop on Atmospheric Icing of Structures,
Andermatt, Switzerland, 2009.
[20] S. Chereshnyuk, L. Timashova and V. Lugovoi, “A new set of climatic loads
maps for Russia,” in 15th International Workshop on Atmospheric Icing of
Structures, St. John's, Newfoundland and Labrador, Canada, 2013.
[21] V. Lugovoi, S. Chereshniuk and L. Timashova, “Modern techniques of ice-load
assessment and icing maps creation for the design of overhead transmission lines
used in the Russian Federation,” in 13th International Workshop on Atmospheric
Icing of Structures, Andermatt, Switzerland, 2009.
[22] K. Harstveit, Ø. Byrkjedal and E. Berge, “Validation of Regional In-Cloud Icing
Maps in Norway,” in 13th International Workshop on Atmospheric Icing of
Structures, Andermatt, Switzerland, 2009.
[23] Ø. Byrkjedal, “Estimating wind power production loss due to icing,” in 13th
International Workshop on Atmospheric Icing of Structures, Andermatt,
Switzerland, 2009.
85
[24] Ø. Byrkjedal, “Mapping of icing in Sweden - On the influence from icing on
wind energy production,” in Winterwind, Skellefteå, Sweden, 2012.
[25] Ø. Byrkjedal, “Vindkart for Norge,” 2009. [Online]. Available:
https://www.nve.no/Media/3759/kartbok3a_4143.pdf. [Accessed 4 3 2016].
[26] Ø. Byrkjedal, “Icing Map for Finland,” [Online]. Available:
http://www.vindteknikk.com/services/analyses/wind-power/pre-
construction/icing-map. [Accessed 4 3 2016].
[27] H. Bergström, P. Thorsson, P. Unden, O. Esbjörn, U. Andrae and S. Söderberg,
“Windpower in cold climates – Vindforsk project V313,” in Winterwind, Umeå,
Sweden, 2011.
[28] G. Ronsten, “Swedens’s bold activities in measurements and mapping of icing
and de-icing of wind turbines,” in 14th International Workshop on Atmospheric
Icing of Structures, Chongqing, China, 2011.
[29] B. Wareing and S. M. Fikke, “A UK Probabilistic Wind / Ice Map,” in 14th
International Workshop on Atmospheric Icing of Structures, Chongqing, China,
2011.
[30] B. E. K. Nygaard, I. A. Seierstad, S. M. Fikke, D. Horsman and B. Wareing,
“The Development of New Maps for Design Ice Loads for Great Britain,” in
15th International Workshop on Atmospheric Icing of Structures, St. John's,
Newfoundland and Labrador, Canada, 2013.
[31] V. Lehtomäki and M. Wadham-Gagnon, “Low temperature & icing map for
Québec,” in Québec Wind Energy Conference, Gaspé, Québec, 2014.
[32] B. E. K. Nygaard, I. A. Seierstad and A. T. Veal, “A new snow and ice load map
for mechanical design of power lines in Great Britain,” Elsevier Cold Regions
Science and Technology, vol. 108, pp. 28-35, 2015.
[33] NOAA, “Celebrating 200 years of science, service and stewardship,” 2007.
[Online]. Available:
http://celebrating200years.noaa.gov/breakthroughs/climate_model/Atmospheric
ModelSchematic.png. [Accessed 11 03 2016].
[34] B. Tammelin, T. Vihma, E. Atlaskin, J. Badger, C. Fortelius, H. Gregow, M.
Horttanainen, R. Hyvönen, J. Kilpinen, J. Latikka, K. Ljungberg, N. G.
Mortensen, S. Niemelä, K. Ruosteenoja, K. Salonen and Suomi, “Production of
the Finnish Wind Atlas,” Wind Energy, vol. 16, no. 1, pp. 19-35, 2013.
[35] S. Söderberg, M. Baltscheffsky, H. Bergström, P. Thorsson, P. Unden and O.
86
Esbjörn, “Mesoscale modelling of icing climate: Sensitivity to model and model
setup,” in Winterwind, Östersund, Sweden, 2013.
[36] S. Dierer, R. Cattin, A. Heimo, B. E. Nygaard and K. Santti, “Modelling the risk
of icing,” in European Wind Energy Conference, Marseille, France, 2009.
[37] S. Dierer, R. Cattin, S. C. Müller, B. E. Nygaard, P. Steiner and B. Calpini,
“Modeling the risk of icing in Switzerland,” in 13th International Workshop on
Atmospheric Icing of Structures, Andermatt, Switzerland, 2009.
[38] J. Yang, K. F. Jones, W. Yu and R. Morris, “Simulation of in-cloud icing events
on Mount Washington with the GEM-LAM,” Journal of Geophysical Research:
Atmospheres, vol. 117, no. D17, 2012.
[39] J. Yang, W. Yu, J. Choisnard, A. Forcione and S. Antic, “Coupled Atmospheric–
Ice Load Model for Evaluation of Wind Plant Power Loss,” Journal of Applied
Meteorology and Climatology, vol. 54, no. 6, pp. 1142-1161, 2015.
[40] B. E. Kringlebotn Nygaard, J. E. Kristjánsson and L. Makkonen, “Prediction of
In-Cloud Icing Conditions at Ground Level Using the WRF Model,” Journal of
Applied Meteorology and Climatology, vol. 50, no. 12, pp. 2445-2459, 2011.
[41] N. N. Davis, A. N. Hahmann, N.-E. Clausen and M. Žagar, “Forecast of icing
events at a wind farm in Sweden,” Journal of Applied Meteorology and
Climatology, vol. 53, no. 2, pp. 262-281, 2014.
[42] B. Tammelin, K. Säntti, H. Dobech, M. Dusterwich, H. Ganander, G. Kury, T.
Laakso, E. Peltola and G. Ronsten, “Wind Turbines in Icing Environment:
Improvement of Tools for Siting, Certification and Operation - NEW
ICETOOLS,” Finnish Meteorological Institute, Helsinki, 2005.
[43] G. Fortin, J. Perron and A. Ilinca, “Behaviour and Modeling of Cup
Anemometers under Icing Conditions,” in IWAIS XI, Montréal, 2005.
[44] T. Pederson and U. Paulsen, “Classification of operational charachteristics of
commercial cup-anemometers,” Risoe National Laboratory/Wind Energy and
Atmospheric Physics Department, pp 45-49, Denmark, 1999.
[45] B. Tammelin et. al., “Improvement of Severe Weather Measurements and
Sensors –EUMETNET SWS II Project,” FMI reports, 2004:3.
[46] Z. Khadiri-Yazami, M. Durstewitz, T. Klaas, L. Peterson and A. Baier,
“Performance of LiDAR in icing conditions. Comparison to a 200m mast in
complex terrain,” in Winterwind, Sundsvall, 2014.
87
[47] R. Cattin, S. Bourgeois, S. Dierer, M. Mueller and S. Koller, “Wind forecasts in
complex terrain. Experiences with SODAR and LIDAR,” in Ice and Rocks III,
Zadar, 2010.
[48] C. Arbez, M. Boquet and R. Krishnamurthy, “Case study of Lidarin cold climate
and complex terrain in Canada,” in Winterwind, Sweden, 2014.
[49] ISO, ISO 12494 - Atmospheric icing of structures, Printed in Switzerland:
Reference number ISO 12494:2001(E), First edition 2001-08-15.
[50] A. Krenn, “More Mobile Remote Energy for heated wind measurement
systems,” in Winterwind, Sweden, 2014.
[51] Krenn, Andreas; Energiewerkstatt, “Intelegent load control for heated wind
measurement sensors,” in Winterwinde, International Wind Energy Conference,
Sweden, 2012.
[52] IEC 61400-12-2:2013 - Power performance measurements of electricity
producing wind turbines, 2013.
[53] VAISALA, “Wind Sensors,” [Online]. Available:
http://www.vaisala.com/en/products/windsensors/Pages/default.aspx. [Accessed
15 6 2015].
[54] G. Instruments, “WInd sensors,” [Online]. Available:
http://gillinstruments.com/products/anemometer/anemometer.htm. [Accessed 22
6 2015].
[55] REMTECH, “DOPPLER SODAR and RASS (Radio Acoustic Sounding
System),” [Online]. Available: http://www.remtechinc.com/. [Accessed 22 6
2015].
[56] Leosphere, “Windcube LiDAR,” [Online]. Available:
http://www.leosphere.com/en/. [Accessed 22 6 2015].
[57] “efoy Energy for you,” [Online]. Available: http://www.efoy-
pro.com/page/wind-measurement. [Accessed 6 2015].
[58] R. Cattin and D. U. Heikkilä, “Evaluation of ice detection systems for wind
turbines,” Meteotest, Bern, 2016.
[59] S. Kimura, D. T. Sato, . P. Y. Yamagishi and H. Morikawa, “Evaluation of ice
detecting sensors by icing wind tunnel test,” in IWAIS XIII, Andermatt, 2009.
[60] D. J. B. Wareing, “Test Site data on icing monitors and conductor ice loads,” in
88
IWAIS XIII, Andermatt, 2009.
[61] H. Wickman, “Evaluation of field tests of different ice measurement methods for
wind power - focusing on their usability for wind farm site assessment and
finding production losses,” 2013.
[62] H. Wickman, J.-Å. Dahlberg and P. Krohn, “Experiences of different ice,” 2013.
[63] “User Guide T 40 series of Icing Rate Sensors,” HoloOptics, [Online].
Available:
http://holooptics.utrymmet.com/Dokument/651.Userguide%20T40.004.En.pdf.
[Accessed 14 01 2016].
[64] J. Rast, R. Cattin and A. Heimo , “Icing Indices: a good solution?,” in IWAIS
XII, Andermatt, 2009.
[65] M. Wadham-Gagnon, . N. Swytink-Binnema, D. Bolduc, . K. Tété and C. Arbez,
“Ice Detection Methods and Measurement of Atmospheric Icing,” in IWAIS,
Uppsala, 2015.
[66] R. Cattin, S. Kunz, . A. Heimo, M. Russi and . G. Russi, “Two Years of
Monitoring of a Wind Turbine under Icing Conditions,” in DEWEK , Bremen,
2008.
[67] B. Ollars and P. Jonsson, “Conbitech Ice Detection System,” in WinterWind
conference, Piteå, 2015.
[68] P. Jonsson, “The ice load surveillance sensor IceMonitor,” Combitech, [Online].
Available:
http://www.combitech.se/Documents/Bilder%20och%20filer%20sidor/Tj%C3%
A4nster/Environmental%20Solutions/4/IceMonitor_Produktblad_Combitech.pdf
. [Accessed 14 01 2016].
[69] J. Šabata, P. Lehký, L. Zeman and P. Vaculík, “Automated Icing Monitoring
System on the territory of the Czech and Slovak Republic,” in IWAIS 2015 - 16th
international workshop on atmosperic icing of structures , Uppsala, 2015.
[70] D. J. B. Wareing and M. J. Sabata, “Testing the PMS Icemeter at Deadwater
Fell,” in IWAIS XIII, Andermatt, 2009.
[71] J. Sabata, “Studnice Test Station (EGÚ Brno),” in IWAIS XIII, Andermatt, 2009.
[72] “EGU Brno,” [Online]. Available:
http://www.egubrno.cz/sekce/s002/produkty/s002_produkty_pms.html.
[Accessed 19 01 2016].
89
[73] “LID-3300IP Ice Detector - Installation and Operating Instructions,” Labkotec,
19 12 2014. [Online]. Available:
http://www.labkotec.fi/sites/default/files/tiedostot/D80186Je.pdf. [Accessed 14
01 2016].
[74] “LID-3300IP - Efficient ice detection brings reliability,” Labkotec, [Online].
Available:
http://www.labkotec.fi/sites/default/files/tiedostot/LID3300IP_es_ENG_9_15_w
eb_0.pdf. [Accessed 14 01 2016].
[75] R. Cattin, A. Heimo, Y.-A. Roulet and J. Rast , “A test of the Goodrich
0871LH1 ice detector at the Guetsch station,” in IWAS XIII, Andermatt, 2009.
[76] S. G. Cober, G. A. Isaac and A. V. Korolev, “Assessing the Rosemount Icing
Detector with In Situ Measurements,” Journal of Atmospheric and Oceanic
Technology, vol. 18, pp. 515-528, 2001.
[77] “0872F1 Ice Detector - Instruction manual,” Goodrich Sensor System (Campbell
Scientific), 2014. [Online]. Available:
https://s.campbellsci.com/documents/ca/manuals/0872f1_man.pdf. [Accessed 14
01 2016].
[78] “Leine Linde Systems IPMS - Ice prevention for greater safety and higer energy
yields,” Leine Linde Systems, [Online]. Available: http://www.ll-
systems.com/uploads/tx_lliproducts/en_publication_LLS_IPMS.pdf. [Accessed
14 01 2016].
[79] N. N. Davis, Ø. Byrkjedal, A. N. Hahmann, C. Niels-Erik and Ž. Mark, “Ice
detection on wind turbines using the observed power curve,” Wind Energy, vol.
19, no. 6, p. 999–1010, 2016.
[80] E. Hellström, “Development of a model for estimation of wind farm production
losses,” Uppsala University , Uppsala, 2013.
[81] S. Kolar, “A Comparison of Wind Power Production with Three Different De-
and Anti-Icing Systems,” Uppsala University , Uppsala, 2015.
[82] “T19IceLossMethod - A standardized method to assess production losses due to
icing from wind turbine SCADA data,” IEA Task 19 - Wind energy in cold
climates, 2015. [Online]. Available:
https://www.ieawind.org/task_19/Task19%20Ice%20Loss%20Method.html.
[Accessed 16 04 2016].
[83] “BLADEcontrol® Greater output – less risk,” Rexroth Bosch Group, [Online].
Available: http://dc-
90
corp.resource.bosch.com/media/general_use/industries_2/renewable_energies_6/
windenergy/products_2/rotor_blade_condition_monitoring_systems_/BLADEco
ntrol_AE.pdf. [Accessed 14 01 2016].
[84] “fos4x monitoring lightweight structures,” fos4x , [Online]. Available:
http://www.fos4x.de/produkte/windprodukte/eiserkennung. [Accessed 14 01
2016].
[85] B. Wölfel, “Reliable ice detection for rotor blades to increase availability and
yield,” in WinterWind, Åre, 2016.
[86] “Eologix,” [Online]. Available: http://eologix.com/en/product/. [Accessed 19 01
2016].
[87] L. Makkonne, M. Marjaniemi and T. Laakso, “Modeling and prevention pf ice
accretion on wind turbines,” Wind Engineering, vol. 21, no. 1, pp. 3-21, 2001.
[88] M. Homola, T. Wallenius, L. Makkonen, P. Nicklasson and P. Sundsbo, “The
relationship between chord length and rime icing on wind turbines,” Wiley Wind
Energy, vol. 13, no. 7, pp. 627-632, 2009.
[89] M. Homola, T. Wallenius, L. Makkonen, P. Nicklasson and P. Sundsbo,
“Turbine Size and Temperature Dependence of Icing on Wind Turbine Blades,”
Wnd Engineering, vol. 34, no. 6, pp. 615-628, 2010.
[90] M. Homola, M. Virk, T. Wallenius, P. Nicklasson and P. Sundsbo, “Effect of
atmospheric temperature and droplet size variation on ice accretion of wind
turbine blades,” Journal of Wind Engineering and Industrial Aerodynamics, vol.
98, no. 12, pp. 724-729, 2010.
[91] W. Wright, “User manual for the NASA Glenn Ice Accretion code LEWICE
version 2.2.2,” NASA, Cleveland, Ohio, 2002.
[92] W. Wright, “User's manual for LEWICE version 3.2,” NASA, Cleveland, Ohio,
2008.
[93] W. Wright and A. Rutkowski, “Validation Results for LEWICE 2.0,” NASA,
Cleveland, Ohio, 1999.
[94] W. Wright, “Validation Results for LEWICE 3.0,” NASA, AIAA–2005–1243,
Reno, Nevada, 2005.
[95] NATO, “Ice Accretion Simulation Evaluation Test,” NATO, RTO-TR-038,
NEUILLY-SUR-SEINE CEDEX, France, 2001.
91
[96] R. Colantonio, “Lewice,” NASA Glenn Research Center, [Online]. Available:
https://icebox.grc.nasa.gov/design/lewice.html. [Accessed November 2015].
[97] F. Saeed, S. Gouttebroze and I. Paraschivoiu, “Modified CANICE for Improved
Prediction of Airfoil Ice Accretion,” in 8th Aerodynamic Symposium, 48th CASI
Conference, 2001.
[98] I. Paraschivoiu and F. Saeed, “Ice Accretion Simulation Code CANICE,” in
International Aerospace Symposium "Carafoli 2001", Bucharest, Romania,
2001.
[99] F. Morency, F. Tezok and I. Paraschivoiu, “Anti-Icing System Simulation Using
CANICE,” Journal of Aircraft, vol. 36, no. 6, 1999.
[100] K. Hasanzadeh, S. Bourgault-Côté, E. Laurendeau, C. Brette and I. Paraschivoiu,
“Validation of multi-time steps Lagrangian/Eulerian RANS based icing code
CANICE2D-NS,” in 62nd CASI Aeronautics Conference and AGM 3rd GARDN
Conference, 2015.
[101] K. Hasanzadeh, A. Mosahebi, E. Laurendeau and I. Paraschivoiu, “Framework
for Multi-Steps Icing Simulation Code CANICE2D-NS,” in Canadian
Aeronautics and Space Institute Conference (CASI), Toronto, Canada, 2013.
[102] K. Hasanzadeh and E. Laurendeau, “Validation and User Manual of
CANICE2D-NS,” Bombardier Co., 2014.
[103] A. Pueyo, C. Brette, S. Vafa and I. Akel, “A Comparison Exercise of Ice
Accretion Simulations with 2D and 3D Solvers,” SAE Technical Paper 2007-01-
3338, 2007.
[104] K. Hasanzadeh, A. Mosahebi, E. Laurendeau and I. Paraschivoiu, “Validation
and Verification of Multi-Steps Icing Calculation Using CANICE2D-NS Code,”
in AIAA Fluid Dynamics and Co-located Conferences and Exhibit, San Diego,
CA, USA, 2013.
[105] R. Gent, “TRAJICE2 - A Combined Water Droplet Trajectory and Ice Accretion
Prediction Program for Aerofoils,” RAE-TR-90054, 1990.
[106] W. B. Wright, R. Gent and D. Guffond, “DRA/NASA/ONERA Collaboration on
Icing Research Part II - Predictions of Airfoil Ice Accretion,” NASA CR-
202349, 1997.
[107] F. Petrosino, G. Mingione and A. Carozza, “Ice Accretion Model on Multi-
Element Airfoil,” in AIAA Atmospheric and Space Environment Conference,
Toronto, Canada, 2010.
92
[108] F. Petrosino, G. Mingione, A. Carozza, T. Gilardoni and G. D'Agostini, “Ice
Accretion Model on Multi-Element Airfoil,” Journal of Aircraft, vol. 48, no. 6,
2011.
[109] G. Zanazzi, G. Mingione, A. Pagano and A. Visingardi, “Ice Accretion
Prediction on Helicopter Rotor Blade in Hover Flight,” in SAE Aircraft &
Engine Icing International Conference, Seville, Spain, 2007.
[110] C. S. Bidwell, “Icing Analysis of the NASA S3 Icing Research Aircraft Using
LEWICE3D Version 2,” in SAE Aircraft and Engine Icing International
Conference, 2007.
[111] B. Wiberg, “Large-scale swept-wing ice accretion modeling in the NASA Glenn
Icing Research Tunnel using LEWICE3D,” University of Illinois, 2014.
[112] R. Colantonio, “LEWICE 3D,” NASA Glenn Research Center. [Online].
[Accessed November 2015].
[113] CERTIF-ICE Inc., “CERTIF-ICE - Home,” [Online]. Available:
http://certifice.com/index.php/en/. [Accessed November 2015].
[114] H. Beaugendre, F. Morency and W. Habashi, “FENSAP-ICE's Three-
Dimensional In-Flight Ice Accretion Module: ICE3D,” Journal of Aircraft, vol.
40, no. 2, pp. 239-247, 2003.
[115] Y. Bourgault, W. Habashi, J. Dompierre and G. Baruzzi, “A finite element
method study of Eulerian droplets impingement models,” International Journal
for Numerical Method in Fluids, vol. 29, pp. 429-449, 1999.
[116] Y. Bourgault, Z. Boutanios and W. Habashi, “Three-dimensional Eulerian
approach to droplet impingement simulation using FENSAP-ICE, Part 1: model,
algorithm, and validation,” Journal of Aircraf, vol. 37, no. 1, pp. 95-103, 2000.
[117] Y. Bourgault, H. Beaugendre and W. Habashi, “Development of a Shallow-
Water Icing Model in FENSAP-ICE,” Journal of Aircraft, vol. 37, no. 4, pp.
640-646, 2000.
[118] ANSYS, “ANSYS FENSAP-ICE,” ANSYS, 2016. [Online]. Available:
http://www.ansys.com/Products/Fluids/ANSYS-FENSAP-ICE. [Accessed 24
February 2016].
[119] T. Hedde and D. Guffond, “ONERA Three-Dimensional Icing Model,” AIAA
Journal, vol. 33, no. 6, pp. 1038-1045, 1995.
[120] E. Montreuil, A. Chazottes, D. Guffond, A. Murrone, F. Caminade and S. Catris,
“Enhancement of Prediction Capability in Icing Accretion and related
93
Performance Penalties Part I: Three-dimensional CFD Prediction of the Ice
Accretion,” in 1st AIAA Atmospheric and Space Environments Conference, San
Antonio, 2009.
[121] N. Davis, Icing Impacts on Wind Energy Prodution - PhD, Denmark: DTU Wind
Energy, 2014.
[122] B. E. Kringlebotn Nygaard, H. Ágústsson and K. Somfalvi-Tóth, “Modeling Wet
Snow Accretion on Power Lines: Improvements to Previous Methods Using 50
Years of Observations,” Journal of Applied Meteorology and Climatology, vol.
52, no. 10, pp. 2189-2203, 2013.
[123] L. Makkonen, “Models for the growth of rime, glaze, icicles and wet snow on
structures,” Philosophical Transactions of the Royal Society A: Mathematical,
Physical and Engineering Sciences, vol. 358, no. 1776, pp. 2913-2939, 2000.
[124] Ø. Byrkjedal, J. Hanss and H. Van der Velde , “Development of operational
forecasting for icing and wind power at cold climate sites,” in IWAIS 2015 –
16th International Workshop on Atmospheric Icing of, Uppsala, Sweden, 2015.
[125] Ø. Byrkjedal, “Icing map of Sweden,” in Winterwind, Östersund, Sweden, 2013.
[126] N. N. Davis, P. Pinson, A. N. Hahmann, C. Niels-Erik and M. Žagar,
“Identifying and characterizing the impact of turbine icing on wind farm power
generation,” Wind Energy, 2015.
[127] K. Finstad, Numerical and Experimental Studies of Rime Ice Accretion on
Cylinders and Airfoils -- PhD, Edmonton, Alberta, Canada: University of
Alberta -- Department of Geography, 1986.
[128] S. Söderberg, WICE - WeatherTech Production Loss Model, Uppsala, Sweden:
WeatherTech Scandinavia AB, 2015.
[129] S. Soderberg and M. Baltscheffsky, “Long-term estimates and variability of
production losses in icing climates,” in Winterwind, Skellefteå, Sweden, 2012.
[130] M. Baltscheffsky and S. Söderberg, “Estimation of Production Losses Due to
Icing – Development of methods for site assessment and forecasting,” in
Winterwind, Östersund, Sweden, 2013.
[131] S. Söderberg and M. Baltscheffsky, “A novel model approach to test de-icing
strategies and de-icing efficiency,” in Winterwind, Sundsvall, Sweden, 2014.
[132] O. Byrkjedal, J. Hansson and H. van der Velde, “Development of operational
forecasting for icing and wind power at cold climate sites,” in IWAIS, Uppsala,
94
2015.
[133] S. Kaija and J. Dillingh, “A Generic Model for Ice Growth and Ice Decrease
Process,” in Winterwind, Piteå, Sweden, 2015.
[134] T. T. W. I. B.-G. M. D. R. H. A. L. E. P. G. R. L. T. Laakso, "State-of-the-art of
wind energy in cold climates," VTT Working Papers, 2010.
[135] S. Ferguson, “Wind energy development in harsh environments subtopic 3:
Design and installation challenges,” in GL Garrad Hassen Presentation, 2010.
[136] L. Kokkala, “Icing Studies and ENERCON Rotor Blade Heating System
(RBHS),” in Optimising Wind Farms in COld Climates, Helsinki, 2014.
[137] Enercon, “ ENERCON rotor blade de-icing system,” WINDBLATT, pp. 10-11,
January 2011.
[138] J. Quitter, “Wind Power Monthly: Vestas reveals de-icing system,” Wind Power
Monthly, 23 October 2013. [Online]. Available:
http://www.windpowermonthly.com/article/1217693/vestas-reveals-de-icing-
system. [Accessed 6 November 2015].
[139] D. Hautmann, “Electricity that Comes from the Cold,” H!tech Magazine, pp. 34-
35, 2013.
[140] P. Jordaens, “Why performing climate chamber tests for wind energy
applications?,” OWI-Lab, 2014.
[141] N. Vindkraft, “Study of wind turbine foundations in cold climate,” Nordisk
Vindkraft, 2012.
[142] M. Gemuend, “Cold climate – test of pitch system,” GL, 2013.
[143] B. C. J. N. R. V. S. P. Jordaens, “Cold start of a 5.5MW offshore transformer,”
Transformer Magazine, vol. 2, no. 2, pp. 28-35, 2015.
[144] P. J. J. (OWI-Lab) and S. G. (. W. Power), “Extreme cold start-up validation of a
wind turbine gearbox by the use of a large climatic test chamber,” in EWEA
2014, Barcelona, 2014.
[145] T. O. S. Patel, “Prepare your renewable plant for cold weather operations,”
Power Magazine, 2014.
[146] O. Parent and I. Adrian, “Anti-icing and de-icing techniques for wind turbines:
Critical review,” Elsevier Cold Regions Science and Technology, vol. 65, no. 1,
95
pp. 88-96, 2011.
[147] L. Battisti, Wind Turbines in Cold Climates - Icing Impacts and Mitigation
Systems, Springer, 2015.
[148] S. Kolar, “A Comparison of Three Different Anti- and De-Icing Techniques
Based on SCADA-Data,” in IWAIS, Uppsala, 2015.
[149] Deutsche WindGuard, “Summary of a Technical Validation of ENERCON's
Rotor Blade De-Icing System,” Deutsche WindGuard Consulting Gmbh, Varel,
2011.
[150] R. Cattin, “Performance of Enercon wind turbines under icing conditions in
Europe,” in WinterWind, Sundsvall, 2014.
[151] E. Sjögren, “Wind Energy in Cold Climate - experiences from Sweden and the
world,” in WinterWind, Pitea, 2015.
[152] B. D. Nielsen, “Vestas de-icing system,” in WinterWind, Sundsvall, 2014.
[153] B. Nielsen, “Vestas De-icing System,” in WinterWind, Pitea, 2015.
[154] Vestas, “Vestas Cold Climate solutions brochure,” Vestas, 2015. [Online].
Available:
https://www.vestas.com/en/products_and_services/options_and_solutions#!vesta
s-cold-climate-solutions. [Accessed 6 November 2015].
[155] J. Birkemeyer, “Anti-icing System on Nordex wind turbines - lightning
protection and operation experience,” in WinterWind, Pitea, 2015.
[156] F. D. Madsen, “Siemens Wind Power Blade De-Icing,” in WinterWind 2014,
Sundsvall, 2014.
[157] Wicetec, “Wicetec Ice Prevention Systems,” [Online]. Available:
http://wicetec.com/. [Accessed 23 October 2015].
[158] Wicetec, “Wicetec Ice Prevention System brochure,” 2015. [Online]. Available:
http://wicetec.com/wp-
content/uploads/2015/09/Wicetec_IPS_description_A4_v1_5_compr.pdf.
[Accessed 23 October 2015].
[159] P. Antikainen, “Ice Prevention Systems for wind turbines,” in Wind Power
Monthly: Optimizing Wind Farms in Cold Climates, Helsinki, 2015.
[160] Nordex, “Anti-Icing - Higher Yields in Icy Conditions,” [Online]. Available:
http://www.nordex-
96
online.com/fileadmin/MEDIA/Produktinfos/EN/Nordex_Anti-Icing_en.pdf.
[Accessed 23 October 2015].
[161] Nordex, “Anti Icing brochure,” [Online]. Available:
http://www.blaikenvind.se/wp-content/uploads/2013/01/Nordex_Anti-
Icing_en.pdf. [Accessed 23 October 2015].
[162] B. Birkemose, “Siemense Wind Power Blade De-icing - 20 years of experience
with blade de-icing,” in WinterWind, Pitea, 2015.
[163] Siemens AB, “Robust and proven technology for de-icing,” Siemens AB,
January 2013. [Online]. Available:
http://w3.siemens.se/home/se/sv/energy/energiproduktion/vindkraft/documents/p
roduktblad%20wind%20power_2013wp_001a_webb.pdf. [Accessed 13 October
2015].
[164] F. D. Madsen, “Siemens Blade De-icing,” in NordVind Seminar"Vindkraft i
kaldt klima", Copenhagen, 01.12.2011.
[165] Siemens AG, “Onshore Wind Customer Event,” in Onshore Wind Customer
Event,
http://w5.siemens.com/belux/web/en/energy/events/Documents/Siemens_Custom
er_Event%201492015.pdf, Beveren Waas, 2015.
[166] E. Peltola, M. Marjaniemi, H. Stiesdal and J. Järvelä, “An IcePrevention System
for the Wind Turbine Blades,” in European Wind Energy Conference, Nice,
1999.
[167] Gamesa, “Gamesa technological solutions for regions with icy conditions,”
September 2014. [Online]. Available:
http://www.gamesacorp.com/recursos/doc/productos-
servicios/aerogeneradores/technological-solutions-for-regions-with-icy-
conditions.pdf. [Accessed 16 October 2015].
[168] K. Johansson, “Anti-icing and Deicing of Wind Turbines using Microwave
Technology,” in WinterWind 2014, Sundsvall, 2014.
[169] J. Karthäuser, “Deicing of Wind Turbines using Microwave Technology,” in
WinterWind conference, Piteå, 2015.
[170] P. Laaksonen, “Using De-Icing and Anti-Icing Systems to tackle production
loss,” in Wind Power Monthly's Optimizing Wind Farms in Cold Climates forum,
Helsinki, 2014.
[171] H. Gedda, “Airborne de-icing solution for wind turbines,” in WinterWind, Åre,
97
2016.
[172] L. Makkonen, “Back to the basics: Wettability, icing and ice adhesion,” in
IWAIS, Uppsala, 2015.
[173] S. Chemyy, M. Jäm, K. Shimizu, A. Swerin, S. U. Pedersen, K. Daasbjerg, L.
Makkonen, P. Claesson and J. Iruthayaraj, “Superhydrophilic Polyelectrolyte
Brush Layers with Imparted Anti-Icing Properties: Effect of Counter ions,” ACS
Appl. Mater. Interfaces, vol. 6, no. 9, pp. 6487-6496, 2014.
[174] G. Heydari, E. Thormann, M. Jäm, E. Tyrode and P. Claesson, “Hydrophobic
Surfaces: Topography Effects on Wetting by Supercooled Water and Freezing
Delay,” The Journal of Physical Chemistry, vol. 117, no. 42, pp. 21752-21762,
2013.
[175] L. Makkonen, “Ice Adhesion —Theory, Measurements and Countermeasures,”
Journal of Adhesion Science and Technology, vol. 26, no. 4-5, pp. 413-445,
2012.
[176] C. Laforte, C. Blackburn and J. Perron, “A Review of Icephobic Coating
Performances over the Last Decade,” in SAE 2015 International Conference on
Icing of Aircraft, Engines, and Structures, Prague, 2015.
[177] F. Arianpour, M. Farzaneh and R. Jafari, “Hydrophobic and anti-ice properties
of homogeneous and heterogeneous nanoparticle coatings on Al 6061
substrates,” in IWAIS, Uppsala, 2015.
[178] H. Koivuluoto, C. Stenroos, R. Ruohomaa, G. Bolelli, L. Lusvarghi and P.
Vuoristo, “Research on icing behavior and ice adhesion testing of icephobic
surfaces,” in IWAIS, Uppsala, 2015.
[179] TopNano, “TopNANO - Top-level nanoscale coatings and surface treatment to
prevent and combat condensation of water, ice formation, ice growth and
adhesion with applications in aircraft, wind turbines and heat exchangers for
improved energy efficiency,” Internal final reprot, 2014.
[180] H. Endo, S. Kimura and I. Nakane, “Behavior of a Small Water Droplet on a
Superhydrophobic Coating in a Cold Environment,” in IWAIS, St. Johns, 2013.
[181] A. Swerin, “Breaking the ice using passive anti-icing coatings – Lessons learned
from the Nordic TopNANO research project,” in WinterWind conferece, Piteå,
2015.
[182] HYDROBOND, “HYDROBOND EU FP7 project (2009-2013),” [Online].
Available: http://hydro-bond.eu/. [Accessed 12 May 2016].
98
[183] WALiD, “WALiD EU FP7 project (2013-2017),” [Online]. Available:
http://www.eu-walid.com/. [Accessed 12 May 2016].
[184] SANAD, “SANAD EU FP7 project (2013-2017),” [Online]. Available:
http://www.sanadproject.eu/. [Accessed 12 May 2016].
[185] TOPNANO, “TOPNANO Nordic Energy Research project (2010-2014),”
[Online]. Available: http://www.topnano.se/en/Sidor/default.aspx. [Accessed 12
May 2016].
[186] T. Wogan, “Best icephobic coating ever created gives ice the slip,” [Online].
Available: http://www.rsc.org/chemistryworld/2016/03/icephobic-coating-
polymer. [Accessed 12 May 2016].
[187] A. Camion, “Wind Turbine Operation Optimization under icing and cold
climate,” in 8th Quebec Wind Energy Conference, Gaspé, 2014.
[188] T. Léger, “Operational Strategies in Cold and Harsh Climates,” in CANWEA
O&M Summit, Toronto, 2015.
[189] J. Nelson, “L'expérience de TransAlta avec le givrage des pales,” in Quebec's
6th Wind Energy Conference, Carleton-sur-Mer, 2012.
[190] J. Nelson, “TransAlta's Experience with Blade Icing,” in WinterWind, Sundsvall,
2014.
[191] D. Bolduc, “A look at wind turbine performance in Canadian icing climate,” in
WinterWind, Åre, 2016.
[192] Repower, “Operational experience of REpower MM-CCV under icing
conditions,” in WinterWind, Skellefteå, 2012.
[193] L. A. Karlberg, New de-icing systems go live, Pitea: WinterWind Conference
Program Book, 2015.
[194] H. Winkelmeier, “WF Moschkogel in the Austrian Alps,” in Ice & Rocks III
conference, Zadar, Croatia, 2010.
[195] TÜV Nord, “For assessment of the functionality of ice detection systems to
prevent ice throw at ENERCON wind energy converters. Ice detection system
based on the ENERCON power curve method,” Hamburg, 2014.
[196] R. Lemoine, “Using operational data to overcome the challenges of icing
variability - Enercon Gries Project,” in WindPower Monthly's Optimising Wind
Farms in Cold Climates forum, Helsinki, 2014.
99
[197] T. Burchart, “Operational Experiences and Challenges during Icing Conditions,”
in IQPC Anti-Icing for Wind Turbines conference, Hamburg, 2015.
[198] R. Lemoine, “Operating Wind turbines in extreme icing conditions: lessons
learned from the Gries project,” in IQPC Anti-Icing for Wind Turbines
conference, Hamburg, 2015.
[199] K. Roloff, “Enercons experiences in operating wind turbines under icy
conditions,” in IQPC Anti-Icing for Wind Turbines conference, Hamburg, 2015.
[200] K. Roloff, “Performance of ENERCON turbines under icing conditions of
different severity,” in WindPower Monthly's Optimising Wind Farms in Cold
Climates forum, Helsinki, 2015.
[201] Lagerwey, “Lagerwey,” Lagerwey, 2015. [Online]. Available:
http://www.lagerwey.com/. [Accessed 4 March 2016].
[202] J. Birkemeyer, “Anti-Icing System on Nordex wind turbines - qualification with
focus on lightning protection,” in Wind Turbine Blade manufacturer conference,
Düsseldorf, 2014.
[203] N. Lehming, “NORDEX OPERATION EXPERIENCE IN COLD CLIMATE,”
in Windpower Monthly's Optimizing Wind Farms in Cold Climates forum,
Helsinki, 2015.
[204] B. Radowitz, “Recharged IN DEPTH: The cold-climate market is hotting up,”
February 2016. [Online]. Available:
http://www.rechargenews.com/wind/1422120/in-depth-the-cold-climate-market-
is-hotting-up. [Accessed 4 May 2016].
[205] Northern Power Systems, “NPS 100C turbine model,” Northern Power Systems,
[Online]. Available: http://www.northernpower.com/products/nps100/.
[Accessed 8 March 2016].
[206] A. Camion, “Wind turbine operation optimization under icing and cold climate,”
in Wind optimization, maintenance and repair summit, Wind Energy Update,
Toronto, 2014.
[207] C. Bolduc, “Cold Climate Operation,” in CanWEA Operation & Maintenance
Summit, Toronto, 2015.
[208] Senvion, “Senvion launches 3.2M114 for Canadian market,” 30 October 2014.
[Online]. Available: https://www.senvion.com/global/en/press-media/press-
releases/detail/repower-installs-worlds-largest-wind-turbine-in-brunsbuettel-
schleswig-holstein-1/. [Accessed 16 October 2015].
100
[209] Siemens, “Analysis of Siemens de-icing system (report no: KVT/HS/2013/R04)
[available upon request],” 2013.
[210] D. Shymanski, “Anti-Icing/de-icing solution developments,” in WinterWind,
Umeå, 2011.
[211] Kelly Aerospace Thermal Systems, “Wind Turbine Ice Protection System,”
2011. [Online]. Available:
http://www.kellyaerospace.com/wind_turbine_deice.html
http://www.kellyaerospace.com/thermalsystems/wind_turbine_ice_protection.ht
ml. [Accessed 23 October 2015].
[212] E. Pederson and H. Gedda, “Wind Turbine Ice Protection System (WTIPS),” in
WinterWind, Norrköping, 2008.
[213] E. Pederson and H. Gedda, “Wind Turbine Ice Protection System (WTIPS),” in
IWAIS, Andermatt, 2009.
[214] G. Ronsted, “The rapidly growing interest in wind energy in cold climates,” in
VindKraftNet, Malmö, 2011.
[215] ADIOS Patent Gmbh, “ADIOS Patent Anti- and de-ice Operating System,”
[Online]. Available: http://www.adios-patent.de/index.php/en/home-2.
[Accessed 24 February 2016].
[216] ADIOS Patent Gmbh, “ADIOS brochure,” http://www.adios-
patent.de/pdf/ADIOS-Product_Datasheet_EN.pdf, Hamburg, 2015.
[217] R. Cattin, S. Kunz, A. Heimo, G. Russi, M. Russi and M. Tiefgraber, “Wind
Turbine Ice Throw Studies in the Swiss Alps,” EWEC 2007, 7 to 10 April,
Milano, Italy, 2007.
[218] R. Cattin, “Ice throw studies, Gütsch and St. Brais,” 8. Februar 2012. [Online].
Available:
http://winterwind.se/2012/download/6b_winterwind_icethrow_cattin.pdf.
[219] A. Krenn and et al, “Risk of Icefall in the international context,” Sundsvall,
Sweden, 2014.
[220] M. Wadham-Gagnon and e. al, “IEA task 19 - Ice throw guidelines,” in
WinterWind conference, Piteå, 2015.
[221] H. Seifert, A. Westerhellweg and J. Kröning, “Risk analysis of ice throw from
wind turbines,” BOREAS VI, 9 to 11 April 2003, 2003.
101
[222] B. Tammelin, M. Cavaliere, H. Holtinnen, C. Morgan, H. Seifert and K. Säntti,
“Wind Energy in Cold Climate,” Final Report WECO Finnish Meteorological
Institute, Helsinki, Finland, February 2000., 2000.
[223] A. Franks, R. Whitehead, P. Crossthwaite and L. Smail, “Application of QRA in
operational safty issues,” Crown copyright, Norwich NR3 1BQ, 2002.
[224] A. Krenn and et al, “IEA Task19, Standardized methodology for the elaboration
of the ice throw risk assessments,” in Winterwind 2016, Are, Sweden.
[225] R. Cattin, S. Koller and U. Heikkilä, “ICING AT ST. BRAIS AND MONT
CROSIN,” in Executive summary for Swiss Federal Office of Energy SFOE,
Bern, 2016.
[226] C. Morgan, “Assessement of safety risks arising from wind turbine icing,” in
EWEC, Dublin, 1997.
[227] C. Morgan, E. Bossanyi and H. Seifert, “Assessement of safety risks arising
from wind turbine icing,” in Boreas IV, 1998.
[228] H. Seifert and A. Westerhellweg, “Risk Analysis of Ice throw from wind
turbines,” in Boreas, Pyhätunturi, 2003 (A).
[229] R. Bredesen and H. Refsum, “Methods for evaluating risk caused by ice throw
and ice fall from wind turbines and other tall structures,” in IWAIS conference,
Uppsala, 2015.
[230] R. Bredesen, “Ice risk forecast system for operational wind farms,” in
WinterWind, Åre, 2016.
[231] B. Göransson and D. Haaheim, “Swedish Wind Energy Associations view on
wind energy in cold climates,” in WinterWind, Åre, 2016.
[232] B. Boucher, “Access to Wind Turbines During Winter Months,” in Wind Energy
Update Operation and Maintenance Summit, Toronto, 2014.
[233] R. Roy, “Caribou Wind Parc (CWP) Ice Mitigation R&D Overview,” in Wind
Optimization, Maintenance and Repair Summit, Toronto, 2014.
[234] B. Brailey, “Validation of New Model for Short-Term Forecasting of Turbine
Icing - Using SCADA data from Scandinavian wind farms,” in Winterwind,
Piteå, Sweden, 2015.
[235] J. Persson, H. Körnich, B. Stensen, E. Olsson, H. Bergström and A. Sjöblom,
“Probabilistic forecasting of icing and production losses,” in Winterwind, Piteå,
102
2015.
[236] N. Davis, A. Hahmann, N. Clausen, M. Žagar and P. Pinson, “Forecasting
Production Losses by Applying the Makkonen Icing Model to Wind Turbine
Blades,” in The 15th International Workshop on Atmospheric Icing of
Structures, St. John’s, Newfoundland and Labrador, Canada, 2013.
[237] J. Yang, W. Yu, J. Choisnard, A. Forcione and S. Antic, “Forecast of icing
events at a wind farm in Sweden,” Journal of Applied Meteorology and
Climatology, pp. 262-281. http://doi.org/10.1175/JAMC-D-13-09.1, 2014.
[238] Schipper, Jarno ;, “Icing forecast for wind turbine - Vereisungsvorhersage für
Windenergieanlagen,” DNV GL, 2015.
[239] Ø. Byrkjedal, R. E. Bredesen and A. Line Løvholm, “Operational forecasting of
icing and wind power at cold climate sites,” in Winterwind, Sundsvall, 2014.
[240] Ø. Byrkjedal , “Icing forecast,” Kjeller Vindteknikk, [Online]. Available:
http://www.vindteknikk.com/services/analyses/wind-power/post-
construction/icing-forecast. [Accessed 01 12 2015].
[241] T. Karlsson, V. Turkia, T. Wallenius and J. Miettinen, “Production Loss
estimation for wind power forecasting,” in Winterwind, Sundsvall, Sweden,
2014.
[242] R. Oechslin, “Wind power forecasting considering icing,” Institute of
meteorology and geophysics university of Innsbruch, Austria, 2011.
[243] E. Gregow, B. Bernstein, I. Wittmeyer and J. Hirvonen, “LAPS–LOWICE: A
Real-Time System for the Assessment of Low-Level Icing Conditions and Their
Effect on Wind Power,” J. Atmos. Oceanic Technol., 32, pp. 1447–1463. doi:
http://dx.doi.org/10.1175/JTECH-D-14-00151.1 , 2015.
[244] B. Bernstein, E. Gregow and I. Wittmeyer, “Innovations in F-LOWICE Real-
Time Forecasts of Wind Power and Icing Effects,” in IWAIS, Uppsala, 2015.
[245] “Services to Wind Power sector - Icing,” Finnish meteorological intitute ,
[Online]. Available: http://en.ilmatieteenlaitos.fi/wind-energy. [Accessed 01 12
2015].
[246] “Icing forecast for wind turbine now possible,” Swedish meteorological and
hydrological institute, [Online]. Available:
http://www.smhi.se/en/research/research-news/icing-forecasts-for-wind-
turbines-now-possible-1.85372. [Accessed 01 12 2015].
103
[247] “Icing,” VORTEX, [Online]. Available:
http://www.vortexfdc.com/solutions/icing.html. [Accessed 01 12 2015].
[248] “Icing,” WeatherTech, [Online]. Available:
http://www.s1106835.crystone.net/?q=en/node/11. [Accessed 01 12 2015].
[249] “Wind Turbine Weather,” Leading Edge Atmospherics, [Online]. Available:
http://icingweather.com/whatwedo/windturbine. [Accessed 01 12 2015].
[250] IEC, “IEC 61400-3:2005 (ed1) Wind turbines - Part 3: Design requirements for
offshore turbines,” IEC, 2005.
[251] G. Lloyd, “GL Wind-Technical Note 067: Certification of Wind Turbines for
Extreme Temperatures (here: Cold Climate),” Germanischer Lloyd, Hamburg,
2011.
[252] G. Lloyd, “Guideline for the Certification of Wind Turbines,” Germanischer
Lloyd, Hamburg, 2004.
[253] Germanischer Lloyd, Guideline for the certification of wind turbines, 2010 ed.,
Hamburg: Germanischer Lloyd Industrial Services GmbH, Renewables
certification, 2010.
[254] SAE International, “SAE AIR 5666: Icing Wind Tunnel Interfacility
Comparison Tests,” SAE, 2012.
[255] CSA (Canadian Standards Association), “CSA-S37-01 "Antennas, Towers, and
Antenna-Supporting Structures,” CSA, Toronto, 2001.
[256] DIBt (Deutche Institut fur Bautechnik), “Richtlinie für Windenergieanlagen
Einwirkungen und Standsicherheitsnachweise,” DIBt, Berlin, 2012.
[257] P. Jordaens, “Cold climate issues for wind turbine machinery,” Windtech
International magazine, vol. 2, no. 1, pp. 17-19, 2015.
[258] Deutsche WindGuard Wind Tunnel Services GmbH, “Wind Tunnel Centre
Services,” Deutsche WindGuard Engineering GmbH, [Online]. Available:
http://www.windtunnelcentre.com/services.html#none. [Accessed 1 March
2016].
[259] Deutsche WindGuard Engineering GmbH, “Contact,” Deutsche WindGuard
Engineering GmbH, 2 3 2016. [Online]. Available:
http://www.windtunnelcentre.com/service/contact.html. [Accessed 2 3 2016].
[260] Deutsche WindGuard GmbH, “Sensor Testing Under Icing Conditions,”
Deutsche WindGuard GmbH, 2 3 2016. [Online]. Available:
104
http://www.windguard.com/services/wind-tunnel-centre/sensor-testing-under-
icing-conditions.html. [Accessed 2 3 2016].
[261] RTA, “Vienna Climatic Wind Tunnel,” Rail Tec Arsenal
Fahrzeugversuchsanlage GmbH (RTA), 2 3 2016. [Online]. Available:
http://www.rta.eu/en/facility/customer-area. [Accessed 2 3 2016].
[262] RTA, “Vienna Climatic Wind Tunnel - Contacts,” Rail Tec Arsenal
Fahrzeugversuchsanlage GmbH (RTA), 2 3 2016. [Online]. Available:
http://www.rta.eu/en/about-us/contact/management. [Accessed 2 3 2016].
[263] RTA, “General Information and Guide for Customers - Climatic / Icing Wind
Tunnel Vienna (ver. 2.3 PDF),” Rail Tec Arsenal Fahrzeugversuchsanlage
GmbH (RTA), Vienna, 2015.
[264] NRC, “3 m x 6 m icing wind tunnel,” National Research Council Canada, 2 3
2016. [Online]. Available: http://www.nrc-
cnrc.gc.ca/eng/solutions/facilities/wind_tunnel/3x6_metre.html. [Accessed 2 3
2016].
[265] D. Orchard, C. Clark and M. Oleskiw, “Development of a Supercooled Large
Droplet Environment within the NRC Altitude Icing Wind Tunnel (2015-01-
2092),” in SAE 2015 International Conference on Icing of Aircraft, Engines and
Structures, Prague, 2015.
[266] D. Fuleki, J. Chalmers and B. Galeote, “Technique for Ice Crystal Particle Size
Measurements and Results for the National Research Council of Canada Altitude
Ice Crystal Test System (2015-01-2125),” in SAE 2015 International Conference
on Icing of Aircraft, Engines and Structures, Prague, 2015.
[267] P. Struk, T. Bartkus, J. Tsao, T. Currie and D. Fuleki, “Ice Accretion
Measurements on an Airfoil and Wedge in Mixed-Phase Conditions,” in SAE
2015 International Conference on Icing of Aircraft, Engines and Structures,
Prague, 2015.
[268] T. Currie, D. Fuleki and C. Davison, “Simulation of Ice Particle Melting in the
NRC RATFac Mixed-Phase Icing Tunnel (2015-01-2107),” in SAE 2015
International Conference on Icing of Aircraft, Engines and Structures, Prague,
2015.
[269] C. Clark and D. Orchard, “Design and Calibration of a New High-Speed Insert
for the NRC Altitude Icing Wind Tunnel,” in SAE 2015 International
Conference on Icing of Aircraft, Engines and Structures, Prague, 2015.
[270] NRC, “Altitude icing wind tunnel,” National Research Council Canada, 2 3
105
2016. [Online]. Available: http://www.nrc-
cnrc.gc.ca/eng/solutions/facilities/wind_tunnel/altitude_icing.html. [Accessed 2
3 2016].
[271] X. Wang, E. L. Bibeau and G. F. Naterer, “Experimental Investigation of Energy
Losses due to Icing of a Wind Turbine,” in International Conference on Power
Engineering - 2007 (23-27.10.2007 China), Hangzhou, 2007.
[272] A. G. Kraj and E. Bibeau, “Icing characteristics and mitigation strategies for
wind turbines in cold climates: accumulation rate,” in Renewable Energy 2006
Makuhari - Japan, Chiba, 2006.
[273] University of Manitoba, “Renewable energy research,” University of Manitoba,
Canada - Mechanical and Manufacturing Engineering Department, 2 3 2016.
[Online]. Available:
http://home.cc.umanitoba.ca/~bibeauel/index.php?pg=Research. [Accessed 2 3
2016].
[274] A. G. Kraj, “ndex of /~bibeauel/research/thesis,” 3 2007. [Online]. Available:
http://home.cc.umanitoba.ca/~bibeauel/research/thesis/2007_Andrea.pdf.
[Accessed 15 03 2016].
[275] “Anti-icing Materials International Laboratory (AMIL),” University of
Chicoutimi, 2012. [Online]. Available: http://www.uqac.ca/amil/en/. [Accessed
8 April 2016].
[276] L. Makkonen, “Ice Adhesion - Theory, Measurements and Countermeasures,”
Journal of Adhesion Science and Technology, vol. 26, no. Ice adhesion, pp. 413 -
445, 2012.
[277] M. Tiihonen, T. Jokela, L. Makkonen and G.-J. Bluemink, “VTT Icing Wind
Tunnel 2.0,” in Winterwind International Wind Energy Conference 2016, Åre -
Sweden, 2016.
[278] V. &. L. Oy, “Labkotec Pre-Certificate,” 22 6 2011. [Online]. Available:
http://www.labkotec.fi/sites/default/files/Labkotec_pre_certificate.pdf.
[Accessed 15 3 2016].
[279] T. Jokela, “Brochure - VTT Icing Wind Tunnel 2.0,” 15 03 2016. [Online].
Available:
http://www.vttresearch.com/Documents/Low%20Carbon%20Energy/Wind%20e
nergy/Icing_Wind_Tunnel_02022016.pdf. [Accessed 15 03 2016].
[280] VTT Ltd - Finland;, “Coating Tests,” 15 03 2016. [Online]. Available:
http://www.vttresearch.com/Documents/Low%20Carbon%20Energy/Wind%20e
106
nergy/Coating_Tests_02022016.pdf. [Accessed 15 03 2016].
[281] C. Stenroos, “PROPERTIES OF ICEPHOBIC SURFACES IN DIFFERENT
ICING CONDITIONS,” Tampere University of Technology, MSc thesis,
Tampere, 2015.
[282] H. Koivuluoto, C. Stenroos, R. Ruohomaa, G. Bolelli, L. Lusvarghi and P.
Vuoristo, “Research on icing behavior and ice adhesion testing of icephobic
surfaces,” in IWAIS, Uppsala, 2015.
[283] Fraunhofer IFAM, “Icing Laboratory With Integrated Wind Tunnel,” 01 2016.
[Online]. Available:
http://www.ifam.fraunhofer.de/content/dam/ifam/en/documents/Adhesive_Bondi
ng_Surfaces/Paint_Lacquer_Technology/ice_lab_en_fraunhofer_ifam.pdf.
[Accessed 15 03 2016].
[284] Fraunhofer Institute for Mnufacturing Technology and Advanced Materials
IFAM, “Icing Laboratory With Integrated Wind Tunnel,” [Online]. Available:
http://www.ifam.fraunhofer.de/content/dam/ifam/en/documents/Adhesive_Bondi
ng_Surfaces/Paint_Lacquer_Technology/ice_lab_en_fraunhofer_ifam.pdf.
[Accessed 16 03 2016].
[285] CARDC, “0.3mx0.2m Icing Wind Tunnel,” China Aerodynamics Research and
Development Center, 27 1 2015. [Online]. Available:
http://www.cardc.cn:88/html/Facility/f6/107.html. [Accessed 15 03 2016].
[286] H. H. Koss, H. Gjelstrup and C. T. Georgakis, “Experimental study of ice
accretion on circular cylinders at moderate low temperatures,” Journal of Wind
Engineering and Industrial Aerodynamics, vol. 12, no. Ice accretion, pp. 104-
106, 540-546, 2012.
[287] C. Demartino, H. H. Koss and F. Ricciardelli, “Experimental study of the effect
of icing on the aerodynamics of circular cylinders – Part I: Cross flow,” in
Proceedings of the 6th European and African Wind Engineering Conference,
Cambridge, UK, 2013.
[288] A. Hudecz, H. Koss and M. O. Hansen, “Accretion on Wind Turbine Blades,” in
Proceedings of IWAIS XV, St. John’s, Newfoundland and Labrador, Canada,
2013.
[289] E. Mattiello, “Aerodynamic forces on a NACA 0015 airfoil section model,” in
Proceedings of the 13th Conference of the Italian Association for Wind
Engineering, Genova, Italy, 2014.
[290] M. B. Eriksen, E. Mattiello and S. . V. Larsen, “The Climatic wind tunnel:
107
Research activities and developments,” in Symposium on the Dynamics and
Aerodynamics of Cables (SDAC), Copenhagen, Denmark, 2014.
[291] E. Mattiello, T. Ingvorsen and S. V. Larsen, “Experimental and Numerical
Simulations of In-Cloud Icing on an Airfoil,” in ICWE 14: 14th International
conference on wind engineering, Porto Alegre, Brazil, 2015.
[292] M. B. Eriksen and S. V. Larsen, “Wind Tunnel Testing of Structural Cables:
Climatic Effects Including Ice Accretion,” in SEWC 2015: 5th Structural
Engineers World Congress, Singapore, 2015.
[293] N. Davis and N.-E. Clausen, “Simulated Ice Growth on a Blade Profile and
Representative Cylinders,” in WinterWind 2015, Piteå, 2015 (2).
[294] FORCE Technology, “Wind Tunnels,” FORCE Technology, [Online].
Available: http://forcetechnology.com/en/all-industry-facilities/wind-tunnel-
facility. [Accessed 15 3 2016].
[295] D. T. C. E. &. A. A. g. (CEAero), “Climatic Wind Tunnel,” DTU , 07 May
2014. [Online]. Available:
http://www.windengineering.byg.dtu.dk/Research/Climatic_Wind_Tunnel.
[Accessed 21 September 2015].
[296] Technology, Force, “Wind Tunnels,” Force Technology, 2014. [Online].
Available: http://forcetechnology.com/en/all-industry-facilities/wind-tunnel-
facility. [Accessed 16 03 2016].
[297] B. Matteo, “Cloud Characterization in CIRA Icing Wind Tunnel,” 2007.
[Online]. Available:
http://www.fedoa.unina.it/1473/1/Bellucci_Ingegneria_Aerospaziale_Navale_e_
della_Qualita.pdf. [Accessed 15 03 2016].
[298] I. A. R. C. -. CIRA, “IWT - Icing Wind Tunnel,” CIRA, [Online]. Available:
http://www.cira.it/en/impianti-en/iwt-icing-wind-tunnel. [Accessed 15 03 2016].
[299] R. Waldman and H. Hu, “High-Speed Imaging to Quantify the Transient Ice
Accretion Process on a NACA 0012 Airfoil,” Journal of Aircraft, vol. DOI:
10.2514/1.C033367, no. Ice accretion process, p. 9, 2015.
[300] K. Zhang, W. Tian and H. Hu, “An Experimental Investigation on the Surface
Water Transport Process over an Airfoil by using a Digital Image Projection
Technique,” Experiments in Fluids, vol. 56:173, no. DOI: 10.1007/s00348-015-
2046-z, p. 16 pages, 2015.
[301] H. Hu and Z. Jin, “An Icing Physics Study by using Lifetime-based Molecular
108
Tagging Thermometry Technique,” International Journal of Multiphase Flow,
Vols. Vol. 36, No.8, no. DOI:10.1016/j.ijmultiphaseflow.2010.04.001, p. 672–
681, 2010.
[302] H. Hu and D. Huang, “Simultaneous Measurements of Droplet Size and
Transient Temperature within Surface Water Droplets,” AIAA Journal, Vols.
Vol.47, No.4, no. http://arc.aiaa.org/doi/pdf/10.2514/1.37158, pp. 813-820,
2009.
[303] H. Li, R. Waldeman and H. Hu, “An Experimental Investigation on Unsteady
Heat Transfer and Transient Icing Process upon Impingement of Water
Droplets,” in AIAA Science and Technology Forum and Exposition
(SciTech2016), San Diego, California, US, 2016.
[304] H. Li, R. Waldman and H. Hu, “An Experimental Investigation on Unsteady
Heat Transfer and Transient Icing Process upon Impingement of Water
Droplets,” in AIAA Science and Technology Forum and Exposition
(SciTech2016), San Diego, California, US, 2016.
[305] Iowa State University - US, “Aircraft Icing Physics and Anti-/De-icing
Technology Laboratory,” College of Engineering | Department of Aerospace
Engineering, [Online]. Available: http://www.aere.iastate.edu/icing/. [Accessed
15 03 2016].
[306] I. S. University, “Advanced Flow Diagnostics and Experimental Aerodynamics,”
College of Engineering / Department of Aerospace Engineering, [Online].
Available: http://www.aere.iastate.edu/~huhui/. [Accessed 15 03 2016].
[307] Iowa State University - News Service, “Iowa State’s icing wind tunnel blows
cold and hard to study ice on wings, turbine blades - See more at:
http://www.news.iastate.edu/news/2014/02/11/icingtunnel#sthash.SWLcFBai.dp
uf,” Iowa State University, US, [Online]. Available:
http://www.news.iastate.edu/news/2014/02/11/icingtunnel. [Accessed 16 03
2016].
[308] National Aeronautics and Space Administration, “NASA´s Aeronautics Test
Pogram - Icing Research Tunnel,” 05 2009. [Online]. Available:
http://facilities.grc.nasa.gov/documents/TOPS/TopIRT.pdf. [Accessed 15 03
2016].
[309] National Aeronautics and Space Administration, “Icing Research Tunnel (IRT),”
NASA, 30 11 2011. [Online]. Available:
http://facilities.grc.nasa.gov/irt/index.html. [Accessed 15 03 2016].
109
[310] National Aeronautics and Space Administration, “Icing Research Tunnel,”
NASA, 25 03 2011. [Online]. Available:
http://facilities.grc.nasa.gov/irt/contact.html. [Accessed 15 03 2016].
[311] PennState, “Adverse Environment Rotor Test Stand,” [Online]. Available:
http://www.aero.psu.edu/Facilities/AERTS/. [Accessed 7 April 2016].
[312] S. Gonzalez Ruiz, “Calibration of the VKI Cold Wind Tunnel by Interferometric
Laser Imaging,” in SAE 2015 International, Conference on Icing of Aircraft,
Engines and Structures, Prague, Czech Republic, 2015.
[313] The Von Karman Institute, “Low Speed Wind Tunnels - Cold Wind Tunnel
CWT-1,” VKI, 2009. [Online]. Available:
https://www.vki.ac.be/index.php/research-consulting-mainmenu-107/facilities-
other-menu-148/low-speed-wt-other-menu-151/63-cold-wind-tunnel-cwt-1.
[Accessed 16 03 2016].
[314] The Von Karman Institute, “Home,” VKI, 2009. [Online]. Available:
https://www.vki.ac.be/. [Accessed 16 03 2016].
[315] D. Hammond, “The Cranfield University Icing Tunnel,” in 41st Aerospace
Sciences Meeting and Exhibit, Aerospace Sciences Meeting
(http://dx.doi.org/10.2514/6.2003-901), Reno, Nevada, US, 2003.
[316] Cranfield University, UK, “Icing Tunnel,” Cranfield University, 2016. [Online].
Available: https://www.cranfield.ac.uk/About/People-and-
Resources/resources/facilities/soe/Icing-Tunnel. [Accessed 16 03 2016].
[317] Cranfield University, “Icing Tunnel - Overview of Icing Tunnel (PDF, Link),”
2016. [Online]. Available: https://www.cranfield.ac.uk/About/People-and-
Resources/resources/facilities/soe/Icing-Tunnel. [Accessed 16 03 2016].
[318] K. Shigeo, Y. Yamagishi, H. Morikawa, K. Tetsuya, S. Tekeshi, T. Aaltio, H.
Valo and J. Hietanen, “De-Icing Testing and Development of Ultrasonic
Windsensor For Cold Climate,” in Winterwind 2013 International Wind Energy
Conference, Östersund, Sweden, 2013.
[319] S. Kimura, T. Sato, Y. Yamagishi and A. Heimo, “Calibration of the off-the-
shelf ice detectors by icing wind tunnel test,” in COST727 Action, Prague, 2008.
[320] S. Kimura, A. Sakabe, T. Sato and Y. Yamagishi, “Icephobic coating for
prevention of secondary icing,” in Winterwind International Conference,
Norrkoping, Sweden, 2008.
[321] S. Kimura, T. Sato, Y. Yamagishi and H. Morikawa, “Evaluation of ice detecting
110
sensors by icing wind tunnel test,” in Proceedings of 13th International
Workshop on Atmospheric Icing on Structures, Andermatt, Switzerland, 2009.
[322] S. Kimura, A. Sakabe and H. Sakaue, “A Note on Icing Wind Tunnel Test,” in
Proceedings of the 49th Aircraft Symposium, The Japan Society for Aeronautical
and Space Sciences JSASS-2011-5166,, Kanazawa, Japan, 2011.
[323] K. Morita, K. Okamoto, S. Kimura and H. Sakaue, “Hydrophobic Coating Study
for Anti-icing Aircraft,” in SAE 2011 International Conference on Aircraft and
Engine Icing and Ground Deicing, SAE International, 2011-38-0010, Chicago,
US , 2011.
[324] H. Endo, S. Kimura, Y. Yamagishi and I. Nakane, “Behavior of a small water
droplet on superhydrophobic coating in a cold environment,” in 15th
International Workshop on Atmospheric Icing of Structures, New Foundland,
Canada, 2013.
[325] H. Endo, S. Kimura, M. Hasegawa, Y. Yamagishi and T. Tanaka, “Analysis of
minute water droplet’s freezing process on coated surface,” SAE International
Journal of Aerospace, Vols. Vol.6, No.2, pp. pp.465-474, 2013.
[326] M. Hasegawa, T. Hyugaji, Y. Yamagishi, S. Kimura, T. Tanaka, K. Morita and
H. Sakaue, “Experimental Investigation of a Single Droplet on a
Superhydrophobic Coating in Icing Wind Tunnel for the Development of Ice-
Protection System,” in The American Institute of Aeronautics and Astronautics
(AIAA), 2014.
[327] Kanazawa University, Japan, “Researcher Information,” Kanazawa University,
Japan, [Online]. Available: http://ridb.kanazawa-
u.ac.jp/public/detail_en.php?id=2332. [Accessed 16 03 2016].
[328] T. Saito, S. Kimura, K. Sato, H. Morikawa, T. Kojima, H. Endo, Y. Yamagishi,
S. Mochizuki and J. Hietanen, “Combined effect of the heating and the
superhydrophhobic coating on the de-icing capability of the ultrasonic wind
sensor,” in Winterwind 2016 International Wind Energy Conference, Åre,
Sweden, 2016.
[329] Zarges, “New CCV lift for wind turbines works down to -40°C,” Zarges, 15
April 2014. [Online]. Available:
http://www.zarges.com/en/company/news/press/news-
detail/?tx_news_pi1%5Bnews%5D=10611&cHash=ef2df801c5bb003c5110201
2e2313ad8. [Accessed 21 September 2015].
[330] A. Mikhails, “Clipper Wind Turbines Receive GL Certification for Cold Climate
111
Operation,” Renewable Energy World Magazine, 2007.
[331] OWI-Lab, “Testing 80 ton of steel to ensure reliable wind power production in
all harsh conditions,” OWI-Lab, [Online]. Available: http://www.owi-
lab.be/content/testing-80-ton-steel-ensure-reliable-wind-power-production-all-
harsh-conditions. [Accessed 09 November 2015].
[332] Nordex, “Nordex submitting turbine components to extended quality testing,”
Nordex, 25 June 2013. [Online]. Available: http://www.nordex-
online.com/index.php?id=53&L=2&tx_ttnews%5Btt_news%5D=2406&tx_ttne
ws%5BbackPid%5D=46&cHash=f2f2a83661. [Accessed 14 December 2014].
[333] Ishibashi, “Gearbox lab with good usability,” Ishibashi, 2015. [Online].
Available: http://www.ishibashi-mfg.com/en/feature/index.html.
[334] Fraunhofer, “Climate chamber,” Fraunhofer, [Online]. Available:
http://www.windenergie.iwes.fraunhofer.de/en/test_centers_laboratories/climate-
chamber.html.
[335] VTT, “Concrete materials for the built environment,” VTT, [Online]. Available:
http://www.vtt.fi/files/research/ama/newmaterials/VTT_concreteA4_2012.pdf.
[Accessed 09 November 2015].
[336] Gamesa, “Gamesa’s climate chamber for testing wind turbines named one of the
'100 best ideas of the year,” Gamesa, March 27 2013. [Online]. Available:
http://www.gamesacorp.com/en/cargarAplicacionNoticia.do?idCategoria=72&id
entificador=969&urlAmigable=gamesas-climate-chamber-for-testing-wind-
turbines-named-one-of-the-100-best-ideas-of-the-year.html. [Accessed 21
September 2015].
[337] Advanced composites & structures center - OFFSHORE WIND
LABORATORY , “DESIGN, FABRICATE, AND TEST UNDER ONE
ROOF,” [Online]. Available:
http://composites.umaine.edu/files/2015/05/UMCompositesCenter_WindBladeT
esting_rev2-9.pdf. [Accessed 09 November 2015].
[338] DTU, “Østerild - National Test Centre for Large Wind Turbines,” DTU,
[Online]. Available:
http://www.vindenergi.dtu.dk/English/About/Oesterild.aspx. [Accessed 09
November 2015].
[339] CENER, “Cener experimental wind farm Alaiz,” CENER, [Online]. Available:
http://www.cener.com/en/wind-energy/wind-experimental-wind-farm-alaiz.asp.
[Accessed 09 November 2015].
112
[340] ECN, “ECN Wind Turbine Test Site Wieringermeer,” ECN, [Online]. Available:
https://www.ecn.nl/fileadmin/ecn/units/wind/docs/EWTW/EWTW_b-08-
014_br.pdf. [Accessed 09 November 2015].
[341] Ecofys, “Test Site Lelystad,” Ecofys, [Online]. Available:
http://www.ecofys.com/nl/project/test-site-lelystad/. [Accessed 09 November
2015].
[342] F. Technologies, “FT Wind Sensor: Winter testing,” FT Technologies, [Online].
Available:
http://www.fttech.co.uk/ufiles/file/Articles/FT_at_Technocentre_Winter_2013_
Web.pdf. [Accessed 2015 November 09].
[343] M. Lindholm, “Comparing Ice-Detector Systems Through Data Analysis:
Moulded On Blades Versus Static Systems,” in Wind Power Monthly Event:
Optimising wind farms in cold climate, Helsinki , 2014.
[344] Alstom, “Alstom announces an exclusive R&D cooperation with Lappeenranta
University of Technology in Finland at the inauguration of its first wind farm in
the Nordic region,” Alstom, [Online]. Available: http://www.alstom.com/press-
centre/2013/8/alstom-announces-an-exclusive-rd-cooperation-with-lappeenranta-
university-of-technology-in-finland-at-the-inauguration-of-its-first-wind-farm-
in-the-nordic-region/. [Accessed 2015 November 09].
[345] “4 MW wind farm,” TechnoCentre éolien, [Online]. Available:
https://www.eolien.qc.ca/en/infrastructures-en/repower-wind-turbines.html.
[Accessed 09 Novemner 2015].
[346] Enercon , “Wind energy in cold climate: experience in Sweden and the world !,”
in Winterwind, Piteä, 2015.
[347] D. S. D. R. G. M. M. S. K. R. C. Dr. Ulla Heikkilä, “Performance of Enercon
wind turbines under icing conditions in Europe,” in EWEA , Paris, 2015.
[348] Blaiken Vind, [Online]. Available: http://www.blaikenvind.se/?lang=en.
[Accessed 12 May 2016].
[349] J. Beurskens, “R&D as a prerequisite for successfully utilising the cold climate
wind energy market oppotunities,” in WinterWind conference, Piteå, 2015.
[350] J. Beurskens and S.-E. Thor, “Summary WinteWind 2015,” in WinterWind
conference, Piteå, 2015.
[351] V. Lehtomäki, “Web-survey results & Panel,” in Winterwind 2016, Åre, 2016.
113
[352] Y. Odemark, “An overview of Vattenfalls research within turbine icing -
Yesterday and tomorrow,” in Winterwind 2016, Åre, 2016.
[353] P.-J. Rigole, “The Swedish Energy Agency strategy within wind energy,” in
Winterwind 2016, Åre, 2016.
[354] D. Fouquet and D. Gustafsson, “Summary of Winterwind 2106,” in Winterwind
2016, Åre, 2016.
[355] V. Lehtomäki, “Overview of IEA wind Task19 results from 2013-2015,” in
Winterwind 2016, Åre, 2016.
[356] R. Cattin, “Validation of the IEA Task 19 ice site classification,” in Winterwind
2016, Åre, 2016.
[357] J. Hansson, J. Lindvall and U. Turkyilmaz, “Methods for estimation of occurred
icing losses in operational wind farms - measurements and modeling,” in
Winterwind 2016, Åre, 2016.
[358] S. Rissanen and J. Heinonen, “Simulations of drifting sea ice loads on offshore
wind turbine support structures,” in Winterwind 2016, Åre, 2016.
[359] V. Lehtomäki, S. Rissanen, D. Bolduc, N. Davis, R. Klintström, S. Dierer, R.
Gugerli and U. Heikkilä, “Standardized method to evaluate production losses
due to icing using only SCADA data “T19IceLossMethod”,” in WinterWind
conference, Piteå, 2015.
[360] T. Karlsson, “Validation of icing atlases based on SCADA data,” in Winterwind
2016, Åre, Åre.
[361] S. Liléo, “Mast measurements in cold climates- Challenges and
recommendations,” in Winterwind 2016, Åre, 2016.
[362] T. Beckford, “Update of DNV GLs empirical icing map of Sweden and
methodology of estimating icing losses using further Nordic wind farm data,” in
Winterwind 2016, Åre, 2016.
[363] L. Johansson, “Frozen anemometers and bias in the wind resource,” in
Winterwind 2016, Åre, 2016.
[364] M. Baltscheffsky, S. Söderberg, M. Wadham Gagnon and N. Swytink-Binnema,
“Towards validation of microphysics schemes in numerical weather prediction
models for icing applications,” in Winterwind 2016, Åre, 2016.
[365] E. Olsson, H. Körnich, J. Persson Söderman, B. Stensen, P. Undén and H.
Bergström, “Uncertainty quantification for wind power forecasts in cold
114
climates,” in Winterwind 2016, Åre, 2016.
[366] B. Martinez and P. J. Trombe, “Benchmark study of icing forecasts - Do they
really add a value,” in Winterwind 2016, Åre, 2016.
[367] L. Makkonen, “Models for the growth of rime, glaze, icicles and wet snow on
structures,” Ice and Snow Accretion on Structures, vol. 358, no. 1776, pp. 2913-
2939, November 2000.
[368] M. C. Pedersen, M. W. Gagnon, H. Sørensen and B. Martinez, “On-site
measurement from cold climate - possibilities and applications towards
validation of CDF model,” in Winterwind 2016, Åre, 2016.
[369] B. Messinger, “Equilibrium temperature of an unheated icing surface as a
function of air speed,” Lockheed Aircraft Corporation, I.A.S., Los Angeles, USA,
1953.
[370] W. Habashi and G. McClure, “Cross-fertilizing the technologies of atmospheric
icing on structures and in-flight structural icing,” in IWAIS 2011, Chongqing,
China, 2011.
[371] H. Bergström and G. Bergström, “Doing a meso-scale re-analysis using the
WRF-model - does it matter for the resulting icing climatology which version of
WRF you use?,” in Winterwind 2016, Åre, 2016.
[372] T. Saito, S. Kimura, K. Sato, H. Morikawa, T. Kojima, H. Endo, Y. Yamagishi,
S. Mochizuki and J. Hietanen, “Combinded effect of the heating and the
superhydrophobic coating on the deicing capability of the ultrasonic wind
sensor,” in Winterwind 2016, Åre, 2016.
[373] E. Lindblom, “In Situ Instrument AB - your overall partner when it comes to
measuring wind in any environment,” in Winterwind 2016, Åre, 2016.
[374] P. Jonsson and B. Ollars, “Monitoring systems for harsh climate,” in Winterwind
2016, Åre, 2016.
[375] T. Beckford, “ESTIMATING ENERGY LOSSES CAUSED BY BLADE
ICING FROM PRE-CONSTRUCTION WIND DATA,” in WinterWind
conference, Piteå, 2015.
[376] J. Miettinen, “On the influences of icing on regional forecast errors,” in
WinterWind conference, Piteå, 2015 (2).
[377] S. Söderberg and M. Baltscheffsky, “Analysis of spatial and temporal variability
in icing conditions and production losses due to icing using a new long-term
115
icing climate database,” in WinterWnd 2015, Piteå, 2015 (2).
[378] T. Karlsson, “Lidar as ice detector,” in WinterWind 2015, Piteå, 2015.
[379] E. Aslund, “GAMESA solutions for Cold Climate Conditions,” in WinterWind
2015, Pitea, 2015.
[380] M. Galbiati, “Prediction of production losses in cold climates and ice protection
system de- sign by computational fluid dynamics,” in Winterwind 2016, Åre,
2016.
[381] N. Rehfeld, “Assessment of de-icingandanti-icing technologies in ice wind
tunnel,” in Winterwind 2016, Åre, 2016.
[382] A. M. Nodeland, “ENERCON experiences with wind energy turbines in icing
conditions,” in Winterwind 2016, Åre, 2016.
[383] B. D. Nielsen, “Vestas cold climate offerings to cope with icing conditions,” in
Winterwind 2016, Åre, 2016.
[384] A. Skovgaard Sørensen, “Improving output in harsh conditions,” in Winterwind
2016, Åre, 2016.
[385] A. Beyer, “Nordex Anti-Icing System on N131 wind turbines - development and
validation,” in Winterwind 2016, Åre, 2016.
[386] H. Zhong, “Dongfang experience in low temperature wind turbine de-icing,” in
Winterwind 2016, Åre, 2016.
[387] J. Van den Broecke, “An experimental study on the use of nanosecond pulsed
dielectric barrier discharge plasma actuators for de-icing of aerospace structure,”
in Winterwind 2016, Åre, 2016.
[388] M. Wadham Gagnon, N. Swytink-Binnema, C. Arbez, D. Bolduc and C. Godrea,
“Ice detection methods and measurements,” in Winterwind 2016, Åre, 2016.
[389] K. Satoh, S. Kimura, T. Saito, H. Morikawa, T. Kojima and H. Endo, “Wet-
snow production and snowing wind tunnel test for snow accretion and
prevention,” in Winterwind 2016, Åre, 2016.
[390] S. Shoja, V. Berbyuk and A. Boström, “An approach in using guided waves for
ice detection on wind turbines,” in Winterwind 2016, Åre, 2016.
[391] D. Futter, “Wind turbine ice detection systems testing,” in Winterwind 2016,
Åre, 2016.
116
[392] M. Moser and T. Schlegl, “Real-world icing distribution analysis based on data
from surface sensors,” in Winterwind 2016, Åre, 2016.
[393] M. Tiihonen, V. Lehtomäki and P. Suopajärvi, “Ice detection via advanced
infrared image analysis,” in Winterwind 2016, Åre, 2016.
[394] T. Muukkonen, “Recent development on blade mounted and nacelle mounted ice
detectors,” in Winterwind 2016, Åre, 2016.
[395] Z. Khadiri-Yazami, C. Scholz, A. Baier, T. Tang and M. Durstewitz,
“Classification based approach for icing detection,” in Winterwind 2016, Åre,
2016.
[396] Ø. Byrkjedal, B. E. K. Nygaard, Ø. Welgaard and Ø. Byrkjedal, “New advances
in icing measurements and icing predictions,” in Winterwind 2016, Åre, 2016.
[397] T. Muukkonen, “Experiences from blade-mounted Ice detector development,” in
WinterWind conference, Piteå, 2015.
[398] L. K. Eppanapelli, J. Casselgren and S. Rosendahl, “Detection of different
phases of water on a wind turbine blade using a NIR camera and three IR
wavelengths,” in WinterWind conference, Piteå, 2015.
[399] D. Brenner, “1,500 operational Years of Icing on Wind Turbines –A Long Term
Study,” in WinterWind conference, Piteå, 2015.
[400] D. Bolduc, M. Wadham-Gagnon, J. Petersen, H. Friedrich and A. Camion, “Ice
Monitoring for R&D projects,” in WinterWind conference, Piteå, 2015.
[401] M. Moser, T. Schlegl and H. Zangk, “On the variability of temperature and icing
status over the blades of a wind turbine,” in WinterWind conference, Piteå, 2015.
[402] S. Rydholm, “Measuring Air Liquid Water Content by Shadowgraph Image
Analysis for Wind Turbine Icing Detection,” in WinterWind conference, Piteå,
2015.
[403] K. Hynynen, I. Romero, S. Afanasyeva, J. Armet and O. Pyrhönen, “Perfomance
of two nacelle-mounted ice detectors a case study,” in Winterwind 2016, Åre,
2016.
[404] A. Sandve and T. Nielsen, “Integrated approach to saftey and asset performance
in cold climates,” in Winterwind 2016, Åre, 2016.
[405] S. Meyer, “North Asia driving the wind industry,” in Winterwind 2016, Åre,
2016.
117
[406] A. Krenn, N. Clausen, N. Davis, M. Wadham-Gagnon, V. Lehtomäki, R. Cattin,
G. Ronsten, H. Wickman, R. Klintström, Z. Khadiri and P. Jordaens, “IEA
Task19 standardized methodology for the elaboration of the ice throw risk
assessments,” in Winterwind 2016, Åre, 2016.
[407] R. E. Bredesen, “Ice risk forecast system for operational wind farms,” in
Winterwind 2016, Åre, 2016.
[408] N. Lawal, “Cost effective system for ice throw detection,” in Winterwind 2016,
Åre, 2016.
[409] D. Brenner, “Determination of the actual ice mass on wind turbine blades
Measurments and methods for avoiding excessive icing loads threads,” in
Winterwind 2016, Åre, 2016.
[410] R. Hann, “Applications of iced wind turbines noise simulations,” in Winterwind
2016, Åre, 2016.
[411] L. Aldén and A. Barney, “Decommissioning of wind farms - ensuring low
environmental impact,” in Winterwind 2016, Åre, 2016.
[412] H. A. Refsum and R. Bredesen, “Methods for evaluating risk caused by ice
throw from wind turbines,” in WinterWind conference, Piteå, 2015.
[413] F. Storck, “Influence of wind conditions under icing conditions on the result of a
risk assessment,” in WinterWind, Piteå, 2015.
[414] R. Cattin, “Operation of wind parks under icing conditions,” in WinterWind
conference, Piteå, 2015.
[415] CCOHS, “Cold Environments - Working in the Cold,” 11 April 2016. [Online].
Available: http://www.ccohs.ca/oshanswers/phys_agents/cold_working.html.
[416] R. Buils, “Urbano Quantifying the impact of ice accretion on turbine life for
typical Scandinavian sites using numerical modelling,” in Winterwind 2016, Åre,
2016.
[417] D. Bolduc, M. Wadham-Gagnon, C. Godreau, N. Swytink-Binnema, C.
Golombek and H. Friedrich, “A look at wind turbine performance in Canadian
icing climate,” in Winterwind 2016, Åre, 2016.
[418] G. Nilsson, “Blade heat system repair part II,” in Winterwind 2016, Åre, 2016.
[419] D. Gustafsson, “Moving forward in a frosty market,” in Winterwind 2016, 2016.
118
[420] H. MacDonald, M. Stack and D. Nash, “Assessing the likelihood of hail impact
damage on wind turbine blades,” in Winterwind 2016, Åre, 2016.
[421] A. Leskinen, “WIND PARK DEVELOPMENT - Long-term on-line sound
monitoring,” in WinterWind conference, Piteå, 2015.
[422] R. Hann, “Simulating Iced Wind Turbine Noise,” in WinterWind conference,
Piteå, 2015.
[423] M. Muckermann, “Benchmark of ice noise modelling,” in WinterWind
conference, 2015, 2015.
[424] E. Olsson, “High resolution forecast maps of production loss due to icing,” in
WinterWind 2015, Piteå, 2015.
[425] Newcom Group (presented by Meyer, Sebastian), “Salkhit Wind Farm
Background,” in Winterwind 2016, Åre, 2016.
[426] D. Fouquet, “The European Commissions Winter Package and the latest
developments regarding cooperation and market integration of renewable
energy,” in Winterwind 2016, Åre, 2016.
[427] S. Uski and S. Niskanen, “Temperature and wind influence on power
transmission capability of power lines in the vicinity of cold climate wind farms
- case studies in Finland,” in WinterWind conference, Östersund, 2013.
[428] H. E. Addy, “Ice accretions and icing effects for modern airfoils, NASA/TP-
2000-210031, DOT/FAA/AR–99/89,” NASA, Cleveland, Ohio, 2000.
[429] J. Miettinen, H. Holttinen, T. Karlsson, Ø. Byrkjedal and M. Kiudulas, “On the
influences of icing on regional forecast errors,” in Winterwind, Piteå, 2015.
[430] Ø. Byrkjedal and S. Lileo, “Icing forecast,” Kjeller Vindteknikk, [Online].
Available: http://www.vindteknikk.com/services/analyses/wind-power/post-
construction/icing-forecast. [Accessed 06 2015].
[431] L. Battisti, “Optimizing wind turbine design for operation in cold climates,”
Wind Energy Systems, pp. 388-460, 2011.
[432] L. Battisti, R. Fedrizzi, M. Rialti and S. Dal Savio, “A model for the design of
hot-air based wind turbine ice prevention system,” in WREC05, Aberdeen, UK,
2005.
[433] “Infralytic,” Infralytic, [Online]. Available: http://www.infralytic.de/. [Accessed
14 01 2016].
119
[434] N. Davis, N.-E. Clausen, A. Hahmann, P. Pinson, M. Žagar, Ø. Byrkjedal, T.
Karlsson, T. Wallenius, V. Turkia, S. Söderberg and M. Baltscheffsky, “IceWind
Inter-comparison of Icing Production Loss Models,” in Winterwind, Sundsvall,
Sweden., 2014.
[435] N. Davis, N. Pinson, A. Hahmann, N. Clausen and M. Žagar, “Identifying and
characterizing the impact of turbine icing on wind farm power generation,” Wind
Energy, p. n/a–n/a. http://doi.org/10.1002/we.1933, 2015.
[436] M. Baltscheffsky, “Modelling of production losses due to icing for individual
turbines in a wind farm - development of techniques for forecasting and site
assessment.,” in Winterwind, Östersund, Sweden, 2013.
[437] Ø. Byrkjedal, “The benefits of forecasting icing on wind energy production,” in
Winterwind, Skellefteå, Sweden, 2012.
[438] N. Davis, A. Hahmann, N. Clausen and M. Žagar, “Forecast of icing events at a
wind farm in Sweden,” Journal of Applied Meteorology and Climatolo, pp. 262–
281. http://doi.org/10.1175/JAMC-D-13-09.1, 2014.
[439] B. Göransson and D. Haaheim, “Swedish Wind Energy Associations view on
wind energy in cold climates,” in Winterwind 2016, Åre, 2016.