Embed Size (px)
Citation preview
Wimmera Bird Monitoring Report Report prepared by: Wimmera Catchment Management Authority 24 Darlot St Horsham, VIC, 3400 19 August 2013


Wimmera CMA – working for a healthy Wimmera catchment
1
Publication details Wimmera Bird Monitoring Report. Birds as indicators of catchment condition. ISBN: xxxx xxxx xxxx xxxx Date of publication: 19 August 2013 Author: Jonathan Starks
Acknowledgements This project was funded by xxx
Wimmera Catchment Management Authority www.wcma.vic.gov.au 24 Darlot Street Horsham VIC 3400 PO Box 479 Horsham VIC 3402 Telephone 03 5382 1544 Facsimile 03 5382 6076 Copyright © Wimmera Catchment Management Authority 2011. Disclaimer Publications produced by the Wimmera Catchment Management Authority may be of assistance to you, but the Wimmera Catchment Management Authority and its employees do not guarantee that the publication is without flaw of any kind or is wholly appropriate for your particular purpose and therefore disclaims all liability for any error, loss or other consequence which may arise from you relying on any information in any Wimmera Catchment Management Authority publication.


Wimmera CMA – working for a healthy Wimmera catchment
13
Executive summary
The Wimmera bird monitoring project monitored birds in diverse vegetation communities across the catchment
four times per annum for five years. The data demonstrate that biodiversity values in the Wimmera are best
defined by vegetation community type. Significant geographic variation is apparent in the biodiversity values of
vegetation communities, which can be explained in part by biogeographic differences, but also by differences in
habitat quality. The highest biodiversity values are associated with riparian and riverine habitats, and their
adjacent woodlands. Relatively low biodiversity values are associated with large patches of heathlands and
heathy woodlands, despite being floristically diverse.
This long term monitoring project has confirmed that the composition of bird communities varies significantly
across the Wimmera catchment and because certain species are relatively more abundant in particular vegetation
communities birds can be used as indicators of biodiversity. The results prove that bird monitoring can be used as
a very effective method of assessing biodiversity values across the catchment, of identifying important habitat
types and in highlighting and monitoring catchment condition.

40
Table of contents Executive summary 3
Table of contents 4
1.Introduction 5
2. Aims 6
3. Methods 6
3.1. Site Selection 6
3.2. Bird Surveying 3
3.3. Data Analysis 4
4. Results 6
4.1 Vegetation Community (EVC group) 9
4.3 Patch Size 11
4.4 Isolation 14
4.5 Bioregions 17
4.6 Geographic distribution by local government districts 20
4.7 Species composition 25
4.8 Species as Indicators of biodiversity 26
4.9 Birds as indicators of environmental change 27
5. Discussion 29
6. Management Implications 31
7. Recommendations 32
8. References 33
9. Appendix 1 34
10. Appendix 2 41

Wimmera CMA – working for a healthy Wimmera catchment
13
1. Introduction The Wimmera Catchment Management Authority’s Regional Catchment Strategy (RCS) (2003-2008) identified
monitoring and evaluation as one of its core aspects. Monitoring requirements focussed on identifying baseline
conditions which could be used to evaluate threats, condition and management of assets. The specific
biodiversity assets that were identified for monitoring were native vegetation condition and extent, the distribution
and abundance of fauna (particularly icon or threatened species) and threats to the region’s assets, such as pest
plants and animals.
Indicators of biodiversity present a valuable monitoring tool. Birds represent good indicators of biodiversity
because they are highly visible, active during the day, their ecology and habitat requirements are generally well
known, and their distribution and abundance can reflect environmental conditions (Birds Australia 2003).
In 2003, the Wimmera Catchment Management Authority (WCMA) commissioned Birds Australia (now BirdLife
Australia) to prepare a scoping report which used birds as indicators of the health of the environment and to
address catchment-wide management issues. The report indicated whether bird monitoring could provide a
method to facilitate the integration of biodiversity issues into the regional planning process. The report compared
bird survey data collected by Birds Australia during their first national bird atlas survey (1977–1981) with data
collected during their second atlas survey (1998–2002). Differences in the reporting rates of species between the
two atlas periods were then related to vegetation type, catchment condition, assets, management issues and
threatening processes (Birds Australia 2003).
The results highlighted some significant changes to bird populations in the Wimmera region. Some species
showed a decline in population, such as the Yellow-billed Spoonbill, Jacky Winter, Hooded Robin and Zebra
Finch. Other species showed an increase in population, including the Black-tailed Native-hen, Long-billed
Corella, Musk Lorikeet and Little Raven. These changes were considered to reflect changes in the biodiversity of
the Wimmera environment, including fragmentation and loss of native vegetation, altered agricultural practices,
hydrological changes and increased urbanisation (Birds Australia 2003).
One of the outcomes of the report was that the WCMA develop a long-term bird monitoring program to act as a
basis for biodiversity monitoring within the catchment. The report recommended conducting regular bird surveys
across a range of habitat types, land uses, and management practices. This would provide a means of
measuring relative bird diversity and thus allow catchment biodiversity issues and threatening processes to be
identified (Birds Australia 2003).
In 2004, the WCMA developed a regional monitoring project using birds as indicators of environmental health,
based on the guiding principles established in the Birds Australia report (2003). The project was called the
Wimmera Bird Monitoring Project (WBMP). The premise for the monitoring project was that birds are considered
useful indicators of biodiversity. Healthy ecosystems are usually associated with greater bird diversity, which in
turn, are associated with greater diversity of flora and fauna. Thus, a list of bird species can be representative of
ecosystem health and catchment condition, and indicate the likelihood of the presence of other biota.
40
2. Aims
The aims fo the Wimmera Birds Monitoring Project were to:
Relate observed differences in bird species composition to habitat and land use variables;
Establish a strategy for gauging the success of on-ground management for protecting terrestrial
biodiversity;
Track the condition of WCMA assets as measured by bird communities.
3. Methods 3.1. Site Selection
Monitoring sites were selected randomly within a stratified framework of five parameters - bioregions, ecological
vegetation class (EVC) groups, land tenure, vegetation patch size and degree of isolation. This was done to
ensure design rigour and adequate coverage of bird populations and habitats across the catchment.
There are nine bioregions and 18 different EVC groups within the Wimmera region. Land tenure was divided into
crown land and private, or freehold land. Vegetation patch size and degree of isolation followed the Birds
Australia Atlas methodology (Barrett et al. 2003). The Patch Size categories (measured in hectares) used were:
Small (<10 ha), Medium (10—100 ha) and Large (>100 ha). Degree of Isolation is a measure of the amount of
native vegetation cover (as a percentage) within a radius of 1km around the site. The four categories used were:
Isolated (<20%), Semi-Isolated (20—40%), Not Isolated (40—80%) and Continuous (>80%). An area with a 1km
radius occupies 314.2 hectares meaning that large sites (>100 ha) cannot, by definition, be categorised as
isolated. Similarly, small sites constitute such a small proportion of the total area (<4%) that they are unlikely to
be categorised within continuous vegetation. Areas of no native vegetation were all considered to be continuous
because they were all within cropped and/or grazed agricultural land lacking any native vegetation and in
paddocks exceeding 300 ha in size. For riparian strips or narrow fringes around large wetlands, which can extend
many kilometres, patch size was calculated for the strip of vegetation within a 1km radius around the site point.
This was done to be consistent with isolation definitions. Patch size and Isolation were not calculated for sites in
the No Native Vegetation EVC group.
Initial site selection used existing spatial data in a geographic information system (ArcGIS®), to identify 250 sites
across the Wimmera region. To ensure a degree of statistical rigour in the selection process, a sub-set of 200
sites was selected randomly from these, within a stratified framework of the site parameters. All sites were
assigned a number, starting at 8000. The site numbers were supplied by Birds Australia and the sites integrated
into their Atlas of Australian Birds database. One site was subsequently deleted because the vegetation patch
selected was found to no longer exist. The breakdown by parameters of the 199 chosen survey sites is shown in
Wimmera CMA – working for a healthy Wimmera catchment
3
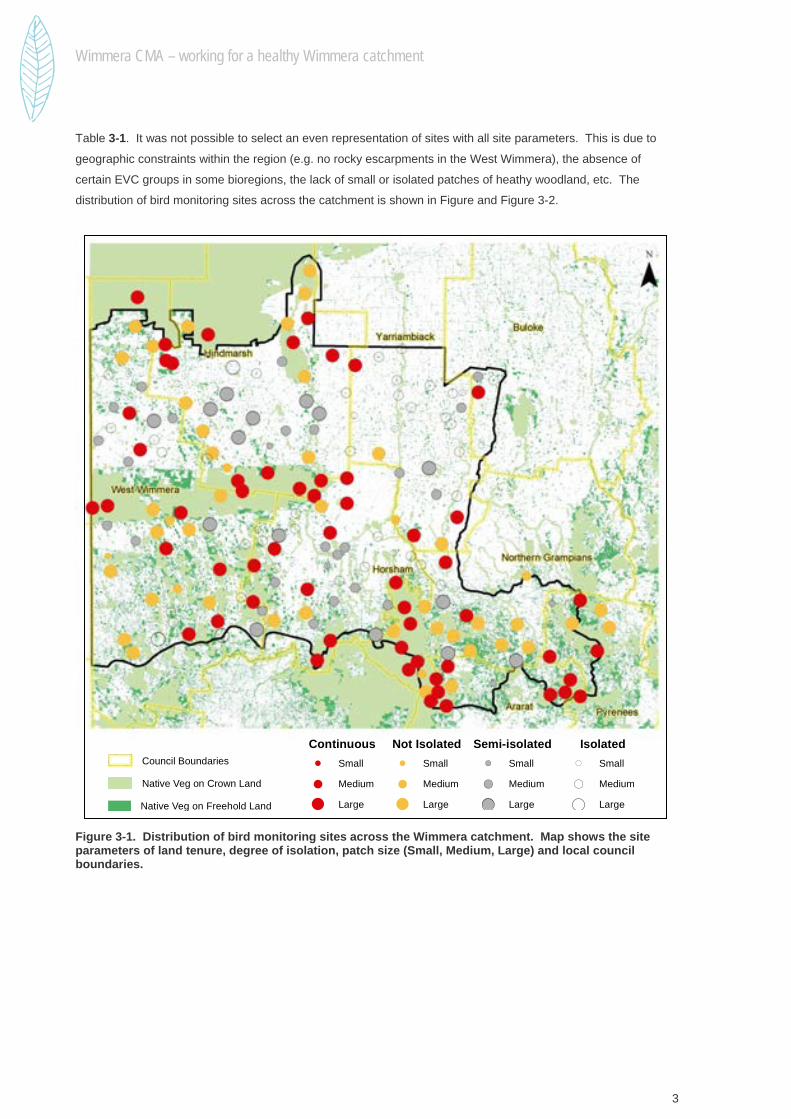
Table 3-1. It was not possible to select an even representation of sites with all site parameters. This is due to
geographic constraints within the region (e.g. no rocky escarpments in the West Wimmera), the absence of
certain EVC groups in some bioregions, the lack of small or isolated patches of heathy woodland, etc. The
distribution of bird monitoring sites across the catchment is shown in Figure and Figure 3-2.
Figure 3-1. Distribution of bird monitoring sites across the Wimmera catchment. Map shows the site parameters of land tenure, degree of isolation, patch size (Small, Medium, Large) and local council boundaries.
Council Boundaries
Native Veg on Crown Land
Native Veg on Freehold Land
Continuous
! Small
! Medium
! Large
Not Isolated
! Small
! Medium
! Large
Semi-isolated
!( Small
!( Medium
!( Large
Isolated
( Small
( Medium
( Large


Wimmera CMA – working for a healthy Wimmera catchment
3
Table 3-1. Breakdown of the five site parameters used to identify the bird monitoring sites.
Bioregion N sites EVC Group N sites Land Tenure N sites Central Victorian Uplands 5 Box Ironbark Forests/Woodlands 6 Crown Land 85
Dundas Tablelands 4 Dry Forests 16 Freehold Land 114
Glenelg Plain 2 Foothill Forests 1
Goldfields 24 Heathlands 7
Greater Grampians 18 Heathy Woodlands 13 Total 199
Lowan Mallee 24 Herb-rich Woodlands 5
Murray Mallee 23 Lower Slopes or Hills Woodlands 14 Patch Size N sites
Wimmera 99 Lowland Forests 1 Large 98
Mallee 21 Medium 64
Montane 2 Small 19
Plains Grasslands/Chenopod Shrubland 20 (NNV) 18
Plains Woodland or Forest Plains Woodland 22
Riparian and/or Swampy Scrubs or Woodland 4 Total 199
Riparian Forests or Woodlands 3
Riverine Grassy Woodlands or Forests 18 Isolation N sites
Rocky outcrop or escarpment Scrubs 6 Isolated 53
Salt-tolerant and/or succulent Shrublands 6 Not Isolated 50
Wetland Freshwater 13 Semi-isolated 41
Wetland Saline 3 Continuous 37
No Native Vegetation (NNV) 18 (NNV) 18
Total 199 199 199


Wimmera CMA – working for a healthy Wimmera catchment
13
Figure 3-2. Distribution of bird monitoring sites across the Wimmera catchment, showing sites in relation to the bioregions (labelled) and council boundaries.
3.2. Bird Surveying
The bird monitoring project employed the Birds Australia 20 minute/ two hectare atlas survey methodology (see
Barrett et al. 2003). At each monitoring site, a two hectare survey site was identified. Usually, these were
rectangular, 100 x 200 metres in size, though shapes varied depending on local topography, vegetation, roads or
fence lines.
Bird surveys involved walking randomly through the 2 ha site, recording all bird species present within the site
during the 20 minute survey period. Counts of individuals were not made, only the presence of each species
recorded. Birds flying over the site were included. Birds heard from within the 2 ha site that were calling from
beyond the site boundary were not included.
Council Boundaries

40
Community participation was an integral component of the monitoring project. Volunteer bird-watchers were
recruited to undertake the majority of the surveys. Where coverage was deficient, due to remoteness or lack of
volunteers, site surveys were undertaken by the project co-ordinator. Sites were surveyed four times per year,
i.e. once per season. The survey months were January (Summer), April (Autumn), July (Winter) and October
(Spring). Survey data were recorded on the Birds Australia Atlas data sheets and submitted to the Wimmera
CMA for entry and analysis. All data sheets were then forwarded onto Birds Australia for incorporation into their
national Atlas of Australian Birds.
The scientific names of all birds referred to in this report are listed in Appendix 1.
3.3. Data Analysis
Two measures of bird populations can be calculated from the survey data: bird species richness and relative
abundance. Species richness is expressed as the mean number of bird species recorded per bird survey and
represents a measure of the diversity of birds recorded. Sites with high species richness are considered to be
indicative of higher levels of biodiversity than sites with low species richness. Relative abundance is a measure
of how often a species is recorded at a site and is expressed as the ‘reporting rate’ of a species. For example, a
species recorded in eight out of ten surveys (in 80% of surveys), is said to have a higher relative abundance than
a species recorded only twice out of ten surveys (20% of surveys). Species with high reporting rates are thus
considered to be relatively more abundant than species with low reporting rates.
Species richness and relative abundance vary depending on the parameters of a site and are considered the
‘response variables’. The five site parameters, as well as season and climate, all influence the presence or
absence of birds at a site and are considered the ‘predictor variables’ (Clarke & Warwick 2001).
Species richness and relative abundance values were calculated for each site and analysed against the five site
parameters. Sites that were visited less than four times were considered to have an insufficient sample size and
were excluded from the statistical analyses. Statistical analysis of means was carried out using the methods
described in Fowler & Cohen (1996). When comparing the means of two samples, the parametric t-test was
performed on small samples (less than 30 observations), or z-test on larger samples (over 30 observations).
When comparing the means of more than two samples, an ANOVA test was performed. Where the variance of
the means was too high for a parametric test, the non-parametric Kruskal-Wallis test or Mann-WhitneyU-test was
used.
Analysis of means can show differences in overall species richness between the different site parameters, but
cannot examine the composition of species which contribute to the overall richness measured. Another method
of analysing the bird survey results is to examine the relative abundance of bird species across sites. Statistical
analysis of the similarities and differences in the relative abundance of species between bird monitoring sites was
undertaken using analysis of similarity (ANOSIM) in the PRIMER software package (Clarke & Warwick 2001). To
identify which bird species contributed to the differences between sites, a similarity percentage (SIMPER) was
used based on the contributions of variables to the Bray-Curtis similarity matrix (on square-root transformed data)
in the PRIMER software package (Clarke & Warwick 2001). For all statistical analyses, a significance level of p =
0.05 was employed.

Wimmera CMA – working for a healthy Wimmera catchment
13

40
4. Results
The bird monitoring project began in September 2004 and was scheduled to run for five years. The first surveys
were conducted in October (Spring) 2004. Because the project had only just commenced and few surveys were
undertaken during the first survey month, it was decided to extend the survey period by one season so that five
full calendar years could be covered. Thus, the last survey month was October 2009, giving 21 survey months in
total.
Surveys were undertaken at 168 sites across the Wimmera. Over 100 volunteers were involved with the project
and 1608 surveys were completed. Some volunteers, who had previously been monitoring sites in the Wimmera
for Birds Australia (Birds on Farms, 1995-1997; new Atlas of Australian Birds, 1998-2002), offered to resume
surveying at these sites. These sites already had allocated site numbers and these were also used by WCMA.
Appendix 2 shows the site parameters and bird survey results for each site surveyed.
A total of 184 bird species was recorded during the survey period. Table 4-1 shows the 20 most widespread
species, based on the number of surveyed sites in which the species was recorded.
Table 4-1. Twenty most widespread species recorded during the bird monitoring project, ranked on the number of sites (out of 168) in which each species was recorded.
Species
Number of sites recorded
Australian Magpie 132
Galah 106
Australian Raven 93
Red Wattlebird 90
Red-rumped Parrot 88
Striated Pardalote 84
Brown Treecreeper 83
White-plumed Honeyeater 83
Willie Wagtail 81
Eastern Rosella 77
Long-billed Corella 76
Welcome Swallow 74
Sulphur-crested Cockatoo 71
Crested Pigeon 70
Grey Shrike-thrush 69
Crimson Rosella 68
Superb Fairy-wren 66
Laughing Kookaburra 65
Musk Lorikeet 62
Noisy Miner 56

Wimmera CMA – working for a healthy Wimmera catchment
13
Australian Magpie was the most frequently recorded and most widespread species recorded during the bird
surveys. Other species found to be widespread across the Wimmera include Galah, Australian Raven and Red-
rumped Parrot (all ground-feeding species), Red Wattlebird and Striated Pardalote (which feed predominantly in
foliage).
Interestingly, Brown Treecreeper, a declining woodland species, was found in nearly half of sites surveyed. Of
the 20 species listed in Table 18 are considered sedentary, one (Musk Lorikeet) is nomadic, and one (Welcome
Swallow) is a partial migrant.
The abundance of species recorded during the bird monitoring project can be determined by calculating their
reporting rate (see Methods). Table shows the 20 most abundant species recorded across the Wimmera, based
on their calculated reporting rates.
Table 4-2. Twenty most abundant species recorded during the bird monitoring project, ranked on the reporting rate (n=1608) calculated for each species.
Species Reporting rate
(%) Australian Magpie 47.1
Galah 36.8
Red-rumped Parrot 32.8
White-plumed Honeyeater 32.5
Brown Treecreeper 31.8
Sulphur-crested Cockatoo 24.7
Willie Wagtail 23.5
Superb Fairy-wren 22.1
Striated Pardalote 21.8
Crimson Rosella 19.5
Red Wattlebird 19.3
Long-billed Corella 18.1
Australian Raven 17.8
Eastern Rosella 17.1
New Holland Honeyeater 17.0
Grey Shrike-thrush 14.9
Crested Pigeon 14.5
Noisy Miner 13.8
Laughing Kookaburra 12.6
Musk Lorikeet 11.3
Australian Magpie was the most frequently recorded species, found in nearly half of all surveys conducted.
Comparing the 20 most widespread species (Table ) with the 20 most abundant species (Table ) shows that 19 of
the 20 most abundant species are also the most widespread, although the ranking order differs. Welcome
Swallow was found to be a widespread species across the Wimmera but is not ranked among the most abundant,
possibly reflecting the part-migratory nature of this species. New Holland Honeyeater is the only species ranked
in the top 20 most abundant species but not ranked in the top 20 most widespread.

40
The mean number of birds per survey (species richness) was calculated for each site (see Appendix 1).
Differences in bird species richness between sites can be displayed by plotting the mean number of birds per
survey on a map of the catchment.
Figure shows the geographic distribution of species richness across the catchment. The results have been
grouped into quartiles of 0—4, 4.1—7, 7.1—10 and over 10 + birds per survey.
Figure 4-1. Mean number of birds per survey recorded at survey sites across the Wimmera.
The results displayed in
Figure show that bird species richness is not evenly distributed across the catchment. The most diverse sites are
clustered in the central and south-eastern parts of the catchment. Species richness is low in the south-west
Wimmera and within the Little Desert and Grampians National Parks. The region with the highest species
richness lies between these two large parks, in an area dissected by numerous north-south orientated
watercourses. The reasons for the disparate distribution of species richness can be explored by examining the
parameters that define each site.
The bird monitoring project defined survey sites according to five site parameters (see

Wimmera CMA – working for a healthy Wimmera catchment
13
Table 3-1). The differing influences that these five site parameters have on biodiversity values across the
catchment can be examined. For the purposes of statistical rigour, sites surveyed less than four times are not
included in the following analyses. Excluding sites surveyed less than four times, bird data were collected from
1485 surveys and from 121 sites.
4.1 Vegetation Community (EVC group)
The habitat requirements of birds in the Wimmera can be determined by examining the bird species richness for
the 18 different vegetation communities (EVC groups). Table 4-3 shows the mean birds per survey results for
each of the 18 different EVC group categories. Sites where less than four surveys were undertaken are not
included in the analysis.
Table 4-3. Species richness (mean birds per survey) recorded for each of the EVC groups. Standard Deviation, number of surveys completed and number of sites surveyed are also shown.
Vegetation community (EVC group)
Mean birds / survey
Stand. Dev.
Number of
surveys Number of sites
Box Ironbark Forests/Woodlands 8.61 4.807 38 3
Dry Forests 7.31 3.633 58 7
Heathlands 4.71 3.746 59 5
Heathy Woodlands 6.75 3.899 129 9
Herb-rich Woodlands 11.76 5.764 72 5
Lower Slopes or Hills Woodlands 8.26 4.064 82 8
Lowland Forests 3.33 1.633 6 1
Mallee 4.28 2.986 32 4
No Native Vegetation 2.29 2.247 146 12
Plains Grasslands/Chenopod Shrubland 6.94 3.556 120 10
Plains Woodland or Forest Plains Woodland 9.52 4.941 204 16
Riparian and/or Swampy Scrubs or Woodlands 10.21 4.697 57 4
Riparian Forests or Woodlands 10.16 2.078 55 3
Riverine Grassy Woodlands or Forests 8.68 3.551 171 13
Rocky Outcrop or Escarpment Scrubs 5.54 1.895 63 6
Salt-tolerant and/or succulent Shrublands 2.77 2.036 51 5
Wetland Freshwater 6.80 3.646 123 9
Wetland Saline 2.95 2.718 19 1
Herb-rich Woodlands was the vegetation community which supported the greatest bird species richness, with an
average of 11.76 birds recorded per survey. Three of the top six EVC groups for species richness are associated
with watercourses (Riparian and/or Swampy Scrubs or Woodland, Riparian Forests or Woodlands and Riverine
Grassy Woodlands or Forests). The EVC group Plains Woodland or Forest Plains Woodlands had the most
number of surveys and the largest number of sites represented, and had a mean species richness of 9.52. In
contrast, Heathlands and Mallee vegetation had very low species richness. Sites with no native vegetation
present had the lowest species richness, with only 2.29 birds recorded per survey.
4.2 Land Tenure
40
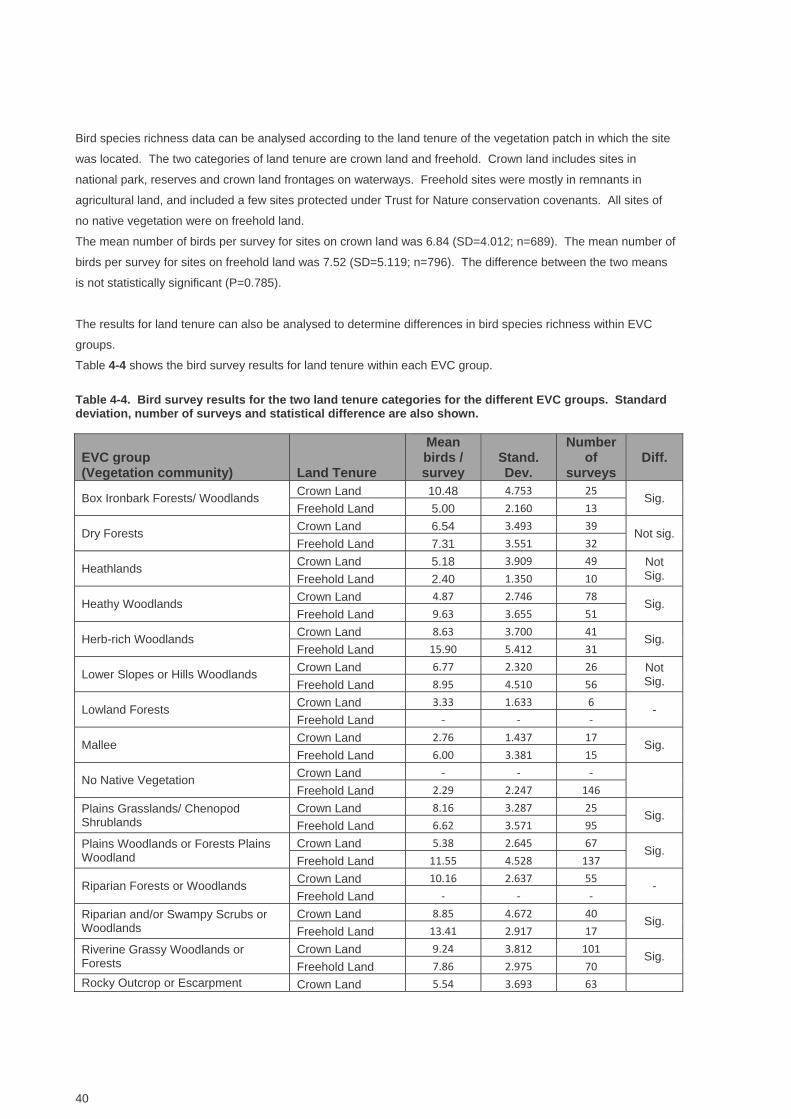
Bird species richness data can be analysed according to the land tenure of the vegetation patch in which the site
was located. The two categories of land tenure are crown land and freehold. Crown land includes sites in
national park, reserves and crown land frontages on waterways. Freehold sites were mostly in remnants in
agricultural land, and included a few sites protected under Trust for Nature conservation covenants. All sites of
no native vegetation were on freehold land.
The mean number of birds per survey for sites on crown land was 6.84 (SD=4.012; n=689). The mean number of
birds per survey for sites on freehold land was 7.52 (SD=5.119; n=796). The difference between the two means
is not statistically significant (P=0.785).
The results for land tenure can also be analysed to determine differences in bird species richness within EVC
groups.
Table 4-4 shows the bird survey results for land tenure within each EVC group.
Table 4-4. Bird survey results for the two land tenure categories for the different EVC groups. Standard deviation, number of surveys and statistical difference are also shown.
EVC group (Vegetation community) Land Tenure
Mean birds / survey
Stand. Dev.
Number of
surveys Diff.
Box Ironbark Forests/ Woodlands Crown Land 10.48 4.753 25
Sig. Freehold Land 5.00 2.160 13
Dry Forests Crown Land 6.54 3.493 39
Not sig. Freehold Land 7.31 3.551 32
Heathlands Crown Land 5.18 3.909 49 Not
Sig. Freehold Land 2.40 1.350 10
Heathy Woodlands Crown Land 4.87 2.746 78
Sig. Freehold Land 9.63 3.655 51
Herb-rich Woodlands Crown Land 8.63 3.700 41
Sig. Freehold Land 15.90 5.412 31
Lower Slopes or Hills Woodlands Crown Land 6.77 2.320 26 Not
Sig. Freehold Land 8.95 4.510 56
Lowland Forests Crown Land 3.33 1.633 6
- Freehold Land ‐ ‐ ‐
Mallee Crown Land 2.76 1.437 17
Sig. Freehold Land 6.00 3.381 15
No Native Vegetation Crown Land ‐ ‐ ‐
Freehold Land 2.29 2.247 146
Plains Grasslands/ Chenopod Shrublands
Crown Land 8.16 3.287 25 Sig.
Freehold Land 6.62 3.571 95
Plains Woodlands or Forests Plains Woodland
Crown Land 5.38 2.645 67 Sig.
Freehold Land 11.55 4.528 137
Riparian Forests or Woodlands Crown Land 10.16 2.637 55
- Freehold Land ‐ ‐ ‐
Riparian and/or Swampy Scrubs or Woodlands
Crown Land 8.85 4.672 40 Sig.
Freehold Land 13.41 2.917 17
Riverine Grassy Woodlands or Forests
Crown Land 9.24 3.812 101 Sig.
Freehold Land 7.86 2.975 70
Rocky Outcrop or Escarpment Crown Land 5.54 3.693 63

Wimmera CMA – working for a healthy Wimmera catchment
13
EVC group (Vegetation community) Land Tenure
Mean birds / survey
Stand. Dev.
Number of
surveys Diff.
Scrubs Freehold Land ‐ ‐ ‐
Salt-tolerant and/or succulent Shrublands
Crown Land 3.04 1.899 24 Not sig.
Freehold Land 2.51 2.155 27
Wetland Freshwater Crown Land 4.06 2.423 33
Sig Freehold Land 7.80 3.510 90
Wetland Saline Crown Land ‐ ‐ ‐
- Freehold Land 2.94 2.718 19
Of the 13 EVC groups which contained sites in both land tenure, nine showed significant differences. From
Table 4-4, sites on freehold land supported significantly higher species richness in six EVC groups, including
Herb-rich Woodlands, Mallee and Freshwater wetlands. Sites on crown land supported significantly higher
species richness in three EVC groups: Box Ironbark Forests/ Woodlands, Plains Grasslands/ Chenopod
Shrublands and Riverine Grassy Woodlands or Forests.
Sites in Box Ironbark Forests/ Woodlands had over double the bird species richness on crown land compared
with sites on crown land. Conversely, sites in freshwater wetlands had nearly double the bird species richness on
freehold land compared with sites on crown land.
4.3 Patch Size
Bird species richness data can be analysed according to the size of the vegetation patch where the site was
located. The results, for all EVC groups combined (but excluding No Native Vegetation; see above), are shown in
Table and Figure . Sites where less than four surveys were undertaken are not included in the analysis.
Table 4-5. Bird species richness data (mean birds per survey) for sites in the three patch size classes. Standard deviation, number of surveys completed (n=1339) and number of sites surveyed (n=109) are also shown.
Patch Size Mean birds per survey Stand. Dev.
Number of surveys
Number of sites
Large (>100 ha) 7.31 4.753 761 65
Medium (10—100 ha) 8.31 4.230 540 39
Small (<10 ha) 8.21 2.915 38 5

40
0
1
2
3
4
5
6
7
8
9
10
Large Medium Small
Patch Size
Me
an
bir
ds
pe
r s
urv
ey
Figure 4-2. Bird species richness data for sites in the three patch size classes. Error bars showing 95% confidence intervals are also shown.
The data in Table and Figure show that sites in medium patch sizes have the highest mean species richness,
and sites in large patches the smallest. A standard ANOVA test could not be conducted on patch size results
because the variances of the means are not homogeneous. Using the non-parametric Kruskal-Wallis test, the
results for the three patch size classes are found to be significantly different (H=29.429, P<0.01). Sites in large
patches are significantly different from sites in small and medium patches; sites in medium and small patches are
not significantly different from each other.
The influence of patch size on species richness can be analysed within each EVC group. Error! Reference
source not found. shows mean species richness by patch size within each of the EVC groups. Not all patch size
categories are represented within each EVC group (see Methods). Sites where less than four surveys were
undertaken are not included in the analysis.

Wimmera CMA – working for a healthy Wimmera catchment
13
Table 4-6. Mean species richness for the different Patch Size categories within each EVC Group. Standard deviation, number of surveys (N) and level of significance are also shown.
EVC Group Patch Size Mean Stand. Dev.
N Significance Level
Box Ironbark Forests or dry/lower fertility Woodlands
Large 8.61 4.807 38 Medium
Small
Dry Forests Large 7.34 3.721 53
z = 0.095, P>0.05 Not significantly different Medium
Small 7.2 2.588 5
Heathlands Large 4.71 3.647 59
Medium
Small
Heathy Woodlands Large 5.29 3.251 84
F2/129 = 23.903, P<0.05 Significantly different Medium 9.83 3.501 36
Small 8.11 3.552 9
Herb-rich Woodlands Large 11.8 6.003 66
H=0.03, P=0.862 Not significantly different Medium
Small 11.33 1.751 6
Lower Slopes or Hills Woodlands
Large 7.62 3.933 45 z = 1.570 Not significantly different Medium 9.03 4.140 37
Small
Lowland Forests Large 3.33 1.633 6
Medium
Small
Mallee Large 2.76 1.437 17
H=15.091, P<0.01, Significantly different Medium 3.71 2.984 7
Small 8.0 2.330 8
Plains Grasslands and Chenopod Shrublands
Large 9.2 6.563 10 H=1.562, P=0.211 Not significantly different Medium 6.74 3.120 110
Small -
Plains Woodlands or Forests
Large 9.32 5.072 134 H=5.613, P=0.06 Not significantly different Medium 10.38 4.819 60
Small 7.1 2.514 10
Riparian and/or Swampy Scrubs and Woodlands
Large 6.38 2.959 13 z = 4.6403, P<0.01 Significantly different Medium 11.34 4.534 44
Small
Riparian Forests or Woodlands
Large Medium 10.16 2.637 55
Small
Riverine Grassy Woodlands or Forests
Large 8.81 3.442 53 z = 0.299, P>0.05 Not significantly different Medium 8.62 4.611 118
Small
Rocky outcrop or Escarpment Scrubs
Large 5.54 3.693 63 Medium
Small
Salt-tolerant and/or succulent Shrublands
Large 3.41 2.027 29 z = 0.945, P>0.05 Not significantly different Medium 2.91 1.743 22
Small
Wetlands Freshwater Large 6.59 3.876 91
z = 1.2023, P>0.05 Not significantly different Medium 7.38 2.871 32
Small
40
Three of the 11 EVC groups which had sufficient surveys in more than one patch size category, showed significant
differences. In each of these, sites in large patches had significantly lower mean species richness than sites in medium
and/or small patches. For the other eight EVC groups, there was no significant differences in mean species richness
among the three patch size classes. The results in Table and Error! Reference source not found. show that patch
size is not a good predictor of bird species richness.
1.
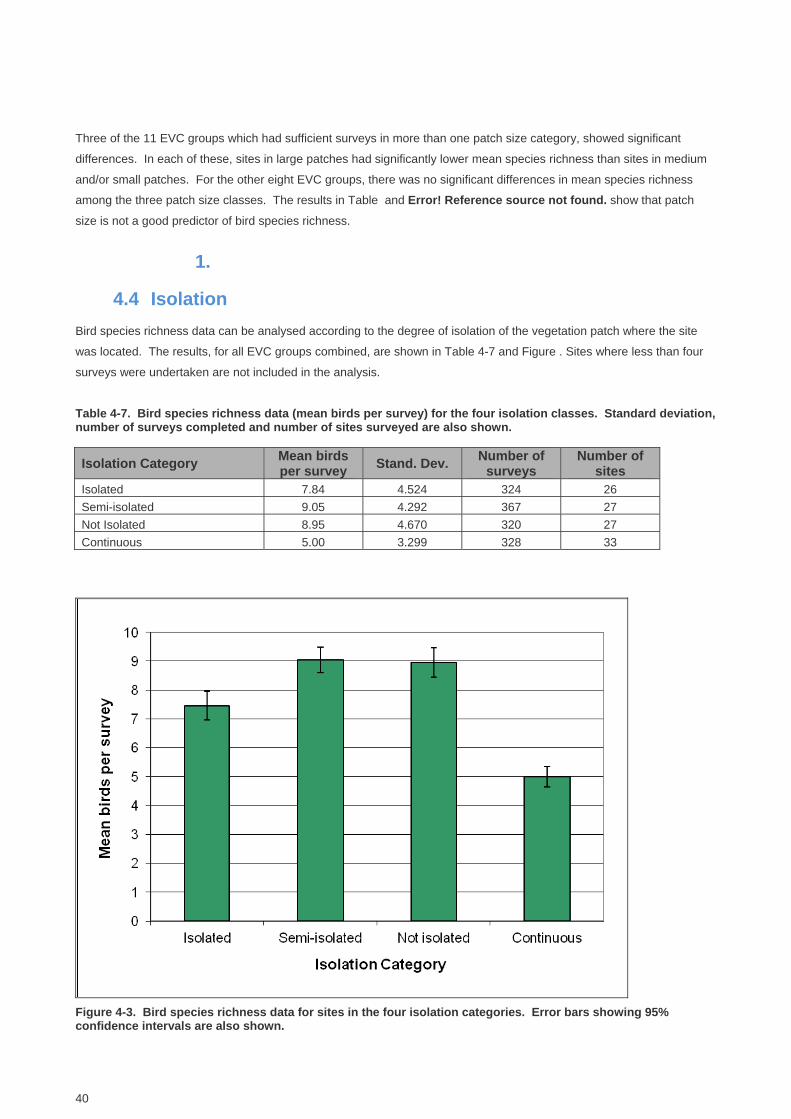
4.4 Isolation
Bird species richness data can be analysed according to the degree of isolation of the vegetation patch where the site
was located. The results, for all EVC groups combined, are shown in Table 4-7 and Figure . Sites where less than four
surveys were undertaken are not included in the analysis.
Table 4-7. Bird species richness data (mean birds per survey) for the four isolation classes. Standard deviation, number of surveys completed and number of sites surveyed are also shown.
Isolation Category Mean birds per survey
Stand. Dev. Number of
surveys Number of
sites Isolated 7.84 4.524 324 26
Semi-isolated 9.05 4.292 367 27
Not Isolated 8.95 4.670 320 27
Continuous 5.00 3.299 328 33
Figure 4-3. Bird species richness data for sites in the four isolation categories. Error bars showing 95% confidence intervals are also shown.

Wimmera CMA – working for a healthy Wimmera catchment
9
The results in Table 4-7 and Figure show that sites in Semi-isolated or Not Isolated vegetation patches have the
highest species richness, whereas sites in isolated and continuous vegetation patches have comparatively lower
species richness. A standard ANOVA test could not be performed on Isolation category results because the
variances of the means are not homogeneous. Using the non-parametric Kruskal-Wallis test, the results for degree
of isolation are found to be significantly different (H=295.16, P<0.01).
Isolation category data can also be analysed for each of the EVC groups. Table 4-8 shows the mean species
richness by Isolation category for each EVC group.
Table 4-8. Mean species richness for the different Patch Size categories within each EVC Group. Standard deviation, number of surveys (N) and level of significance are also shown.
EVC Group Isolation Category
Mean Stand. Dev.
N Significance Level
Box Ironbark Forests or dry/lower fertility Woodlands
Isolated
Semi-isolated
Not Isolated 8.61 4.807 38
Continuous
Dry Forests
Isolated 7.20 2.588 5
H=5.559, P=0.062, Not significantly different
Semi-isolated 9.63 2.066 8
Not Isolated
Continuous 6.91 3.831 45
Heathlands
Isolated
H=3.527, P=0.06, Not Significantly different
Semi-isolated
Not Isolated 2.40 1.350 10
Continuous 5.18 3.909 49
Heathy Woodlands
Isolated 8.11 3.551 9
H=55.507, P<0.01, Significantly different
Semi-isolated 9.83 3.501 36
Not Isolated 9.13 4.086 15
Continuous 4.45 2.342 69
Herb-rich Woodland
Isolated 11.33 1.751 6
H=52.515, P<0.01, Significantly different
Semi-isolated 19.11 4.189 19
Not Isolated 11.04 2.821 27
Continuous 5.90 2.222 20
Lower Slopes or Hills Woodlands
Isolated
H=5.595, P=0.06, Not Significantly different
Semi-isolated 7.56 2.950 50
Not Isolated 10.32 5.490 25
Continuous 5.86 1.676 7
Lowland Forests
Isolated
Semi-isolated
Not Isolated
Continuous 3.33 1.633 6
Mallee
Isolated 6.0 3.381 15
H=8.26, P=0.016, Significantly different
Semi-isolated
Not Isolated 3.0 1.852 8
Continuous 2.56 1.014 9
Plains Grasslands and Chenopod Shrublands
Isolated 6.25 3.163 77
H=21.461, P<0.01, Significantly different
Semi-isolated 8.82 3.486 39
Not Isolated 2.0 1.826 4
Continuous

40
EVC Group Isolation Category
Mean Stand. Dev.
N Significance Level
Plains Woodlands or Forests
Isolated 12.1 4.649 30
H=42.546, P<0.001, Significantly different
Semi-isolated 8.98 3.902 54
Not Isolated 10.14 4.935 103
Continuous 3.0 1.969 17
Riparian Forests or Woodlands
Isolated 10.51 2.873 37
H=1.474, P=0.225, Not Significantly different
Semi-isolated 9.44 1.947 18
Not Isolated
Continuous
Riparian and/or Swampy Scrubs and Woodlands
Isolated 10.39 4.541 28
H=15.137, P<0.01, Significantly different
Semi-isolated 13.0 4.147 16
Not Isolated
Continuous 6.38 2.959 13
Riverine Grassy Woodlands or Forests
Isolated 8.55 4.145 76
H=1.478, P=0.478, Not Significantly different
Semi-isolated 8.57 2.937 65
Not Isolated 9.23 3.226 30
Continuous
Rocky outcrop or Escarpment Scrubs
Isolated
Semi-isolated
Not Isolated
Continuous 5.54 3.693 63
Salt-tolerant and/or succulent Shrublands
Isolated 1.91 1.743 22
H=7.875, P=0.019, Significantly different
Semi-isolated 3.71 1.899 14
Not Isolated
Continuous 3.13 2.167 15
Wetland Freshwater
Isolated
H=26.604, P<0.01, Significantly different
Semi-isolated 6.96 6.958 48
Not Isolated 7.77 3.698 60
Continuous 2.40 1.920 15
Wetland Saline
Isolated 2.95 2.718 19
Semi-isolated
Not Isolated
Continuous
Eight of the 13 EVC groups which had sufficient surveys in more than one isolation category, showed significant
differences in mean species richness. Of these, seven showed significantly lower species richness for sites in
Continuous vegetation. The other EVC group had no sites in Continuous vegetation but showed significantly lower
mean species richness for sites in Not Isolated vegetation.
Mean species richness was highest at sites in Semi-isolated and Not Isolated vegetation (Table 4-7 and 4-3) Seven
EVC groups had sites represented in both these isolation categories. Species richness was not significantly different
between Semi-isolated and Not Isolated sites in five of the seven EVC groups, and significantly different in two EVC
groups; in both cases, semi-isolated sites were significantly larger (Table 4-8). Although there are significant
differences between the four different Isolation categories, the degree of isolation of a vegetation patch is a weak
predictor of bird species richness, and exerts less influence on species richness than EVC group.
Wimmera CMA – working for a healthy Wimmera catchment
11
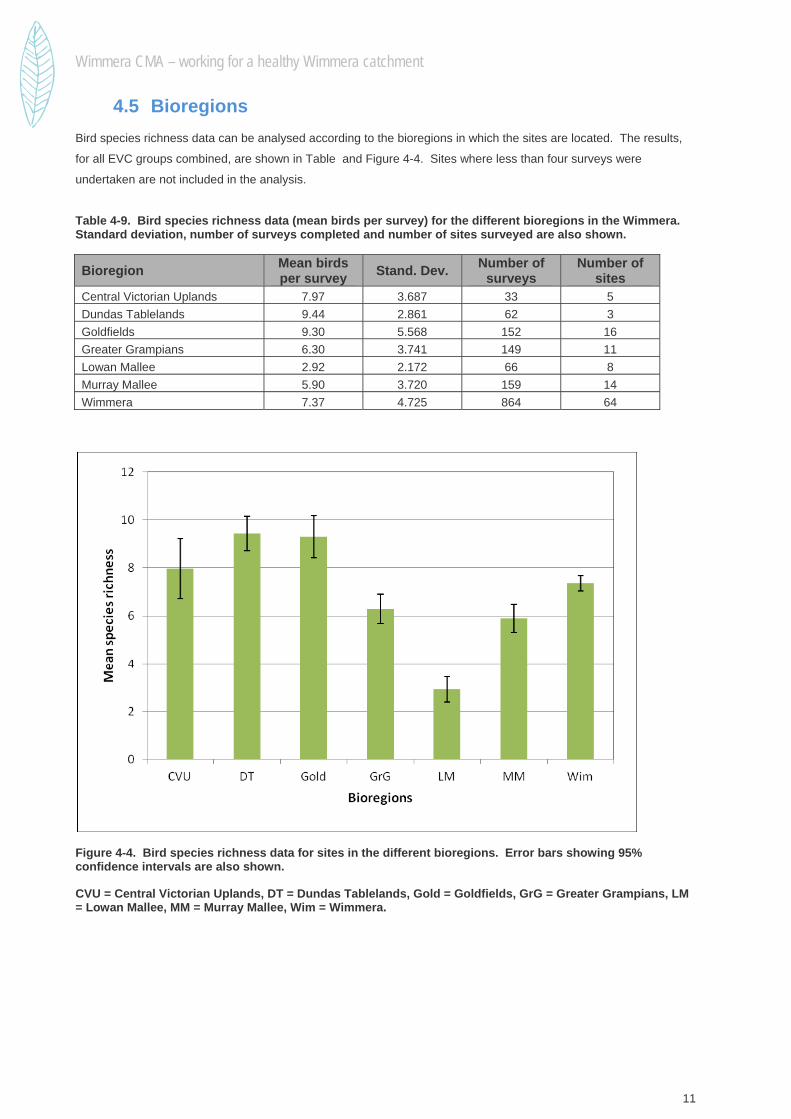
4.5 Bioregions
Bird species richness data can be analysed according to the bioregions in which the sites are located. The results,
for all EVC groups combined, are shown in Table and Figure 4-4. Sites where less than four surveys were
undertaken are not included in the analysis.
Table 4-9. Bird species richness data (mean birds per survey) for the different bioregions in the Wimmera. Standard deviation, number of surveys completed and number of sites surveyed are also shown.
Bioregion Mean birds per survey
Stand. Dev. Number of
surveys Number of
sites Central Victorian Uplands 7.97 3.687 33 5
Dundas Tablelands 9.44 2.861 62 3
Goldfields 9.30 5.568 152 16
Greater Grampians 6.30 3.741 149 11
Lowan Mallee 2.92 2.172 66 8
Murray Mallee 5.90 3.720 159 14
Wimmera 7.37 4.725 864 64
Figure 4-4. Bird species richness data for sites in the different bioregions. Error bars showing 95% confidence intervals are also shown.
CVU = Central Victorian Uplands, DT = Dundas Tablelands, Gold = Goldfields, GrG = Greater Grampians, LM = Lowan Mallee, MM = Murray Mallee, Wim = Wimmera.
40
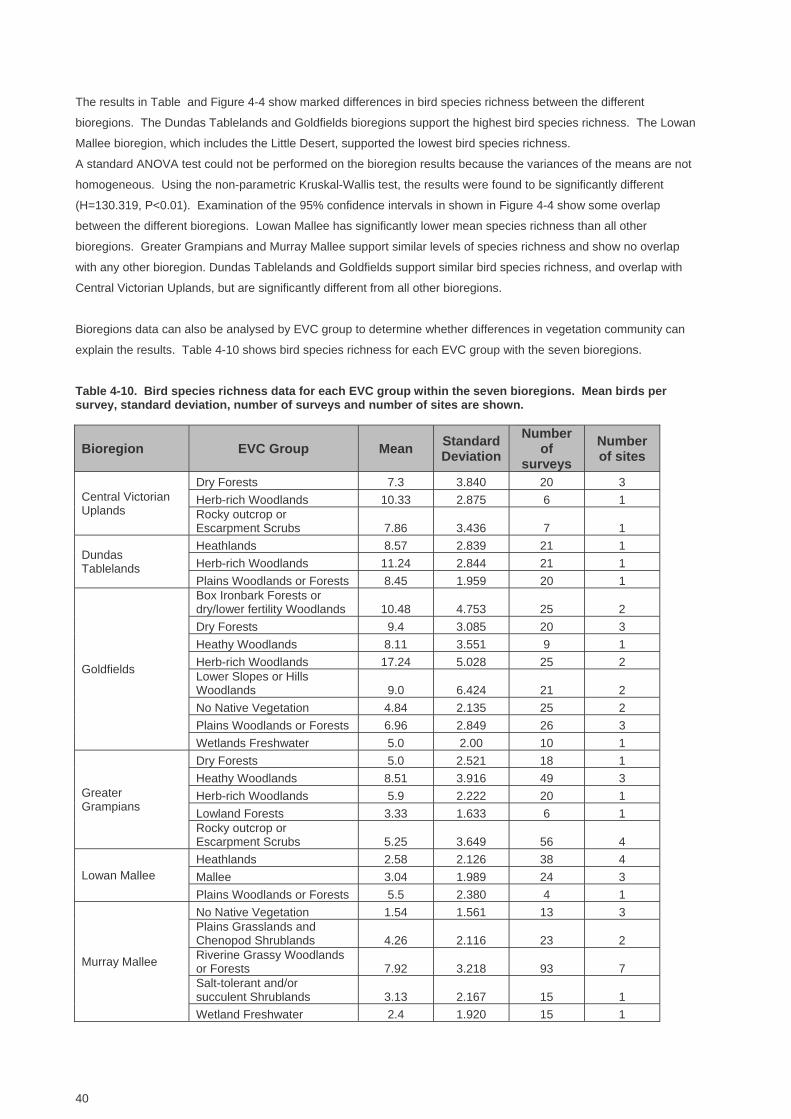
The results in Table and Figure 4-4 show marked differences in bird species richness between the different
bioregions. The Dundas Tablelands and Goldfields bioregions support the highest bird species richness. The Lowan
Mallee bioregion, which includes the Little Desert, supported the lowest bird species richness.
A standard ANOVA test could not be performed on the bioregion results because the variances of the means are not
homogeneous. Using the non-parametric Kruskal-Wallis test, the results were found to be significantly different
(H=130.319, P<0.01). Examination of the 95% confidence intervals in shown in Figure 4-4 show some overlap
between the different bioregions. Lowan Mallee has significantly lower mean species richness than all other
bioregions. Greater Grampians and Murray Mallee support similar levels of species richness and show no overlap
with any other bioregion. Dundas Tablelands and Goldfields support similar bird species richness, and overlap with
Central Victorian Uplands, but are significantly different from all other bioregions.
Bioregions data can also be analysed by EVC group to determine whether differences in vegetation community can
explain the results. Table 4-10 shows bird species richness for each EVC group with the seven bioregions.
Table 4-10. Bird species richness data for each EVC group within the seven bioregions. Mean birds per survey, standard deviation, number of surveys and number of sites are shown.
Bioregion EVC Group Mean Standard Deviation
Number of
surveys
Number of sites
Central Victorian Uplands
Dry Forests 7.3 3.840 20 3
Herb-rich Woodlands 10.33 2.875 6 1 Rocky outcrop or Escarpment Scrubs 7.86 3.436 7 1
Dundas Tablelands
Heathlands 8.57 2.839 21 1
Herb-rich Woodlands 11.24 2.844 21 1
Plains Woodlands or Forests 8.45 1.959 20 1
Goldfields
Box Ironbark Forests or dry/lower fertility Woodlands 10.48 4.753 25 2
Dry Forests 9.4 3.085 20 3
Heathy Woodlands 8.11 3.551 9 1
Herb-rich Woodlands 17.24 5.028 25 2 Lower Slopes or Hills Woodlands 9.0 6.424 21 2
No Native Vegetation 4.84 2.135 25 2
Plains Woodlands or Forests 6.96 2.849 26 3
Wetlands Freshwater 5.0 2.00 10 1
Greater Grampians
Dry Forests 5.0 2.521 18 1
Heathy Woodlands 8.51 3.916 49 3
Herb-rich Woodlands 5.9 2.222 20 1
Lowland Forests 3.33 1.633 6 1 Rocky outcrop or Escarpment Scrubs 5.25 3.649 56 4
Lowan Mallee Heathlands 2.58 2.126 38 4
Mallee 3.04 1.989 24 3
Plains Woodlands or Forests 5.5 2.380 4 1
Murray Mallee
No Native Vegetation 1.54 1.561 13 3 Plains Grasslands and Chenopod Shrublands 4.26 2.116 23 2 Riverine Grassy Woodlands or Forests 7.92 3.218 93 7 Salt-tolerant and/or succulent Shrublands 3.13 2.167 15 1
Wetland Freshwater 2.4 1.920 15 1

Wimmera CMA – working for a healthy Wimmera catchment
13
Bioregion EVC Group Mean Standard Deviation
Number of
surveys
Number of sites
Wimmera
Box Ironbark Forests or dry/lower fertility Woodlands 5.0 2.160 13 1
Heathy Woodlands 5.37 3.390 71 5 Lower Slopes or Hills Woodlands 8.13 3.563 70 6
Mallee 8.0 2.330 8 1
No Native Vegetation 1.80 1.927 108 7 Plains Grasslands and Chenopod Shrublands 7.58 3.538 97 8
Plains Woodlands or Forests 10.2 5.323 154 11 Riparian Forests or Woodlands 10.16 2.637 55 3 Riparian and/or Swampy Scrubs and Woodlands 10.21 4.697 57 4 Riverine Grassy Woodlands or Forests 9.58 3.737 78 6 Salt-tolerant and/or succulent Shrublands 2.61 1.990 36 4
Wetland Freshwater 7.65 3.429 98 7
Wetland Saline 2.95 2.718 19 1 Table 4-10 shows that, not unexpectedly, the EVC groups are not evenly distributed across each bioregion. At this
level of breakdown, many EVC groups are represented by only one site. However, the influence of bioregions on
bird species richness can be examined by looking the same EVC group across bioregions. Two examples are
shown in Figure 4-5 and Figure 4-6, which show bird species richness data for two EVC groups across different
bioregions.
Figure 4-5. Average birds per survey across four bioregions for Herb-rich Woodlands EVC group.

40
Figure 4-6. Average birds per survey across four bioregions for the Plains Woodlands or Forests EVC group.
The results in Figure 4-5 and Figure 4-6 show great variation in bird species richness within EVC groups across
bioregions. This most likely reflects differences in vegetation composition and condition in different parts of the
catchment. The Lowan Mallee Bioregion encompasses mostly the infertile sandy soils of Little Desert and southern
Big Desert, whereas the Wimmera Bioregion encompasses the more fertile plains and higher rainfall regions in the
south (see DSE website).
4.6 Geographic distribution by local government districts
Bird species richness data can be analysed according to the local government district in which sites are located. The
results, for all EVC groups combined, are shown in Table 4-1 and Figure 4-7. Sites where less than four surveys
were undertaken are not included in the analysis.
Table 4-11. Bird species richness data (mean birds per survey) for the different local government districts in the Wimmera. Standard deviation, number of surveys completed and number of sites surveyed are also shown.
Local Government district Mean birds per survey Stand. Dev.
Number of surveys
Number of sites
Ararat Shire 6.06 2.567 50 6
Buloke Shire 3.40 2.945 20 3
Hindmarsh Shire 7.30 4.039 207 17
Horsham Regional City 8.34 4.955 424 28
Northern Grampians Shire 7.97 5.419 272 23
Pyrenees Shire 10.24 5.377 34 5
West Wimmera Shire 4.92 3.286 289 23
Yarriambiack Shire 7.1- 3.947 189 16

Wimmera CMA – working for a healthy Wimmera catchment
15
Figure 4-7. Bird species richness data for sites in the eight local government districts in the Wimmera.
Ar = Ararat Shire, Bul = Buloke Shire, Hind = Hindmarsh Shire, Hor = Horsham Regional City, N Gr = Northern Grampians, Pyr = Pyrenees Shire, W Wim = West Wimmera Shire, Yarr = Yarriambiack Shire Table 4-11 and Figure 4-7 show great variation in bird species richness across the different local government
districts, with the Pyrenees Shire supporting the highest species richness, and Buloke Shire the lowest. In the
Buloke Shire, only three sites were represented, and one of these was a site of No Native Vegetation, so the EVC
grouips within each shire will have a strong bearing on overall species richness by shire. Table 4-12 shows the
breakdown of species richness per EVC group within each local government district.

40
Table 4-12. Bird species richness data for each EVC group within the eight different local government boundaries. Mean birds per survey, standard deviation, number of surveys and number of sites are shown.
Local government district
EVC Group Mean Stand. Dev.
Number surveys
Number of sites
Ararat
Dry Forests 6.63 2.712 19 3 Lower Slopes or Hills Woodlands
4.33 1.633 6 1
No Native Vegetation 5.33 1.715 18 1 Rocky outcrop or Escarpment Scrubs
7.86 3.436 7 1
Buloke No Native Vegetation 0.5 0.756 8 2 Plains Grasslands and Chenopod Shrublands 5.33 2.103 12 1
Hindmarsh
Heathlands 1.64 1.502 11 1 Lower Slopes or Hills Woodlands 8.83 2.483 6 1
No Native Vegetation 3.20 0.837 5 1 Plains Grasslands and Chenopod Shrublands 8.71 3.197 17 2 Plains Woodlands or Forests 11.0 2.602 14 1 Riverine Grassy Woodlands or Forests 8.56 3.183 70 5 Salt-tolerant and/or succulent Shrublands 3.13 2.167 15 1
Wetland Freshwater 6.91 4.252 69 5
Horsham
Heathlands 8.57 2.839 21 1
Heathy Woodlands 7.02 4.364 63 4
Herb-rich Woodlands 11.24 2.844 21 1
No Native Vegetation 0.87 0.730 30 2 Plains Woodlands or Forests 11.19 4.287 90 6 Riparian Forests or Woodlands 10.26 2.468 38 2 Riparian and/or Swampy Scrubs and Woodlands 11.28 4.559 46 3 Riverine Grassy Woodlands or Forests 10.24 4.499 37 3 Rocky Outcrop or Escarpment Scrubs 4.19 2.095 27 2 Salt-tolerant and/or succulent Shrublands 2.23 1.960 30 3
Wetlands Freshwater 8.43 2.856 21 1
Northern Grampians
Box Ironbark Forests or dry/lower fertility Woodlands 6.77 2.956 30 2
Dry Forests 6.42 3.202 26 2
Heathy Woodlands 6.18 3.290 22 2
Herb-rich Woodland 12.07 7.024 45 3 Lower Slopes or Hills Woodlands 13.67 5.989 6 1
Lowland Forests 3.33 1.633 6 1
No Native Vegetation 4.53 2.615 15 1 Plains Woodlands or Forests 8.84 6.414 55 5 Riparian Forests or Woodlands 9.94 3.051 17 1 Riparian and/or Swampy Scrubs and Woodlands 5.73 1.618 11 1
Rocky outcrop or 6.24 4.469 29 3

Wimmera CMA – working for a healthy Wimmera catchment
17
Local government district
EVC Group Mean Stand. Dev.
Number surveys
Number of sites
Escarpment Scrubs
Wetland Freshwater 5.0 2.00 10 1
Pyrenees
Box Ironbark Forests or dry/lower fertility Woodlands 15.5 4.140 8 1
Dry Forests 10.08 4.425 13 2
Herb-rich Woodlands 11.33 1.751 6 1
No Native Vegetation 3.57 2.699 7 1
West Wimmera
Heathlands 2.96 2.244 27 3
Heathy Woodlands 6.66 3.497 44 3 Lower Slopes or Hills Woodlands 7.87 2.877 38 2
Mallee 3.04 1.989 24 3
No Native Vegetation 1.61 1.346 38 2 Plains Grasslands and Chenopod Shrublands 4.83 2.427 40 3 Plains Woodlands or Forests 6.93 3.016 30 3 Salt-tolerant and/or succulent Shrublands 4.50 0.548 6 1
Wetland Freshwater 5.74 1.888 23 2
Wetland Saline 2.95 2.718 19 1
Yarriambiack
Lower Slopes or Hills Woodlands 8.34 4.613 26 3
Mallee 8.0 2.330 8 1
No Native Vegetation 1.56 1.805 25 2 Plains Grasslands and Chenopod Shrublands 8.39 3.721 51 4 Plains Woodlands or Forests 5.87 1.685 15 1 Riverine Grassy Woodlands or Forests 7.91 3.048 64 5
The results in Table 4-12 show that there is great variation in bird species richness within each local government
district, and that this variation is driven by the different EVC groups. The influence of geographic variation (local
government districts) on bird species richness can examined by graphing EVC groups across different districts.
Figure 4-8 and Figure 4-9 show bird species richness data for two EVC groups across different local government
districts.

40
Figure 4-8. Average birds per survey across five local government districts for the Lower Slopes or Hills Woodlands EVC group.
Figure 4-9. Average birds per survey across five local government districts for the Plains Woodlands or Forests EVC group.
The results in Figure 4-8 and Figure 4-9 show great variation in bird species richness within EVC groups across local
government districts. This most likely reflects differences in vegetation composition and condition in different parts of
the catchment.

Wimmera CMA – working for a healthy Wimmera catchment
19
4.7 Species composition
The most widespread and most abundant species recorded during the bird monitoring project are shown in Table
and Table . The analysis of results for the five different site parameters all indicate that it is vegetation community
(EVC group) which accounts for the greatest variability of species richness across the catchment. The species
composition of the different EVC groups can be examined to determine whether species composition varies across
different EVC groups and which bird species might drive any observed differences.
Table 4-3 ranked the EVC groups according to mean species richness. The top six EVC groups can be divided into
two groups - those associated with watercourses and floodplain habitats (Riparian and/or Swampy Scrubs or
Woodland, Riparian Forests or Woodlands and Riverine Grassy Woodlands or Forests), and those which generally
occur on hilly, undulating or plains country away from watercourses and floodplains (Herb-rich Woodlands, Plains
Woodland or Forest Plains Woodland, and Box Ironbark Forests or dry/lower fertility Woodlands).
The species composition of these two groups can be analysed to determine the similarities or differences in their bird
species composition. An analysis of similarity (ANOSIM) was performed on the bird monitoring data. The results
can be displayed graphically as an MDS (multi Dimensional Scaling) plot, where sites with similar bird species
composition are plotted close together, and sites with less similarity are plotted further apart (Figure 4-10).
Figure 4-10. MDS plot of sites in riparian/ riverine habitats (blue) and sites in the three main woodland habitats (green). The black curved line delineates visually the cluster of riparian/ riverine sites in the upper right portion of the plot.
The MDS plot in Figure 4-10 shows a distinct cluster of sites in riparian/ riverine habitats, indicating a similarity in the
species composition of these sites. Analysis of the data showed that bird species composition differed significantly

40
between sites in riparian/ riverine habitats and sites in hills/plains woodland habitats (ANOSIM, R = 0.161, P =
0.001).
For sites in riparian/ riverine habitats, a SIMPER analysis showed that 12 species contributed approximately 70% of
the similarity of their bird compositions. Those species contributing most include Galah (11.1%), Red-rumped Parrot
(9.0%), Australian Magpie (8.52%), Brown Treecreeper (6.69%), Willie Wagtail (6.26%) and White-plumed
Honeyeater (5.3%).
For sites in the main hills/plains woodland habitat group, a SIMPER analysis showed that 16 species contributed
approximately 70% of the similarity of their bird assemblages, including Australian Magpie (8.27%), Red Wattlebird
(7.22%), Galah (6.31%), White-plumed Honeyeater (5.78%) and Sulphur-crested Cockatoo (5.47%).
Between the two habitat groupings, a SIMPER analysis showed that the species which contributed most to the
differences in species composition were Red-rumped Parrot (3.36%), Brown Treecreeper (2.75%), White-plumed
Honeyeater (6.89%), Sulphur-crested Cockatoo (2.73%) and Superb Fairy-wren (2.57%). Red-rumped Parrots were
over three times more abundant at sites in riparian/ riverine habitats. Similarly, Brown Treecreepers were nearly
twice as abundant at sites in riparian/ riverine habitats. In contrast, Superb Fairy-wren and Sulphur-crested
Cockatoo were more abundant in the hills/plains woodland habitat sites. Australian Magpie was found to have
similar abundance in both habitat groups and therefore contributed little to the observed differences between them.
4.8 Species as Indicators of biodiversity
Species which are relatively common and well known but sensitive to disturbance can be used as indicators of
environmental change. The presence (or absence) of such species at a site can be used to indicate the relative
health of the environment at that site (see Birds Australia 2003).
The analysis of the WBMP species composition data revealed that certain species make large contributions to the
similarity of bird populations within vegetation communities, and large contributions to the differences between
vegetation communities. The presence or absence of these species can therefore be indicative of the relative
biodiversity values of sites and of vegetation communities. An example of this is the Brown Treecreeper, a sedentary
woodland bird that is both widespread and relatively abundant across the Wimmera (see Table 4-1 and Table ), and
differed in its contribution to species composition across EVC groups (see Species Composition, above). Brown
Treecreepers are listed as Vulnerable in NSW where it is considered sensitive to habitat change, particularly the loss
of suitable hollow-bearing trees, fallen timber, overgrazing and loss of ground litter (NSW Environment & Heritage
website). In Victoria, Brown Treecreeper is listed as Near Threatened on the DSE Advisory List of Threatened
Vertebrate Fauna, 2007.
Brown Treecreeper, an example of an indicator species
The WBMP database contains 490 records of Brown Treecreeper from 70 sites surveyed four or more times, at an
overall reporting rate of 33%.

Wimmera CMA – working for a healthy Wimmera catchment
21
Table 4-12 shows reporting rates of Brown Treecreeper recorded within each EVC group across the Wimmera.

40
Table 4-12. Reporting rates of Brown Treecreepers recorded in each EVC group. The total number of surveys undertaken and total number of sites surveyed is also shown.
Vegetation community (EVC group) Reporting Rate (%)
Number of surveys
Number of sites
Riparian Forests or Woodlands 69.09 55 3
Riverine Grassy Woodlands or Forests 64.33 171 13
Riparian and/or Swampy Scrubs or Woodland 54.39 57 4
Plains Grasslands and Chenopod Shrublands 52.50 120 10 Box Ironbark Forests or dry/lower fertility Woodlands 47.37 38 3
Lower Slopes or Hills Woodlands 46.34 82 8
Plains Woodland or Forest Plains Woodland 38.73 204 16
Dry Forests 32.76 58 7
Herb-rich Woodlands 30.56 72 5
Heathy Woodlands 25.58 129 9
Wetland Freshwater 23.58 123 9
Mallee 12.50 33 4
Wetland Saline 5.26 19 1
Rocky outcrop or Escarpment Scrubs 4.76 63 6
Heathlands 1.69 59 5
No Native Vegetation 0.68 146 12
Lowland Forests 0 6 1
Salt-tolerant and/or succulent Shrublands 0 51 5
The results in
Wimmera CMA – working for a healthy Wimmera catchment
23
Table 4-12 show that Brown Treecreepers were most abundant in the three riparian/ riverine EVC groups (see Table
4-3). Brown Treecreepers also showed high relative abundance in the Plains Grassland and Chenopod Shrublands
EVC group, the Box Ironbark Forests or dry/lower fertility Woodlands EVC group and the Lower Slopes or Hills
Woodlands EVC group. In contrast, Brown Treecreepers were rarely recorded in Mallee or Heathlands EVC groups.
In the Wimmera, both the Plains Grassland and Chenopod Shrubland EVC group and Lower Slopes or Hills
Woodlands EVC group are dominated by endangered EVCs (DSE website). The presence of Brown Treecreepers in
endangered vegetation communities and in vegetation communities of high species richness demonstrates that this
species can be used as an indicator of sites important both for high conservation value and sites supporting high
biodiversity value.
The indicator species concept can be used effectively as a broad approach across woodland communities but should
be used with caution with specialised vegetation communities. As an example, Salt-tolerant and/or succulent
Shrublands as an EVC group was found to be relatively poor in bird species diversity (see Table 4-3), yet is
floristically complex, contains a number of threatened EVCs within the Wimmera and supports numerous listed
threatened species.
4.9 Birds as indicators of environmental change
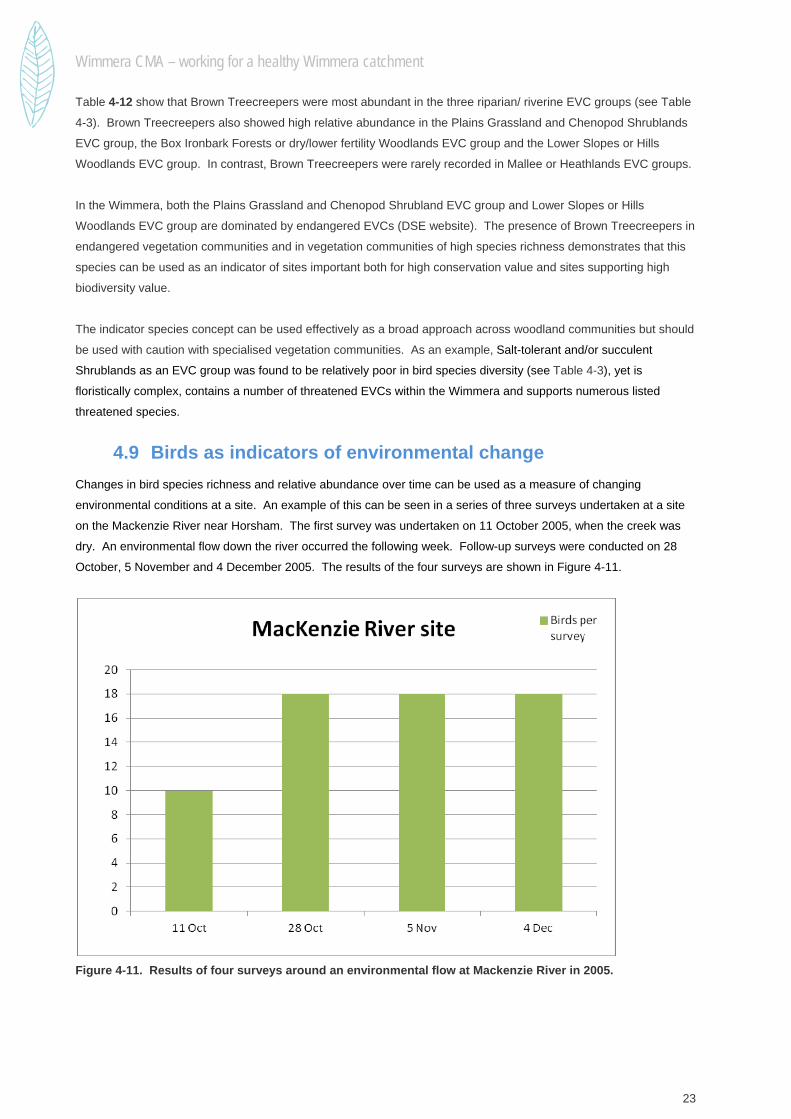
Changes in bird species richness and relative abundance over time can be used as a measure of changing
environmental conditions at a site. An example of this can be seen in a series of three surveys undertaken at a site
on the Mackenzie River near Horsham. The first survey was undertaken on 11 October 2005, when the creek was
dry. An environmental flow down the river occurred the following week. Follow-up surveys were conducted on 28
October, 5 November and 4 December 2005. The results of the four surveys are shown in Figure 4-11.
Figure 4-11. Results of four surveys around an environmental flow at Mackenzie River in 2005.
40
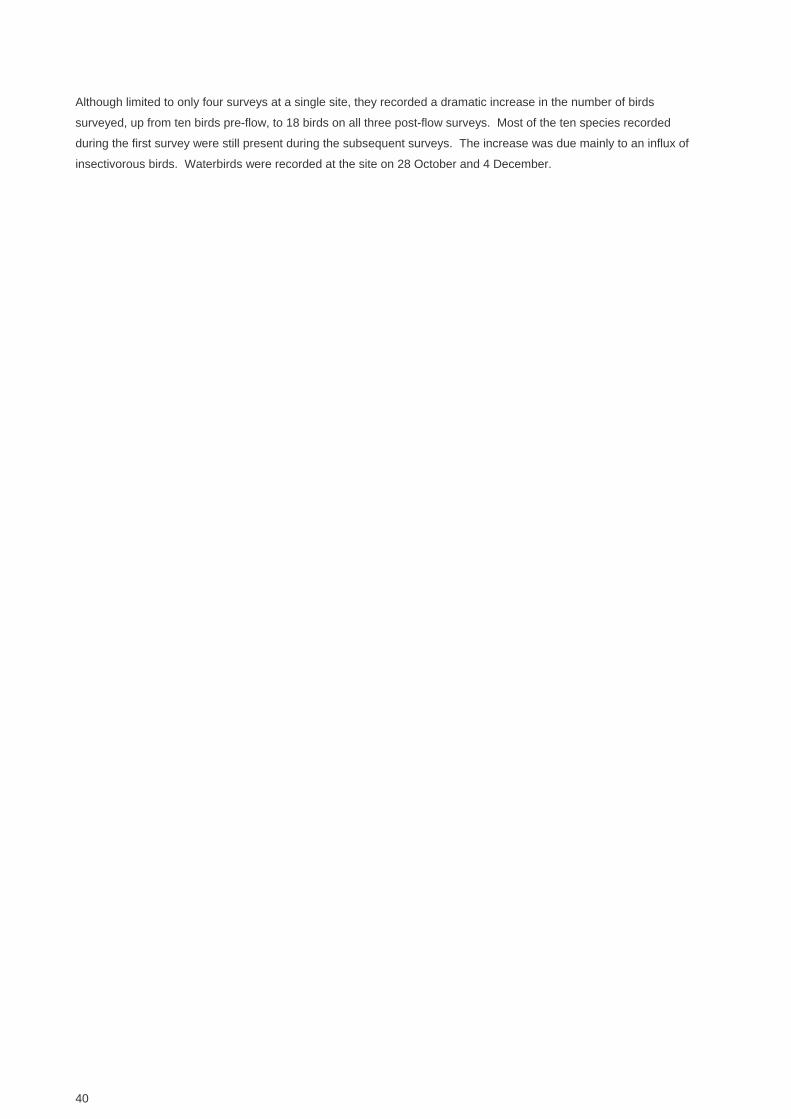
Although limited to only four surveys at a single site, they recorded a dramatic increase in the number of birds
surveyed, up from ten birds pre-flow, to 18 birds on all three post-flow surveys. Most of the ten species recorded
during the first survey were still present during the subsequent surveys. The increase was due mainly to an influx of
insectivorous birds. Waterbirds were recorded at the site on 28 October and 4 December.

Wimmera CMA – working for a healthy Wimmera catchment
25
5. Discussion The analysis of results show that the site parameter with the strongest influence on relative biodiversity values (as
measured by birds) across the Wimmera catchment is the vegetation community, or EVC group. Bird species
richness data for EVC groups showed a greater than four-fold difference between the most diverse vegetation
community (Herb-rich Woodlands) and the least diverse (Salt-tolerant and/or succulent Shrublands) (Table 4-3). The
characteristics which define EVCs, such as eucalypt-lined watercourses in riparian woodlands, or succulent
chenopod shrubs in salt-tolerant shrublands, also explain why bird species richness varies. For example, chenopod
shrubs grow in harsh, often highly saline conditions, and are relatively slow growing. They produce little nectar or
sap and do not attract a very broad suite of insects. Riparian understorey tends to grow in fertile, well-watered
conditions and is floristically very productive (see Costermans 2009). These characteristics will, however, vary in
condition across the catchment and be influenced by factors such as geography, stream flow, water quality and land
use.
The results showed significant geographic differences within vegetation communities (see Table 4-10 and Table 4-
11). Bioregions partly capture these differences, because bioregions reflect grouped landscape-scale natural
features and environmental processes. However, the significant variation between EVC groups within bioregions
(Table 4-10), and the significant variation within EVC groups between bioregions (Figure 4-4 and Figure 4-5)
demonstrate that bioregions only account for some of observed differences in biodiversity values across the
catchment.
Another factor explaining geographic variation in bird species richness within EVC groups is water quality and stream
flow. This is particularly important for riverine/ riparian vegetation types, which grow along waterways and associated
floodplains. The bird monitoring results (Table 4-12) show that bird species richness for riparian/ riverine EVC
groups varied geographically (local council districts). During the five year survey period, stream flow down the main
waterways in the catchment (Wimmera River and Yarriambiack Creek) was low to non-existent (unpublished WCMA
data). The highest bird species richness for riparian/ riverine EVC groups was recorded in the Horsham local council
district, where salinity levels were lowest and some stream flow occurred. Moderate levels of bird species richness
were recorded in the Hindmarsh local council district, where water was present but salinity levels were higher. The
lowest bird species richness for riparian/ riverine EVC groups was recorded in the Yarriambiack local council district,
where water was absent.
The effect of stream flow on bird populations can also be demonstrated through observations at the Mackenzie River
site (Figure 4-11). The dramatic increase in bird species richness following an environmental release demonstrates
not only the importance of stream flow to birds (and by inference, biodiversity) but the ability of bird monitoring as a
tool to detect rapid environmental change.
The bird monitoring results also demonstrate that significant differences in biodiversity values linked are to land
tenure (
Table 4-4). The differences in relative biodiversity values observed have implications for the way land is managed
across the catchment. For example, Box Ironbark habitats had significantly higher biodiversity values on public land
compared to freehold. This suggests that land use practices on private land are degrading the value of these

40
habitats for biodiversity. Freshwater wetland habitats had significantly higher biodiversity values on freehold land
compared with crown land, suggesting that land management practices on freehold land were
beneficial to biodiversity. The reasons for these observed differences would only become apparent from a more
detailed examination of the attributes of the respective vegetation communities.
Some bird species are more indicative of biodiversity values than others. The results have shown that presence of
certain bird species at a site are can be good indicators of relative biodiversity values. Species such as the Brown
Treecreeper can be used to indicate high conservation value vegetation. The presence or absence of these species
can be used guide management decisions for prioritising on-ground habitat works such as protection, revegetation
and connectivity.

Wimmera CMA – working for a healthy Wimmera catchment
27
6. Management Implications One of the original aims of the bird monitoring project was to track the condition of WCMA assets as measured by
bird communities. The results of the bird monitoring project have shown that biodiversity differences exist across the
catchment and that these differences are expressed most strongly through variation in vegetation communities, and
to a lesser extent, geography and land tenure. The condition of an environmental asset can be measured across any
gradient by assessing relative biodiversity values. Gradients can occur across time, such as the establishment and
growth of revegetation areas, the regrowth of native vegetation following fire, or long-term changes in vegetation
quality due to climatic variation. Gradients can also be physical, such as salinity differences along waterways, the
impacts of environmental water releases or the effectiveness of landscape connectivity. Biodiversity values along
these gradients can be measured through analysing the survey data in the bird monitoring database. An example of
this can be seen in the results for geographic variation within EVC groups (see Results, section 4.6). The bird
monitoring project has demonstrated both the feasibility and effectiveness of tracking WCMA assets by measuring
bird communities.
A second aim of the bird monitoring project was to establish a strategy for gauging the success of on-ground
management for protecting terrestrial biodiversity. This project has demonstrated that regular bird monitoring at
selected sites can be an effective method of measuring biodiversity values across the catchment. The Wimmera
CMA has invested huge sums of money into on-ground management activities, including protection and
enhancement of native vegetation on private land through tender and incentive funding models, revegetation
programs, salinity control, wetland and riparian restoration. Site inspections may reveal reductions in weed levels or
pest animal activity, changes in vegetation structure and condition, or growth and survival rates in revegetation plots,
but do not reveal much about the ecological function of these sites. Are we just planting trees, or creating additional,
ecologically functioning habitat for wildlife? An assessment of the biodiversity value of a site, as measured by birds,
can be a powerful way of gauging the success of on-ground management programs.
Understanding catchment-wide biodiversity values will allow the WCMA to make informed decisions for priority
planning and decision-making within the framework of its Regional Catchment Strategy.
40
7. Recommendations The following broad recommendation can be made from the outcomes of the Wimmera Bird Monitoring Project.
Incorporate the biodiversity values of vegetation communities into on-ground management planning and action.
The WCMA possesses a large dataset showing the relative biodiversity values of different vegetation communities
(as measured by EVC groups) across the Wimmera catchment. The WCMA can identify which vegetation
communities support the highest biodiversity values and determine where high biodiversity values occur.
From a geographic perspective, the WCMA can identify high value areas on a broad scale, such as by regional
council boundaries or waterway catchment, or on a local scale, such as local Landcare groups. This can help form
the basis of identifying priority areas, or priority zones within a defined area.
From an ecological perspective, high value vegetation communities can be prioritised within identified geographic
boundaries, or catchment-wide. Priorities can also be determined for focal species, either directly from existing
records, or through extrapolation from known habitat values.
The land tenure of identified high biodiversity priority areas can also help determine the focus of activities, for
example, on co-operative management, such as with government agencies if on crown land, landholder agreements
if on private land, or with multiple groups if building connectivity between priority areas of different tenure.
An additional recommendation is made for on-going monitoring of key sites across the catchment.
The Wimmera Bird Monitoring Project conducted surveys for five years. Some sites have been monitored
continuously since 2005. The Wimmera experienced drought conditions for most of the five year monitoring period.
Although this data set reflects biodiversity values as they existed in a dry climate period, only through on-going
monitoring will it be possible to reveal how biodiversity values change with, for example, the flooding rains of 2010,
and therefore how assets change with changing climate. Bird monitoring has continued since 2009 at approximately
20 sites, driven partly by the efforts of dedicated volunteers, and partly through WCMA projects such as EWR
monitoring and Project Hindmarsh. Maintaining a degree of monitoring of key sites will allow the WCMA to
continuously track the condition of catchment assets, the effectiveness of on-ground works and environmental
response to climate change.
Wimmera CMA – working for a healthy Wimmera catchment
29
8. References Barrett, G., A. Silcocks, S. Barry, R. Cunningham & R. Poulter (2003). The new Atlas of Australian birds. Royal
Australasian Ornithologists Union, Hawthorn East.
Birds Australia (2003). Integrating Biodiversity into Regional Planning – the Wimmera Catchment Management
Authority Pilot Project. Scoping .Report prepared for the Wimmera Catchment Management Authority. Birds
Australia, Melbourne.
Clarke, K.R. & R.M. Warwick (2001). Change in Marine Communities: An Approach to Statistical Analysis and
Interpretation. Plymouth Marine Laboratory, Plymouth, UK.
Costermans, L. (2009). Native Trees and Shrubs of South-Eastern Australia. New Holland Publishers, Sydney.
Department of Sustainability and Environment. (2007). Advisory list of threatened vertebrate fauna in Victoria. DSE:
East Melbourne.
Fowler, J. and L. Cohen (1996). Statistics for Ornithologists. BTO Guide 22. British Trust for Ornithology, Tring, UK.
Johnson, M., P. Reich & R. MacNally (2007). Bird assemblages of a fragmented agricultural landscape and the
relative importance of vegetation structure and landscape pattern. Wildlife Research 34: 185—193.

40
9. Appendix 1 List of bird species recorded in the Wimmera, showing their taxonomic relationship of Order and Family, plus their
common names and scientific names. The Birds Australia Atlas numbers are also shown. The list has been
compiled from information supplied by Horsham BirdLife and from sightings data in the Wimmera Bird Monitoring
Project database.
ORDER, Family, Common Name Scientific Name Atlas No. CASUARIIFORMES
Casuariidae
Emu Dromaius novaehollandiae 1
GALLIFORMES
Megapodiidae
Malleefowl Leipoa ocellata 7
Phasianidae
Stubble Quail Coturnix pectoralis 9
Brown Quail Coturnix ypsilophora 11
ANSERIFORMES
Anatidae
Plumed Whistling-Duck Dendrocygna eytoni 205
Musk Duck Biziura lobata 217
Freckled Duck Stictonetta naevosa 214
Cape Barren Goose Cereopsis novaehollandiae 198
Black Swan Cygnus atratus 203
Australian Shelduck Tadorna tadornoides 207
Australian Wood Duck Chenonetta jubata 202
Pink-eared Duck Malacorhynchus membranaceus 213
Australasian Shoveler Anas rhynchotis 212
Grey Teal Anas gracilis 211
Chestnut Teal Anas castanea 210
Pacific Black Duck Anas superciliosa 208
Hardhead Aythya australis 215
Blue-billed Duck Oxyura australis 216
PODICIPEDIFORMES
Podicipedidae
Australasian Grebe Tachybaptus novaehollandiae 61
Hoary-headed Grebe Poliocephalus poliocephalus 62
Great Crested Grebe Podiceps cristatus 60
COLUMBIFORMES
Columbidae
Rock Dove Columba livia 957
Spotted Turtledove Streptopelia chinensis 989
Common Bronzewing Phaps chalcoptera 34
Brush Bronzewing Phaps elegans 35
Crested Pigeon Ocyphaps lophotes 43
Diamond Dove Geopelia cuneata 31
Peaceful Dove Geopelia striata 30
CAPRIMULGIFORMES
Podargidae
Tawny Frogmouth Podargus strigoides 313

Wimmera CMA – working for a healthy Wimmera catchment
31
ORDER, Family, Common Name Scientific Name Atlas No. Eurostopodidae
White-throated Nightjar Eurostopodus mystacalis 330
Spotted Nightjar Eurostopodus argus 331
APODIFORMES
Aegothelidae
Australian Owlet-nightjar Aegotheles cristatus 317
Apodidae
White-throated Needletail Hirundapus caudacutus 334
Fork-tailed Swift Apus pacificus 335
Anhingidae
Australasian Darter Anhinga novaehollandiae 101
Phalacrocoracidae
Little Pied Cormorant Microcarbo melanoleucos 100
Great Cormorant Phalacrocorax carbo 96
Little Black Cormorant Phalacrocorax sulcirostris 97
Pied Cormorant Phalacrocorax varius 99
CICONIIFORMES
Pelecanidae
Australian Pelican Pelecanus conspicillatus 106
Ardeidae
Australasian Bittern Botaurus poiciloptilus 197
Australian Little Bittern Ixobrychus dubius 195
White-necked Heron Ardea pacifica 189
Eastern Great Egret Ardea modesta 187
Intermediate Egret Ardea intermedia 186
Cattle Egret Ardea ibis 977
White-faced Heron Egretta novaehollandiae 188
Little Egret Egretta garzetta 185
Nankeen Night-Heron Nycticorax caledonicus 192
Threskiornithidae
Glossy Ibis Plegadis falcinellus 178
Australian White Ibis Threskiornis molucca 179
Straw-necked Ibis Threskiornis spinicollis 180
Royal Spoonbill Platalea regia 181
Yellow-billed Spoonbill Platalea flavipes 182
ACCIPITRIFORMES
Accipitridae
Black-shouldered Kite Elanus axillaris 232
Letter-winged Kite Elanus scriptus 233
Square-tailed Kite Lophoictinia isura 230
White-bellied Sea-Eagle Haliaeetus leucogaster 226
Whistling Kite Haliastur sphenurus 228
Black Kite Milvus migrans 229
Brown Goshawk Accipiter fasciatus 221
Collared Sparrowhawk Accipiter cirrocephalus 222
Spotted Harrier Circus assimilis 218
Swamp Harrier Circus approximans 219
Wedge-tailed Eagle Aquila audax 224
Little Eagle Hieraaetus morphnoides 225
FALCONIFORMES
Falconidae

40
ORDER, Family, Common Name Scientific Name Atlas No. Nankeen Kestrel Falco cenchroides 240
Brown Falcon Falco berigora 239
Australian Hobby Falco longipennis 235
Black Falcon Falco subniger 238
Peregrine Falcon Falco peregrinus 237
GRUIFORMES
Gruidae
Brolga Grus rubicunda 177
Rallidae
Purple Swamphen Porphyrio porphyrio 58
Buff-banded Rail Gallirallus philippensis 46
Baillon's Crake Porzana pusilla 50
Australian Spotted Crake Porzana fluminea 49
Spotless Crake Porzana tabuensis 51
Black-tailed Native-hen Tribonyx ventralis 55
Dusky Moorhen Gallinula tenebrosa 56
Eurasian Coot Fulica atra 59
Otididae
Australian Bustard Ardeotis australis 176
CHARADRIIFORMES
Burhinidae
Bush Stone-curlew Burhinus grallarius 174
Recurvirostridae
Black-winged Stilt Himantopus himantopus 146
Red-necked Avocet Recurvirostra novaehollandiae 148
Banded Stilt Cladorhynchus leucocephalus 147
Charadriidae
Red-capped Plover Charadrius ruficapillus 143
Double-banded Plover Charadrius bicinctus 140
Inland Dotterel Charadrius australis 145
Black-fronted Dotterel Elseyornis melanops 144
Red-kneed Dotterel Erythrogonys cinctus 132
Banded Lapwing Vanellus tricolor 135
Masked Lapwing Vanellus miles 133
Pedionomidae
Plains-wanderer Pedionomus torquatus 20
Rostratulidae
Australian Painted Snipe Rostratula australis 170
Scolopacidae
Latham's Snipe Gallinago hardwickii 168
Common Greenshank Tringa nebularia 158
Marsh Sandpiper Tringa stagnatilis 159
Red-necked Stint Calidris ruficollis 162
Sharp-tailed Sandpiper Calidris acuminata 163
Curlew Sandpiper Calidris ferruginea 161
Turnicidae
Painted Button-quail Turnix varius 14
Red-chested Button-quail Turnix pyrrhothorax 19
Little Button-quail Turnix velox 18
Glareolidae
Australian Pratincole Stiltia isabella 173

Wimmera CMA – working for a healthy Wimmera catchment
33
ORDER, Family, Common Name Scientific Name Atlas No. Laridae
Gull-billed Tern Gelochelidon nilotica 111
Whiskered Tern Chlidonias hybrida 110
Silver Gull Chroicocephalus novaehollandiae 125
PSITTACIFORMES
Cacatuidae
Red-tailed Black-Cockatoo Calyptorhynchus banksii 264
Yellow-tailed Black-Cockatoo Calyptorhynchus funereus 267
Gang-gang Cockatoo Callocephalon fimbriatum 268
Galah Eolophus roseicapillus 273
Long-billed Corella Cacatua tenuirostris 272
Little Corella Cacatua sanguinea 271
Sulphur-crested Cockatoo Cacatua galerita 269
Cockatiel Nymphicus hollandicus 274
Psittacidae
Rainbow Lorikeet Trichoglossus haematodus 254
Musk Lorikeet Glossopsitta concinna 258
Little Lorikeet Glossopsitta pusilla 260
Purple-crowned Lorikeet Glossopsitta porphyrocephala 259
Regent Parrot Polytelis anthopeplus 278
Crimson Rosella Platycercus elegans 282
Eastern Rosella Platycercus eximius 288
Australian Ringneck Barnardius zonarius 294
Blue Bonnet Northiella haematogaster 297
Swift Parrot Lathamus discolor 309
Red-rumped Parrot Psephotus haematonotus 295
Mulga Parrot Psephotus varius 296
Budgerigar Melopsittacus undulatus 310
Blue-winged Parrot Neophema chrysostoma 306
Elegant Parrot Neophema elegans 307
CUCULIFORMES
Cuculidae
Horsfield's Bronze-Cuckoo Chalcites basalis 342
Black-eared Cuckoo Chalcites osculans 341
Shining Bronze-Cuckoo Chalcites lucidus 344
Pallid Cuckoo Cacomantis pallidus 337
Fan-tailed Cuckoo Cacomantis flabelliformis 338
STRIGIFORMES
Strigidae
Powerful Owl Ninox strenua 248
Barking Owl Ninox connivens 246
Southern Boobook Ninox novaeseelandiae 242
Tytonidae
Eastern Barn Owl Tyto javanica 249
CORACIIFORMES
Halcyonidae
Laughing Kookaburra Dacelo novaeguineae 322
Red-backed Kingfisher Todiramphus pyrrhopygius 325
Sacred Kingfisher Todiramphus sanctus 326
Meropidae
Rainbow Bee-eater Merops ornatus 329

40
ORDER, Family, Common Name Scientific Name Atlas No. Coraciidae
Dollarbird Eurystomus orientalis 318
PASSERIFORMES
Climacteridae
White-throated Treecreeper Cormobates leucophaea 558
White-browed Treecreeper Climacteris affinis 561
Brown Treecreeper Climacteris picumnus 555
Maluridae
Superb Fairy-wren Malurus cyaneus 529
Splendid Fairy-wren Malurus splendens 532
Variegated Fairy-wren Malurus lamberti 536
Acanthizidae
White-browed Scrubwren Sericornis frontalis 488
Chestnut-rumped Heathwren Calamanthus pyrrhopygia 498
Shy Heathwren Calamanthus cautus 499
Striated Fieldwren Calamanthus fuliginosus 500
Redthroat Pyrrholaemus brunneus 497
Speckled Warbler Chthonicola sagittata 504
Weebill Smicrornis brevirostris 465
Western Gerygone Gerygone fusca 463
Striated Thornbill Acanthiza lineata 470
Yellow Thornbill Acanthiza nana 471
Yellow-rumped Thornbill Acanthiza chrysorrhoa 486
Chestnut-rumped Thornbill Acanthiza uropygialis 481
Buff-rumped Thornbill Acanthiza reguloides 484
Slender-billed Thornbill Acanthiza iredalei 482
Inland Thornbill Acanthiza apicalis 476
Brown Thornbill Acanthiza pusilla 475
Southern Whiteface Aphelocephala leucopsis 466
Pardalotidae
Spotted Pardalote Pardalotus punctatus 565
Striated Pardalote Pardalotus striatus 976
Meliphagidae
Eastern Spinebill Acanthorhynchus tenuirostris 591
Lewin's Honeyeater Meliphaga lewinii 605
Yellow-faced Honeyeater Lichenostomus chrysops 614
Singing Honeyeater Lichenostomus virescens 608
White-eared Honeyeater Lichenostomus leucotis 617
Yellow-tufted Honeyeater Lichenostomus melanops 619
Yellow-plumed Honeyeater Lichenostomus ornatus 622
Fuscous Honeyeater Lichenostomus fuscus 613
White-plumed Honeyeater Lichenostomus penicillatus 625
White-fronted Honeyeater Purnella albifrons 594
Noisy Miner Manorina melanocephala 634
Yellow-throated Miner Manorina flavigula 635
Spiny-cheeked Honeyeater Acanthagenys rufogularis 640
Little Wattlebird Anthochaera chrysoptera 712
Red Wattlebird Anthochaera carunculata 638
Black Honeyeater Sugomel niger 589
Tawny-crowned Honeyeater Glyciphila melanops 593
Crescent Honeyeater Phylidonyris pyrrhopterus 630
Wimmera CMA – working for a healthy Wimmera catchment
35
ORDER, Family, Common Name Scientific Name Atlas No. New Holland Honeyeater Phylidonyris novaehollandiae 631
Black-chinned Honeyeater Melithreptus gularis 580
Brown-headed Honeyeater Melithreptus brevirostris 583
White-naped Honeyeater Melithreptus lunatus 578
Blue-faced Honeyeater Entomyzon cyanotis 641
Crimson Chat Epthianura tricolor 449
Orange Chat Epthianura aurifrons 450
White-fronted Chat Epthianura albifrons 448
Pomatostomidae Grey-crowned Babbler Pomatostomus temporalis 443
White-browed Babbler Pomatostomus superciliosus 445
Neosittidae
Varied Sittella Daphoenositta chrysoptera 549
Campephagidae
Black-faced Cuckoo-shrike Coracina novaehollandiae 424
White-bellied Cuckoo-shrike Coracina papuensis 425
White-winged Triller Lalage sueurii 430
Pachycephalidae
Crested Shrike-tit Falcunculus frontatus 416
Olive Whistler Pachycephala olivacea 405
Gilbert's Whistler Pachycephala inornata 403
Golden Whistler Pachycephala pectoralis 398
Rufous Whistler Pachycephala rufiventris 401
Grey Shrike-thrush Colluricincla harmonica 408
Crested Bellbird Oreoica gutturalis 419
Oriolidae
Olive-backed Oriole Oriolus sagittatus 671
Artamidae
White-breasted Woodswallow Artamus leucorynchus 543
Masked Woodswallow Artamus personatus 544
White-browed Woodswallow Artamus superciliosus 545
Black-faced Woodswallow Artamus cinereus 546
Dusky Woodswallow Artamus cyanopterus 547
Grey Butcherbird Cracticus torquatus 702
Pied Butcherbird Cracticus nigrogularis 700
Australian Magpie Cracticus tibicen 705
Pied Currawong Strepera graculina 694
Grey Currawong Strepera versicolor 697
Rhipiduridae
Rufous Fantail Rhipidura rufifrons 362
Grey Fantail Rhipidura albiscapa 361
Willie Wagtail Rhipidura leucophrys 364
Corvidae
Australian Raven Corvus coronoides 930
Forest Raven Corvus tasmanicus 868
Little Raven Corvus mellori 954
Monarchidae
Leaden Flycatcher Myiagra rubecula 365
Satin Flycatcher Myiagra cyanoleuca 366
Restless Flycatcher Myiagra inquieta 728
Black-faced Monarch Monarcha melanopsis 373

40
ORDER, Family, Common Name Scientific Name Atlas No. Magpie-lark Grallina cyanoleuca 415
Corcoracidae
White-winged Chough Corcorax melanorhamphos 693
Petroicidae
Jacky Winter Microeca fascinans 377
Scarlet Robin Petroica boodang 380
Red-capped Robin Petroica goodenovii 381
Flame Robin Petroica phoenicea 382
Rose Robin Petroica rosea 384
Hooded Robin Melanodryas cucullata 385
Eastern Yellow Robin Eopsaltria australis 392
Southern Scrub-robin Drymodes brunneopygia 441
Alaudidae
Horsfield’s Bushlark Mirafra javanica 648
Eurasian Skylark Alauda arvensis 993
Cisticolidae
Golden-headed Cisticola Cisticola exilis 525
Acrocephalidae
Australian Reed-Warbler Acrocephalus australis 524
Megaluridae
Little Grassbird Megalurus gramineus 522
Rufous Songlark Cincloramphus mathewsi 509
Brown Songlark Cincloramphus cruralis 508
Timaliidae
Silvereye Zosterops lateralis 574
Hirundinidae
White-backed Swallow Cheramoeca leucosterna 358
Welcome Swallow Hirundo neoxena 357
Fairy Martin Petrochelidon ariel 360
Tree Martin Petrochelidon nigricans 359
Turdidae
Bassian Thrush Zoothera lunulata 779
Common Blackbird Turdus merula 991
Sturnidae
Common Starling Sturnus vulgaris 999
Nectariniidae
Mistletoebird Dicaeum hirundinaceum 564
Estrildidae
Zebra Finch Taeniopygia guttata 653
Red-browed Finch Neochmia temporalis 662
Diamond Firetail Stagonopleura guttata 652
Passeridae
House Sparrow Passer domesticus 995
Motacillidae
Australasian Pipit Anthus novaeseelandiae 647
Fringillidae
European Goldfinch Carduelis carduelis 996
Common Greenfinch Chloris chloris 997
Wimmera CMA – working for a healthy Wimmera catchment
37
10. Appendix 2 Table of all sites surveyed, showing the five site parameters, plus local government region, number of surveys undertaken, mean species richness and the total number of bird species recorded at the site.
Site no.
Bioregion EVC group name Land
Tenure Patch Size
Isolation category
Local Government district
N surveys
Mean birds / survey
Total Species
8000 Wimmera No Native Vegetation Freehold - - Northern Grampians 15 4.53 17
8001 Wimmera Riparian and/ or Swampy Scrubs or Woodland
Crown Land M Isolated Northern Grampians 11 5.72 17
8004 Greater Grampians Heathy Woodlands Crown Land L Continuous Northern Grampians 13 4.85 23
8005 Wimmera Riparian Forests or Woodlands
Crown Land M Isolated Northern Grampians 17 9.94 30
8007 Goldfields Dry Forests Crown Land L Continuous Pyrenees 7 10.71 31
8009 Wimmera Plains Woodland or Forest Plains Woodland
Freehold L Semi-isolated Northern Grampians 3 12.33 19
8011 Goldfields Plains Woodland or Forest Plains Woodland
Freehold S Isolated Northern Grampians 10 7.1 24
8013 Wimmera Plains Woodland or Forest Plains Woodland
Freehold L Not Isolated Northern Grampians 16 17.25 44
8015 Greater Grampians Rocky outcrop or escarpment Scrubs
Crown Land L Continuous Northern Grampians 16 9.44 38
8016 Wimmera No Native Vegetation Freehold - - Yarriambiack 4 1 2
8018 Wimmera Plains Woodland or Forest Plains Woodland
Crown Land L Continuous Northern Grampians 13 2.23 9
8019 Goldfields No Native Vegetation Freehold - - Pyrenees 7 3.57 12
8021 Goldfields Plains Woodland or Forest Plains Woodland
Crown Land L Not Isolated Northern Grampians 10 5.3 20
8022 Greater Grampians Herb-rich Woodlands Crown Land L Continuous Northern Grampians 20 5.9 30
8024 Wimmera Box Ironbark Forests/ Woodlands
Freehold L Not Isolated Northern Grampians 13 5 23
8025 Goldfields No Native Vegetation Freehold - - Ararat 18 5.33 29
8026 Goldfields Box Ironbark Forests/ Woodlands
Crown Land L Not Isolated Northern Grampians 17 8.12 33
40
Site no.
Bioregion EVC group name Land
Tenure Patch Size
Isolation category
Local Government district
N surveys
Mean birds / survey
Total Species
8029 Goldfields Heathy Woodlands Crown Land S Isolated Northern Grampians 9 8.11 33
8031 Goldfields Wetland Freshwater Crown Land L Not Isolated Northern Grampians 10 5 13
8035 Goldfields Lower Slopes or Hills Woodlands
Freehold L Not Isolated Northern Grampians 6 13.67 41
8036 Greater Grampians Dry Forests Crown Land L Continuous Northern Grampians 18 5 28
8038 Central Victorian Uplands
Dry Forests Freehold L Continuous Pyrenees 6 9.33 29
8039 Goldfields Herb-rich Woodlands Freehold L Semi-isolated Northern Grampians 19 19.11 76
8041 Greater Grampians Lowland Forests Crown Land L Continuous Northern Grampians 6 3.33 12
8043 Goldfields Dry Forests Freehold L Semi-isolated Northern Grampians 8 9.625 33
8045 Goldfields Herb-rich Woodlands Freehold S Isolated Pyrenees 6 11.33 23
8049 Central Victorian Uplands
Dry Forests Crown Land L Continuous Ararat 7 4.86 13
8050 Greater Grampians Rocky outcrop or escarpment Scrubs
Crown Land L Continuous Northern Grampians 5 2 8
8054 Greater Grampians Montane Crown Land L Continuous Northern Grampians 2 3 5
8055 Central Victorian Uplands
Rocky outcrop or escarpment Scrubs
Crown Land L Continuous Ararat 7 7.86 24
8056 Central Victorian Uplands
Dry Forests Crown Land L Continuous Ararat 7 7.86 26
8057 Greater Grampians Heathy Woodlands Crown Land L Continuous Ararat 2 7 9
8058 Goldfields Dry Forests Freehold S Isolated Ararat 5 7.2 20
8059 Wimmera No Native Vegetation Freehold - - Horsham 13 0.923 7
8060 Wimmera Riparian and/ or Swampy Scrubs or Woodland
Crown Land L Continuous Horsham 13 6.38 35
8061 Lowan Mallee Plains Woodland or Forest Plains Woodland
Crown Land L Continuous Horsham 3 10.33 25
8062 Wimmera No Native Vegetation Freehold - - Horsham 17 0.82 6
8063 Wimmera No Native Vegetation Freehold - - Horsham 3 3.67 8
8068 Wimmera Plains Woodland or Forest Plains Woodland
Crown Land L Not Isolated Horsham 6 7.83 26
8069 Wimmera Salt-tolerant and/ or succulent Shrublands
Crown Land M Isolated Horsham 10 2.7 18

Wimmera CMA – working for a healthy Wimmera catchment
39
Site no.
Bioregion EVC group name Land
Tenure Patch Size
Isolation category
Local Government district
N surveys
Mean birds / survey
Total Species
8070 Wimmera Riverine Grassy Woodlands or Forests
Crown Land M Isolated Horsham 13 15.08 38
8071 Wimmera Mallee Freehold S Isolated Horsham 2 9.5 16
8072 Wimmera Riverine Grassy Woodlands or Forests
Freehold M Isolated Horsham 5
8073 Wimmera Salt-tolerant and/ or succulent Shrublands
Crown Land L Semi-isolated Horsham 8 3.125 14
8074 Wimmera Riverine Grassy Woodlands or Forests
Crown Land M Isolated Horsham 13 6.08 22
8075 Wimmera Salt-tolerant and/ or succulent Shrublands
Freehold M Isolated Horsham 12 1.75 11
8076 Wimmera Riparian and/ or Swampy Scrubs or Woodland
Crown Land M Semi-isolated Horsham 16 13 52
8078 Greater Grampians Rocky outcrop or escarpment Scrubs
Crown Land L Continuous Horsham 7 5.14 19
8079 Wimmera Plains Woodland or Forest Plains Woodland
Freehold M Semi-isolated Horsham 15 10.2 47
8080 Wimmera Plains Woodland or Forest Plains Woodland
Crown Land S Isolated Horsham 2 9 14
8082 Wimmera Riparian Forests or Woodlands
Crown Land M Semi-isolated Horsham 18 9.44 30
8083 Wimmera Riparian Forests or Woodlands
Crown Land M Isolated Horsham 20 11 47
8085 Wimmera Mallee Freehold S Semi-isolated Horsham 2 10 15
8087 Wimmera Wetland Saline Crown Land M Semi-isolated Horsham 2 2.5 5
8088 Wimmera No Native Vegetation Freehold - - Horsham 1 2 2
8089 Wimmera Salt-tolerant and/ or succulent Shrublands
Crown Land M Isolated Horsham 2 2 4
8090 Wimmera Heathy Woodlands Crown Land L Continuous Horsham 20 3 28
8091 Wimmera Riverine Grassy Woodlands or Forests
Crown Land M Semi-isolated Horsham 11 9.45 22
8092 Wimmera Riparian and/ or Swampy Scrubs or Woodland
Freehold M Isolated Horsham 17 13.41 40
8094 Wimmera Heathy Woodlands Crown Land L Continuous Horsham 7 4 14
8095 Wimmera Plains Woodland or Forest Plains Woodland
Freehold M Isolated Horsham 20 14.6 56

40
Site no.
Bioregion EVC group name Land
Tenure Patch Size
Isolation category
Local Government district
N surveys
Mean birds / survey
Total Species
8096 Wimmera Wetland Freshwater Freehold M Semi-isolated Horsham 21 8.43 32
8097 Greater Grampians Heathy Woodlands Freehold M Semi-isolated Horsham 17 8.59 34
8098 Dundas Tablelands Herb-rich Woodlands Crown Land L Not Isolated Horsham 21 11.24 49
8099 Wimmera Plains Woodland or Forest Plains Woodland
Crown Land L Not Isolated Horsham 14 7.57 36
8100 Greater Grampians Heathy Woodlands Freehold M Semi-isolated Horsham 19 10.95 42
8103 Greater Grampians Rocky outcrop or escarpment Scrubs
Crown Land L Continuous Horsham 20 3.85 30
8105 Dundas Tablelands Heathlands Crown Land L Continuous Horsham 21 8.57 53
8107 Murray Mallee No Native Vegetation Freehold - - Buloke 4 0.25 1
8109 Murray Mallee Riverine Grassy Woodlands or Forests
Freehold M Isolated Yarriambiack 7 9.43 25
8111 Murray Mallee Plains Grasslands/ Chenopod Shrubland
Freehold M Semi-isolated Buloke 12 5.33 17
8112 Murray Mallee Riverine Grassy Woodlands or Forests
Freehold M Isolated Yarriambiack 7 5.14 11
8114 Murray Mallee Plains Grasslands/ Chenopod Shrubland
Freehold M Isolated Yarriambiack 11 3.09 12
8117 Wimmera Plains Grasslands/ Chenopod Shrubland
Freehold M Isolated Yarriambiack 1 6 6
8118 Murray Mallee Riverine Grassy Woodlands or Forests
Freehold M Isolated Yarriambiack 15 5.33 23
8120 Wimmera Plains Grasslands/ Chenopod Shrubland
Freehold M Isolated Yarriambiack 2 11.5 15
8121 Wimmera Mallee Freehold M Isolated Yarriambiack 2 7.5 11
8122 Wimmera Mallee Freehold S Isolated Yarriambiack 8 8 22
8125 Wimmera Plains Grasslands/ Chenopod Shrubland
Freehold M Isolated Yarriambiack 2 9.5 13
8127 Murray Mallee Plains Grasslands/ Chenopod Shrubland
Freehold S Isolated Buloke 1 6 6
8128 Wimmera Riverine Grassy Woodlands or Forests
Crown Land M Isolated Yarriambiack 2 8.5 13
8129 Wimmera Plains Grasslands/ Chenopod Shrubland
Freehold M Isolated Yarriambiack 13 8.77 28
8130 Wimmera Lower Slopes or Hills Woodlands
Crown Land L Not Isolated Yarriambiack 13 6.31 27

Wimmera CMA – working for a healthy Wimmera catchment
41
Site no.
Bioregion EVC group name Land
Tenure Patch Size
Isolation category
Local Government district
N surveys
Mean birds / survey
Total Species
8131 Wimmera Plains Grasslands/ Chenopod Shrubland
Freehold L Semi-isolated Yarriambiack 6 14 25
8132 Wimmera Riverine Grassy Woodlands or Forests
Freehold M Semi-isolated Yarriambiack 14 9.36 30
8133 Wimmera No Native Vegetation Freehold - - Yarriambiack 21 1.667 18
8134 Wimmera Riverine Grassy Woodlands or Forests
Freehold M Isolated Yarriambiack 21 9.19 41
8135 Wimmera Plains Grasslands/ Chenopod Shrubland
Crown Land M Semi-isolated Yarriambiack 21 9.33 35
8136 Wimmera Lower Slopes or Hills Woodlands
Freehold M Not Isolated Yarriambiack 6 15.67 37
8137 Wimmera Lower Slopes or Hills Woodlands
Crown Land L Continuous Yarriambiack 7 5.86 18
8138 Wimmera Plains Woodland or Forest Plains Woodland
Crown Land L Not Isolated Yarriambiack 15 5.87 16
8142 Murray Mallee Riverine Grassy Woodlands or Forests
Crown Land L Not Isolated Hindmarsh 14 10.36 40
8143 Murray Mallee Salt-tolerant and/ or succulent Shrublands
Freehold L Continuous Hindmarsh 15 3.13 19
8145 Murray Mallee Wetland Freshwater Crown Land L Continuous Hindmarsh 15 2.4 13
8148 Murray Mallee Riverine Grassy Woodlands or Forests
Crown Land M Semi-isolated Hindmarsh 3 3.67 7
8149 Murray Mallee Riverine Grassy Woodlands or Forests
Crown Land L Not Isolated Hindmarsh 3 5.33 13
8150 Murray Mallee No Native Vegetation Freehold - - Hindmarsh 5 3.2 9
8152 Lowan Mallee Mallee Freehold L Continuous Hindmarsh 2 6.5 13
8154 Wimmera Plains Grasslands/ Chenopod Shrubland
Freehold M Isolated Hindmarsh 5 12.8 29
8157 Wimmera Plains Grasslands/ Chenopod Shrubland
Freehold M Isolated Hindmarsh 12 7 24
8161 Wimmera Wetland Freshwater Crown Land L Semi-isolated Hindmarsh 8 6 14
8162 Murray Mallee Riverine Grassy Woodlands or Forests
Streamside Reserve
L Semi-isolated Hindmarsh 17 8.59 48
8163 Wimmera Riverine Grassy Woodlands or Forests
Freehold L Semi-isolated Hindmarsh 6 7.33 17
8164 Murray Mallee Riverine Grassy Woodlands or Forests
Crown Land M Semi-isolated Hindmarsh 17 7.76 35
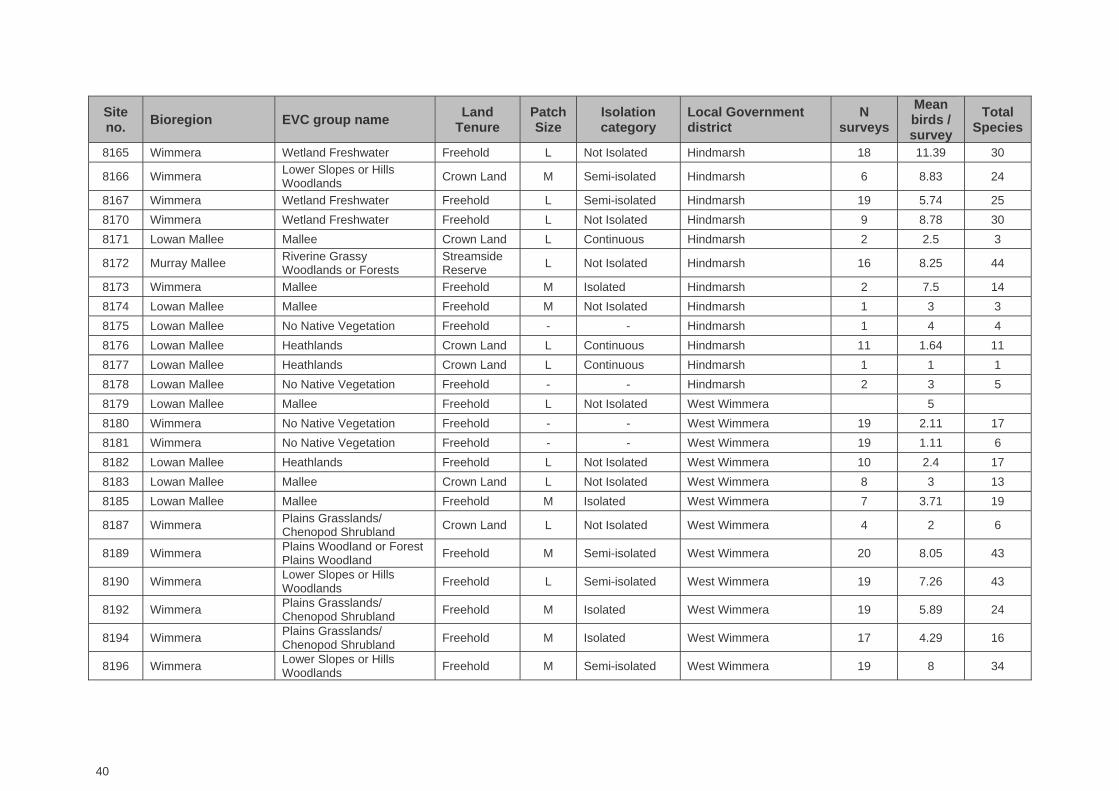
40
Site no.
Bioregion EVC group name Land
Tenure Patch Size
Isolation category
Local Government district
N surveys
Mean birds / survey
Total Species
8165 Wimmera Wetland Freshwater Freehold L Not Isolated Hindmarsh 18 11.39 30
8166 Wimmera Lower Slopes or Hills Woodlands
Crown Land M Semi-isolated Hindmarsh 6 8.83 24
8167 Wimmera Wetland Freshwater Freehold L Semi-isolated Hindmarsh 19 5.74 25
8170 Wimmera Wetland Freshwater Freehold L Not Isolated Hindmarsh 9 8.78 30
8171 Lowan Mallee Mallee Crown Land L Continuous Hindmarsh 2 2.5 3
8172 Murray Mallee Riverine Grassy Woodlands or Forests
Streamside Reserve
L Not Isolated Hindmarsh 16 8.25 44
8173 Wimmera Mallee Freehold M Isolated Hindmarsh 2 7.5 14
8174 Lowan Mallee Mallee Freehold M Not Isolated Hindmarsh 1 3 3
8175 Lowan Mallee No Native Vegetation Freehold - - Hindmarsh 1 4 4
8176 Lowan Mallee Heathlands Crown Land L Continuous Hindmarsh 11 1.64 11
8177 Lowan Mallee Heathlands Crown Land L Continuous Hindmarsh 1 1 1
8178 Lowan Mallee No Native Vegetation Freehold - - Hindmarsh 2 3 5
8179 Lowan Mallee Mallee Freehold L Not Isolated West Wimmera 5
8180 Wimmera No Native Vegetation Freehold - - West Wimmera 19 2.11 17
8181 Wimmera No Native Vegetation Freehold - - West Wimmera 19 1.11 6
8182 Lowan Mallee Heathlands Freehold L Not Isolated West Wimmera 10 2.4 17
8183 Lowan Mallee Mallee Crown Land L Not Isolated West Wimmera 8 3 13
8185 Lowan Mallee Mallee Freehold M Isolated West Wimmera 7 3.71 19
8187 Wimmera Plains Grasslands/ Chenopod Shrubland
Crown Land L Not Isolated West Wimmera 4 2 6
8189 Wimmera Plains Woodland or Forest Plains Woodland
Freehold M Semi-isolated West Wimmera 20 8.05 43
8190 Wimmera Lower Slopes or Hills Woodlands
Freehold L Semi-isolated West Wimmera 19 7.26 43
8192 Wimmera Plains Grasslands/ Chenopod Shrubland
Freehold M Isolated West Wimmera 19 5.89 24
8194 Wimmera Plains Grasslands/ Chenopod Shrubland
Freehold M Isolated West Wimmera 17 4.29 16
8196 Wimmera Lower Slopes or Hills Woodlands
Freehold M Semi-isolated West Wimmera 19 8 34

Wimmera CMA – working for a healthy Wimmera catchment
43
Site no.
Bioregion EVC group name Land
Tenure Patch Size
Isolation category
Local Government district
N surveys
Mean birds / survey
Total Species
8204 Lowan Mallee Plains Woodland or Forest Plains Woodland
Crown Land L Continuous West Wimmera 4 5.5 16
8205 Lowan Mallee Heathlands Crown Land L Continuous West Wimmera 13 3.15 27
8206 Lowan Mallee Heathlands Crown Land L Continuous West Wimmera 4 3.75 10
8210 Wimmera Wetland Freshwater Freehold M Semi-isolated West Wimmera 2 3.5 6
8212 Wimmera Wetland Freshwater Freehold L Not Isolated West Wimmera 12 6.08 20
8214 Wimmera Wetland Freshwater Freehold M Semi-isolated West Wimmera 1 7 7
8215 Wimmera Wetland Freshwater Freehold M Isolated West Wimmera 2 9.5 14
8216 Wimmera Plains Woodland or Forest Plains Woodland
Crown Land L Continuous West Wimmera 1 3 3
8217 Wimmera Wetland Freshwater Freehold M Not Isolated West Wimmera 11 5.36 22
8221 Wimmera Wetland Freshwater Freehold L Not Isolated West Wimmera 1 11 11
8222 Wimmera Heathy Woodlands Crown Land L Continuous West Wimmera 11 6.64 36
8223 Wimmera Heathy Woodlands Freehold L Not Isolated West Wimmera 15 9.13 40
8224 Wimmera Plains Woodland or Forest Plains Woodland
Freehold S Isolated West Wimmera 1 8 8
8226 Wimmera Heathy Woodlands Freehold L Not Isolated West Wimmera 1 8 8
8227 Wimmera Plains Woodland or Forest Plains Woodland
Crown Land M Semi-isolated West Wimmera 6 4.167 15
8231 Wimmera Wetland Saline Freehold M Isolated West Wimmera 19 2.947 24
8233 Wimmera Salt-tolerant and/ or succulent Shrublands
Crown Land L Semi-isolated West Wimmera 6 4.5 13
8235 Wimmera No Native Vegetation Freehold - - West Wimmera 1 3 3
8237 Wimmera Heathy Woodlands Crown Land L Continuous West Wimmera 18 4.61 26
8246 Lowan Mallee Mallee Crown Land L Continuous West Wimmera 9 2.67 8
8247 Greater Grampians Rocky outcrop or Escarpment Scrubs
Crown Land L Continuous Northern Grampians 8 2.5 15
8252 Goldfields Box Ironbark Forests/ Woodlands
Crown Land L Not Isolated Pyrenees 8 15.5 41
8256 Wimmera Lower Slopes or Hills Woodlands
Freehold M Semi-isolated Hindmarsh 3 7 14
8258 Dundas Tablelands Plains Woodland or Forest Plains Woodland
Freehold L Not Isolated Horsham 20 8.4 34

40
Site no.
Bioregion EVC group name Land
Tenure Patch Size
Isolation category
Local Government district
N surveys
Mean birds / survey
Total Species
8260 Wimmera Plains Woodland or Forest Plains Woodland
Freehold L Not Isolated Horsham 17 15.12 46
8261 Wimmera Non-indigenous Freehold S Semi-isolated Horsham 9 13 36
8263 Wimmera Plains Woodland or Forest Plains Woodland
Freehold L Semi-isolated Hindmarsh 14 11.0 44
8264 Murray Mallee No Native Vegetation Freehold - - Buloke 4 0.75 2
8265 Wimmera Lower Slopes or Hills Woodlands
Freehold M Isolated Hindmarsh 14 2.57 13
8266 Wimmera Plains Woodland or Forest Plains Woodland
Freehold L Semi-isolated Hindmarsh 13 5.15 34
8269 Goldfields Plains Woodland or Forest Plains Woodland
Freehold M Semi-isolated Northern Grampians 2 3 6
8270 Goldfields Plains Woodland or Forest Plains Woodland
Freehold S Isolated Northern Grampians 1 11 11
8271 Central Victorian Uplands
Herb-rich Woodlands Freehold L Not Isolated North Grampians 6 10.33 38
8272 Wimmera Riverine Grassy Woodlands or Forests
Crown Land M Semi-isolated Horsham 2 9 15
8274 Wimmera Plains Woodland or Forest Plains Woodland
Freehold M Isolated West Wimmera 1 5 4
8275 Goldfields Plains Woodland or Forest Plains Woodland
Crown Land S Isolated Northern Grampians 1 9 9
8277 Wimmera Lower Slopes or Hills Woodlands
Crown Land L Not Isolated Hindmarsh 1 5 5
8278 Lowan Mallee Mallee Freehold M Not Isolated Hindmarsh 1 5 5
2543 Goldfields Lower Slopes or Hills Woodlands
Freehold M Semi-isolated Ararat 6 4.67 15
2544 Goldfields Lower Slopes or Hills Woodlands
Freehold M Semi-isolated Ararat 6 4.33 10
5006 Goldfields Plains Woodland or Forest Plains Woodland
Freehold L Not Isolated Northern Grampians 6 9.5 30
5008 Goldfields Non-indigenous Freehold S Isolated Northern Grampians 6 10.17 30