Embed Size (px)
Citation preview

Willingness to Pay for Clean Air in China
Richard Freeman Wenquan Liang Department of Economics College of Economics Harvard University and NBER Jinan University Cambridge, United States, 02138 Guangzhou, P. R. China, 510632 E-mail: [email protected] E-mail: [email protected] Ran Song Christopher Timmins Harvard Center for Green Buildings Department of Economics and Cities, Harvard University Duke University and NBER Cambridge, United States, 02138 Durham, United States, 27708 E-mail: [email protected] E-mail: [email protected]
15 December 2017
Abstract
We develop a residential sorting model incorporating migration disutility to recover the implicit value of clean air in China. The model is estimated using China Population Census Data along with PM2.5 satellite data. Our study provides new evidence on the willingness to pay for air quality improvement in developing countries and is the first application of an equilibrium sorting model to the valuation of non-market amenities in China. We employ two novel instrumental variables based on coal-fired electricity generation and wind direction to address the endogeneity of local air pollution. Results suggest important differences between the residential sorting model and a conventional hedonic model, highlighting the role of moving costs and the discreteness of the choice set. Our sorting results indicate that the economic value of air quality improvement associated with a one-unit decline in PM2.5 concentration is up to $8.83 billion for all Chinese households in 2005.
JEL Classification: Q51, Q53, R23 Keywords: Air Pollution, Willingness to Pay, Hedonics, Migration Costs, Discrete Choice Models, Residential Sorting
We would like to thank Wayne Gray, Don Fullerton, Ming Lu, Billy Pizer, Kerry Smith, Robert Stavins,
Junfu Zhang, and seminar and conference participants at Harvard University, Fudan University, the 3rd
Biennial Conference of China Development Studies, the 2017 Camp Resources for their helpful
comments and insights. We thank He Tian and Yingdong Zhou for excellent research assistance. All
remaining errors and omissions are our own.

2
1. Introduction
Reliable estimation of household preferences for clean air has long been an
important topic for economists and policy makers. A large body of literature uses the
hedonic framework to recover the economic value of air quality improvements. A
meta-analysis of 37 hedonic price studies found that the willingness to pay for air
quality varied widely in the U.S., some even having a “perverse” sign that is
inconsistent with prior expectations (Smith and Huang, 1995).
Three econometric identification problems could plague the implementation of the
conventional hedonic model, especially in the developing country context. First, the
hedonic model assumes that households are freely mobile across locations, but the costs
associated with migration are high in developing countries. When there are
significant migration costs, the benefits that households receive from moving to less
polluted cities must compensate them not only for lower income and higher housing
prices, but also for these costs. Therefore, the simple variation in income and housing
costs across locations no longer reflects the economic value of differences in air quality
(Bayer et al., 2009).
Second, the hedonic model assumes that households are free to select an amenity
bundle from a continuous joint distribution of local attributes, but the spatial
distribution of amenities is discrete and may contain many “holes”. When the spatial
distribution of at least one amenity is discrete, there is no specific link between the
marginal price and the marginal willingness to pay (Kuminoff et al., 2013); this problem
may be particularly important when amenities are discrete and heavily imbalanced

3
across locations, which is often the case in developing countries.
Third, air pollution is likely to be correlated with unobservable local variables that
affect both housing costs and household income. In most developing countries,
economic development, job opportunities, government provision of public services, and
polluting industries are all centralized in the same areas, which results in a more serious
omitted variable problem in the estimation of hedonic prices for environmental
amenities. Any of these three identification problems will lead to biased estimates of
the marginal willingness to pay for clean air.
Billions of residents of developing countries face excessively high levels of air
pollution, and this air pollution endangers their physical and economic health.
However, the few existing studies find that households’ willingness to pay for
improvements to environmental quality is extremely low in developing countries
(Yusuf and Resosudarmo, 2009; Kremer et al., 2011; Ito and Zhang, 2016). The
paradox of a heavy economic and health burden generated by severe pollution and
households’ low valuation of environmental quality improvements in developing
countries is the central puzzle at the intersection of environmental and development
economics (Greenstone and Jack, 2015). China is the largest developing country and
second largest economy in the world, and its air pollution problems pose extraordinary
local and global challenges. However, data limitations have led to very few studies
measuring the economic value of air quality improvements in China.
China provides a good setting in which to study households’ sorting decisions
while incorporating the disutility from migration. Estimates derived from these

4
decisions can be used to evaluate willingness to pay for local amenities. The
incomplete discrimination of hukou (the Chinese household registration system) argues
against the benchmark assumption of free mobility in the conventional hedonic
framework. Migrants without a local hukou do not have equal access to government-
provided amenities – e.g., public education for kids and medical care service. There
is also tremendous heterogeneity in the application of the hukou system across cities.1
Although moving costs are high in China, the total stock of migrants is estimated to be
about 247 million in 2015, as large as 77% of the U.S. population.
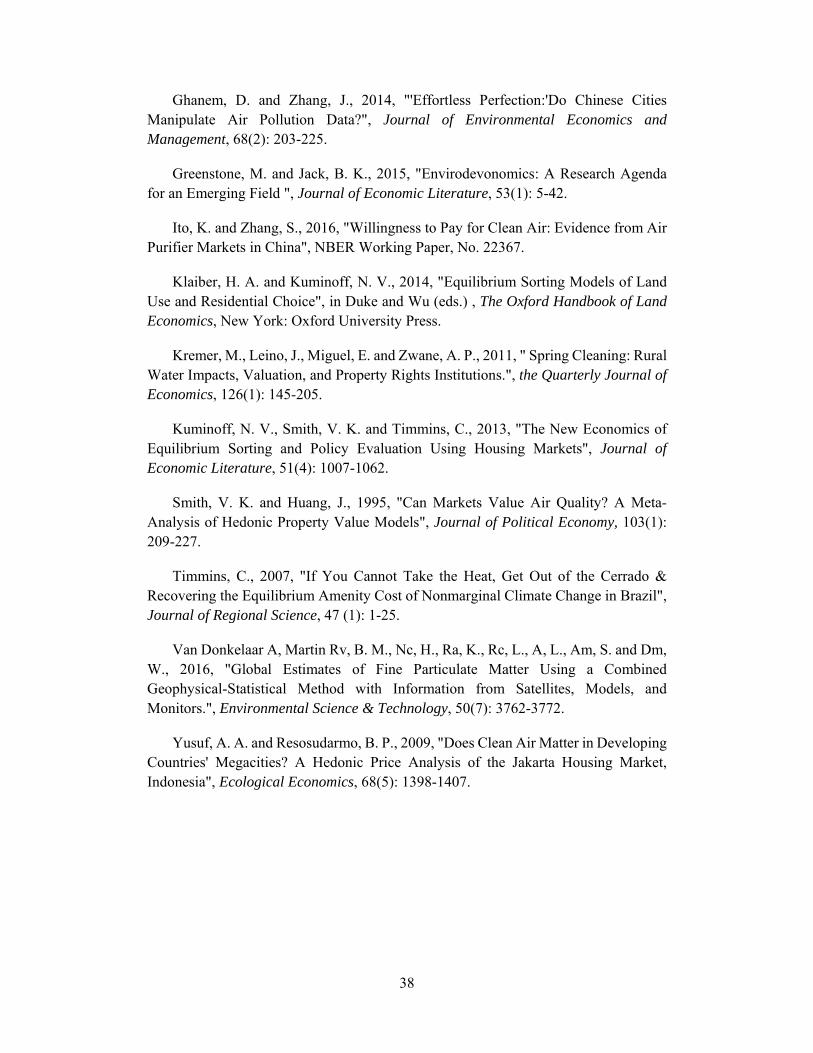
In sorting across labor and housing markets, Chinese residents express growing
concerns over the quality of the environment and its impact on their health. Figure 1
relates air pollution of hukou location and the fraction of the population who leave their
hukou city. It shows evidence in raw data that that people have fled their hukou city
to avoid the harmful exposure to severe air pollution; preferences for clean air shape
the way that households sort across cities. China therefore provides a great
opportunity for the study of pollution induced sorting and the important role played by
migration costs.
We develop a two-step framework to recover household preferences for air quality.
At its heart is a discrete-choice model of household residential location decisions,
incorporating migration disutility. This empirical model follows Bayer et al. (2009),
who estimate the economic value of air quality improvement in U.S. metro areas; in
1 The quantity and quality of state-provided services associated with local hukou status, as well as the difficulties
involved in obtaining the local hukou for migrants vary widely across cities in China, and are highly correlated with the administrative hierarchies and the economic development of jurisdictions (Chan, 2009).

5
contrast, we employ different approaches to model migration disutility and different
instruments to deal with endogeneity. First, we use a discrete-choice model with
moving disutility to return the indirect utilities associated with residing in various cities.
In order to model moving disutility in China, we not only consider the physical and
psychological costs of leaving far from one’s hukou location, but also the heterogeneity
of the barrier to obtain local hukou and economic opportunities available for migrants
across Chinese cities. After getting city-specific mean utilities from the first-stage
estimation, we regress them on measures of local air pollution in order to quantify the
marginal willingness to pay for clean air. Because air pollution is likely to be
correlated with unobserved aspects of city quality, an endogeneity problem arises in the
second-stage estimation. Hence naïve OLS estimates of willingness to pay will be
biased.
We employ two novel instrumental variable strategies to address the endogeneity
of the air pollution concentration of a given city: the smallest angle between the local
annual prevailing wind direction and large-scale thermal power plants outside the city,
along with the total annual coal consumption of the large-scale thermal power plants
located upwind of the city.2 The wind will blow the particulate matter spewed from
distant coal-fired power plants into the city, and these pollutants can dramatically
worsen local air quality. The two instrumental variables provide an exogenous source
of variation for a number of reasons. First, wind direction is stable over long periods
of time, and it is strictly exogenous to local economic activity. Second, those large-
2The large-scale thermal power plants are defined as the thermal power plants whose installed-capacities are larger than 1 million KW.

6
scale thermal power plants supply electricity to vast areas of China, including many
remote regions; many do not supply electricity at all to their nearby cities, but rather to
many remote provinces. Further, the allocation of electricity supply from large-scale
power plants is determined by the central government – it is difficult for local
governments to exert influence on the allocation of electricity supply from these power
plants. Finally, the spillover from distant large-scale power plants on local economic
activity is extremely small, but the pollutants emitted from power plants located upwind
severely contaminate the local air.
Our study is conducted with the most comprehensive and detailed data available on
city level air pollution and household level internal migration in China. Existing
studies of air pollution in China typically use the Air Pollution Index (API) and PM10
data from the Ministry of Environmental Protection of China. However, API and
PM10 data can only be obtained in large and medium-sized cities in China, and PM2.5
data were not published until 2014. Additionally, there is a potential concern that the
official air quality data may be manipulated by local governments (Chen et al., 2012;
Ghanem and Zhang, 2014). We collect city level annual average PM2.5 using Global
Annual PM2.5 Grids derived from satellite data by Van Donkelaar et al. (2016). These
data provide a reliable and accurate measurement of air quality for all cities in China.
Internal migration data are drawn from the 2005 One-Percent Population Census of
China, which is a restricted access census data set collected by National Bureau of
Statistics of China. It is the only national census data that records income in China.
For each household, this dataset provides four-digit codes of city level hukou location

7
and residential location, along with a wide range of sociodemographic and housing
characteristic variables.
Our results reveal salient differences between the conclusions of the conventional
hedonic framework and those of the residential sorting framework. They also
demonstrate the importance of dealing with endogeneity as well as accounting for
migration disutility and the discreteness of the choice set. To compare these two
methodologies, we begin with a conventional hedonic analysis that recovers a negative
estimate of the value of cleaner air. Instrumenting for air pollution is found to weaken
the bias of hedonic estimates. Consistent with intuition, the MWTP for air quality has
an expected positive sign when sorting process and migration disutility are taken into
account. Specifically, we find that the median Chinese household would pay about
$21.70 for a one-unit reduction in annual average fine particulate matter concentration.
Given 407 million households in China in 2005, the economic value of air quality
improvement associated with a one-unit decline in PM2.5 concentration is up to $8.83
billion. Our estimated willingness to pay for air quality is substantially larger than
that found in existing studies on the economic value of clean environment in developing
countries. Furthermore, the results indicate that ignoring the discreteness of the
choice set and migration disutility will likely misrepresent the economic benefits of
environmental quality improvement in developing countries.
2. A residential sorting model incorporating moving disutility
Following Bayer et al. (2009), we present our utility-maximizing location choice

8
model in the context of China. Household chooses residential city , along with
consumption of a composite commodity , and housing , , to maximize its utility
subject to a budget constraint:
max, , , ,
, , , , . . , , , (1)
where , is household income in city , represents the unit price of housing in city
, and denotes the local amenity of interest (here, air quality) in city . For
simplicity, we normalize the price of the composite commodity to 1. The utility
function for household residing in city is assumed to be:
, , ,, , (2)
where captures all the unobserved characteristics of city that are valued similarly
by all households, and , is a household-specific idiosyncratic term that is
independent of migration disutility and city attributes. , represents the disutility to
household of moving from its hukou city to city j. In our study, , not only
captures the physical and psychological costs of living far from one’s hukou location,
but also the barrier to obtaining local hukou and economic opportunities available for
migrants in city .
Household utility maximization yields the optimum housing consumption:

9
,∗ ∙ ,
(3)
Denoting , substituting ,∗ for , in (2) and using the budget
constraint yields the following household indirect utility function
,, , , (4)
where / is a constant that does not vary with location
choice j and subsequently drops out of the random utility problem. We can derive the
MWTP for the amenity using the marginal substitution rate between and
household income:
∙ ,
(5)
We can only observe household ’s income in its city of residence. Thus, we must
predict the counterfactual income in other unchosen locations. We then decompose
household income into a predicted mean and an idiosyncratic error term—i.e., ln ,
ln , , . Substituting this into (4) and taking logs yields:
ln , ln , , , , (6)
ln ln (7)

10
where represents city-specific mean utility that is common to the households in city
and captures all the utility-relevant characteristics of the city, and captures the
unobservable component of .
The residential sorting framework introduced above can easily handle the discrete
and imbalanced distribution of amenities in developing countries. This is different
from the conventional hedonic model where individuals are assumed to face a
continuous joint distribution of all amenities.
In a sorting equilibrium, no household could improve its utility by migrating to a
new city, given income, housing price, local amenities, moving disutility and all the
parameters in the equation (6) and (7) (Kuminoff et al., 2013; Klaiber and Kuminoff,
2014). All the structural parameters can be recovered using a two-step approach
related to that in Berry et al. (1995). In the first step, we directly estimate equation (6)
to recover all the alternative-specific fixed effects, 1,⋯ , . Assuming that
is independently and identically distributed Type I extreme value, the probability
that household chooses to reside in city can be written as:
ln , ln , , ∀ , ,
∑ , , (8)
We use the multinomial logit estimation procedure to infer the parameters in
equation (8). Mean utility, ,is recovered as a city-specific fixed effect.
In the second step, we use the estimated fix effect obtained from the first stage, ,
as the dependent variable and regress on air quality, housing price and other city factors

11
in the form of equation (7). Two identification problems will result in biased estimates
of in this second step. First, it is likely that housing price is correlated with
unobservable city attributes in . However, from Eq. (3), we have that
∗/ , ; the parameter can be obtained from the first step estimation and we
set ∗/ , equal to the median value of the share of income spent on housing, which
is 0.162 in our sample.3 We therefore address the endogeneity issue by moving
ln to the left-hand side of equation (7):
ln (9)
We can consider the new dependent variable, ln , as the housing costs adjusted
life quality of residing in city .
Second, local amenities tend to be correlated with unobservable aspects of city
quality. In the case of air quality, local economic activity is likely to be positively
correlated with air pollution concentration along with housing price and income. This
endogeneity problem leads to biased estimates of the marginal utility of air quality. To
deal with the issue, previous studies have generally relied on instrumental variables that
are exogenous to local economic activity. Chay and Greenstone (2005) use
nonattainment status defined by 1970 Clean Air Act as instruments for county level air
quality improvement. Bayer et al. (2009) instrument for air quality using the
3Following Bayer et al. (2007), for the purchased houses and self-built houses, we use the coefficients of city-specific housing price regression of equation (10) (see the next section) to convert the housing values into a measure of annual costs in 2005, and then calculate the share of housing expenditure in household income. The details of housing price regression will be illustrated in the next section.

12
contribution of distant sources to local air pollution, which is computed through a
county-to-county source-receptor matrix in America. In China, however, stringent
regulations on particulates matter concentration were not implemented until 2012,4 and
a source-receptor matrix is not available. Hence, we define two innovative
instrumental variables for local air pollution based on backgrounds in China. The first
is the smallest angle between the local annual prevailing wind direction and the large-
scale thermal power plants located outside city and within a certain distance. The
second is the total annual coal consumption of the large-scale thermal power plants
located at upwind region of city . We will further explain our instrumental strategy
in section 4.4. To the best of our knowledge, the two instrumental variables in our
study have not been used previously in the sorting literature.
3. Data
3.1 Primary data sources
We estimate the residential sorting model and recover counterfactual household
income and city-specific housing price using the 2005 One-Percent Population Census
of China. The 2005 One-Percent Population Census of China was conducted by the
National Bureau of Statistics of China. It is the latest population census data that has
been made available to academic researchers, but only with restricted access. The
4On December 5, 2012, “12th Five-Year Plan on Air Pollution Prevention and Control in Key Regions” was issued jointly by Ministry of Environmental Protection of China, National Development and Reform Commission of China, and Ministry of Finance of China issue. The plan sets stringent targets for ambient concentrations of particulate matter (PM2.5 and PM10) for the first time in China. For more background information, see http://www.mep.gov.cn/gkml/hbb/bwj/201212/t20121205_243271.htm

13
census data has about 2.3 million individuals and 1 million households, covering all 31
province-level jurisdictions.5 The data not only records very detailed information
about housing conditions, but also contains a long list of variables about demographic
and economic characteristics of household members, such as age, gender, education
level, employment status, occupation, hukou type (rural/urban), four-digit code of
hukou city, and four-digit code of residential city. The most important variable in the
data is the individual monthly income. To the best of our knowledge, the 2005 One-
Percent Population Census of China is the only census data that has the information
about income.6
We assume that the migration decision of a household is made by the household
head, hence we use the household head’s hukou city and residential city to define the
migration status of the household. Similarly to Bayer et al. (2009), we exclude the
households if the age of household head is greater than 35 years to ensure the migration
decisions are mainly driven by the current city factors. We drop observations with
missing values, and use the sample whose hukou are held by the households not by the
working units.7
To get a more accurate estimation of counterfactual household income, we delete
5The sample size of the 2005 One-Percent Population Census of China should be about 13 million, but National Bureau of Statistics of China only released a one-fifth random subsample of the census data. 6We have checked all the national population census questionnaires in China: Questionnaire of the Third National Population Census (1982), 1990 National Population Census Questionnaire, Census 2000 long mail-out questionnaire, the 2005 One-Percent Population Census of China Questionnaire, the 2010 National Population Census Questionnaire, the 2015 One-Percent Population Census of China Questionnaire.
7One clarification of hukou in China is household hukou and working unit collective hukou. Migrants who are employed in state owned enterprises, public institutions, and government departments are typically provided with temporary working unit collective hukou. The individuals whose hukou are temporarily held by working units don’t have equal access to government provided amenities as natives who hold household hukou, but they are relatively easier to apply for local household hukou and eligible to more government provided welfare in comparison with other migrants. Thus, it is difficult to clarify the migration status of the households who hold working-unit collective hukou. In 2005, only 2.35% of households had hukou that were held temporarily by their working units.

14
the samples that have the highest or lowest 0.1% value of individual monthly income,
transform the monthly income into annual income, then predict annual counterfactual
individual income in each city, and aggregate counterfactual individual income at
household level to recover counterfactual household income. Because China’s real
estate market was not established until 1991, we drop the households if their houses
were built before 1991 to infer city-specific housing price.8
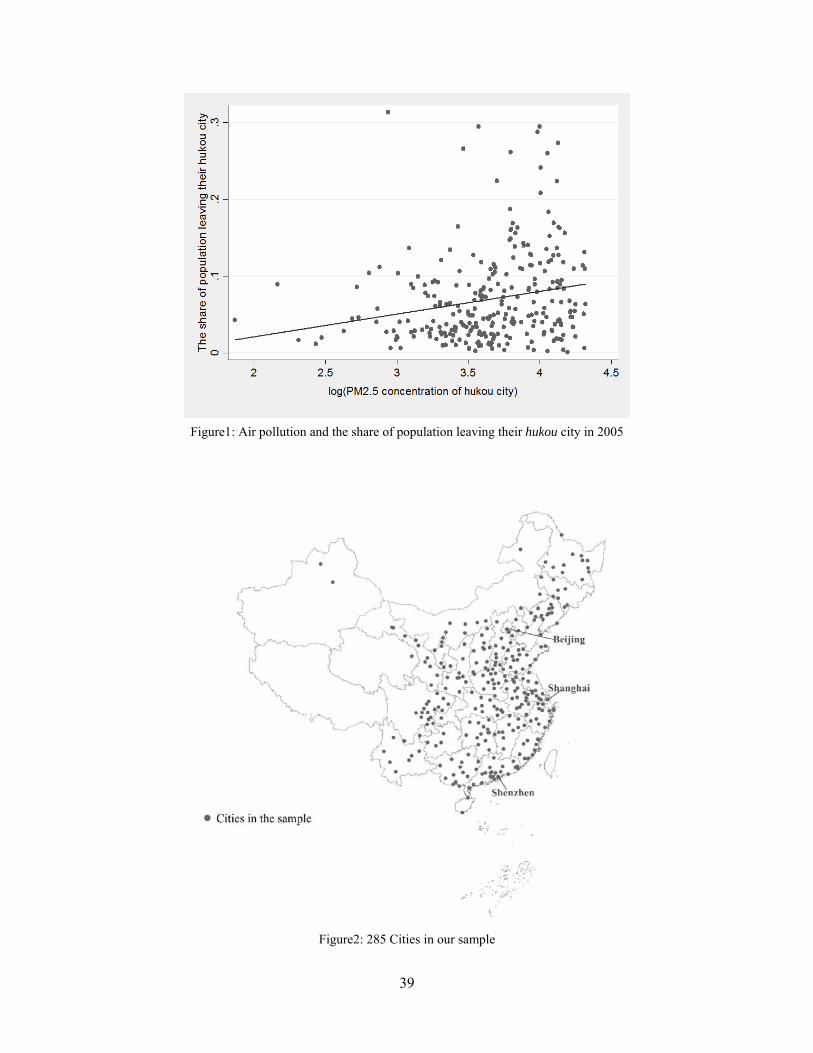
We collect the city characteristic variables from China City Statistical Yearbook,
which covers 285 cities of China in 2005.9 Thus, we only use the samples whose
hukou city and residential city are both covered by the 285 cities. In total, there are
61,536 households in our sample. The summary statistics of census variables used in
our study are presented in Table A1.
The regional distribution of the 285 cites is illustrated in Figure 1. There are 337
cites at the prefecture level and above in 2005. The 285 cities in our sample cover 85%
of the cities in this group, and contain approximately 91.04% of the Chinese population
in 2005.
To estimate the MWTP for clean air, we require data on air pollution concentration,
household income, housing price, and city attributes. We describe the measurement
of city level air pollution in detail below. Table 1 reports the summary statistics and
8The Chinese government has enacted many reforms in the housing sector since 1978, but has only carried them out in some cities, e.g., Shen Zhen. Prior to 1991, housing was mainly allocated to employees at state owned enterprises, public institutions and government departments through a planned system; therefore, there was no housing market, and one cannot observe transaction values. In 1991, the central government authorized a housing reform project which covered 24 provinces, autonomous regions, and municipalities in China. This represented a comprehensive reform of the housing sector in China. Since then, the housing market in China has matured, allowing people to exchange their housing through the price system. This has made it possible for us to observe transaction prices since that time. 9The 2005 China City Statistical Yearbook lists 286 cities, but all the variables in our study are missing in Lhasa. Thus, we only use the 285 cities to construct households’ residential choice set.

15
a full description of the key variables used in the analysis.
3.2 Air quality measures
Previous studies on China’s air pollution problems generally use the Air Pollution
Index (API) and PM10 data from the Ministry of Environmental Protection of China.
However, API and PM10 data can only be obtained in large and medium-sized cities in
China, and PM2.5 data were not published until 2014. We use PM2.5 satellite data
for our analysis rather than official air quality data, since it has the following advantages.
First, the location choice set of households includes not only large and medium-sized
cities, but also many small-sized cities; official air quality data are not available for
these cities. Our satellite PM2.5 data are available for all the cities in China, thus the
data facilitates the construction of households’ location choice set. Second, fine
particles (diameter<2.5µm) are more hazardous than larger particles
(2.5µm<diameter<10µm) in terms of mortality, cardiovascular and respiratory
endpoints, and PM2.5 is considered to be the best indicator of the level of health risks
from air pollution.10 Finally, a potential concern of the official air quality data is that
it may be manipulated by the local government (Chen et al., 2012; Ghanem and Zhang,
2014), however our satellite data are immune to any underlying data manipulation.
We use city level annual PM2.5 concentrations measured using the Global Annual
PM2.5 Grids derived from satellite data by Van Donkelaar et al. (2016). Van
Donkelaar et al. (2016) estimate ground-level PM2.5 by combining Aerosol Optical
Depth (AOD) retrievals from the NASA MODIS, MISR, and SeaWiFS, which are
10For more background information, see WHO reports: http://www.who.int/mediacentre/news/releases/2014/air-quality/en/ and http://www.euro.who.int/__data/assets/pdf_file/0005/112199/E79097.pdf

16
subsequently calibrated to global ground-based observations of PM2.5 using
Geographically Weighted Regression (GWR). The raster grids of this ground
calibrated PM2.5 data have a high grid cell resolution of 0.01 degree.11 Our data
provides a comprehensive and reliable measurement of air quality for a wide range of
cities in China, covering all the prefecture, sub-provincial and provincial cities.
Figure 3 illustrates the satellite air pollution data, depicting the spatial distribution
of annual PM2.5 concentration for China in 2005. The figure shows that air quality is
unevenly distributed in China – the most severe air pollution occurs in eastern provinces,
where manufacturing industries agglomerate and high economic growth takes place.
PM2.5 concentration is also high in Xinjiang province, because vast areas of this
province are dessert. Figure 4 illustrates the time trend of mean annual PM2.5
concentration of Chinese cities since 2001; the mean concentration is above the WHO
air quality guideline in all these years.12
4. Econometric Specification
4.1 Estimating counterfactual household income
We first recover the individual income each household member would earn in
every location, by estimating a separate regression of individual income on personal
characteristics for each labor market of every city, correcting for Roy sorting bias using
the procedure described in Dahl (2002). The hukou system results in discrepancies in
11NASA's Earth Observing System Data and Information System also published Global Annual Average PM2.5 Grids, and its grid cell resolution is 0.5 degree, but the resolution is too large to calculate city level PM2.5 concentration.
12See http://www.who.int/mediacentre/factsheets/fs313/en/ for more background information.

17
income between migrants and natives in Chinese cities. It is difficult for migrants to
obtain a local hukou in the large cities of China, but easy for them to obtain one in small
and medium-sized cities. Thus, we allow for two separate labor markets in each of 35
large cities (i.e., a labor market for natives and another for migrants), but only one labor
market in each of the other 250 cities of our sample to calculate counterfactual
individual income.13
We define , as the probability of individual residing in city . Following
Dahl (2002), we infer , in the context of China. We first allocate all individuals
into three data cells according to their education attainment: less than high school, high
school graduate, and some college or above. Within each cell, we further assign
individuals into two hukou type cells: urban hukou and rural hukou. Within each
education-by-hukou type cell, we finally divide them into 285 hukou locations.
Overall, we have 1,710 data cells, and , is computed as the share of the population
in individual s cell that settle in city . Then we run the individual income
regression in each labor market of city using the following equation:
ln , , , , Γ , , , , , , , , (10)
where denotes labor market. On the basis of the heterogeneity of the barrier to
obtain local hukou, we specify two labor markets in 35 large cities of China, but only
13These thirty five large cities include all the provincial cities, sub-provincial cities, and provincial capitals (excluding Lhasa) in China. They are Beijing, Changchun, Changsha, Chengdu, Chongqing, Dalian, Fuzhou, Guangzhou, Guiyang, Hangzhou, Harbin, Haikou, Hefei, Hohhot, Jinan, Kunming, Lanzhou, Nanchang, Nanjing, Nanning, Ningbo, Qingdao, Shanghai, Shenyang, Shenzhen, Shijiazhuang, Tianjin, Taiyuan, Wuhan, Xiamen, Xi'an, Xining, Yinchuan, Ürümqi, and Zhengzhou.

18
one labor market in other cities. Γ , is a vector of individual attributes, including age,
age squared, and dummy variables for hukou types (rural hukou, urban hukou),
educational attainment (below high school, high school and some college or above) and
gender (male, female).
We predict counterfactual individual income of each household member in every
location using coefficient estimated by equation (10). 14 After that, we add the
predicted individual incomes to the level of the household in order to calculate the
counterfactual household income , in every city
4.2 Measuring housing price
We define the value of the home occupied by household in city , , , as the
value of the house (for owner-occupied units) or annual rent (for rental units). We
assume , is a function of a city-specific constant ( ) and a vector of housing
characteristics ( ) that includes age of housing structure, the number of rooms, floor
area, whether the housing structure is a storied building, whether tap water is provided,
whether kitchen is provided, and whether there is a restroom. We then estimate the
following equation:
ln , ln , , Ω , , , Ω ,
, , Ω , , , Ω , Η , (11)
14We omit the Dahl correction terms , and , when predicting individual income in each city, because they
only serve as controls for Roy sorting bias.

19
where Ω , is a dummy variable that equals 1 if household purchases its home
and 0 if it is rented; Ω , is a dummy variable that equals 1 if household builds
its home and 0 otherwise. The 2005 One-Percent Population Census of China reports
the current rent in the census year, but the past price of owner occupied housing when
the house was self-built or purchased. Thus , , , , and
, , , , measure the premium on purchased housing and built
housing of different age in city , respectively. describes the role of housing
characteristics on prices in city . The fixed effect measures the unit price of
housing services adjusted by housing characteristics and ownership in city .
Therefore, we can infer the housing price in each city as the constant in city-specific
regression of equation (11), using the 2005 One-Percent Population Census of China
described in section 3.1.
4.3 Modeling moving disutility in the first-step estimation
High migration costs mean that the conventional hedonic model will be unable to
recover unbiased estimates of the value of local amenities (Cragg and Kahn, 1997;
Timmins, 2007). The residential sorting framework introduced in Section 2 can
capture the moving disutility in the sorting process by incorporating a fixed cost
associated with every alternative location (Bayer et al., 2009). The inclusion of
moving disutility yields a more accurate measure of the MWTP, particularly in
developing countries. The mobility rate is high in the U.S. – 18% of the United States
population has moved to a new place of residence every year since the Second World
War (Klaiber and Kuminoff, 2014). But on average, only 5.48% of the Chinese

20
population has left their hukou location for a new city every year between 2005 and
2015. 15 The hukou System restricts population mobility in China (Chan and
Buckingham, 2008; Chan, 2009), and the comparison of internal migration between the
two countries indicates that there exists a remarkable higher moving disutility in China.
Consider the heterogeneity of the barrier to obtain local hukou and economic
opportunities available for migrants across Chinese cities, we use six dummies and their
interactions to capture the migration disutility in China. We first divide the cities into
four groups: Beijing and Shanghai, sub-provincial cities along with Tianjin and
Chongqing,16 provincial capitals,17 and ordinary cities. The difficulty for migrants
to obtain local hukou is highest for Beijing and Shanghai, followed by sub-provincial
cities, and then by provincial capitals and ordinary cities. In terms of economic
opportunities for migrants, the situation is entirely different. Beijing and Shanghai
provide migrants the maximum amount of economic opportunities, followed by sub-
provincial cities, provincial capitals and ordinary cities in descending order. Thus we
model the moving disutility in China using the following equation:
15On the basis of the 2005 One-Percent Population Census of China, the 2010 National Population Census of China and the 2015 One-Percent Population Census of China, we report the pattern and evolution of internal migration in China from 2005 to 2015. We define the share of people between 18 and 65 years old that have left their hukou place for a new place of residence during last year to measure the population mobility in China. In 2005, only 4.49% of people left their hukou place during the last year. The figure increases to 8.75% in 2010, but decreases to 4.77% in 2015. Moreover, males have a higher mobility rate than female in 2005, 2010 and 2015, respectively. On average, 5.92% of male and 5.04% of female have moved to a new place every year during 2005 to 2010. 16Tianjin and Chongqing are provincial cities in China, but the barrier to obtain local hukou and the economic opportunities for migrants in the two cities are similar to sub-provincial cities. Hence, we assign Tianjin, Chongqing and sub-provincial cities to the same group. 17We exclude 10 cities which are both sub-provincial cities and provincial capitals in the group of provincial capitals, and assign the 10 cities to the group of sub-provincial cities. In the mainland of China, there are 27 provincial capitals and 15 sub-provincial cities. Among them, 10 cities are both sub-provincial cities and provincial capitals. Thus, there are 17 cities in the group of provincial capitals in our study.

21
, , , , , , , , , , (12)
, 1 if location is outside of household ’s hukou city18 (=0, otherwise).
, 1 if location is outside of household ’s hukou province (=0, otherwise).
, 1 if location is outside of household ’s hukou macro-regions19 (=0, otherwise)
, =1 if location is Beijing/Shanghai (=0, otherwise).
, =1 if location is a sub-provincial city/ Tianjin/ Chongqing (=0, otherwise).
, =1 if location is a provincial capital (=0, otherwise).
The first three dummies of equation (12) measure the disutility with respect to the
physical and psychological costs of leaving one’s hukou city.20 The interactions
between “outside of hukou city” dummy and three city group dummies capture the
difficulty of obtaining local hukou and economic opportunities available for migrants.
Moving disutility is normalized to zero if the household stays in its hukou city.
Then, we calculate the following likelihood function to infer the parameters in the
first step estimation:
, , ,…, ∏ ∏ , ∑ , ∑ , ,
∑ , ∑ , ∑ , ,
,
(13)
where , is an indicator function that equals one if household chooses to live in
city , and 0 otherwise. Recall that estimated from equation (13) denotes city-
specific indirect utility independent of household income and moving disutility, and we
18For a given household, we use the household head’s hukou location to define a household’s hukou location. 19There are seven macro-regions in China: East China, North China, Central China, South China, Southwest China, Northwest China and Northeast China. 20In China, most people’s hukou city is the same as their birth city. At 2014, only 7.08% of people’s hukou city is different from their birth city.

22
use the housing price adjusted city-specific utility as the dependent variable in the
second step estimation.
4.4 Instrumenting for air pollution in the second-step estimation
We use the following equation to perform our second-step estimation:
0.162 ln ln (14)
where represents fine particulate matter (PM2.5) concentration; denotes
other local characteristics, including GDP per capita, population, education service,
medical care service, distance to large seaports and industrial pollutant emissions; the
parameter is inferred from our first step estimation.
As introduced in Section 2, we use two innovative instrumental variables together
to address the endogeneity of local air pollution in city . The idea behind our
instrumental strategy is illustrated in the Figure 5.
The first instrumental variable, which we label IV1, is the smallest angle between
the local annual prevailing wind direction and the large-scale thermal power plants
outside city . We exclude the thermal power plants that locate at more than 500 km
from city to avoid the weak instrumental variable problem. As illustrated in Figure
5a, the thick arrow represents the annual dominant wind direction of city , and large-
scale thermal power plant A are located outside city , but less than 500km from the
city, thus the angle is the first IV for air pollution concentration in city . Note
that if there are more than one large-scale thermal power plant (located outside city

23
and within 500km), we use the smallest angle to define IV1.
The second instrumental variable, which we label IV2, is the total annual coal
consumption of all large-scale thermal power plants located upwind of city . As
depicted in Figure 5b, we take a section of a circular buffer drawn at a distance of
500km from the city. The angle between the left/right side of the section and the annual
dominant wind direction of city is π/4. We exclude the overlapped area of the
sector and city , and the shaded area is defined as the upwind region of the city. For
instance, there are two large-scale thermal power plants located in the upwind region
of city , power plant A and power plant B. IV2 is then defined as the sum of annual
coal consumption of A and annual coal consumption of B.
There are 105 large-scale power plants in China in 2005, the total electricity
generation of the large-scale power plants is up to 842.5 billion kWh, and the total coal
consumption reaches approximately 2,670 million tons. Figure 6 shows the location
of the large-scale power plants in 2005. The comparison of Figure 3 and Figure 6
indicates that the large-scale coal-fired power plants are highly correlated with PM2.5
concentration in terms of spatial distribution. Note that there is no large-scale thermal
power plant in Xinjiang Province, however air quality is poor in Xinjiang. The reason
is that vast areas of this province are covered by desert and sand dust will cause a high
concentration of particulate matter.
Good instrumental variables must satisfy two assumptions. The first assumption
is that they should be strongly correlated with the variable being instrumented.
China’s installed generating capacity reaches 517.18 million kW in 2005, and the

24
production of electricity is composed of four types: hydro, fossil, nuclear, and other.
Fossil fuels maintain the largest share at about 75%, which remains very steady between
1995 and 2009 (see Figure A1 in the appendix).
To illustrate the effects of our instrumental variables on air pollution, we regress
local PM2.5 concentration on the two instruments. Table 2 presents the estimated
results. The coefficients on the two instrumental variables are highly statistically
significant, and have expected signs. The results suggest that the location (the angle
between the large-scale thermal power plant and annual prevailing upwind direction)
and the coal consumption of distant large-scale thermal power plants significantly affect
local air pollution.
The second assumption is that the instrumental variables are orthogonal to local
economic activity, which is valid for the following reasons. First, wind direction is
determined by nature and remains stable over long periods of time, thus it is strictly
exogenous to local economic attributes. Second, the large-scale thermal power plants
supply electricity to vast areas of China; some of them do not even supply electricity to
their nearby cities, but rather to many remote provinces. There are 1,486 fossil plants
in 2004,21 but only 7.1% of them are large-scale power plants. Third, in China, the
allocation of electricity supply from large-scale power plants is determined by the
central government. Although many reforms have taken place over the past 30 years,
there are still strict regulations in the power sector and ownership of the sector is largely
with the state. The central government owns the grid, and controls the setup and
21The data source of this number is the 2004 Economic Census Data.

25
operation of power plants if their generating capacity is large. “The state regulator
may continue to be involved in investment decisions for large projects in order to ensure
that financing follows the guidelines of the State Development Planning Commission
and Ministry of Finance.” (Berrah et al., 2001). Thus, local governments find it difficult
to exert influence on the setup of large-scale power plants and the allocation of
electricity supply from them. Finally, the impact of distant power plants on local
economic activity is extremely small, but the particulate matter spewed from coal-fired
power plants located at upwind region contribute substantially to local air pollution.
Our instrumental variables are constructed on the basis of background in China,
which provides a new way to address the endogenous issue of air quality in developing
countries.
5. Estimation Results 5.1 Housing price and income regressions
Table A2 summarizes the results from the city-specific housing price regressions.
In the average city, the premium on purchased housing is higher than self-built housing,
and both premiums go down as the age of housing structure increases. The price of
storied buildings is higher than single-story houses. Newer, larger houses are more
expensive, as are houses with more rooms, tap water, kitchen and restroom. The
intercept in each city-specific regression represents the unit price of housing services
adjusted by housing attributes and ownership in each city.
Table A3 reports the summary statistics of estimated coefficients from the city-
specific income regressions. On average, individual income goes up with educational

26
attainment. Income also increases with age, but at a declining rate. In Chinese cities,
women earn less than men, and urban hukou holders earn more than rural hukou holders.
5.2 Estimates from the conventional model
We first estimate a conventional hedonic model based on regression specifications
typically used in previous studies. The hedonic estimates provide a useful benchmark
for comparison with the residential sorting model incorporating moving disutility. We
estimate a hedonic model with and without instrumental variables for local air quality,
in order to demonstrate the role of pollution endogeneity.
In the hedonic framework without moving disutility, the housing price-air quality
gradient minus income-air quality gradient yields the MWTP for clean air. Therefore,
we estimate the marginal impacts of air pollution concentration on housing service price
(the intercept from the city-specific housing price regression) and city average
household income:
ln lnPM2.5 (15)
ln lnPM2.5 (16)
Table 3 reports the coefficients on air pollution concentrations from the income
hedonic regression and the housing price hedonic regression, respectively. Columns
(1)-(3) present the results from the OLS regressions and columns (4)-(5) present
instrumental variable estimates. After controlling for city characteristics, the
coefficients on lnPM2.5 estimated by OLS regression are significantly negative in the

27
income hedonic model, and significantly positive in the housing price hedonic model.
The “perverse” sign of these OLS hedonic estimates is at odds with intuition. The
effects of instrumenting for air quality indicate that the OLS estimates are biased. The
IV results suggest that the marginal impacts of air pollution on household income and
housing price are economically insignificant. When we compare the full model of
column (3) and column (5), the coefficients on lnPM2.5 decline in magnitude and
significance in both income and housing price hedonic regressions. Our instruments
weaken the bias of the hedonic estimates, but their signs remain inconsistent with
expectations. The positive correlation between housing price and air pollution, as well
as the negative correlation between income and air pollution, are driven by high
migration costs that distort sorting behavior in China. Our IV estimates only reduce
the bias induced by unobservable local characteristics that are systematically correlated
with local air pollution, but don’t account for the imbalanced and discrete distribution
of amenities and high moving costs in developing countries like China.
5.3 Estimates from the residential sorting model
Table 4 presents estimation results from the first-step discrete choice model. The
coefficient on counterfactual income is 1.62, which is statistically significantly different
from zero, implying that households are more likely to reside in the locations where
they can earn high income. There exists a remarkable disutility associated with
leaving one’s hukou city.22 The disutility of moving increases as households leave
22In China, most people’s hukou city is the same as their birth city. China Labor-force Dynamics Survey in 2014 has the information of both hukou location and birth location, and this data covers 14226 families and 23594 individuals in 29 provinces of China. Using this data, we find that only 7.08% of people’s hukou city is different from their birth city. It is natural to guess that this number is smaller in 2005. Additionally, it usually takes a long time for migrants to obtain local hukou. Some local governments’ official documents require that migrants must

28
their hukou provinces, and then hukou macro-regions, but at a decreasing rate. The
interaction between out of hukou city dummy and three city group dummies imply that
the moving disutility is lowest in Beijing and Shanghai in China, followed by sub-
provincial level cities, provincial capitals and ordinary cities in ascending order.
Although it is most difficult to obtain local hukou in Beijing and Shanghai, the two
large cities provide migrants with the maximum amount of economic opportunity.23
Because the benefits from economic opportunities outweigh the costs associated with
obtaining local hukou, the consequence of combing the two effects is that moving
disutility is relatively low in large cities of China. The 2005 One-Percent Population
Census of China shows that about 31.8% of migrants choose to locate in the 10 largest
cities of China. Therefore, the results in Table 4 are consistent with the spatial
distribution of migrants in China – the majority of migrants choose to reside in Beijing,
Shanghai and the other metropolitan areas of China.
The city-specific fixed effects in Table 4 represent the average indirect utilities
from residing in each city, independent of moving disutility and household earnings.
It is not feasible to list average utilities for all the cities; therefore, we present the mean
of these city fix effects. The city-specific utilities are measured relative to Beijing,
which we set to zero.
We use housing-price adjusted city fixed effects as the dependent variable in the
second-step estimation. Table 5 presents the second-stage OLS results from
work in the city for more than 3 years before applying for local hukou. If a migrant moved out from his hometown and obtains hukou in a second city, he must have worked in this city for a long period, and get used to the life in the city. Overall, there exists a significant moving disutility for households leaving their hukou city. 23In our study, economic opportunities not only refer to job opportunities, but also include other opportunities, such as assimilate into local society, learn and improve personal ability, and invest in profitable projects etc.

29
estimating equation (14). The first row in each column shows the coefficient on
lnPM2.5. The OLS estimates of marginal utilities of air pollution are all statistically
significant with the expected negative sign. Negative preference for air pollution
suggests that air pollution results in utility losses, and households prefer to settle in
locations with cleaner air.
Chinese households have expressed concern over worsening air pollution in their
residential cities. Some families have even fled highly polluted cities, giving up
earnings in exchange for air quality improvements. Compared to column (1) of Table
5, the coefficient on lnPM2.5 rises in magnitude after we control for city characteristics
in column (2). Fine particle concentration tends to be correlated with local industrial
pollutant emissions. To account for the potential role played by local industrial
emissions, we add three industrial emissions variables as covariates in Column (3).
The inclusion of these industrial emissions has only a trivial effect on the marginal
impact of PM2.5 concentration.
It is likely that air pollution is correlated with unobservable local variables that
affect both housing costs and household income. Hence, we use two instrumental
variables together to deal with the endogeneity problem. Table 6 reports the second-
step IV estimates. In comparison with the corresponding OLS results, the coefficients
on lnPM2.5 from IV estimation increase approximately 40% in magnitude – the OLS
estimates range from -0.78 to -0.71 while the IV results range from -1.10 to -0.98. The
results suggest that the endogeneity problem leads to downwardly biased estimates of
households’ preference for air quality improvements. Similar to OLS estimates, the

30
inclusion of industrial pollutant emissions does little to affect the coefficient on
lnPM2.5.
The coefficients on other city characteristics differ in significance, but most have
the expected sign. Cities with more education services and higher GDP per capita are
significantly more appealing to residents. The coefficient on population24 is negative
but insignificant, implying that households do not place significant value on city size
after controlling for GDP per capita and local amenities. The coefficient on the
minimum distance to three large seaports is negative, and significantly different from
zero. Regional development is out of balance in China, and economic development,
good amenities and regional preference of government policies are centralized in
several coastal provinces of China. Hence, households prefer to reside in coastal cities.
Tables A4-A6 in the appendix present coefficient estimates for lnPM2.5 for
thirteen different specifications. The specifications vary in three dimensions: (i)
different thresholds in the construction of IV, (ii) exclusion of power plants within
50km of a given city in the construction of IV, and (iii) dropping the observations in
Xinjiang and Shanxi province.
On the basis of these results, we conclude that the main specification of our study
does a good job and that our findings are insensitive to the choice of econometric
specification in the second step estimation.
24 Population might be correlated with unobservable city attributes; we include it here simply to account for the impact of unobservables and prevent bias in other parameters where we have more interest (here, air pollution). To deal with the potential for endogeneity of current population, we also employ a specification using the city population in 1982 as an instrument. The coefficient on PM2.5 remains essentially the same in magnitude and significance, and the coefficient on population becomes insignificant. We also employ a second-step estimation without controlling for population, and the results are nearly identical to the main results.
31
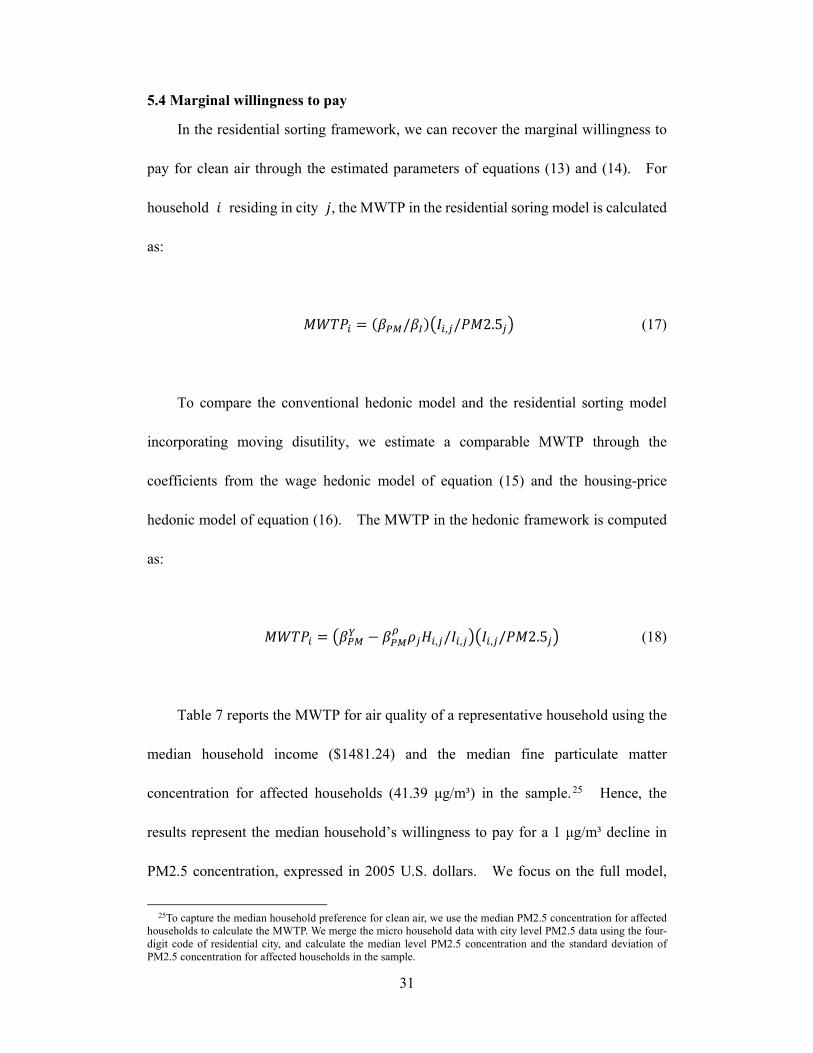
5.4 Marginal willingness to pay
In the residential sorting framework, we can recover the marginal willingness to
pay for clean air through the estimated parameters of equations (13) and (14). For
household residing in city , the MWTP in the residential soring model is calculated
as:
/ , / 2.5 (17)
To compare the conventional hedonic model and the residential sorting model
incorporating moving disutility, we estimate a comparable MWTP through the
coefficients from the wage hedonic model of equation (15) and the housing-price
hedonic model of equation (16). The MWTP in the hedonic framework is computed
as:
, / , , / 2.5 (18)
Table 7 reports the MWTP for air quality of a representative household using the
median household income ($1481.24) and the median fine particulate matter
concentration for affected households (41.39 μg/m³) in the sample.25 Hence, the
results represent the median household’s willingness to pay for a 1 μg/m³ decline in
PM2.5 concentration, expressed in 2005 U.S. dollars. We focus on the full model,
25To capture the median household preference for clean air, we use the median PM2.5 concentration for affected households to calculate the MWTP. We merge the micro household data with city level PM2.5 data using the four-digit code of residential city, and calculate the median level PM2.5 concentration and the standard deviation of PM2.5 concentration for affected households in the sample.
32
and make a comparison of the MWTP estimated by the hedonic model versus the
residential sorting model.
The results provide strong evidence of the importance of dealing with endogeneity,
as well as accounting for sorting process and migration disutility in developing
countries. The first and second row of Table 7 present the OLS and IV estimates from
the conventional hedonic framework, respectively. The MWTP estimated by hedonic
OLS regression has a negative sign, which is inconsistent with prior expectations.
When we use instrumental variables to address the endogeneity problem, the MWTP is
still negative, but declines in magnitude. All of the hedonic results suggest that the
economic value of clean air is negative. Given the adverse effects of severe air
pollution on health and productivity in developing countries like China, these estimates
are unreasonable. The third and fourth rows present the OLS and IV estimates from
the residential sorting model with migration disutility. Both OLS and IV estimates
from residential sorting model have an expected positive sign. After instrumenting
for air quality, the MWTP estimated by the residential sorting model rises dramatically
from $15.61 to $21.70 in the full model, indicating the importance of addressing
endogeneity problem.
There is a striking difference between estimates from the hedonic model and the
residential sorting model in our study. Comparing the results shown in the second and
fourth rows of Table 7, the sign of the estimated MWTP changes from negative to
positive after accounting for the discrete and imbalanced distribution of amenities and
migration disutility. Bayer et al. (2009) estimate the MWTP for clean air in the U.S.

33
The MWTP estimated by the hedonic model is positive but increases in magnitude
when accounting for moving disutility in the residential sorting framework. Thus, the
bias problem in our study is more severe than that in Bayer et al. (2009). In comparison
with the U.S., moving costs are higher in China, and the spatial distribution of amenities
is more discontinuous and imbalanced, which can explain the extreme results found
with the hedonic model.
We now use our results to estimate the economic value of air quality improvement
in China – in other words, the willingness to pay (WTP) for a decline in fine particle
concentration. Following Freeman (1974) and Chay and Greenstone (2005), we
assume that household preferences are linear and homogeneous with respect to air
quality level, thus the marginal willingness to pay (MWTP) for clean air is constant.
Our estimates indicate that a median household would pay $21.70 for a one-unit decline
in annual average PM2.5 concentration. The standard deviation of PM2.5
concentration for affected households is 14.58 in China in 2005, thus the median
household is willing to pay $316.39 for a one-standard-deviation decrease in PM2.5
concentration, which accounts for 21.36% of median household income. Given 407
million households in China in 2005, the economic benefit of air quality improvement
is up to $8.83 billion associated with a one-unit reduction in annual PM2.5
concentration, and $128.77 billion associated with a one-standard-deviation decline in
annual PM2.5 concentration. The welfare benefit of air quality improvement is
substantial, which is in accordance with the fact that severe air pollution endangers
residential health and economic development in developing countries like China. Our

34
estimates provide a monetary measure of the benefits of air quality improvement, and
shed light on the importance of air pollution control in developing countries.
5.5 Sensitivity Analysis
To examine the robustness of the main results, we report the MWTP for clean air
estimated under a range of alternative empirical specifications. In our baseline
estimates, we specify 500km as the maximum distance to construct the instrumental
variables. Table 8 presents the estimated MWTP using a variety of thresholds (450km,
475km, 500km, 525km, 550km) in the construction of the instrumental variable. The
MWTP are calculated using the corresponding coefficients on lnPM2.5 in Table A4.
The estimated MWTP using different thresholds in IV construction are nearly identical,
which indicates that our results are remarkably robust to the maximum distance in the
definition of IV.
Next, we exclude large-scale thermal power plants that are less than 50km from
city . This approach imposes a stronger restriction on the IV strategy, and reduces
the potential for correlation between our instrumental variable and local economic
activity. Table 9 shows the estimated MWTP using power plants more than 50km but
inside various distance thresholds in IV construction. The results are computed using
the corresponding coefficients on lnPM2.5 in Table A5. A comparison between
Tables 8 and 9 shows that the estimated MWTP hardly changes with and without the
exclusion of these power plants, which confirms the orthogonality of our baseline
instrumental variables to local economic activity.
Recall that there is no large-scale coal-fired power plant in Xinjiang province,

35
but the concentration of fine particulate matter is high due to large areas of desert in
this province. As a result, the correlations between our instrumental variables and
local air pollution are weak in this province. To address this concern, we drop the two
cities of located there in our second step estimation, and the results are shown in the
first row of Table 10.26 Exclusion of Xinjiang Province does little to affect our
estimated MWTP.
Another concern with the validity of our instrumental variables strategy is that
the central government might locate large-scale thermal power plants in regions where
coal production is high. Shanxi is the largest coal production province in China, and
accounts for 29.9% of total coal production in China in 2005.27 Therefore, we drop
the eleven cities of Shanxi Province in our sample in the second step estimation.28 The
estimated MWTPs are presented in the second row of Table 9, and they are qualitatively
similar to our baseline estimates of MWTP. We also drop the cities in both Xinjiang
and Shanxi province in our second-step estimation; the estimated MWTP’s are shown
in the bottom row of Table 9. Exclusion of the cities in the two provinces has little
impact on our results.
6 Conclusion
This study provides new evidence on household preferences for clean air in
developing countries, and the first application of the equilibrium sorting model to the
26The two cities are Urumqi and Karamay.
27We first obtain total energy production and the share of coal production in total energy production in each province from China Compendium of Statistics, 1949-2008, then calculate provincial level coal production using the two variables. 28The eleven cities are Changzhi, Datong, Jincheng, Jinzhong, Linfen, Lvliang, Shuozhou, Taiyuan, Xinzhou, Yangquan, Yuncheng.

36
valuation of non-marketed amenities in China. We develop a discrete-choice model
of household residential location decisions that incorporates migration disutility and
use it to recover the parameters of indirect utilities associated with residing in various
cities across China. We use two innovative instrumental variables for air pollution
concentration in a given city – the smallest angle between the annual prevailing wind
direction and the large-scale thermal power plants outside the city, along with the total
annual coal consumption of the large-scale thermal power plants located upwind from
the city. We use the estimates from this model to calculate the MTWP for air quality
improvement in China.
Our results indicate a striking difference between the residential sorting model and
the conventional hedonic model. The MWTP recovered with the discrete sorting
model incorporating moving disutility implies that the median household is willing to
pay $21.70 for a one-unit decline in annual PM2.5 concentration. In contrast, the
comparable MWTP from the conventional hedonic model is unexpectedly negative,
implying that the hedonic model severely underestimates the monetary value of clean
air. Using instrumental variables to address the endogeneity bias yields noticeable
differences in both methodologies.
Our study suggests that the welfare effects of environmental quality improvements
are substantial in developing countries like China. This helps to address the central
puzzle at the interaction of environmental economics and development economics
(Greenstone and Jack, 2015). Although credible estimates of the costs of air pollution
regulation are not available, our results indicate that the true value of air quality
37
improvement is substantially higher than has been previously recognized, which shed
light on the social benefits of pollution regulation policies for governments in
developing countries.
Reference
Bayer, P., Ferreira, F. and Mcmillan, R., 2007, "A Unified Framework for Measuring Preferences for Schools and Neighborhoods", Journal of Political Economy, 115(4): 538-638.
Bayer, P., Keohane, N. and Timmins, C., 2009, "Migration and Hedonic Valuation: The Case of Air Quality", Journal of Environmental Economics and Management, 58(1): 1-14.
Berrah, N., Lamech, R. and Zhao, J., 2001, "Fostering Competition in China's Power Markets", World Bank Discussion Paper, No.416.
Berry, S., Levinsohn, J. and Pakes, A., 1995, "Automobile Prices in Market Equilibrium", Econometrica, 63(4): 841-890.
Chan, K. W., 2009, "The Chinese Hukou System at 50", Eurasian Geography and Economics, 50(2): 197-221.
Chan, K. W. and Buckingham, W., 2008, "Is China Abolishing the Hukou System?", The China Quarterly, 195(3): 582-606.
Chay, K. Y. and Greenstone, M., 2005, "Does Air Quality Matter? Evidence from the Housing Market", Journal of Political Economy, 113(2): 376-424.
Chen, Y., Jin, G. Z., Kumar, N. and Shi, G., 2012, "Gaming in Air Pollution Data Lessons from China", The B.E. Journal of Economic Analysis & Policy, 12(3): 1682-1935.
Cragg, M. and Kahn, M., 1997, "New Estimates of Climate Demand: Evidence from Location Choice", Journal of Urban Economics, 42(2): 261-284.
Dahl, G. B., 2002, "Mobility and the Return to Education: Testing a Roy Model with Multiple Markets", Econometrica, 70(6): 2367-2420.
Freeman, A. M., 1974, "On Estimating Air Pollution Control Benefits from Land Value Studies", Journal of Environmental Economics and Management, 1(2): 74-83.
38
Ghanem, D. and Zhang, J., 2014, "'Effortless Perfection:'Do Chinese Cities Manipulate Air Pollution Data?", Journal of Environmental Economics and Management, 68(2): 203-225.
Greenstone, M. and Jack, B. K., 2015, "Envirodevonomics: A Research Agenda for an Emerging Field ", Journal of Economic Literature, 53(1): 5-42.
Ito, K. and Zhang, S., 2016, "Willingness to Pay for Clean Air: Evidence from Air Purifier Markets in China", NBER Working Paper, No. 22367.
Klaiber, H. A. and Kuminoff, N. V., 2014, "Equilibrium Sorting Models of Land Use and Residential Choice", in Duke and Wu (eds.) , The Oxford Handbook of Land Economics, New York: Oxford University Press.
Kremer, M., Leino, J., Miguel, E. and Zwane, A. P., 2011, " Spring Cleaning: Rural Water Impacts, Valuation, and Property Rights Institutions.", the Quarterly Journal of Economics, 126(1): 145-205.
Kuminoff, N. V., Smith, V. K. and Timmins, C., 2013, "The New Economics of Equilibrium Sorting and Policy Evaluation Using Housing Markets", Journal of Economic Literature, 51(4): 1007-1062.
Smith, V. K. and Huang, J., 1995, "Can Markets Value Air Quality? A Meta-Analysis of Hedonic Property Value Models", Journal of Political Economy, 103(1): 209-227.
Timmins, C., 2007, "If You Cannot Take the Heat, Get Out of the Cerrado & Recovering the Equilibrium Amenity Cost of Nonmarginal Climate Change in Brazil", Journal of Regional Science, 47 (1): 1-25.
Van Donkelaar A, Martin Rv, B. M., Nc, H., Ra, K., Rc, L., A, L., Am, S. and Dm, W., 2016, "Global Estimates of Fine Particulate Matter Using a Combined Geophysical-Statistical Method with Information from Satellites, Models, and Monitors.", Environmental Science & Technology, 50(7): 3762-3772.
Yusuf, A. A. and Resosudarmo, B. P., 2009, "Does Clean Air Matter in Developing Countries' Megacities? A Hedonic Price Analysis of the Jakarta Housing Market, Indonesia", Ecological Economics, 68(5): 1398-1407.
39
Figure1: Air pollution and the share of population leaving their hukou city in 2005
Figure2: 285 Cities in our sample

40
Figure 3: China’s spatial distribution of PM2.5 concentration in 2005

41
Figure 4: The evolution of mean PM2.5 concentration: 2001~2015
Figure 5a: Description of IV1

42
Figure 5b: Description of IV2
Figure 6: China’s large-scale thermal power plants in 2005

43
Table 1: Summary statistics
Variable name Description Mean Std. dev
Annual household income (dollar) 1683.199 1961.761
ln log (Housing price) (dollar) 4.320 0.949
PM2.5 PM2.5 concentration(μg/m³) 40.877 14.762
School The number of elementary and
secondary schools per 10,000 people 3.693 2.097
Hospital The number of hospitals per 10,000 people 0.629 0.768
GDP. capita GDP per capita (dollar) 2073.990 2592.082
Population Population (10,000) 416.095 291.762
Distance. Seaport The minimum distance to three large
sea ports in the mainland of China (km) 651.481 415.564
Water. emission Industrial waste water emission (10,000 ton) 7985.211 11513.177
SO2.emission Industrial SO2 emission (ton) 69445.060 69966.758
Dust. emission Industrial dust emission (ton) 30941.972 30409.932
Notes:
(1) , ln and GDP. Capita are translated from RMB into 2005 U.S. dollars.
(2) The three large seaports in the mainland of China are Tianjin seaport, Shanghai seaport, and Shenzhen
seaport. These seaports are located at the three major economic circles of China: Beijing-Tianjin-Hebei
Metropolitan Region, The Yangtze River Delta, the Pearl River Delta.
Data Source: (1) The raw data of household income, , and housing price,ln , are drawn from the 2005
One-Percent Population Census of China. (2) The PM2.5 data is collected from Global Annual PM2.5
Grids conducted by Van Donkelaar et al (2016). (3) The data of School, Hospital, GDP. capita,
Population, Water. Emission, SO2.emission, Dust. emission is draw from China City Statistical Yearbook.

44
Table 2: Air pollution concentration and the instrumental variables
Dependent variable: ln (PM2.5) (1) (2) (3)
Instrument1 -0.158*** -0.144*** -0.136*** (0.037) (0.034) (0.033)
Instrument2 0.009*** 0.007*** 0.007*** (0.002) (0.002) (0.002)
ln (School) -0.131*** -0.115**
(0.045) (0.047)
ln (Hospital) -0.168*** -0.174***
(0.038) (0.038)
ln (GDP. Capita) 0.009 -0.039 (0.036) (0.040)
ln (Population) 0.091*** 0.035
(0.031) (0.037)
ln (Distance. Seaport) -0.022 -0.029
(0.025) (0.025)
ln (Water. Emission) 0.015
(0.030)
ln (SO2.emission)
0.042
(0.027)
ln (Dust. emission) 0.014
(0.028)
Constant 3.580*** 3.189*** 3.495***
(0.038) (0.482) (0.522)
0.225 0.397 0.414
Observations 285 285 285
Notes: Instrument1 denotes the smallest angle between the local annual prevailing wind direction of a
given city and the large-scale thermal power plants located outside the city and within 500km of the city.
Instrument2 denotes the total annual coal consumption of large-scale thermal power plants located at the
upwind region of a given city. Standard errors in parentheses, * p < 0.10, ** p < 0.05, *** p < 0.01.

45
Table 3:Results from conventional hedonic regressions
Dependent Variable OLS IV
(1) (2) (3) (4) (5)
Average household income 0.002 -0.166*** -0.153*** -0.095 -0.054
(0.055) (0.033) (0.034) (0.078) (0.081)
Housing price 0.174 0.479*** 0.498*** 0.360 0.311
(0.140) (0.156) (0.159) (0.363) (0.380)
City characteristics No Yes Yes Yes Yes
Industrial pollutant emissions No No Yes No Yes
Notes: This table reports results from conventional hedonic regressions. The cells contain the coefficients
on ln(PM2.5) pertaining to average household income and housing price with respect to increase in air
pollution. Columns (1)-(3) present OLS results; columns (4) and (5) present IV results. City
characteristics include School, Hospital, GDP. capita, Population, Distance. Seaport, Water. Emission,
SO2.emission, and Dust. emission. Standard errors in parentheses, * p < 0.10, ** p < 0.05, *** p < 0.01.
Table 4: Results from the first step discrete choice model of residential location decision
Variable Coefficient
ln (Counter-factual Income , ) 1.621***
(0.065)
Out of hukou city dummy ( 1,ijD ) - 6.846 ***
(0.035)
Out of hukou province dummy ( 2,ijD ) -2.102***
(0.042)
Out of hukou macro-region dummy ( 3,ijD ) -1.991 ***
(0.037)
Out of hukou city dummy ( 1,ijD ) Beijing/Shanghai dummy ( 4,ijD ) 4.558 ***
(0.183)
Out of hukou city dummy ( 1,ijD ) Sub-provincial city dummy ( 5,ijD ) 2.364***
(0.068)
Out of hukou city dummy ( 1,ijD ) provincial capital dummy ( 6,ijD ) 1.587 ***
(0.086)
Mean city-specific fix effects -0.640
Notes: Standard errors in parentheses, * p < 0.10, ** p < 0.05, *** p < 0.01. The last row presents the
mean of estimated .

46
Table 5: OLS results from the second step estimation
Dependent variable: ln (1) (2) (3)
ln (PM2.5) -0.570*** -0.776*** -0.707***
(0.204) (0.189) (0.193)
ln (School) 0.591*** 0.595***
(0.160) (0.164)
ln (Hospital) 0.011 0.046
(0.133) (0.135)
ln (GDP. Capita) 0.735*** 0.809***
(0.123) (0.139)
ln (Population) -0.232** -0.137
(0.111) (0.131)
ln (Distance. Seaport) -0.570*** -0.544*** (0.084) (0.086)
ln (Water. Emission) 0.024
(0.105)
ln (SO2.emission) -0.042
(0.094)
ln (Dust. emission) -0.111
(0.097)
Constant 2.566*** 2.133 1.033
(0.747) (1.797) (1.969)
0.027 0.394 0.402
Observations 285 285 285
Notes: Standard errors in parentheses, * p < 0.10, ** p < 0.05, *** p < 0.01.

47
Table 6: IV results from the second step estimation
Dependent variable: ln (1) (2)
ln (PM2.5) -1.095** -0.983**
(0.441) (0.461)
ln (School) 0.545*** 0.558***
(0.169) (0.172)
ln (Hospital) -0.035 0.002
(0.144) (0.148)
ln (GDP. Capita) 0.728*** 0.789***
(0.122) (0.141)
ln (Population) -0.192 -0.121
(0.121) (0.132)
ln (Distance. Seaport) -0.596*** -0.569*** (0.090) (0.093)
ln (Water. Emission) 0.027
(0.103)
ln (SO2. emission) -0.034
(0.093)
ln (Dust. emission) -0.100
(0.097)
Constant 3.293 2.179
(2.300) (2.612)
0.388 0.397
Observations 285 285
Notes: Standard errors in parentheses, * p < 0.10, ** p < 0.05, *** p < 0.01.

48
Table 7:Estimated marginal willingness to pay for air quality
MWTP ($) No covariates
(1)
No control for industrial
pollutant emissions (2)
Full specification
(3)
Hedonic model OLS -0. 937 -8.718 -8.363
IV -5.487 -3.736
Sorting model incorporating OLS 12.584 17.132 15.609
migration disutility IV 24.175 21.702
Notes: Specification (1) includes no covariates. Specification (2) doesn’t control for ln (Water. Emission),
ln (SO2.emission), and ln (Dust. emission). Specification (3) is a full specification. The hedonic estimates
are calculated using the coefficients from Table 3. The residential sorting estimates are calculated using
the coefficients from Table 4-Table 6. All estimates are in constant 2005 dollars.
Table 8:Estimated marginal willingness to pay for air quality:
using different thresholds to construct instrumental variables
MWTP ($) No control for industrial
pollutant emissions (1)
Full specification
(2)
Distance<450 km 23.490 21.194
Distance<475 km 24.815 22.431
Distance<500 km 24.175 21.702
Distance<525 km 24.064 21.327
Distance<550 km 27.817 25.279
Notes: This table presents the MWTP estimated by IV regression in the residential sorting model. The
instrumental variables are constructed using the large-scale thermal power plants located outside a given
city and within various thresholds. Specification (1) doesn’t control for ln (Water. Emission), ln
(SO2.emission), and ln (Dust. emission). Specification (2) is a full specification. The estimates are
calculated using the coefficients from Table A4. All estimates are in constant 2005 dollars.
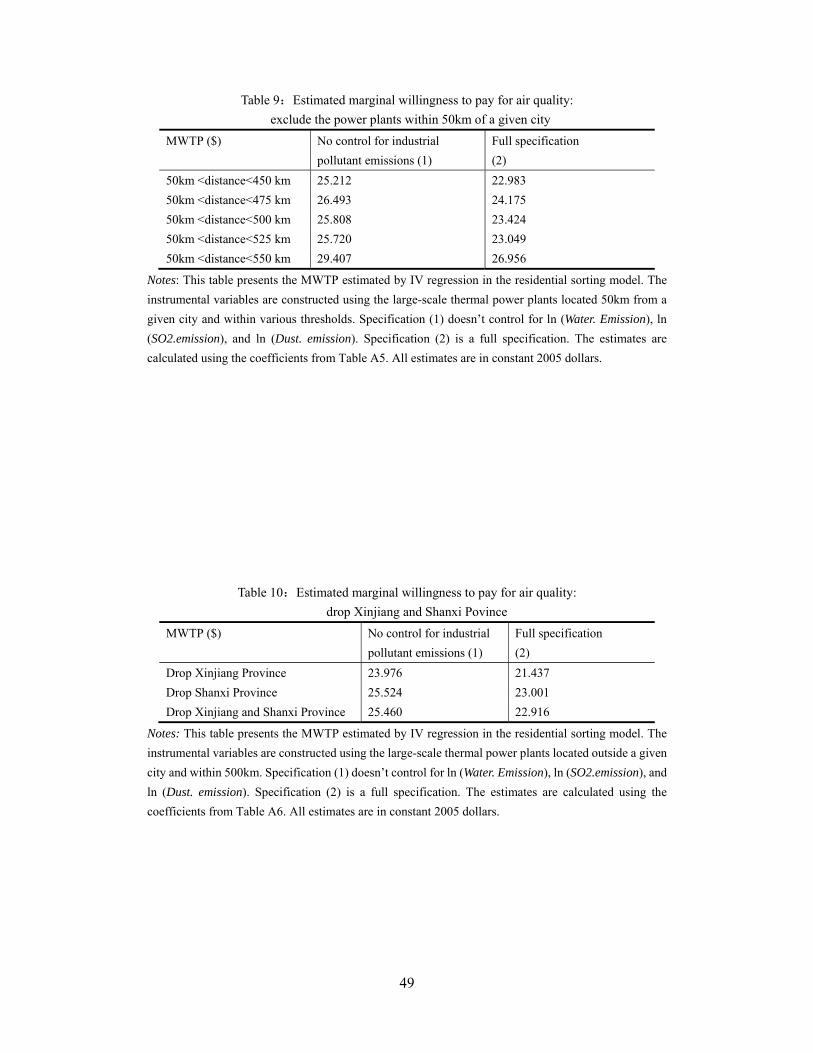
49
Table 9:Estimated marginal willingness to pay for air quality:
exclude the power plants within 50km of a given city
MWTP ($) No control for industrial
pollutant emissions (1)
Full specification
(2)
50km <distance<450 km 25.212 22.983
50km <distance<475 km 26.493 24.175
50km <distance<500 km 25.808 23.424
50km <distance<525 km 25.720 23.049
50km <distance<550 km 29.407 26.956
Notes: This table presents the MWTP estimated by IV regression in the residential sorting model. The
instrumental variables are constructed using the large-scale thermal power plants located 50km from a
given city and within various thresholds. Specification (1) doesn’t control for ln (Water. Emission), ln
(SO2.emission), and ln (Dust. emission). Specification (2) is a full specification. The estimates are
calculated using the coefficients from Table A5. All estimates are in constant 2005 dollars.
Table 10:Estimated marginal willingness to pay for air quality:
drop Xinjiang and Shanxi Povince
MWTP ($) No control for industrial
pollutant emissions (1)
Full specification
(2)
Drop Xinjiang Province 23.976 21.437
Drop Shanxi Province 25.524 23.001
Drop Xinjiang and Shanxi Province 25.460 22.916
Notes: This table presents the MWTP estimated by IV regression in the residential sorting model. The
instrumental variables are constructed using the large-scale thermal power plants located outside a given
city and within 500km. Specification (1) doesn’t control for ln (Water. Emission), ln (SO2.emission), and
ln (Dust. emission). Specification (2) is a full specification. The estimates are calculated using the
coefficients from Table A6. All estimates are in constant 2005 dollars.
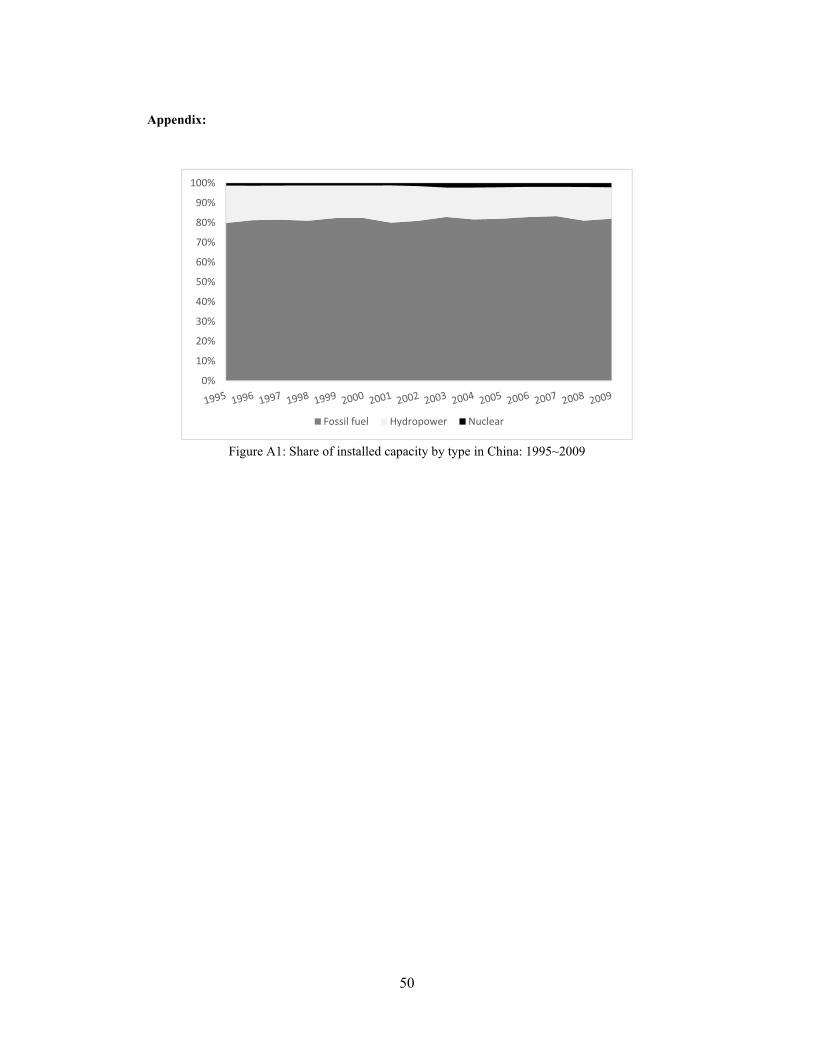
50
Appendix:
Figure A1: Share of installed capacity by type in China: 1995~2009
0%
10%
20%
30%
40%
50%
60%
70%
80%
90%
100%
Fossil fuel Hydropower Nuclear

51
Table A1: Data Summary
Variables Mean Std. dev
Annual individual income ($) 1213 1380
High school 0.168 0.373
Some college or above 0.154 0.361
Age 33.43 8.342
Female 0.556 0.497
Urban hukou 0.354 0.478
Ω , 0.232 0.422
Ω , 0.293 0.455
Ω , 0.475 0.499
Age of housing structure 6.597 3.836
The number of rooms 2.671 1.569
Floor area (m²) 81.62 52.33
Storied building 0.588 0.492
Tap water 0.677 0.467
Kitchen 0.869 0.337
Restroom 0.844 0.363
Notes:
(1) Annual individual income is translated from RMB into 2005 U.S. dollars;
High school=1 if the highest degree of the household member is high school, =0 otherwise;
Some college or above=1 if the highest degree of the household member is some college or
above, =0 otherwise;
Female=1 if the highest degree of the household member is female, =0 otherwise;
Urban hukou=1 if the household member holds urban hukou, =0 otherwise.
(2)Ω , = 1 if household rents its home, =0 otherwise;
Ω , = 1 if household purchases its home, =0 otherwise;
Ω , =1 1 if household builds its home, =0 otherwise.
Storied building=1 if the building is a storied building, =0 otherwise
Tap water=1 if the house has tap water, =0 otherwise.
Kitchen =1 if the house has private kitchen, =0 otherwise.
Restroom=1 if the house has private restroom, =0 otherwise.
Data Source: All the variables in the table are drawn from the 2005 One-Percent
Population Census of China

52
Table A2: Summary of estimated coefficients from housing price regressions
Variables Mean Std. dev
Ω , 3.497 0.827
Ω , Age of housing structure -0.049 0.110
Ω , 2.847 0.886
Ω , Age of housing structure -0.007 0.104
Age of housing structure -0.035 0.106
The number of rooms 0.051 0.053
Floor area 0.006 0.004
Storied building 0.541 0.258
Tap water 0.233 0.172
Kitchen 0.087 0.264
Restroom 0.133 0.263
Constant 4.320 0.949
Table A3: Summary of estimated coefficients from income regressions
Variables Mean Std. dev
High school 0.261 0.131
Some college or above 0.578 0.202
Age 0.041 0.017
Age2 -0.001 0.000
Female -0.383 0.154
Urban hukou 0.527 0.259
Constant 6.127 0.443

53
Table A4:IV results from the second step estimation:
using different thresholds to construct IV
(1) (2)
Distance<450 km -1.064** -0.960*
(0.484) (0.498)
Distance<475 km -1.124** -1.016**
(0.468) (0.488)
Distance<500 km -1.095** -0.983**
(0.441) (0.461)
Distance<525 km -1.090** -0.966**
(0.435) (0.455)
Distance<550 km -1.260*** -1.145**
(0.426) (0.447)
City characteristics No Yes
Industrial pollutant emissions Yes Yes
Notes: This table presents the coefficients on ln(PM2.5) estimated by IV regression in the second step
estimation of the residential sorting model. The instrumental variables are constructed using the large-
scale thermal power plants located outside a given city but within various thresholds. City characteristics
include School, Hospital, GDP. capita, Population, Distance. Seaport. Industrial pollutant emissions
include Water. Emission, SO2.emission, and Dust. emission. Standard errors in parentheses, * p < 0.10,
** p < 0.05, *** p < 0.01.
Table A5:IV results from the second step estimation:
drop the power plants within 50km of the city
(1) (2)
50km <distance<450 km -1.142** -1.041**
(0.489) (0.503)
50km <distance<475 km -1.200** -1.095**
(0.473) (0.494)
50km <distance<500 km -1.169*** -1.061**
(0.445) (0.466)
50km <distance<525 km -1.165*** -1.044**
(0.439) (0.460)
50km <distance<550 km -1.332*** -1.221***
(0.432) (0.453)
City characteristics No Yes
Industrial pollutant emissions Yes Yes
Notes: This table presents the coefficients on ln(PM2.5) estimated by IV regression in the second step
estimation of the residential sorting model. The instrumental variables are constructed using the large-
scale thermal power plants located 50km from a given city but within various thresholds. City
characteristics include School, Hospital, GDP. capita, Population, Distance. Seaport. Industrial pollutant
emissions include Water. Emission, SO2.emission, and Dust. emission. Standard errors in parentheses, *
p < 0.10, ** p < 0.05, *** p < 0.01.

54
Table A6:IV results from the second step estimation:
drop Xinjiang and Shanxi Povince
(1) (2)
Drop Xinjiang Province -1.086** -0.971**
(0.450) (0.469)
Drop Shanxi Province -1.194*** -1.076**
(0.444) (0.460)
Drop Xinjiang and Shanxi Province -1.191*** -1.072**
(0.453) (0.468)
City characteristics No Yes
Industrial pollutant emissions Yes Yes
Notes: This table presents the coefficients on ln(PM2.5) estimated by IV regression in the second step
estimation of the residential sorting model. The instrumental variables are constructed using the large-
scale thermal power plants located outside a given city but within 500km. City characteristics include
School, Hospital, GDP. capita, Population, Distance. Seaport. Industrial pollutant emissions include
Water. Emission, SO2.emission, and Dust. emission. Standard errors in parentheses, * p < 0.10, ** p <
0.05, *** p < 0.01.


![Design Pattern 1 [Eric Freeman & Elisabeth Freeman 1 – 5 ]](https://img.pdfslide.us/doc/110x75/56816844550346895dde1d18/design-pattern-1-eric-freeman-elisabeth-freeman-1-5--56ce9704eb05a.jpg)