Embed Size (px)
Citation preview

Willis Independent School District
2018‐2019 Academic Accountability Report
Published February, 2020

The Willis Independent School District as an equal opportunity educational provider and employer does not discriminate on the basis of race, color, national origin, sex, religion, age, or disability in educational programs or activities that it operates or in employment matters. The District is required by Title VI and Title VII of the Civil Rights Act of 1964, as amended, Title IX of the Education Amendments of 1972, the Age Discrimination Act of 1975, as amended, Section 504 of the Rehabilitation Act of 1973, the Americans with Disabilities Act, as well as Board policy not to discriminate in such a manner. For information about Title IX rights or Section 504/ADA rights, contact the Title IX Coordinator or the Section 504/ADA coordinator at 204 West Rogers, Willis, TX 77378; (936) 856-1200.
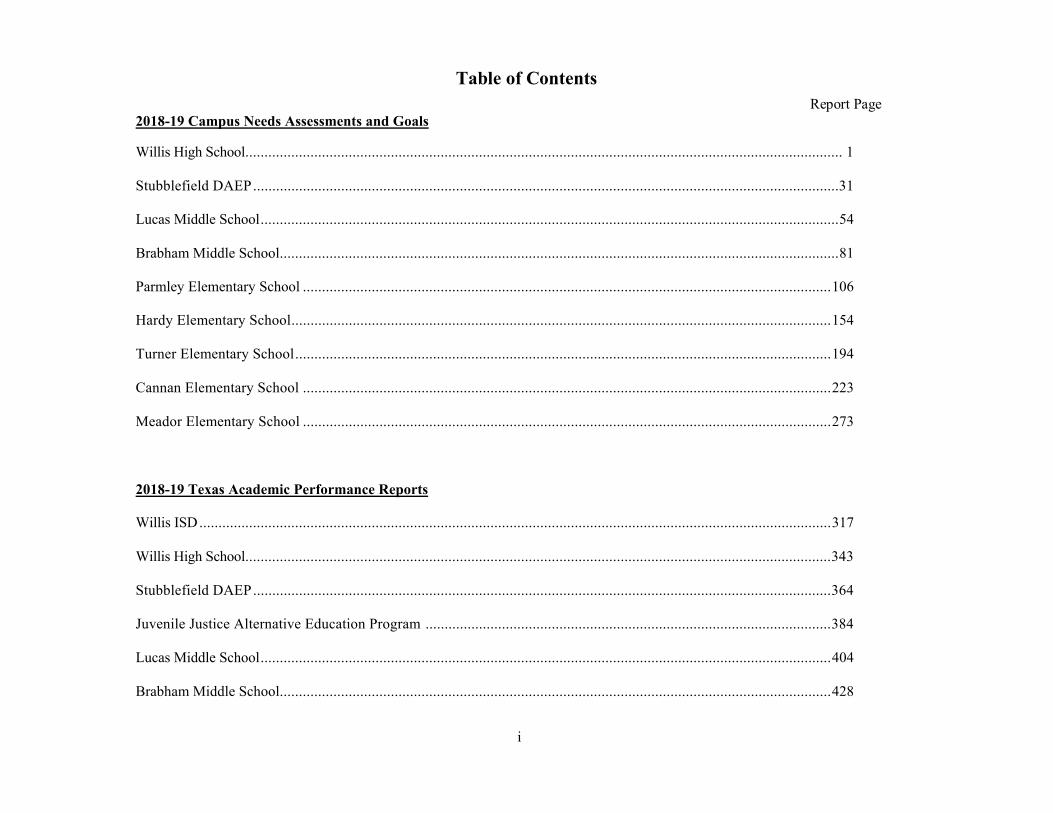
Table of Contents
i
Report Page 2018-19 Campus Needs Assessments and Goals Willis High School ............................................................................................................................................................ 1 Stubblefield DAEP ......................................................................................................................................................... 31 Lucas Middle School ....................................................................................................................................................... 54 Brabham Middle School .................................................................................................................................................. 81 Parmley Elementary School .......................................................................................................................................... 106 Hardy Elementary School ............................................................................................................................................. 154 Turner Elementary School ............................................................................................................................................ 194 Cannan Elementary School .......................................................................................................................................... 223 Meador Elementary School .......................................................................................................................................... 273 2018-19 Texas Academic Performance Reports Willis ISD ..................................................................................................................................................................... 317 Willis High School ......................................................................................................................................................... 343 Stubblefield DAEP ....................................................................................................................................................... 364 Juvenile Justice Alternative Education Program .......................................................................................................... 384 Lucas Middle School ..................................................................................................................................................... 404 Brabham Middle School ................................................................................................................................................ 428
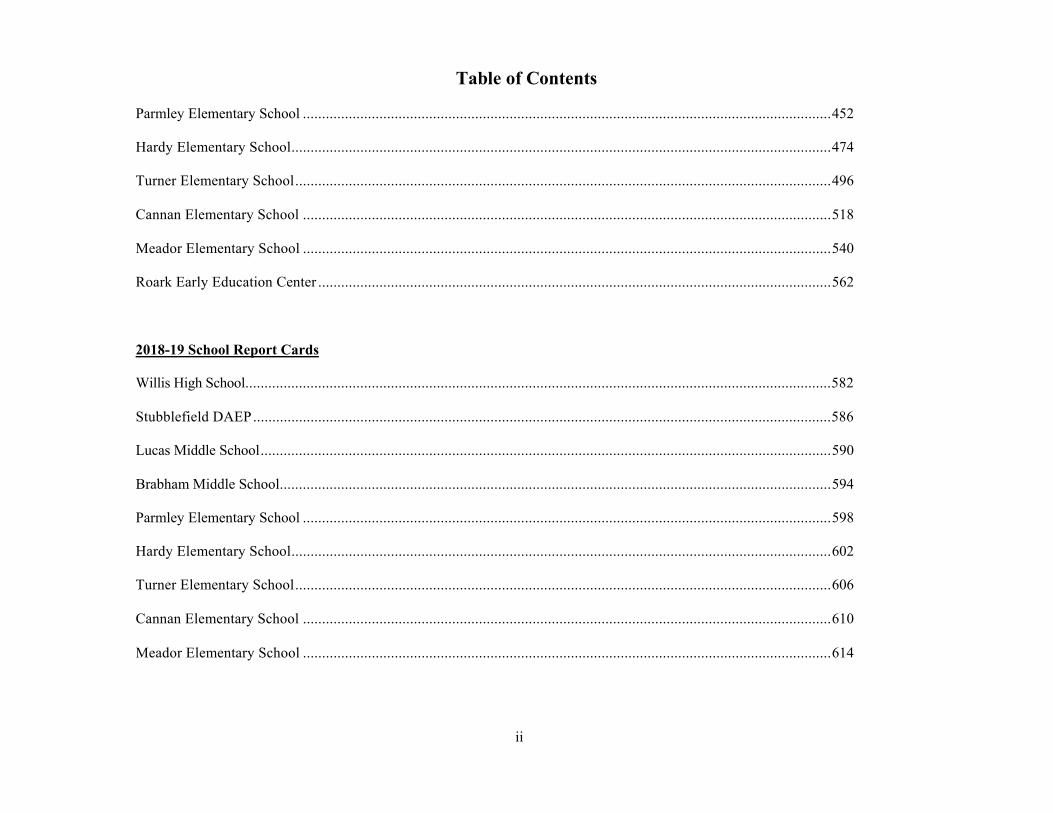
Table of Contents
ii
Parmley Elementary School .......................................................................................................................................... 452 Hardy Elementary School ............................................................................................................................................. 474 Turner Elementary School ............................................................................................................................................ 496 Cannan Elementary School .......................................................................................................................................... 518 Meador Elementary School .......................................................................................................................................... 540 Roark Early Education Center ...................................................................................................................................... 562 2018-19 School Report Cards Willis High School ......................................................................................................................................................... 582 Stubblefield DAEP ....................................................................................................................................................... 586 Lucas Middle School ..................................................................................................................................................... 590 Brabham Middle School ................................................................................................................................................ 594 Parmley Elementary School .......................................................................................................................................... 598 Hardy Elementary School ............................................................................................................................................. 602 Turner Elementary School ............................................................................................................................................ 606 Cannan Elementary School .......................................................................................................................................... 610 Meador Elementary School .......................................................................................................................................... 614

Table of Contents
iii
Other District Reports 2018-2019 Accreditation Status ...................................................................................................................................... 618 2016-2017 HS Graduates’ Enrollment and Academic Performance in Texas Public Higher Ed in FY 2018 ................ 619 Violent or Criminal Incidents for the 2018-19 School Year ............................................................................................ 621 2017-2018 Actual Financial data ................................................................................................................................... 622 Appendices 2018-2019 Texas Academic Performance Report Glossary (English) ................................................................................ 625

Table of Contents
iv
BLANK PAGE
Willis Independent School District
Willis High School
2018-2019 Accountability Rating: Met Standard
Willis High SchoolGenerated by Plan4Learning.com 1 of 30
Campus #170-904-002February 4, 2020 3:03 pm
18-19 AAR Page 1
Mission StatementThe mission at WHS is to ensure that all decisions made are in the best interest of students and their success, both in and out of the classroom.
VisionAt Willis High School, teachers and staff are committed to developing the minds and empowering the
success of our students.
Willis High SchoolGenerated by Plan4Learning.com 2 of 30
Campus #170-904-002February 4, 2020 3:03 pm
18-19 AAR Page 2

Table of Contents
Comprehensive Needs Assessment 4Demographics 4Student Academic Achievement 7School Processes & Programs 9Perceptions 11
Priority Problem Statements 12Comprehensive Needs Assessment Data Documentation 14Goals 16
Goal 1: All students will reach high academic standards, at a minimum attaining proficiency or better on state assessments. 16Goal 2: All parents will participate in regular, two-way, and meaningful communication involving student academic learning and school activities. 24Goal 3: All staff will be prepared to support student achievement. 26Goal 4: All district funds will be utilized for programs that ensure the success of every student. 27Goal 5: All students will be educated in learning environments that are safe and conducive to learning. 28
District Funding Summary 30
Willis High SchoolGenerated by Plan4Learning.com 3 of 30
Campus #170-904-002February 4, 2020 3:03 pm
18-19 AAR Page 3

Comprehensive Needs Assessment
Demographics
Demographics Summary
WILLIS HIGH SCHOOL
During the 2018-19 academic year, Willis High School will serve over 2100 students. The demographic breakdown of the student population remainedconsistent with the percentages observed over the past five years. Student enrollment increased 5.82% from the end of the 2017-2018 school year with astudent population of:
Female 49.08%
Male 50.92%
American Indian 0.38%
Asian 0.76%
Black 7.89%
Pacific Islander 0.05%
White 51.58%
2 or more races 3.21%
Hispanic 36.14%
Students enrolled were identified as:
At Risk 47.95% a decrease of 1.1%
Economically Disadvantaged 58.05% an increase of 5.94%
Willis High SchoolGenerated by Plan4Learning.com 4 of 30
Campus #170-904-002February 4, 2020 3:03 pm
18-19 AAR Page 4

Limited English Proficient 10.01% an increase of 1.13%
Students will receive services in the following programs:
ESL 9.68%
CTE 76.76%
Free Lunch 50.87%
Reduced Lunch 7.18%
GT 4.72%
Special Education 7.42%
Dyslexia 2.03%
The campus also experienced a 5.66% increase in mobility rate ending the 2017-18 school year at 21.68%.
TEACHER
Teacher retention rate for the current year is 80.9%.
Demographics Strengths
The WHS student demographics have remained consistent over the past five years allowing for a proactive approach to staff development and instructionalplanning and implementation of instructional supports appropriate for the sub-populations served.
Problem Statements Identifying Demographics Needs
Problem Statement 1: Student attendance is low. Root Cause: No system in place to consistently address students with excessive absences and/or truancy.
Problem Statement 2: Historically, WHS ESL students have demonstrated limited success on state assessments. The WHS ESL student population hasreached 9.7%, requiring the implementation of appropriate instructional supports and practices this year. Root Cause: Improvement of current ESLinstructional practices needed.
Willis High SchoolGenerated by Plan4Learning.com 5 of 30
Campus #170-904-002February 4, 2020 3:03 pm
18-19 AAR Page 5
Problem Statement 3: Student enrollment is expected to increase significantly over the next few years due to forecasted construction of over 4500 homesin Willis over the next few years. Root Cause: Construction of new homes in the Willis area.
Problem Statement 4: The EcoDis population at WHS increased about 6% from the previous year requiring special attention be paid to academicintervention, teacher staff development and implementation of effective instructional practices.
Willis High SchoolGenerated by Plan4Learning.com 6 of 30
Campus #170-904-002February 4, 2020 3:03 pm
18-19 AAR Page 6

Student Academic Achievement
Student Academic Achievement Summary
STAAR Data:
For the 2018 STAAR EOC tests, Willis High School had an increase in “Masters Grade Level” in ELA I, ELA II, and Algebra I. There was an increase in“Meets Grade Level” from 51.3% in 2017 to 52.93% in 2018 on the ELA II test. On the Algebra I test, “Meets Grade Level” increased from 43.58% in2017 to 53.74% in 2018. Other data is listed below:
English I EOC: Out of 551 students, 58.08% approached grade level, 39.75% met grade level, and 5.81% mastered grade level.
English II EOC: Out of 495 students, 69.29% approached grade level, 52.92 met grade level, and 7.47% mastered grade level.
Algebra I: Out of 495 students, 81.01% approached grade level, 53.74% met grade level, and 29.7% mastered grade level.
Biology: Out of 468 students, 86.75% approached grade level, 62.61% met grade level, and 19.87% mastered grade level.
Out of 450 students, 94% approached grade level, 73.33 met grade level, and 39.11% mastered grade level.
Other Data:
In 2018, 53.6% of our students took the SATs. This was a decrease from 2017 when 56.2% of the students took the SAT. 911 students took the PSAT testwhich was given to all tenth and eleventh graders.
On TELPAS, there was a decrease in Listening, Speaking, and Writing proficiencies from 2017 to 2018.
Student Academic Achievement Strengths
At Willis High School there were significant gains on the ELA I and ELA II EOC tests where students “Mastered Grade Level.”
In 2018, Willis High School scored in Quartile 2 for our SAT and ACT scores in Math and Science.
There was a 10% gain in “Meets Grade Level” on the Algebra I EOC from 43.58% in 2017 to 53.74% in 2018
Willis High SchoolGenerated by Plan4Learning.com 7 of 30
Campus #170-904-002February 4, 2020 3:03 pm
18-19 AAR Page 7
Problem Statements Identifying Student Academic Achievement Needs
Problem Statement 1: EOC scores decreased in “Approaches Grade Level” and “Meets Grade Level” in ELA I, ELA II, Algebra I, and Biology. RootCause: Teaching strategies do match the student needs and levels.
Problem Statement 2: TELPAS scores have decreased in all proficiencies. Root Cause: There is not a clear understanding of the ELPS and they are notbeing used effectively in the classroom.
Willis High SchoolGenerated by Plan4Learning.com 8 of 30
Campus #170-904-002February 4, 2020 3:03 pm
18-19 AAR Page 8

School Processes & Programs
School Processes & Programs Summary
TEKS Resource Systems - provides content and support for an online curriculum management system. The content includes curriculum components andsample unit assessment items aligned to the most current versions of the State Board of Education-adopted standards (TEKS).
Texas Teachers Evaluation and Support System (T-TESS) - strives to capture the holistic nature of teaching – the idea that a constant feedback loop existsbetween teachers and students, and gauging the effectiveness of teachers requires a consistent focus on how students respond to their teacher’s instructionalpractices.
Enriching Students - is the Response to Intervention (RTI) tool that is specifically designed to meet the challenges of scheduling middle and high schoolstudents for regular RTI sessions. Never has it been easier to implement an RTI program in your middle and secondary school.
Measure Academic Progress (MAP) Suite - is an assessment system that’s all about measuring what matters so you can support growth and skill mastery forevery student.
University Interscholastic League (UIL) - exists to provide educational extracurricular academic, athletic, and music contests. The initials UIL have come torepresent quality educational competition administered by school people on an equitable basis.
Professional Learning Community (PLC) - An ongoing process in which educators work collaboratively in recurring cycles of collective inquiry and actionresearch to achieve better results for the students they serve.
Odysseyware - Educators can give students the ability to earn credits for failed or incomplete courses without having to repeat the entire course, enablingstudents to complete the work at their own pace and focus on just the concepts they have not yet mastered.
Advanced Academics - Gifted & Talented Services, Dual Credit, Pre-Advanced Placement (Pre-AP) courses, and Advanced Placement (AP) courses.
Career Technical Education (CTE) - programs offer a sequence of courses that provide students with coherent and rigorous content. CTE content is alignedwith challenging academic standards and relevant technical knowledge and skills needed to prepare for further education and careers in current or emergingprofessions.
TEAMS for Student - is a real-time, web-based solution that allows Teachers, Counselors, and Administrators access up-to-date and accurate data fromanywhere they have internet access.
Eduphoria - integrated apps assist in every aspect of the school day, from lesson planning to monitor student progress, streamlining administrative duties,and providing a collaborative platform for education professionals.
Willis High SchoolGenerated by Plan4Learning.com 9 of 30
Campus #170-904-002February 4, 2020 3:03 pm
18-19 AAR Page 9

eStar (eSPED) - allows users to enter data safely and quickly anytime, anywhere-with full compliance with federal and state-specific reporting regulationsand data safeguards through our Tier-1 Provider partnership with Level (3) Communications.
School Processes & Programs Strengths
TEKS Resource Systems (Strength): Teachers are able to create common assessments to measure student performance that meets the standards.
Texas Teachers Evaluation and Support System (T-TESS) (Strength): All teachers are required to attend an annual refresher training on the principles andprocesses of the evaluation system and how it relates to improving student performance.
Enriching Students (Strength): Targeted intervention student accountability.
Measure Academic Progress (MAP) (Strength): Identify achievement gaps sooner and monitor academic growth.
University Interscholastic League (UIL) (Strength): It ensures all students are passing all academic courses.
Professional Learning Community (PLC) (Strength): Creates a culture of collaboration focused on student and teacher learning.
Odysseyware (Strength): Increase graduation rates and improve student outcomes.
Advanced Academics (Strength): Increased student enrollment.
Career Technical Education (CTE) (Strength) - The programs offer 17 different certifications.
TEAMS for Student (Strength): real-time automation views instantly as updates take place.
Eduphoria (Strength): Empowers teachers
eStar (eSPED) (Strength) - more than one person can view and enter recommendations on a child without having the actual document.
Problem Statements Identifying School Processes & Programs Needs
Problem Statement 1: There is a group of disengaged students on campus who are not being reached. Root Cause: Failure in Communication
Willis High SchoolGenerated by Plan4Learning.com 10 of 30
Campus #170-904-002February 4, 2020 3:03 pm
18-19 AAR Page 10

Perceptions
Perceptions Summary
In the spring of 2018, Willis ISD leadership named a new head football coach and a new campus principal. In an effort to get to know more about theculture of WHS, the new principal, Stephanie Hodgins, met with a group of student leaders and a group of teacher leaders, respectively. The focus of eachmeeting was to survey the participants and gather information about what students and staff perceived as the campus' greatest strengths as well as itsopportunities for growth.
The consensus from students was that school spirit was lacking and that the same core group of students tended to participate in all of the extracurricularactivities. Additionally, students believed that most of their teachers cared about them, but they agreed that their teachers who were also athletic coaches didnot put their classrooms first. Students also indicated that the football program received most of the attention in the community as well as in the schoolbuilding while other sports or fine arts received little to no recognition for their achievements. Another point that students recognized was that somestudents did not respect the authority of certain teachers on campus. They expressed that some teachers had confided in them that, in general, they did notfeel respected and had grown increasingly frustrated by the behaviors of certain students in their classrooms.
In the meeting with teacher leaders, they expressed frustration about a lack of consistent leadership in the building. They felt that administrators did nothandle student referrals equitably and that there appeared to be no system in place for dealing with issues related to student behavior. In addition to thisperceived lack of accountability, teachers also indicated that the standards to which students were held were not high and that the culture of the campuscould best be described as apathetic.
Perceptions Strengths
There is a core group of students and teachers who genuinely care about WHS and would like for all students and staff to share their passion.
Problem Statements Identifying Perceptions Needs
Problem Statement 1: Students are not held to a high standard. Root Cause: No system in place to consistently deal with issues of student misbehavior.
Problem Statement 2: Lack of school spirit Root Cause: Adults in building do not provide enough opportunities for students to participate (i.e. moredress-up days, contests, encouraging spirit on game days).
Problem Statement 3: Students do not respect authority in classroom. Root Cause: Lack of classroom management and consistently high expectations.
Willis High SchoolGenerated by Plan4Learning.com 11 of 30
Campus #170-904-002February 4, 2020 3:03 pm
18-19 AAR Page 11
Priority Problem Statements
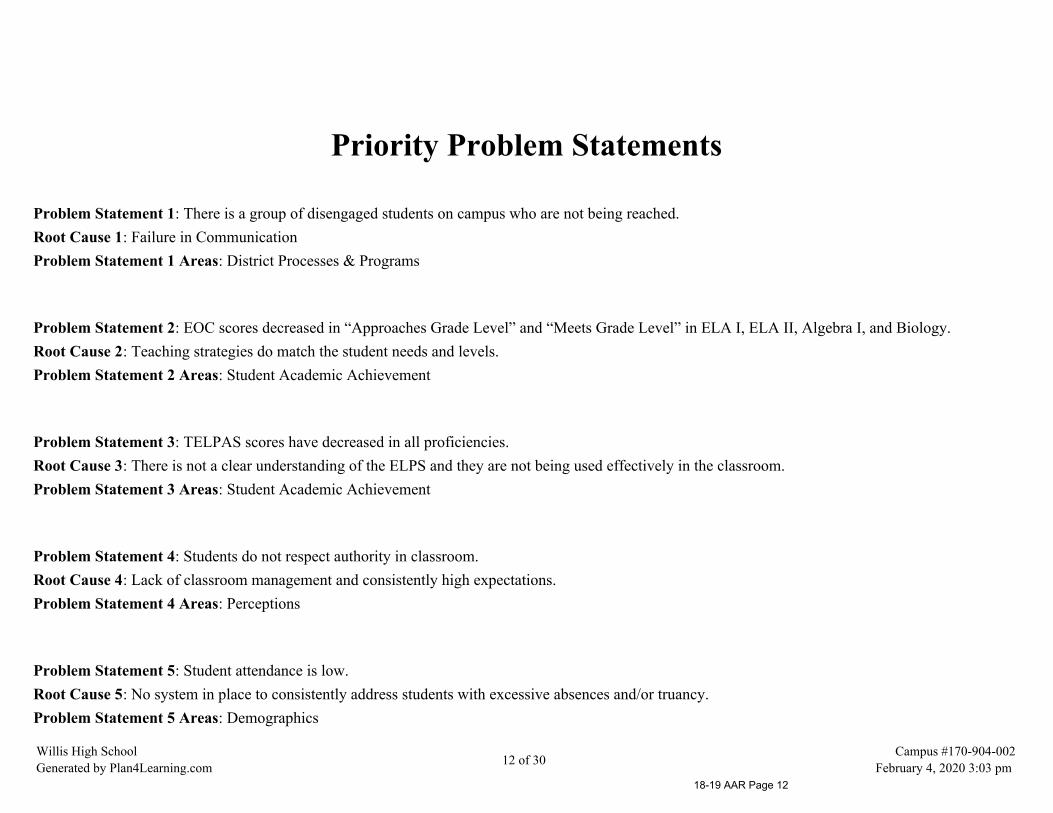
Problem Statement 1: There is a group of disengaged students on campus who are not being reached.Root Cause 1: Failure in CommunicationProblem Statement 1 Areas: District Processes & Programs
Problem Statement 2: EOC scores decreased in “Approaches Grade Level” and “Meets Grade Level” in ELA I, ELA II, Algebra I, and Biology.Root Cause 2: Teaching strategies do match the student needs and levels.Problem Statement 2 Areas: Student Academic Achievement
Problem Statement 3: TELPAS scores have decreased in all proficiencies.Root Cause 3: There is not a clear understanding of the ELPS and they are not being used effectively in the classroom.Problem Statement 3 Areas: Student Academic Achievement
Problem Statement 4: Students do not respect authority in classroom.Root Cause 4: Lack of classroom management and consistently high expectations.Problem Statement 4 Areas: Perceptions
Problem Statement 5: Student attendance is low.Root Cause 5: No system in place to consistently address students with excessive absences and/or truancy.Problem Statement 5 Areas: Demographics
Willis High SchoolGenerated by Plan4Learning.com 12 of 30
Campus #170-904-002February 4, 2020 3:03 pm
18-19 AAR Page 12
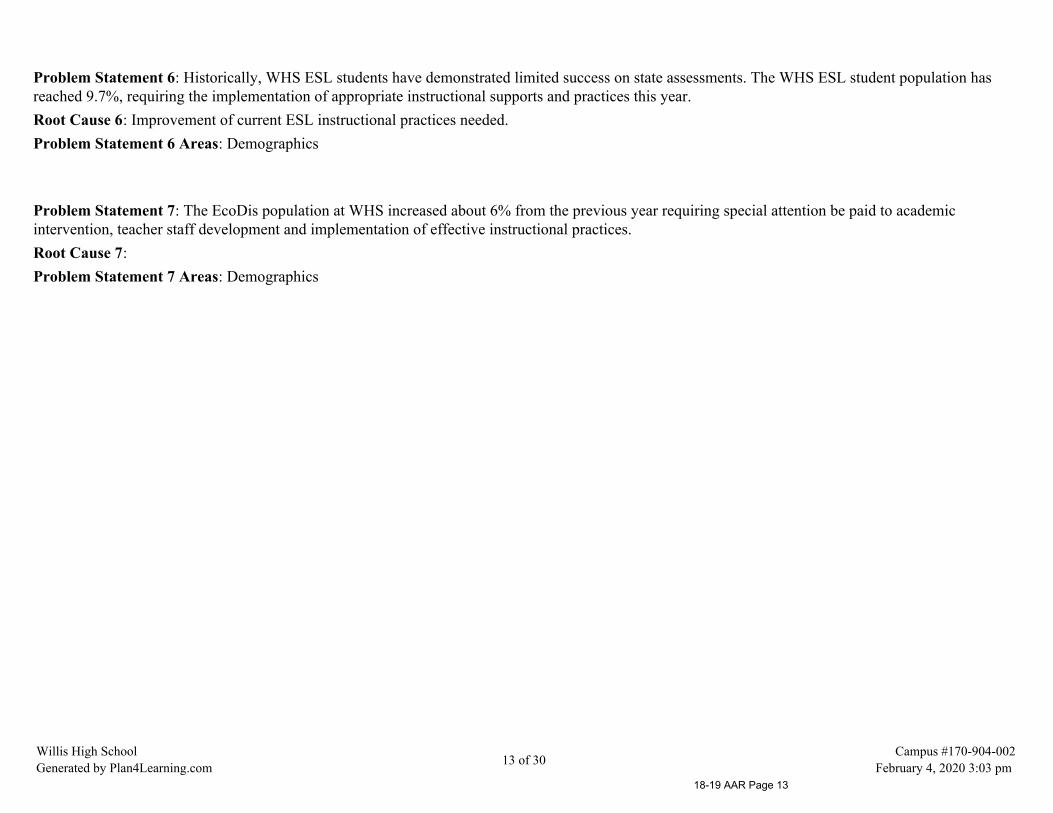
Problem Statement 6: Historically, WHS ESL students have demonstrated limited success on state assessments. The WHS ESL student population hasreached 9.7%, requiring the implementation of appropriate instructional supports and practices this year.Root Cause 6: Improvement of current ESL instructional practices needed.Problem Statement 6 Areas: Demographics
Problem Statement 7: The EcoDis population at WHS increased about 6% from the previous year requiring special attention be paid to academicintervention, teacher staff development and implementation of effective instructional practices.Root Cause 7:Problem Statement 7 Areas: Demographics
Willis High SchoolGenerated by Plan4Learning.com 13 of 30
Campus #170-904-002February 4, 2020 3:03 pm
18-19 AAR Page 13
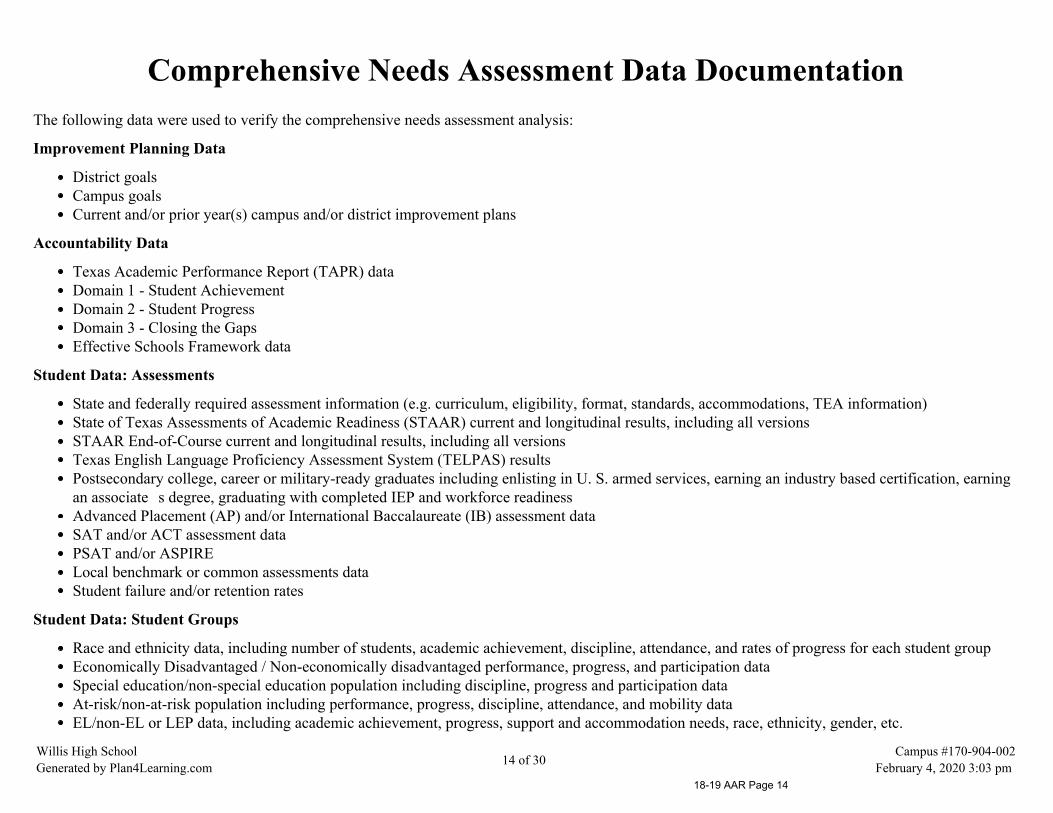
Comprehensive Needs Assessment Data DocumentationThe following data were used to verify the comprehensive needs assessment analysis:
Improvement Planning Data
District goalsCampus goalsCurrent and/or prior year(s) campus and/or district improvement plans
Accountability Data
Texas Academic Performance Report (TAPR) dataDomain 1 - Student AchievementDomain 2 - Student ProgressDomain 3 - Closing the GapsEffective Schools Framework data
Student Data: Assessments
State and federally required assessment information (e.g. curriculum, eligibility, format, standards, accommodations, TEA information)State of Texas Assessments of Academic Readiness (STAAR) current and longitudinal results, including all versionsSTAAR End-of-Course current and longitudinal results, including all versionsTexas English Language Proficiency Assessment System (TELPAS) resultsPostsecondary college, career or military-ready graduates including enlisting in U. S. armed services, earning an industry based certification, earningan associate s degree, graduating with completed IEP and workforce readinessAdvanced Placement (AP) and/or International Baccalaureate (IB) assessment dataSAT and/or ACT assessment dataPSAT and/or ASPIRELocal benchmark or common assessments dataStudent failure and/or retention rates
Student Data: Student Groups
Race and ethnicity data, including number of students, academic achievement, discipline, attendance, and rates of progress for each student groupEconomically Disadvantaged / Non-economically disadvantaged performance, progress, and participation dataSpecial education/non-special education population including discipline, progress and participation dataAt-risk/non-at-risk population including performance, progress, discipline, attendance, and mobility dataEL/non-EL or LEP data, including academic achievement, progress, support and accommodation needs, race, ethnicity, gender, etc.
Willis High SchoolGenerated by Plan4Learning.com 14 of 30
Campus #170-904-002February 4, 2020 3:03 pm
18-19 AAR Page 14

Career and Technical Education (CTE) data, including coherent sequence coursework aligned with the industry-based certifications, program growthand student achievement by race, ethnicity, gender, etc.Section 504 dataHomeless dataGifted and talented dataResponse to Intervention (RtI) student achievement dataDyslexia Data
Student Data: Behavior and Other Indicators
Completion rates and/or graduation rates dataAnnual dropout rate dataAttendance dataMobility rate, including longitudinal dataDiscipline recordsViolence and/or violence prevention recordsTobacco, alcohol, and other drug-use dataStudent surveys and/or other feedbackClass size averages by grade and subject
Employee Data
Professional learning communities (PLC) dataStaff surveys and/or other feedbackState certified and high quality staff dataTeacher/Student RatioCampus leadership dataCampus department and/or faculty meeting discussions and dataProfessional development needs assessment dataTTESS data
Parent/Community Data
Parent surveys and/or other feedback
Support Systems and Other Data
Organizational structure dataProcesses and procedures for teaching and learning, including program implementationStudy of best practices
Willis High SchoolGenerated by Plan4Learning.com 15 of 30
Campus #170-904-002February 4, 2020 3:03 pm
18-19 AAR Page 15

Goals
Goal 1: All students will reach high academic standards, at a minimum attaining proficiency or better onstate assessments.
Performance Objective 1: WHS will increase the number of students who approach mastery on the English I and English II EOCs by 10% in 2018-19.
Evaluation Data Source(s) 1: STAAR scoresCCA data from English I and English II MAP results
Summative Evaluation 1: Some progress made toward meeting Performance Objective
Next Year's Recommendation 1: Utilize Reader's Writer's Workshop strategies in English I and English II to encourage and promote readingand writing proficiency.
Strategy Description ELEMENTS Monitor Strategy's Expected Result/ImpactReviews
Formative SummativeNov Jan Mar June
Critical Success FactorsCSF 1
1) Students who were unsuccessful on English Ior English II EOC last year have been placed inan EOC Remediation class during Academy.
2.4, 2.5, 2.6 Lorry Dickinson,RTI Coordinator Richard Ray,Dean ofInstruction Brooke Paulson,AP over EnglishDepartment
Increase number of students who approach ormeet mastery on EOC retests offered inDecember, May, June, and July.
Problem Statements: Student Academic Achievement 1
Willis High SchoolGenerated by Plan4Learning.com 16 of 30
Campus #170-904-002February 4, 2020 3:03 pm
18-19 AAR Page 16

Strategy Description ELEMENTS Monitor Strategy's Expected Result/ImpactReviews
Formative SummativeNov Jan Mar June
Critical Success FactorsCSF 1
2) Students who are classified as EnglishLanguage Learners and scored at the beginner orintermediate level on TELPAS in 2017-18 havebeen placed in an English class where theyreceive sheltered instruction from an ESL/ELAcertified teacher.
2.4, 2.6 Richard Ray,Dean ofInstruction Brooke Paulson,AP over ESL Heather Vargo,ESL Coordinator
Increase number of LEP students who make ayear's growth on TELPAS as well as on English Ior English II EOC.
Problem Statements: Demographics 2, 4 - Student Academic Achievement 1, 2 - School Processes & Programs 1Funding Sources: SCE - 0.00
Critical Success FactorsCSF 1 CSF 2 CSF 3 CSF 4 CSF 7
3) The English I and English II teams have adesignated PLC period built into their scheduleso that each team can meet as a PLC every dayof the week without having to sacrifice time afterschool or during their conference period.
2.4, 2.5, 2.6 Richard Ray,Dean ofInstruction Brooke Paulson,AP over EnglishDepartment DeAnna Slovak,EnglishDepartment Chairand English IITeam Leader StephanieOsborn, English ITeam Leader Lorry Dickinson,RTI Coordinator
The expectation for the PLC period is that eachteam uses it to examine and analyze data fromboth formative and common assessments in orderto inform their instruction and better intervene onbehalf of students.
Problem Statements: Demographics 2, 4 - Student Academic Achievement 1 - School Processes & Programs 1
= Accomplished = Continue/Modify = No Progress = Discontinue
Performance Objective 1 Problem Statements:
DemographicsProblem Statement 2: Historically, WHS ESL students have demonstrated limited success on state assessments. The WHS ESL student population has reached 9.7%, requiring theimplementation of appropriate instructional supports and practices this year. Root Cause 2: Improvement of current ESL instructional practices needed.
Problem Statement 4: The EcoDis population at WHS increased about 6% from the previous year requiring special attention be paid to academic intervention, teacher staff developmentand implementation of effective instructional practices.
Willis High SchoolGenerated by Plan4Learning.com 17 of 30
Campus #170-904-002February 4, 2020 3:03 pm
18-19 AAR Page 17

Student Academic AchievementProblem Statement 1: EOC scores decreased in “Approaches Grade Level” and “Meets Grade Level” in ELA I, ELA II, Algebra I, and Biology. Root Cause 1: Teaching strategies domatch the student needs and levels.Problem Statement 2: TELPAS scores have decreased in all proficiencies. Root Cause 2: There is not a clear understanding of the ELPS and they are not being used effectively in theclassroom.
School Processes & ProgramsProblem Statement 1: There is a group of disengaged students on campus who are not being reached. Root Cause 1: Failure in Communication
Willis High SchoolGenerated by Plan4Learning.com 18 of 30
Campus #170-904-002February 4, 2020 3:03 pm
18-19 AAR Page 18
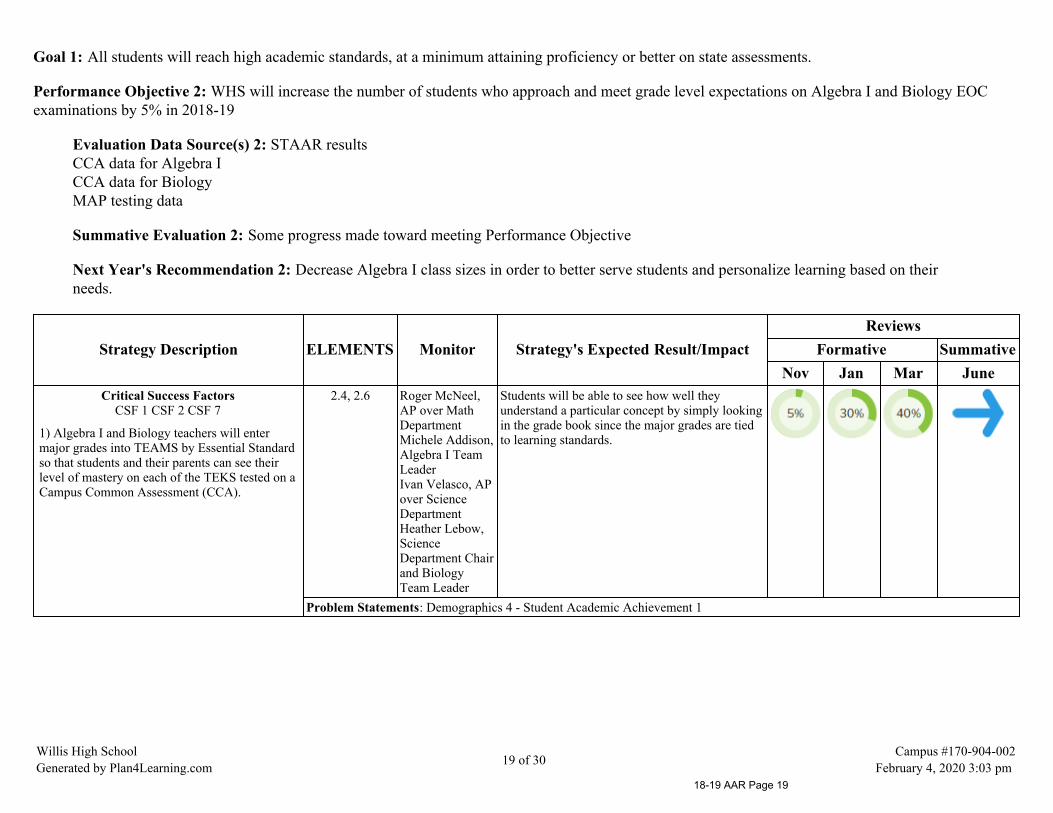
Goal 1: All students will reach high academic standards, at a minimum attaining proficiency or better on state assessments.
Performance Objective 2: WHS will increase the number of students who approach and meet grade level expectations on Algebra I and Biology EOCexaminations by 5% in 2018-19
Evaluation Data Source(s) 2: STAAR results CCA data for Algebra I CCA data for BiologyMAP testing data
Summative Evaluation 2: Some progress made toward meeting Performance Objective
Next Year's Recommendation 2: Decrease Algebra I class sizes in order to better serve students and personalize learning based on theirneeds.
Strategy Description ELEMENTS Monitor Strategy's Expected Result/ImpactReviews
Formative SummativeNov Jan Mar June
Critical Success FactorsCSF 1 CSF 2 CSF 7
1) Algebra I and Biology teachers will entermajor grades into TEAMS by Essential Standardso that students and their parents can see theirlevel of mastery on each of the TEKS tested on aCampus Common Assessment (CCA).
2.4, 2.6 Roger McNeel,AP over MathDepartment Michele Addison,Algebra I TeamLeader Ivan Velasco, APover ScienceDepartment Heather Lebow,ScienceDepartment Chairand BiologyTeam Leader
Students will be able to see how well theyunderstand a particular concept by simply lookingin the grade book since the major grades are tiedto learning standards.
Problem Statements: Demographics 4 - Student Academic Achievement 1
Willis High SchoolGenerated by Plan4Learning.com 19 of 30
Campus #170-904-002February 4, 2020 3:03 pm
18-19 AAR Page 19
Strategy Description ELEMENTS Monitor Strategy's Expected Result/ImpactReviews
Formative SummativeNov Jan Mar June
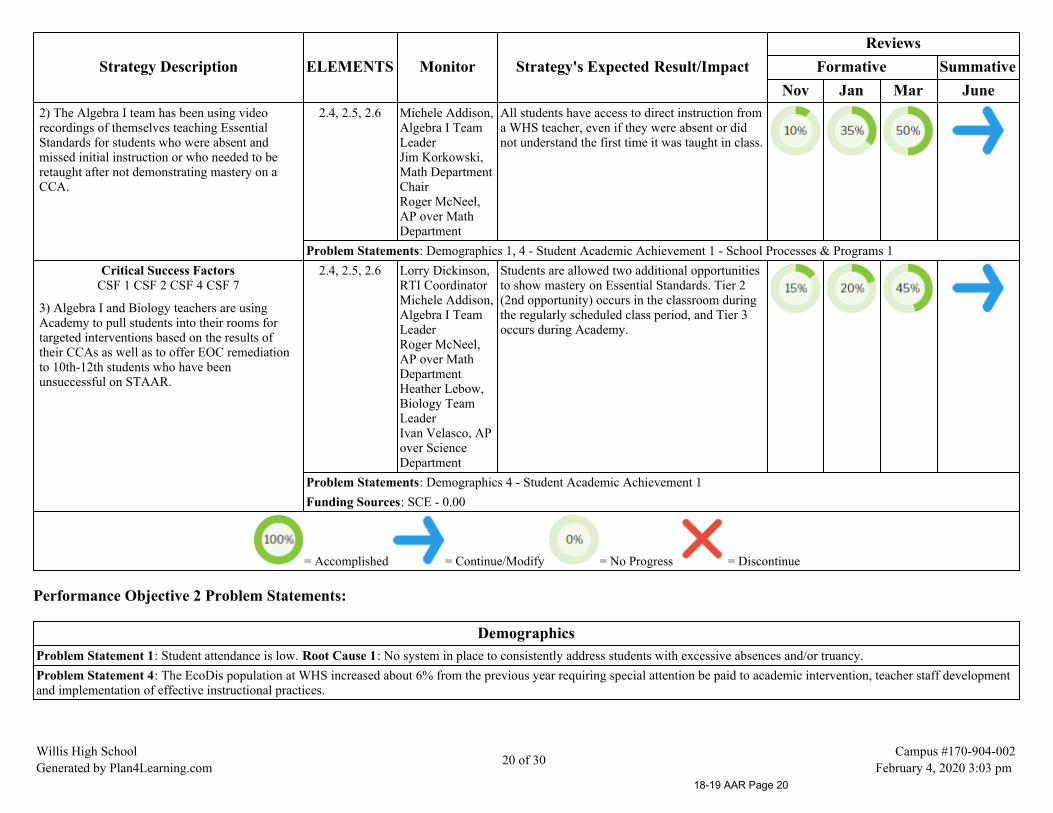
2) The Algebra I team has been using videorecordings of themselves teaching EssentialStandards for students who were absent andmissed initial instruction or who needed to beretaught after not demonstrating mastery on aCCA.
2.4, 2.5, 2.6 Michele Addison,Algebra I TeamLeaderJim Korkowski,Math DepartmentChair Roger McNeel,AP over MathDepartment
All students have access to direct instruction froma WHS teacher, even if they were absent or didnot understand the first time it was taught in class.
Problem Statements: Demographics 1, 4 - Student Academic Achievement 1 - School Processes & Programs 1Critical Success Factors
CSF 1 CSF 2 CSF 4 CSF 7
3) Algebra I and Biology teachers are usingAcademy to pull students into their rooms fortargeted interventions based on the results oftheir CCAs as well as to offer EOC remediationto 10th-12th students who have beenunsuccessful on STAAR.
2.4, 2.5, 2.6 Lorry Dickinson,RTI CoordinatorMichele Addison,Algebra I TeamLeader Roger McNeel,AP over MathDepartment Heather Lebow,Biology TeamLeader Ivan Velasco, APover ScienceDepartment
Students are allowed two additional opportunitiesto show mastery on Essential Standards. Tier 2(2nd opportunity) occurs in the classroom duringthe regularly scheduled class period, and Tier 3occurs during Academy.
Problem Statements: Demographics 4 - Student Academic Achievement 1Funding Sources: SCE - 0.00
= Accomplished = Continue/Modify = No Progress = Discontinue
Performance Objective 2 Problem Statements:
DemographicsProblem Statement 1: Student attendance is low. Root Cause 1: No system in place to consistently address students with excessive absences and/or truancy.Problem Statement 4: The EcoDis population at WHS increased about 6% from the previous year requiring special attention be paid to academic intervention, teacher staff developmentand implementation of effective instructional practices.
Willis High SchoolGenerated by Plan4Learning.com 20 of 30
Campus #170-904-002February 4, 2020 3:03 pm
18-19 AAR Page 20
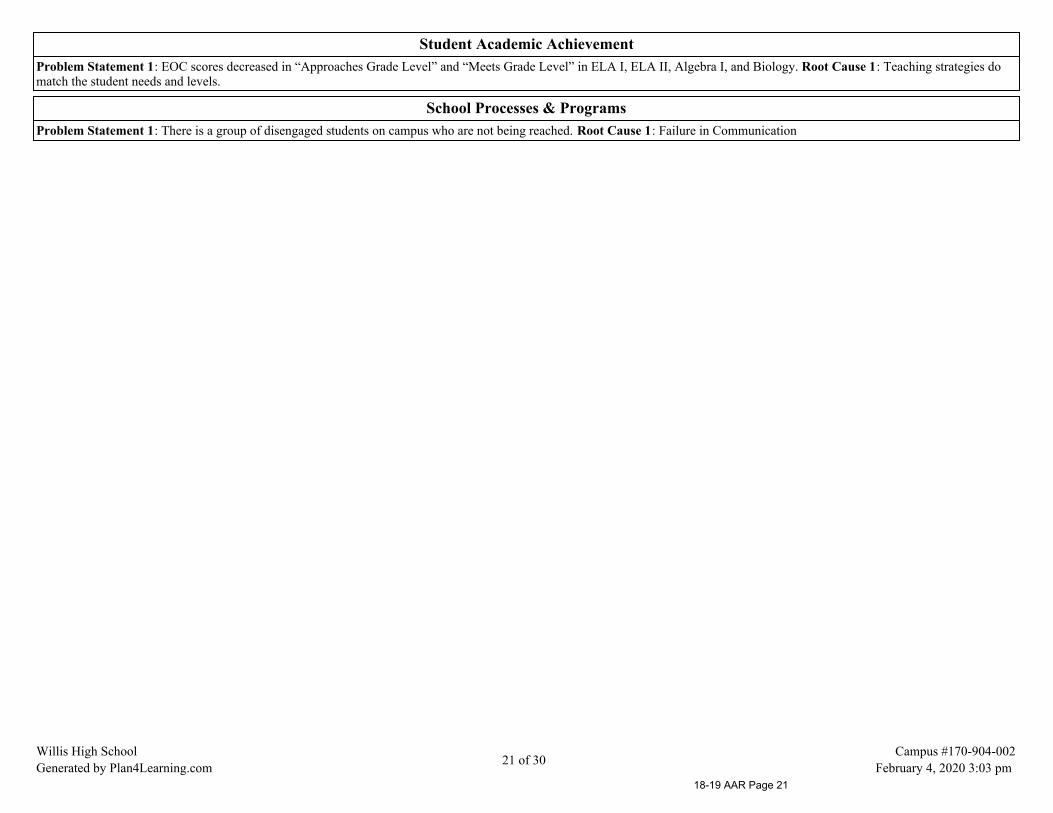
Student Academic AchievementProblem Statement 1: EOC scores decreased in “Approaches Grade Level” and “Meets Grade Level” in ELA I, ELA II, Algebra I, and Biology. Root Cause 1: Teaching strategies domatch the student needs and levels.
School Processes & ProgramsProblem Statement 1: There is a group of disengaged students on campus who are not being reached. Root Cause 1: Failure in Communication
Willis High SchoolGenerated by Plan4Learning.com 21 of 30
Campus #170-904-002February 4, 2020 3:03 pm
18-19 AAR Page 21

Goal 1: All students will reach high academic standards, at a minimum attaining proficiency or better on state assessments.
Performance Objective 3: WHS students who receive services through Special Education, ESL, or 504 will increase their performance on STAAR/EOCby 5% in 2018-19.
Evaluation Data Source(s) 3: STAAR CCAsBenchmarks
Summative Evaluation 3: Some progress made toward meeting Performance Objective
Next Year's Recommendation 3: Continue to monitor our special programs to ensure that students are served equitably.
Strategy Description ELEMENTS Monitor Strategy's Expected Result/ImpactReviews
Formative SummativeNov Jan Mar June
Critical Success FactorsCSF 1 CSF 4
1) All co-teach classes have a 2:1 ratio of generaleducation students to Special Education students.
2.4, 2.6 StephanieHodgins,Principal Richard Ray,Dean ofInstruction Tricia Neumann,Lead Counselor
Because class sizes for each population have beencapped at a certain number, teachers are betterable to provide instruction that meets the students'individual needs.
Problem Statements: Demographics 2, 4 - Student Academic Achievement 1 - School Processes & Programs 1Critical Success Factors
CSF 1 CSF 4 CSF 7
2) We now have sheltered instruction classes formost core content areas in order to meet theneeds of our beginner and intermediate levelEnglish Language Learners.
2.4, 2.6 StephanieHodgins,Principal Richard Ray,Dean ofInstruction Tricia Neumann,Lead Counselor Heather Vargo,ESL Coordinator
Students who have limited English proficiencyhave better access to quality instruction in asmaller, sheltered setting with the support of ourESL coordinator.
Problem Statements: Demographics 2, 4 - Student Academic Achievement 2
= Accomplished = Continue/Modify = No Progress = Discontinue
Willis High SchoolGenerated by Plan4Learning.com 22 of 30
Campus #170-904-002February 4, 2020 3:03 pm
18-19 AAR Page 22
Performance Objective 3 Problem Statements:
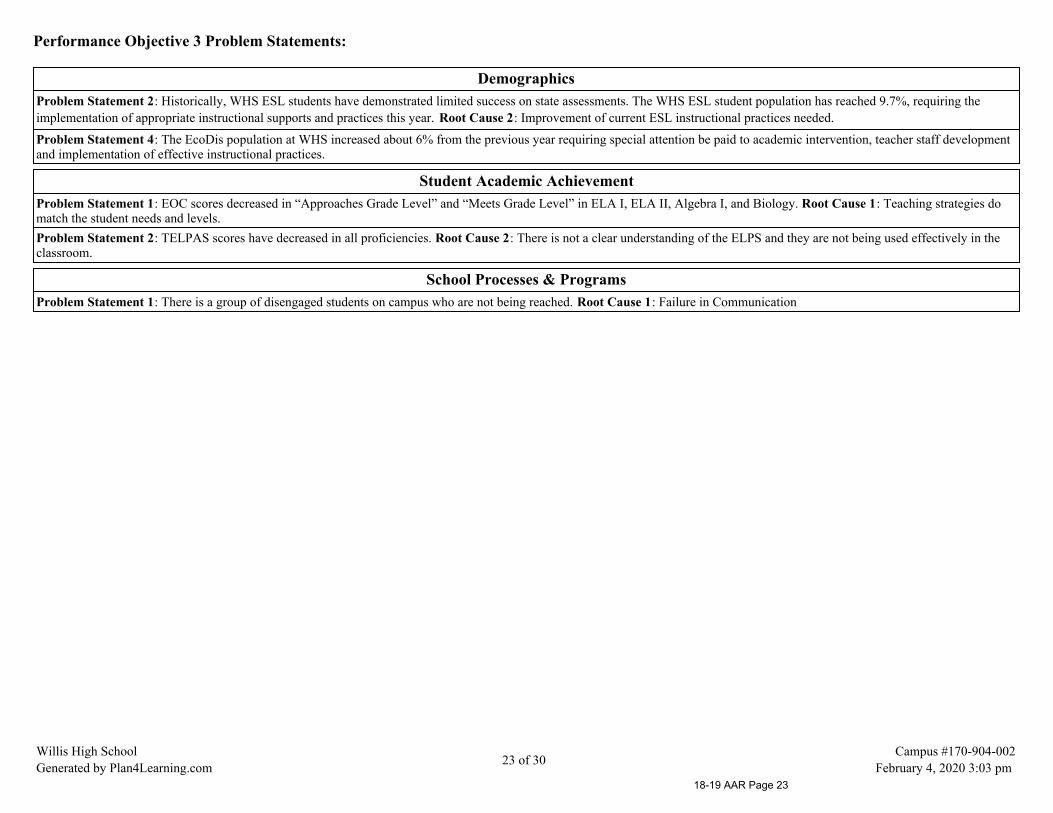
DemographicsProblem Statement 2: Historically, WHS ESL students have demonstrated limited success on state assessments. The WHS ESL student population has reached 9.7%, requiring theimplementation of appropriate instructional supports and practices this year. Root Cause 2: Improvement of current ESL instructional practices needed.
Problem Statement 4: The EcoDis population at WHS increased about 6% from the previous year requiring special attention be paid to academic intervention, teacher staff developmentand implementation of effective instructional practices.
Student Academic AchievementProblem Statement 1: EOC scores decreased in “Approaches Grade Level” and “Meets Grade Level” in ELA I, ELA II, Algebra I, and Biology. Root Cause 1: Teaching strategies domatch the student needs and levels.Problem Statement 2: TELPAS scores have decreased in all proficiencies. Root Cause 2: There is not a clear understanding of the ELPS and they are not being used effectively in theclassroom.
School Processes & ProgramsProblem Statement 1: There is a group of disengaged students on campus who are not being reached. Root Cause 1: Failure in Communication
Willis High SchoolGenerated by Plan4Learning.com 23 of 30
Campus #170-904-002February 4, 2020 3:03 pm
18-19 AAR Page 23

Goal 2: All parents will participate in regular, two-way, and meaningful communication involving studentacademic learning and school activities.
Performance Objective 1: 100% of our parents will feel that the staff at WHS communicates well and often in 2018-19.
Evaluation Data Source(s) 1: Parent surveys
Summative Evaluation 1: Some progress made toward meeting Performance Objective
Next Year's Recommendation 1: Administration will work to front load communication ahead of big changes and encourage teachers to dothe same by putting a monitoring system in place to ensure that it happens.
Strategy Description ELEMENTS Monitor Strategy's Expected Result/ImpactReviews
Formative SummativeNov Jan Mar June
Critical Success FactorsCSF 5
1) Administrators will call parents directly everytime a student is assigned a disciplinaryconsequence and will make two positive phonecalls per week.
Administration Parents will be aware of how their children arebeing disciplined at school.
Problem Statements: School Processes & Programs 1
Critical Success FactorsCSF 5
2) Teachers will make parent contact before eachmarking period to let them know if their studentis failing. They will also make two positiveparent phone calls per week.
DepartmentChairs AssistantPrincipals
Parents will be aware of how students areprogressing in their classes. Positive phone callswill help improve community's response to ourcampus staff.
Problem Statements: School Processes & Programs 1 - Perceptions 3
Willis High SchoolGenerated by Plan4Learning.com 24 of 30
Campus #170-904-002February 4, 2020 3:03 pm
18-19 AAR Page 24

Strategy Description ELEMENTS Monitor Strategy's Expected Result/ImpactReviews
Formative SummativeNov Jan Mar June
Critical Success FactorsCSF 5
3) Admin will utilize Blackboard to send parentsand students necessary messages as well as theweekly Paw Print.
New AP [Fain]Emily Meachen,JournalismTeacher
Parents will have access to positive messagesbeing sent from WHS.
Problem Statements: School Processes & Programs 1
= Accomplished = Continue/Modify = No Progress = Discontinue
Performance Objective 1 Problem Statements:
School Processes & ProgramsProblem Statement 1: There is a group of disengaged students on campus who are not being reached. Root Cause 1: Failure in Communication
PerceptionsProblem Statement 3: Students do not respect authority in classroom. Root Cause 3: Lack of classroom management and consistently high expectations.
Willis High SchoolGenerated by Plan4Learning.com 25 of 30
Campus #170-904-002February 4, 2020 3:03 pm
18-19 AAR Page 25
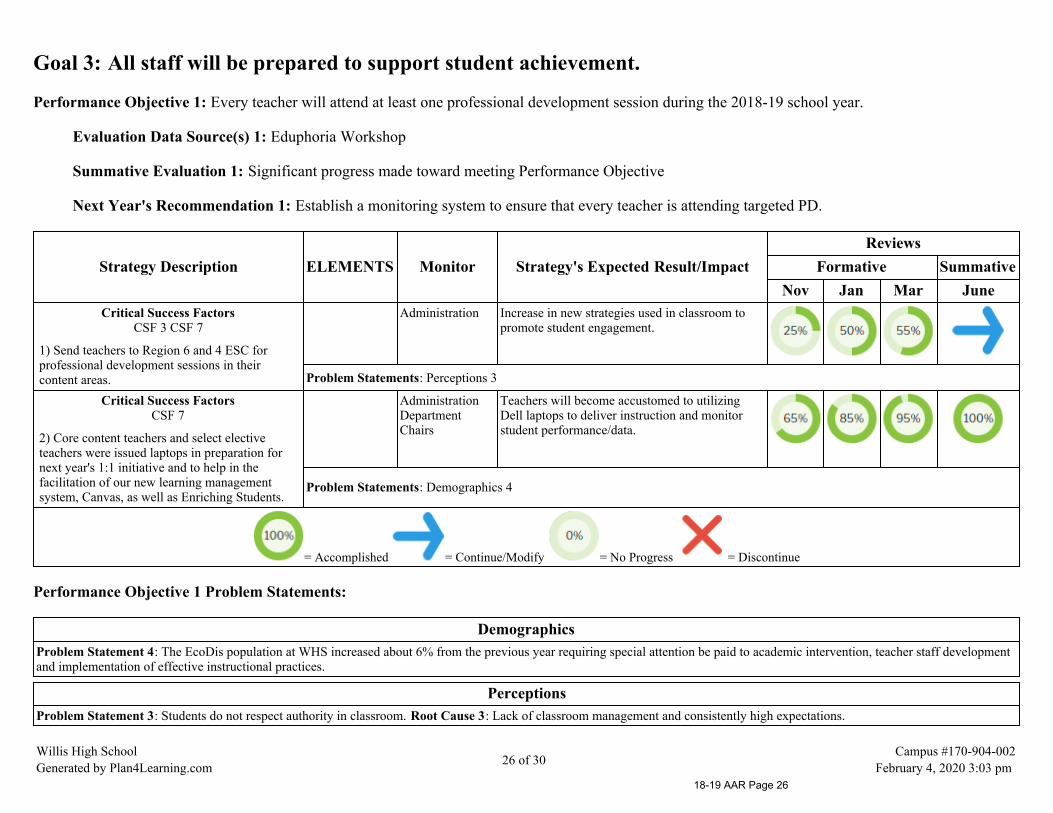
Goal 3: All staff will be prepared to support student achievement.
Performance Objective 1: Every teacher will attend at least one professional development session during the 2018-19 school year.
Evaluation Data Source(s) 1: Eduphoria Workshop
Summative Evaluation 1: Significant progress made toward meeting Performance Objective
Next Year's Recommendation 1: Establish a monitoring system to ensure that every teacher is attending targeted PD.
Strategy Description ELEMENTS Monitor Strategy's Expected Result/ImpactReviews
Formative SummativeNov Jan Mar June
Critical Success FactorsCSF 3 CSF 7
1) Send teachers to Region 6 and 4 ESC forprofessional development sessions in theircontent areas.
Administration Increase in new strategies used in classroom topromote student engagement.
Problem Statements: Perceptions 3
Critical Success FactorsCSF 7
2) Core content teachers and select electiveteachers were issued laptops in preparation fornext year's 1:1 initiative and to help in thefacilitation of our new learning managementsystem, Canvas, as well as Enriching Students.
Administration DepartmentChairs
Teachers will become accustomed to utilizingDell laptops to deliver instruction and monitorstudent performance/data.
Problem Statements: Demographics 4
= Accomplished = Continue/Modify = No Progress = Discontinue
Performance Objective 1 Problem Statements:
DemographicsProblem Statement 4: The EcoDis population at WHS increased about 6% from the previous year requiring special attention be paid to academic intervention, teacher staff developmentand implementation of effective instructional practices.
PerceptionsProblem Statement 3: Students do not respect authority in classroom. Root Cause 3: Lack of classroom management and consistently high expectations.
Willis High SchoolGenerated by Plan4Learning.com 26 of 30
Campus #170-904-002February 4, 2020 3:03 pm
18-19 AAR Page 26

Goal 4: All district funds will be utilized for programs that ensure the success of every student.
Performance Objective 1: 100% of funding decisions made by the campus administration will be prioritized by campus improvement initiatives during the2018-19 school year.
Evaluation Data Source(s) 1: Campus budget audit evaluating line by line alignment between budget spending and campus improvement plan
Summative Evaluation 1: Met Performance Objective
Strategy Description ELEMENTS Monitor Strategy's Expected Result/ImpactReviews
Formative SummativeNov Jan Mar June
Critical Success FactorsCSF 3
1) Continue to assess each department during thespring to determine needs.
District andcampusadministration
To ensure that campus funds are allocated to bestsupport the needs of students.
Problem Statements: Demographics 4 - Student Academic Achievement 1Critical Success Factors
CSF 3
2) Continue to assess all requisitions todetermine if funds support the campus goals.
Campusadministration
To ensure that outgoing campus funds are beingspent in the best interest of students and theirsuccess.
Problem Statements: Demographics 4 - Student Academic Achievement 1
= Accomplished = Continue/Modify = No Progress = Discontinue
Performance Objective 1 Problem Statements:
DemographicsProblem Statement 4: The EcoDis population at WHS increased about 6% from the previous year requiring special attention be paid to academic intervention, teacher staff developmentand implementation of effective instructional practices.
Student Academic AchievementProblem Statement 1: EOC scores decreased in “Approaches Grade Level” and “Meets Grade Level” in ELA I, ELA II, Algebra I, and Biology. Root Cause 1: Teaching strategies domatch the student needs and levels.
Willis High SchoolGenerated by Plan4Learning.com 27 of 30
Campus #170-904-002February 4, 2020 3:03 pm
18-19 AAR Page 27
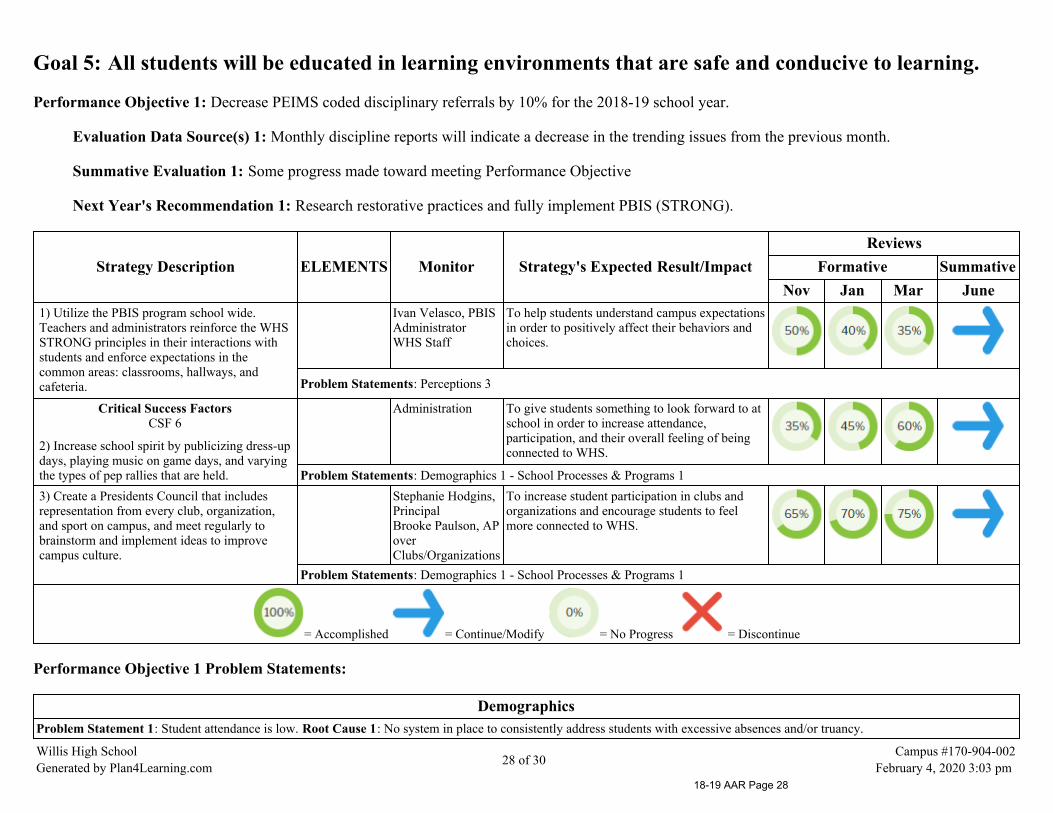
Goal 5: All students will be educated in learning environments that are safe and conducive to learning.
Performance Objective 1: Decrease PEIMS coded disciplinary referrals by 10% for the 2018-19 school year.
Evaluation Data Source(s) 1: Monthly discipline reports will indicate a decrease in the trending issues from the previous month.
Summative Evaluation 1: Some progress made toward meeting Performance Objective
Next Year's Recommendation 1: Research restorative practices and fully implement PBIS (STRONG).
Strategy Description ELEMENTS Monitor Strategy's Expected Result/ImpactReviews
Formative SummativeNov Jan Mar June
1) Utilize the PBIS program school wide.Teachers and administrators reinforce the WHSSTRONG principles in their interactions withstudents and enforce expectations in thecommon areas: classrooms, hallways, andcafeteria.
Ivan Velasco, PBISAdministrator WHS Staff
To help students understand campus expectationsin order to positively affect their behaviors andchoices.
Problem Statements: Perceptions 3
Critical Success FactorsCSF 6
2) Increase school spirit by publicizing dress-updays, playing music on game days, and varyingthe types of pep rallies that are held.
Administration To give students something to look forward to atschool in order to increase attendance,participation, and their overall feeling of beingconnected to WHS.
Problem Statements: Demographics 1 - School Processes & Programs 13) Create a Presidents Council that includesrepresentation from every club, organization,and sport on campus, and meet regularly tobrainstorm and implement ideas to improvecampus culture.
Stephanie Hodgins,Principal Brooke Paulson, APoverClubs/Organizations
To increase student participation in clubs andorganizations and encourage students to feelmore connected to WHS.
Problem Statements: Demographics 1 - School Processes & Programs 1
= Accomplished = Continue/Modify = No Progress = Discontinue
Performance Objective 1 Problem Statements:
DemographicsProblem Statement 1: Student attendance is low. Root Cause 1: No system in place to consistently address students with excessive absences and/or truancy.
Willis High SchoolGenerated by Plan4Learning.com 28 of 30
Campus #170-904-002February 4, 2020 3:03 pm
18-19 AAR Page 28

School Processes & ProgramsProblem Statement 1: There is a group of disengaged students on campus who are not being reached. Root Cause 1: Failure in Communication
PerceptionsProblem Statement 3: Students do not respect authority in classroom. Root Cause 3: Lack of classroom management and consistently high expectations.
Willis High SchoolGenerated by Plan4Learning.com 29 of 30
Campus #170-904-002February 4, 2020 3:03 pm
18-19 AAR Page 29

District Funding Summary
SCEGoal Objective Strategy Resources Needed Account Code Amount
1 1 2 Heather Vargo, ESL Coordinator $0.001 2 3 Enriching Students $0.00
Sub-Total $0.00Grand Total $0.00
Willis High SchoolGenerated by Plan4Learning.com 30 of 30
Campus #170-904-002February 4, 2020 3:03 pm
18-19 AAR Page 30
Willis Independent School District
Stubblefield Daep
2018-2019
Stubblefield DaepGenerated by Plan4Learning.com 1 of 23 February 4, 2020 3:03 pm
18-19 AAR Page 31

Table of Contents
Comprehensive Needs Assessment 3Needs Assessment Overview 3Demographics 4Student Academic Achievement 7School Processes & Programs 8Perceptions 10
Priority Problem Statements 11Comprehensive Needs Assessment Data Documentation 12Goals 14
Goal 1: All students will reach high academic standards, at a minimum attaining proficiency or better on state assessments. 14Goal 2: All parents will participate in regular, two-way, and meaningful communication involving student academic learning and school activities. 15Goal 3: All staff will be prepared to support student achievement. 18Goal 4: All district funds will be utilized for programs that ensure the success of every student. 20Goal 5: All students will be educated in learning environments that are safe and conducive to learning. 21
State Compensatory 23Personnel for Stubblefield Daep: 23
Stubblefield DaepGenerated by Plan4Learning.com 2 of 23 February 4, 2020 3:03 pm
18-19 AAR Page 32

Comprehensive Needs Assessment
Needs Assessment Overview
After looking at Stubblefield's goals there are many mastered but some that I would like to continue. We need to improve on following up with students attheir home campus after they complete their DAEP placement. We want to ensure they are on the right track both academically and behaviorally. To helpincrease the visits, my plan is to make schedule using Google docs and designate a certain day of the week that the Principal or Assistant Principal will visitthe home campus and students. There will be a form created to document the visit and conversation with the student so we can hopefully see growth in thestudent. We will continue the PBIS (Positive Behavior Interventions and Supports) to improve discipline techniques and relationships within theclassrooms. We will continue to call students that are absent by seven thirty in the morning, we feel this has helped improve attendance. We will implementschool-wide strategies, behaviorally and academically that are included in the plan that provides for all students that come to Stubblefield the opportunity togrow academically and behaviorally.
Stubblefield DaepGenerated by Plan4Learning.com 3 of 23 February 4, 2020 3:03 pm
18-19 AAR Page 33
Demographics
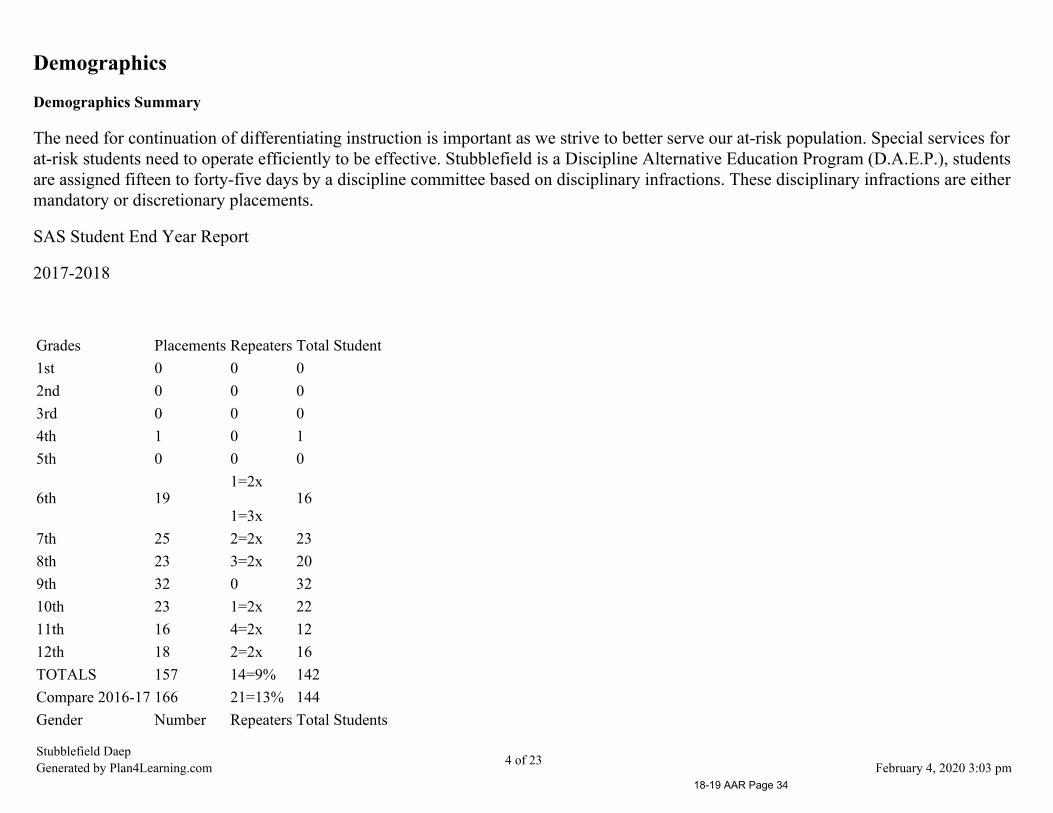
Demographics Summary
The need for continuation of differentiating instruction is important as we strive to better serve our at-risk population. Special services forat-risk students need to operate efficiently to be effective. Stubblefield is a Discipline Alternative Education Program (D.A.E.P.), studentsare assigned fifteen to forty-five days by a discipline committee based on disciplinary infractions. These disciplinary infractions are eithermandatory or discretionary placements.
SAS Student End Year Report
2017-2018
Grades Placements Repeaters Total Student1st 0 0 02nd 0 0 03rd 0 0 04th 1 0 15th 0 0 0
6th 191=2x
1=3x16
7th 25 2=2x 238th 23 3=2x 209th 32 0 3210th 23 1=2x 2211th 16 4=2x 1212th 18 2=2x 16TOTALS 157 14=9% 142Compare 2016-17 166 21=13% 144Gender Number Repeaters Total Students
Stubblefield DaepGenerated by Plan4Learning.com 4 of 23 February 4, 2020 3:03 pm
18-19 AAR Page 34
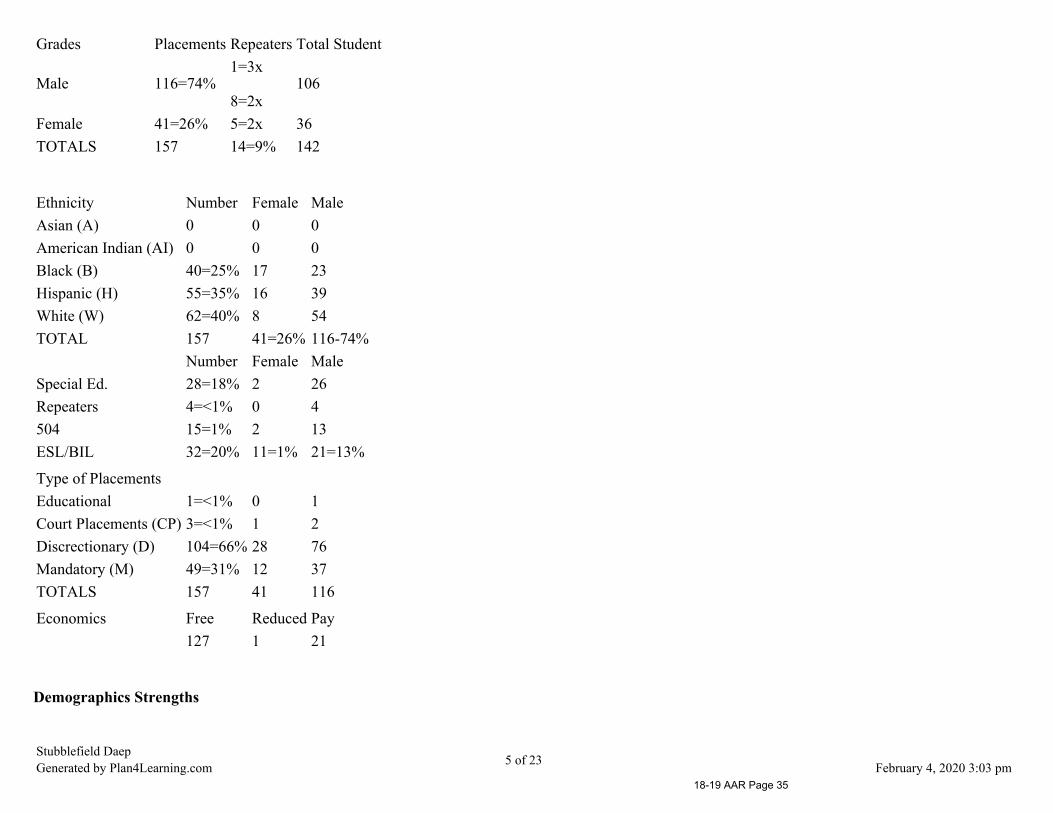
Grades Placements Repeaters Total Student
Male 116=74%1=3x
8=2x10⁶
Female 41=26% 5=2x 36TOTALS 157 14=9% 142
Ethnicity Number Female MaleAsian (A) 0 0 0American Indian (AI) 0 0 0Black (B) 40=25% 17 23Hispanic (H) 55=35% 16 39White (W) 62=40% 8 54TOTAL 157 41=26% 116-74%
Number Female MaleSpecial Ed. 28=18% 2 26Repeaters 4=<1% 0 4504 15=1% 2 13ESL/BIL 32=20% 11=1% 21=13%
Type of PlacementsEducational 1=<1% 0 1Court Placements (CP) 3=<1% 1 2Discrectionary (D) 104=66% 28 76Mandatory (M) 49=31% 12 37TOTALS 157 41 116
Economics Free Reduced Pay127 1 21
Demographics Strengths
Stubblefield DaepGenerated by Plan4Learning.com 5 of 23 February 4, 2020 3:03 pm
18-19 AAR Page 35
Stubblefield's demographics fluctuate depending on the students being sent for disciplinary reasons throughout the school year.
Problem Statements Identifying Demographics Needs
Problem Statement 1: The Special Education population numbers tend to be high. Root Cause: Special Education mandatory placements
Stubblefield DaepGenerated by Plan4Learning.com 6 of 23 February 4, 2020 3:03 pm
18-19 AAR Page 36
Student Academic Achievement
Student Academic Achievement Summary
The students are expected to remain on the district time-lines in all core areas to continue their education using District Pacing Guides,YAG (Year at a Glance) to stay with the pace of the other students on the main campus'. As the students return to their home campuses,they will be able to join the learning on pace. The Scope and Sequence, YAG and Forethought in Eduphoria from the departments will beused to keep our students on pace. Restorative Practices (Discipline) implementation is a main focus this year at Stubblefield. Our goal isto empower students to become conflict problem solvers and to build relationships to have a better focus on academic success, byimplementing campus standards of behavior during classroom instruction, transitions and meal times.
Student Academic Achievement Strengths
Stubblefield's Achievement Strengths are:
Teachers are able to access the home campus' lesson plans using Forethought in Eduphoria to help them keep the students on trackwhile they are on our campus, so that when they return to their home campus they are on track to be able to continue their learning.
1.
Restorative Practices (Discipline) learned while they are at Stubblefield can be used to keep the students on campus and buildrelationships with teacher and students to foster academic and social success.
2.
Students flourish with small class sizes or when there is low enrollment more one on one assistance.3.
Stubblefield DaepGenerated by Plan4Learning.com 7 of 23 February 4, 2020 3:03 pm
18-19 AAR Page 37
School Processes & Programs
School Processes & Programs Summary
Curriculum and Instruction strategies and plans are shared by the home campus. The teachers utilize Forethought in Eduphoria, district pacing guides,TEKS and TEKS Resource, to insure the students stay on track with their home campus. Common Assessments are created by the home campus' that arealigned with the TEKS in the district curriculum pacing guides. The data from these Common Assessments are used by teachers to measure the areas ofweakness to identify specific students needing differentiated instruction. Teachers also have access to Student's State Testing STAAR and EOC results toanalyze to help them better serve the students and discover their strengths and weaknesses.
Teacher quality is good and has improved as a result of meaningful and purposeful campus and district professional development. The turnover rate isexcellent, only one teacher left for a promotion and one secretary moved.
The need for continuation of differentiating instruction is important as we strive to better serve our at-risk population. Special services for at-risk studentsneed to operate efficiently to be effective. Stubblefield is a Discipline Alternative Education Program (D.A.E.P.), students are assigned fifteen to forty-fivedays by a discipline committee based on disciplinary infractions. These disciplinary infractions are either mandatory or discretionary placements.Stubblefield's goal is to show growth and gains in student performance both academically and behaviorally while at the discipline alternative campus. Weimplement the Why Try? program, use Positive Behavior Interventions and Supports (PBIS) and Restorative Practices (Discipline) to insure students arehaving access to behavioral skills and teachers are building relationships with students.
School Processes & Programs Strengths
Stubblefield's strengths:
District Pacing Guides, IFD, Vertical Alignment, TEKS Resource, and Forethought in Eduphoria.1.Common Assessments, Benchmark Testing and MAP Testing and Reports2.Curriculum Resources provided by the district; Comprehension Tool Kit, Lucy Calkins, Envision Math, STEPScope Science, and LLI (LeveledLiteracy Intervention).
3.
Daily Behavior Reports sent home that require a parent signature.4.Parents required to meet and go through an intake before students can attend Stubblefield.he Assistance League from Montgomery County helpingstudents and parents in need.
5.
The Parent Center at Roark.6.Parents access to grades on-line.7.Teaching the Why Try? Program every day before the school day starts. Introduction of the topic, Music, videos, writing, activities and games are
Stubblefield DaepGenerated by Plan4Learning.com 8 of 23 February 4, 2020 3:03 pm
18-19 AAR Page 38

1.2.3.
4.5.
6.7.
used to help students better understand the program and topics being delivered.8.
Positive attitudes and motivation essential for the acquisition of knowledge, understanding and the desire for learning.9.Teach the qualities that are important for students to become a good citizen and a self-sufficient member of society.10.Positive values of cooperation and self-respect to empower them to resist negative influences.11.Positive ethical and social attitudes, good self-concept and pride in their accomplishments and in their community.12.Restorative Practices (Discipline) and PBIS will give students options in resolving conflicts and building relationships to help foster their successwhen returning to their home campus and in life.
13.
Stubblefield DaepGenerated by Plan4Learning.com 9 of 23 February 4, 2020 3:03 pm
18-19 AAR Page 39
Perceptions
Perceptions Summary
Stubblefield Academy D.A.E.P. promotes and maintains a positive school culture that promotes student growth and achievement, bothacademically and behaviorally. Incorporating PBIS, Positive Behavior Interventions and Supports, is a proactive approach to establishingthe behavioral supports and social culture needed for all students in a school to achieve social, emotional and academic success. Allteachers make the effort to provide the educational environment necessary to develop habits and to be successful in the regular setting andat their home campus. The Why Try? Program is implemented and taught daily, by the teachers, before the day starts. This programteaches the students how to build self-esteem, self-discipline, decision making skills, problem solving skills, bullying prevention, refusalskills, coping skills, conflict-resolution skills, and tobacco, alcohol and drug prevention, among other topics.
Perceptions Strengths
Stubblefield's School Culture and Climate Strengths that administration and faculty provide are:
Teaching the Why Try? Program every day before the school day starts. Introduction of the topic, Music, videos, writing, activitiesand games are used to help students better understand the program and topics being delivered.
1.
Positive attitudes and motivation essential for the acquisition of knowledge, understanding and the desire for learning.2.Teach the qualities that are important for students to become a good citizen and a self-sufficient member of society.3.Positive values of cooperation and self-respect to empower them to resist negative influences.4.Positive ethical and social attitudes, good self-concept and pride in their accomplishments and in their community.5.Restorative Practices (Discipline) and PBIS will give students options in resolving conflicts and building relationships to help fostertheir success when returning to their home campus and in life.
6.
Stubblefield DaepGenerated by Plan4Learning.com 10 of 23 February 4, 2020 3:03 pm
18-19 AAR Page 40
Priority Problem Statements
Stubblefield DaepGenerated by Plan4Learning.com 11 of 23 February 4, 2020 3:03 pm
18-19 AAR Page 41
Comprehensive Needs Assessment Data DocumentationThe following data were used to verify the comprehensive needs assessment analysis:
Improvement Planning Data
District goalsCampus goalsCurrent and/or prior year(s) campus and/or district improvement plansCampus and/or district planning and decision making committee(s) meeting dataState and federal planning requirements
Accountability Data
Texas Academic Performance Report (TAPR) dataDomain 1 - Student AchievementDomain 2 - Student ProgressDomain 3 - Closing the GapsEffective Schools Framework dataAccountability Distinction DesignationsFederal Report Card DataPBMAS data
Student Data: Assessments
State and federally required assessment information (e.g. curriculum, eligibility, format, standards, accommodations, TEA information)State of Texas Assessments of Academic Readiness (STAAR) current and longitudinal results, including all versionsSTAAR End-of-Course current and longitudinal results, including all versionsSTAAR Released Test QuestionsTexas English Language Proficiency Assessment System (TELPAS) resultsAdvanced Placement (AP) and/or International Baccalaureate (IB) assessment dataStudent Success Initiative (SSI) data for Grades 5 and 8SSI: Istation Indicators of Progress (ISIP) accelerated reading assessment data for Grades 3-5 (TEA approved statewide license)SSI: Compass Learning accelerated reading assessment data for Grades 6-8 (TEA approved statewide license)SSI: Apex Learning accelerated reading assessment data for English I and II (TEA approved statewide license)Local benchmark or common assessments dataStudent failure and/or retention ratesRunning Records results
Stubblefield DaepGenerated by Plan4Learning.com 12 of 23 February 4, 2020 3:03 pm
18-19 AAR Page 42

Observation Survey results
Student Data: Student Groups
Race and ethnicity data, including number of students, academic achievement, discipline, attendance, and rates of progress for each student groupEconomically Disadvantaged / Non-economically disadvantaged performance, progress, and participation dataMale / Female performance, progress, and participation dataSpecial education/non-special education population including discipline, progress and participation dataAt-risk/non-at-risk population including performance, progress, discipline, attendance, and mobility dataCareer and Technical Education (CTE) data, including coherent sequence coursework aligned with the industry-based certifications, program growthand student achievement by race, ethnicity, gender, etc.Section 504 data
Student Data: Behavior and Other Indicators
Completion rates and/or graduation rates dataAnnual dropout rate dataAttendance dataDiscipline recordsViolence and/or violence prevention recordsStudent surveys and/or other feedback
Employee Data
Staff surveys and/or other feedbackState certified and high quality staff dataTeacher/Student RatioCampus leadership dataCampus department and/or faculty meeting discussions and dataProfessional development needs assessment dataEvaluation(s) of professional development implementation and impactTTESS data
Stubblefield DaepGenerated by Plan4Learning.com 13 of 23 February 4, 2020 3:03 pm
18-19 AAR Page 43

Goals
Goal 1: All students will reach high academic standards, at a minimum attaining proficiency or better onstate assessments.
Performance Objective 1: Stubblefield core teachers will review all available student data every three weeks, throughout the school year ending May 24,2019, and evaluate to determine appropriate instructional strategies and interventions that will result in a 5% increase in student academic progress.
Evaluation Data Source(s) 1: Common Assessments, daily work, MAPS Testing, major tests, quizzes
Summative Evaluation 1: Some progress made toward meeting Performance Objective
Strategy Description Monitor Strategy's Expected Result/ImpactReviews
Formative SummativeNov Jan Mar June
1) Incorporate STAAR formatted questions on allcommon assessments in target areas as identified by theTEKS.
Administrators andteachers
STAAR formatted questions, on common assessments,will lead to an increase of student achievement onbenchmark, EOC and STAAR tests.
2) Analyze the results from benchmarks in English,Writing, Math, Science and Social Studies to determineremediation strategies.
Administration andteachers
Benchmark results will lead to student growth andperformance.
3) Lesson plans will reflect focused instruction alignedwith TEKS, district pacing guide, IFD, and YAG.
Administration Teacher will review Forethought in Eduphoria of thehome campus. Improved planning and instruction willlead to student growth and performance.
4) Technology will be increased by providing teacherswith more technology devices. Teachers will provide students with technology basedinstruction in all core subject areas.
Administration,teachers andtechnologydepartment
All classrooms are equipped with appropriate technologyto meet the needs of their students as well as providingengaging lessons.
= Accomplished = Continue/Modify = No Progress = Discontinue
Stubblefield DaepGenerated by Plan4Learning.com 14 of 23 February 4, 2020 3:03 pm
18-19 AAR Page 44
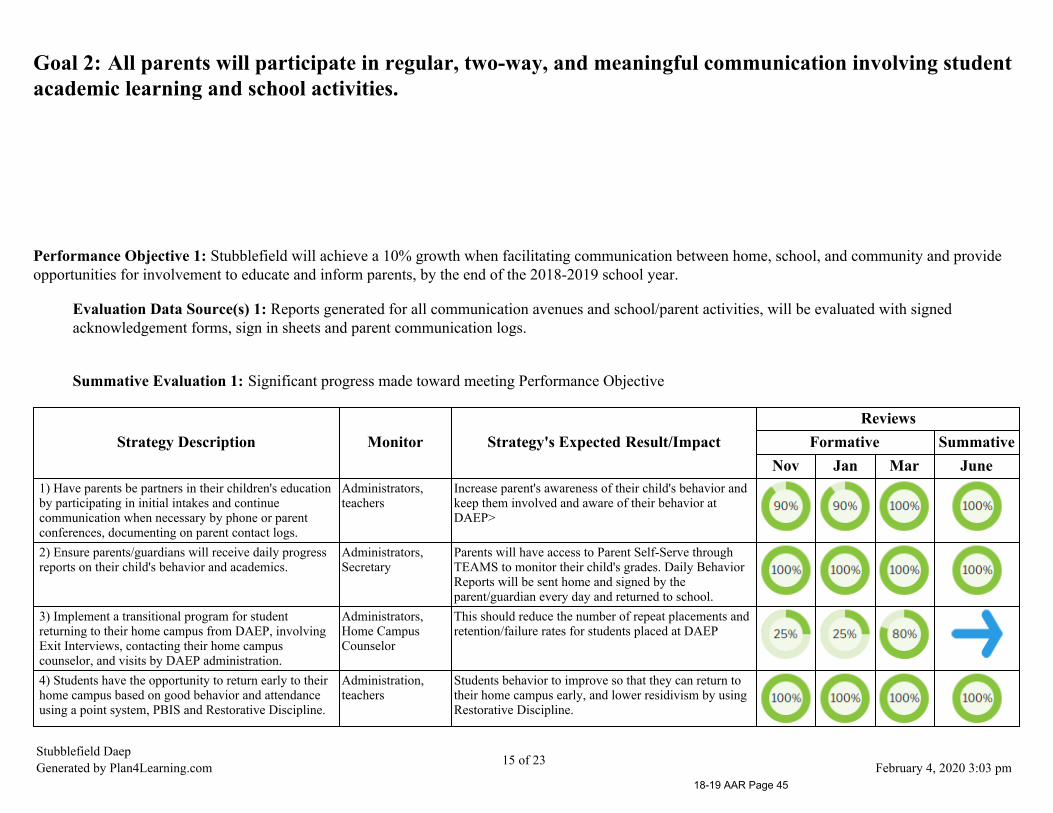
Goal 2: All parents will participate in regular, two-way, and meaningful communication involving studentacademic learning and school activities.
Performance Objective 1: Stubblefield will achieve a 10% growth when facilitating communication between home, school, and community and provideopportunities for involvement to educate and inform parents, by the end of the 2018-2019 school year.
Evaluation Data Source(s) 1: Reports generated for all communication avenues and school/parent activities, will be evaluated with signedacknowledgement forms, sign in sheets and parent communication logs.
Summative Evaluation 1: Significant progress made toward meeting Performance Objective
Strategy Description Monitor Strategy's Expected Result/ImpactReviews
Formative SummativeNov Jan Mar June
1) Have parents be partners in their children's educationby participating in initial intakes and continuecommunication when necessary by phone or parentconferences, documenting on parent contact logs.
Administrators,teachers
Increase parent's awareness of their child's behavior andkeep them involved and aware of their behavior atDAEP>
2) Ensure parents/guardians will receive daily progressreports on their child's behavior and academics.
Administrators,Secretary
Parents will have access to Parent Self-Serve throughTEAMS to monitor their child's grades. Daily BehaviorReports will be sent home and signed by theparent/guardian every day and returned to school.
3) Implement a transitional program for studentreturning to their home campus from DAEP, involvingExit Interviews, contacting their home campuscounselor, and visits by DAEP administration.
Administrators,Home CampusCounselor
This should reduce the number of repeat placements andretention/failure rates for students placed at DAEP
4) Students have the opportunity to return early to theirhome campus based on good behavior and attendanceusing a point system, PBIS and Restorative Discipline.
Administration,teachers
Students behavior to improve so that they can return totheir home campus early, and lower residivism by usingRestorative Discipline.
Stubblefield DaepGenerated by Plan4Learning.com 15 of 23 February 4, 2020 3:03 pm
18-19 AAR Page 45

Strategy Description Monitor Strategy's Expected Result/ImpactReviews
Formative SummativeNov Jan Mar June
5) Students' name will be put in a drawing forcoupons/incentives if they return their Daily PointSheet, signed and with a perfect day the followingschool day.
Administrators andSecretary
Students to be cognizent of their daily behavior andstrive for a perfect behavior day.
= Accomplished = Continue/Modify = No Progress = Discontinue
Stubblefield DaepGenerated by Plan4Learning.com 16 of 23 February 4, 2020 3:03 pm
18-19 AAR Page 46
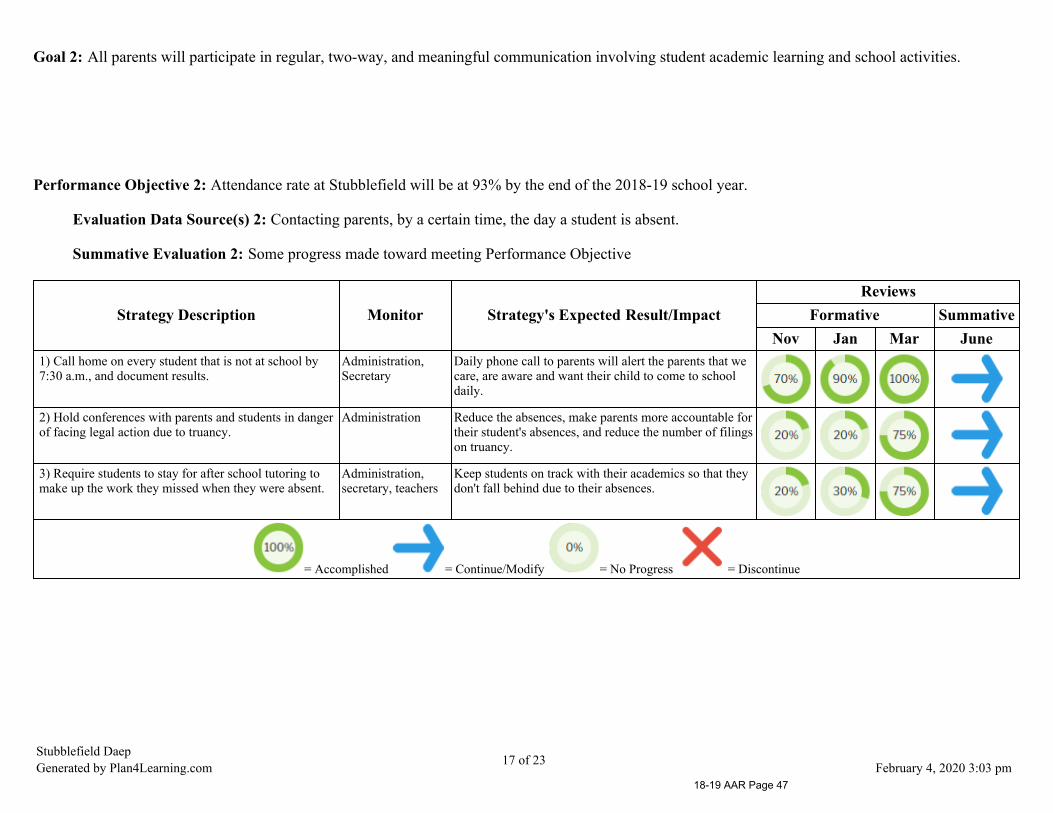
Goal 2: All parents will participate in regular, two-way, and meaningful communication involving student academic learning and school activities.
Performance Objective 2: Attendance rate at Stubblefield will be at 93% by the end of the 2018-19 school year.
Evaluation Data Source(s) 2: Contacting parents, by a certain time, the day a student is absent.
Summative Evaluation 2: Some progress made toward meeting Performance Objective
Strategy Description Monitor Strategy's Expected Result/ImpactReviews
Formative SummativeNov Jan Mar June
1) Call home on every student that is not at school by7:30 a.m., and document results.
Administration,Secretary
Daily phone call to parents will alert the parents that wecare, are aware and want their child to come to schooldaily.
2) Hold conferences with parents and students in dangerof facing legal action due to truancy.
Administration Reduce the absences, make parents more accountable fortheir student's absences, and reduce the number of filingson truancy.
3) Require students to stay for after school tutoring tomake up the work they missed when they were absent.
Administration,secretary, teachers
Keep students on track with their academics so that theydon't fall behind due to their absences.
= Accomplished = Continue/Modify = No Progress = Discontinue
Stubblefield DaepGenerated by Plan4Learning.com 17 of 23 February 4, 2020 3:03 pm
18-19 AAR Page 47
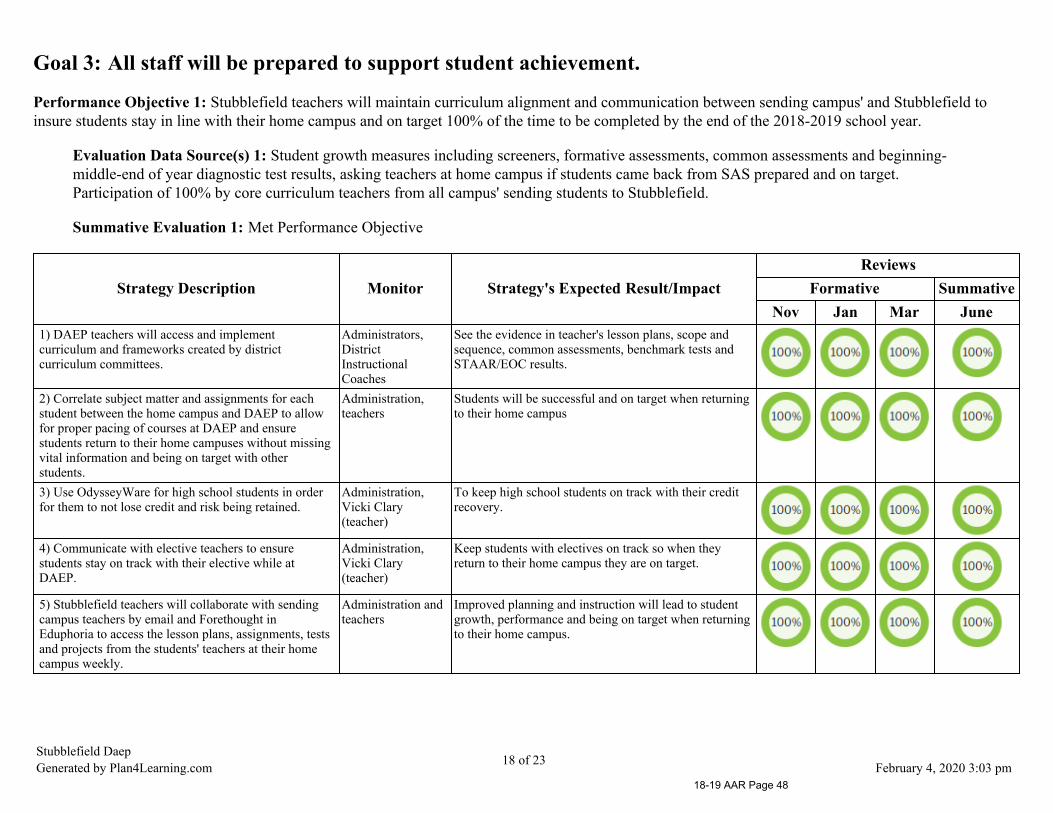
Goal 3: All staff will be prepared to support student achievement.
Performance Objective 1: Stubblefield teachers will maintain curriculum alignment and communication between sending campus' and Stubblefield toinsure students stay in line with their home campus and on target 100% of the time to be completed by the end of the 2018-2019 school year.
Evaluation Data Source(s) 1: Student growth measures including screeners, formative assessments, common assessments and beginning-middle-end of year diagnostic test results, asking teachers at home campus if students came back from SAS prepared and on target.Participation of 100% by core curriculum teachers from all campus' sending students to Stubblefield.
Summative Evaluation 1: Met Performance Objective
Strategy Description Monitor Strategy's Expected Result/ImpactReviews
Formative SummativeNov Jan Mar June
1) DAEP teachers will access and implementcurriculum and frameworks created by districtcurriculum committees.
Administrators,DistrictInstructionalCoaches
See the evidence in teacher's lesson plans, scope andsequence, common assessments, benchmark tests andSTAAR/EOC results.
2) Correlate subject matter and assignments for eachstudent between the home campus and DAEP to allowfor proper pacing of courses at DAEP and ensurestudents return to their home campuses without missingvital information and being on target with otherstudents.
Administration,teachers
Students will be successful and on target when returningto their home campus
3) Use OdysseyWare for high school students in orderfor them to not lose credit and risk being retained.
Administration,Vicki Clary(teacher)
To keep high school students on track with their creditrecovery.
4) Communicate with elective teachers to ensurestudents stay on track with their elective while atDAEP.
Administration,Vicki Clary(teacher)
Keep students with electives on track so when theyreturn to their home campus they are on target.
5) Stubblefield teachers will collaborate with sendingcampus teachers by email and Forethought inEduphoria to access the lesson plans, assignments, testsand projects from the students' teachers at their homecampus weekly.
Administration andteachers
Improved planning and instruction will lead to studentgrowth, performance and being on target when returningto their home campus.
Stubblefield DaepGenerated by Plan4Learning.com 18 of 23 February 4, 2020 3:03 pm
18-19 AAR Page 48
Strategy Description Monitor Strategy's Expected Result/ImpactReviews
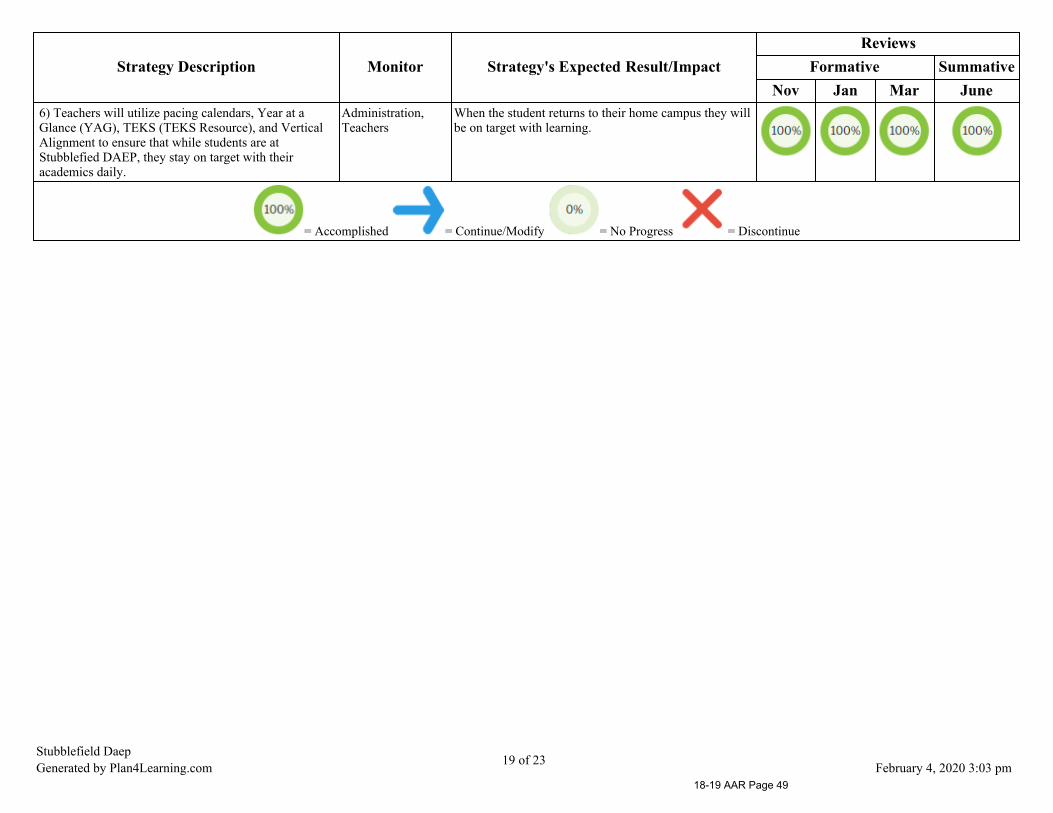
Formative SummativeNov Jan Mar June
6) Teachers will utilize pacing calendars, Year at aGlance (YAG), TEKS (TEKS Resource), and VerticalAlignment to ensure that while students are atStubblefied DAEP, they stay on target with theiracademics daily.
Administration,Teachers
When the student returns to their home campus they willbe on target with learning.
= Accomplished = Continue/Modify = No Progress = Discontinue
Stubblefield DaepGenerated by Plan4Learning.com 19 of 23 February 4, 2020 3:03 pm
18-19 AAR Page 49

Goal 4: All district funds will be utilized for programs that ensure the success of every student.
Performance Objective 1: 100% of funding decision made by the campus will be prioritized by the campus, the budgeting process supports integrity andefficient management of resources district-wide, during the 2018-2019 school year ending on May 24, 2019.
Evaluation Data Source(s) 1: Monitoring through district approval process and annual financial audit.
Summative Evaluation 1: Significant progress made toward meeting Performance Objective
Strategy Description Monitor Strategy's Expected Result/ImpactReviews
Formative SummativeNov Jan Mar June
1) All district funds will be monitored and utilizedaccording to Federal, State and Local guidelines.
Administrator Budgets will be utilized and balanced accordingly at theend of the school year.
2) Campus faculty will meet regularly to reviewcampus needs, campus plan and budget items.
Administrators,teachers, secretary
Regular attendance monitored through sign in sheets,balanced budget and purchase orders reflecting campusneeds.
= Accomplished = Continue/Modify = No Progress = Discontinue
Stubblefield DaepGenerated by Plan4Learning.com 20 of 23 February 4, 2020 3:03 pm
18-19 AAR Page 50
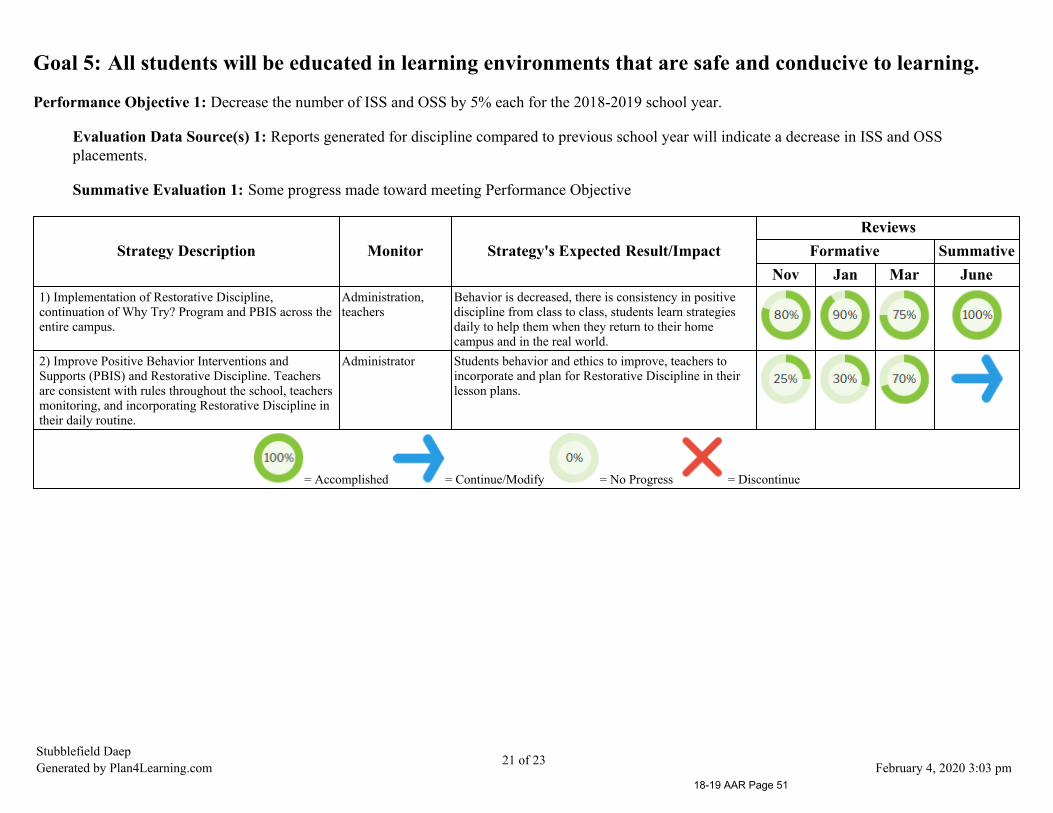
Goal 5: All students will be educated in learning environments that are safe and conducive to learning.
Performance Objective 1: Decrease the number of ISS and OSS by 5% each for the 2018-2019 school year.
Evaluation Data Source(s) 1: Reports generated for discipline compared to previous school year will indicate a decrease in ISS and OSSplacements.
Summative Evaluation 1: Some progress made toward meeting Performance Objective
Strategy Description Monitor Strategy's Expected Result/ImpactReviews
Formative SummativeNov Jan Mar June
1) Implementation of Restorative Discipline,continuation of Why Try? Program and PBIS across theentire campus.
Administration,teachers
Behavior is decreased, there is consistency in positivediscipline from class to class, students learn strategiesdaily to help them when they return to their homecampus and in the real world.
2) Improve Positive Behavior Interventions andSupports (PBIS) and Restorative Discipline. Teachersare consistent with rules throughout the school, teachersmonitoring, and incorporating Restorative Discipline intheir daily routine.
Administrator Students behavior and ethics to improve, teachers toincorporate and plan for Restorative Discipline in theirlesson plans.
= Accomplished = Continue/Modify = No Progress = Discontinue
Stubblefield DaepGenerated by Plan4Learning.com 21 of 23 February 4, 2020 3:03 pm
18-19 AAR Page 51

Goal 5: All students will be educated in learning environments that are safe and conducive to learning.
Performance Objective 2: Lower students returning to DAEP for a second visit in the same school year, 2018-2019, by 5%.
Evaluation Data Source(s) 2: Data charts and SAS Master list indicates a decrease in second visits from students.
Summative Evaluation 2: Some progress made toward meeting Performance Objective
Strategy Description Monitor Strategy's Expected Result/ImpactReviews
Formative SummativeNov Jan Mar June
1) Home campus visits from DAEP administration tomonitor student behavior before being sent to DAEP,and also monitor student behavior once a studentreturns to home campus from DAEP.
Administration To ensure students correct behavior to avoid coming toDAEP, and decrease residivism.
= Accomplished = Continue/Modify = No Progress = Discontinue
Stubblefield DaepGenerated by Plan4Learning.com 22 of 23 February 4, 2020 3:03 pm
18-19 AAR Page 52
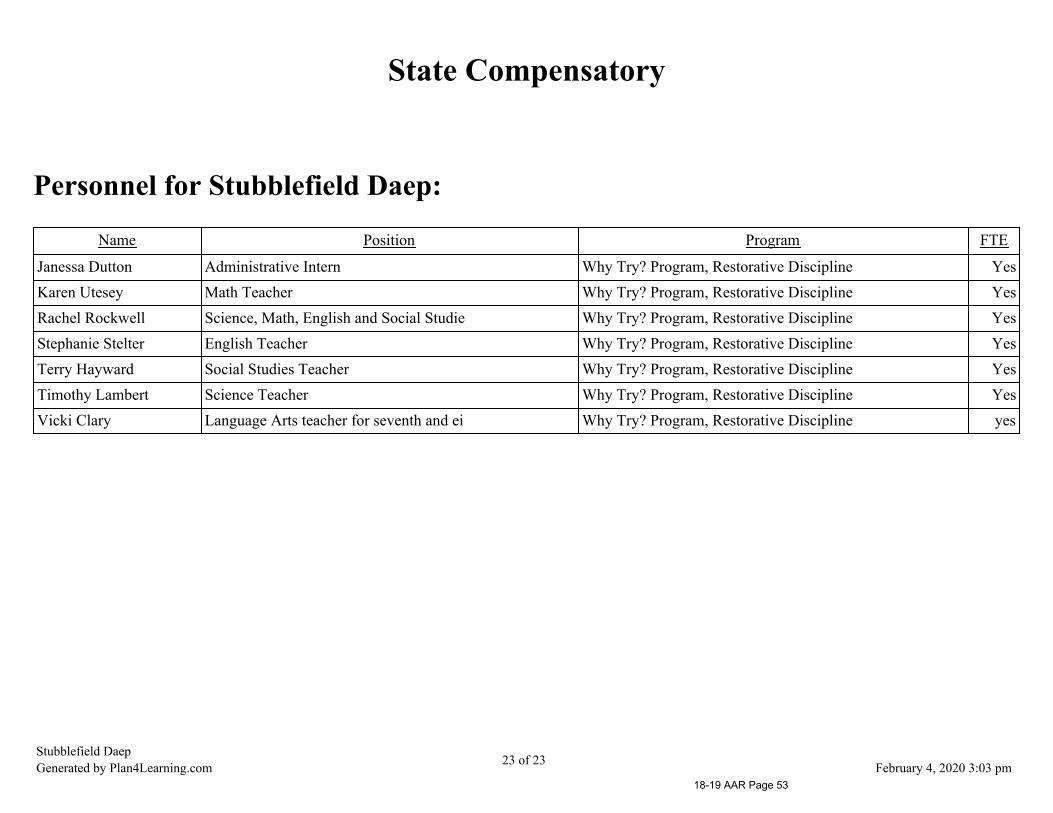
State Compensatory
Personnel for Stubblefield Daep:
Name Position Program FTE
Janessa Dutton Administrative Intern Why Try? Program, Restorative Discipline YesKaren Utesey Math Teacher Why Try? Program, Restorative Discipline YesRachel Rockwell Science, Math, English and Social Studie Why Try? Program, Restorative Discipline YesStephanie Stelter English Teacher Why Try? Program, Restorative Discipline YesTerry Hayward Social Studies Teacher Why Try? Program, Restorative Discipline YesTimothy Lambert Science Teacher Why Try? Program, Restorative Discipline YesVicki Clary Language Arts teacher for seventh and ei Why Try? Program, Restorative Discipline yes
Stubblefield DaepGenerated by Plan4Learning.com 23 of 23 February 4, 2020 3:03 pm
18-19 AAR Page 53

Willis Independent School District
Lucas Middle School
2018-2019 Accountability Rating: Met Standard
Lucas Middle SchoolGenerated by Plan4Learning.com 1 of 27 February 4, 2020 3:02 pm
18-19 AAR Page 54
Mission StatementLynn Lucas Middle School will promote a nurturing environment that fosters a passion for life-long learning and challenges our studentsto reach their highest potential. We will create an atmosphere that encourages the development of character, respect, responsibility, and
productive problem-solving citizens.
Lucas Middle SchoolGenerated by Plan4Learning.com 2 of 27 February 4, 2020 3:02 pm
18-19 AAR Page 55

Table of Contents
Comprehensive Needs Assessment 4Demographics 4Student Academic Achievement 5School Processes & Programs 7Perceptions 8
Priority Problem Statements 9Comprehensive Needs Assessment Data Documentation 10Goals 11
Goal 1: All students will reach high academic standards, at a minimum attaining proficiency or better on state assessments. 11Goal 2: All parents will participate in regular, two-way, and meaningful communication involving student academic learning and school activities. 13Goal 3: All staff will be prepared to support student achievement. 16Goal 4: All district funds will be utilized for programs that ensure the success of every student. 18Goal 5: All students will be educated in learning environments that are safe and conducive to learning. 19
Comprehensive Support Strategies 23State Compensatory 24
Budget for Lucas Middle School: 24Personnel for Lucas Middle School: 25
2018-2019 Campus Improvement Team 26District Funding Summary 27
Lucas Middle SchoolGenerated by Plan4Learning.com 3 of 27 February 4, 2020 3:02 pm
18-19 AAR Page 56

Comprehensive Needs Assessment
Demographics
Demographics Summary
The student pouplation at Lynn Lucas is broken down as follows: 46.85% of the students are white, 39.26% are Hispanic, 8.79% are African American,roughly 4% are two or more ethnicities, and the rest of the student body consists of other ethnicities. Economically Disadvantaged students make upapproximately 72.89% of the student population, which has been the average for the past 3 years. Our Limited English Proficiency students make up13.88% of the population. These numbers have stayed fairly consistent over the past 5 years.
School culture and climate continues to be healthy. With the consistency with administration and small turn over with teachers plus the continued progressof the campus PBIS system, we continue to see a positive and collaborative school climate. As a school, we aspire to facilitate a healthy environment wherewe inspire learning.
59% of the staff at Lynn Lucas has been teaching for 5 years or more, with 35% of the staff having more than 10 years experience. Over the last three yearsturnover rate has continued to decrease.
Involving all stakeholders in the educational process is vitally important to positive, profound learning experiences for young adults. An integral andirreplaceable component of this, is the role that family and community involvement plays and the deep impact they have on learning outcomes. Asynergistic effect creates more highly engaged parents and community partners that are invested in the rigor and depth of the learning that their childrenexperiences. An environment that is conducive to life-long learning hinges upon the importance that these key players and role models place on educationwhile talking to their children. The faculty is acutely aware of these fundamental facts and works continually to build deep relationships with parentsthrough phone and email contact, as well as face-to-face formal and informal meetings. Parents attend certain functions at the campus level, such asorganizational or sporting events that their child is involved with. However, increasing the home/school connection through academics helps the students tosee the interconnected nature of education and real-life experiences. As such, increasing parent involvement and interface with curricular activities isimperative.
Lucas Middle SchoolGenerated by Plan4Learning.com 4 of 27 February 4, 2020 3:02 pm
18-19 AAR Page 57
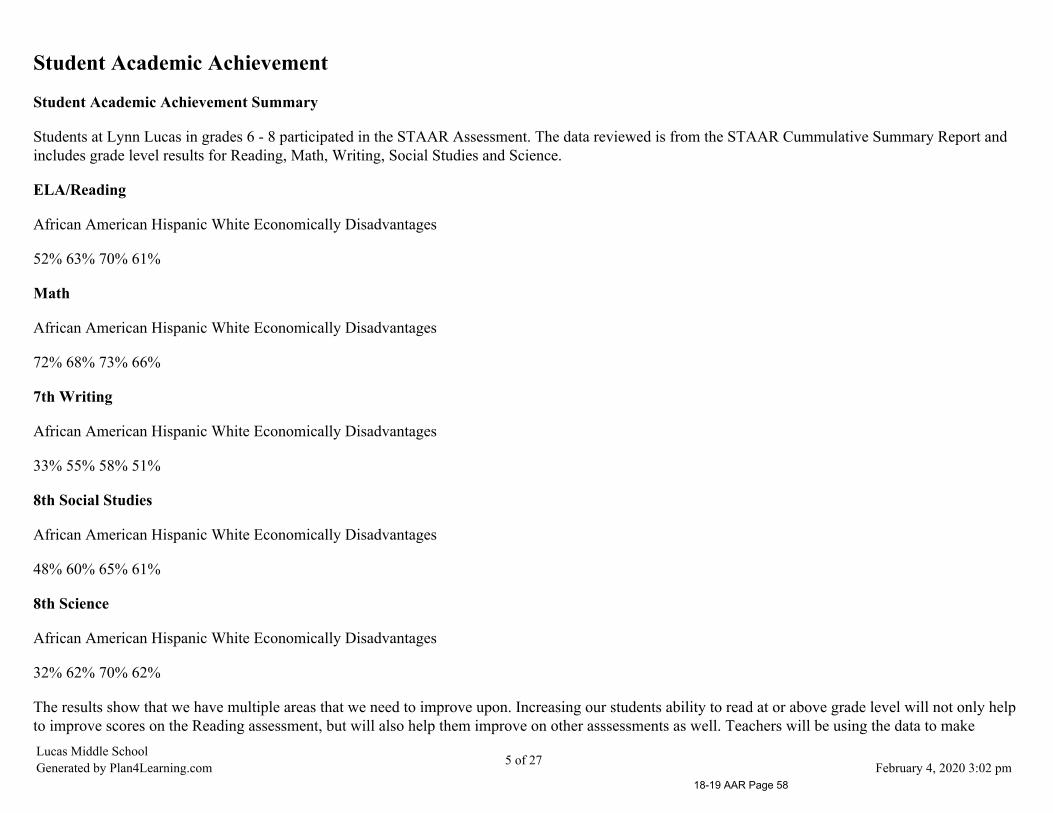
Student Academic Achievement
Student Academic Achievement Summary
Students at Lynn Lucas in grades 6 - 8 participated in the STAAR Assessment. The data reviewed is from the STAAR Cummulative Summary Report andincludes grade level results for Reading, Math, Writing, Social Studies and Science.
ELA/Reading
African American Hispanic White Economically Disadvantages
52% 63% 70% 61%
Math
African American Hispanic White Economically Disadvantages
72% 68% 73% 66%
7th Writing
African American Hispanic White Economically Disadvantages
33% 55% 58% 51%
8th Social Studies
African American Hispanic White Economically Disadvantages
48% 60% 65% 61%
8th Science
African American Hispanic White Economically Disadvantages
32% 62% 70% 62%
The results show that we have multiple areas that we need to improve upon. Increasing our students ability to read at or above grade level will not only helpto improve scores on the Reading assessment, but will also help them improve on other asssessments as well. Teachers will be using the data to makeLucas Middle SchoolGenerated by Plan4Learning.com 5 of 27 February 4, 2020 3:02 pm
18-19 AAR Page 58
informed decisions in their own classrooms, to drive instuction.
Student Academic Achievement Strengths
The campus has continued to increase those achievement results for a second year in a row. Every area and sub population continues to increase.
Problem Statements Identifying Student Academic Achievement Needs
Problem Statement 1: We are needing to improve our progress on progress measure for students Root Cause: Teachers need to focus instruction ondifferentiation based on individual student needs.
Lucas Middle SchoolGenerated by Plan4Learning.com 6 of 27 February 4, 2020 3:02 pm
18-19 AAR Page 59
School Processes & Programs
School Processes & Programs Summary
The campus has continued to put a heavy focus on planning and research based instructional practices. This includes PLCs where teachers plan and worktogether on the 4 key questions of PLC schools. Teachers make common assessments and work on their Essential Standard assessments together. Teachersdecide what interventions and how they will be implemented during this PLC time.
This year the campus is focusing on an intervention time built into the school day, called PRIDE Time for teachers to work with students at their level. TheNWEA MAPS data as well as the Odysseyware program is working to assist teachers with where students are and how they can assist them.
Lucas Middle SchoolGenerated by Plan4Learning.com 7 of 27 February 4, 2020 3:02 pm
18-19 AAR Page 60
Perceptions
Perceptions Summary
Our campus has spent the last two years getting rid of the label of IR and working to prove to the community, parents, students and staff that we are a goodschool capable of doing great things for students.
We are proud that we have continued to hear throughout our community that people believe our school puts students and families first.
Lucas Middle SchoolGenerated by Plan4Learning.com 8 of 27 February 4, 2020 3:02 pm
18-19 AAR Page 61
Priority Problem Statements
Lucas Middle SchoolGenerated by Plan4Learning.com 9 of 27 February 4, 2020 3:02 pm
18-19 AAR Page 62

Comprehensive Needs Assessment Data DocumentationThe following data were used to verify the comprehensive needs assessment analysis:
Improvement Planning Data
District goalsCampus goalsCurrent and/or prior year(s) campus and/or district improvement plansCampus and/or district planning and decision making committee(s) meeting data
Accountability Data
Texas Academic Performance Report (TAPR) dataDomain 1 - Student AchievementDomain 2 - Student ProgressDomain 3 - Closing the GapsFederal Report Card Data
Student Data: Assessments
State and federally required assessment information (e.g. curriculum, eligibility, format, standards, accommodations, TEA information)
Lucas Middle SchoolGenerated by Plan4Learning.com 10 of 27 February 4, 2020 3:02 pm
18-19 AAR Page 63
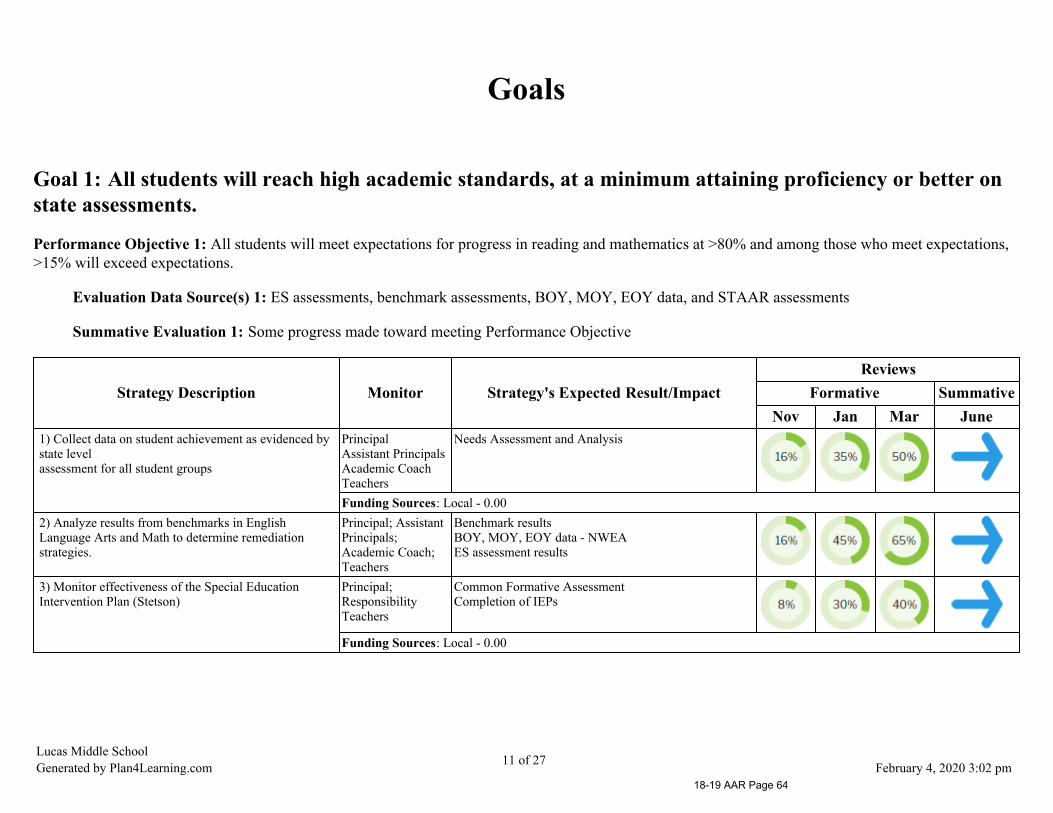
Goals
Goal 1: All students will reach high academic standards, at a minimum attaining proficiency or better onstate assessments.
Performance Objective 1: All students will meet expectations for progress in reading and mathematics at >80% and among those who meet expectations,>15% will exceed expectations.
Evaluation Data Source(s) 1: ES assessments, benchmark assessments, BOY, MOY, EOY data, and STAAR assessments
Summative Evaluation 1: Some progress made toward meeting Performance Objective
Strategy Description Monitor Strategy's Expected Result/ImpactReviews
Formative SummativeNov Jan Mar June
1) Collect data on student achievement as evidenced bystate levelassessment for all student groups
PrincipalAssistant PrincipalsAcademic CoachTeachers
Needs Assessment and Analysis
Funding Sources: Local - 0.002) Analyze results from benchmarks in EnglishLanguage Arts and Math to determine remediationstrategies.
Principal; AssistantPrincipals;Academic Coach;Teachers
Benchmark results BOY, MOY, EOY data - NWEAES assessment results
3) Monitor effectiveness of the Special EducationIntervention Plan (Stetson)
Principal;ResponsibilityTeachers
Common Formative Assessment Completion of IEPs
Funding Sources: Local - 0.00
Lucas Middle SchoolGenerated by Plan4Learning.com 11 of 27 February 4, 2020 3:02 pm
18-19 AAR Page 64

Strategy Description Monitor Strategy's Expected Result/ImpactReviews
Formative SummativeNov Jan Mar June
4) Implement and monitor effective response toIntervention (RtI) model for the academic andbehavioral needs of all student populations.
CampusAdministration;Counselors;Academic Coaches;BehavioralSpecialist;Teachers
RTI modelRTI ProceduresRTI Documentation
Funding Sources: Local - 0.005) Incorporate STAAR format questions on all commonassessments in target areas as identified by benchmarkanalysis
PrincipalAssistant PrincipalsDistrict academiccoachesContent Teachers
Common assessment review
6) Utilize Comprehension Toolkit and WritersWorkshop programs to increase reading and writingstudent performance in grades 6, 7, and 8
ELAR teachers,Academic coaches,Administrative team
CFA results, benchmark test, STAAR results
7) Use PRIDE time intervention period and any othertutoring to help students needing assistance in all levelsof intervention including enrichment.
Teachers, InstructionalCoaches, Administration
Reduced failure rates across grade levels, increase
8) Increase academic rigor and develop systems toensure the planning and design of instructionalexperiences for students are conducive to highacademic performance.
Principal, Assistantprincipals,Instructionalcoaches, technologycoach, GT specialist
Improved scores in CFAs, benchmarks, and STAAR testresults
= Accomplished = Continue/Modify = No Progress = Discontinue
Lucas Middle SchoolGenerated by Plan4Learning.com 12 of 27 February 4, 2020 3:02 pm
18-19 AAR Page 65

Goal 2: All parents will participate in regular, two-way, and meaningful communication involving studentacademic learning and school activities.
Performance Objective 1: Increase parental participation in campus activities by 10% through 6th grade orientation, Open House, and extra curricularactivities.
Evaluation Data Source(s) 1: Conduct campus wide opportunities for parent and community involvement to promote academic achievementand school spirit
Summative Evaluation 1: Significant progress made toward meeting Performance Objective
Strategy Description Monitor Strategy's Expected Result/ImpactReviews
Formative SummativeNov Jan Mar June
1) Establish a variety of ways to celebrate students,staff, and volunteer accomplishments and establishcriteria for recognition.
PrincipalLeadership TeamPositive BehaviorSupport Committee
Increased participation of all stakeholders
2) Continue campus-based community mentoringprograms such as RISE Mentoring
PrincipalRISE Mentor
Mentors attending lunch and other mentoring sessionswith students, mentors attending specialty functions atschool with student and family, decreased behavioralincidents with mentored students, increased academicengagement of mentored students
3) Design and implement opportunities to celebrateschool spirit and unity such as campus Pep Rallies,Lunch time affirmations, positive announcements, andother suggestions from the Positive Behavior SupportCommittee.
PrincipalAssistant PrincipalsCommittee ChairCommitteeMembers
Completion of designed activities
= Accomplished = Continue/Modify = No Progress = Discontinue
Lucas Middle SchoolGenerated by Plan4Learning.com 13 of 27 February 4, 2020 3:02 pm
18-19 AAR Page 66

Goal 2: All parents will participate in regular, two-way, and meaningful communication involving student academic learning and school activities.
Performance Objective 2: Increase parent volunteer participation by 5% by doing extra curricular events, PRIDE store volunteers and creating a parentvolunteer organization.
Evaluation Data Source(s) 2: Design and implement opportunities for parents to participate in campus volunteer opportunities that are insideand outside of the normal school day to accommodate family schedules while including parents in campus growth activities.
Summative Evaluation 2: Significant progress made toward meeting Performance Objective
Strategy Description Monitor Strategy's Expected Result/ImpactReviews
Formative SummativeNov Jan Mar June
1) Create and implement unique parent surveys togather feedback on how parents perceive opportunitiesto participate in campus activities.
PrincipalAssistant PrincipalsCommittee chairCommitteeTechnologyApplicationsTeachers
Completion, distribution, and return of parent surveys togather data about parent perceptions to create growthopportunities of campus activities, Inclusion of the datain SMART goals
2) Create a system of sign-in sheets to track parentinvolvement, along with system of placing these intothe Parent Community Involvement Committee Binderfor analysis at monthly meetings.
PrincipalCommittee ChairCommitteeMembersFront Office Staff
Completion, distribution, and tracking of parent sign-insheets by committee via the Committee Binder system
3) Increase the utilization of teacher webpages and theuse of tools such as Google Classroom to communicatewith students and parents.
PrincipalAssistant PrincipalsCampus WebmasterDepartment ChairsTeachers
Weekly teacher webpage reviews by CampusWebmaster, tracking of use of classroom communicationtools at PLC with Dept. Chair, collaboration with Dept.members on use of new communication tools in theclassroom
= Accomplished = Continue/Modify = No Progress = Discontinue
Lucas Middle SchoolGenerated by Plan4Learning.com 14 of 27 February 4, 2020 3:02 pm
18-19 AAR Page 67

Goal 2: All parents will participate in regular, two-way, and meaningful communication involving student academic learning and school activities.
Performance Objective 3: Call Logs are submitted monthly and Eduphoria reports will be run each semester to increase school communication withparents by 5%.
Evaluation Data Source(s) 3: Monthly positive contact logs, remind system, call out system, website and Eduphoria teacher logs for studentacademic and behavior concerns.
Summative Evaluation 3: Significant progress made toward meeting Performance Objective
Lucas Middle SchoolGenerated by Plan4Learning.com 15 of 27 February 4, 2020 3:02 pm
18-19 AAR Page 68
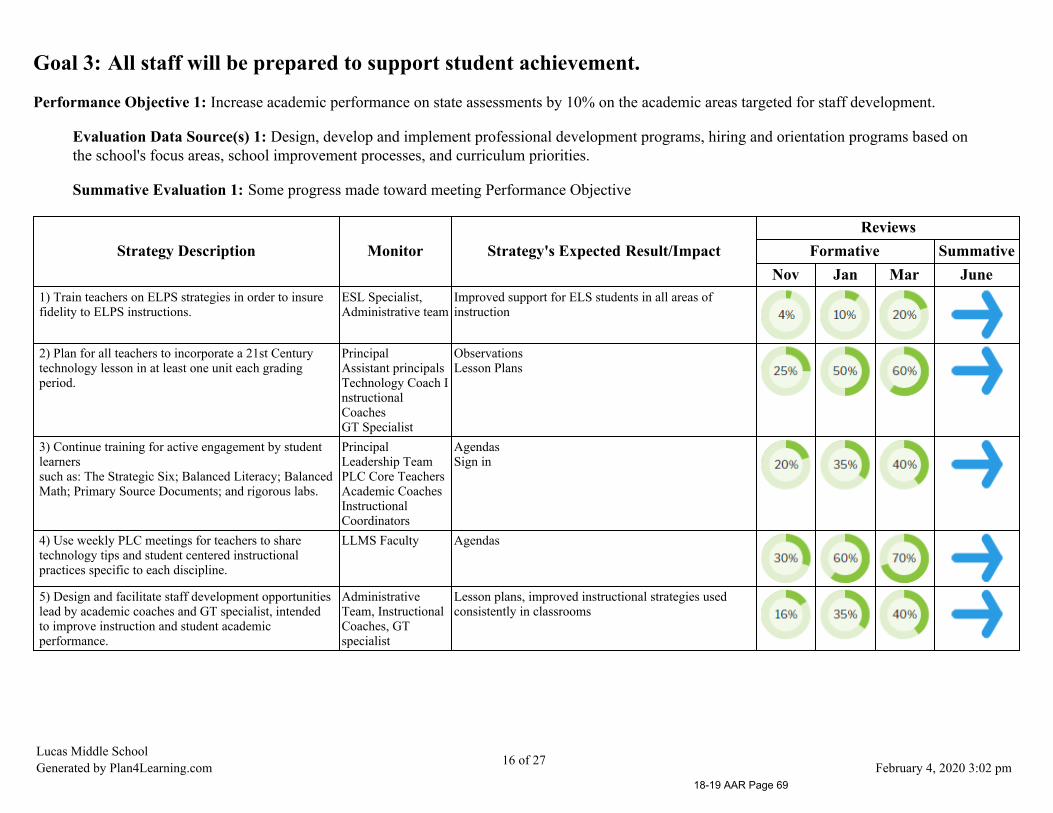
Goal 3: All staff will be prepared to support student achievement.
Performance Objective 1: Increase academic performance on state assessments by 10% on the academic areas targeted for staff development.
Evaluation Data Source(s) 1: Design, develop and implement professional development programs, hiring and orientation programs based onthe school's focus areas, school improvement processes, and curriculum priorities.
Summative Evaluation 1: Some progress made toward meeting Performance Objective
Strategy Description Monitor Strategy's Expected Result/ImpactReviews
Formative SummativeNov Jan Mar June
1) Train teachers on ELPS strategies in order to insurefidelity to ELPS instructions.
ESL Specialist,Administrative team
Improved support for ELS students in all areas ofinstruction
2) Plan for all teachers to incorporate a 21st Centurytechnology lesson in at least one unit each gradingperiod.
PrincipalAssistant principals Technology Coach InstructionalCoaches GT Specialist
Observations Lesson Plans
3) Continue training for active engagement by studentlearnerssuch as: The Strategic Six; Balanced Literacy; BalancedMath; Primary Source Documents; and rigorous labs.
PrincipalLeadership TeamPLC Core TeachersAcademic CoachesInstructionalCoordinators
AgendasSign in
4) Use weekly PLC meetings for teachers to sharetechnology tips and student centered instructionalpractices specific to each discipline.
LLMS Faculty Agendas
5) Design and facilitate staff development opportunitieslead by academic coaches and GT specialist, intendedto improve instruction and student academicperformance.
AdministrativeTeam, InstructionalCoaches, GTspecialist
Lesson plans, improved instructional strategies usedconsistently in classrooms
Lucas Middle SchoolGenerated by Plan4Learning.com 16 of 27 February 4, 2020 3:02 pm
18-19 AAR Page 69
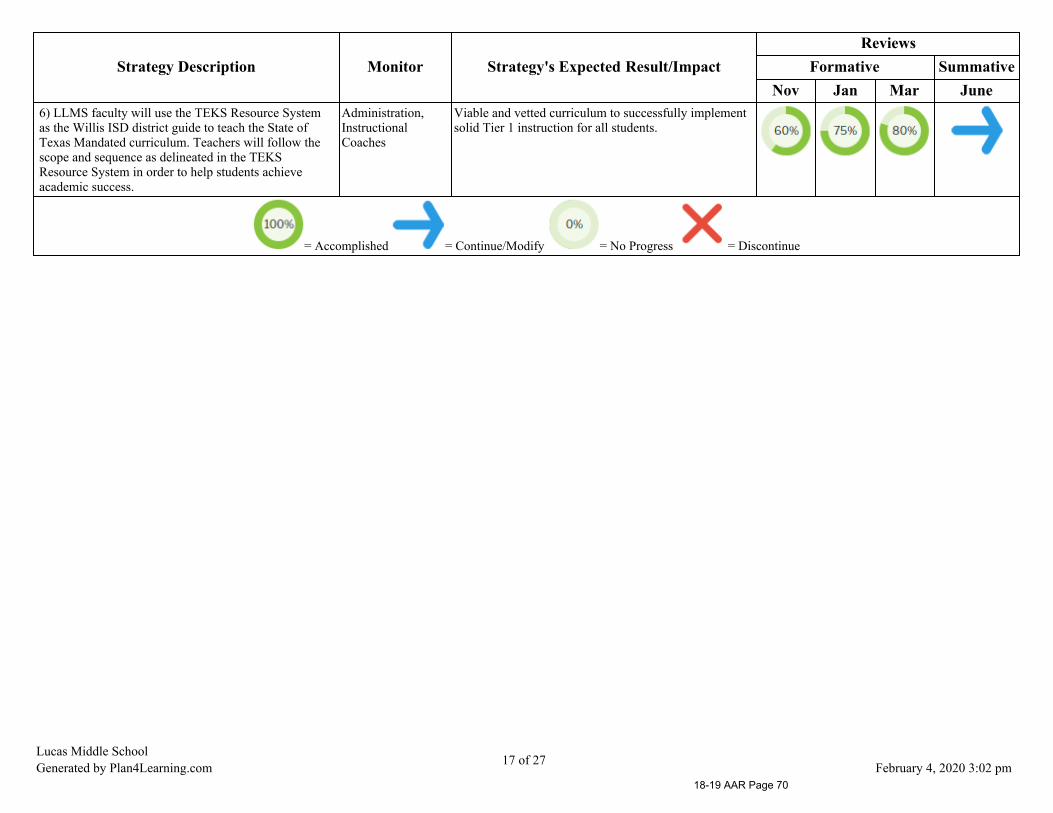
Strategy Description Monitor Strategy's Expected Result/ImpactReviews
Formative SummativeNov Jan Mar June
6) LLMS faculty will use the TEKS Resource Systemas the Willis ISD district guide to teach the State ofTexas Mandated curriculum. Teachers will follow thescope and sequence as delineated in the TEKSResource System in order to help students achieveacademic success.
Administration,InstructionalCoaches
Viable and vetted curriculum to successfully implementsolid Tier 1 instruction for all students.
= Accomplished = Continue/Modify = No Progress = Discontinue
Lucas Middle SchoolGenerated by Plan4Learning.com 17 of 27 February 4, 2020 3:02 pm
18-19 AAR Page 70

Goal 4: All district funds will be utilized for programs that ensure the success of every student.
Performance Objective 1: 100% of campus funds will be allocated to improve all campus programs.
Evaluation Data Source(s) 1: All campus funds will be utilized for programs that ensure the success of every student.
Summative Evaluation 1: Met Performance Objective
Strategy Description Monitor Strategy's Expected Result/ImpactReviews
Formative SummativeNov Jan Mar June
1) Review expenditures and make recommendations forfuture planning.
PrincipalsAssistant PrincipalsCampusImprovementCommittee
Campus financial records
= Accomplished = Continue/Modify = No Progress = Discontinue
Lucas Middle SchoolGenerated by Plan4Learning.com 18 of 27 February 4, 2020 3:02 pm
18-19 AAR Page 71

Goal 5: All students will be educated in learning environments that are safe and conducive to learning.
Performance Objective 1: Lower the number of discipline referrals by 5% from previous year.
Evaluation Data Source(s) 1: Trend data charts will reflect a decline of discipline incidents by all student groups.
Summative Evaluation 1: Significant progress made toward meeting Performance Objective
Strategy Description Monitor Strategy's Expected Result/ImpactReviews
Formative SummativeNov Jan Mar June
1) Improve overall classroom management byreviewing and discussing behavior interventionstrategies during PLCs and assigning mentors tostruggling teachers.
PrincipalAssistant Principals
Reduction of discipline referrals
Funding Sources: Local - 0.002) Develop procedures to follow when dealing withdiscipline issues before students are referred to theoffice.
Building Principal,Assistant PrincipalsSRO
Plans developed and implemented
3) Continue implementation of the CHAMPSdiscipline management system as the campus standard.
PrincipalAssistant PrincipalsCounselorsDept ChairsDiscipline Committee
Documentation of attempted interventions prior toreferral to office, discussion of CHAMPS strategies andimplementation at PLC's, Decrease in overall minorreferrals for specified behaviors
4) Continue implementation stage 2 of PBIS andPRIDE system to celebrate and affirm desiredbehaviors
PrincipalAssistant PrincipalCommittee ChairCommittee MembersCounselors
Reduce discipline incidents by 5% during the schoolyear
5) Review persistent behavior concerns withRtI/ARD/504 Committee to devise more effectivemanagement plans for targeted students
PrincipalAssistant PrincipalsCounselorsDiagnostician/LSSPRtI Coordinator
Increased response to intervention strategies by targetedstudents via behavioral tracking charts, disciplinereview, journaling from teachers
= Accomplished = Continue/Modify = No Progress = Discontinue
Lucas Middle SchoolGenerated by Plan4Learning.com 19 of 27 February 4, 2020 3:02 pm
18-19 AAR Page 72

Goal 5: All students will be educated in learning environments that are safe and conducive to learning.
Performance Objective 2: Lower the number assignments to OSS, ISS and DAEP by 5% each.
Evaluation Data Source(s) 2: Trend data charts of student placement in OSS, ISS and DAEP indicates a decrease in total placements.
Summative Evaluation 2: Significant progress made toward meeting Performance Objective
Strategy Description Monitor Strategy's Expected Result/ImpactReviews
Formative SummativeNov Jan Mar June
1) Review persistent behavior concerns withRtI/ARD/504 Committee to devise more effectivemanagement plans for targeted students
Principal AssistantPrincipals CounselorsDiagnostician/LSSPRtI Coordinator
Increased response to intervention strategies by targetedstudents via behavioral tracking charts, disciplinereview, journaling from teachers
2) Increase parental involvement of targeted studentsthrough parent contact, parent meetings, parent-studentbehavior contracts, and counseling sessions
PrincipalAssistant PrincipalsCounselors
Decrease in serious incidents requiring potentialremoval
= Accomplished = Continue/Modify = No Progress = Discontinue
Lucas Middle SchoolGenerated by Plan4Learning.com 20 of 27 February 4, 2020 3:02 pm
18-19 AAR Page 73

Goal 5: All students will be educated in learning environments that are safe and conducive to learning.
Performance Objective 3: 100% of students and teachers attend safety awareness training as evidenced by sign-in sheets and training certificates.
Evaluation Data Source(s) 3: Create and promote school safety awareness for students and staff to know what to do in times of crisis.
Summative Evaluation 3: Met Performance Objective
Strategy Description Monitor Strategy's Expected Result/ImpactReviews
Formative SummativeNov Jan Mar June
1) Maintain the district required number of school staffwho are CPI trained
PrincipalCPI trainers
Evaluate number of training opportunities and availabletimes for staff members to complete CPI training,increase opportunities by exploring training options
2) Create behavioral monitoring and tracking systemsfor progress monitoring and implementation ofeffective crisis intervention plans.
PrincipalAssistant PrincipalsCounselorsLSSP/Diagnostician
Implementation of tracking systems that create data tobe used to determine readiness for crisis responsiveness.
3) Create Emergency Operations Planning Team thatresponds to crisis situations and are trained to handlespecified crises.
PrincipalAssistant PrincipalsSafety Coordinator
Design of membership and training of EOPT members
4) Continue to implement school health screeningsthrough the nurses office per local, state, and federalmandates, protocols and guidelines.
PrincipalSafety CoordinatorCampus NurseDistrict Nurse
Record of all required screenings, health checks, anddocumentation
= Accomplished = Continue/Modify = No Progress = Discontinue
Lucas Middle SchoolGenerated by Plan4Learning.com 21 of 27 February 4, 2020 3:02 pm
18-19 AAR Page 74

Goal 5: All students will be educated in learning environments that are safe and conducive to learning.
Performance Objective 4: Reduce the number of bullying incidents by 5%
Evaluation Data Source(s) 4: Policies and practices in addressing bullying are aligned across the system.
Summative Evaluation 4: Significant progress made toward meeting Performance Objective
Strategy Description Monitor Strategy's Expected Result/ImpactReviews
Formative SummativeNov Jan Mar June
1) Continue to implement district policy for definingbullying and the protocol through consistentImplementation of this policy including reporting andconsequences to address and reduce incidents ofbullying.
PrincipalAssistant PrincipalsCounselors
Reduction in incidents
Funding Sources: Local - 0.002) Conduct ongoing training for all stakeholders -students, staffand parents in recognizing bullying, reportingrequirements and appreciated interventions.
PrincipalAssistant PrincipalsCounselors
All stakeholders trained
Funding Sources: Local - 0.003) Heighten awareness of the CyberBully Hotline ascounselors conduct awareness training with students
PrincipalAssistant PrincipalsConselors
Monitor trend data for effectiveness of CBH use
= Accomplished = Continue/Modify = No Progress = Discontinue
Lucas Middle SchoolGenerated by Plan4Learning.com 22 of 27 February 4, 2020 3:02 pm
18-19 AAR Page 75

Comprehensive Support Strategies
Goal Objective Strategy Description
1 1 6 Utilize Comprehension Toolkit and Writers Workshop programs to increase reading and writing student performance in grades6, 7, and 8
3 1 5 Design and facilitate staff development opportunities lead by academic coaches and GT specialist, intended to improveinstruction and student academic performance.
Lucas Middle SchoolGenerated by Plan4Learning.com 23 of 27 February 4, 2020 3:02 pm
18-19 AAR Page 76
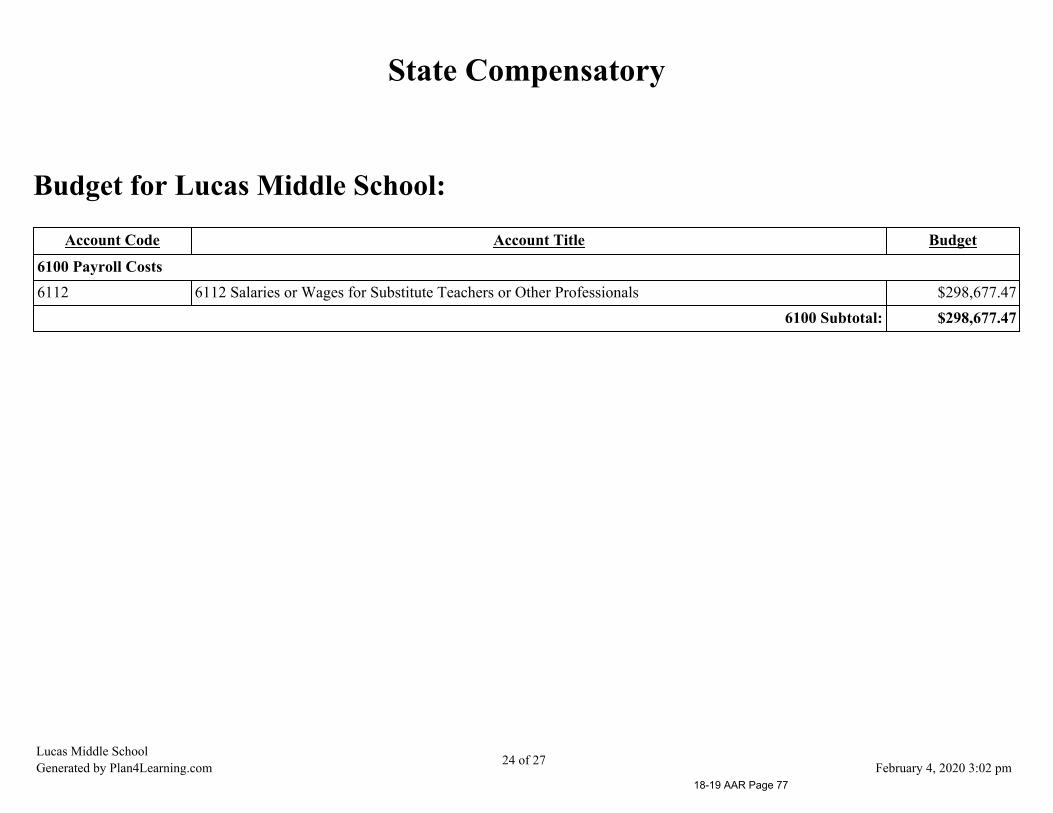
State Compensatory
Budget for Lucas Middle School:
Account Code Account Title Budget
6100 Payroll Costs6112 6112 Salaries or Wages for Substitute Teachers or Other Professionals $298,677.47
6100 Subtotal: $298,677.47
Lucas Middle SchoolGenerated by Plan4Learning.com 24 of 27 February 4, 2020 3:02 pm
18-19 AAR Page 77
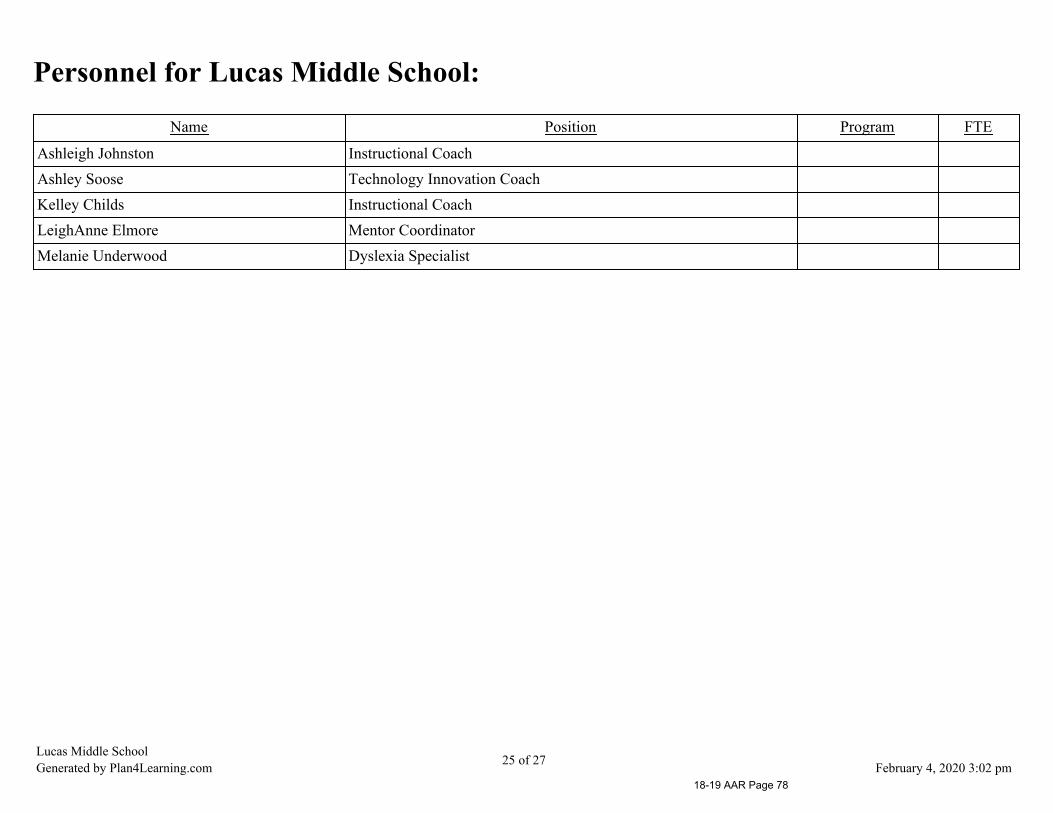
Personnel for Lucas Middle School:
Name Position Program FTE
Ashleigh Johnston Instructional CoachAshley Soose Technology Innovation CoachKelley Childs Instructional CoachLeighAnne Elmore Mentor CoordinatorMelanie Underwood Dyslexia Specialist
Lucas Middle SchoolGenerated by Plan4Learning.com 25 of 27 February 4, 2020 3:02 pm
18-19 AAR Page 78
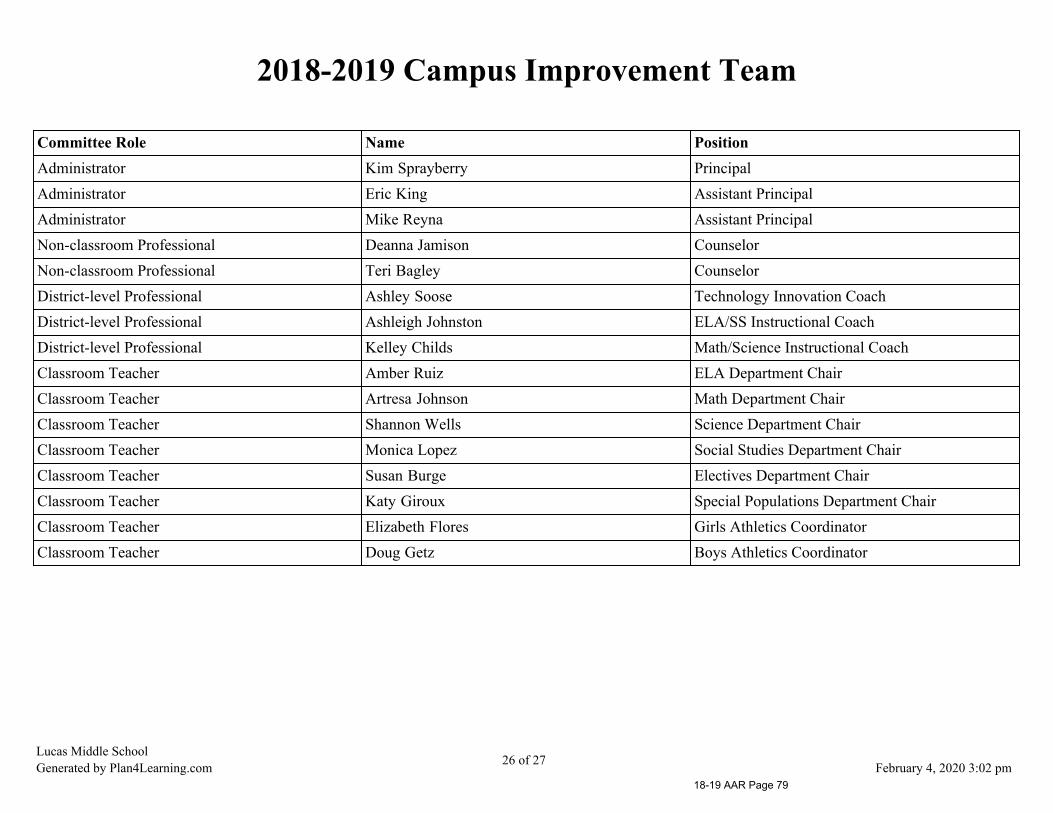
2018-2019 Campus Improvement Team
Committee Role Name PositionAdministrator Kim Sprayberry PrincipalAdministrator Eric King Assistant PrincipalAdministrator Mike Reyna Assistant PrincipalNon-classroom Professional Deanna Jamison CounselorNon-classroom Professional Teri Bagley CounselorDistrict-level Professional Ashley Soose Technology Innovation CoachDistrict-level Professional Ashleigh Johnston ELA/SS Instructional CoachDistrict-level Professional Kelley Childs Math/Science Instructional CoachClassroom Teacher Amber Ruiz ELA Department ChairClassroom Teacher Artresa Johnson Math Department ChairClassroom Teacher Shannon Wells Science Department ChairClassroom Teacher Monica Lopez Social Studies Department ChairClassroom Teacher Susan Burge Electives Department ChairClassroom Teacher Katy Giroux Special Populations Department ChairClassroom Teacher Elizabeth Flores Girls Athletics CoordinatorClassroom Teacher Doug Getz Boys Athletics Coordinator
Lucas Middle SchoolGenerated by Plan4Learning.com 26 of 27 February 4, 2020 3:02 pm
18-19 AAR Page 79
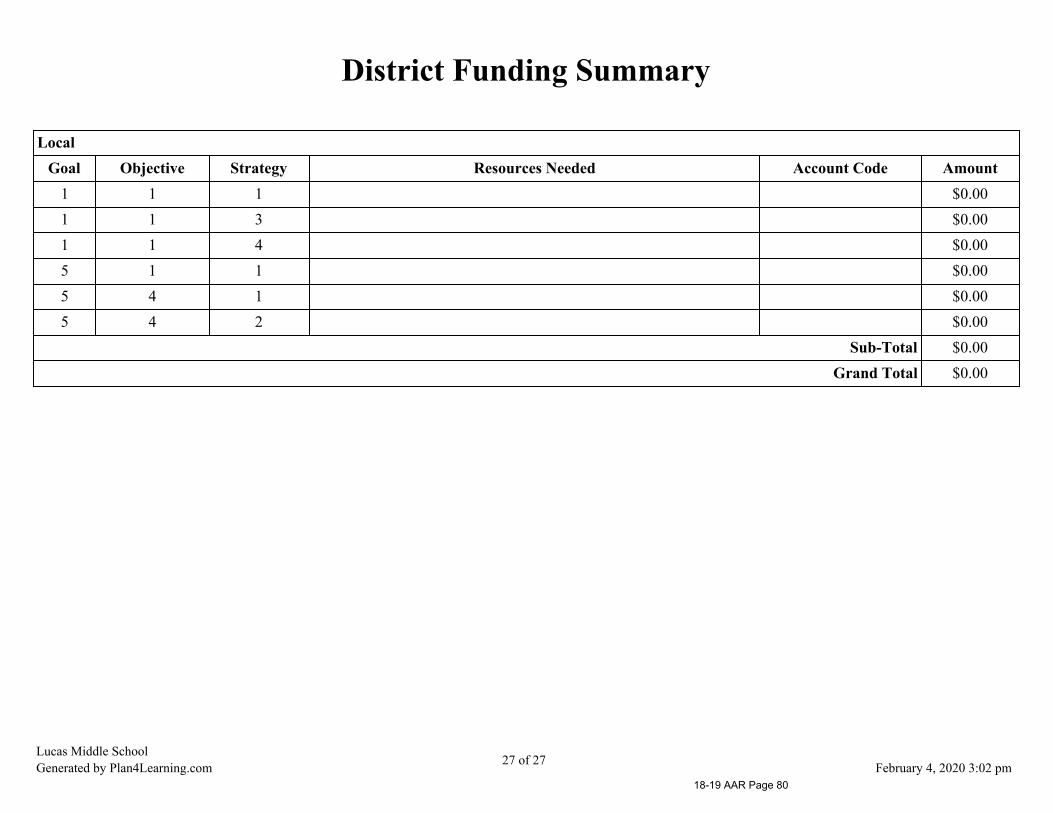
District Funding Summary
LocalGoal Objective Strategy Resources Needed Account Code Amount
1 1 1 $0.001 1 3 $0.001 1 4 $0.005 1 1 $0.005 4 1 $0.005 4 2 $0.00
Sub-Total $0.00Grand Total $0.00
Lucas Middle SchoolGenerated by Plan4Learning.com 27 of 27 February 4, 2020 3:02 pm
18-19 AAR Page 80
Willis Independent School District
Brabham Middle School
2018-2019 Accountability Rating: Met Standard
Distinction Designations:Academic Achievement in Mathematics
Top 25 Percent: Comparative Academic GrowthTop 25 Percent: Comparative Closing the Gaps
Postsecondary Readiness
Brabham Middle SchoolGenerated by Plan4Learning.com 1 of 25
Campus #170-904-064February 4, 2020 2:59 pm
18-19 AAR Page 81

Mission StatementOur mission is to ensure that all students are prepared for high school and for lifelong learning.
VisionBrabham Middle School will be a safe and positive community of learners where all students develop a passion for learning.
Brabham Middle SchoolGenerated by Plan4Learning.com 2 of 25
Campus #170-904-064February 4, 2020 2:59 pm
18-19 AAR Page 82

Table of Contents
Comprehensive Needs Assessment 4Demographics 4Student Academic Achievement 6School Processes & Programs 7Perceptions 8
Priority Problem Statements 9Comprehensive Needs Assessment Data Documentation 10Goals 12
Goal 1: All students will reach high academic standards, at a minimum attaining proficiency or better on state assessments. 12Goal 2: All parents will participate in regular, two-way, and meaningful communication involving student academic learning and school activitiesduring the 2018-2019 school year. 19Goal 3: All staff will be prepared to support student achievement. 20Goal 4: All district funds will be utilized for programs that ensure the success of every student. 22Goal 5: All students will be educated in learning environments that are safe and conducive to learning. 23
Comprehensive Support Strategies 24District Funding Summary 25
Brabham Middle SchoolGenerated by Plan4Learning.com 3 of 25
Campus #170-904-064February 4, 2020 2:59 pm
18-19 AAR Page 83

Comprehensive Needs Assessment
Demographics
Demographics Summary
Brabham Middle School is a 6-8 grade campus with a diverse student population. We are a campus within The Willis Independent School District locatednorth of Houston. The campus demographics are changing due to new master planned communities being developed within our campus boundaries.
TAPR 2016-2017 data:
Attendance Rate: 96.2%
Number of students: 834
Ethnic Distribution: AA: 5.6%; Hispanic: 33.5%; White: 57.6%; AI: 0.2%; Asian: 1.2%; Two or More Races: 1.9%.
ECO DIS: 48.2%
ELL: 10.6%
At Risk: 46%
Demographics Strengths
Student overall scores on STAAR increased from the previous year. Algebra 1 EOC master level scores increased this school year from the previous year.Eco Dis subpopulations scores increased in all tested areas. The campus received four TEA designation distinctions for the first time. ELL student scoresincreased in all tested areas besides Science.
Problem Statements Identifying Demographics Needs
Problem Statement 1: BMS African American subpopulation is scoring lowering Reading and Math than other populations on STAAR. Root Cause:
Brabham Middle SchoolGenerated by Plan4Learning.com 4 of 25
Campus #170-904-064February 4, 2020 2:59 pm
18-19 AAR Page 84

Foundation gaps and relatable material.
Problem Statement 2: BMS Eco Dis subpopulation is scoring lower than the campus average score across all tests. Root Cause: Foundation gaps andmobility rates.
Problem Statement 3: BMS ELL subpopulation scores are lower than the campus average across all subjects. Root Cause: Limited growth in the englishlanguage and vocabulary.
Brabham Middle SchoolGenerated by Plan4Learning.com 5 of 25
Campus #170-904-064February 4, 2020 2:59 pm
18-19 AAR Page 85
Student Academic Achievement
Student Academic Achievement Summary
Academic growth (meeting/exceeding growth standards) in our At Risk student group is a major result of our intervention systems in reading and math.Additionally, our Algebra program enrollment is growing and 100% of our students passed the 2017 Algebra 1 EOC.
Brabham Middle SchoolGenerated by Plan4Learning.com 6 of 25
Campus #170-904-064February 4, 2020 2:59 pm
18-19 AAR Page 86

School Processes & Programs
School Processes & Programs Summary
Data regarding the campus culture and climate was collected from staff and parents through a parent survey and staff survey. In addition,data regarding student discipline was also examined. Particular highlights include the overall cohesiveness of the faculty and the perceivedeffectiveness of the PLCs. It is also noted that the school is perceived to be a place where people feel safe.
For the 2016-17 school year we used two systems that positively impacted student growth across all content areas. The first system was theadministration of our common assessment (CA) every three weeks. CAs were aligned to the state curriculum by grade level TEKS and thedistrict scope and sequence. With the continued use of Profession Learning Communities (PLCs) where teachers and administratorsdiscussed student specific data from the CA and how those data will drive future instruction. This discussion materialized into the creation ofspiraled activities meant to provide targeted remediation. The second system we implement was the a block schedule to create more time.
Areas of curriculum, instruction, and assessment that need improvement for the 2017-18 school year include: writing across the curriculum,addressing achievement gaps, providing high-engagement and student-centered instruction and increasing rigor within the classroom.
Brabham Middle SchoolGenerated by Plan4Learning.com 7 of 25
Campus #170-904-064February 4, 2020 2:59 pm
18-19 AAR Page 87

Perceptions
Perceptions Summary
The middle school years can be challenging for both students and parents. Students leave the very structured and controlled environment of elementaryschool and enter an environment of changing classes multiple times a day, changing teachers, choices in academics and choices in extracurricular activities.These changes not only affect our students, but also their parents. Multiple teachers, the increasing complexity of course content, and students' growingneed for autonomy tend to weaken the tie between parents and the school that existed in elementary school. Parents may find that the ways in which theywere formerly involved in their child's education will undergo fundamental change during the middle school years. During these years, students also makepersonal and educational decisions that can impact the rest of their lives. Middle school students often struggle with independence, changing peerrelationships, physical and emotional changes and academic challenges. The challenges of our students also have an impact on their families and thecommunity. As a school, we must create and maintain relationships with our families and community through consistent communication and opportunitiesfor parent education. Our staff recognizes the importance of this collaboration on overall student success and are dedicated to making these connectionsbetween our school, our families and our community.
Data regarding the campus culture and climate was collected from staff and parents through a parent survey and staff survey. In addition, data regardingstudent discipline was also examined. Particular highlights include the overall cohesiveness of the faculty and the perceived effectiveness of the PLCs. It isalso noted that the school is perceived to be a place where people feel safe.
Brabham Middle SchoolGenerated by Plan4Learning.com 8 of 25
Campus #170-904-064February 4, 2020 2:59 pm
18-19 AAR Page 88

Priority Problem Statements
Brabham Middle SchoolGenerated by Plan4Learning.com 9 of 25
Campus #170-904-064February 4, 2020 2:59 pm
18-19 AAR Page 89

Comprehensive Needs Assessment Data DocumentationThe following data were used to verify the comprehensive needs assessment analysis:
Improvement Planning Data
District goalsCampus goalsCurrent and/or prior year(s) campus and/or district improvement plansCampus and/or district planning and decision making committee(s) meeting data
Accountability Data
Texas Academic Performance Report (TAPR) dataDomain 1 - Student AchievementDomain 2 - Student ProgressDomain 3 - Closing the GapsAccountability Distinction DesignationsPBMAS data
Student Data: Assessments
State of Texas Assessments of Academic Readiness (STAAR) current and longitudinal results, including all versionsSTAAR End-of-Course current and longitudinal results, including all versionsSTAAR EL Progress Measure dataTexas English Language Proficiency Assessment System (TELPAS) resultsObservation Survey results
Student Data: Student Groups
Economically Disadvantaged / Non-economically disadvantaged performance, progress, and participation dataSpecial education/non-special education population including discipline, progress and participation dataAt-risk/non-at-risk population including performance, progress, discipline, attendance, and mobility dataEL/non-EL or LEP data, including academic achievement, progress, support and accommodation needs, race, ethnicity, gender, etc.
Student Data: Behavior and Other Indicators
Attendance dataDiscipline records
Brabham Middle SchoolGenerated by Plan4Learning.com 10 of 25
Campus #170-904-064February 4, 2020 2:59 pm
18-19 AAR Page 90
Employee Data
Professional learning communities (PLC) dataStaff surveys and/or other feedbackCampus department and/or faculty meeting discussions and dataProfessional development needs assessment dataTTESS data
Parent/Community Data
Parent surveys and/or other feedbackParent engagement rateCommunity surveys and/or other feedback
Support Systems and Other Data
Processes and procedures for teaching and learning, including program implementationCommunications dataStudy of best practices
Brabham Middle SchoolGenerated by Plan4Learning.com 11 of 25
Campus #170-904-064February 4, 2020 2:59 pm
18-19 AAR Page 91

Goals
Goal 1: All students will reach high academic standards, at a minimum attaining proficiency or better onstate assessments.
Performance Objective 1: Increase the masters grade level performance of all students to 20% or more in all subjects by the end of the 2018-2019 schoolyear.
Evaluation Data Source(s) 1: This objective will be evaluated by dividing the total number of 2019 "masters grade level" scores by the totalnumber of 2019 tests taken.
Summative Evaluation 1: Some progress made toward meeting Performance Objective
Next Year's Recommendation 1: Establish supports in Math 6 & Reading 7th with labs to provide additional assistance for students.
Strategy Description Monitor Strategy's Expected Result/ImpactReviews
Formative SummativeNov Jan Mar June
1) Create common formative assessment (CFA) resultsin Eduphoria for all subjects.
CampusAdministrators, RtITeam, InstructionalCoaches, PLC's andTeam Leaders.
All subgroups achieving "masters grade level"on thedistrict benchmarks increase.
2) Monitor CFA results for Algebra. AdministrativeTeam, Math Facultyand InstructionalCoaches.
Monitoring of unit tests, CFA's and other data to ensure75% of all subgroups are meeting "masters grade level."
Brabham Middle SchoolGenerated by Plan4Learning.com 12 of 25
Campus #170-904-064February 4, 2020 2:59 pm
18-19 AAR Page 92

Strategy Description Monitor Strategy's Expected Result/ImpactReviews
Formative SummativeNov Jan Mar June
3) Work closely with district-assigned instructionalcoaches, dyslexia specialist and G/T specialist toeffectively utilize their expertise in best practices andimpact student performance.
AdministrativeTeam, AssistantSuperintendent ofInnovation,Teaching andLearning, DyslexiaSpecialist,InstructionalCoaches, andFaculty.
Anecdotal teacher information, lesson plans evolving,walk-through and T-TESS data indicating higher levelsof rigor.
Funding Sources: SCE - 0.004) Continue to grow the robotics program aimed atincreasing the critical problem-solving skills of studentsby actively engaging them in a hands-on program toincrease applicability of math, science, and relative skillsets.
AdministrativeTeam and assignedrobotics coach
Anecdotal teacher information, 70% or higher on CFAresults, and increased participation in the robotics classand planning documents.
Funding Sources: 199 - General Fund - 0.005) Implement Writing Across the Curriculum (WAC) inevery subject once a week.
All staff. Students become more confident and comfortable withacademic writing.
Funding Sources: SCE - 0.006) Implement Bobkat Time (RTI/Enrichment) five daysa week.
All staff. Meet individual student needs based on understanding ofessential standards.
7) Monitor CFA results for ELA for all grades. All staff. Increase in ELA scores and targeted instruction.
8) Monitor CFA 6-8 Math scores. All staff. Increase in math scores and targeted instruction.
9) Monitor 8th grade Science CFA's. All staff. Increase in targeted instruction and scores for 8th gradeScience.
10) Monitor 8th grade Social Studies CFA's. All staff Increase in scores and focused instruction.
Brabham Middle SchoolGenerated by Plan4Learning.com 13 of 25
Campus #170-904-064February 4, 2020 2:59 pm
18-19 AAR Page 93
Strategy Description Monitor Strategy's Expected Result/ImpactReviews
Formative SummativeNov Jan Mar June
= Accomplished = Continue/Modify = No Progress = Discontinue
Brabham Middle SchoolGenerated by Plan4Learning.com 14 of 25
Campus #170-904-064February 4, 2020 2:59 pm
18-19 AAR Page 94
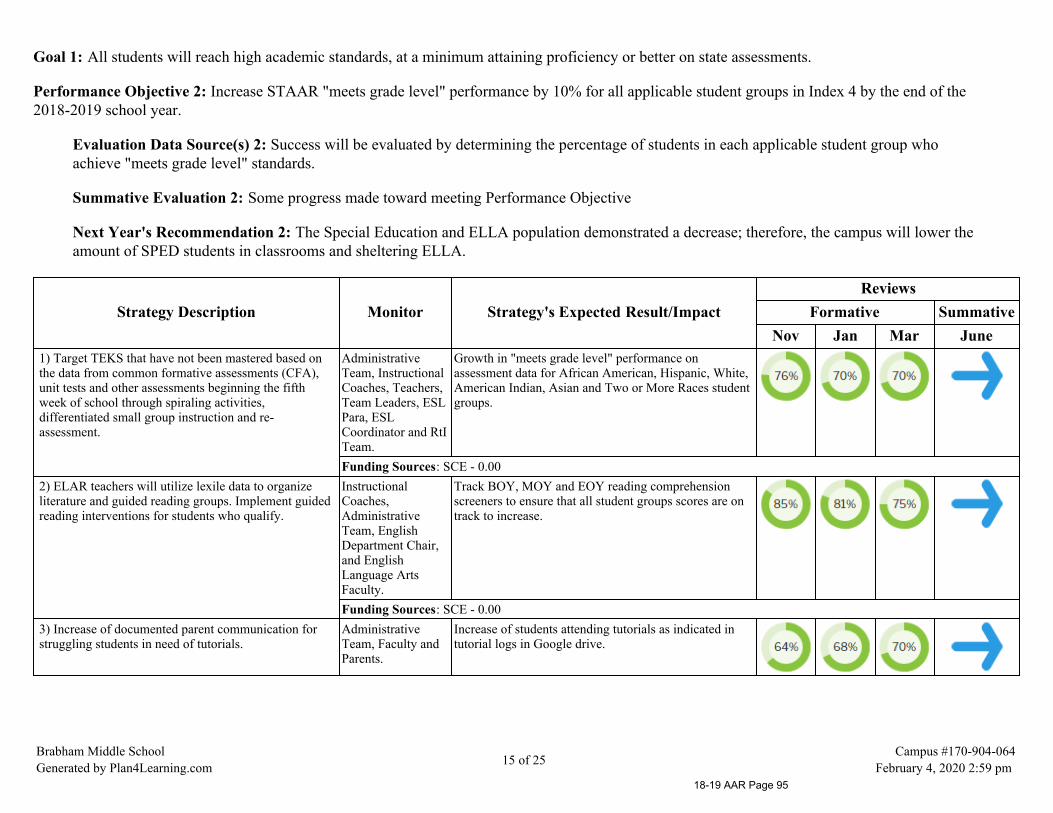
Goal 1: All students will reach high academic standards, at a minimum attaining proficiency or better on state assessments.
Performance Objective 2: Increase STAAR "meets grade level" performance by 10% for all applicable student groups in Index 4 by the end of the2018-2019 school year.
Evaluation Data Source(s) 2: Success will be evaluated by determining the percentage of students in each applicable student group whoachieve "meets grade level" standards.
Summative Evaluation 2: Some progress made toward meeting Performance Objective
Next Year's Recommendation 2: The Special Education and ELLA population demonstrated a decrease; therefore, the campus will lower theamount of SPED students in classrooms and sheltering ELLA.
Strategy Description Monitor Strategy's Expected Result/ImpactReviews
Formative SummativeNov Jan Mar June
1) Target TEKS that have not been mastered based onthe data from common formative assessments (CFA),unit tests and other assessments beginning the fifthweek of school through spiraling activities,differentiated small group instruction and re-assessment.
AdministrativeTeam, InstructionalCoaches, Teachers,Team Leaders, ESLPara, ESLCoordinator and RtITeam.
Growth in "meets grade level" performance onassessment data for African American, Hispanic, White,American Indian, Asian and Two or More Races studentgroups.
Funding Sources: SCE - 0.002) ELAR teachers will utilize lexile data to organizeliterature and guided reading groups. Implement guidedreading interventions for students who qualify.
InstructionalCoaches,AdministrativeTeam, EnglishDepartment Chair,and EnglishLanguage ArtsFaculty.
Track BOY, MOY and EOY reading comprehensionscreeners to ensure that all student groups scores are ontrack to increase.
Funding Sources: SCE - 0.003) Increase of documented parent communication forstruggling students in need of tutorials.
AdministrativeTeam, Faculty andParents.
Increase of students attending tutorials as indicated intutorial logs in Google drive.
Brabham Middle SchoolGenerated by Plan4Learning.com 15 of 25
Campus #170-904-064February 4, 2020 2:59 pm
18-19 AAR Page 95
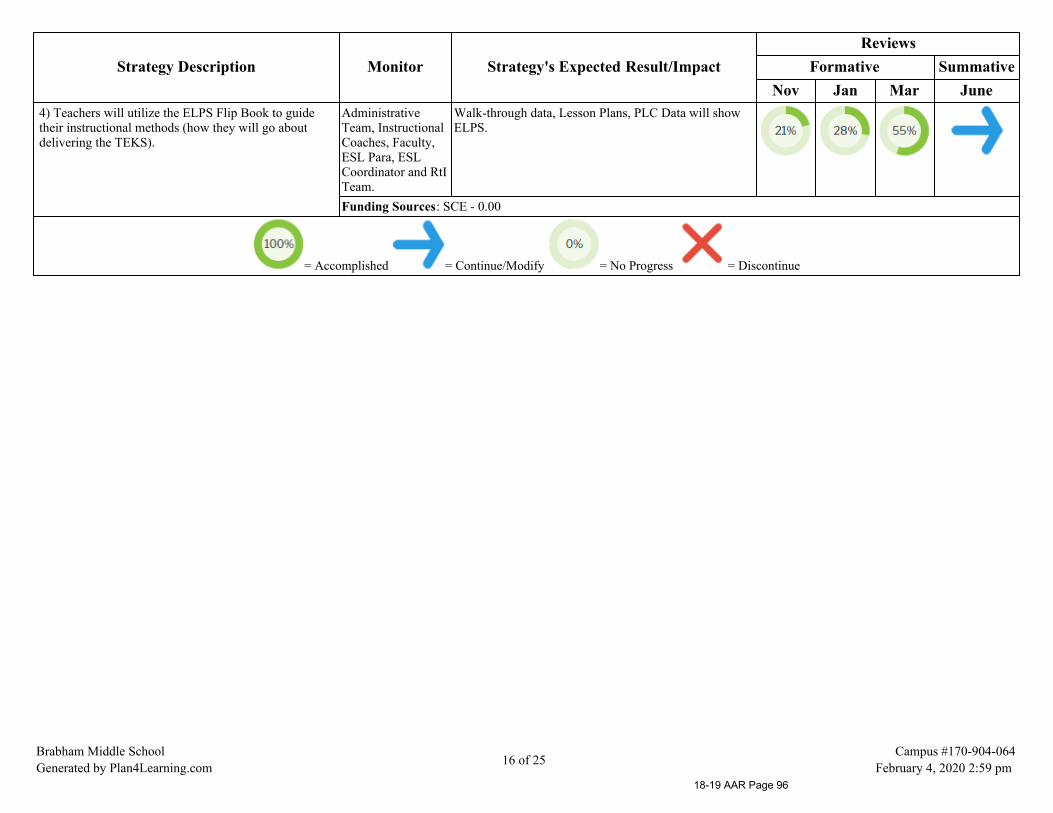
Strategy Description Monitor Strategy's Expected Result/ImpactReviews
Formative SummativeNov Jan Mar June
4) Teachers will utilize the ELPS Flip Book to guidetheir instructional methods (how they will go aboutdelivering the TEKS).
AdministrativeTeam, InstructionalCoaches, Faculty,ESL Para, ESLCoordinator and RtITeam.
Walk-through data, Lesson Plans, PLC Data will showELPS.
Funding Sources: SCE - 0.00
= Accomplished = Continue/Modify = No Progress = Discontinue
Brabham Middle SchoolGenerated by Plan4Learning.com 16 of 25
Campus #170-904-064February 4, 2020 2:59 pm
18-19 AAR Page 96

Goal 1: All students will reach high academic standards, at a minimum attaining proficiency or better on state assessments.
Performance Objective 3: Student Attendance rate will increase to 96.8% for the 2018-2019 school year.
Evaluation Data Source(s) 3: An overall attendance rate of 96.8% will be achieved and maintained.
Summative Evaluation 3: Met Performance Objective
Next Year's Recommendation 3: Continue current initiatives with additional student and staff incentives.
Strategy Description Monitor Strategy's Expected Result/ImpactReviews
Formative SummativeNov Jan Mar June
1) Implement a Positive Behavior Intervention andSupport (PBIS) Committee that focuses on attendanceand discipline strategies and recognition.
AdministrativeTeam, Faculty, andParents.
Higher attendance rates will be recorded for theidentified days.
2) School wide incentive for maintaining 96.8% orabove attendance rates each semester.
AdministrativeTeam, PBISCommittee andFaculty.
Higher overall attendance rates will be experienced, ingeneral.
3) Partner with PTO to receive incentives for studentsand teachers with the highest attendance rate duringeach nine week grading period.
AdministrativeTeam and faculty
Increase in attendance rate
4) Reward each student achieving perfect attendanceduring a nine week grading period.
AdministrativeTeam, PBISCommittee andFaculty.
Increase in attendance rate
= Accomplished = Continue/Modify = No Progress = Discontinue
Brabham Middle SchoolGenerated by Plan4Learning.com 17 of 25
Campus #170-904-064February 4, 2020 2:59 pm
18-19 AAR Page 97
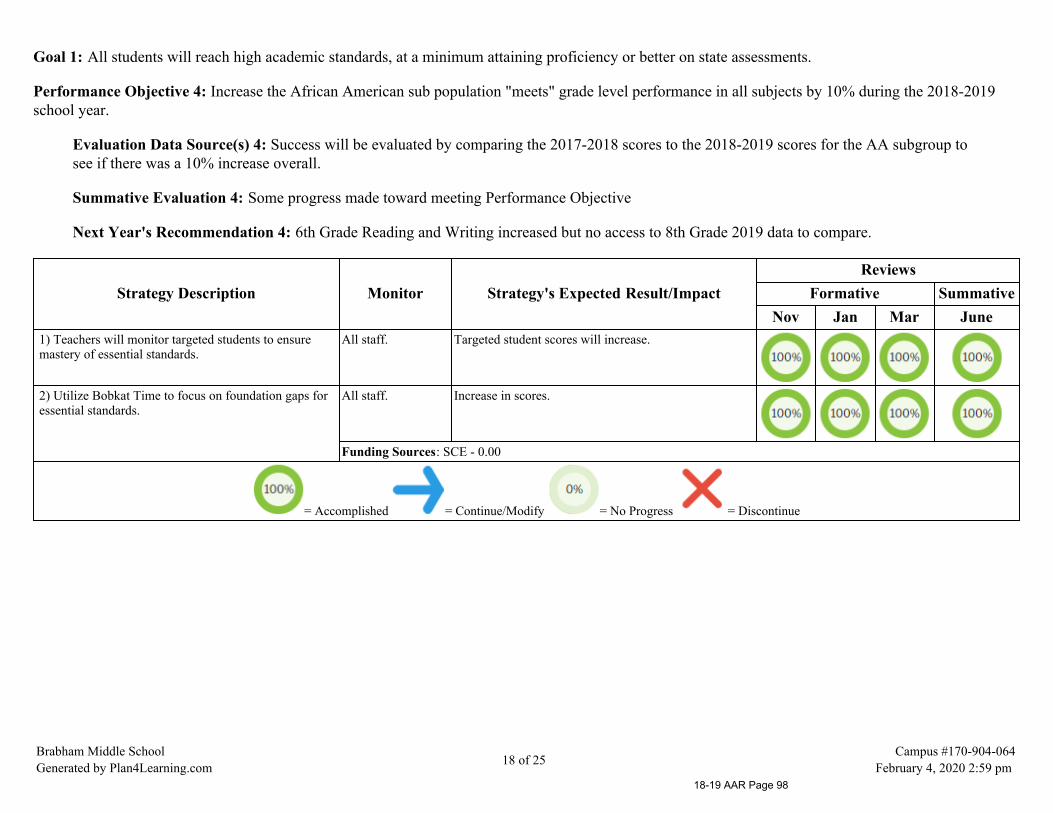
Goal 1: All students will reach high academic standards, at a minimum attaining proficiency or better on state assessments.
Performance Objective 4: Increase the African American sub population "meets" grade level performance in all subjects by 10% during the 2018-2019school year.
Evaluation Data Source(s) 4: Success will be evaluated by comparing the 2017-2018 scores to the 2018-2019 scores for the AA subgroup tosee if there was a 10% increase overall.
Summative Evaluation 4: Some progress made toward meeting Performance Objective
Next Year's Recommendation 4: 6th Grade Reading and Writing increased but no access to 8th Grade 2019 data to compare.
Strategy Description Monitor Strategy's Expected Result/ImpactReviews
Formative SummativeNov Jan Mar June
1) Teachers will monitor targeted students to ensuremastery of essential standards.
All staff. Targeted student scores will increase.
2) Utilize Bobkat Time to focus on foundation gaps foressential standards.
All staff. Increase in scores.
Funding Sources: SCE - 0.00
= Accomplished = Continue/Modify = No Progress = Discontinue
Brabham Middle SchoolGenerated by Plan4Learning.com 18 of 25
Campus #170-904-064February 4, 2020 2:59 pm
18-19 AAR Page 98
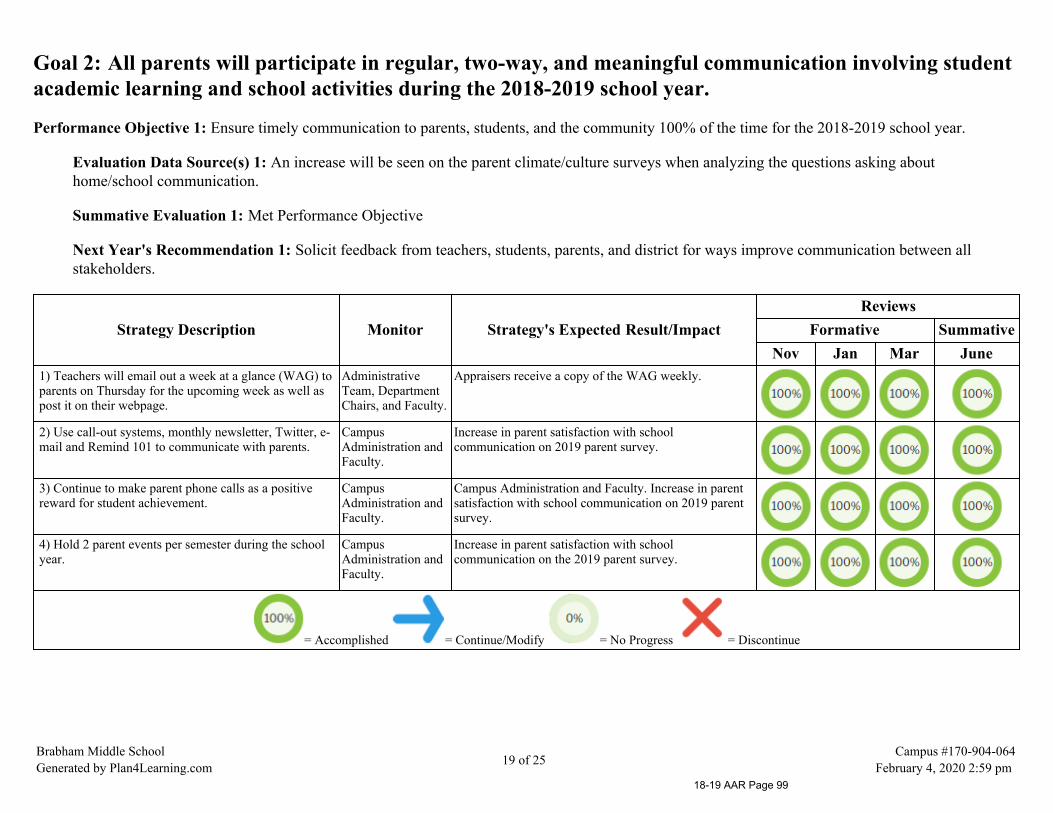
Goal 2: All parents will participate in regular, two-way, and meaningful communication involving studentacademic learning and school activities during the 2018-2019 school year.
Performance Objective 1: Ensure timely communication to parents, students, and the community 100% of the time for the 2018-2019 school year.
Evaluation Data Source(s) 1: An increase will be seen on the parent climate/culture surveys when analyzing the questions asking abouthome/school communication.
Summative Evaluation 1: Met Performance Objective
Next Year's Recommendation 1: Solicit feedback from teachers, students, parents, and district for ways improve communication between allstakeholders.
Strategy Description Monitor Strategy's Expected Result/ImpactReviews
Formative SummativeNov Jan Mar June
1) Teachers will email out a week at a glance (WAG) toparents on Thursday for the upcoming week as well aspost it on their webpage.
AdministrativeTeam, DepartmentChairs, and Faculty.
Appraisers receive a copy of the WAG weekly.
2) Use call-out systems, monthly newsletter, Twitter, e-mail and Remind 101 to communicate with parents.
CampusAdministration andFaculty.
Increase in parent satisfaction with schoolcommunication on 2019 parent survey.
3) Continue to make parent phone calls as a positivereward for student achievement.
CampusAdministration andFaculty.
Campus Administration and Faculty. Increase in parentsatisfaction with school communication on 2019 parentsurvey.
4) Hold 2 parent events per semester during the schoolyear.
CampusAdministration andFaculty.
Increase in parent satisfaction with schoolcommunication on the 2019 parent survey.
= Accomplished = Continue/Modify = No Progress = Discontinue
Brabham Middle SchoolGenerated by Plan4Learning.com 19 of 25
Campus #170-904-064February 4, 2020 2:59 pm
18-19 AAR Page 99
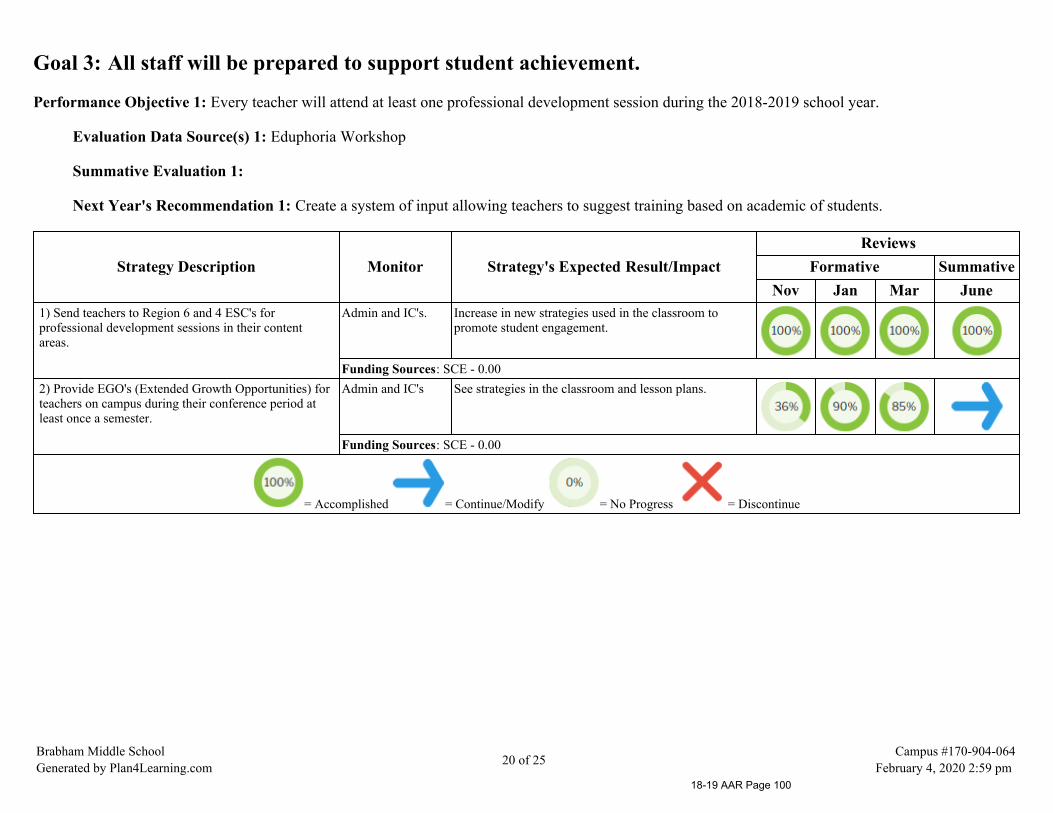
Goal 3: All staff will be prepared to support student achievement.
Performance Objective 1: Every teacher will attend at least one professional development session during the 2018-2019 school year.
Evaluation Data Source(s) 1: Eduphoria Workshop
Summative Evaluation 1:
Next Year's Recommendation 1: Create a system of input allowing teachers to suggest training based on academic of students.
Strategy Description Monitor Strategy's Expected Result/ImpactReviews
Formative SummativeNov Jan Mar June
1) Send teachers to Region 6 and 4 ESC's forprofessional development sessions in their contentareas.
Admin and IC's. Increase in new strategies used in the classroom topromote student engagement.
Funding Sources: SCE - 0.002) Provide EGO's (Extended Growth Opportunities) forteachers on campus during their conference period atleast once a semester.
Admin and IC's See strategies in the classroom and lesson plans.
Funding Sources: SCE - 0.00
= Accomplished = Continue/Modify = No Progress = Discontinue
Brabham Middle SchoolGenerated by Plan4Learning.com 20 of 25
Campus #170-904-064February 4, 2020 2:59 pm
18-19 AAR Page 100

Goal 3: All staff will be prepared to support student achievement.
Performance Objective 2: Students will attend Bobkat Time for RTI and enrichment every day during the 2018-2019 school year.
Evaluation Data Source(s) 2: Enriching Students data.
Summative Evaluation 2: Met Performance Objective
Next Year's Recommendation 2: To collaborate with administrators and instructional coaches to target professional to improve teacher andstudent performance.
Strategy Description Monitor Strategy's Expected Result/ImpactReviews
Formative SummativeNov Jan Mar June
1) Utilize Enriching Students reports to track studentsattending sessions.
Admin and IC's. Increase in mastery of Essential Standards.
Funding Sources: SCE - 0.002) Send teacher leaders to RTI Institute. Admin and IC's Increase in mastery of Essential Standards.
Funding Sources: SCE - 0.00
= Accomplished = Continue/Modify = No Progress = Discontinue
Brabham Middle SchoolGenerated by Plan4Learning.com 21 of 25
Campus #170-904-064February 4, 2020 2:59 pm
18-19 AAR Page 101

Goal 4: All district funds will be utilized for programs that ensure the success of every student.
Performance Objective 1: 100% of funding decisions made by the campus administration will be prioritized by campus improvement initiatives during the2018-2019 school year.
Evaluation Data Source(s) 1: The campus budget audit evaluating line by line alignment between budget spending and campus improvementplans
Summative Evaluation 1: Met Performance Objective
Next Year's Recommendation 1: Provide a system for UIL fund utilization.
Strategy Description Monitor Strategy's Expected Result/ImpactReviews
Formative SummativeNov Jan Mar June
1) Continue to assess each department during the springto determine needs.
District andCampusadministration
Needs Assessments turned in and evaluated.
2) Continue to assess all requisitions to determine iffunds support the campus goals.
Requisitions support campus goals.
= Accomplished = Continue/Modify = No Progress = Discontinue
Brabham Middle SchoolGenerated by Plan4Learning.com 22 of 25
Campus #170-904-064February 4, 2020 2:59 pm
18-19 AAR Page 102
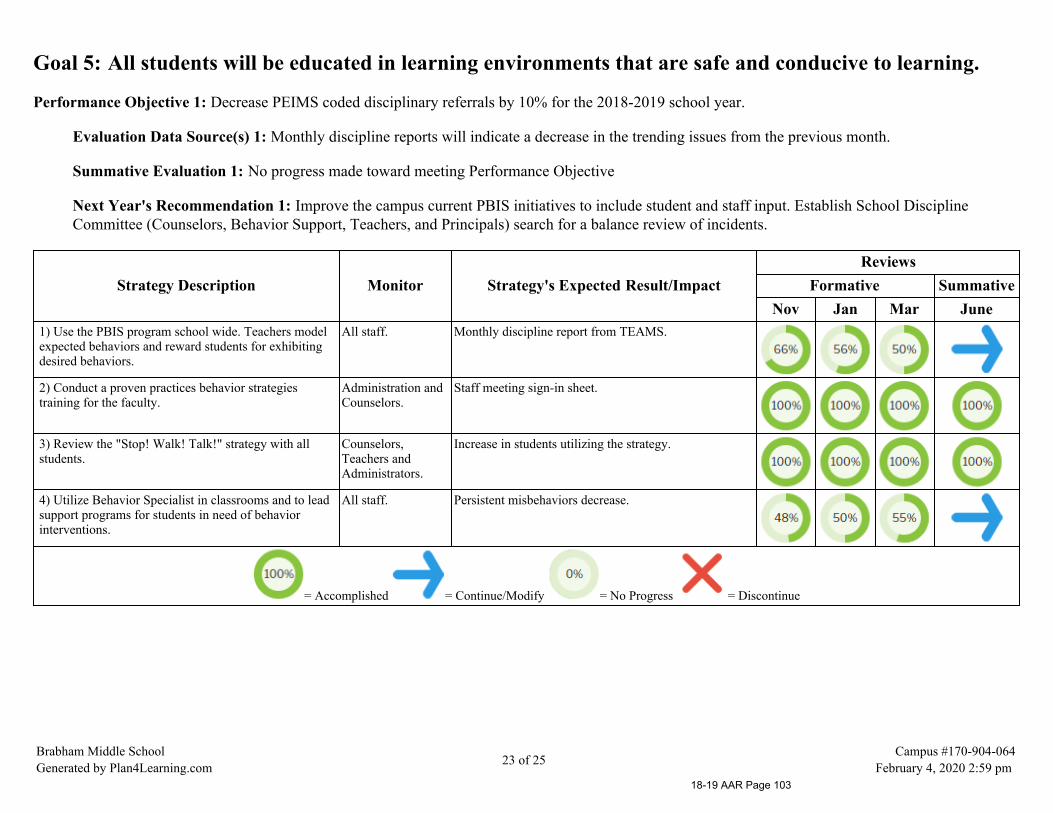
Goal 5: All students will be educated in learning environments that are safe and conducive to learning.
Performance Objective 1: Decrease PEIMS coded disciplinary referrals by 10% for the 2018-2019 school year.
Evaluation Data Source(s) 1: Monthly discipline reports will indicate a decrease in the trending issues from the previous month.
Summative Evaluation 1: No progress made toward meeting Performance Objective
Next Year's Recommendation 1: Improve the campus current PBIS initiatives to include student and staff input. Establish School DisciplineCommittee (Counselors, Behavior Support, Teachers, and Principals) search for a balance review of incidents.
Strategy Description Monitor Strategy's Expected Result/ImpactReviews
Formative SummativeNov Jan Mar June
1) Use the PBIS program school wide. Teachers modelexpected behaviors and reward students for exhibitingdesired behaviors.
All staff. Monthly discipline report from TEAMS.
2) Conduct a proven practices behavior strategiestraining for the faculty.
Administration andCounselors.
Staff meeting sign-in sheet.
3) Review the "Stop! Walk! Talk!" strategy with allstudents.
Counselors,Teachers andAdministrators.
Increase in students utilizing the strategy.
4) Utilize Behavior Specialist in classrooms and to leadsupport programs for students in need of behaviorinterventions.
All staff. Persistent misbehaviors decrease.
= Accomplished = Continue/Modify = No Progress = Discontinue
Brabham Middle SchoolGenerated by Plan4Learning.com 23 of 25
Campus #170-904-064February 4, 2020 2:59 pm
18-19 AAR Page 103

Comprehensive Support Strategies
Goal Objective Strategy Description1 1 1 Create common formative assessment (CFA) results in Eduphoria for all subjects.1 1 2 Monitor CFA results for Algebra.
1 1 3 Work closely with district-assigned instructional coaches, dyslexia specialist and G/T specialist to effectively utilize theirexpertise in best practices and impact student performance.
1 1 5 Implement Writing Across the Curriculum (WAC) in every subject once a week.1 1 6 Implement Bobkat Time (RTI/Enrichment) five days a week.
1 2 1Target TEKS that have not been mastered based on the data from common formative assessments (CFA), unit tests and otherassessments beginning the fifth week of school through spiraling activities, differentiated small group instruction and re-assessment.
1 2 2 ELAR teachers will utilize lexile data to organize literature and guided reading groups. Implement guided readinginterventions for students who qualify.
1 2 4 Teachers will utilize the ELPS Flip Book to guide their instructional methods (how they will go about delivering the TEKS).
1 3 1 Implement a Positive Behavior Intervention and Support (PBIS) Committee that focuses on attendance and discipline strategiesand recognition.
1 4 1 Teachers will monitor targeted students to ensure mastery of essential standards.
Brabham Middle SchoolGenerated by Plan4Learning.com 24 of 25
Campus #170-904-064February 4, 2020 2:59 pm
18-19 AAR Page 104
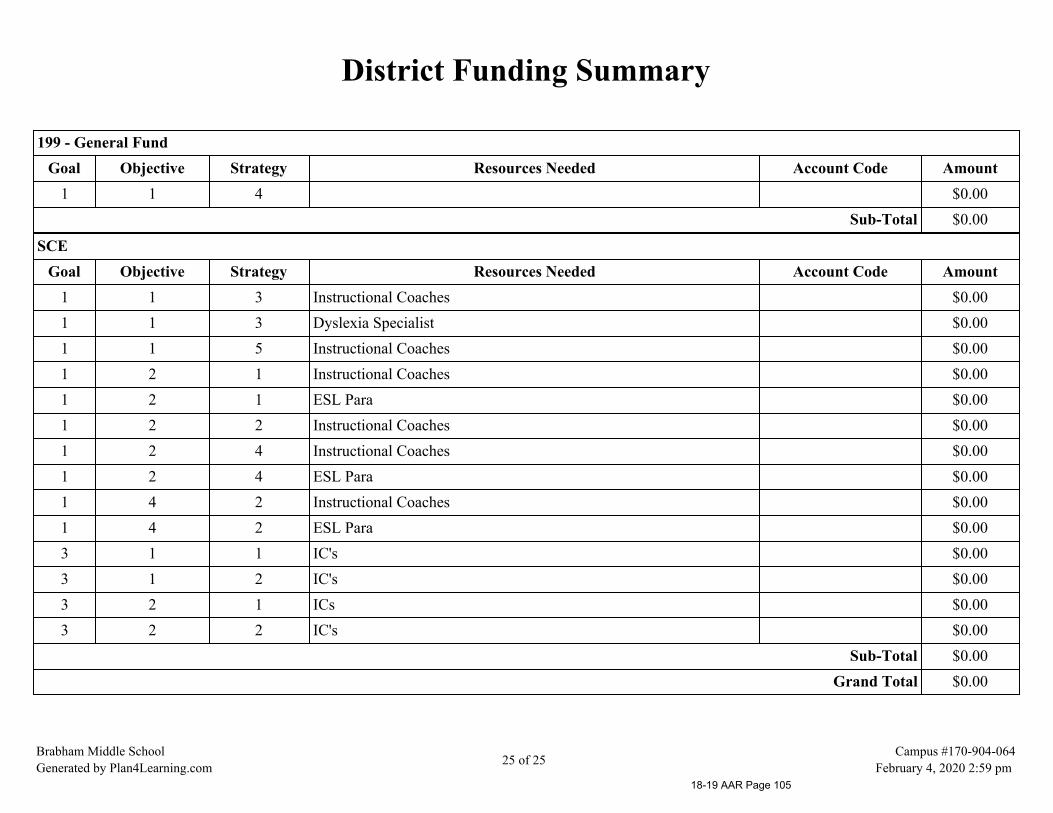
District Funding Summary
199 - General FundGoal Objective Strategy Resources Needed Account Code Amount
1 1 4 $0.00Sub-Total $0.00
SCEGoal Objective Strategy Resources Needed Account Code Amount
1 1 3 Instructional Coaches $0.001 1 3 Dyslexia Specialist $0.001 1 5 Instructional Coaches $0.001 2 1 Instructional Coaches $0.001 2 1 ESL Para $0.001 2 2 Instructional Coaches $0.001 2 4 Instructional Coaches $0.001 2 4 ESL Para $0.001 4 2 Instructional Coaches $0.001 4 2 ESL Para $0.003 1 1 IC's $0.003 1 2 IC's $0.003 2 1 ICs $0.003 2 2 IC's $0.00
Sub-Total $0.00Grand Total $0.00
Brabham Middle SchoolGenerated by Plan4Learning.com 25 of 25
Campus #170-904-064February 4, 2020 2:59 pm
18-19 AAR Page 105
Willis Independent School District
Parmley Elementary
2018-2019 Accountability Rating: Met Standard
Parmley ElementaryGenerated by Plan4Learning.com 1 of 48
Campus #170-904-101February 4, 2020 3:03 pm
18-19 AAR Page 106

Mission StatementAt Parmley Elementary and in Willis ISD, we are One team, one purpose!
VisionAt Parmley, we are Parmley P.R.O.U.D. Expect More, Be More!
Core BeliefsParmley PROUD
ProductiveResilient
OptimisticUnified
Dedicated
Parmley ElementaryGenerated by Plan4Learning.com 2 of 48
Campus #170-904-101February 4, 2020 3:03 pm
18-19 AAR Page 107
Table of Contents
Comprehensive Needs Assessment 5Demographics 5Student Academic Achievement 8School Processes & Programs 9Perceptions 11
Priority Problem Statements 13Comprehensive Needs Assessment Data Documentation 15Goals 18
Goal 1: By the end of the school year, all students will reach high academic standards, at a minimum attaining proficiency or better as measured bySTAAR. 18Goal 2: Throughout the year, all parents will participate in regular, two-way, and meaningful communication involving student academic learning andschool activities as measured by parent surveys sent through administration. 24Goal 3: Throughout the year, all staff will be prepared to support student achievement as measured by walkthrough data, benchmarks, STAAR, andTELPAS. 28Goal 4: Throughout the school year, all district funds will be utilized for programs that ensure the success of every student as measured by ourachievement scores and budget analysis. 34Goal 5: Throughout the school year, all students will be educated in learning environments that are safe and conducive to learning as measured bywalkthroughs and student surveys of school safety. 35
Comprehensive Support Strategies 39PBMAS Intervention Strategies 40State Compensatory 41
Budget for Parmley Elementary: 41Personnel for Parmley Elementary: 42
Title I Schoolwide Elements 43ELEMENT 1. SWP COMPREHENSIVE NEEDS ASSESSMENT (CNA) 431.1: Comprehensive Needs Assessment 43ELEMENT 2. SWP CAMPUS IMPROVEMENT PLAN (CIP) 432.1: Campus Improvement Plan developed with appropriate stakeholders 432.2: Regular monitoring and revision 442.3: Available to parents and community in an understandable format and language 442.4: Opportunities for all children to meet State standards 442.5: Increased learning time and well-rounded education 45
Parmley ElementaryGenerated by Plan4Learning.com 3 of 48
Campus #170-904-101February 4, 2020 3:03 pm
18-19 AAR Page 108

2.6: Address needs of all students, particularly at-risk 45ELEMENT 3. PARENT AND FAMILY ENGAGEMENT (PFE) 453.1: Develop and distribute Parent and Family Engagement Policy 453.2: Offer flexible number of parent involvement meetings 45
Title I Personnel 46Campus Education Improvement Committee 47District Funding Summary 48
Parmley ElementaryGenerated by Plan4Learning.com 4 of 48
Campus #170-904-101February 4, 2020 3:03 pm
18-19 AAR Page 109

Comprehensive Needs Assessment
Demographics
Demographics Summary
Student Demographics
1. Who are we:
665 students
Female- 48.28%
Male- 51.72%
Native Hawaiian or other Pacific Islander- 0.13%
African Americans- 10.03%
American Indian or Alaskan Native- 0.53%
Asian- 0.53%
Hispanic/Latino- 29.42%
White- 56.33%
2 or more races- 3.03%
Gifted/talented- 3.30%
ESL- 4.75%
Special Education - 14.91%
Parmley ElementaryGenerated by Plan4Learning.com 5 of 48
Campus #170-904-101February 4, 2020 3:03 pm
18-19 AAR Page 110

504- 6.3%
Dyslexia- 1.98%
Speech Impairment- 30%
Autism- 26%
Title 1- 100%
At-Risk- 41.95%
Economically Disadvantaged- 62.53%
With whom are we engaged?
The Ark, Conroe Bible Church, Entergy of the Woodlands, PTO- parent volunteers, Parent Support Center, Ladies of Eastern Star, North Shore RepublicanWomen, Willis High School Students
STAFF:
Staff by Ethnicity Race Report Category for USERCAMPUSES PARMLEY EL
County-District Number: 170904 District Name: WILLIS ISDEthnicity Race Report Category 18-19B - Black or African American 6
H - Hispanic/Latino 16T - Two or More Races 0
W - White 59TOTALS 81
Demographics Strengths
How many students are homeless? .66% What services are available- backpack program, parent support center. Students basic needs are met.(strength)
1.
All teachers are state certified and more diverse in ethnicity/gender.2.
Parmley ElementaryGenerated by Plan4Learning.com 6 of 48
Campus #170-904-101February 4, 2020 3:03 pm
18-19 AAR Page 111

1.
2.
Various types of professional development are offered to staff3.
The Willis community is growing4.
Problem Statements Identifying Demographics Needs
Problem Statement 1: Parmley student absences have historically been high Root Cause: Parent lack of understanding in the importance of education andparent perception of education.
Problem Statement 2: Parmley parental and community involvement have been historically low. Root Cause: Lack of various ways to communicateactivities to families. Communication did not include more than one language
Parmley ElementaryGenerated by Plan4Learning.com 7 of 48
Campus #170-904-101February 4, 2020 3:03 pm
18-19 AAR Page 112
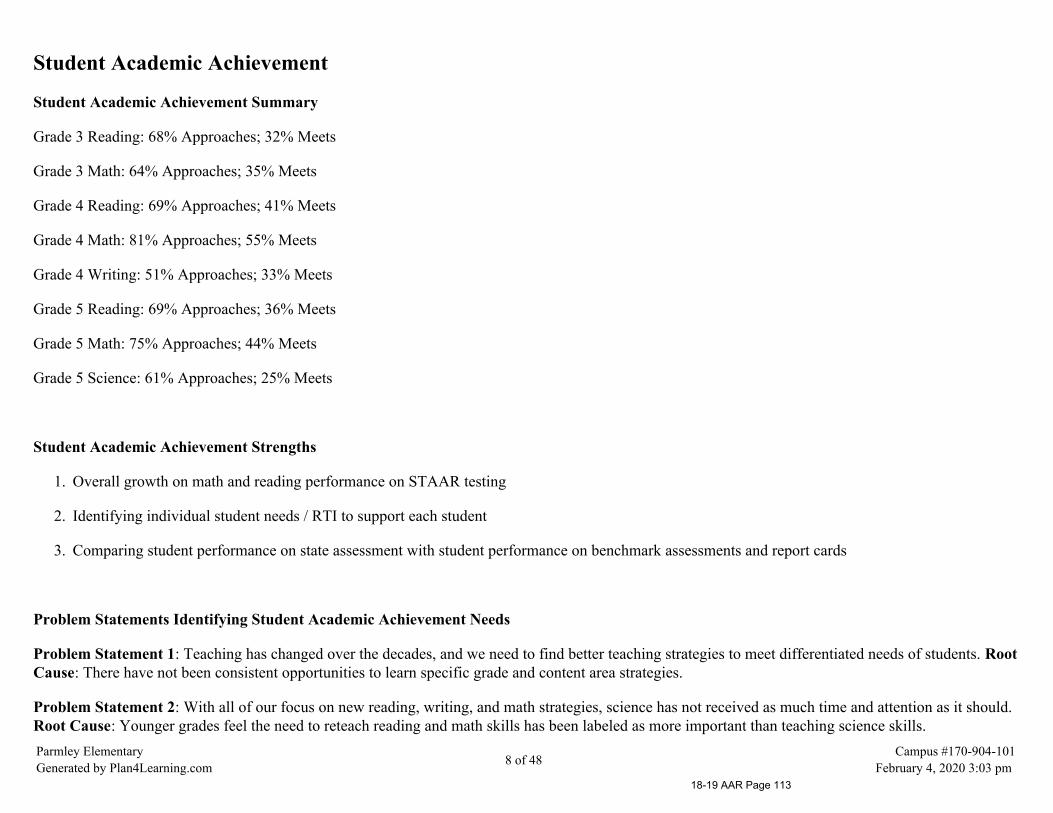
Student Academic Achievement
Student Academic Achievement Summary
Grade 3 Reading: 68% Approaches; 32% Meets
Grade 3 Math: 64% Approaches; 35% Meets
Grade 4 Reading: 69% Approaches; 41% Meets
Grade 4 Math: 81% Approaches; 55% Meets
Grade 4 Writing: 51% Approaches; 33% Meets
Grade 5 Reading: 69% Approaches; 36% Meets
Grade 5 Math: 75% Approaches; 44% Meets
Grade 5 Science: 61% Approaches; 25% Meets
Student Academic Achievement Strengths
Overall growth on math and reading performance on STAAR testing1.
Identifying individual student needs / RTI to support each student2.
Comparing student performance on state assessment with student performance on benchmark assessments and report cards3.
Problem Statements Identifying Student Academic Achievement Needs
Problem Statement 1: Teaching has changed over the decades, and we need to find better teaching strategies to meet differentiated needs of students. RootCause: There have not been consistent opportunities to learn specific grade and content area strategies.
Problem Statement 2: With all of our focus on new reading, writing, and math strategies, science has not received as much time and attention as it should.Root Cause: Younger grades feel the need to reteach reading and math skills has been labeled as more important than teaching science skills.Parmley ElementaryGenerated by Plan4Learning.com 8 of 48
Campus #170-904-101February 4, 2020 3:03 pm
18-19 AAR Page 113

School Processes & Programs
School Processes & Programs Summary
1. Flipgrid to screen applicants prior to hiring
2. Comprehension Toolkit has been implemented school wide
3. Instructional coaches are on campus regularly and in PLC meetings.
4. Certified and licensed teachers who work together to do what is best for students.
5. Instructional practices that are monitored with consistent feedback for all
TEKS ResourceComprehension ToolkitBenchmark AssessmentsMAP TestingEnvisionStemscopes for ScienceMelissa Leach LLC Consulting on campus
School Processes & Programs Strengths
Curriculum aligned with TEKS and ELPS
Being pulled from TEKS Resource
Implementing the district curriculum with fidelity
MAP
Assessments being used to measure student achivement
Student progress being tracked
Parmley ElementaryGenerated by Plan4Learning.com 9 of 48
Campus #170-904-101February 4, 2020 3:03 pm
18-19 AAR Page 114
Instructional initiatives aligned with plan
A literacy program for parents called Partners in Print
PLC time for available content areas
Programs available after school
DI, Lego League and last year was soccer, running club, student council, Choir, jump rope, Kats for Christ
Duty and supervision scheduled well
Good formal and informal leadership
Problem Statements Identifying School Processes & Programs Needs
Problem Statement 1: There is a lack of rigorous use of materials and strategies supported by scientifically based research. Root Cause: Teachers arehaving to use standards from lower grades to reteach since students are not coming at grade level.
Problem Statement 2: Students aren’t monitoring their academic progress. Root Cause: Teachers are limited on instructional time to be able to teachstudents how to monitor progress.
Problem Statement 3: Interruptions, especially calls for ISS/OSS work, have increased during instructional time. Root Cause: There is no process for howto collect work or have prepared assignments.
Problem Statement 4: When appropriate, technology is not consistently being used to support instruction and learning. Root Cause: There is a learningcurve that requires time to learn and implement technology.
Parmley ElementaryGenerated by Plan4Learning.com 10 of 48
Campus #170-904-101February 4, 2020 3:03 pm
18-19 AAR Page 115
Perceptions
Perceptions Summary
Through surveying parents, teachers, and staff via google drive, survey monkey, and google classroom.
Multiple means of communication with parents
* Call outs
* Parmley Post
* Teacher/Parent calls
* Remind 101/DoJo
* Emails
* Letters sent home via mail/student
Recruitment of community support (Montgomery County Food Bank, The Ark, Conroe Bible Church, Entergy, Chick-fil-a)
Volunteer Login in via the Willis ISD website
Parmley Night Events (Meet the Teacher, Open House, Title 1 Meeting, STEAM night, Reading, Night, Ned Show)
Perceptions Strengths
* Communication is used in variety of ways in order to make parent and community members aware of what is going on at Parmley Elementary (phonecalls, text, email, remind 101, Class DoJo, Marquee, Twitter, Parmley Post and letters sent home).
* Multiple parent volunteers have began coming to our CEIC committee meetings and becoming more active members in the decision making process
* Teachers and administrative staff are approachable and available for families and community members to come and discuss their concerns and ideas inways to improve the Parmley communityParmley ElementaryGenerated by Plan4Learning.com 11 of 48
Campus #170-904-101February 4, 2020 3:03 pm
18-19 AAR Page 116

* A strong relationship with community partners that help support our students needs and morale building of the staff.
* Teachers are building relationships through their daily use of community circles and realtionship building within the school community
* The staff is part of the discipline practices and decision making through monthly meetings of evaluating discipline data through PBIS (Positive BehaviorIntervention System)
Problem Statements Identifying Perceptions Needs
Problem Statement 1: Parmley Elementary has a large number of disciplinary issues. Root Cause: There is a need to educate students effective coping andsocial-emotional skills.
Problem Statement 2: There is a lack of parental involvement within the school community. Root Cause: There is a need to educate parents on variousways to be involved with their child's/children's education.
Problem Statement 3: There is a perception that teachers are not invested in building relationships with students. Root Cause: There needs be a clear andconsistent line of communication between the teacher, parent, and student.
Parmley ElementaryGenerated by Plan4Learning.com 12 of 48
Campus #170-904-101February 4, 2020 3:03 pm
18-19 AAR Page 117
Priority Problem Statements
Problem Statement 1: Parmley Elementary has a large number of disciplinary issues.Root Cause 1: There is a need to educate students effective coping and social-emotional skills.Problem Statement 1 Areas: Perceptions
Problem Statement 2: There is a lack of parental involvement within the school community.Root Cause 2: There is a need to educate parents on various ways to be involved with their child's/children's education.Problem Statement 2 Areas: Perceptions
Problem Statement 3: There is a perception that teachers are not invested in building relationships with students.Root Cause 3: There needs be a clear and consistent line of communication between the teacher, parent, and student.Problem Statement 3 Areas: Perceptions
Problem Statement 4: Parmley student absences have historically been highRoot Cause 4: Parent lack of understanding in the importance of education and parent perception of education.Problem Statement 4 Areas: Demographics
Problem Statement 5: Parmley parental and community involvement have been historically low.Root Cause 5: Lack of various ways to communicate activities to families. Communication did not include more than one languageProblem Statement 5 Areas: Demographics
Parmley ElementaryGenerated by Plan4Learning.com 13 of 48
Campus #170-904-101February 4, 2020 3:03 pm
18-19 AAR Page 118

Problem Statement 6: Teaching has changed over the decades, and we need to find better teaching strategies to meet differentiated needs of students.Root Cause 6: There have not been consistent opportunities to learn specific grade and content area strategies.Problem Statement 6 Areas: Student Academic Achievement
Problem Statement 7: With all of our focus on new reading, writing, and math strategies, science has not received as much time and attention as it should.Root Cause 7: Younger grades feel the need to reteach reading and math skills has been labeled as more important than teaching science skills.Problem Statement 7 Areas: Student Academic Achievement
Problem Statement 8: There is a lack of rigorous use of materials and strategies supported by scientifically based research.Root Cause 8: Teachers are having to use standards from lower grades to reteach since students are not coming at grade level.Problem Statement 8 Areas: District Processes & Programs
Problem Statement 9: When appropriate, technology is not consistently being used to support instruction and learning.Root Cause 9: There is a learning curve that requires time to learn and implement technology.Problem Statement 9 Areas: District Processes & Programs
Parmley ElementaryGenerated by Plan4Learning.com 14 of 48
Campus #170-904-101February 4, 2020 3:03 pm
18-19 AAR Page 119

Comprehensive Needs Assessment Data DocumentationThe following data were used to verify the comprehensive needs assessment analysis:
Improvement Planning Data
District goalsCampus goalsCurrent and/or prior year(s) campus and/or district improvement plansCampus and/or district planning and decision making committee(s) meeting dataState and federal planning requirements
Accountability Data
Texas Academic Performance Report (TAPR) dataDomain 1 - Student AchievementDomain 2 - Student ProgressDomain 3 - Closing the GapsEffective Schools Framework dataTargeted support Identification dataAccountability Distinction DesignationsFederal Report Card DataPBMAS data
Student Data: Assessments
State and federally required assessment information (e.g. curriculum, eligibility, format, standards, accommodations, TEA information)State of Texas Assessments of Academic Readiness (STAAR) current and longitudinal results, including all versionsSTAAR EL Progress Measure dataTexas English Language Proficiency Assessment System (TELPAS) resultsStudent Success Initiative (SSI) data for Grades 5 and 8Local benchmark or common assessments dataStudent failure and/or retention ratesObservation Survey results
Student Data: Student Groups
Race and ethnicity data, including number of students, academic achievement, discipline, attendance, and rates of progress for each student groupEconomically Disadvantaged / Non-economically disadvantaged performance, progress, and participation data
Parmley ElementaryGenerated by Plan4Learning.com 15 of 48
Campus #170-904-101February 4, 2020 3:03 pm
18-19 AAR Page 120

Male / Female performance, progress, and participation dataSpecial education/non-special education population including discipline, progress and participation dataAt-risk/non-at-risk population including performance, progress, discipline, attendance, and mobility dataEL/non-EL or LEP data, including academic achievement, progress, support and accommodation needs, race, ethnicity, gender, etc.Section 504 dataHomeless dataGifted and talented dataResponse to Intervention (RtI) student achievement dataDyslexia Data
Student Data: Behavior and Other Indicators
Attendance dataMobility rate, including longitudinal dataDiscipline recordsStudent surveys and/or other feedbackClass size averages by grade and subjectSchool safety data
Employee Data
Professional learning communities (PLC) dataStaff surveys and/or other feedbackState certified and high quality staff dataTeacher/Student RatioCampus leadership dataCampus department and/or faculty meeting discussions and dataProfessional development needs assessment dataEvaluation(s) of professional development implementation and impactTTESS data
Parent/Community Data
Parent surveys and/or other feedbackParent engagement rateCommunity surveys and/or other feedback
Support Systems and Other Data
Organizational structure dataProcesses and procedures for teaching and learning, including program implementation
Parmley ElementaryGenerated by Plan4Learning.com 16 of 48
Campus #170-904-101February 4, 2020 3:03 pm
18-19 AAR Page 121
Capacity and resources dataBudgets/entitlements and expenditures data
Parmley ElementaryGenerated by Plan4Learning.com 17 of 48
Campus #170-904-101February 4, 2020 3:03 pm
18-19 AAR Page 122

Goals
Goal 1: By the end of the school year, all students will reach high academic standards, at a minimumattaining proficiency or better as measured by STAAR.
Performance Objective 1: By May of 2019, we will increase our passing rate of 72% to 80% in reading across the grade levels as measured by STAAR.
By the end of the year, 85% of students will show at least one year's growth as measured by MAP and STAAR.
Evaluation Data Source(s) 1: STAARMAPBenchmark Data
Summative Evaluation 1: No progress made toward meeting Performance Objective
Next Year's Recommendation 1: More focus on phonics and reading in K-2 to unmask the problem.
Strategy Description ELEMENTS Monitor Strategy's Expected Result/ImpactReviews
Formative SummativeNov Jan Mar June
Critical Success FactorsCSF 1 CSF 3 CSF 7
1) Implement Guided Reading with fidelity.Reading across genres and subject area. RtI implementation
2.4, 2.5, 2.6 AdminCoachesTeachers
Higher achievement levelsFilling in gaps
Problem Statements: Student Academic Achievement 1Funding Sources: 211 - Title 1-A - 531.00
PBMASCritical Success Factors
CSF 1 CSF 2 CSF 4
2) Using MyOn, students will engage in on levelreading using technology.
2.4, 2.5, 2.6 AdministratorsTeachers
Increased reading comprehension and fluency
Problem Statements: Student Academic Achievement 1Funding Sources: 211 - Title 1-A - 7635.57
Parmley ElementaryGenerated by Plan4Learning.com 18 of 48
Campus #170-904-101February 4, 2020 3:03 pm
18-19 AAR Page 123

Strategy Description ELEMENTS Monitor Strategy's Expected Result/ImpactReviews
Formative SummativeNov Jan Mar June
3) Hire a reading tutor to assist with Tier 3students using research based practices.
2.4, 2.5, 2.6 AdminLiteracy Coach
Higher achievement and overall growth
Problem Statements: Student Academic Achievement 1Funding Sources: 211 - Title 1-A - 4275.00
= Accomplished = Continue/Modify = No Progress = Discontinue
Performance Objective 1 Problem Statements:
Student Academic AchievementProblem Statement 1: Teaching has changed over the decades, and we need to find better teaching strategies to meet differentiated needs of students. Root Cause 1: There have not beenconsistent opportunities to learn specific grade and content area strategies.
Parmley ElementaryGenerated by Plan4Learning.com 19 of 48
Campus #170-904-101February 4, 2020 3:03 pm
18-19 AAR Page 124
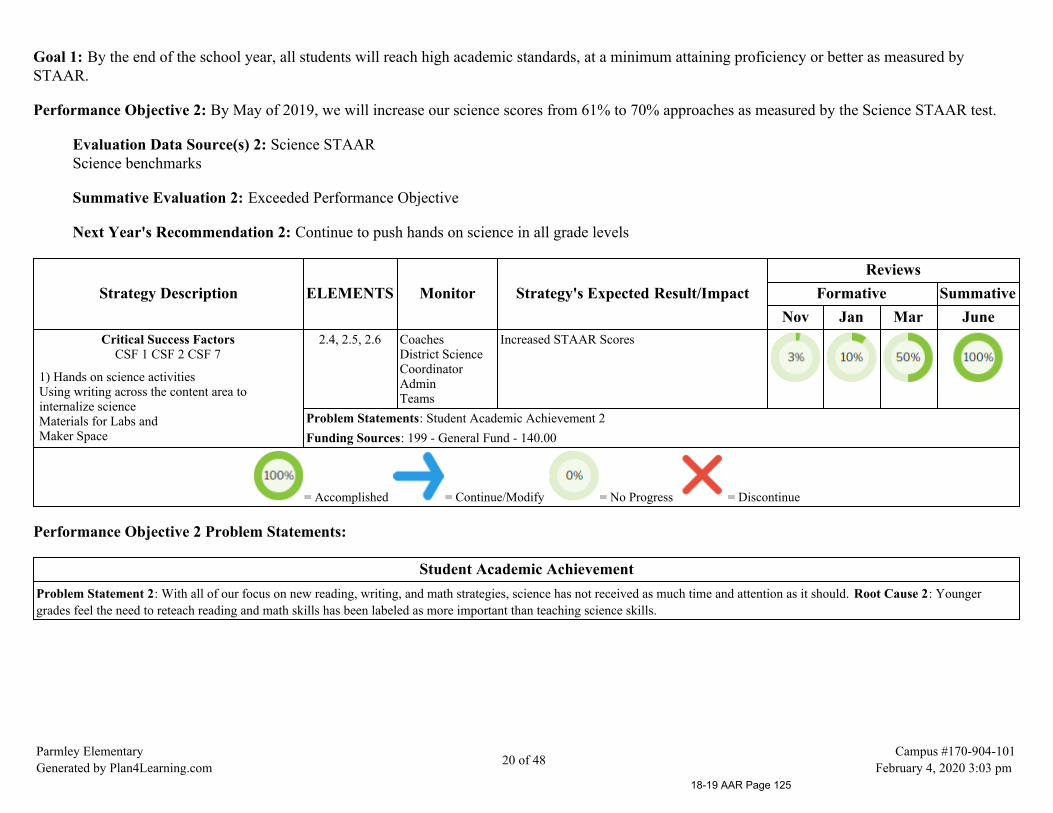
Goal 1: By the end of the school year, all students will reach high academic standards, at a minimum attaining proficiency or better as measured bySTAAR.
Performance Objective 2: By May of 2019, we will increase our science scores from 61% to 70% approaches as measured by the Science STAAR test.
Evaluation Data Source(s) 2: Science STAARScience benchmarks
Summative Evaluation 2: Exceeded Performance Objective
Next Year's Recommendation 2: Continue to push hands on science in all grade levels
Strategy Description ELEMENTS Monitor Strategy's Expected Result/ImpactReviews
Formative SummativeNov Jan Mar June
Critical Success FactorsCSF 1 CSF 2 CSF 7
1) Hands on science activitiesUsing writing across the content area tointernalize science Materials for Labs andMaker Space
2.4, 2.5, 2.6 CoachesDistrict ScienceCoordinatorAdminTeams
Increased STAAR Scores
Problem Statements: Student Academic Achievement 2Funding Sources: 199 - General Fund - 140.00
= Accomplished = Continue/Modify = No Progress = Discontinue
Performance Objective 2 Problem Statements:
Student Academic AchievementProblem Statement 2: With all of our focus on new reading, writing, and math strategies, science has not received as much time and attention as it should. Root Cause 2: Youngergrades feel the need to reteach reading and math skills has been labeled as more important than teaching science skills.
Parmley ElementaryGenerated by Plan4Learning.com 20 of 48
Campus #170-904-101February 4, 2020 3:03 pm
18-19 AAR Page 125

Goal 1: By the end of the school year, all students will reach high academic standards, at a minimum attaining proficiency or better as measured bySTAAR.
Performance Objective 3: By May of 2019, students meeting the masters grade level will increase by 6% in each subject as measured by the STAAR Test.
Evaluation Data Source(s) 3: Each STAAR Test
Summative Evaluation 3: Some progress made toward meeting Performance Objective
Next Year's Recommendation 3: Intervention schedules and making sure we know every student by name, strength, and need
Strategy Description ELEMENTS Monitor Strategy's Expected Result/ImpactReviews
Formative SummativeNov Jan Mar June
Critical Success FactorsCSF 1
1) Staff collaboration with Enrichment activities .
2.4, 2.5, 2.6 AdminTeachersCoachesMentor teachers
Teachers work together to improve student masterscores
Problem Statements: Student Academic Achievement 1, 2 - School Processes & Programs 1Critical Success Factors
CSF 1 CSF 2
2) Staff Training on differentiation strategiessuch as Lead4ward Playlist
2.4, 2.5, 2.6 AdminCoaches
More differentiation in classrooms and increasedknowledge on how to differentiate.
Problem Statements: School Processes & Programs 1Funding Sources: 199 - General Fund - 300.00, 211 - Title 1-A - 150.00
= Accomplished = Continue/Modify = No Progress = Discontinue
Performance Objective 3 Problem Statements:
Student Academic AchievementProblem Statement 1: Teaching has changed over the decades, and we need to find better teaching strategies to meet differentiated needs of students. Root Cause 1: There have not beenconsistent opportunities to learn specific grade and content area strategies.
Problem Statement 2: With all of our focus on new reading, writing, and math strategies, science has not received as much time and attention as it should. Root Cause 2: Youngergrades feel the need to reteach reading and math skills has been labeled as more important than teaching science skills.
Parmley ElementaryGenerated by Plan4Learning.com 21 of 48
Campus #170-904-101February 4, 2020 3:03 pm
18-19 AAR Page 126

School Processes & ProgramsProblem Statement 1: There is a lack of rigorous use of materials and strategies supported by scientifically based research. Root Cause 1: Teachers are having to use standards fromlower grades to reteach since students are not coming at grade level.
Parmley ElementaryGenerated by Plan4Learning.com 22 of 48
Campus #170-904-101February 4, 2020 3:03 pm
18-19 AAR Page 127
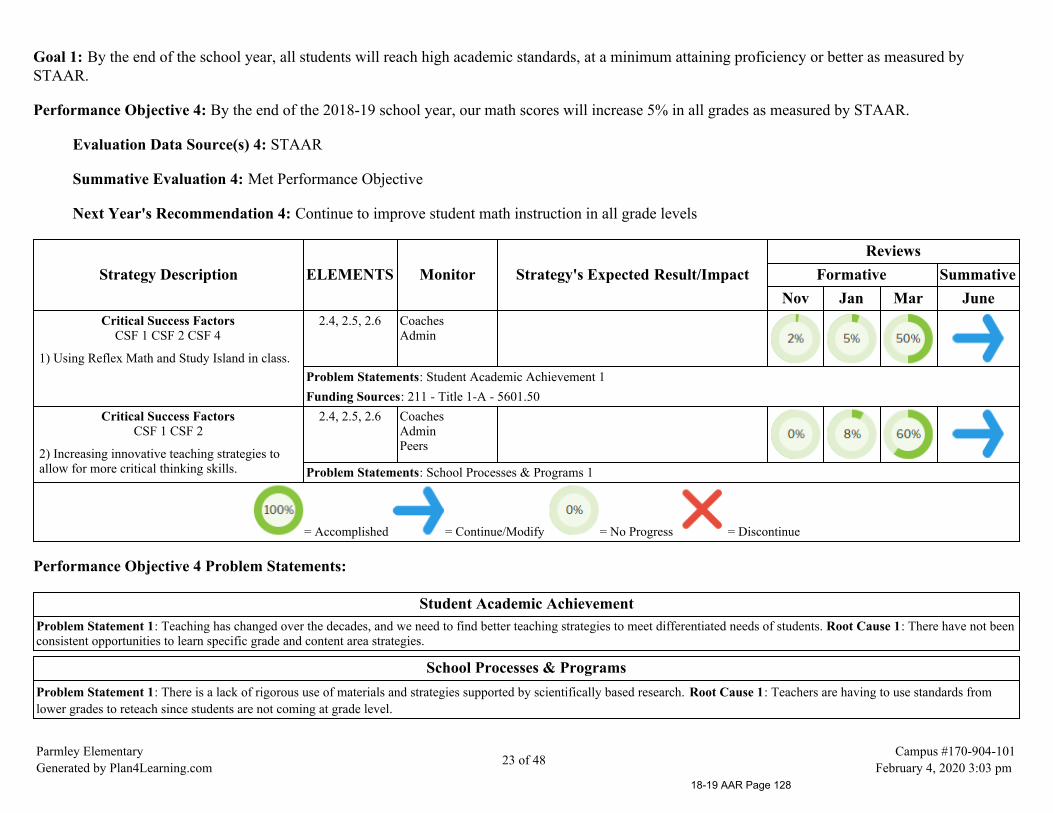
Goal 1: By the end of the school year, all students will reach high academic standards, at a minimum attaining proficiency or better as measured bySTAAR.
Performance Objective 4: By the end of the 2018-19 school year, our math scores will increase 5% in all grades as measured by STAAR.
Evaluation Data Source(s) 4: STAAR
Summative Evaluation 4: Met Performance Objective
Next Year's Recommendation 4: Continue to improve student math instruction in all grade levels
Strategy Description ELEMENTS Monitor Strategy's Expected Result/ImpactReviews
Formative SummativeNov Jan Mar June
Critical Success FactorsCSF 1 CSF 2 CSF 4
1) Using Reflex Math and Study Island in class.
2.4, 2.5, 2.6 CoachesAdmin
Problem Statements: Student Academic Achievement 1Funding Sources: 211 - Title 1-A - 5601.50
Critical Success FactorsCSF 1 CSF 2
2) Increasing innovative teaching strategies toallow for more critical thinking skills.
2.4, 2.5, 2.6 CoachesAdminPeers
Problem Statements: School Processes & Programs 1
= Accomplished = Continue/Modify = No Progress = Discontinue
Performance Objective 4 Problem Statements:
Student Academic AchievementProblem Statement 1: Teaching has changed over the decades, and we need to find better teaching strategies to meet differentiated needs of students. Root Cause 1: There have not beenconsistent opportunities to learn specific grade and content area strategies.
School Processes & ProgramsProblem Statement 1: There is a lack of rigorous use of materials and strategies supported by scientifically based research. Root Cause 1: Teachers are having to use standards fromlower grades to reteach since students are not coming at grade level.
Parmley ElementaryGenerated by Plan4Learning.com 23 of 48
Campus #170-904-101February 4, 2020 3:03 pm
18-19 AAR Page 128
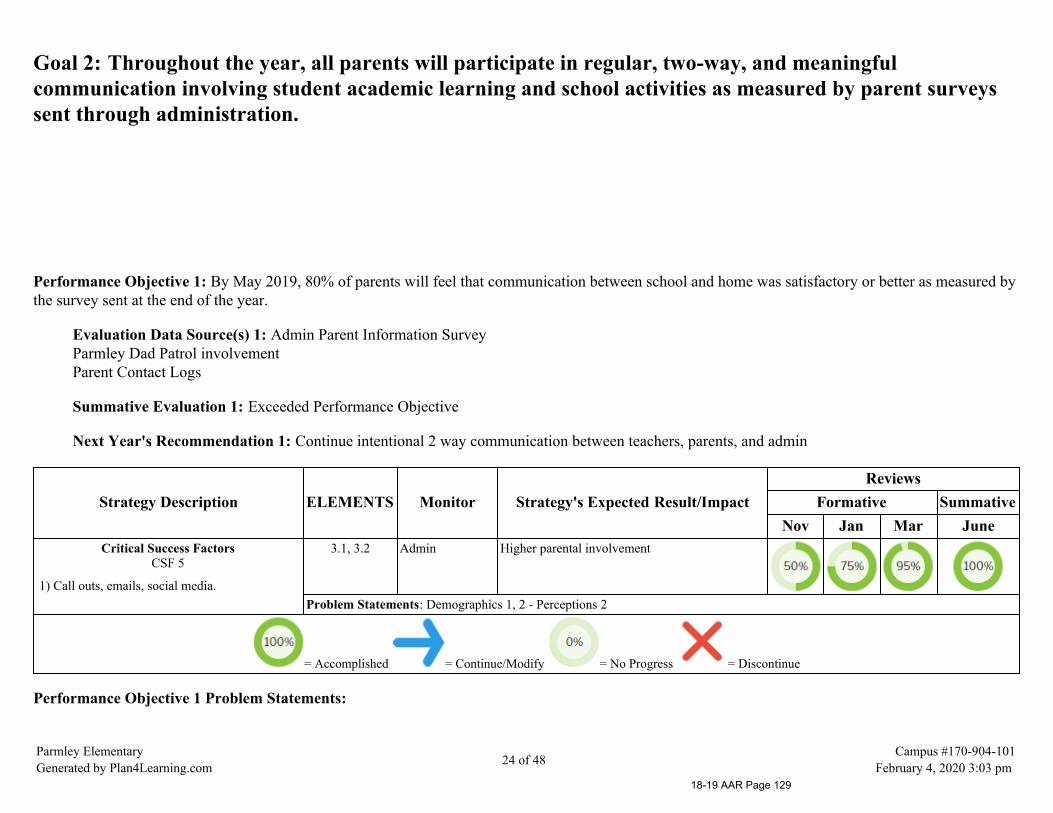
Goal 2: Throughout the year, all parents will participate in regular, two-way, and meaningfulcommunication involving student academic learning and school activities as measured by parent surveyssent through administration.
Performance Objective 1: By May 2019, 80% of parents will feel that communication between school and home was satisfactory or better as measured bythe survey sent at the end of the year.
Evaluation Data Source(s) 1: Admin Parent Information SurveyParmley Dad Patrol involvementParent Contact Logs
Summative Evaluation 1: Exceeded Performance Objective
Next Year's Recommendation 1: Continue intentional 2 way communication between teachers, parents, and admin
Strategy Description ELEMENTS Monitor Strategy's Expected Result/ImpactReviews
Formative SummativeNov Jan Mar June
Critical Success FactorsCSF 5
1) Call outs, emails, social media.
3.1, 3.2 Admin Higher parental involvement
Problem Statements: Demographics 1, 2 - Perceptions 2
= Accomplished = Continue/Modify = No Progress = Discontinue
Performance Objective 1 Problem Statements:
Parmley ElementaryGenerated by Plan4Learning.com 24 of 48
Campus #170-904-101February 4, 2020 3:03 pm
18-19 AAR Page 129
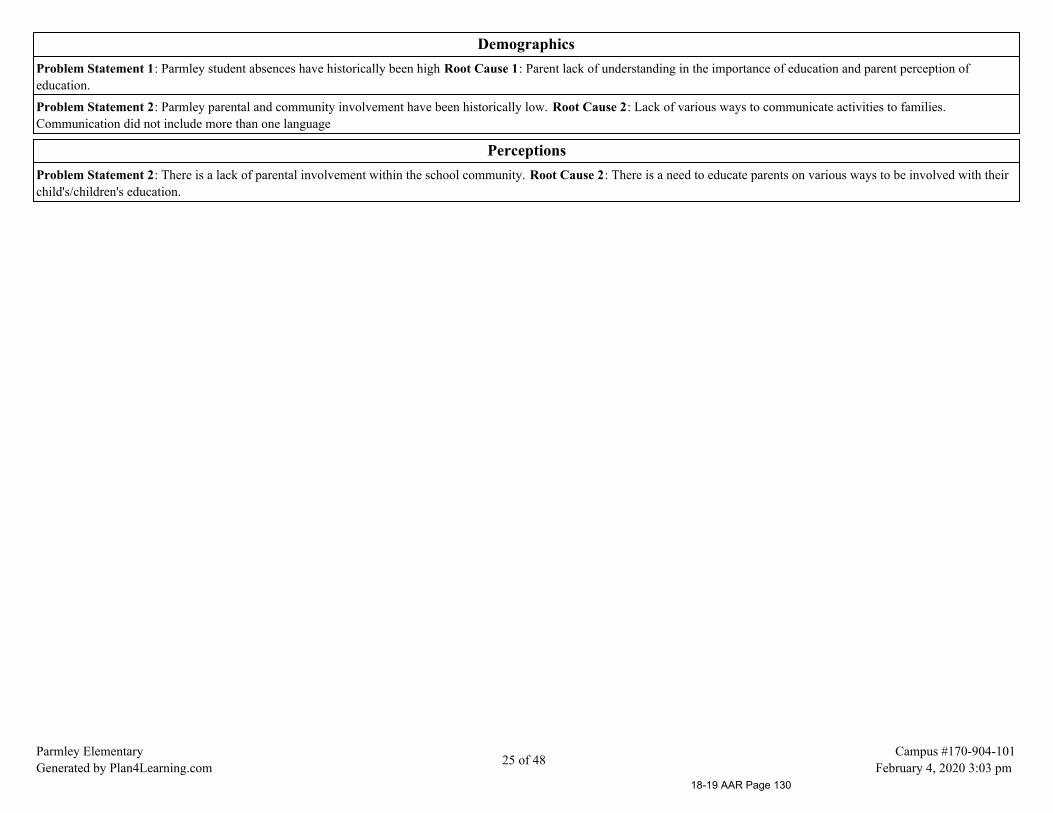
DemographicsProblem Statement 1: Parmley student absences have historically been high Root Cause 1: Parent lack of understanding in the importance of education and parent perception ofeducation.
Problem Statement 2: Parmley parental and community involvement have been historically low. Root Cause 2: Lack of various ways to communicate activities to families.Communication did not include more than one language
PerceptionsProblem Statement 2: There is a lack of parental involvement within the school community. Root Cause 2: There is a need to educate parents on various ways to be involved with theirchild's/children's education.
Parmley ElementaryGenerated by Plan4Learning.com 25 of 48
Campus #170-904-101February 4, 2020 3:03 pm
18-19 AAR Page 130

Goal 2: Throughout the year, all parents will participate in regular, two-way, and meaningful communication involving student academic learning andschool activities as measured by parent surveys sent through administration.
Performance Objective 2: By the end of the 2018-19 school year, Parmley Elementary will increase the amount of parental involvement by 15% asmeasured by sign in sheets and participation logs.
Evaluation Data Source(s) 2: Survey on Partners in Print
Summative Evaluation 2: Exceeded Performance Objective
Next Year's Recommendation 2: Continue involving parents (provide food if possible)
Strategy Description ELEMENTS Monitor Strategy's Expected Result/ImpactReviews
Formative SummativeNov Jan Mar June
1) Implementing Partners in Print 3.1, 3.2 Admin
Problem Statements: Demographics 1, 2 - Perceptions 2, 3Funding Sources: 211 - Title 1-A - 890.00
Critical Success FactorsCSF 5
2) Parent donations and activities to increasestudent participation and involvement in school.
3.1, 3.2
= Accomplished = Continue/Modify = No Progress = Discontinue
Performance Objective 2 Problem Statements:
Parmley ElementaryGenerated by Plan4Learning.com 26 of 48
Campus #170-904-101February 4, 2020 3:03 pm
18-19 AAR Page 131

DemographicsProblem Statement 1: Parmley student absences have historically been high Root Cause 1: Parent lack of understanding in the importance of education and parent perception ofeducation.
Problem Statement 2: Parmley parental and community involvement have been historically low. Root Cause 2: Lack of various ways to communicate activities to families.Communication did not include more than one language
PerceptionsProblem Statement 2: There is a lack of parental involvement within the school community. Root Cause 2: There is a need to educate parents on various ways to be involved with theirchild's/children's education.
Problem Statement 3: There is a perception that teachers are not invested in building relationships with students. Root Cause 3: There needs be a clear and consistent line ofcommunication between the teacher, parent, and student.
Parmley ElementaryGenerated by Plan4Learning.com 27 of 48
Campus #170-904-101February 4, 2020 3:03 pm
18-19 AAR Page 132

Goal 3: Throughout the year, all staff will be prepared to support student achievement as measured bywalkthrough data, benchmarks, STAAR, and TELPAS.
Performance Objective 1: By the end of the 2018-19 school year, 90% of staff will have demonstrated growth in supporting student achievement byobtaining a rating of proficient or higher on their summative evaluations.
Evaluation Data Source(s) 1: Summative evaluationsEnrichment PlansCoaching Plans
Summative Evaluation 1: Significant progress made toward meeting Performance Objective
Next Year's Recommendation 1: Implementing our morning faculty meetings as professional learning
Strategy Description ELEMENTS Monitor Strategy's Expected Result/ImpactReviews
Formative SummativeNov Jan Mar June
Critical Success FactorsCSF 1 CSF 7
1) Coaching by admin and coaches
2.4, 2.5, 2.6 AdminCoachesTeachers
High level of teaching
Problem Statements: Student Academic Achievement 1 - School Processes & Programs 1, 4
= Accomplished = Continue/Modify = No Progress = Discontinue
Performance Objective 1 Problem Statements:
Student Academic AchievementProblem Statement 1: Teaching has changed over the decades, and we need to find better teaching strategies to meet differentiated needs of students. Root Cause 1: There have not beenconsistent opportunities to learn specific grade and content area strategies.
School Processes & ProgramsProblem Statement 1: There is a lack of rigorous use of materials and strategies supported by scientifically based research. Root Cause 1: Teachers are having to use standards fromlower grades to reteach since students are not coming at grade level.Problem Statement 4: When appropriate, technology is not consistently being used to support instruction and learning. Root Cause 4: There is a learning curve that requires time to learnand implement technology.
Parmley ElementaryGenerated by Plan4Learning.com 28 of 48
Campus #170-904-101February 4, 2020 3:03 pm
18-19 AAR Page 133

Goal 3: Throughout the year, all staff will be prepared to support student achievement as measured by walkthrough data, benchmarks, STAAR, andTELPAS.
Performance Objective 2: By the end of the 2018-19 school year, we will improve teacher retention by decreasing the turnover rate of 30% to 15% asmeasured by the number of resignation/retirement numbers.
Evaluation Data Source(s) 2: Retirement Resignation lettersOpen Positions
Summative Evaluation 2: Some progress made toward meeting Performance Objective
Next Year's Recommendation 2: Continue to build teacher capacity
Strategy Description ELEMENTS Monitor Strategy's Expected Result/ImpactReviews
Formative SummativeNov Jan Mar June
Critical Success FactorsCSF 6 CSF 7
1) Improve culture and climate
2.4, 2.5, 2.6 TeachersAdminCoachesStudents
= Accomplished = Continue/Modify = No Progress = Discontinue
Parmley ElementaryGenerated by Plan4Learning.com 29 of 48
Campus #170-904-101February 4, 2020 3:03 pm
18-19 AAR Page 134

Goal 3: Throughout the year, all staff will be prepared to support student achievement as measured by walkthrough data, benchmarks, STAAR, andTELPAS.
Performance Objective 3: By the end of the 2018-19 school year, 95% of the staff will have an ESL certification as measured by the number of teacherswith a valid ESL certificate.
Evaluation Data Source(s) 3: SBEC certification checks
Summative Evaluation 3: Some progress made toward meeting Performance Objective
Next Year's Recommendation 3: Continue to encourage ESL certification
Strategy Description ELEMENTS Monitor Strategy's Expected Result/ImpactReviews
Formative SummativeNov Jan Mar June
Critical Success FactorsCSF 7
1) Classes offered through Region VI
2.4, 2.5, 2.6 Admin
Problem Statements: Student Academic Achievement 1 - School Processes & Programs 1
= Accomplished = Continue/Modify = No Progress = Discontinue
Performance Objective 3 Problem Statements:
Student Academic AchievementProblem Statement 1: Teaching has changed over the decades, and we need to find better teaching strategies to meet differentiated needs of students. Root Cause 1: There have not beenconsistent opportunities to learn specific grade and content area strategies.
School Processes & ProgramsProblem Statement 1: There is a lack of rigorous use of materials and strategies supported by scientifically based research. Root Cause 1: Teachers are having to use standards fromlower grades to reteach since students are not coming at grade level.
Parmley ElementaryGenerated by Plan4Learning.com 30 of 48
Campus #170-904-101February 4, 2020 3:03 pm
18-19 AAR Page 135
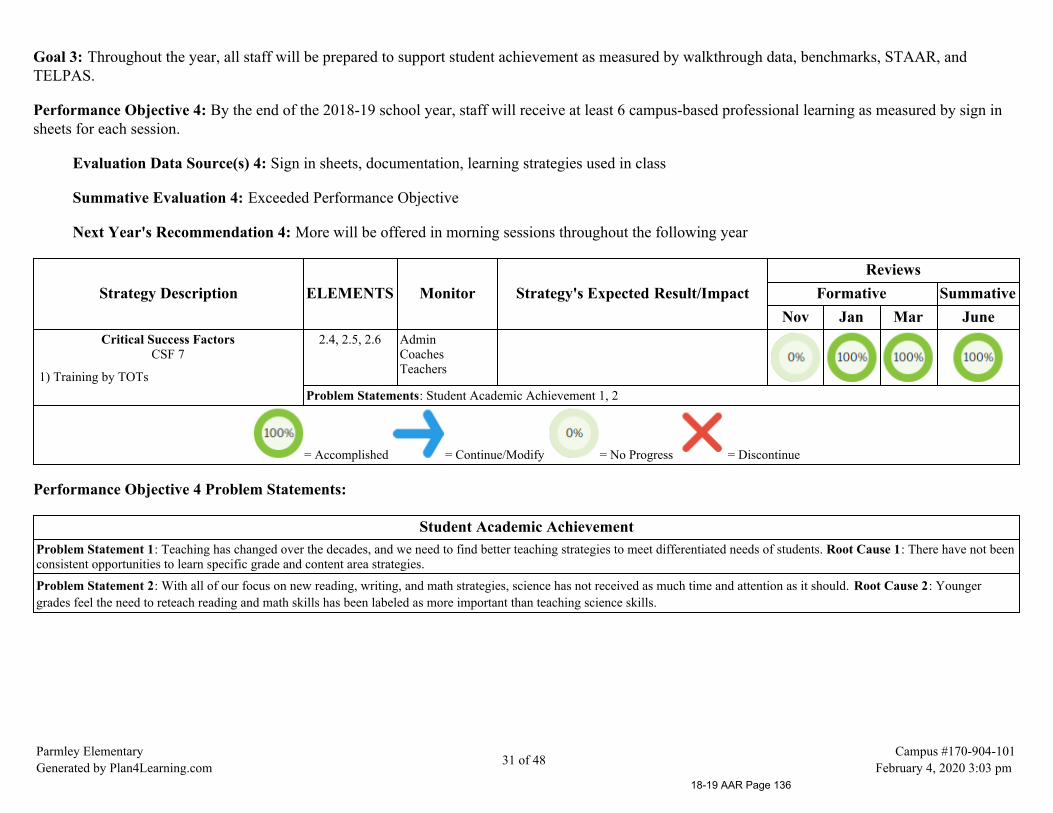
Goal 3: Throughout the year, all staff will be prepared to support student achievement as measured by walkthrough data, benchmarks, STAAR, andTELPAS.
Performance Objective 4: By the end of the 2018-19 school year, staff will receive at least 6 campus-based professional learning as measured by sign insheets for each session.
Evaluation Data Source(s) 4: Sign in sheets, documentation, learning strategies used in class
Summative Evaluation 4: Exceeded Performance Objective
Next Year's Recommendation 4: More will be offered in morning sessions throughout the following year
Strategy Description ELEMENTS Monitor Strategy's Expected Result/ImpactReviews
Formative SummativeNov Jan Mar June
Critical Success FactorsCSF 7
1) Training by TOTs
2.4, 2.5, 2.6 AdminCoachesTeachers
Problem Statements: Student Academic Achievement 1, 2
= Accomplished = Continue/Modify = No Progress = Discontinue
Performance Objective 4 Problem Statements:
Student Academic AchievementProblem Statement 1: Teaching has changed over the decades, and we need to find better teaching strategies to meet differentiated needs of students. Root Cause 1: There have not beenconsistent opportunities to learn specific grade and content area strategies.
Problem Statement 2: With all of our focus on new reading, writing, and math strategies, science has not received as much time and attention as it should. Root Cause 2: Youngergrades feel the need to reteach reading and math skills has been labeled as more important than teaching science skills.
Parmley ElementaryGenerated by Plan4Learning.com 31 of 48
Campus #170-904-101February 4, 2020 3:03 pm
18-19 AAR Page 136

Goal 3: Throughout the year, all staff will be prepared to support student achievement as measured by walkthrough data, benchmarks, STAAR, andTELPAS.
Performance Objective 5: By the end of the year, reading teachers in grades K-5 will receive coaching and instructional strategies to assist them withreading instruction as measured by student achievement scores.
Evaluation Data Source(s) 5: STAARMelissa Leach Consulting feedback
Summative Evaluation 5: Met Performance Objective
Strategy Description ELEMENTS Monitor Strategy's Expected Result/ImpactReviews
Formative SummativeNov Jan Mar June
PBMASCritical Success Factors
CSF 1 CSF 7
1) Melissa Leach Consulting and Coaching
2.4, 2.5, 2.6 AdminCoaches
Guided Reading conducted with fidelity withstrategy groups.RtI intervention
Problem Statements: Student Academic Achievement 1 - School Processes & Programs 1Funding Sources: 211 - Title 1-A - 10733.00
= Accomplished = Continue/Modify = No Progress = Discontinue
Performance Objective 5 Problem Statements:
Student Academic AchievementProblem Statement 1: Teaching has changed over the decades, and we need to find better teaching strategies to meet differentiated needs of students. Root Cause 1: There have not beenconsistent opportunities to learn specific grade and content area strategies.
School Processes & ProgramsProblem Statement 1: There is a lack of rigorous use of materials and strategies supported by scientifically based research. Root Cause 1: Teachers are having to use standards fromlower grades to reteach since students are not coming at grade level.
Parmley ElementaryGenerated by Plan4Learning.com 32 of 48
Campus #170-904-101February 4, 2020 3:03 pm
18-19 AAR Page 137

Goal 3: Throughout the year, all staff will be prepared to support student achievement as measured by walkthrough data, benchmarks, STAAR, andTELPAS.
Performance Objective 6: By the end of the year, teachers will use technology to help students level up at least one year.
Evaluation Data Source(s) 6: STAAR, Reading Levels, MAP
Summative Evaluation 6: Met Performance Objective
Strategy Description ELEMENTS Monitor Strategy's Expected Result/ImpactReviews
Formative SummativeNov Jan Mar June
Critical Success FactorsCSF 1 CSF 2 CSF 4
1) Teachers will use technology programs suchas Study Island, Exact Path, Stemscopes, Reflex,and Gynzy to help level up students.
2.4, 2.5, 2.6 TeachersAdmin
Increased skills and knowledge and engagementin class
Problem Statements: School Processes & Programs 4Funding Sources: 211 - Title 1-A - 5530.56
= Accomplished = Continue/Modify = No Progress = Discontinue
Performance Objective 6 Problem Statements:
School Processes & ProgramsProblem Statement 4: When appropriate, technology is not consistently being used to support instruction and learning. Root Cause 4: There is a learning curve that requires time to learnand implement technology.
Parmley ElementaryGenerated by Plan4Learning.com 33 of 48
Campus #170-904-101February 4, 2020 3:03 pm
18-19 AAR Page 138
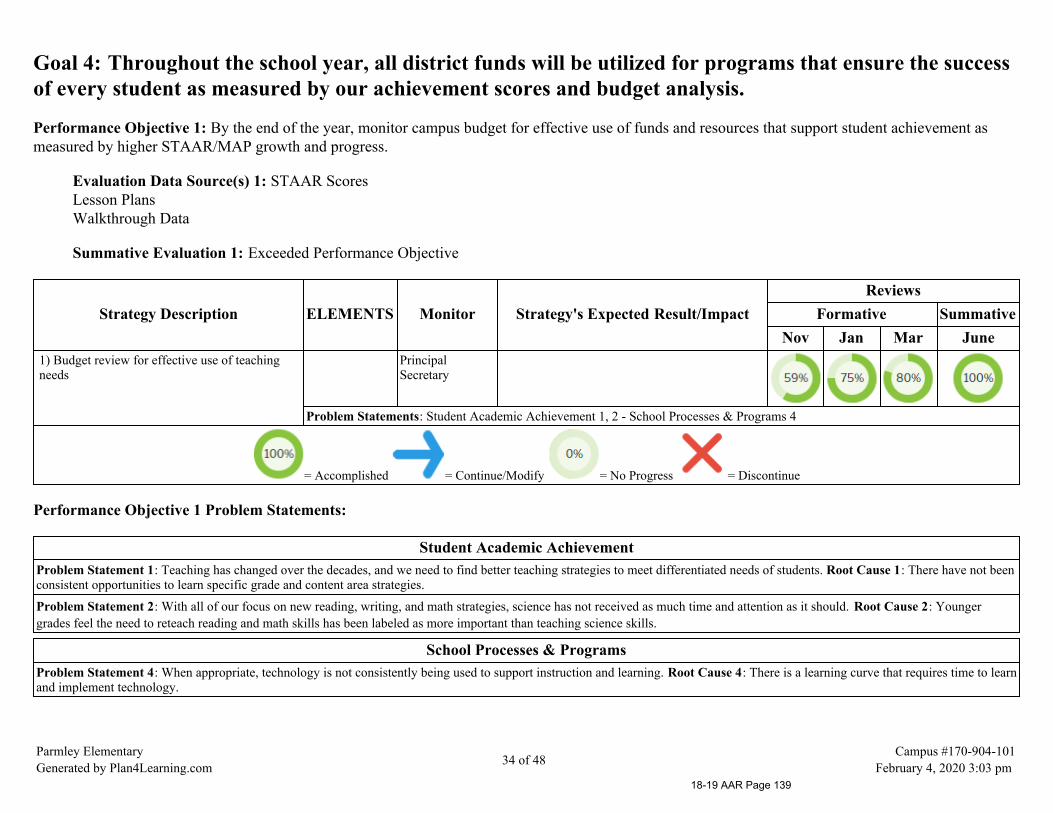
Goal 4: Throughout the school year, all district funds will be utilized for programs that ensure the successof every student as measured by our achievement scores and budget analysis.
Performance Objective 1: By the end of the year, monitor campus budget for effective use of funds and resources that support student achievement asmeasured by higher STAAR/MAP growth and progress.
Evaluation Data Source(s) 1: STAAR ScoresLesson PlansWalkthrough Data
Summative Evaluation 1: Exceeded Performance Objective
Strategy Description ELEMENTS Monitor Strategy's Expected Result/ImpactReviews
Formative SummativeNov Jan Mar June
1) Budget review for effective use of teachingneeds
PrincipalSecretary
Problem Statements: Student Academic Achievement 1, 2 - School Processes & Programs 4
= Accomplished = Continue/Modify = No Progress = Discontinue
Performance Objective 1 Problem Statements:
Student Academic AchievementProblem Statement 1: Teaching has changed over the decades, and we need to find better teaching strategies to meet differentiated needs of students. Root Cause 1: There have not beenconsistent opportunities to learn specific grade and content area strategies.
Problem Statement 2: With all of our focus on new reading, writing, and math strategies, science has not received as much time and attention as it should. Root Cause 2: Youngergrades feel the need to reteach reading and math skills has been labeled as more important than teaching science skills.
School Processes & ProgramsProblem Statement 4: When appropriate, technology is not consistently being used to support instruction and learning. Root Cause 4: There is a learning curve that requires time to learnand implement technology.
Parmley ElementaryGenerated by Plan4Learning.com 34 of 48
Campus #170-904-101February 4, 2020 3:03 pm
18-19 AAR Page 139
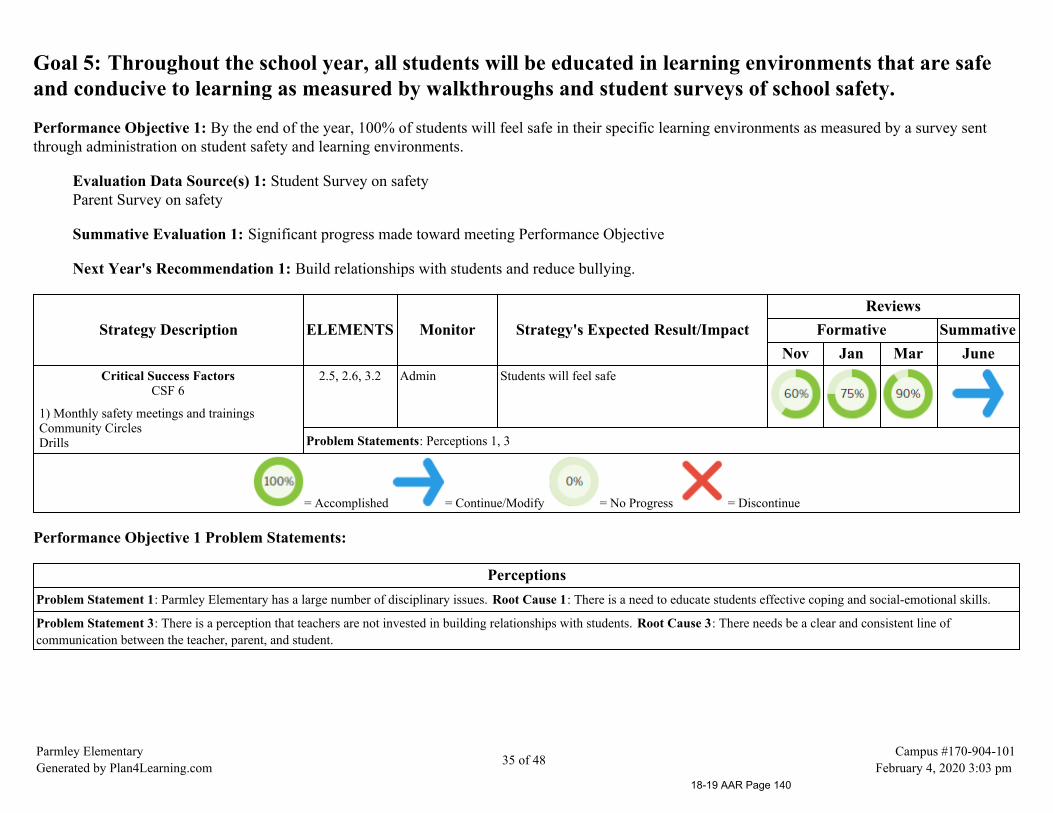
Goal 5: Throughout the school year, all students will be educated in learning environments that are safeand conducive to learning as measured by walkthroughs and student surveys of school safety.
Performance Objective 1: By the end of the year, 100% of students will feel safe in their specific learning environments as measured by a survey sentthrough administration on student safety and learning environments.
Evaluation Data Source(s) 1: Student Survey on safetyParent Survey on safety
Summative Evaluation 1: Significant progress made toward meeting Performance Objective
Next Year's Recommendation 1: Build relationships with students and reduce bullying.
Strategy Description ELEMENTS Monitor Strategy's Expected Result/ImpactReviews
Formative SummativeNov Jan Mar June
Critical Success FactorsCSF 6
1) Monthly safety meetings and trainingsCommunity CirclesDrills
2.5, 2.6, 3.2 Admin Students will feel safe
Problem Statements: Perceptions 1, 3
= Accomplished = Continue/Modify = No Progress = Discontinue
Performance Objective 1 Problem Statements:
PerceptionsProblem Statement 1: Parmley Elementary has a large number of disciplinary issues. Root Cause 1: There is a need to educate students effective coping and social-emotional skills.
Problem Statement 3: There is a perception that teachers are not invested in building relationships with students. Root Cause 3: There needs be a clear and consistent line ofcommunication between the teacher, parent, and student.
Parmley ElementaryGenerated by Plan4Learning.com 35 of 48
Campus #170-904-101February 4, 2020 3:03 pm
18-19 AAR Page 140
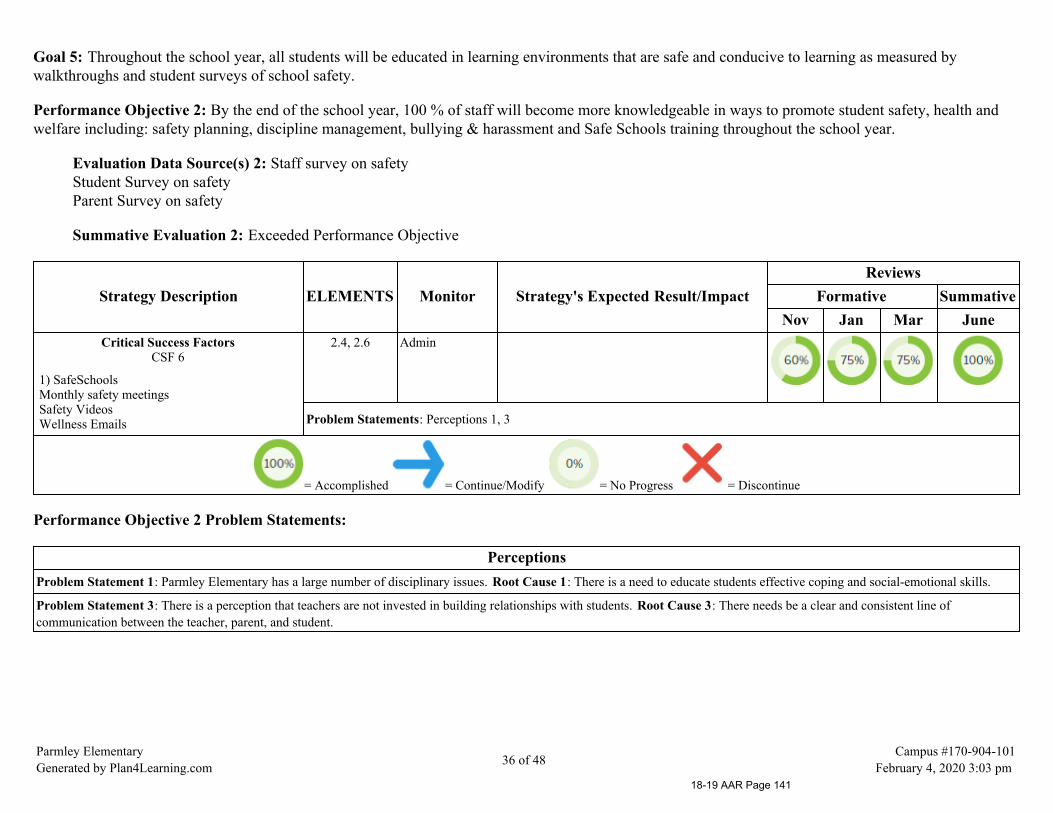
Goal 5: Throughout the school year, all students will be educated in learning environments that are safe and conducive to learning as measured bywalkthroughs and student surveys of school safety.
Performance Objective 2: By the end of the school year, 100 % of staff will become more knowledgeable in ways to promote student safety, health andwelfare including: safety planning, discipline management, bullying & harassment and Safe Schools training throughout the school year.
Evaluation Data Source(s) 2: Staff survey on safetyStudent Survey on safetyParent Survey on safety
Summative Evaluation 2: Exceeded Performance Objective
Strategy Description ELEMENTS Monitor Strategy's Expected Result/ImpactReviews
Formative SummativeNov Jan Mar June
Critical Success FactorsCSF 6
1) SafeSchoolsMonthly safety meetingsSafety VideosWellness Emails
2.4, 2.6 Admin
Problem Statements: Perceptions 1, 3
= Accomplished = Continue/Modify = No Progress = Discontinue
Performance Objective 2 Problem Statements:
PerceptionsProblem Statement 1: Parmley Elementary has a large number of disciplinary issues. Root Cause 1: There is a need to educate students effective coping and social-emotional skills.
Problem Statement 3: There is a perception that teachers are not invested in building relationships with students. Root Cause 3: There needs be a clear and consistent line ofcommunication between the teacher, parent, and student.
Parmley ElementaryGenerated by Plan4Learning.com 36 of 48
Campus #170-904-101February 4, 2020 3:03 pm
18-19 AAR Page 141

Goal 5: Throughout the school year, all students will be educated in learning environments that are safe and conducive to learning as measured bywalkthroughs and student surveys of school safety.
Performance Objective 3: By June 2019, the staff will create a safe learning environment that utilizes Positive Behavior Interventions and Supports (PBIS)through systematically continuing the following activities:Modeling the PROUD expectations, student recognitions, class Dojo, Character Education, lunch Bunch, Campus Anti-Bullying Plan, Ned Show,Community Circles
Evaluation Data Source(s) 3: Staff Surveys on safetyStudent Surveys on safetyParent Surveys on safety
Summative Evaluation 3: Significant progress made toward meeting Performance Objective
Next Year's Recommendation 3: Implement campus wide PBIS interventions and discipline
Strategy Description ELEMENTS Monitor Strategy's Expected Result/ImpactReviews
Formative SummativeNov Jan Mar June
Critical Success FactorsCSF 1 CSF 6
1) Ned ShowCommunity CirclesPBIS meetingsPROUD posters in classroomsDojo
2.4, 2.6 AdminPBIS TeamCounselor
Better disciplineGraduating out of PAWS
Problem Statements: Perceptions 1, 3
= Accomplished = Continue/Modify = No Progress = Discontinue
Performance Objective 3 Problem Statements:
PerceptionsProblem Statement 1: Parmley Elementary has a large number of disciplinary issues. Root Cause 1: There is a need to educate students effective coping and social-emotional skills.
Problem Statement 3: There is a perception that teachers are not invested in building relationships with students. Root Cause 3: There needs be a clear and consistent line ofcommunication between the teacher, parent, and student.
Parmley ElementaryGenerated by Plan4Learning.com 37 of 48
Campus #170-904-101February 4, 2020 3:03 pm
18-19 AAR Page 142

Goal 5: Throughout the school year, all students will be educated in learning environments that are safe and conducive to learning as measured bywalkthroughs and student surveys of school safety.
Performance Objective 4: By the end of the school year, 100% of staff and students will understand the policies and procedures for emergencyprocedures, by the being provided practice time of emergency procedures, including AED drills by the Campus Emergency Response Team(ERT) atrequired times.
Evaluation Data Source(s) 4: Staff Surveys on safetyStudent Surveys on safetyParent Surveys on safety
Summative Evaluation 4: Exceeded Performance Objective
Strategy Description ELEMENTS Monitor Strategy's Expected Result/ImpactReviews
Formative SummativeNov Jan Mar June
Critical Success FactorsCSF 6
1) Safety Meetings and drills
2.6 Admin Safer community
Problem Statements: Perceptions 1, 3
= Accomplished = Continue/Modify = No Progress = Discontinue
Performance Objective 4 Problem Statements:
PerceptionsProblem Statement 1: Parmley Elementary has a large number of disciplinary issues. Root Cause 1: There is a need to educate students effective coping and social-emotional skills.
Problem Statement 3: There is a perception that teachers are not invested in building relationships with students. Root Cause 3: There needs be a clear and consistent line ofcommunication between the teacher, parent, and student.
Parmley ElementaryGenerated by Plan4Learning.com 38 of 48
Campus #170-904-101February 4, 2020 3:03 pm
18-19 AAR Page 143
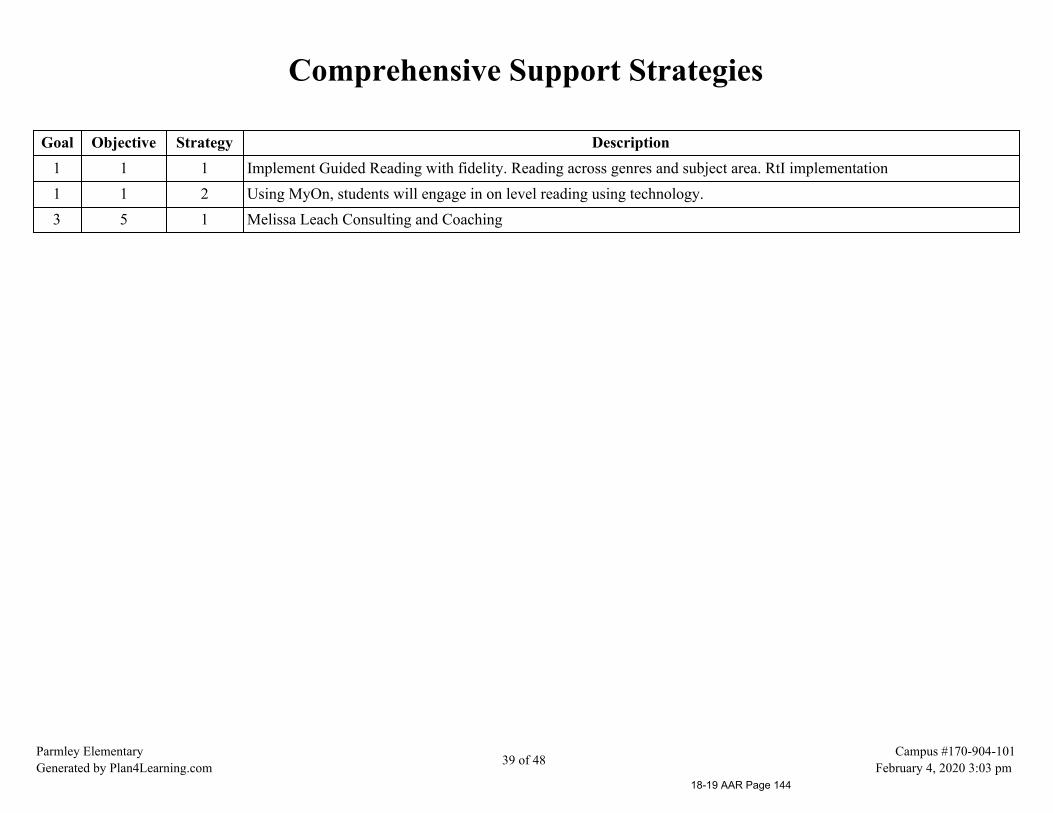
Comprehensive Support Strategies
Goal Objective Strategy Description1 1 1 Implement Guided Reading with fidelity. Reading across genres and subject area. RtI implementation1 1 2 Using MyOn, students will engage in on level reading using technology.3 5 1 Melissa Leach Consulting and Coaching
Parmley ElementaryGenerated by Plan4Learning.com 39 of 48
Campus #170-904-101February 4, 2020 3:03 pm
18-19 AAR Page 144
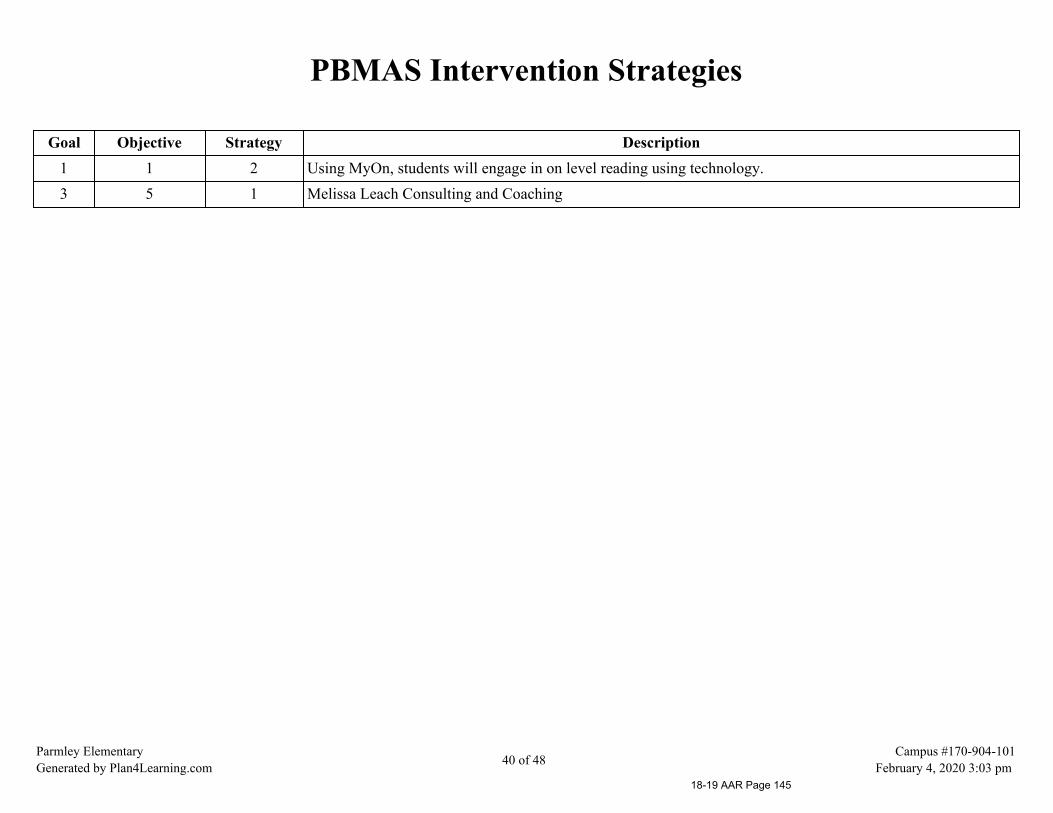
PBMAS Intervention Strategies
Goal Objective Strategy Description1 1 2 Using MyOn, students will engage in on level reading using technology.3 5 1 Melissa Leach Consulting and Coaching
Parmley ElementaryGenerated by Plan4Learning.com 40 of 48
Campus #170-904-101February 4, 2020 3:03 pm
18-19 AAR Page 145
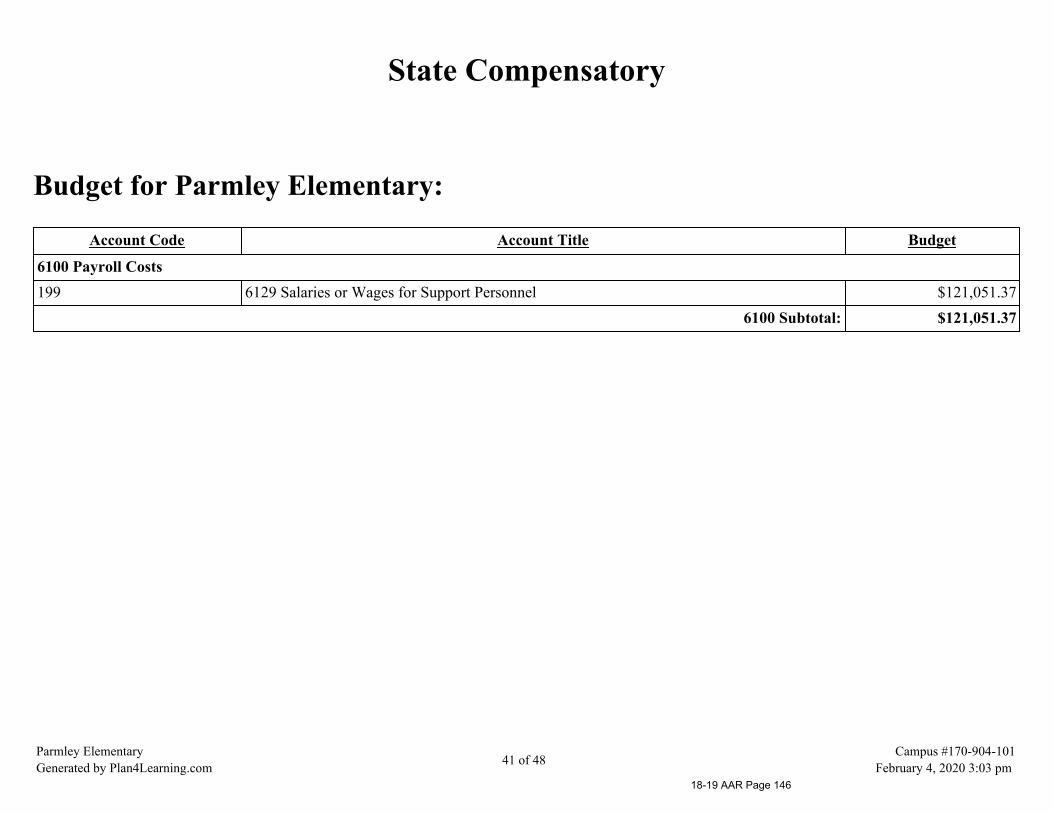
State Compensatory
Budget for Parmley Elementary:
Account Code Account Title Budget
6100 Payroll Costs199 6129 Salaries or Wages for Support Personnel $121,051.37
6100 Subtotal: $121,051.37
Parmley ElementaryGenerated by Plan4Learning.com 41 of 48
Campus #170-904-101February 4, 2020 3:03 pm
18-19 AAR Page 146

Personnel for Parmley Elementary:
Name Position Program FTE
James Burns Instructional AidMelanie Hooks Instructional AidMindy Miller Instructional AidPatricia Debrow Dyslexia SpecialistVirginia Straughter Instructional Aid
Parmley ElementaryGenerated by Plan4Learning.com 42 of 48
Campus #170-904-101February 4, 2020 3:03 pm
18-19 AAR Page 147
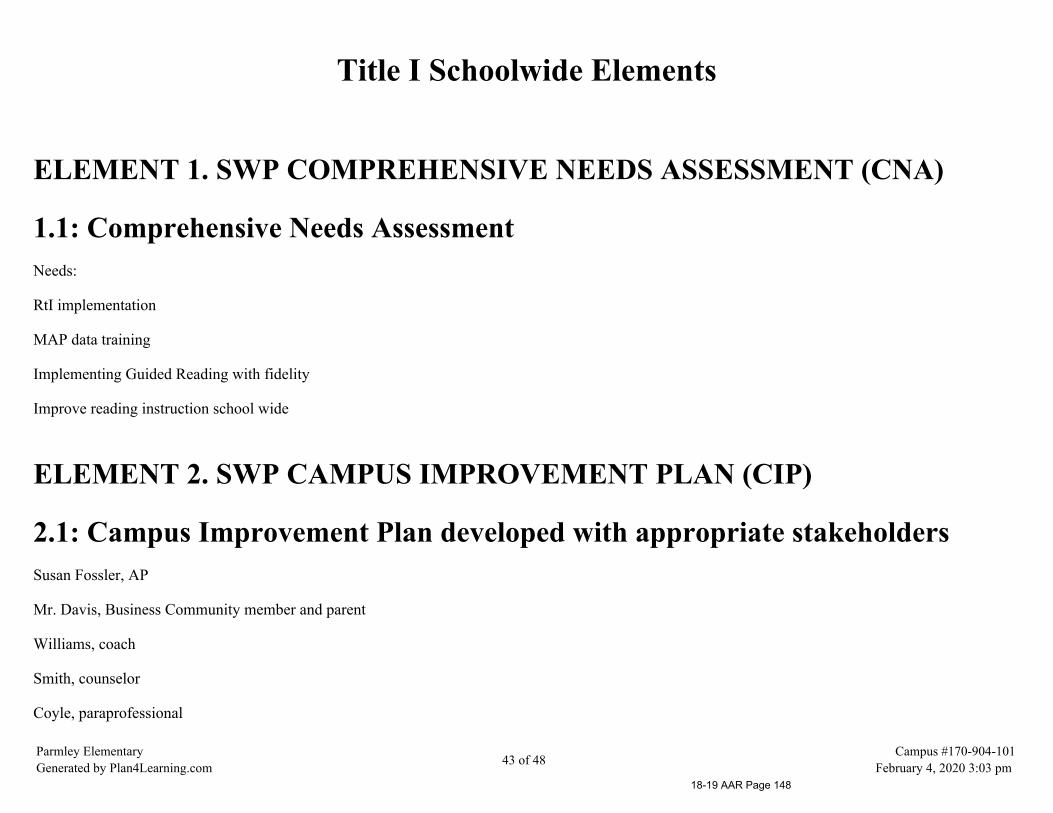
Title I Schoolwide Elements
ELEMENT 1. SWP COMPREHENSIVE NEEDS ASSESSMENT (CNA)
1.1: Comprehensive Needs AssessmentNeeds:
RtI implementation
MAP data training
Implementing Guided Reading with fidelity
Improve reading instruction school wide
ELEMENT 2. SWP CAMPUS IMPROVEMENT PLAN (CIP)
2.1: Campus Improvement Plan developed with appropriate stakeholdersSusan Fossler, AP
Mr. Davis, Business Community member and parent
Williams, coach
Smith, counselor
Coyle, paraprofessional
Parmley ElementaryGenerated by Plan4Learning.com 43 of 48
Campus #170-904-101February 4, 2020 3:03 pm
18-19 AAR Page 148
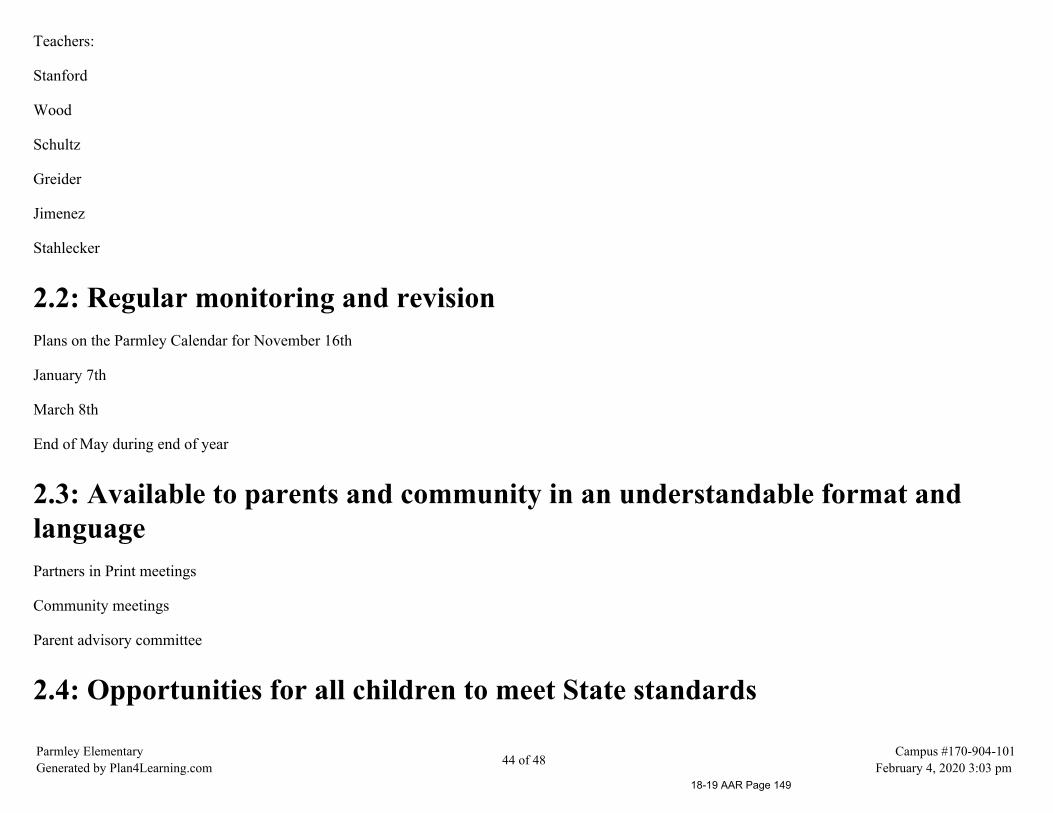
Teachers:
Stanford
Wood
Schultz
Greider
Jimenez
Stahlecker
2.2: Regular monitoring and revisionPlans on the Parmley Calendar for November 16th
January 7th
March 8th
End of May during end of year
2.3: Available to parents and community in an understandable format andlanguagePartners in Print meetings
Community meetings
Parent advisory committee
2.4: Opportunities for all children to meet State standards
Parmley ElementaryGenerated by Plan4Learning.com 44 of 48
Campus #170-904-101February 4, 2020 3:03 pm
18-19 AAR Page 149

Community Circles, building relationships
2.5: Increased learning time and well-rounded educationWorking with teachers to implement Guided reading with fidelity
2.6: Address needs of all students, particularly at-riskCommunity Circles, differentiation
ELEMENT 3. PARENT AND FAMILY ENGAGEMENT (PFE)
3.1: Develop and distribute Parent and Family Engagement PolicyWorking with staff to create a compact; will email to staff.
3.2: Offer flexible number of parent involvement meetingsMonthly meetings with Partners in Print as well as spring curriculum nights
Parmley ElementaryGenerated by Plan4Learning.com 45 of 48
Campus #170-904-101February 4, 2020 3:03 pm
18-19 AAR Page 150

Title I Personnel
Name Position Program FTE
Heather Paugh Instructional Coach Title I 100Lydia Klespis Instructional Coach Title I 100Trevor Williams Technology Innovation Coach Title I 100
Parmley ElementaryGenerated by Plan4Learning.com 46 of 48
Campus #170-904-101February 4, 2020 3:03 pm
18-19 AAR Page 151

Campus Education Improvement Committee
Committee Role Name PositionClassroom Teacher Charlotte WoodCampus Professional Charlene BarbaraClassroom Teacher Christy BahnClassroom Teacher Dana SchultzClassroom Teacher Emily DeanNon-classroom Professional Heather PaughAdministrator Kelley MooreNon-classroom Professional Lydia KlespisClassroom Teacher Sarah WagnerAdministrator Susan FosslerClassroom Teacher Theresa MelanconNon-classroom Professional Trevor WilliamsParent Julie Odom ParentParent Daralyn McGuffin
Parmley ElementaryGenerated by Plan4Learning.com 47 of 48
Campus #170-904-101February 4, 2020 3:03 pm
18-19 AAR Page 152
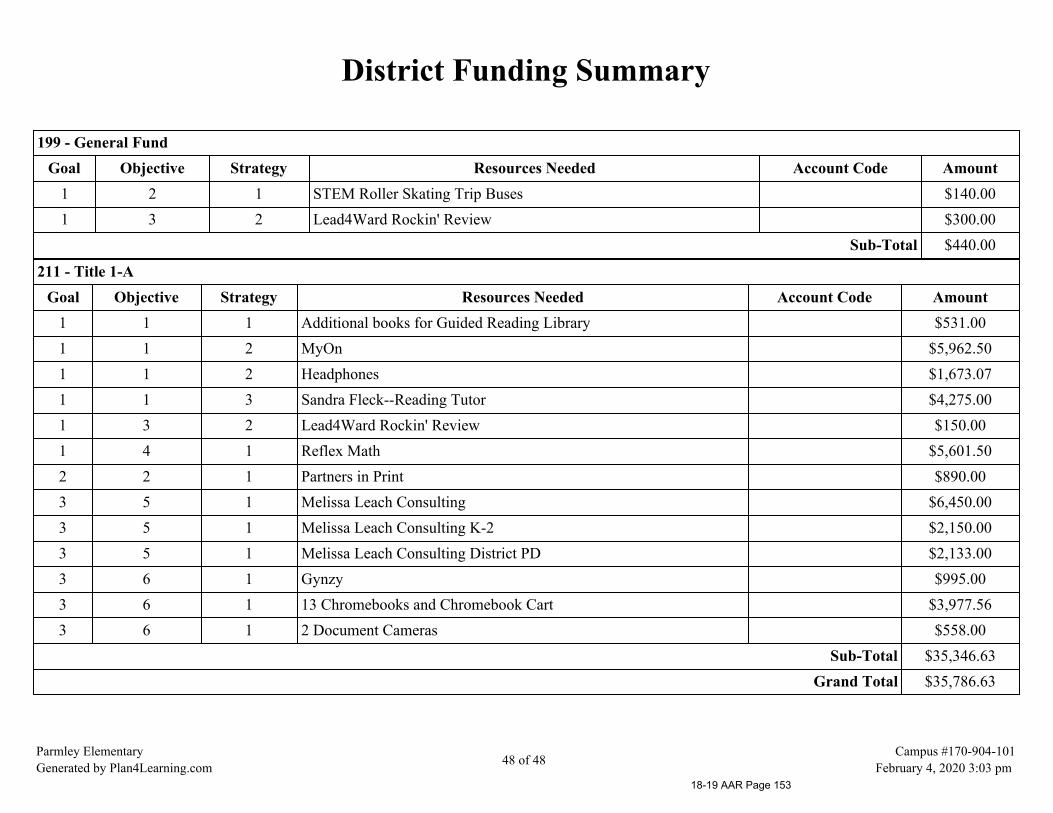
District Funding Summary
199 - General FundGoal Objective Strategy Resources Needed Account Code Amount
1 2 1 STEM Roller Skating Trip Buses $140.001 3 2 Lead4Ward Rockin' Review $300.00
Sub-Total $440.00
211 - Title 1-AGoal Objective Strategy Resources Needed Account Code Amount
1 1 1 Additional books for Guided Reading Library $531.001 1 2 MyOn $5,962.501 1 2 Headphones $1,673.071 1 3 Sandra Fleck--Reading Tutor $4,275.001 3 2 Lead4Ward Rockin' Review $150.001 4 1 Reflex Math $5,601.502 2 1 Partners in Print $890.003 5 1 Melissa Leach Consulting $6,450.003 5 1 Melissa Leach Consulting K-2 $2,150.003 5 1 Melissa Leach Consulting District PD $2,133.003 6 1 Gynzy $995.003 6 1 13 Chromebooks and Chromebook Cart $3,977.563 6 1 2 Document Cameras $558.00
Sub-Total $35,346.63Grand Total $35,786.63
Parmley ElementaryGenerated by Plan4Learning.com 48 of 48
Campus #170-904-101February 4, 2020 3:03 pm
18-19 AAR Page 153

Willis Independent School District
Hardy Elementary
2018-2019 Accountability Rating: Met Standard
Hardy ElementaryGenerated by Plan4Learning.com 1 of 40 February 4, 2020 3:02 pm
18-19 AAR Page 154
Mission StatementThe mission of C.C. Hardy Elementary is to provide a safe learning environment where all children are presented with opportunities to become life long
learners. We are a team dedicated to developing and challenging all students to reach their maximum potential.
Hardy ElementaryGenerated by Plan4Learning.com 2 of 40 February 4, 2020 3:02 pm
18-19 AAR Page 155
Table of Contents
Comprehensive Needs Assessment 4Demographics 4Student Achievement 5School Culture and Climate 7Staff Quality, Recruitment, and Retention 8Curriculum, Instruction, and Assessment 10Parent and Community Engagement 11School Context and Organization 12Technology 13
Priority Problem Statements 14Comprehensive Needs Assessment Data Documentation 17Goals 19
Goal 1: All students will reach high academic standards, at a minimum attaining proficiency or better on state assessments. 19Goal 2: All parents will participate in regular, two-way, and meaningful communication involving student academic learning and school activities. 26Goal 3: All staff will be prepared to support student achievement. 29Goal 4: All district funds will be utilized for programs that ensure the success of every student. 32Goal 5: All students will be educated in learning environments that are safe and conducive to learning. 33Goal 6: To create a climate where all students and staff are empowered, valued and excited about student achievement. 34
Comprehensive Support Strategies 37Title I Personnel 382018-2019 Campus Improvement Team 39District Funding Summary 40
Hardy ElementaryGenerated by Plan4Learning.com 3 of 40 February 4, 2020 3:02 pm
18-19 AAR Page 156

Comprehensive Needs Assessment
Demographics
Demographics Summary
Student Demographics (2018 - 2019 Preliminary Fall PEIMS file loaded 09/12/2018) Count PercentGenderFemale 287 47.52%Male 317 52.48%EthnicityHispanic-Latino 326 53.97%RaceAmerican Indian - Alaskan Native 1 0.17%Asian 1 0.17%Black - African American 59 9.77%Native Hawaiian - Pacific Islander 0 0.00%White 192 31.79%Two-or-More 25 4.14%
Hardy ElementaryGenerated by Plan4Learning.com 4 of 40 February 4, 2020 3:02 pm
18-19 AAR Page 157

Student Achievement
Student Achievement Summary
Students at C.C. Hardy in grades 3-5 participated in the STAAR Assessment. The data reviewed is from the STAAR Cumulative Summary Report andincludes campus-wide results for Reading, Mathematics, Writing and Science. The disaggregation of the 2018 STAAR data indicated that there wasprogress made in the percentage of students who were classified as approaching, met, and mastered grade-level standards in the area of reading. Also, therewas a 7% increase in the students who approached and met grade-level standards on their writing STAAR assessment. There was a decline in the percentageof students who approached, met, and mastered grade-level standards in the area of science. Finally, there was a 10% decline in the number of students whomet grade-level standards on their Math STAAR assessment.
Approaches GradeLevel
Meets GradeLevel
Masters GradeLevel
17 18 17 18 17 18AllSubjects 64% 67% 31% 29% 11% 11%
Reading 62% 66% 28% 32% 12% 15%Math 75% 77% 41% 31% 15% 11%Writing 45% 52% 16% 23% 2% 4%Science 57% 55% 22% 14% 5% 3%
Student Achievement Strengths
From 2017 to 2018 there was an increase in the percentage of students who were classified as "approaching" grade-level in Reading, Math, andWritingFrom 2017 to 2018 there was a 7% increase in students who were classified as "approaching" and "meeting" grade-level standards on their WritingSTAAR assessment.CCH was ranked in quartile I in the "Accelerated Student Growth in ELA/Reading" indicator on the 2018 Distinction Designation Summary.
Problem Statements Identifying Student Achievement Needs
Hardy ElementaryGenerated by Plan4Learning.com 5 of 40 February 4, 2020 3:02 pm
18-19 AAR Page 158
Problem Statement 1: Students not receiving the necessary individualized intervention in a timely manner. Root Cause: There is no clear, definedcampus-wide RTI system for students and teachers.
Problem Statement 2: Implementation of items discussed in meetings Root Cause: Inconsistency in best practice and good instruction.
Hardy ElementaryGenerated by Plan4Learning.com 6 of 40 February 4, 2020 3:02 pm
18-19 AAR Page 159

School Culture and Climate
School Culture and Climate Summary
When conducting the campus needs assessment with the CCH site-based committee, feedback suggested that Hardy has a positive school climate. Mostcommittee members mentioned that CCH is a fun, warm, and welcoming campus; where most parent-teacher-student interactions are positive andproductive. There were comments/feedback that mentioned students being picked-on and classroom disruption as being an area of concern. Also, the needfor a support system for new students at CCH is something that was mentioned in the CNA.
Overall, the CEIC considered the campus to be conducive for student learning. Also, they said Hardy is a safe and positive campus that offers students,staff, and parents the opportunity to be involved in student academics and extra-curricular activities (i.e. student clubs/organizations and monthly familyevents.)
School Culture and Climate Strengths
-Safe environment
-Teacher-student interaction
-staff-staff interaction
Problem Statements Identifying School Culture and Climate Needs
Problem Statement 1: Physical altercations between students and classroom disruption Root Cause: Students are seeking attention from their peers.
Hardy ElementaryGenerated by Plan4Learning.com 7 of 40 February 4, 2020 3:02 pm
18-19 AAR Page 160
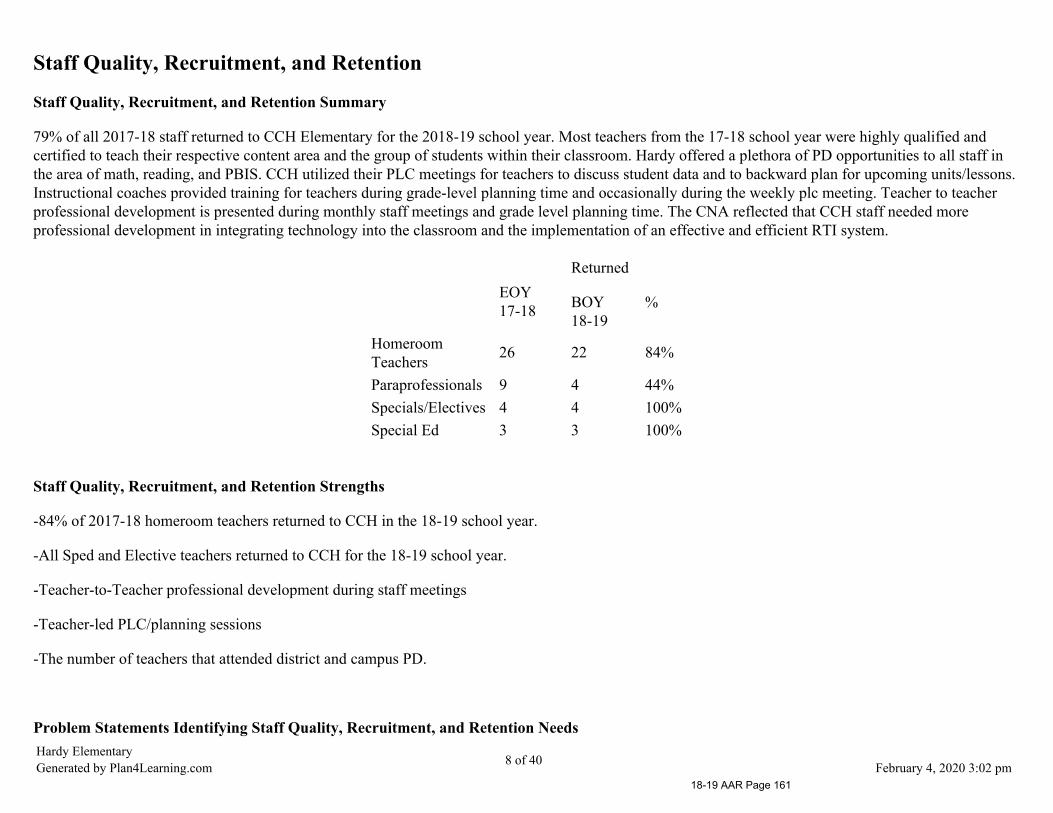
Staff Quality, Recruitment, and Retention
Staff Quality, Recruitment, and Retention Summary
79% of all 2017-18 staff returned to CCH Elementary for the 2018-19 school year. Most teachers from the 17-18 school year were highly qualified andcertified to teach their respective content area and the group of students within their classroom. Hardy offered a plethora of PD opportunities to all staff inthe area of math, reading, and PBIS. CCH utilized their PLC meetings for teachers to discuss student data and to backward plan for upcoming units/lessons.Instructional coaches provided training for teachers during grade-level planning time and occasionally during the weekly plc meeting. Teacher to teacherprofessional development is presented during monthly staff meetings and grade level planning time. The CNA reflected that CCH staff needed moreprofessional development in integrating technology into the classroom and the implementation of an effective and efficient RTI system.
EOY17-18
Returned
BOY18-19
%
HomeroomTeachers 26 22 84%
Paraprofessionals 9 4 44%Specials/Electives 4 4 100%Special Ed 3 3 100%
Staff Quality, Recruitment, and Retention Strengths
-84% of 2017-18 homeroom teachers returned to CCH in the 18-19 school year.
-All Sped and Elective teachers returned to CCH for the 18-19 school year.
-Teacher-to-Teacher professional development during staff meetings
-Teacher-led PLC/planning sessions
-The number of teachers that attended district and campus PD.
Problem Statements Identifying Staff Quality, Recruitment, and Retention NeedsHardy ElementaryGenerated by Plan4Learning.com 8 of 40 February 4, 2020 3:02 pm
18-19 AAR Page 161
Problem Statement 1: Three bilingual classrooms were not being served by bilingual certified teachers. Root Cause: Teachers lack the knowledge and/orskills necessary to pass their Bilingual Target Language Proficiency Test
Problem Statement 2: CCH did not implement an effective and efficient, campus-wide RTI system Root Cause: Lack of knowledge and experience withRTI.
Hardy ElementaryGenerated by Plan4Learning.com 9 of 40 February 4, 2020 3:02 pm
18-19 AAR Page 162

Curriculum, Instruction, and Assessment
Curriculum, Instruction, and Assessment Summary
According to CCH's campus needs assessment, participants shared the common belief that most CCH teachers do implement the district's curriculum withfidelity. Also, many mentioned that they use planning time to "think" of differentiating strategies. Further, a teacher's guided reading group was the onlydifferentiated/intervention strategy shared on the CCH CNA. Also, the CNA data suggested that CCH teachers monitor their students' data, but students arenot responsible for monitoring their own data.
Curriculum, Instruction, and Assessment Strengths
-Backward planning process being implemented
Problem Statements Identifying Curriculum, Instruction, and Assessment Needs
Problem Statement 1: Not all teachers implemented the district's curriculum and initiatives with fidelity. Root Cause: A lot of new teachers who are newto the teaching profession and who are unfamiliar with state standards and best practices.
Problem Statement 2: Not all teachers implemented the district's curriculum and initiatives with fidelity. Root Cause: Lack of resources and training thatteaches how to incorporate technology in core-content lessons, use effective questioning strategies, and other instructional strategies
Problem Statement 3: Students are not responsible for monitoring their own data. Root Cause: No system that allows students to own their data.
Problem Statement 4: Not all teachers are intentional about scaffolding and differentiating instruction. Root Cause: Lack of training during grade level plcand planning time that focuses on differentiating instructional strategies.
Hardy ElementaryGenerated by Plan4Learning.com 10 of 40 February 4, 2020 3:02 pm
18-19 AAR Page 163
Parent and Community Engagement
Parent and Community Engagement Summary
Hardy offered a variety of parent and community enagements throughout the 2017-18 school year. It partnered with the ARK church to provide freeproduce from the Montgomery County Food Bank to all of its students and families. CCH hosted a family event each month of the school year.
Parent and Community Engagement Strengths
A high percentage of parents were present at monthly family events (Nachos & Number, Grandparents Luncheon, Painting with a Spin, Books and BlueBell, Career Hour, etc.)
Problem Statements Identifying Parent and Community Engagement Needs
Problem Statement 1: Lack of parental involvement with our hispanic population of parents. Root Cause: Effective communication strategies to notifySpanish speaking parents of all school events.
Problem Statement 2: Minimum amount of parent feedback (positive and constructive) received throughout the year. Root Cause: No MOY or EOYdistrict/campus parent survey
Hardy ElementaryGenerated by Plan4Learning.com 11 of 40 February 4, 2020 3:02 pm
18-19 AAR Page 164
School Context and Organization
School Context and Organization Summary
The vision of Hardy Elementary is to be the elementary campus of choice in WISD. All students and staff are aware of the campus' three expectations (BeSafe, Be Responsible, Be Respectful). Teachers were encouraged to give constructive feedback through their team leaders. Team leader share feedback withHardy's leadership team at their monthly TL meeting. Teachers are also encouraged to share their feedback, positive or negative, in the "suggestion box"that in located it the teacher's lounge. All of Hardy's educators play an active role in their grade-level planning sessions and plc meetings. Hardy providesafter-school clubs such as (art, book club, step team, hardy helping hearts, etc. ) to all of CCH students. The master schedule is considered to be a work inprogress. There are critical grade levels (3rd-5th) where instructional minutes are being decreased or constantly interrupted.
School Context and Organization Strengths
-Student Clubs and Organization
-Teacher having a voice in decision making and school practices
-Leadership opputunities for all teachers
Problem Statements Identifying School Context and Organization Needs
Problem Statement 1: Limited leadership opportunities for students. Root Cause: No time within instructional day to provide students leadershipopportunities consistently.
Problem Statement 2: Students having a voice in the decision making process and school practices. Root Cause: No organization implemented to fosterstudents having a choice in the decision making process.
Problem Statement 3: Too many interruptions in grades 3-5 instructional minutes. Root Cause: Master schedule that causes interruptions(specials/lunches) during the optimal time for learning in grade 3-5.
Hardy ElementaryGenerated by Plan4Learning.com 12 of 40 February 4, 2020 3:02 pm
18-19 AAR Page 165
Technology
Technology Summary
CNA data suggested that most school stakeholders understand the importance of technology in the classroom; however, they are unclear of the campus anddistricts expectations for the integrated use of technology. Most school technology devices were used to assess student learning and/or for the use ofstudents to enjoy online programs.
Technology Strengths
-One-to-One in grade 3-5
Problem Statements Identifying Technology Needs
Problem Statement 1: Teachers do not have a clear and accurate understanding of how technology is used to support instruction and learning Root Cause:Lack of relevant and meaningful training/coaching sessions for teachers.
Hardy ElementaryGenerated by Plan4Learning.com 13 of 40 February 4, 2020 3:02 pm
18-19 AAR Page 166
Priority Problem Statements
Problem Statement 1: Implementation of items discussed in meetingsRoot Cause 1: Inconsistency in best practice and good instruction.Problem Statement 1 Areas: Student Achievement
Problem Statement 2: Physical altercations between students and classroom disruptionRoot Cause 2: Students are seeking attention from their peers.Problem Statement 2 Areas: District Culture and Climate
Problem Statement 3: Students not receiving the necessary individualized intervention in a timely manner.Root Cause 3: There is no clear, defined campus-wide RTI system for students and teachers.Problem Statement 3 Areas: Student Achievement
Problem Statement 4: Three bilingual classrooms were not being served by bilingual certified teachers.Root Cause 4: Teachers lack the knowledge and/or skills necessary to pass their Bilingual Target Language Proficiency TestProblem Statement 4 Areas: Staff Quality, Recruitment, and Retention
Problem Statement 5: CCH did not implement an effective and efficient, campus-wide RTI systemRoot Cause 5: Lack of knowledge and experience with RTI.Problem Statement 5 Areas: Staff Quality, Recruitment, and Retention
Hardy ElementaryGenerated by Plan4Learning.com 14 of 40 February 4, 2020 3:02 pm
18-19 AAR Page 167

Problem Statement 6: Not all teachers implemented the district's curriculum and initiatives with fidelity.Root Cause 6: A lot of new teachers who are new to the teaching profession and who are unfamiliar with state standards and best practices.Problem Statement 6 Areas: Curriculum, Instruction, and Assessment
Problem Statement 7: Not all teachers are intentional about scaffolding and differentiating instruction.Root Cause 7: Lack of training during grade level plc and planning time that focuses on differentiating instructional strategies.Problem Statement 7 Areas: Curriculum, Instruction, and Assessment
Problem Statement 8: Students are not responsible for monitoring their own data.Root Cause 8: No system that allows students to own their data.Problem Statement 8 Areas: Curriculum, Instruction, and Assessment
Problem Statement 9: Lack of parental involvement with our hispanic population of parents.Root Cause 9: Effective communication strategies to notify Spanish speaking parents of all school events.Problem Statement 9 Areas: Parent and Community Engagement
Problem Statement 10: Limited leadership opportunities for students.Root Cause 10: No time within instructional day to provide students leadership opportunities consistently.Problem Statement 10 Areas: District Context and Organization
Problem Statement 11: Students having a voice in the decision making process and school practices.Root Cause 11: No organization implemented to foster students having a choice in the decision making process.Problem Statement 11 Areas: District Context and Organization
Hardy ElementaryGenerated by Plan4Learning.com 15 of 40 February 4, 2020 3:02 pm
18-19 AAR Page 168

Problem Statement 12: Too many interruptions in grades 3-5 instructional minutes.Root Cause 12: Master schedule that causes interruptions (specials/lunches) during the optimal time for learning in grade 3-5.Problem Statement 12 Areas: District Context and Organization
Problem Statement 13: Teachers do not have a clear and accurate understanding of how technology is used to support instruction and learningRoot Cause 13: Lack of relevant and meaningful training/coaching sessions for teachers.Problem Statement 13 Areas: Technology
Problem Statement 14: Minimum amount of parent feedback (positive and constructive) received throughout the year.Root Cause 14: No MOY or EOY district/campus parent surveyProblem Statement 14 Areas: Parent and Community Engagement
Hardy ElementaryGenerated by Plan4Learning.com 16 of 40 February 4, 2020 3:02 pm
18-19 AAR Page 169
Comprehensive Needs Assessment Data DocumentationThe following data were used to verify the comprehensive needs assessment analysis:
Improvement Planning Data
District goalsCampus goals
Accountability Data
Texas Academic Performance Report (TAPR) dataDomain 1 - Student AchievementDomain 2 - Student ProgressDomain 3 - Closing the GapsAccountability Distinction DesignationsFederal Report Card Data
Student Data: Assessments
State of Texas Assessments of Academic Readiness (STAAR) current and longitudinal results, including all versionsSTAAR Released Test QuestionsLocal benchmark or common assessments data
Student Data: Student Groups
Economically Disadvantaged / Non-economically disadvantaged performance, progress, and participation dataMale / Female performance, progress, and participation dataSpecial education/non-special education population including discipline, progress and participation data
Student Data: Behavior and Other Indicators
Attendance dataDiscipline records
Employee Data
Staff surveys and/or other feedbackEquity DataCampus department and/or faculty meeting discussions and dataEvaluation(s) of professional development implementation and impact
Hardy ElementaryGenerated by Plan4Learning.com 17 of 40 February 4, 2020 3:02 pm
18-19 AAR Page 170
TTESS data
Parent/Community Data
Parent engagement rate
Support Systems and Other Data
Organizational structure dataProcesses and procedures for teaching and learning, including program implementationCommunications dataBudgets/entitlements and expenditures dataStudy of best practicesOther additional data
Hardy ElementaryGenerated by Plan4Learning.com 18 of 40 February 4, 2020 3:02 pm
18-19 AAR Page 171
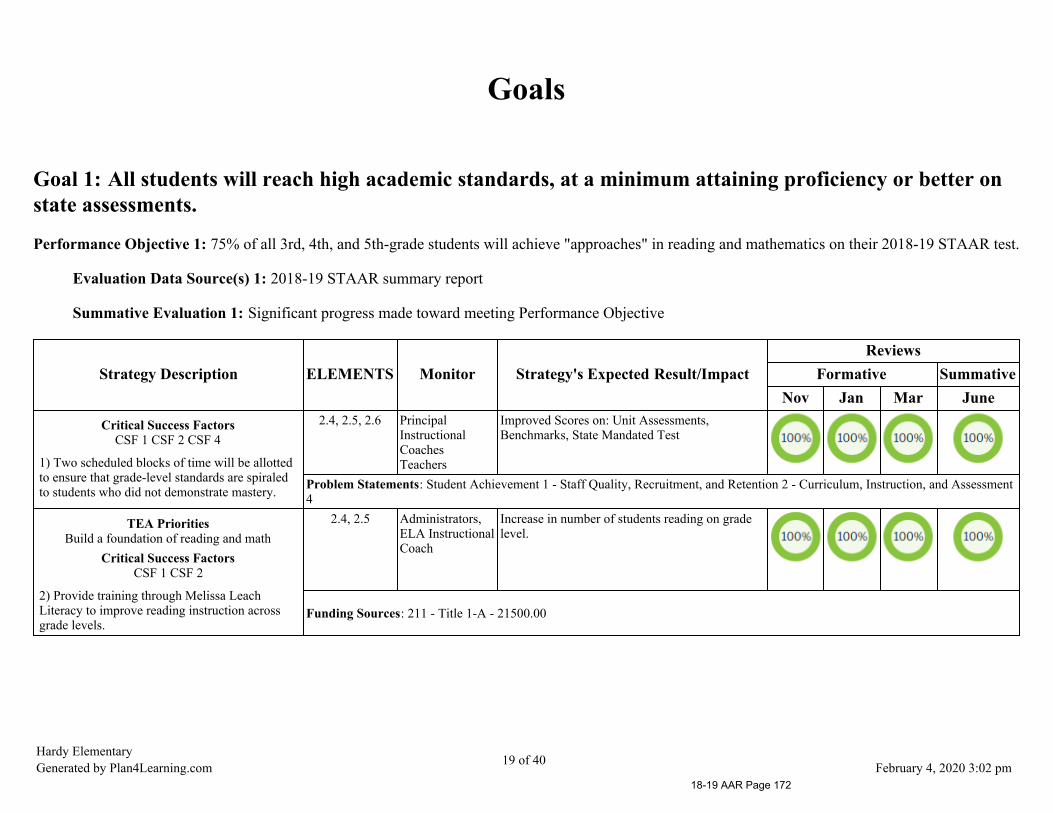
Goals
Goal 1: All students will reach high academic standards, at a minimum attaining proficiency or better onstate assessments.
Performance Objective 1: 75% of all 3rd, 4th, and 5th-grade students will achieve "approaches" in reading and mathematics on their 2018-19 STAAR test.
Evaluation Data Source(s) 1: 2018-19 STAAR summary report
Summative Evaluation 1: Significant progress made toward meeting Performance Objective
Strategy Description ELEMENTS Monitor Strategy's Expected Result/ImpactReviews
Formative SummativeNov Jan Mar June
Critical Success FactorsCSF 1 CSF 2 CSF 4
1) Two scheduled blocks of time will be allottedto ensure that grade-level standards are spiraledto students who did not demonstrate mastery.
2.4, 2.5, 2.6 PrincipalInstructionalCoachesTeachers
Improved Scores on: Unit Assessments,Benchmarks, State Mandated Test
Problem Statements: Student Achievement 1 - Staff Quality, Recruitment, and Retention 2 - Curriculum, Instruction, and Assessment4
TEA PrioritiesBuild a foundation of reading and math
Critical Success FactorsCSF 1 CSF 2
2) Provide training through Melissa LeachLiteracy to improve reading instruction acrossgrade levels.
2.4, 2.5 Administrators,ELA InstructionalCoach
Increase in number of students reading on gradelevel.
Funding Sources: 211 - Title 1-A - 21500.00
Hardy ElementaryGenerated by Plan4Learning.com 19 of 40 February 4, 2020 3:02 pm
18-19 AAR Page 172
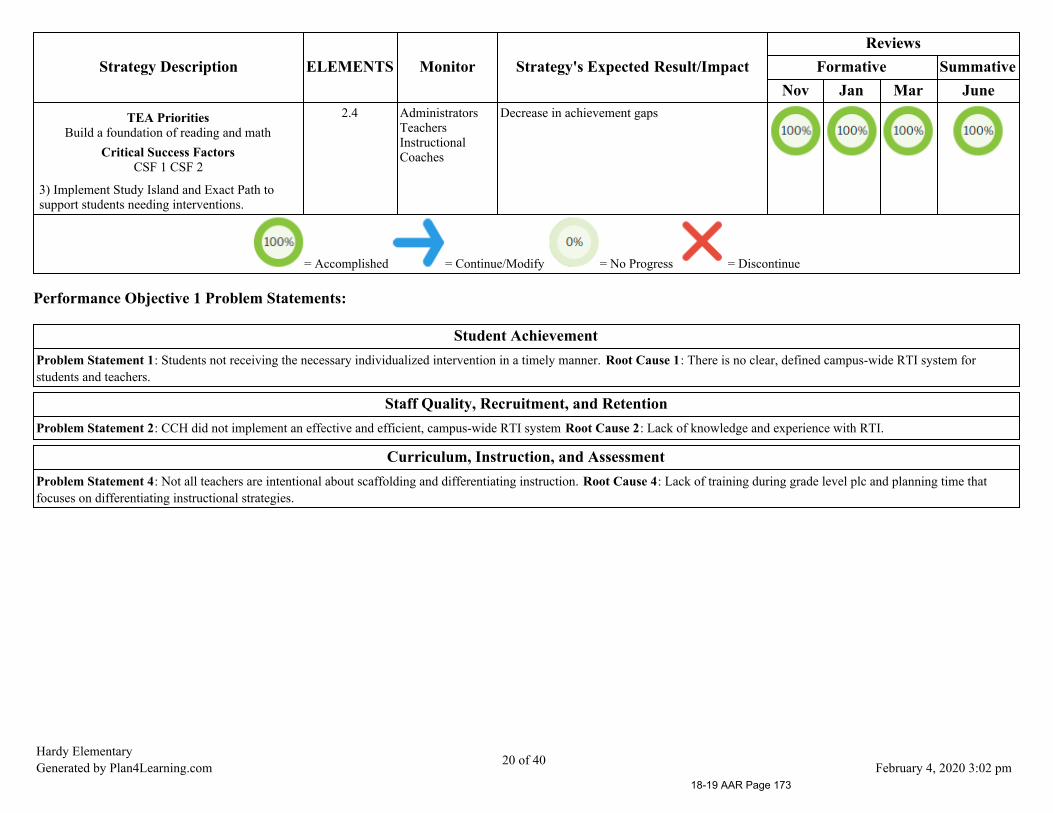
Strategy Description ELEMENTS Monitor Strategy's Expected Result/ImpactReviews
Formative SummativeNov Jan Mar June
TEA PrioritiesBuild a foundation of reading and math
Critical Success FactorsCSF 1 CSF 2
3) Implement Study Island and Exact Path tosupport students needing interventions.
2.4 AdministratorsTeachersInstructionalCoaches
Decrease in achievement gaps
= Accomplished = Continue/Modify = No Progress = Discontinue
Performance Objective 1 Problem Statements:
Student AchievementProblem Statement 1: Students not receiving the necessary individualized intervention in a timely manner. Root Cause 1: There is no clear, defined campus-wide RTI system forstudents and teachers.
Staff Quality, Recruitment, and RetentionProblem Statement 2: CCH did not implement an effective and efficient, campus-wide RTI system Root Cause 2: Lack of knowledge and experience with RTI.
Curriculum, Instruction, and AssessmentProblem Statement 4: Not all teachers are intentional about scaffolding and differentiating instruction. Root Cause 4: Lack of training during grade level plc and planning time thatfocuses on differentiating instructional strategies.
Hardy ElementaryGenerated by Plan4Learning.com 20 of 40 February 4, 2020 3:02 pm
18-19 AAR Page 173

Goal 1: All students will reach high academic standards, at a minimum attaining proficiency or better on state assessments.
Performance Objective 2: In all subjects, there will be a 10% increase in the number of students who meet and masters grade level curriculum on the2018-19 STAAR assessment.
Evaluation Data Source(s) 2: 2018-19 STAAR summary Report (All Subjects Report)
Summative Evaluation 2: Significant progress made toward meeting Performance Objective
Strategy Description ELEMENTS Monitor Strategy's Expected Result/ImpactReviews
Formative SummativeNov Jan Mar June
Critical Success FactorsCSF 1 CSF 2 CSF 7
1) After all campus and district assessments,teachers will attend a data meeting. During thedata meeting, teachers will follow a protocol thatrequires for them to disaggregate, analyze, andrecord their student data. Also, teacher willcollaborate with their peers and instructionalcoaches to develop an action plan of interventionduring this meeting. (Data Meeting Form)
2.4, 2.6 AdminInstructionalCoachesTeachers
10% increase in number of students who meet andmasters their respective grade level curriculum ingrades 3-5.
Problem Statements: Student Achievement 1 - Curriculum, Instruction, and Assessment 4
= Accomplished = Continue/Modify = No Progress = Discontinue
Performance Objective 2 Problem Statements:
Student AchievementProblem Statement 1: Students not receiving the necessary individualized intervention in a timely manner. Root Cause 1: There is no clear, defined campus-wide RTI system forstudents and teachers.
Curriculum, Instruction, and AssessmentProblem Statement 4: Not all teachers are intentional about scaffolding and differentiating instruction. Root Cause 4: Lack of training during grade level plc and planning time thatfocuses on differentiating instructional strategies.
Hardy ElementaryGenerated by Plan4Learning.com 21 of 40 February 4, 2020 3:02 pm
18-19 AAR Page 174

Goal 1: All students will reach high academic standards, at a minimum attaining proficiency or better on state assessments.
Performance Objective 3: EOY MAP data will indicate that 80% of all CCH students will achieve one year worth of growth.
Evaluation Data Source(s) 3: MAP campus summary report.
Summative Evaluation 3: Some progress made toward meeting Performance Objective
Strategy Description ELEMENTS Monitor Strategy's Expected Result/ImpactReviews
Formative SummativeNov Jan Mar June
Critical Success FactorsCSF 1 CSF 2
1) CCH will have an effective and efficient RTIprocess that address student reading and mathskills.
Instructional Coaches will lead PD on bestinstructional practices, district initiatives, andpurchased reading/ math resources.
2.4, 2.6 M. WithamA. WilliamsE. BurnsTeachersInstructionalCoaches
Students' MAP Growth Report will show studentgrowth.
Problem Statements: Student Achievement 2 - Staff Quality, Recruitment, and Retention 2 - Curriculum, Instruction, and Assessment1, 3
TEA PrioritiesBuild a foundation of reading and math
Critical Success FactorsCSF 1 CSF 2
2) Implement Reading Eggs in conjunction withMAP for primary grades to provide interventionfor at-risk students.
2.4 Administrators,ELA InstructionalCoach, Teachers
Increase in number of students showing academicgrowth
Funding Sources: 211 - Title 1-A - 7000.00
= Accomplished = Continue/Modify = No Progress = Discontinue
Performance Objective 3 Problem Statements:
Student AchievementProblem Statement 2: Implementation of items discussed in meetings Root Cause 2: Inconsistency in best practice and good instruction.
Hardy ElementaryGenerated by Plan4Learning.com 22 of 40 February 4, 2020 3:02 pm
18-19 AAR Page 175

Staff Quality, Recruitment, and RetentionProblem Statement 2: CCH did not implement an effective and efficient, campus-wide RTI system Root Cause 2: Lack of knowledge and experience with RTI.
Curriculum, Instruction, and AssessmentProblem Statement 1: Not all teachers implemented the district's curriculum and initiatives with fidelity. Root Cause 1: A lot of new teachers who are new to the teaching professionand who are unfamiliar with state standards and best practices.
Problem Statement 3: Students are not responsible for monitoring their own data. Root Cause 3: No system that allows students to own their data.
Hardy ElementaryGenerated by Plan4Learning.com 23 of 40 February 4, 2020 3:02 pm
18-19 AAR Page 176

Goal 1: All students will reach high academic standards, at a minimum attaining proficiency or better on state assessments.
Performance Objective 4: 70% percent of students in grades 3-5 will meet the "approaches" standard in the area of math and reading on the first 2018benchmark assessment.
Evaluation Data Source(s) 4: BM1
Summative Evaluation 4: Significant progress made toward meeting Performance Objective
Strategy Description ELEMENTS Monitor Strategy's Expected Result/ImpactReviews
Formative SummativeNov Jan Mar June
Critical Success FactorsCSF 1 CSF 2 CSF 4 CSF 7
1) Data MeetingsNew Master Schedule (45 min of RTI time,Tues-Fri)Uninterrupted block of learning
2.4, 2.5, 2.6 Burnsinstructionalcoachesteachers
Academic improvement in math and reading-Allstudents 3-5
Problem Statements: Student Achievement 1 - Staff Quality, Recruitment, and Retention 2 - Curriculum, Instruction, and Assessment4 - School Context and Organization 3
= Accomplished = Continue/Modify = No Progress = Discontinue
Performance Objective 4 Problem Statements:
Student AchievementProblem Statement 1: Students not receiving the necessary individualized intervention in a timely manner. Root Cause 1: There is no clear, defined campus-wide RTI system forstudents and teachers.
Staff Quality, Recruitment, and RetentionProblem Statement 2: CCH did not implement an effective and efficient, campus-wide RTI system Root Cause 2: Lack of knowledge and experience with RTI.
Curriculum, Instruction, and AssessmentProblem Statement 4: Not all teachers are intentional about scaffolding and differentiating instruction. Root Cause 4: Lack of training during grade level plc and planning time thatfocuses on differentiating instructional strategies.
School Context and OrganizationProblem Statement 3: Too many interruptions in grades 3-5 instructional minutes. Root Cause 3: Master schedule that causes interruptions (specials/lunches) during the optimal time forlearning in grade 3-5.
Hardy ElementaryGenerated by Plan4Learning.com 24 of 40 February 4, 2020 3:02 pm
18-19 AAR Page 177

Hardy ElementaryGenerated by Plan4Learning.com 25 of 40 February 4, 2020 3:02 pm
18-19 AAR Page 178

Goal 2: All parents will participate in regular, two-way, and meaningful communication involving studentacademic learning and school activities.
Performance Objective 1: In the 2018-19 school year, there will be less than 7 parental complaints submitted to the campus administrators regarding thelack of two-way communication between parent-teacher-school officials.
Evaluation Data Source(s) 1: A spreadsheet that reflects the number of parental complaints submitted to campus administrators.
Summative Evaluation 1: Met Performance Objective
Strategy Description ELEMENTS Monitor Strategy's Expected Result/ImpactReviews
Formative SummativeNov Jan Mar June
Critical Success FactorsCSF 5 CSF 6
1) A stakeholder feedback board will be placedin the cafeteria. The feedback board will give allstakeholders an opportunity to share theirfeedback and concerns.
3.1, 3.2 Leadership Team School climate and parental involvement.
Problem Statements: Parent and Community Engagement 2
= Accomplished = Continue/Modify = No Progress = Discontinue
Performance Objective 1 Problem Statements:
Parent and Community EngagementProblem Statement 2: Minimum amount of parent feedback (positive and constructive) received throughout the year. Root Cause 2: No MOY or EOY district/campus parent survey
Hardy ElementaryGenerated by Plan4Learning.com 26 of 40 February 4, 2020 3:02 pm
18-19 AAR Page 179
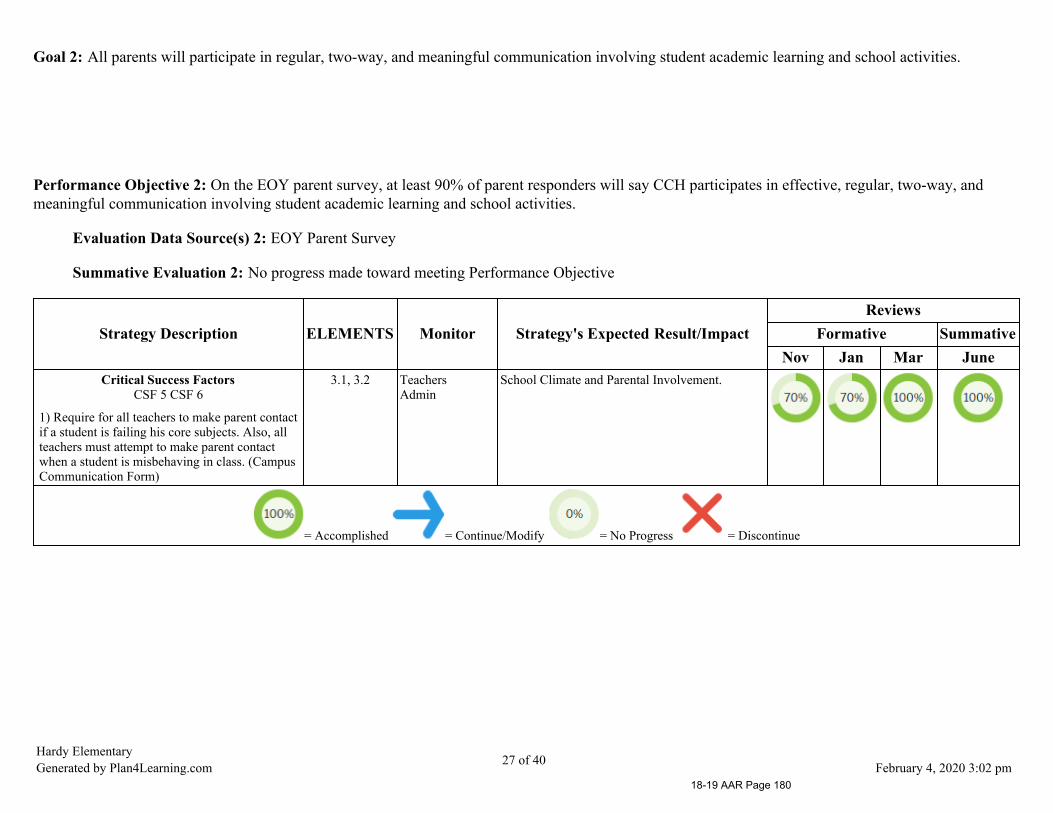
Goal 2: All parents will participate in regular, two-way, and meaningful communication involving student academic learning and school activities.
Performance Objective 2: On the EOY parent survey, at least 90% of parent responders will say CCH participates in effective, regular, two-way, andmeaningful communication involving student academic learning and school activities.
Evaluation Data Source(s) 2: EOY Parent Survey
Summative Evaluation 2: No progress made toward meeting Performance Objective
Strategy Description ELEMENTS Monitor Strategy's Expected Result/ImpactReviews
Formative SummativeNov Jan Mar June
Critical Success FactorsCSF 5 CSF 6
1) Require for all teachers to make parent contactif a student is failing his core subjects. Also, allteachers must attempt to make parent contactwhen a student is misbehaving in class. (CampusCommunication Form)
3.1, 3.2 TeachersAdmin
School Climate and Parental Involvement.
= Accomplished = Continue/Modify = No Progress = Discontinue
Hardy ElementaryGenerated by Plan4Learning.com 27 of 40 February 4, 2020 3:02 pm
18-19 AAR Page 180

Goal 2: All parents will participate in regular, two-way, and meaningful communication involving student academic learning and school activities.
Performance Objective 3: From Sept 2018-May 2019, CCH will host one parent involvement/volunteer meeting each month.
Evaluation Data Source(s) 3: Sign in Sheet
Summative Evaluation 3: No progress made toward meeting Performance Objective
Strategy Description ELEMENTS Monitor Strategy's Expected Result/ImpactReviews
Formative SummativeNov Jan Mar June
Critical Success FactorsCSF 5 CSF 6
1) CCH will host a parent meeting each month.During this meeting, parent will receiveinformation about upcoming events and waysthey can become more involved in the schoolsetting.
3.1, 3.2 Lisa BuellPrincipal
School Climate and an increase in the amount ofparent who are actively involved in the schoolsetting.
Active PTO in 19-20 school year.Problem Statements: Parent and Community Engagement 1Funding Sources: 211 - Title 1-A - 500.00
= Accomplished = Continue/Modify = No Progress = Discontinue
Performance Objective 3 Problem Statements:
Parent and Community EngagementProblem Statement 1: Lack of parental involvement with our hispanic population of parents. Root Cause 1: Effective communication strategies to notify Spanish speaking parents of allschool events.
Hardy ElementaryGenerated by Plan4Learning.com 28 of 40 February 4, 2020 3:02 pm
18-19 AAR Page 181

Goal 3: All staff will be prepared to support student achievement.
Performance Objective 1: Before the end of the first 9 weeks, all homeroom teachers at CCH will receive training and begin conducting regularlyscheduled meeting with the campus RTI coordinator to discuss RTI tiered students.
Evaluation Data Source(s) 1: Tier II and III meeting agendas, notes, and sign in sheets with date and times presented.
Summative Evaluation 1: Met Performance Objective
Strategy Description ELEMENTS Monitor Strategy's Expected Result/ImpactReviews
Formative SummativeNov Jan Mar June
Critical Success FactorsCSF 1 CSF 2 CSF 7
1) Shared campus RTI schedule for each gradelevel.
Mandatory RTI training for all homeroomteachers.
Shared sign in sheets, agendas, and meetingminutes. (coordinator, teachers, admin)
2.4, 2.6 RTI coordinatorPrincipalTeachers
Increase in academic growth in all TII and TIIIstudents. (MAP Data)
Closing achievement gaps of TII and TIIIstudents.
Problem Statements: Student Achievement 1
= Accomplished = Continue/Modify = No Progress = Discontinue
Performance Objective 1 Problem Statements:
Student AchievementProblem Statement 1: Students not receiving the necessary individualized intervention in a timely manner. Root Cause 1: There is no clear, defined campus-wide RTI system forstudents and teachers.
Hardy ElementaryGenerated by Plan4Learning.com 29 of 40 February 4, 2020 3:02 pm
18-19 AAR Page 182

Goal 3: All staff will be prepared to support student achievement.
Performance Objective 2: By the end of the year, teachers in grades K-5 will receive professional development training to assist them with reading, mathand/or science instruction in order to increase student performance.
Evaluation Data Source(s) 2:
Summative Evaluation 2: Met Performance Objective
Strategy Description ELEMENTS Monitor Strategy's Expected Result/ImpactReviews
Formative SummativeNov Jan Mar June
TEA PrioritiesBuild a foundation of reading and math
Critical Success FactorsCSF 1 CSF 2 CSF 7
1) Provide trainings to improve reading. mathand/or science instruction through the following:1. Melissa Leach Literacy2. Lead4Ward3. Solution Tree (RtI, PLC, Math at Work)4. Edmentum (Study Island, Exact Path, ReadingEggs)5. NWEA MAP6. ESC 6 7. District Coordinators (Math - DMR, Science-StemSCOPE, 5E Model, Planetarium,Bilingual/ELL-Sheltered Instruction)
2.4, 2.5 Administrators,DistrictCoordinators,InstructionalCoaches,Teachers
Lessons reflect learning and implementationwhich results in improved student growth anddecrease in achievement gap
Funding Sources: 211 - Title 1-A - 6000.00
= Accomplished = Continue/Modify = No Progress = Discontinue
Hardy ElementaryGenerated by Plan4Learning.com 30 of 40 February 4, 2020 3:02 pm
18-19 AAR Page 183
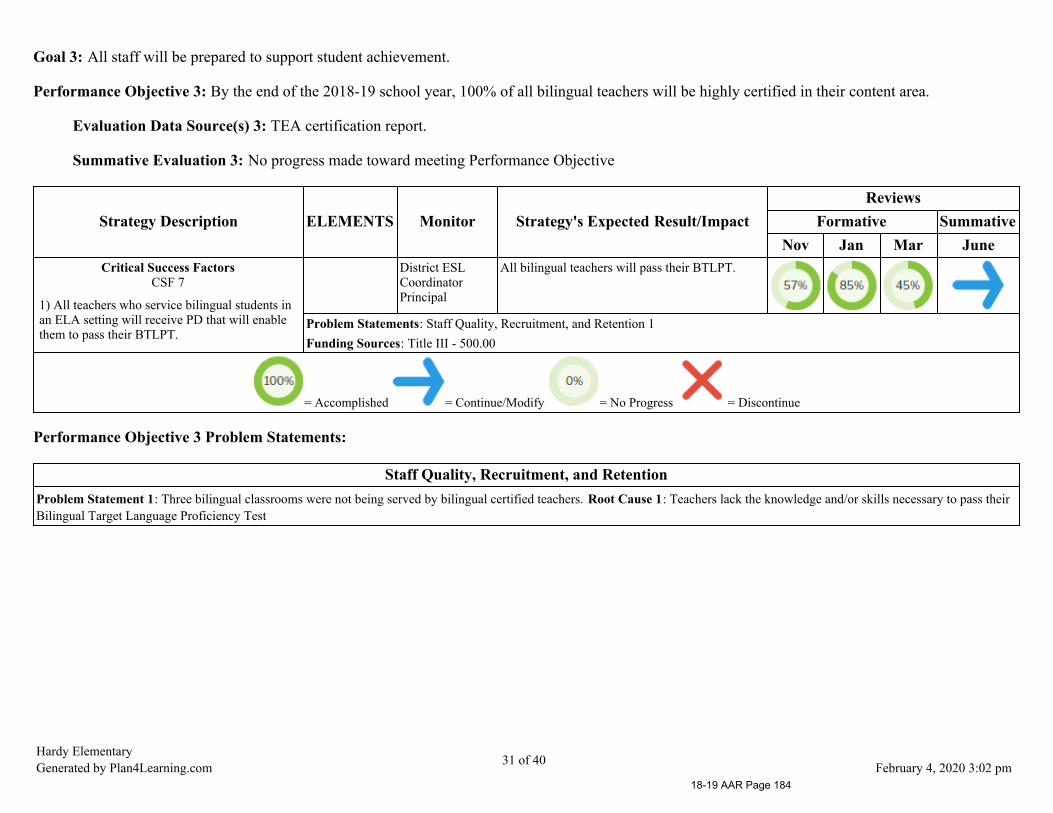
Goal 3: All staff will be prepared to support student achievement.
Performance Objective 3: By the end of the 2018-19 school year, 100% of all bilingual teachers will be highly certified in their content area.
Evaluation Data Source(s) 3: TEA certification report.
Summative Evaluation 3: No progress made toward meeting Performance Objective
Strategy Description ELEMENTS Monitor Strategy's Expected Result/ImpactReviews
Formative SummativeNov Jan Mar June
Critical Success FactorsCSF 7
1) All teachers who service bilingual students inan ELA setting will receive PD that will enablethem to pass their BTLPT.
District ESLCoordinatorPrincipal
All bilingual teachers will pass their BTLPT.
Problem Statements: Staff Quality, Recruitment, and Retention 1Funding Sources: Title III - 500.00
= Accomplished = Continue/Modify = No Progress = Discontinue
Performance Objective 3 Problem Statements:
Staff Quality, Recruitment, and RetentionProblem Statement 1: Three bilingual classrooms were not being served by bilingual certified teachers. Root Cause 1: Teachers lack the knowledge and/or skills necessary to pass theirBilingual Target Language Proficiency Test
Hardy ElementaryGenerated by Plan4Learning.com 31 of 40 February 4, 2020 3:02 pm
18-19 AAR Page 184

Goal 4: All district funds will be utilized for programs that ensure the success of every student.
Performance Objective 1: 100% of CCH's funds will be spent for the overall improvement of the campus, address student's academic/socio-emotionalneeds, and professional development of teachers.
Evaluation Data Source(s) 1: Monthly Budget Report
Summative Evaluation 1: Exceeded Performance Objective
Strategy Description ELEMENTS Monitor Strategy's Expected Result/ImpactReviews
Formative SummativeNov Jan Mar June
1) Monthly budget meeting R. JohnsonE. Burns
EOY budget audit shows all budget has beenappropriately spent.
= Accomplished = Continue/Modify = No Progress = Discontinue
Hardy ElementaryGenerated by Plan4Learning.com 32 of 40 February 4, 2020 3:02 pm
18-19 AAR Page 185
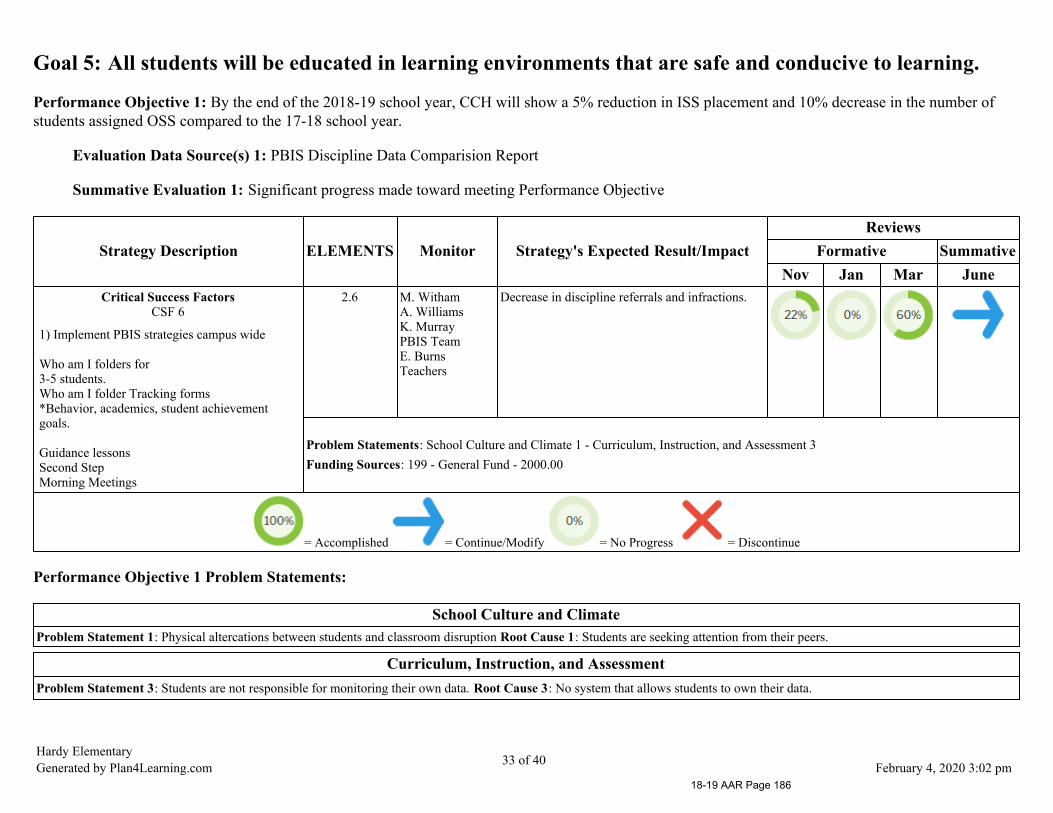
Goal 5: All students will be educated in learning environments that are safe and conducive to learning.
Performance Objective 1: By the end of the 2018-19 school year, CCH will show a 5% reduction in ISS placement and 10% decrease in the number ofstudents assigned OSS compared to the 17-18 school year.
Evaluation Data Source(s) 1: PBIS Discipline Data Comparision Report
Summative Evaluation 1: Significant progress made toward meeting Performance Objective
Strategy Description ELEMENTS Monitor Strategy's Expected Result/ImpactReviews
Formative SummativeNov Jan Mar June
Critical Success FactorsCSF 6
1) Implement PBIS strategies campus wide
Who am I folders for3-5 students. Who am I folder Tracking forms*Behavior, academics, student achievementgoals.
Guidance lessonsSecond StepMorning Meetings
2.6 M. WithamA. WilliamsK. MurrayPBIS TeamE. BurnsTeachers
Decrease in discipline referrals and infractions.
Problem Statements: School Culture and Climate 1 - Curriculum, Instruction, and Assessment 3Funding Sources: 199 - General Fund - 2000.00
= Accomplished = Continue/Modify = No Progress = Discontinue
Performance Objective 1 Problem Statements:
School Culture and ClimateProblem Statement 1: Physical altercations between students and classroom disruption Root Cause 1: Students are seeking attention from their peers.
Curriculum, Instruction, and AssessmentProblem Statement 3: Students are not responsible for monitoring their own data. Root Cause 3: No system that allows students to own their data.
Hardy ElementaryGenerated by Plan4Learning.com 33 of 40 February 4, 2020 3:02 pm
18-19 AAR Page 186
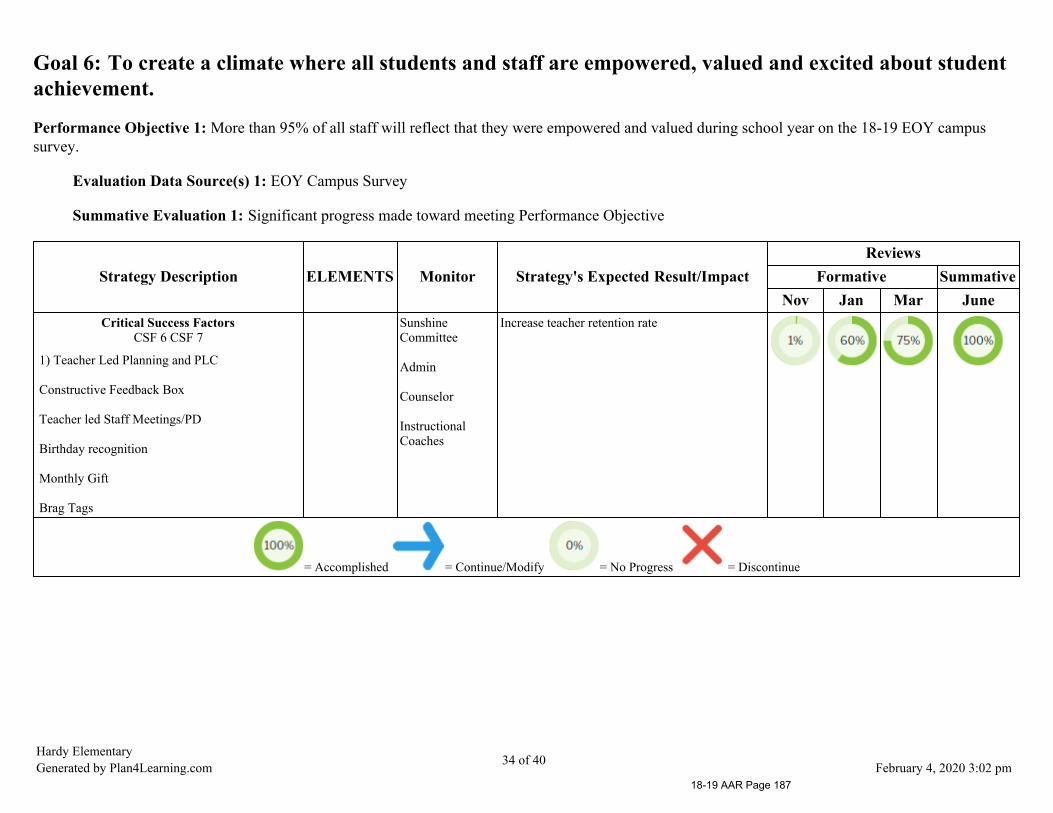
Goal 6: To create a climate where all students and staff are empowered, valued and excited about studentachievement.
Performance Objective 1: More than 95% of all staff will reflect that they were empowered and valued during school year on the 18-19 EOY campussurvey.
Evaluation Data Source(s) 1: EOY Campus Survey
Summative Evaluation 1: Significant progress made toward meeting Performance Objective
Strategy Description ELEMENTS Monitor Strategy's Expected Result/ImpactReviews
Formative SummativeNov Jan Mar June
Critical Success FactorsCSF 6 CSF 7
1) Teacher Led Planning and PLC
Constructive Feedback Box
Teacher led Staff Meetings/PD
Birthday recognition
Monthly Gift
Brag Tags
SunshineCommittee
Admin
Counselor
InstructionalCoaches
Increase teacher retention rate
= Accomplished = Continue/Modify = No Progress = Discontinue
Hardy ElementaryGenerated by Plan4Learning.com 34 of 40 February 4, 2020 3:02 pm
18-19 AAR Page 187
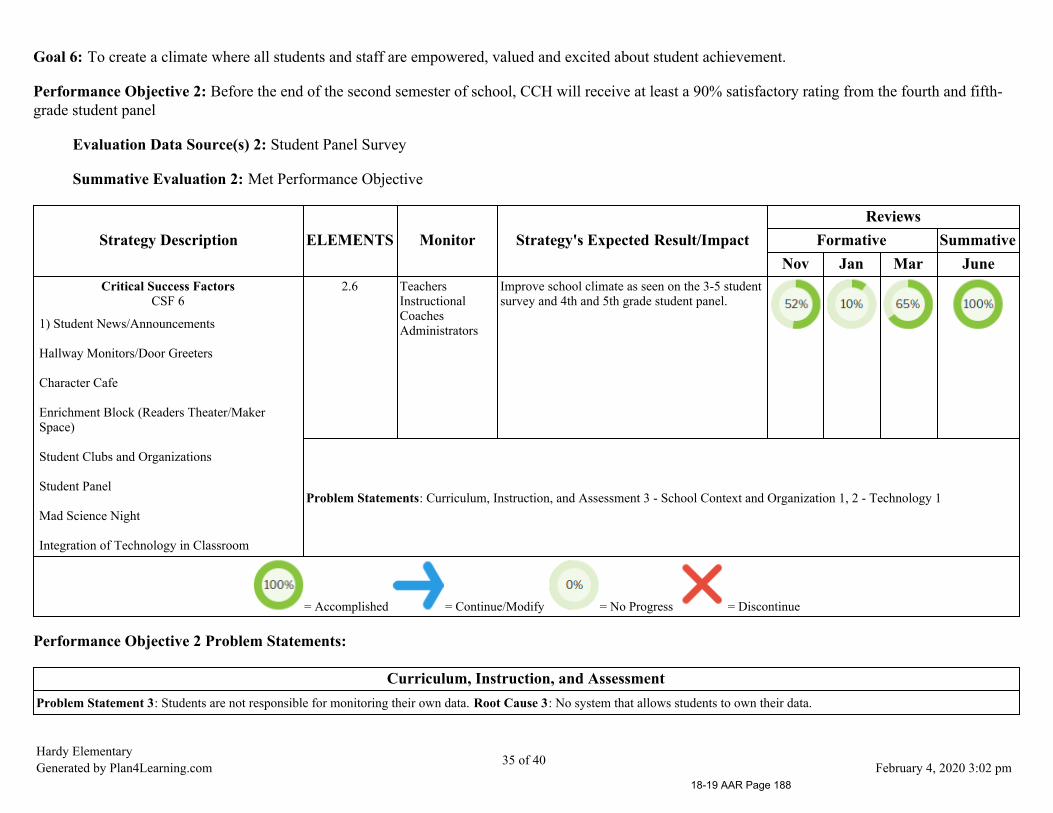
Goal 6: To create a climate where all students and staff are empowered, valued and excited about student achievement.
Performance Objective 2: Before the end of the second semester of school, CCH will receive at least a 90% satisfactory rating from the fourth and fifth-grade student panel
Evaluation Data Source(s) 2: Student Panel Survey
Summative Evaluation 2: Met Performance Objective
Strategy Description ELEMENTS Monitor Strategy's Expected Result/ImpactReviews
Formative SummativeNov Jan Mar June
Critical Success FactorsCSF 6
1) Student News/Announcements
Hallway Monitors/Door Greeters
Character Cafe
Enrichment Block (Readers Theater/MakerSpace)
Student Clubs and Organizations
Student Panel
Mad Science Night
Integration of Technology in Classroom
2.6 TeachersInstructionalCoachesAdministrators
Improve school climate as seen on the 3-5 studentsurvey and 4th and 5th grade student panel.
Problem Statements: Curriculum, Instruction, and Assessment 3 - School Context and Organization 1, 2 - Technology 1
= Accomplished = Continue/Modify = No Progress = Discontinue
Performance Objective 2 Problem Statements:
Curriculum, Instruction, and AssessmentProblem Statement 3: Students are not responsible for monitoring their own data. Root Cause 3: No system that allows students to own their data.
Hardy ElementaryGenerated by Plan4Learning.com 35 of 40 February 4, 2020 3:02 pm
18-19 AAR Page 188

School Context and OrganizationProblem Statement 1: Limited leadership opportunities for students. Root Cause 1: No time within instructional day to provide students leadership opportunities consistently.
Problem Statement 2: Students having a voice in the decision making process and school practices. Root Cause 2: No organization implemented to foster students having a choice in thedecision making process.
TechnologyProblem Statement 1: Teachers do not have a clear and accurate understanding of how technology is used to support instruction and learning Root Cause 1: Lack of relevant andmeaningful training/coaching sessions for teachers.
Hardy ElementaryGenerated by Plan4Learning.com 36 of 40 February 4, 2020 3:02 pm
18-19 AAR Page 189
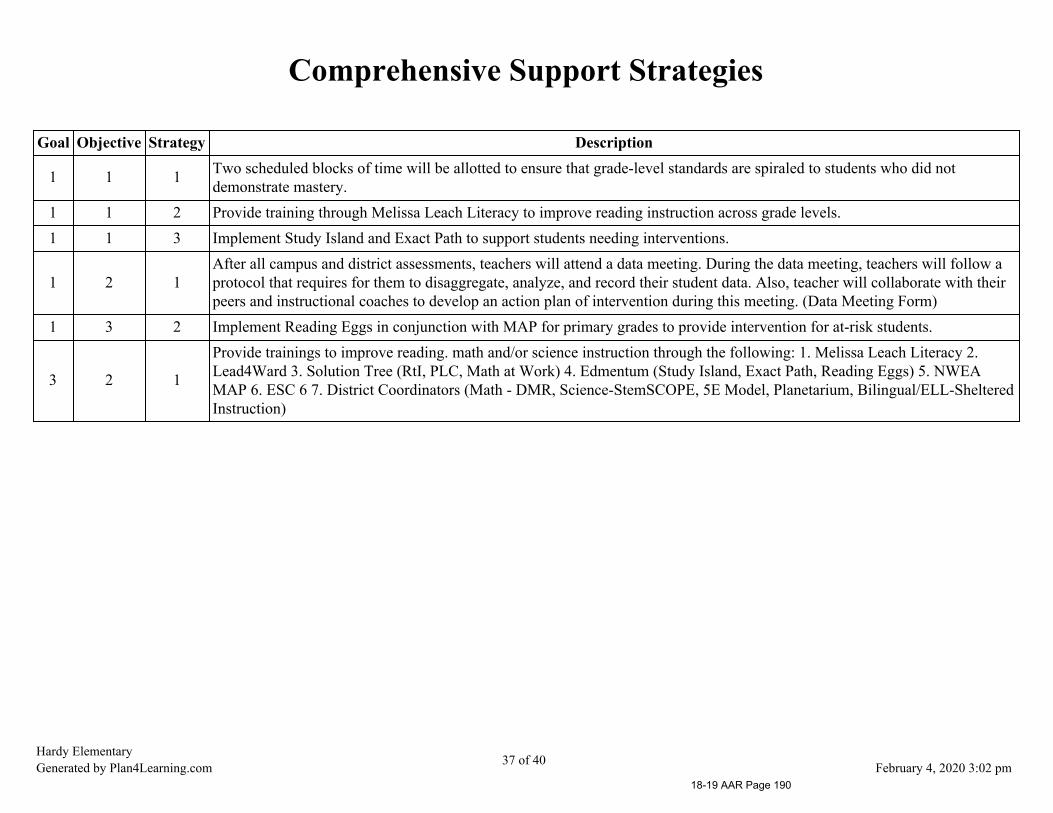
Comprehensive Support Strategies
Goal Objective Strategy Description
1 1 1 Two scheduled blocks of time will be allotted to ensure that grade-level standards are spiraled to students who did notdemonstrate mastery.
1 1 2 Provide training through Melissa Leach Literacy to improve reading instruction across grade levels.1 1 3 Implement Study Island and Exact Path to support students needing interventions.
1 2 1After all campus and district assessments, teachers will attend a data meeting. During the data meeting, teachers will follow aprotocol that requires for them to disaggregate, analyze, and record their student data. Also, teacher will collaborate with theirpeers and instructional coaches to develop an action plan of intervention during this meeting. (Data Meeting Form)
1 3 2 Implement Reading Eggs in conjunction with MAP for primary grades to provide intervention for at-risk students.
3 2 1
Provide trainings to improve reading. math and/or science instruction through the following: 1. Melissa Leach Literacy 2.Lead4Ward 3. Solution Tree (RtI, PLC, Math at Work) 4. Edmentum (Study Island, Exact Path, Reading Eggs) 5. NWEAMAP 6. ESC 6 7. District Coordinators (Math - DMR, Science-StemSCOPE, 5E Model, Planetarium, Bilingual/ELL-ShelteredInstruction)
Hardy ElementaryGenerated by Plan4Learning.com 37 of 40 February 4, 2020 3:02 pm
18-19 AAR Page 190

Title I Personnel
Name Position Program FTE
Bradley Persinger Technology Innovation Coach Title I 100Karen Novak Instructional coach Title I 100Kimberly Truett Instructional Coach Title I 100
Hardy ElementaryGenerated by Plan4Learning.com 38 of 40 February 4, 2020 3:02 pm
18-19 AAR Page 191
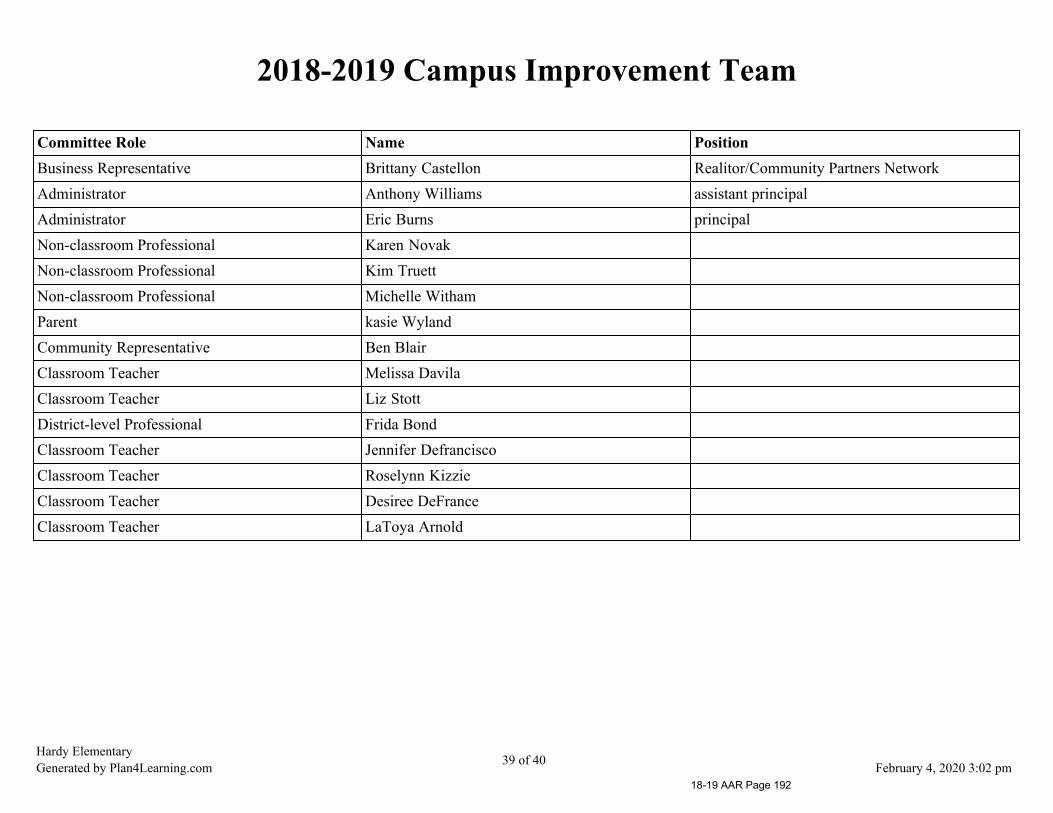
2018-2019 Campus Improvement Team
Committee Role Name PositionBusiness Representative Brittany Castellon Realitor/Community Partners NetworkAdministrator Anthony Williams assistant principalAdministrator Eric Burns principalNon-classroom Professional Karen NovakNon-classroom Professional Kim TruettNon-classroom Professional Michelle WithamParent kasie WylandCommunity Representative Ben BlairClassroom Teacher Melissa DavilaClassroom Teacher Liz StottDistrict-level Professional Frida BondClassroom Teacher Jennifer DefranciscoClassroom Teacher Roselynn KizzieClassroom Teacher Desiree DeFranceClassroom Teacher LaToya Arnold
Hardy ElementaryGenerated by Plan4Learning.com 39 of 40 February 4, 2020 3:02 pm
18-19 AAR Page 192
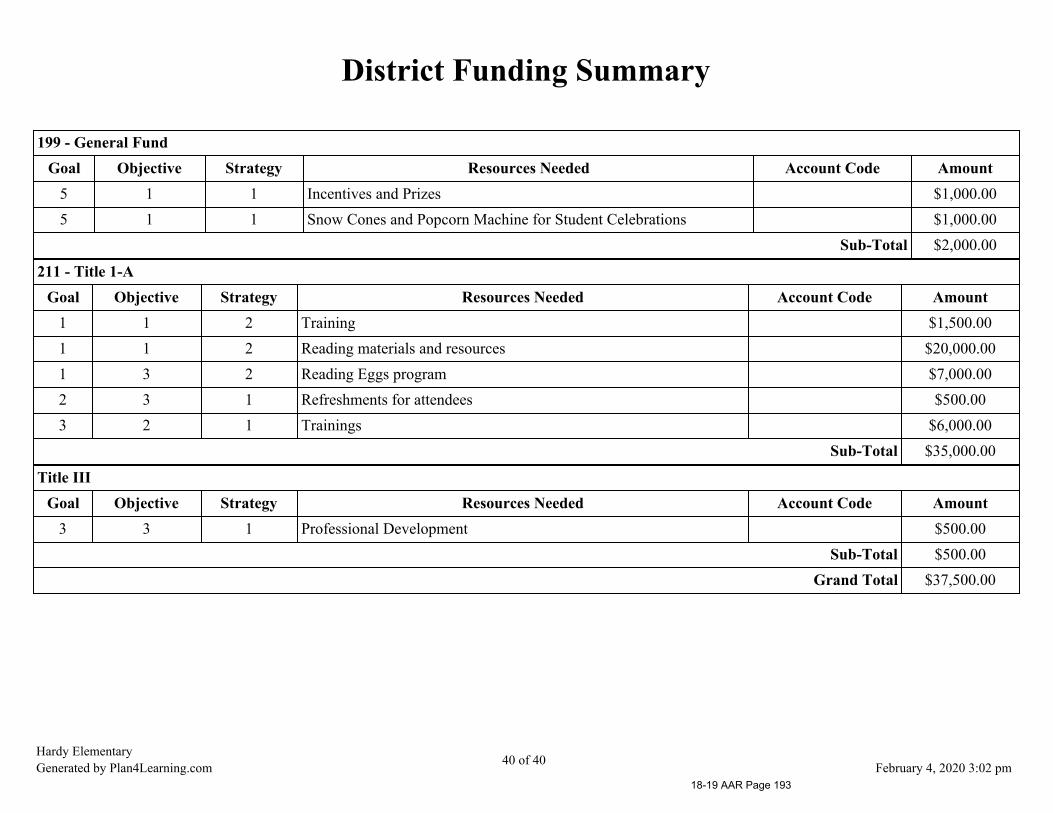
District Funding Summary
199 - General FundGoal Objective Strategy Resources Needed Account Code Amount
5 1 1 Incentives and Prizes $1,000.005 1 1 Snow Cones and Popcorn Machine for Student Celebrations $1,000.00
Sub-Total $2,000.00
211 - Title 1-AGoal Objective Strategy Resources Needed Account Code Amount
1 1 2 Training $1,500.001 1 2 Reading materials and resources $20,000.001 3 2 Reading Eggs program $7,000.002 3 1 Refreshments for attendees $500.003 2 1 Trainings $6,000.00
Sub-Total $35,000.00
Title IIIGoal Objective Strategy Resources Needed Account Code Amount
3 3 1 Professional Development $500.00Sub-Total $500.00
Grand Total $37,500.00
Hardy ElementaryGenerated by Plan4Learning.com 40 of 40 February 4, 2020 3:02 pm
18-19 AAR Page 193
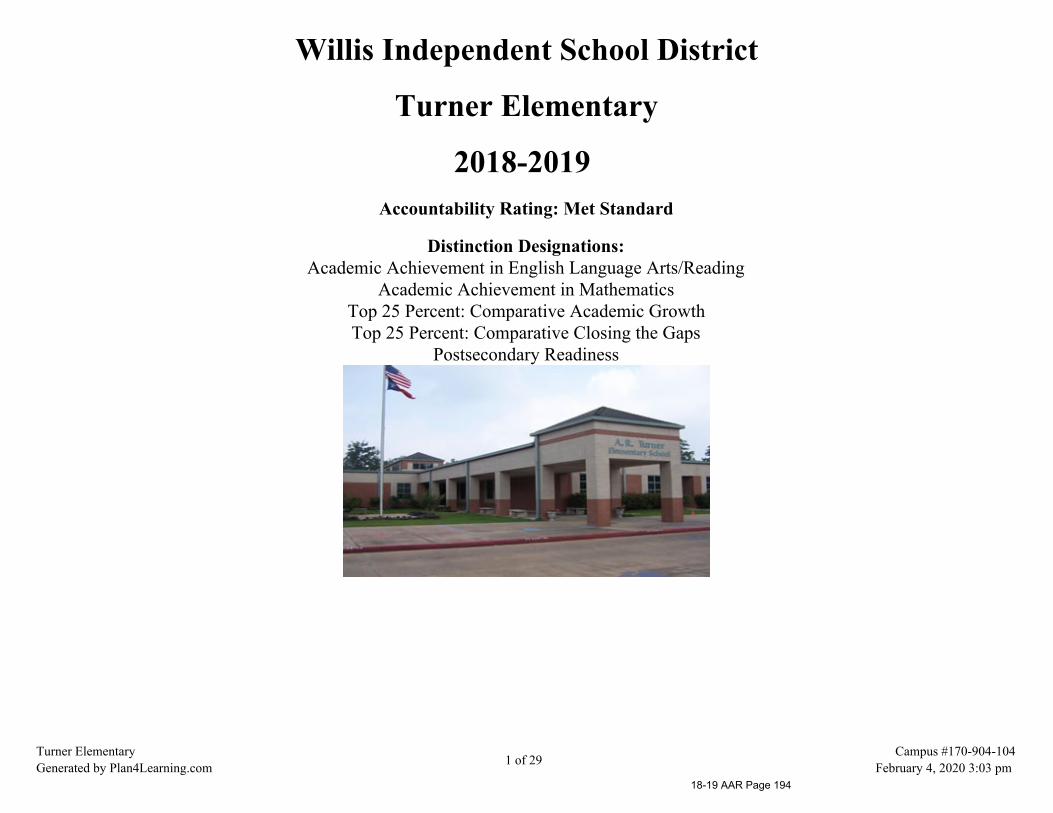
Willis Independent School District
Turner Elementary
2018-2019 Accountability Rating: Met Standard
Distinction Designations:Academic Achievement in English Language Arts/Reading
Academic Achievement in MathematicsTop 25 Percent: Comparative Academic GrowthTop 25 Percent: Comparative Closing the Gaps
Postsecondary Readiness
Turner ElementaryGenerated by Plan4Learning.com 1 of 29
Campus #170-904-104February 4, 2020 3:03 pm
18-19 AAR Page 194
Mission StatementThe mission of A. R. Turner Elementary is committed to providing a safe and enriching environment
that encourages teamwork and empowers children to be responsible and productive learners.
VisionOur vision is to encourage children to be responsible and productive in the learning environment andcommunity. As educators, we are committed to promoting such qualities through literacy, problem-
solving, and independent thinking.
Core BeliefsWe believe every child counts; every child learns.
We will provide the opportunity for a successful future by teaching every child to think.
We believe the education of all children is the responsibility of the family, school district, and community.
We will communicate, encourage, be responsive to, and seek input and participation from students, their families, staff, and community
We believe each employee is valuable and has a profound impact on student learning.
We will invest in highly qualified human talent, engage them in teamwork and learning communities and provide focused training toensure they will be active contributors to academic achievement and student success. We will treat each employee with fairness,empower each employee to focus on high performance, and hold each employee accountable for results that contribute to studentachievement and success.
We believe the equitable allocation of resources ensures each student will have the opportunity to become productive citizens.
We will operate effectively and efficiently within the limits of local, state, and federal budget constraints with fiscal accountability.
We believe all students learn best in a safe, supportive, and secure environment.
We will ensure that the learning and work environments are safe and nurturing so that each student and staff member will achieve highlevels of performance.
Turner ElementaryGenerated by Plan4Learning.com 2 of 29
Campus #170-904-104February 4, 2020 3:03 pm
18-19 AAR Page 195
Table of Contents
Comprehensive Needs Assessment 4Needs Assessment Overview 4Demographics 5Student Academic Achievement 6School Processes & Programs 7Perceptions 8
Priority Problem Statements 9Comprehensive Needs Assessment Data Documentation 10Goals 12
Goal 1: All students will reach high academic standards, at a minimum attaining proficiency or better on state assessments. 12Goal 2: All parents will participate in regular, two-way, and meaningful communication involving student academic learning and school activities. 20Goal 3: All staff will be prepared to support student achievement. 22Goal 4: All district funds will be utilized for programs that ensure the success of every student. 25Goal 5: All students will be educated in learning environments that are safe and conducive to learning. 26
District Funding Summary 29
Turner ElementaryGenerated by Plan4Learning.com 3 of 29
Campus #170-904-104February 4, 2020 3:03 pm
18-19 AAR Page 196

Comprehensive Needs AssessmentRevised/Approved: September 01, 2018
Needs Assessment Overview
An examination of campus STAAR scores, primary DRA scores, and CA scores reflect a need for targeted instruction forstruggling students in both reading and writing in our primary grades, but indicate significant growth in our intermediate
grades. With the rigor of the STAAR tests, we know that we must continue to raise the bar in our academic expectations andbuild on students’ strengths to raise the level of academic achievement in all subject areas. We will continue to prepare all of
our students and work towards closing the achievement gap with our targeted groups. We will continue to meet weekly inprofessional learning communities to discuss student needs, analyze data, create action plans, and grow professionally with
one another. Based on teacher feedback, we are implementing more technology to meet the needs of all students andprovide remediation for other students. We are also determined to meet the needs of our Special Education students.
Through support facilitation, we are meeting those needs and provide valuable services to help all students be successful. Wewill also continue to implement school-wide strategies that are included throughout this plan that provide opportunities for all
students to meet the state standards, campus goals, and community expectations.
Turner ElementaryGenerated by Plan4Learning.com 4 of 29
Campus #170-904-104February 4, 2020 3:03 pm
18-19 AAR Page 197

Demographics
Demographics Summary
Turner is more than a school. It is a family of learners who grow together every day. Academics are important tous, but we realize that our students are so much more than their scores on a test. We strive to be a student-centered campus where challenges are viewed as an opportunity for growth, and where relationships matter.
Campus Size 772 Students
African American 4.29%Hispanic 22.44%White 67.87%Asian 1,80%Native American .42%Two or More Races 3.19%At-Risk 34.21%Economically Disadvantaged36.15%
Limited English Proficiency 5.12%
Turner ElementaryGenerated by Plan4Learning.com 5 of 29
Campus #170-904-104February 4, 2020 3:03 pm
18-19 AAR Page 198
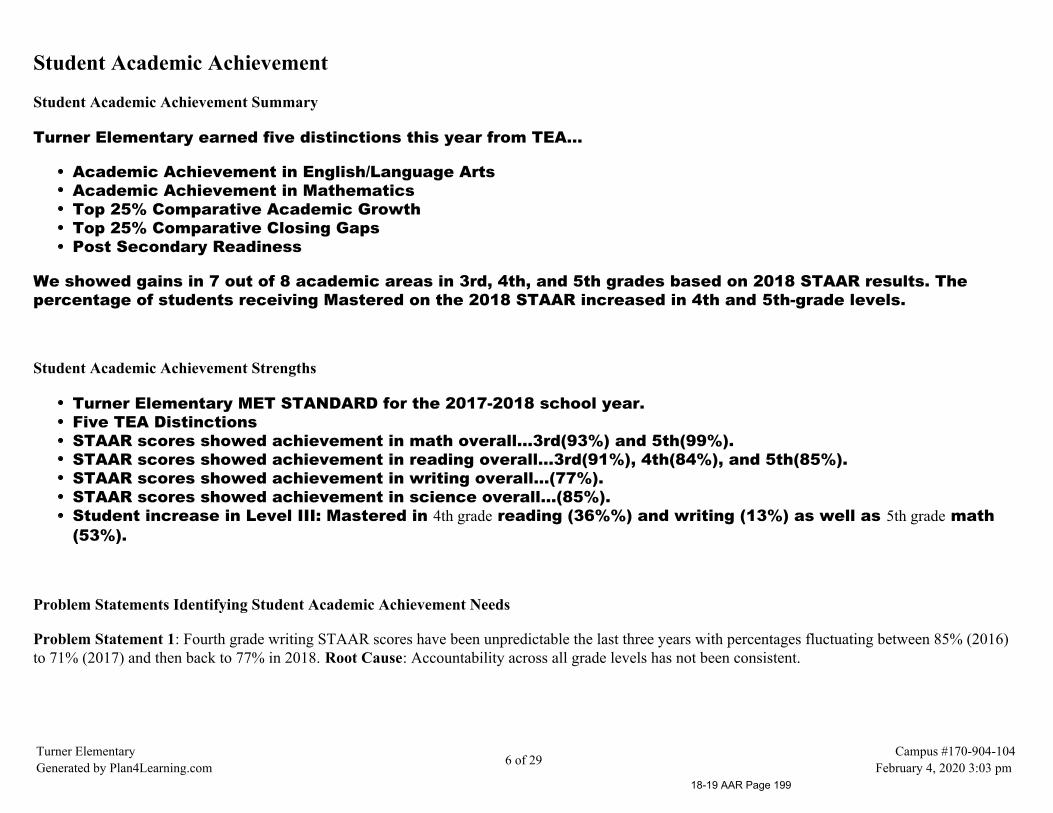
Student Academic Achievement
Student Academic Achievement Summary
Turner Elementary earned five distinctions this year from TEA...
Academic Achievement in English/Language ArtsAcademic Achievement in MathematicsTop 25% Comparative Academic GrowthTop 25% Comparative Closing GapsPost Secondary Readiness
We showed gains in 7 out of 8 academic areas in 3rd, 4th, and 5th grades based on 2018 STAAR results. Thepercentage of students receiving Mastered on the 2018 STAAR increased in 4th and 5th-grade levels.
Student Academic Achievement Strengths
Turner Elementary MET STANDARD for the 2017-2018 school year.Five TEA DistinctionsSTAAR scores showed achievement in math overall...3rd(93%) and 5th(99%).STAAR scores showed achievement in reading overall...3rd(91%), 4th(84%), and 5th(85%).STAAR scores showed achievement in writing overall...(77%).STAAR scores showed achievement in science overall...(85%).Student increase in Level III: Mastered in 4th grade reading (36%%) and writing (13%) as well as 5th grade math(53%).
Problem Statements Identifying Student Academic Achievement Needs
Problem Statement 1: Fourth grade writing STAAR scores have been unpredictable the last three years with percentages fluctuating between 85% (2016)to 71% (2017) and then back to 77% in 2018. Root Cause: Accountability across all grade levels has not been consistent.
Turner ElementaryGenerated by Plan4Learning.com 6 of 29
Campus #170-904-104February 4, 2020 3:03 pm
18-19 AAR Page 199
School Processes & Programs
School Processes & Programs Summary
Instruction is first and foremost at Turner Elementary. Collaboration meetings and lesson planning sessions arescheduled weekly with grade level teachers and instructional coaches. Instructional resources are available oncampus to help teach content and provide engagement opportunities for students. Campus staff development isplanned and prepared to assist teachers with upcoming standards as well as provide additional activities to helpextend our teaching standards. Our campus participates in Destination Imagination, LEGO-Robotics, ScienceClub, and Choir to encourage learning outside the classroom. We also host Kats for Christ and severalopportunities for families to be involved with our school.
Turner ElementaryGenerated by Plan4Learning.com 7 of 29
Campus #170-904-104February 4, 2020 3:03 pm
18-19 AAR Page 200
Perceptions
Perceptions Summary
Turner Elementary truly asks the question, "What's best for kids?" on a daily basis. We think about student needand student success, and then we make a plan for implementing strategies and deciding responsibility for ourcampus. While instruction will always be a priority, we also feel it's necessary to recognize kindness, encouragepositive friendships, and teach tolerance. As the Turner Tribe, we will continue to teach our students to have kindhearts, brave spirits, and fierce minds, but we are also encouraging our community to "Believe There Is Good InThe World" and to "Be the Good!"
Turner ElementaryGenerated by Plan4Learning.com 8 of 29
Campus #170-904-104February 4, 2020 3:03 pm
18-19 AAR Page 201
Priority Problem Statements
Problem Statement 1: Fourth grade writing STAAR scores have been unpredictable the last three years with percentages fluctuating between 85% (2016)to 71% (2017) and then back to 77% in 2018.Root Cause 1: Accountability across all grade levels has not been consistent.Problem Statement 1 Areas: Student Achievement
Turner ElementaryGenerated by Plan4Learning.com 9 of 29
Campus #170-904-104February 4, 2020 3:03 pm
18-19 AAR Page 202

Comprehensive Needs Assessment Data DocumentationThe following data were used to verify the comprehensive needs assessment analysis:
Improvement Planning Data
District goalsCampus goalsCurrent and/or prior year(s) campus and/or district improvement plansCampus and/or district planning and decision making committee(s) meeting dataState and federal planning requirements
Accountability Data
Texas Academic Performance Report (TAPR) dataDomain 1 - Student AchievementDomain 2 - Student ProgressDomain 3 - Closing the GapsEffective Schools Framework dataAccountability Distinction DesignationsFederal Report Card DataPBMAS data
Student Data: Assessments
State and federally required assessment information (e.g. curriculum, eligibility, format, standards, accommodations, TEA information)State of Texas Assessments of Academic Readiness (STAAR) current and longitudinal results, including all versionsSTAAR Released Test QuestionsSTAAR EL Progress Measure dataTexas English Language Proficiency Assessment System (TELPAS) resultsTexas Primary Reading Inventory (TPRI), Tejas LEE, or other alternate early reading assessment resultsStudent Success Initiative (SSI) data for Grades 5 and 8SSI: Istation Indicators of Progress (ISIP) accelerated reading assessment data for Grades 3-5 (TEA approved statewide license)SSI: Think Through Math assessment data for Grades 3-8 and Algebra I (TEA approved statewide license)Running Records resultsObservation Survey results
Parent/Community Data
Turner ElementaryGenerated by Plan4Learning.com 10 of 29
Campus #170-904-104February 4, 2020 3:03 pm
18-19 AAR Page 203

Parent surveys and/or other feedbackParent engagement rateCommunity surveys and/or other feedback
Turner ElementaryGenerated by Plan4Learning.com 11 of 29
Campus #170-904-104February 4, 2020 3:03 pm
18-19 AAR Page 204

Goals
Goal 1: All students will reach high academic standards, at a minimum attaining proficiency or better onstate assessments.
Performance Objective 1: Turner Elementary students will achieve 85% mastery on their grade level assessments in reading and meet or exceed the stateaverage on 2019 STAAR as well as at least 30% attaining Level III: Mastered.
Evaluation Data Source(s) 1: Impact will be determined by the percentage of students scoring 85% or better on the STAAR assessment.
OBJECTIVE PROGRESS: STAAR reading scores indicate more than 85% met standard in 3rd grade (86%) , 4th grade (87%), and 5th grade(94%). All three grade levels had more than 30% achieve Masters: 3rd (37%), 4th (33%), 5th (37%). Turner Elementary students exceededstate average on 3rd, 4th, and 5th grade Reading STAAR.
Summative Evaluation 1: Exceeded Performance Objective
Strategy Description Monitor Strategy's Expected Result/ImpactReviews
Formative SummativeNov Jan Mar June
1) Lesson plans to reflect focused instruction alignedwith TEKS, district pacing guide, IFD, and Strategic 6.Teachers will continue to focus on the BalancedLiteracy model as a guide for instruction.
Administrators,campus coaches,and teachers
Improved planning and instruction will lead to studentgrowth and performance.
2) Staff Development will be planned to address theneeds of staff for successful implementation of theTEKS and best instructional practices in all coreareas...Ed Camp, Leach Literacy PD, focused writingactivities, etc...
Administrators,District andCampus Coaches
Improved planning and instruction will lead to studentgrowth and performance.
3) Develop and provide diagnostic tools to assessstudent achievement...MAP screeners, DRA, andcommon assessments.
Administrators,Coaches, TeamLeaders, Teachers
Improved progress monitoring will promote data driveninstruction.
Turner ElementaryGenerated by Plan4Learning.com 12 of 29
Campus #170-904-104February 4, 2020 3:03 pm
18-19 AAR Page 205

Strategy Description Monitor Strategy's Expected Result/ImpactReviews
Formative SummativeNov Jan Mar June
4) RTI meetings will be held monthly for Tier IIstudents and weekly for Tier III students in order totarget those needing intervention.
Administrators,Teachers, CampusCoaches, Counselor
Reduced number of academically fragile students
5) Create STAAR Learning Summits for targeted 3rd,4th, and 5th graders to reteach and assist with raisingthe achievement level and closing the performance gap.
Administrators,Staff
Improved student performance and decreasingperformance gap
6) Technology will be increased by providing teacherswith more technology such as Chrome books andIpads...These items will assist implementation of StudyIsland, Exact Path, and MyOn.
Administrator,ICoach, Tech Dept.
All classrooms are equipped with appropriate technologyto meet the needs of the classroom as well as provideengaging lessons.
7) Plan and host at least two schoolwide academic-based Family Nights for both math/reading and sciencenight.
Administrators,Teachers
Increase in student and parent involvement as well aseducate parents about learning expectations.
8) Turner Elementary will utilize support facilitation toinsure the academic needs of students with disabilitiesare being met in the least restrictive environment.
Administrators Increase in academic growth of students on assessmentsand in meeting IEP Goals.
9) Implement Study Island in grade levels after MAPscreeners to increase student RIT scores.
Teachers, Admin. Student growth in content areas
= Accomplished = Continue/Modify = No Progress = Discontinue
Turner ElementaryGenerated by Plan4Learning.com 13 of 29
Campus #170-904-104February 4, 2020 3:03 pm
18-19 AAR Page 206

Goal 1: All students will reach high academic standards, at a minimum attaining proficiency or better on state assessments.
Performance Objective 2: Turner Elementary students will achieve 88% mastery on their grade level assessments in math and meet or exceed the stateaverage on 2019 STAAR as well as at least 40% attaining Level III: Mastered.
Evaluation Data Source(s) 2: Impact will be determined by the percentage of students scoring 88% or better on the STAAR assessment.
OBJECTIVE PROGRESS: STAAR math scores indicate more than 88% met standard in 3rd grade (89%), 4th grade (95%), and 5th grade(98%). Two grade levels had more than 40% achieve Masters: 4th grade (46%) and 5th grade (66%). However, only 24% of 3rd grade achievedMasters. Turner Elementary students exceeded state average on 3rd, 4th, and 5th grade Math STAAR.
Summative Evaluation 2: Significant progress made toward meeting Performance Objective
Strategy Description Monitor Strategy's Expected Result/ImpactReviews
Formative SummativeNov Jan Mar June
1) Lesson plans to reflect focused instruction alignedwith TEKS, district pacing guide, Balanced MathModel, and Strategic 6.
Administrators,Teachers
Improved planning and instruction will lead to studentgrowth and performance.
2) Staff Development will be planned to address theneeds of staff for successful implementation of theTEKS and best instructional practices in all coreareas...Resources include Marcy Cook and Greg Tang.
Administrators,District andCampus Coaches
Improved planning and instruction will lead to studentgrowth and performance.
3) Develop and provide diagnostic tools to assessstudent achievement such as MAP screeners andCommon Assessments.
Administrators,Coaches, TeamLeaders
Improved progress monitoring provides data driveninstruction.
4) RTI meetings will be held monthly for Tier IIstudents and weekly for Tier III students in order totarget those needing intervention.
Administrators,Campus Coaches,Teachers,Counselor
Reduced number of academically fragile students
5) Create STAAR Learning Summits for targeted 3rd,4th, and 5th graders to reteach and assist with raisingthe achievement level and closing the performance gap.
Administrators,Staff
Improved student performance and decreasingperformance gap
Turner ElementaryGenerated by Plan4Learning.com 14 of 29
Campus #170-904-104February 4, 2020 3:03 pm
18-19 AAR Page 207

Strategy Description Monitor Strategy's Expected Result/ImpactReviews
Formative SummativeNov Jan Mar June
6) Technology will be increased by providing teacherswith more technology such as Chrome books to helpwith implementation of Study Island and Exact Path.
Administrator,ICoach, Tech Dept.
All classrooms are equipped with appropriate technologyto meet the needs of the classroom as well as increaseengaging instruction.
7) Instructional materials such as manipulatives andmath literacy will continue to be purchased to addinstructional materials to the Math Lab.
Administrators,Math CampusCoach
Teachers will receive support from the campus mathcoach regarding materials for planning. Teachers willcheck out materials.
8) Plan and host at least two schoolwide academic-based Family Nights for both math/reading and sciencenights.
Administrators,Committee Chairs
Increase in student and parent involvement as well aseducate parents about learning expectations.
9) Implement Study Island in grade levels after MAPscreeners to increase student RIT scores.
Teachers, Admin. Student growth in content areas
10) Turner Elementary will utilize support facilitationto insure the academic needs of students withdisabilities are being met in the least restrictiveenvironment.
Administrators Increase in academic growth of students on assessmentsand in meeting IEP Goals.
= Accomplished = Continue/Modify = No Progress = Discontinue
Turner ElementaryGenerated by Plan4Learning.com 15 of 29
Campus #170-904-104February 4, 2020 3:03 pm
18-19 AAR Page 208
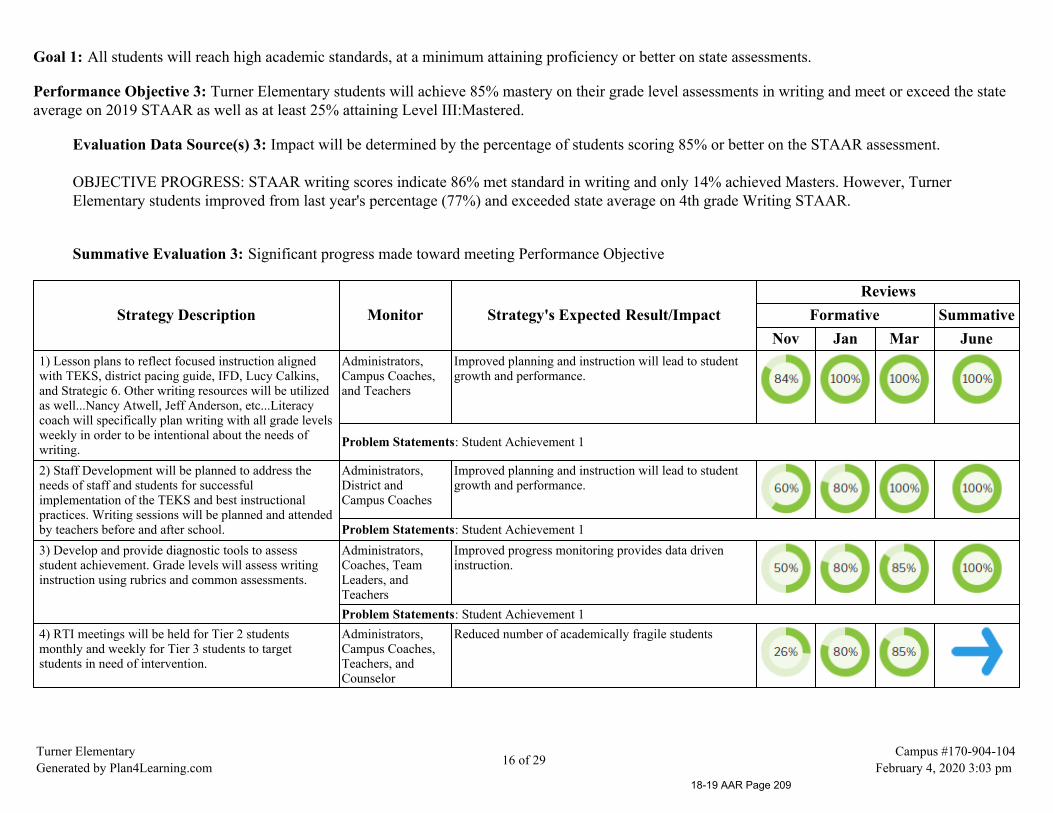
Goal 1: All students will reach high academic standards, at a minimum attaining proficiency or better on state assessments.
Performance Objective 3: Turner Elementary students will achieve 85% mastery on their grade level assessments in writing and meet or exceed the stateaverage on 2019 STAAR as well as at least 25% attaining Level III:Mastered.
Evaluation Data Source(s) 3: Impact will be determined by the percentage of students scoring 85% or better on the STAAR assessment.
OBJECTIVE PROGRESS: STAAR writing scores indicate 86% met standard in writing and only 14% achieved Masters. However, TurnerElementary students improved from last year's percentage (77%) and exceeded state average on 4th grade Writing STAAR.
Summative Evaluation 3: Significant progress made toward meeting Performance Objective
Strategy Description Monitor Strategy's Expected Result/ImpactReviews
Formative SummativeNov Jan Mar June
1) Lesson plans to reflect focused instruction alignedwith TEKS, district pacing guide, IFD, Lucy Calkins,and Strategic 6. Other writing resources will be utilizedas well...Nancy Atwell, Jeff Anderson, etc...Literacycoach will specifically plan writing with all grade levelsweekly in order to be intentional about the needs ofwriting.
Administrators,Campus Coaches,and Teachers
Improved planning and instruction will lead to studentgrowth and performance.
Problem Statements: Student Achievement 1
2) Staff Development will be planned to address theneeds of staff and students for successfulimplementation of the TEKS and best instructionalpractices. Writing sessions will be planned and attendedby teachers before and after school.
Administrators,District andCampus Coaches
Improved planning and instruction will lead to studentgrowth and performance.
Problem Statements: Student Achievement 13) Develop and provide diagnostic tools to assessstudent achievement. Grade levels will assess writinginstruction using rubrics and common assessments.
Administrators,Coaches, TeamLeaders, andTeachers
Improved progress monitoring provides data driveninstruction.
Problem Statements: Student Achievement 14) RTI meetings will be held for Tier 2 studentsmonthly and weekly for Tier 3 students to targetstudents in need of intervention.
Administrators,Campus Coaches,Teachers, andCounselor
Reduced number of academically fragile students
Turner ElementaryGenerated by Plan4Learning.com 16 of 29
Campus #170-904-104February 4, 2020 3:03 pm
18-19 AAR Page 209

Strategy Description Monitor Strategy's Expected Result/ImpactReviews
Formative SummativeNov Jan Mar June
5) Create STAAR Learning Summit for targeted 3rd,4th, and 5th graders to reteach and assist with raisingthe achievement level and closing the performance gap.
Administrators,Staff
Improved student performance and decreaseperformance gap
6) Technology will be increased by providing teacherswith more technology such as Chromebooks.
Administrator,ICoach, Tech Dept.
All classrooms are equipped with appropriate technologyto meet the needs of the classroom as well as provideengaging instruction.
7) Turner Elementary will utilize the inclusion model toinsure the academic needs of students with disabilitiesare being met in the least restrictive environment.
Administrators Increase in academic growth of students on assessmentsand in meeting IEP Goals.
8) Implement Study Island in grade levels after MAPscreeners to increase student RIT scores.
Teachers, Admin. Student growth in content areas
= Accomplished = Continue/Modify = No Progress = Discontinue
Performance Objective 3 Problem Statements:
Student AchievementProblem Statement 1: Fourth grade writing STAAR scores have been unpredictable the last three years with percentages fluctuating between 85% (2016) to 71% (2017) and then back to77% in 2018. Root Cause 1: Accountability across all grade levels has not been consistent.
Turner ElementaryGenerated by Plan4Learning.com 17 of 29
Campus #170-904-104February 4, 2020 3:03 pm
18-19 AAR Page 210
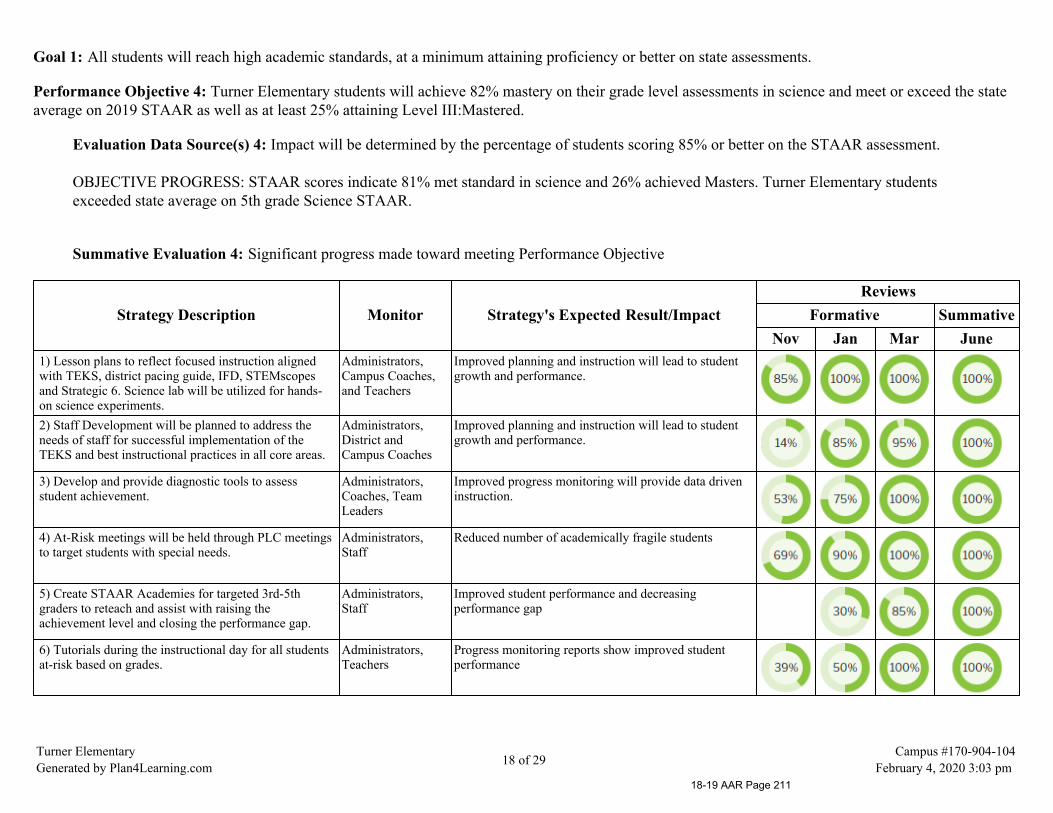
Goal 1: All students will reach high academic standards, at a minimum attaining proficiency or better on state assessments.
Performance Objective 4: Turner Elementary students will achieve 82% mastery on their grade level assessments in science and meet or exceed the stateaverage on 2019 STAAR as well as at least 25% attaining Level III:Mastered.
Evaluation Data Source(s) 4: Impact will be determined by the percentage of students scoring 85% or better on the STAAR assessment.
OBJECTIVE PROGRESS: STAAR scores indicate 81% met standard in science and 26% achieved Masters. Turner Elementary studentsexceeded state average on 5th grade Science STAAR.
Summative Evaluation 4: Significant progress made toward meeting Performance Objective
Strategy Description Monitor Strategy's Expected Result/ImpactReviews
Formative SummativeNov Jan Mar June
1) Lesson plans to reflect focused instruction alignedwith TEKS, district pacing guide, IFD, STEMscopesand Strategic 6. Science lab will be utilized for hands-on science experiments.
Administrators,Campus Coaches,and Teachers
Improved planning and instruction will lead to studentgrowth and performance.
2) Staff Development will be planned to address theneeds of staff for successful implementation of theTEKS and best instructional practices in all core areas.
Administrators,District andCampus Coaches
Improved planning and instruction will lead to studentgrowth and performance.
3) Develop and provide diagnostic tools to assessstudent achievement.
Administrators,Coaches, TeamLeaders
Improved progress monitoring will provide data driveninstruction.
4) At-Risk meetings will be held through PLC meetingsto target students with special needs.
Administrators,Staff
Reduced number of academically fragile students
5) Create STAAR Academies for targeted 3rd-5thgraders to reteach and assist with raising theachievement level and closing the performance gap.
Administrators,Staff
Improved student performance and decreasingperformance gap
6) Tutorials during the instructional day for all studentsat-risk based on grades.
Administrators,Teachers
Progress monitoring reports show improved studentperformance
Turner ElementaryGenerated by Plan4Learning.com 18 of 29
Campus #170-904-104February 4, 2020 3:03 pm
18-19 AAR Page 211

Strategy Description Monitor Strategy's Expected Result/ImpactReviews
Formative SummativeNov Jan Mar June
7) Technology will be increased by providing teacherswith appropriate technology for engagement.
Administrator,ICoach, Tech Dept.
All classrooms are equipped with appropriate technologyto meet the needs of the classroom.
8) Plan and host schoolwide academic-based FamilyNights for both math/science.
Administrators,Committee Chairs
Increase in student and parent involvement as well ascommunity - EXXONMobil Science AmbassadorProgram.
9) Turner Elementary will utilize the inclusion model toinsure the academic needs of students with disabilitiesare being met in the least restrictive environment.
Administrators Increase in academic growth of students on assessmentsand in meeting IEP Goals.
10) Fourth and fifth grade students will have anopportunity to participate in a Science Club beforeschool hosted by Mrs. Durrenberger and Mr. Scatesonce a month.
Administrators Extended exposure to Science TEKS will lead to studentgrowth.
11) Implement Study Island in grade levels after MAPscreeners to increase student RIT scores.
Teachers, Admin. Student growth in content areas
12) In order to meet the needs of all students, AdvancedAcademic activities (Destination Imagination andLEGO-Robotics) will be implemented to extendlearning outside the classroom.
Teachers, Admin. Impact will be evaluated through the participation ofstudents and the integration of learning into theclassroom.
= Accomplished = Continue/Modify = No Progress = Discontinue
Turner ElementaryGenerated by Plan4Learning.com 19 of 29
Campus #170-904-104February 4, 2020 3:03 pm
18-19 AAR Page 212

Goal 2: All parents will participate in regular, two-way, and meaningful communication involving studentacademic learning and school activities.
Performance Objective 1: In addition to our family nights, Open House, and family breakfasts, Turner Elementary will achieve 10% growth inparticipation of schoolwide activities involving student learning by implementing two additional parent information nights during the 2018-2019 schoolyear.
Evaluation Data Source(s) 1: Impact will be evaluated by 10% increase of parental involvement in school wide activities on sign in sheets.
OBJECTIVE PROGRESS: Parent Involvement remained around the same as parent involvement activities continued to be offered at ourcampus...Book Fairs, Reading/Math/Science Night, Muffins with Mom, Donuts with Dad, and Goodies with Grandparents were continuedevents added to the school year along with Music programs, Fall Festival, and additional STAAR Information Night. There is always a stronginterest in PTO membership and WatchDOG membership at the beginning of the year; however, consistency as active participants remained thesame.
Summative Evaluation 1: Met Performance Objective
Strategy Description Monitor Strategy's Expected Result/ImpactReviews
Formative SummativeNov Jan Mar June
1) Turner will schedule Meet the Teacher night, OpenHouse, grade level music programs and academic peprallies, PTO meetings, WatchDOG rallies, familynights, and all parent involvement activities throughoutthe year. Call outs and website will be utilized forpublicity.
Administrators,Staff, PTO Board
Programs, Calendar, Raptor and Sign in sheets indicateincrease in parent attendance and involvement
2) Special Events: Grandparent's Day, Jump Rope forHeart, Turkey Trot, Reindeer Run, Field Day, and FallFestival.
CommitteeChairperson
Programs, Calendar, Raptor and Sign in sheets indicateincrease in parent attendance and involvement
3) Turner will track the amount of time parentsvolunteer throughout the year. All volunteers will berecognized at a luncheon held in May.
Administrators,Receptionist,Teachers
Raptor and sign in sheets for volunteers on the go
4) The A.R. Turner Web Page will be updatedperiodically to ensure all information is current as wellas broadcast proud moments on Twitter.
Webmaster Increase in the amount of visitors to our website
Turner ElementaryGenerated by Plan4Learning.com 20 of 29
Campus #170-904-104February 4, 2020 3:03 pm
18-19 AAR Page 213

Strategy Description Monitor Strategy's Expected Result/ImpactReviews
Formative SummativeNov Jan Mar June
5) Staff e-mail links will be posted on the Web Page forcommunity access.
Webmaster Increase in the amount of visitors to our website
6) Turner will hold a traditional Spelling Bee andScience Fair to reinforce basic skills and provide aforum for curricular enrichment.
Administrators,Staff
Increased participation
7) Music students will participate in grade levelproductions for family and community. 2nd/4th/& 5thgrade
Administrator,Choir Director,Teachers
Increase in audience and student participation
8) WatchDOGS program will continue for all dads andgrandfathers to participate in school activities...tutoring,small group instruction, mentoring, promoting positiveplay on the playground, etc...
Counselor,Assistant Principal
WatchDOGS are visible on campus and increase inparticipation
9) Plan and host at least two additional school-wideacademic-based Family Nights...One addressingKindergarten expectations and another addressing theformat of STAAR assessments.
Administrators,Committee Chairs,CampusInstructionalCoaches
Increase in attendance for Family Nights
10) Conduct Parent Surveys to gain feedback onacademics, climate, communication, environment, andchild safety
Administrators At least 80% of surveys are returned with feedback
11) Administrators will contact at least 300 parents togive positive praise to individual students.
Administrators,Counselor
Increase positive parent rapport to keep lines ofcommunication open.
12) Turner Elementary will continue to promote post-secondary opportunities with College T-Shirt onMondays for teachers, students, parents andcommunity.
Administrator,Counselor
= Accomplished = Continue/Modify = No Progress = Discontinue
Turner ElementaryGenerated by Plan4Learning.com 21 of 29
Campus #170-904-104February 4, 2020 3:03 pm
18-19 AAR Page 214

Goal 3: All staff will be prepared to support student achievement.
Performance Objective 1: 100% of all Turner Elementary students will be taught by a teacher who has met the requirement as Highly Qualified (HQ) inthe 2018-2019 school year.
Evaluation Data Source(s) 1: Impact will be determined by hiring 100% of our teachers who meet the requirement as Highly Qualified (HQ).
OBJECTIVE PROGRESS: All classroom teachers at Turner Elementary are Highly Qualified and meet state requirements.
Summative Evaluation 1: Met Performance Objective
Strategy Description Monitor Strategy's Expected Result/ImpactReviews
Formative SummativeNov Jan Mar June
1) Recruit early from pool of Highly Qualified teachersin core academic subject areas.
Administrators,Human Resource
Retention of HQ teachers and staff
2) ART will retain its highly qualified teachers: a. Provide mentors for new teachersb. Provide professional growth opportunities
Administrators Feedback from new teachers and returning staffdemonstrates success
= Accomplished = Continue/Modify = No Progress = Discontinue
Turner ElementaryGenerated by Plan4Learning.com 22 of 29
Campus #170-904-104February 4, 2020 3:03 pm
18-19 AAR Page 215
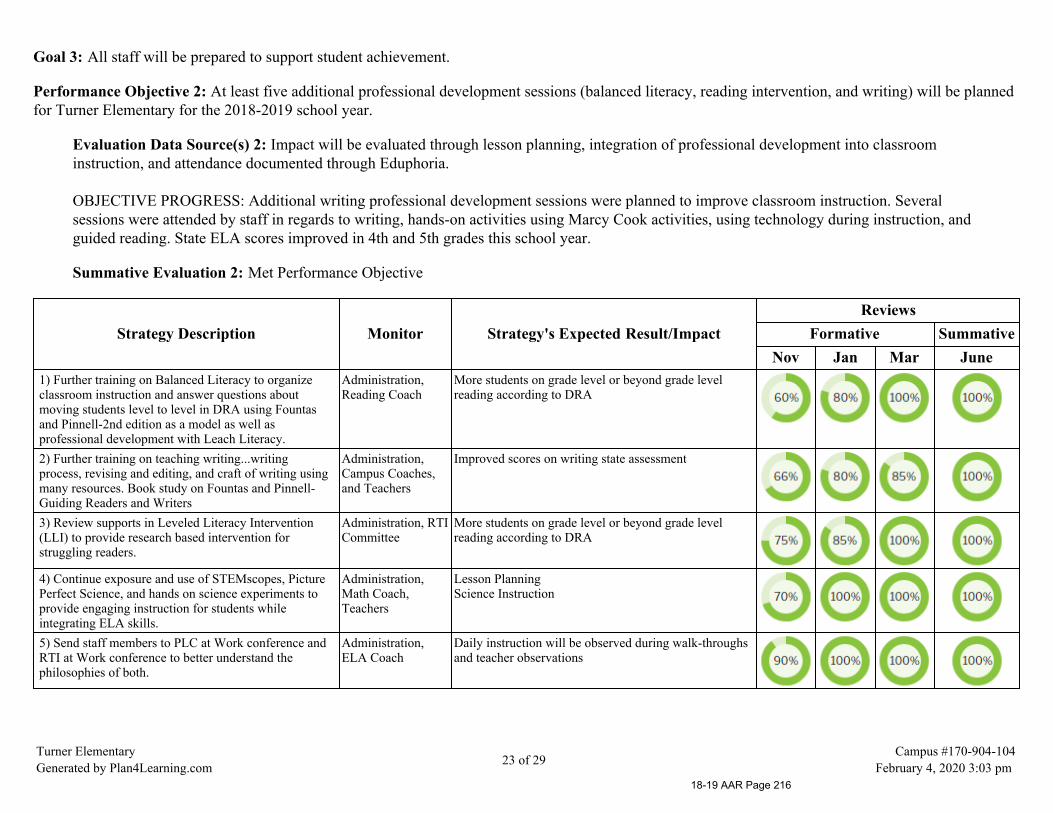
Goal 3: All staff will be prepared to support student achievement.
Performance Objective 2: At least five additional professional development sessions (balanced literacy, reading intervention, and writing) will be plannedfor Turner Elementary for the 2018-2019 school year.
Evaluation Data Source(s) 2: Impact will be evaluated through lesson planning, integration of professional development into classroominstruction, and attendance documented through Eduphoria.
OBJECTIVE PROGRESS: Additional writing professional development sessions were planned to improve classroom instruction. Severalsessions were attended by staff in regards to writing, hands-on activities using Marcy Cook activities, using technology during instruction, andguided reading. State ELA scores improved in 4th and 5th grades this school year.
Summative Evaluation 2: Met Performance Objective
Strategy Description Monitor Strategy's Expected Result/ImpactReviews
Formative SummativeNov Jan Mar June
1) Further training on Balanced Literacy to organizeclassroom instruction and answer questions aboutmoving students level to level in DRA using Fountasand Pinnell-2nd edition as a model as well asprofessional development with Leach Literacy.
Administration,Reading Coach
More students on grade level or beyond grade levelreading according to DRA
2) Further training on teaching writing...writingprocess, revising and editing, and craft of writing usingmany resources. Book study on Fountas and Pinnell-Guiding Readers and Writers
Administration,Campus Coaches,and Teachers
Improved scores on writing state assessment
3) Review supports in Leveled Literacy Intervention(LLI) to provide research based intervention forstruggling readers.
Administration, RTICommittee
More students on grade level or beyond grade levelreading according to DRA
4) Continue exposure and use of STEMscopes, PicturePerfect Science, and hands on science experiments toprovide engaging instruction for students whileintegrating ELA skills.
Administration,Math Coach,Teachers
Lesson PlanningScience Instruction
5) Send staff members to PLC at Work conference andRTI at Work conference to better understand thephilosophies of both.
Administration,ELA Coach
Daily instruction will be observed during walk-throughsand teacher observations
Turner ElementaryGenerated by Plan4Learning.com 23 of 29
Campus #170-904-104February 4, 2020 3:03 pm
18-19 AAR Page 216

Strategy Description Monitor Strategy's Expected Result/ImpactReviews
Formative SummativeNov Jan Mar June
6) Attend NWEA training and implement MAP dataand records into PLC to plan for intervention andstudent growth.
Administration,InstructionalCoaches
= Accomplished = Continue/Modify = No Progress = Discontinue
Turner ElementaryGenerated by Plan4Learning.com 24 of 29
Campus #170-904-104February 4, 2020 3:03 pm
18-19 AAR Page 217
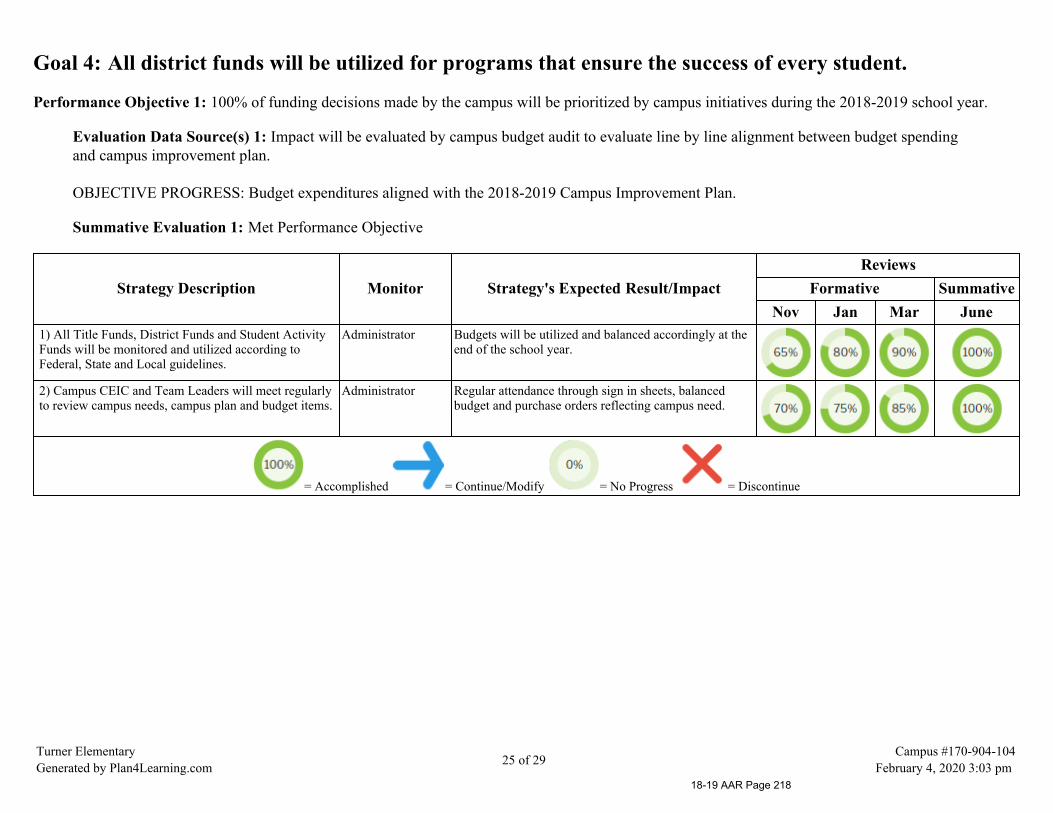
Goal 4: All district funds will be utilized for programs that ensure the success of every student.
Performance Objective 1: 100% of funding decisions made by the campus will be prioritized by campus initiatives during the 2018-2019 school year.
Evaluation Data Source(s) 1: Impact will be evaluated by campus budget audit to evaluate line by line alignment between budget spendingand campus improvement plan.
OBJECTIVE PROGRESS: Budget expenditures aligned with the 2018-2019 Campus Improvement Plan.
Summative Evaluation 1: Met Performance Objective
Strategy Description Monitor Strategy's Expected Result/ImpactReviews
Formative SummativeNov Jan Mar June
1) All Title Funds, District Funds and Student ActivityFunds will be monitored and utilized according toFederal, State and Local guidelines.
Administrator Budgets will be utilized and balanced accordingly at theend of the school year.
2) Campus CEIC and Team Leaders will meet regularlyto review campus needs, campus plan and budget items.
Administrator Regular attendance through sign in sheets, balancedbudget and purchase orders reflecting campus need.
= Accomplished = Continue/Modify = No Progress = Discontinue
Turner ElementaryGenerated by Plan4Learning.com 25 of 29
Campus #170-904-104February 4, 2020 3:03 pm
18-19 AAR Page 218

Goal 5: All students will be educated in learning environments that are safe and conducive to learning.
Performance Objective 1: Turner Elementary will maintain high expectations toward a safe and structured learning environment with the implementation of token economies and positive behavior supports in 90% of all classrooms during the 2018-2019 school year.
Evaluation Data Source(s) 1: Impact will be evaluated by the percentage of annual decreases in referrals.
OBJECTIVE PROGRESS: Incidents were less than 1% each six weeks. Positive behavior supports are in place for 90% of all classrooms aswell as schoolwide...Examples include Lunch Bunch, Student Shout Outs, Popcorn Posse, etc...
Summative Evaluation 1: Met Performance Objective
Strategy Description Monitor Strategy's Expected Result/ImpactReviews
Formative SummativeNov Jan Mar June
1) Guidance lessons about teasing, bullying, decisionmaking, making/keeping friendship lessons forstudents.
Counselor Decrease in Bullying incidents
2) Turner Elementary will monitor CHAMPS structurefor clear expectations in the classroom.
Administrators,teachers
Decrease in the number of discipline referrals
3) Turner Elementary will have Safe School videosavailable for those needing more guidance in PBIS.
Administrators Awareness among staff regarding student safety
= Accomplished = Continue/Modify = No Progress = Discontinue
Turner ElementaryGenerated by Plan4Learning.com 26 of 29
Campus #170-904-104February 4, 2020 3:03 pm
18-19 AAR Page 219

Goal 5: All students will be educated in learning environments that are safe and conducive to learning.
Performance Objective 2: Turner Elementary will maintain high expectations for attendance rates per six weeks striving for at least 97% for 2018-2019school year.
Evaluation Data Source(s) 2: Impact will be evaluated each six weeks focusing on the attendance percentage.
OBJECTIVE PROGRESS: Attendance maintained 97% only in the 1st six weeks and 2nd six weeks. Attendance never fell below 95%.
Summative Evaluation 2: Some progress made toward meeting Performance Objective
Strategy Description Monitor Strategy's Expected Result/ImpactReviews
Formative SummativeNov Jan Mar June
1) A.R. Turner Elementary School will increaseawareness about attendance with an attendancecommittee reviewing and discussing incentives as wellas families with attendance issues.
Administrators,Leadership Team
Increase in A.R. Turner attendance rate. Letters sendhome weekly.
2) Calls will be made to parents after 3 tardies and 3absences.
Administrator,Registrar, Staff
Increase in attendance
3) Cookie parties to classes with Perfect Attendancestrip...Weekly announcements and popcorn and/orcommunity incentives to those with Perfect Attendancefor the whole week.
Administrator,Registrar, Staff
Increase in attendance
Funding Sources: 199 - General Fund - 300.00
= Accomplished = Continue/Modify = No Progress = Discontinue
Turner ElementaryGenerated by Plan4Learning.com 27 of 29
Campus #170-904-104February 4, 2020 3:03 pm
18-19 AAR Page 220

Goal 5: All students will be educated in learning environments that are safe and conducive to learning.
Performance Objective 3: Staff morale and culture will be a focus during the 2018-2019 school year implementing at least 5 additional fun activities forstaff.
Evaluation Data Source(s) 3: Impact will be evaluated in May using staff survey.
OBJECTIVE PROGRESS: Staff pot luck lunches and off-campus dinners were planned throughout the year.
Summative Evaluation 3: Met Performance Objective
Strategy Description Monitor Strategy's Expected Result/ImpactReviews
Formative SummativeNov Jan Mar June
1) Beginning of the year family get together...hot dogsand Bingo, Tailgate Party during Homecoming,Runaway Pumpkin, Elf on a Shelf, Spring Fun
Admin, FunCommittee
Elevated morale
2) Fridays will be school "Spirit Day". Staff andstudents will have the opportunity to dress accordingly(within the professional dress code).
All Staff Increase in the number of staff and students that aredressed in Wildkat gear each Friday.
3) Teacher luncheons will be scheduled at least 4 timesper year. FUN Committee and retired teachers (STAR)will organize a pot luck lunches for all staff.
CommitteeChairperson
Sign up sheets for pot luck lunches by staff hasincreased.
4) Jean rewards for teachers/staff to celebrate successessuch as professional development attendance.
Administrators Increase in staff morale, attendance and participation inactivities
5) Team Leaders and CEIC will meet to discuss campusneeds.
Administrator,Team Leaders,CEIC
Areas addressed as campus needs will showimprovement
6) Turner Elementary will participate in monthly firedrills, Shelter In Place training, Rave Panic app, andSafe School Training.
Administration Heightened awareness about emergency situations.
= Accomplished = Continue/Modify = No Progress = Discontinue
Turner ElementaryGenerated by Plan4Learning.com 28 of 29
Campus #170-904-104February 4, 2020 3:03 pm
18-19 AAR Page 221
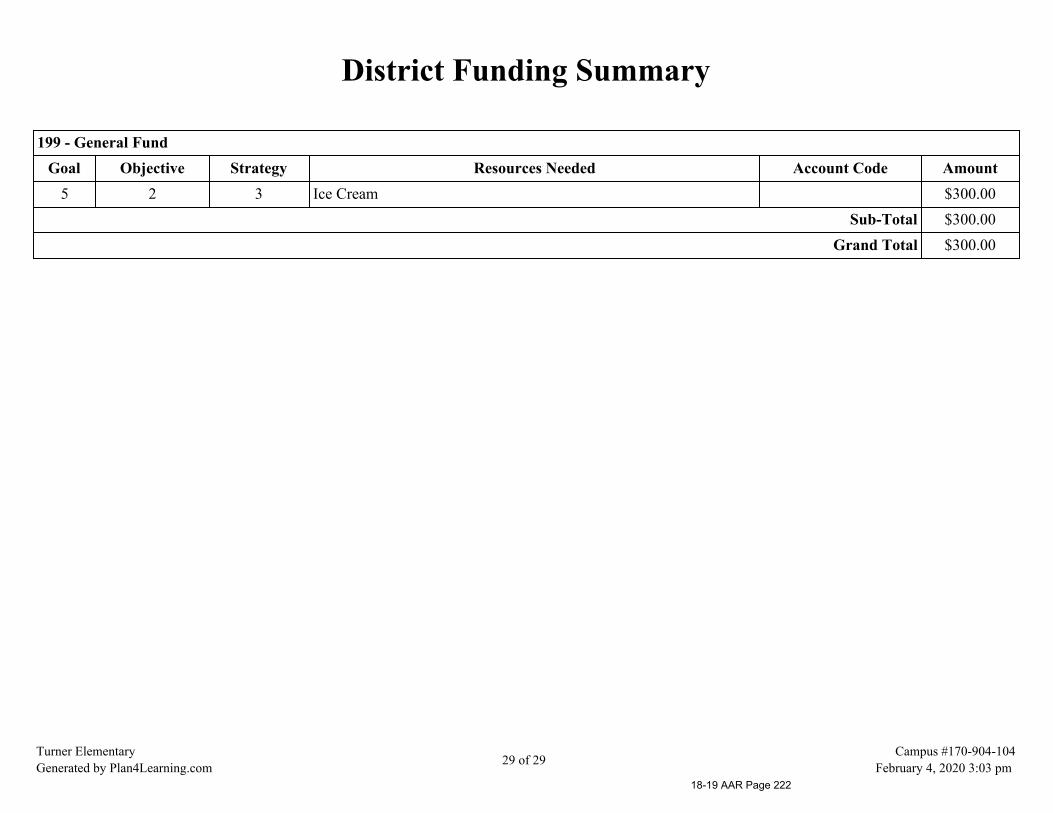
District Funding Summary
199 - General FundGoal Objective Strategy Resources Needed Account Code Amount
5 2 3 Ice Cream $300.00Sub-Total $300.00
Grand Total $300.00
Turner ElementaryGenerated by Plan4Learning.com 29 of 29
Campus #170-904-104February 4, 2020 3:03 pm
18-19 AAR Page 222

Willis Independent School District
Cannan Elementary
2018-2019 Accountability Rating: Met Standard
Distinction Designations:Top 25 Percent: Comparative Academic Growth
Cannan ElementaryGenerated by Plan4Learning.com 1 of 50
Campus #170-904-106February 4, 2020 3:01 pm
18-19 AAR Page 223

Mission Statement
The mission of Cannan Elementary School is to create a collaborative, safelearning environment which empowers all students to achieve success with
high expectations through real world experiences.
Vision
We are Game Changers at Cannan Elementary! Moving from Good to Greatthrough high expectations for students.
Core Beliefs
Cannan's Core Beliefs are:
1. Students will rise to meet and achieve high academic expectations.
2. Learning should be fun and engaging for all students.
3. School is a place where every child belongs and can find their path to beinga successful citizen for our nation and world.
Cannan ElementaryGenerated by Plan4Learning.com 2 of 50
Campus #170-904-106February 4, 2020 3:01 pm
18-19 AAR Page 224
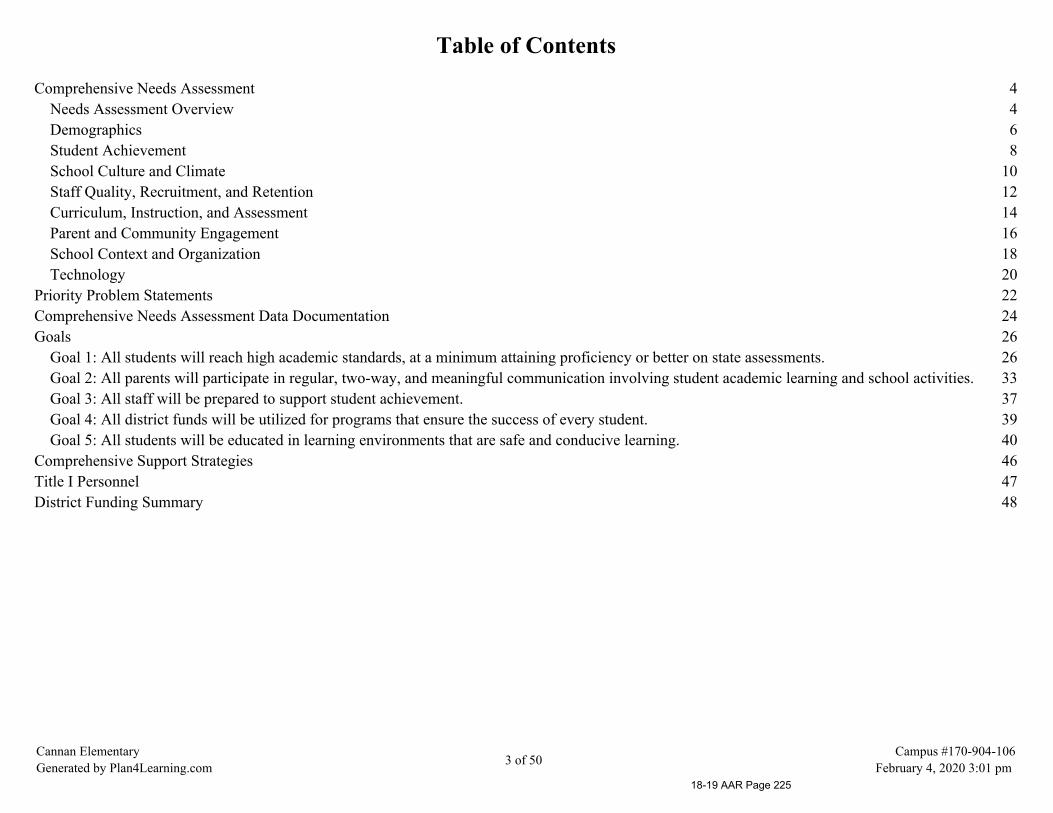
Table of Contents
Comprehensive Needs Assessment 4Needs Assessment Overview 4Demographics 6Student Achievement 8School Culture and Climate 10Staff Quality, Recruitment, and Retention 12Curriculum, Instruction, and Assessment 14Parent and Community Engagement 16School Context and Organization 18Technology 20
Priority Problem Statements 22Comprehensive Needs Assessment Data Documentation 24Goals 26
Goal 1: All students will reach high academic standards, at a minimum attaining proficiency or better on state assessments. 26Goal 2: All parents will participate in regular, two-way, and meaningful communication involving student academic learning and school activities. 33Goal 3: All staff will be prepared to support student achievement. 37Goal 4: All district funds will be utilized for programs that ensure the success of every student. 39Goal 5: All students will be educated in learning environments that are safe and conducive learning. 40
Comprehensive Support Strategies 46Title I Personnel 47District Funding Summary 48
Cannan ElementaryGenerated by Plan4Learning.com 3 of 50
Campus #170-904-106February 4, 2020 3:01 pm
18-19 AAR Page 225

Comprehensive Needs Assessment
Needs Assessment Overview
Edward B Cannan Elementary School opened in 1999. Many challenges hereat Cannan have been addressed using the data collected from our needsassessment. The data used for the needs assessment is an accumulation ofstudent performance on STAAR, TELPAS, TPRI, DRA, Universal Screeners,RTI, attendance, discipline reports and parent surveys. The campus plan wasmade with the help of the campus team leaders and CEIC members.
Parent involvement is something that is a vital part of Cannan’s success.Volunteer opportunities are integrated into many of the programs that areoffered or occur at Cannan. Some of the opportunities are Grade Level ParentMeetings to review homework and strategies for success, Family ReadingNight, Family STAAR Night, PTO meetings, fundraisers, Fall Festival,Grandparent’s Day, Science Club monthly meetings, Field Days, TeacherAppreciation Week, PE Activities, Choir performances, Watch D.O.G.S.Program, Cannan M.O.M.S. program and Cannan’s participation in Texas
Cannan ElementaryGenerated by Plan4Learning.com 4 of 50
Campus #170-904-106February 4, 2020 3:01 pm
18-19 AAR Page 226

Go! Eat! Grow!. We use Monday folders, the electronic marquee, campus andteacher webpages, School Reach, and the district app to keep all parents andguardians informed.
Edward B. Cannan Elementary School will continue to develop a positiveclimate throughout the school year with counselor’s character buildinglessons, drug awareness week (Red Ribbon Week), academic recognition, andFall Festival and Accelerated Reader recognition.
The student attendance goal for the 2017-2018 school year is 97.2%. CannanElementary School will continue to focus on student attendance and staying atschool for the full day of instruction through the use of attendance incentiveprograms and the visual representation of daily attendance on our attendancebulletin board.
Cannan ElementaryGenerated by Plan4Learning.com 5 of 50
Campus #170-904-106February 4, 2020 3:01 pm
18-19 AAR Page 227

Demographics
Demographics Summary
Cannan Elementary School ended the 2017-2018 year with 703 students in grade Pre-Kindergartenthrough 5th.
70.6% Economically Disadvantaged38.8% English Language Learners53% Hispanic42% Caucasian2% African American.1% Asian2.5% Multi-Racial14% Mobility Rate
Demographics Strengths
Our Demographic strengths at Cannan are many. The 2018 STAAR Results reflect student growth from the 2016-2017 school year:
STAAR and STAAR Spanish COMBINED (Approaches):
3rd Grade Reading (2016): 55% 3rd Grade Reading (2017): 66%
3rd Grade Math (2016): 62% 3rd Grade Math (2017): 70%
4th Grade Reading (2016): 62% 4th Grade Reading (2017): 64%
4th Grade Math (2016): 72% 4th Grade Math (2017): 72%
4th Grade Writing (2016): 55% 4th Grade Writing (2017): 63%
Cannan ElementaryGenerated by Plan4Learning.com 6 of 50
Campus #170-904-106February 4, 2020 3:01 pm
18-19 AAR Page 228
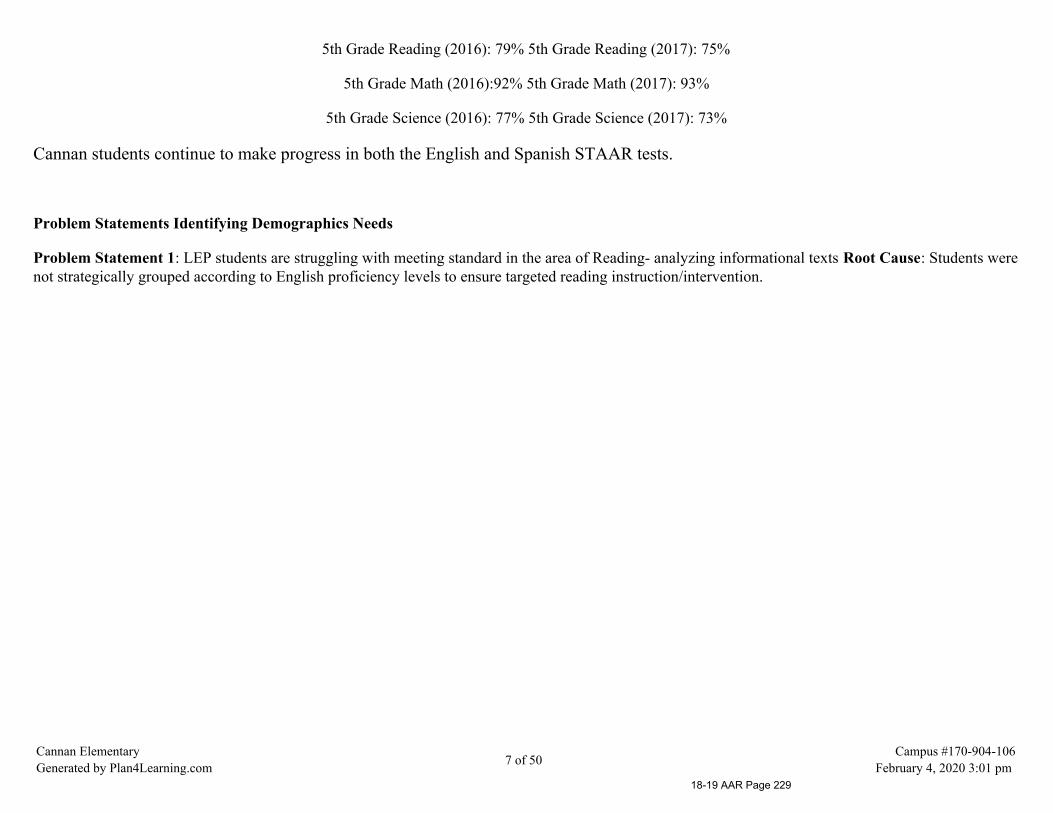
5th Grade Reading (2016): 79% 5th Grade Reading (2017): 75%
5th Grade Math (2016):92% 5th Grade Math (2017): 93%
5th Grade Science (2016): 77% 5th Grade Science (2017): 73%
Cannan students continue to make progress in both the English and Spanish STAAR tests.
Problem Statements Identifying Demographics Needs
Problem Statement 1: LEP students are struggling with meeting standard in the area of Reading- analyzing informational texts Root Cause: Students werenot strategically grouped according to English proficiency levels to ensure targeted reading instruction/intervention.
Cannan ElementaryGenerated by Plan4Learning.com 7 of 50
Campus #170-904-106February 4, 2020 3:01 pm
18-19 AAR Page 229

Student Achievement
Student Achievement Summary
The 2017-2018 STAAR Results reflect student growth from the 2016-2017 school year:
STAAR and STAAR Spanish COMBINED (Approaches):
3rd Grade Reading (2016): 55% 3rd Grade Reading (2017): 66%
3rd Grade Math (2016): 62% 3rd Grade Math (2017): 70%
4th Grade Reading (2016): 62% 4th Grade Reading (2017): 64%
4th Grade Math (2016): 72% 4th Grade Math (2017): 72%
4th Grade Writing (2016): 55% 4th Grade Writing (2017): 63%
5th Grade Reading (2016): 79% 5th Grade Reading (2017): 75%
5th Grade Math (2016):92% 5th Grade Math (2017): 93%
5th Grade Science (2016): 77% 5th Grade Science (2017): 73%
Cannan students continue to make progress in both the English and Spanish STAAR tests.
Student Achievement Strengths
Reviewing student progress longitudinally, Cannan students continue to make academic through the grade levels.
*In 2017, 61% of 3rd grade students achieved "Approaches" on STAAR Reading. In 2018, 71% of the same group of students achieved"Approaches." A 10 point growth over the year.
*In 2017, 66% of 3rd grade students achieved "Approaches" on STAAR Math, In 2018, 71%of the same group of students achieved"Approaches." This is a 5 point growth over the year.
Cannan ElementaryGenerated by Plan4Learning.com 8 of 50
Campus #170-904-106February 4, 2020 3:01 pm
18-19 AAR Page 230

*In 2017, 61% of 4th grade students achieved "Approaches" on STAAR Reading, In 2018, 67%%of the same group of students achieved"Approaches." This is a 6 point growth over the year.
*In 2017, 55% of 4th grade students achieved "Approaches" on STAAR Writing, In 2018, 67% of 4th grade students achieved"Approaches." This is a 12 point growth over the year.
Growth was maintained in other areas of student achievement as well from 2017-2018.
Problem Statements Identifying Student Achievement Needs
Problem Statement 1: 4th Grade STAAR Reading scores are below 70%. Root Cause: Insufficient reading comprehension strategies K-3rd.
Problem Statement 2: 4th Grade Writing scores are below 70% Root Cause: Lack of focus on editing/revision and grammar in K-3rd grade.
Cannan ElementaryGenerated by Plan4Learning.com 9 of 50
Campus #170-904-106February 4, 2020 3:01 pm
18-19 AAR Page 231

School Culture and Climate
School Culture and Climate Summary
Our Cannan CEIC met March 9, 2018, May 29, and May 31st to complete our comprehensive school needs assessment. School culture andclimate will continue to be addressed by creating a positive theme that supports student and staff growth and success. The theme will beutilized throughout the year as a fundamental part of Cannan Elementary School. The theme for the upcoming 2018-2019 school year is"Today, Readers, Tomorrow, Leaders." The foundation has been laid for building up students and staff at Cannan. This year, we aremoving to the next level of excellence as we make adjustments for targeted success in the area of reading. "Today, Readers, Tomorrow,Leaders" is an extension of our overriding focus to make gains in reading achievement for all students.
School Culture and Climate Strengths
A previous staff interview during the summer of 2016 indicated that teachers believed Cannan's greatest strength was how well teachersand staff worked together along with the family atmosphere on campus. The needs assessment for school culture and climate was extendedin 2017 to include community representation in the form of our parent-teacher organization- PTO. Some strengths that were shared fromPTO were positive school climate as well as improved communication between home and school.
To address the need for Cannan's various subgroups to connect to the school culture, which was a focus in 2017-2018, we set a goal tofurther improve our campus climate through the introduction of various clubs and activities such as Student Council, Elementary HonorSociety, Destination Imagination, and Hispanic Heritage Club. This year our school culture and climate needs assessment process beganwith a survey during our campus improvement committee meetings. Our staff and community members answered a survey regardingschool culture and climate. The following questions were asked:
1. How do students describe campus life with regards to respect, relationships, behavior, support, belonging, etc?
2. What strategies are in place to reduce the threat of bullying?
3. Are effective procedures in place to promote safety? Do students feel safe? How do we know?
4. Are disciplinary policies and practices proactive or reactive? Why? What areas specifically need to be addressed?
5. Do campus activities promote widespread student participation? Are they inclusive or exclusive?
Cannan ElementaryGenerated by Plan4Learning.com 10 of 50
Campus #170-904-106February 4, 2020 3:01 pm
18-19 AAR Page 232
Based on the responses we received from the survey, it is evident that a school wide systematic approach to behavior management isneeded. We will launch our PBIS program to address this issue in the 2018-2019 school year.
Problem Statements Identifying School Culture and Climate Needs
Problem Statement 1: Campus behavior expectations between students in K-2nd and 3rd-5th appear to be different, which has led to more frequentdiscipline incidents within grades 3rd-5th. Root Cause: School wide behavior expectations have been inconsistent and unenforced.
Cannan ElementaryGenerated by Plan4Learning.com 11 of 50
Campus #170-904-106February 4, 2020 3:01 pm
18-19 AAR Page 233

Staff Quality, Recruitment, and Retention
Staff Quality, Recruitment, and Retention Summary
The highest quality staff is a direct correlation to student achievement. Cannan Elementary will seek and keep highly qualified teachersthat bring a love of life long learning to every classroom. Administration will retain those teachers by creating a positive workenvironment. Teachers will receive positive feedback and appreciation items throughout the year.
Staff Quality, Recruitment, and Retention Strengths
For the 2018-2019 school year, we have selected several classes in K-2nd to loop up with their teacherto provide more effective, consist instruction. We began this process with one class in 2017-2018- aclass of 2nd graders to loop up with their teacher in 3rd grade. Based on data from benchmarks andcommon assessments, this group of students made significant gains reading and math. The teacher wasalso able to make positive contact with parents from the beginning of the school year since she wasalready familiar with the parents. We plan to loop students up with their teacher in several other K-2ndgrade classes this year.
To address issues in our English Language Learners' acquisition of the English language, our bilingualteacher team met to address class scheduling for next year. Teachers have worked on class lists ofbilingual classes to be more targeted with groups of students who are ready to transition into English.We have also paired our bilingual teachers according to strengths to ensure all of our bilingual studentsare making progress in English acquisition. We have worked hard to ensure most, if not all, teachers arein the grade level and subject area they feel most knowledgeable teaching.
Problem Statements Identifying Staff Quality, Recruitment, and Retention Needs
Cannan ElementaryGenerated by Plan4Learning.com 12 of 50
Campus #170-904-106February 4, 2020 3:01 pm
18-19 AAR Page 234
Problem Statement 1: Bilingual students are struggling with making gains on STAAR Reading and Writing Root Cause: Students class groupings are notin relation to their strength/weakness in English language acquisition.
Cannan ElementaryGenerated by Plan4Learning.com 13 of 50
Campus #170-904-106February 4, 2020 3:01 pm
18-19 AAR Page 235

Curriculum, Instruction, and Assessment
Curriculum, Instruction, and Assessment Summary
During the summer of 2017, our teacher leaders and administration attended the TEKS Resource conference in San Antonio. During theconference, we received training on how to use the TEKS Resource system to develop lessons and assessments that are aligned to thedepth and complexity of our current TEKS. Our teacher leaders and administrative team returned from the conference to train our staff onhow to use the system. TEKS Resource is our reference for our instructional focus guides, year at a glance documents, and structures forlesson planning. The TEKS Resource Assessment creator is now used to create common assessments within grade level teams to ensurestudents are being monitored and assessed in the same way. Our PLC meetings focus on disaggregating of common assessment studentdata assessments to plan how to address SE's that need focus. Our Literacy and Math Coaches assist teachers in daily instruction daily andhelp provide guidance in implementing balanced literacy and balanced math. Balanced literacy and balanced math are core parts ofinstruction in every classroom. Emphasis on science instruction through hands on lab activities is our focus for as well.
For the 2018-2019 school year, MAPS assessment will be implemented to provide targeted data of student achievement. Teachers will usethe data from MAPS to create intervention plans and intervention groups to close gaps in student achievement.
Curriculum, Instruction, and Assessment Strengths
-LLI Intervention time is structured into the daily schedule at Cannan. For the 2018-2019 school year,Tier 3 intervention groups will be expanded during Connect Time.
-PLC time is structured to review student data and devise a structured intervention plan and time.
-Tier III interventions occur on a regular basis after students are identified through the universalscreeners and DRA levels.
-Teacher planning time is consistent on a weekly basis with instructional coaches and administrators apart of the planning dialogue.
Cannan ElementaryGenerated by Plan4Learning.com 14 of 50
Campus #170-904-106February 4, 2020 3:01 pm
18-19 AAR Page 236
Problem Statements Identifying Curriculum, Instruction, and Assessment Needs
Problem Statement 1: Tier 2 intervention in reading and math using common assessment data is not implemented on a daily basis to help studentsunderstand currently taught concepts. Root Cause: Failure of teachers to plan as a team to share students in Tier 2 interventions. based on commonassessment unit data.
Cannan ElementaryGenerated by Plan4Learning.com 15 of 50
Campus #170-904-106February 4, 2020 3:01 pm
18-19 AAR Page 237

Parent and Community Engagement
Parent and Community Engagement Summary
Parent involvement is something that is a vital part of Cannan’ssuccess. Volunteer opportunities are integrated into many of theprograms that are offered or occur at Cannan. Some of theopportunities are Grade Level Parent Nights, Family Reading Nights,Family STAAR Nights, PTO meetings, fundraisers, Fall Festival,Grandparent’s Day, Science Club monthly meetings, Field Days,Teacher Appreciation Week, PE Activities, Choir performances, andWatch D.O.G.S. Program/Cannan M.O.M.S. Program. We useMonday folders, the electronic marquee, campus and teacherwebpages, and the district app to keep all parents and guardiansinformed.
Parent and Community Engagement Strengths
Cannan has a functioning and involved PTO. Our PTO had a strong showing at Meet the Teacher tosign parents up for PTO along with communication portals such as PTO Facebook and Twitter. For2017, we focused on increasing parent involvement from our bilingual community. One of our bilingualteachers served as our bilingual parent-teacher liaison who communicated needs and informationbetween PTO and our bilingual community. Upon meeting as a CEIC team to address family andCannan ElementaryGenerated by Plan4Learning.com 16 of 50
Campus #170-904-106February 4, 2020 3:01 pm
18-19 AAR Page 238

community involvement, the following questions were examined:
1. Do we focus on an authentic home/school connection to educate and engage parents in understandinghow to support their children? Yes How? Cannan provides events such as Literacy Nights, STEMNights, and Open House to share ways parents can support their students with their learning.
2. How are parents and community involved with the school? Answer: Cannan parents very involved inattending major events on campus, such as, school programs/running events, Christmas parties, andCinco de Mayo. Parents are not as involved in meaningful ways that support student learning unlessincentive is provided to encourage attendance, such as providing dinner for Literacy and STEM Nights.
3. How effective are communications such as the school website, mobile app, letters, news articles, etc.?Answer: Based on survey from our PTO board, Cannan's communication between home and schoolcould be improved. To assist in this effort, we began sending parents recorded call outs to inform themof upcoming events/activities in conjunction with emails and Monday folders.
Problem Statements Identifying Parent and Community Engagement Needs
Problem Statement 1: While our PTO is involved in school activities, there is a greater need for parents to be more involved as parent volunteers in theclassroom on a daily/weekly basis. Root Cause: We have a large number of working parents; however, the direct communication and opportunity forparents to sign up to volunteer has not been communicated well throughout the years.
Cannan ElementaryGenerated by Plan4Learning.com 17 of 50
Campus #170-904-106February 4, 2020 3:01 pm
18-19 AAR Page 239
School Context and Organization
School Context and Organization Summary
Several structures are in place to ensure regular input from staff and community members when itcomes to the campus decision making process. Our CEIC meetings have been put on the calendarduring the summer to ensure meetings are regular and consistent. Monthly PTO meetings are attendedby a campus rep to communicate information from the PTO to staff.
The following questions were considered for our school context and organization needs:
1. Is a common planning time or PLC time available for content areas and/or grade levels? How is itstructured? What are the instructional planning expectations?
2. Does our Master Schedule maximize the amount of time spent in instruction? Is instruction protectedfrom unnecessary interruptions?
3. How do teachers have a voice in decision making and school practices?
4. How are duty rosters and supervision schedules developed?
5. Is the campus focused on improving student academic achievement? Is there a sense of urgency andstrong commitment? What processes are in place to ensure that the daily demands of the campus do notovershadow a focus on improvement?
School Context and Organization Strengths
Weekly PLC meetings - data and curriculum talks
Cannan ElementaryGenerated by Plan4Learning.com 18 of 50
Campus #170-904-106February 4, 2020 3:01 pm
18-19 AAR Page 240
Faculty Meetings monthlyMonthly Team Leader meetingsWeekly Leadership Team meetingWeekly lesson planning meetings - lesson plans and relearningMonthly Tier 2 meetings - struggling student progressWeekly Tier 3 meetings - struggling student progressCEIC meetings
Problem Statements Identifying School Context and Organization Needs
Problem Statement 1: Teachers have expressed difficulty in balancing meeting opportunities to discuss student data and plan for instruction within thegiven time frame. Root Cause: SMART Goals are not implemented during each meeting time to provide structure and directions to the meeting.
Cannan ElementaryGenerated by Plan4Learning.com 19 of 50
Campus #170-904-106February 4, 2020 3:01 pm
18-19 AAR Page 241

Technology
Technology Summary
Increased technology usage in every classroom is a priority at Cannan Elementary to meet the needs of21st century students.
Currently, we have one computer lab at Cannan and four Chromecarts. In 2017, we purchased anadditional Chromecart for student use. Our K-2nd grade classrooms were also awarded 5 IPads andApple TV for each classroom.
For the upcoming 2018-2019 school year, MAPS assessment will be completed by students online. Wehave developed a plan to allow each grade level ample use time to use computers in the lab, with theChromecart, or use of Ipads. To complete our technology needs assessment, the following questionswere considered:
1. What barriers reduce the use of technology? WiFi difficulties in the building and damaged Chromeunits.
2. What are the district and/or campus expectations for the integrated use of technology? Daily use oftechnology through computer apps in the classroom.
3. What technology training is available to teachers? For Staff? For others? Weekly T3 trainings withICoach
4. How are instructional materials available online evaluated for appropriateness and accuracy? ICoachrecommendations. Math and Reading Coach suggestions.
5. What plans are being made for technology upgrades in 1-5 years? One to One technology for studentsCannan ElementaryGenerated by Plan4Learning.com 20 of 50
Campus #170-904-106February 4, 2020 3:01 pm
18-19 AAR Page 242
in 4/5.
Technology Strengths
5 Chromecarts (25 Chromebooks each) and 1 computer lab of 25 computers.
5 IPads and an Apple Tv for all K-2nd grade teachers
Software licenses for Gynzy, Flocabulary, Epic, MyOn, TEKS Resource (teacher resource).
We are updating those devices yearly and are purchasing more carts to make available for classroomteachers.
We also have an ICoach on a weekly basis to provide training to teachers on new instructionaltechnology implementation.
Problem Statements Identifying Technology Needs
Problem Statement 1: Chrome tablets and other hardware are in need of updating. More Chrome tablets are needed for student use. Root Cause:Budgeting concerns with the purchase of 1-2 more Chromecarts and/or IPad carts.
Cannan ElementaryGenerated by Plan4Learning.com 21 of 50
Campus #170-904-106February 4, 2020 3:01 pm
18-19 AAR Page 243

Priority Problem Statements
Problem Statement 1: Campus behavior expectations between students in K-2nd and 3rd-5th appear to be different, which has led to more frequentdiscipline incidents within grades 3rd-5th.Root Cause 1: School wide behavior expectations have been inconsistent and unenforced.Problem Statement 1 Areas: District Culture and Climate
Problem Statement 2: 4th Grade STAAR Reading scores are below 70%.Root Cause 2: Insufficient reading comprehension strategies K-3rd.Problem Statement 2 Areas: Student Achievement
Problem Statement 3: 4th Grade Writing scores are below 70%Root Cause 3: Lack of focus on editing/revision and grammar in K-3rd grade.Problem Statement 3 Areas: Student Achievement
Problem Statement 4: Bilingual students are struggling with making gains on STAAR Reading and WritingRoot Cause 4: Students class groupings are not in relation to their strength/weakness in English language acquisition.Problem Statement 4 Areas: Staff Quality, Recruitment, and Retention
Problem Statement 5: Tier 2 intervention in reading and math using common assessment data is not implemented on a daily basis to help studentsunderstand currently taught concepts.
Cannan ElementaryGenerated by Plan4Learning.com 22 of 50
Campus #170-904-106February 4, 2020 3:01 pm
18-19 AAR Page 244
Root Cause 5: Failure of teachers to plan as a team to share students in Tier 2 interventions. based on common assessment unit data.Problem Statement 5 Areas: Curriculum, Instruction, and Assessment
Problem Statement 6: While our PTO is involved in school activities, there is a greater need for parents to be more involved as parent volunteers in theclassroom on a daily/weekly basis.Root Cause 6: We have a large number of working parents; however, the direct communication and opportunity for parents to sign up to volunteer has notbeen communicated well throughout the years.Problem Statement 6 Areas: Parent and Community Engagement
Problem Statement 7: Teachers have expressed difficulty in balancing meeting opportunities to discuss student data and plan for instruction within thegiven time frame.Root Cause 7: SMART Goals are not implemented during each meeting time to provide structure and directions to the meeting.Problem Statement 7 Areas: District Context and Organization
Problem Statement 8: LEP students are struggling with meeting standard in the area of Reading- analyzing informational textsRoot Cause 8: Students were not strategically grouped according to English proficiency levels to ensure targeted reading instruction/intervention.Problem Statement 8 Areas: Demographics
Cannan ElementaryGenerated by Plan4Learning.com 23 of 50
Campus #170-904-106February 4, 2020 3:01 pm
18-19 AAR Page 245

Comprehensive Needs Assessment Data DocumentationThe following data were used to verify the comprehensive needs assessment analysis:
Improvement Planning Data
District goalsCampus goalsCurrent and/or prior year(s) campus and/or district improvement plansCampus and/or district planning and decision making committee(s) meeting dataState and federal planning requirements
Accountability Data
Texas Academic Performance Report (TAPR) dataDomain 1 - Student AchievementDomain 2 - Student ProgressDomain 3 - Closing the GapsEffective Schools Framework dataAccountability Distinction DesignationsPBMAS data
Student Data: Assessments
State of Texas Assessments of Academic Readiness (STAAR) current and longitudinal results, including all versionsSTAAR Released Test QuestionsSTAAR EL Progress Measure dataTexas English Language Proficiency Assessment System (TELPAS) resultsTexas Primary Reading Inventory (TPRI), Tejas LEE, or other alternate early reading assessment resultsStudent Success Initiative (SSI) data for Grades 5 and 8Running Records results
Student Data: Student Groups
Race and ethnicity data, including number of students, academic achievement, discipline, attendance, and rates of progress for each student groupEconomically Disadvantaged / Non-economically disadvantaged performance, progress, and participation dataSpecial education/non-special education population including discipline, progress and participation dataAt-risk/non-at-risk population including performance, progress, discipline, attendance, and mobility dataEL/non-EL or LEP data, including academic achievement, progress, support and accommodation needs, race, ethnicity, gender, etc.
Cannan ElementaryGenerated by Plan4Learning.com 24 of 50
Campus #170-904-106February 4, 2020 3:01 pm
18-19 AAR Page 246
Section 504 dataGifted and talented data
Student Data: Behavior and Other Indicators
Attendance dataDiscipline records
Employee Data
Professional learning communities (PLC) dataCampus department and/or faculty meeting discussions and dataProfessional development needs assessment dataTTESS data
Parent/Community Data
Parent surveys and/or other feedbackParent engagement rate
Support Systems and Other Data
Processes and procedures for teaching and learning, including program implementationCommunications dataCapacity and resources dataBudgets/entitlements and expenditures dataStudy of best practicesAction research results
Cannan ElementaryGenerated by Plan4Learning.com 25 of 50
Campus #170-904-106February 4, 2020 3:01 pm
18-19 AAR Page 247
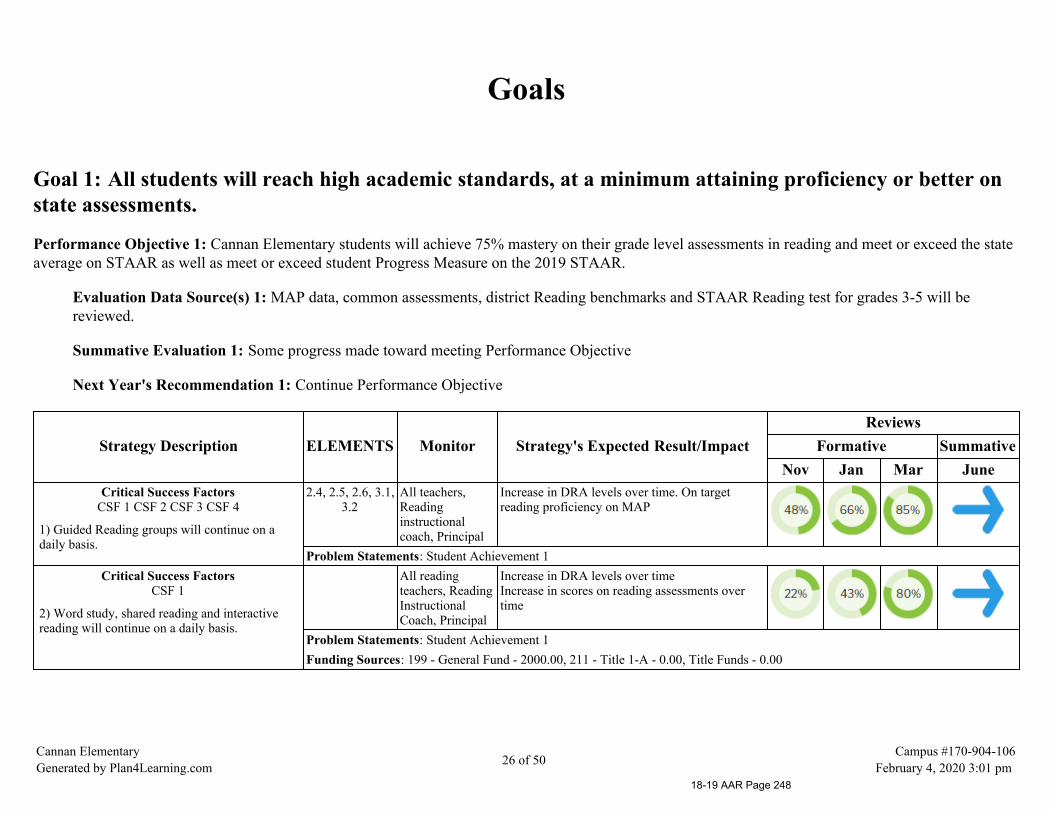
Goals
Goal 1: All students will reach high academic standards, at a minimum attaining proficiency or better onstate assessments.
Performance Objective 1: Cannan Elementary students will achieve 75% mastery on their grade level assessments in reading and meet or exceed the stateaverage on STAAR as well as meet or exceed student Progress Measure on the 2019 STAAR.
Evaluation Data Source(s) 1: MAP data, common assessments, district Reading benchmarks and STAAR Reading test for grades 3-5 will bereviewed.
Summative Evaluation 1: Some progress made toward meeting Performance Objective
Next Year's Recommendation 1: Continue Performance Objective
Strategy Description ELEMENTS Monitor Strategy's Expected Result/ImpactReviews
Formative SummativeNov Jan Mar June
Critical Success FactorsCSF 1 CSF 2 CSF 3 CSF 4
1) Guided Reading groups will continue on adaily basis.
2.4, 2.5, 2.6, 3.1,3.2
All teachers,Readinginstructionalcoach, Principal
Increase in DRA levels over time. On targetreading proficiency on MAP
Problem Statements: Student Achievement 1Critical Success Factors
CSF 1
2) Word study, shared reading and interactivereading will continue on a daily basis.
All readingteachers, Reading InstructionalCoach, Principal
Increase in DRA levels over timeIncrease in scores on reading assessments overtime
Problem Statements: Student Achievement 1Funding Sources: 199 - General Fund - 2000.00, 211 - Title 1-A - 0.00, Title Funds - 0.00
Cannan ElementaryGenerated by Plan4Learning.com 26 of 50
Campus #170-904-106February 4, 2020 3:01 pm
18-19 AAR Page 248
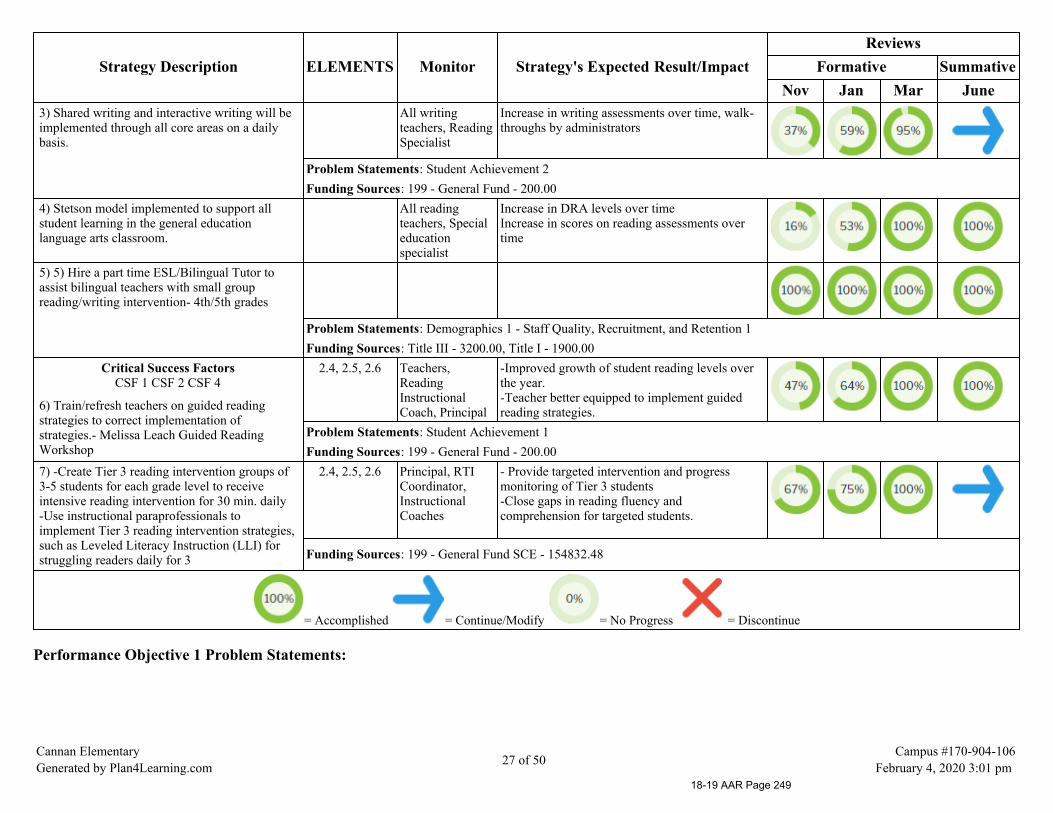
Strategy Description ELEMENTS Monitor Strategy's Expected Result/ImpactReviews
Formative SummativeNov Jan Mar June
3) Shared writing and interactive writing will beimplemented through all core areas on a dailybasis.
All writingteachers, ReadingSpecialist
Increase in writing assessments over time, walk-throughs by administrators
Problem Statements: Student Achievement 2Funding Sources: 199 - General Fund - 200.00
4) Stetson model implemented to support allstudent learning in the general educationlanguage arts classroom.
All readingteachers, Specialeducationspecialist
Increase in DRA levels over timeIncrease in scores on reading assessments overtime
5) 5) Hire a part time ESL/Bilingual Tutor toassist bilingual teachers with small groupreading/writing intervention- 4th/5th grades
Problem Statements: Demographics 1 - Staff Quality, Recruitment, and Retention 1Funding Sources: Title III - 3200.00, Title I - 1900.00
Critical Success FactorsCSF 1 CSF 2 CSF 4
6) Train/refresh teachers on guided readingstrategies to correct implementation ofstrategies.- Melissa Leach Guided ReadingWorkshop
2.4, 2.5, 2.6 Teachers,ReadingInstructionalCoach, Principal
-Improved growth of student reading levels overthe year. -Teacher better equipped to implement guidedreading strategies.
Problem Statements: Student Achievement 1Funding Sources: 199 - General Fund - 200.00
7) -Create Tier 3 reading intervention groups of3-5 students for each grade level to receiveintensive reading intervention for 30 min. daily-Use instructional paraprofessionals toimplement Tier 3 reading intervention strategies,such as Leveled Literacy Instruction (LLI) forstruggling readers daily for 3
2.4, 2.5, 2.6 Principal, RTICoordinator,InstructionalCoaches
- Provide targeted intervention and progressmonitoring of Tier 3 students-Close gaps in reading fluency andcomprehension for targeted students.
Funding Sources: 199 - General Fund SCE - 154832.48
= Accomplished = Continue/Modify = No Progress = Discontinue
Performance Objective 1 Problem Statements:
Cannan ElementaryGenerated by Plan4Learning.com 27 of 50
Campus #170-904-106February 4, 2020 3:01 pm
18-19 AAR Page 249
DemographicsProblem Statement 1: LEP students are struggling with meeting standard in the area of Reading- analyzing informational texts Root Cause 1: Students were not strategically groupedaccording to English proficiency levels to ensure targeted reading instruction/intervention.
Student AchievementProblem Statement 1: 4th Grade STAAR Reading scores are below 70%. Root Cause 1: Insufficient reading comprehension strategies K-3rd.
Problem Statement 2: 4th Grade Writing scores are below 70% Root Cause 2: Lack of focus on editing/revision and grammar in K-3rd grade.
Staff Quality, Recruitment, and RetentionProblem Statement 1: Bilingual students are struggling with making gains on STAAR Reading and Writing Root Cause 1: Students class groupings are not in relation to theirstrength/weakness in English language acquisition.
Cannan ElementaryGenerated by Plan4Learning.com 28 of 50
Campus #170-904-106February 4, 2020 3:01 pm
18-19 AAR Page 250
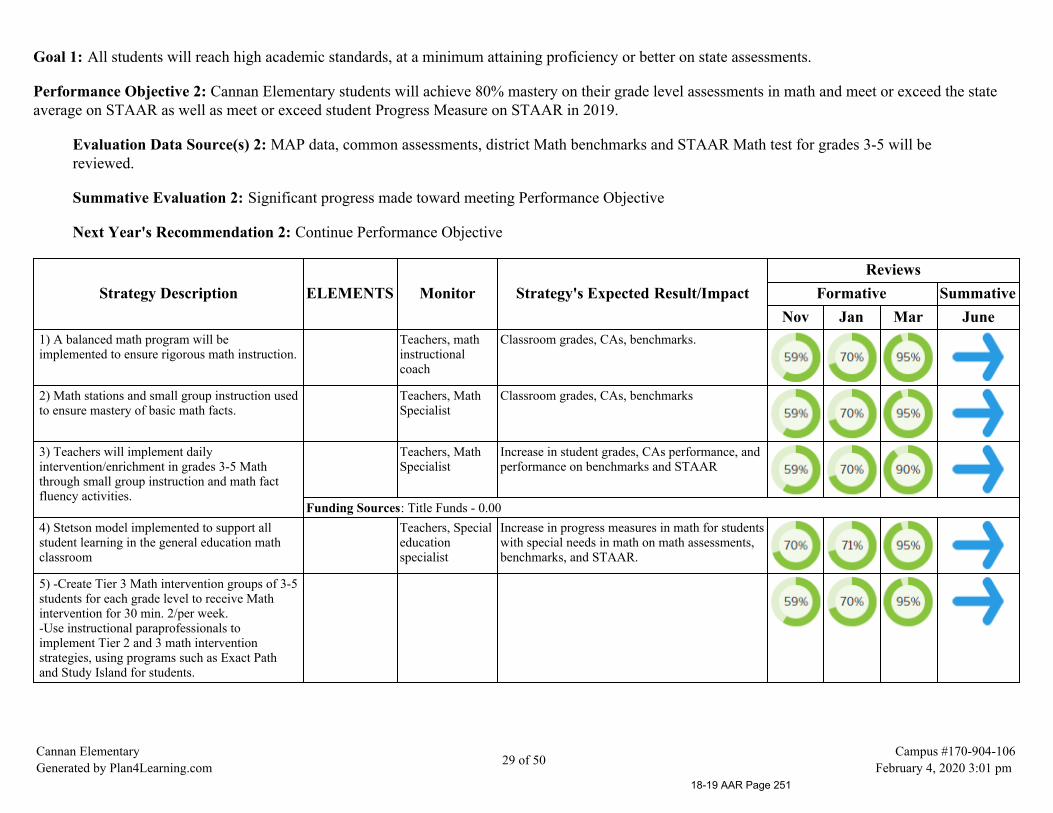
Goal 1: All students will reach high academic standards, at a minimum attaining proficiency or better on state assessments.
Performance Objective 2: Cannan Elementary students will achieve 80% mastery on their grade level assessments in math and meet or exceed the stateaverage on STAAR as well as meet or exceed student Progress Measure on STAAR in 2019.
Evaluation Data Source(s) 2: MAP data, common assessments, district Math benchmarks and STAAR Math test for grades 3-5 will bereviewed.
Summative Evaluation 2: Significant progress made toward meeting Performance Objective
Next Year's Recommendation 2: Continue Performance Objective
Strategy Description ELEMENTS Monitor Strategy's Expected Result/ImpactReviews
Formative SummativeNov Jan Mar June
1) A balanced math program will beimplemented to ensure rigorous math instruction.
Teachers, mathinstructionalcoach
Classroom grades, CAs, benchmarks.
2) Math stations and small group instruction usedto ensure mastery of basic math facts.
Teachers, MathSpecialist
Classroom grades, CAs, benchmarks
3) Teachers will implement dailyintervention/enrichment in grades 3-5 Maththrough small group instruction and math factfluency activities.
Teachers, MathSpecialist
Increase in student grades, CAs performance, andperformance on benchmarks and STAAR
Funding Sources: Title Funds - 0.004) Stetson model implemented to support allstudent learning in the general education mathclassroom
Teachers, Specialeducationspecialist
Increase in progress measures in math for studentswith special needs in math on math assessments,benchmarks, and STAAR.
5) -Create Tier 3 Math intervention groups of 3-5students for each grade level to receive Mathintervention for 30 min. 2/per week.-Use instructional paraprofessionals toimplement Tier 2 and 3 math interventionstrategies, using programs such as Exact Pathand Study Island for students.
Cannan ElementaryGenerated by Plan4Learning.com 29 of 50
Campus #170-904-106February 4, 2020 3:01 pm
18-19 AAR Page 251

Strategy Description ELEMENTS Monitor Strategy's Expected Result/ImpactReviews
Formative SummativeNov Jan Mar June
= Accomplished = Continue/Modify = No Progress = Discontinue
Cannan ElementaryGenerated by Plan4Learning.com 30 of 50
Campus #170-904-106February 4, 2020 3:01 pm
18-19 AAR Page 252

Goal 1: All students will reach high academic standards, at a minimum attaining proficiency or better on state assessments.
Performance Objective 3: In 2019, Cannan Elementary students will achieve 80% mastery on their grade level assessments in Science and meet or exceedthe state average on STAAR as well as meet or exceed student Progress Measure on STAAR.
Evaluation Data Source(s) 3: Data from common assessments, benchmarks, and STAAR Science test will be reviewed.
Summative Evaluation 3: Some progress made toward meeting Performance Objective
Next Year's Recommendation 3: Continue Performance Objective
Strategy Description ELEMENTS Monitor Strategy's Expected Result/ImpactReviews
Formative SummativeNov Jan Mar June
Critical Success FactorsCSF 1 CSF 2
1) Create a curriculum plan for rigorous sciencecurriculum.
2.4, 2.5, 2.6 Science teachers,District ScienceCoordinator,InstructionalCoach, Principal
Increased science scores
Funding Sources: Donations - 2000.002) Stetson model implemented to support allstudent learning in the general education science.
Teachers, Specialeducationspecialist
Increase in scores in science
= Accomplished = Continue/Modify = No Progress = Discontinue
Cannan ElementaryGenerated by Plan4Learning.com 31 of 50
Campus #170-904-106February 4, 2020 3:01 pm
18-19 AAR Page 253
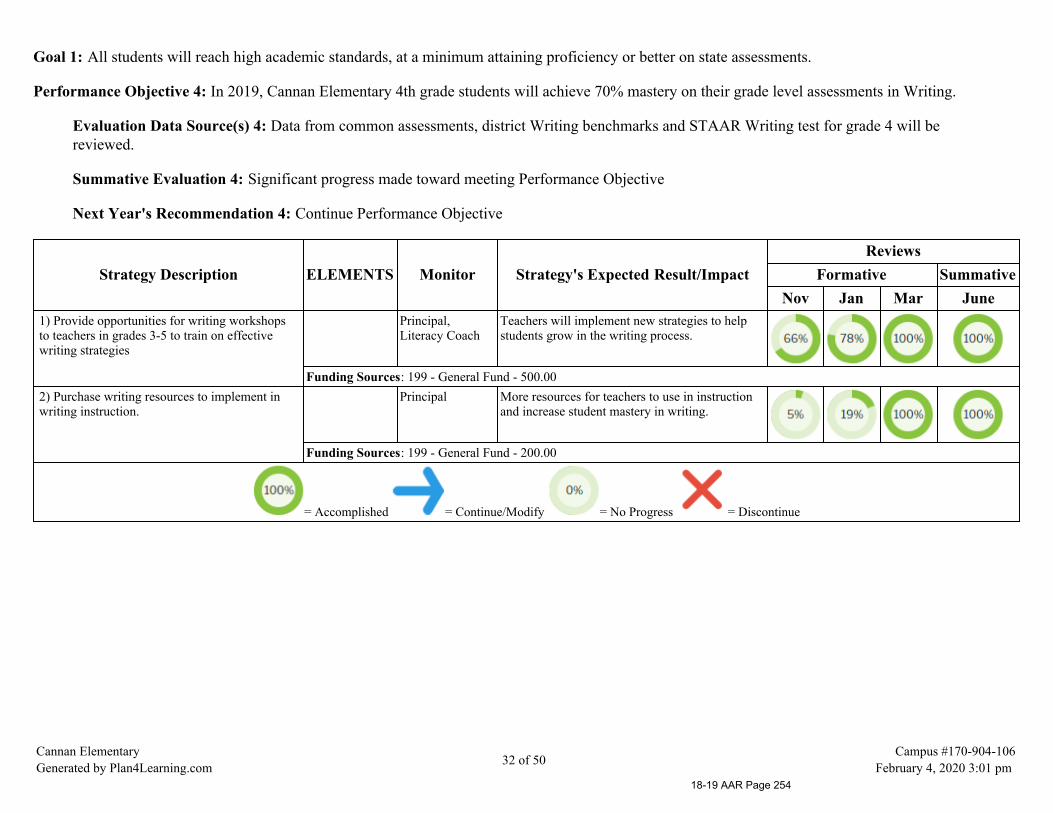
Goal 1: All students will reach high academic standards, at a minimum attaining proficiency or better on state assessments.
Performance Objective 4: In 2019, Cannan Elementary 4th grade students will achieve 70% mastery on their grade level assessments in Writing.
Evaluation Data Source(s) 4: Data from common assessments, district Writing benchmarks and STAAR Writing test for grade 4 will bereviewed.
Summative Evaluation 4: Significant progress made toward meeting Performance Objective
Next Year's Recommendation 4: Continue Performance Objective
Strategy Description ELEMENTS Monitor Strategy's Expected Result/ImpactReviews
Formative SummativeNov Jan Mar June
1) Provide opportunities for writing workshopsto teachers in grades 3-5 to train on effectivewriting strategies
Principal,Literacy Coach
Teachers will implement new strategies to helpstudents grow in the writing process.
Funding Sources: 199 - General Fund - 500.002) Purchase writing resources to implement inwriting instruction.
Principal More resources for teachers to use in instructionand increase student mastery in writing.
Funding Sources: 199 - General Fund - 200.00
= Accomplished = Continue/Modify = No Progress = Discontinue
Cannan ElementaryGenerated by Plan4Learning.com 32 of 50
Campus #170-904-106February 4, 2020 3:01 pm
18-19 AAR Page 254

Goal 2: All parents will participate in regular, two-way, and meaningful communication involving studentacademic learning and school activities.
Performance Objective 1: Increase parent involvement in campus activities and events by 10% during the 2018-19 school year.
Evaluation Data Source(s) 1: Impact will be evaluated by 10% parental involvement in school activities as noted on parent sign in sheets fromparent involvement meetings and activity nights.
Summative Evaluation 1: Met Performance Objective
Next Year's Recommendation 1: Continue Performance Objective
Strategy Description ELEMENTS Monitor Strategy's Expected Result/ImpactReviews
Formative SummativeNov Jan Mar June
Critical Success FactorsCSF 5 CSF 6
1) Meet the Teacher will be split between K-2ndand 3rd-5th to create an open environment forschool/parent communication. A copy of theparent-school compact will be provided at Meetthe Teacher.
3.1, 3.2 Principal,teachers
Increased parental involvement at other activitiesthroughout the school year
Problem Statements: Parent and Community Engagement 1
Critical Success FactorsCSF 5 CSF 6
2) Grandparents Day will be held in Novemberto encourage students to honor their grandparentsand read together.
2.4, 2.5, 2.6 Principal,InstructionalLearningSpecialist,Library Aide
Students will actively read with their grandparentsand increase their MOY reading level.
Funding Sources: 199 - General Fund - 300.00Critical Success Factors
CSF 5
3) Open House will be held within the first twomonths of school to discuss Title One andParental Involvement to create an openenvironment for teacher/parent communication.A copy of the parent-school compact will beprovided at Open House.
3.1, 3.2 Principal,teachers
Increased parental involvement at other activitiesthroughout the school year.
Cannan ElementaryGenerated by Plan4Learning.com 33 of 50
Campus #170-904-106February 4, 2020 3:01 pm
18-19 AAR Page 255
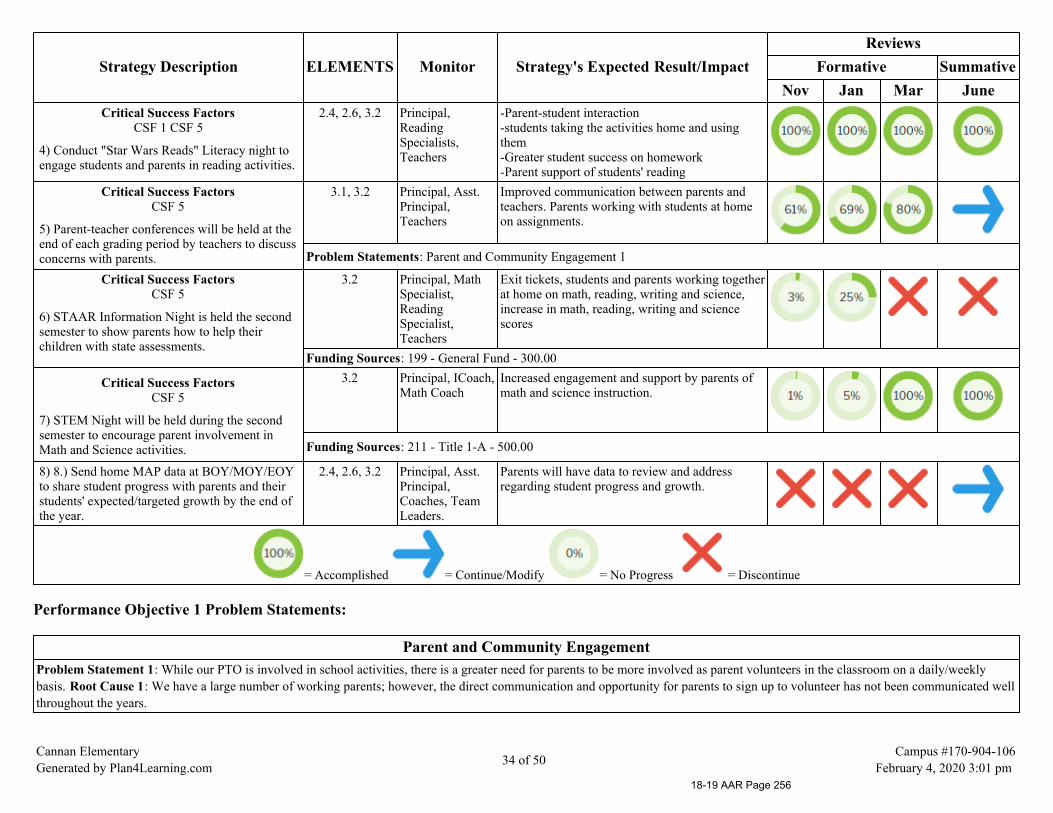
Strategy Description ELEMENTS Monitor Strategy's Expected Result/ImpactReviews
Formative SummativeNov Jan Mar June
Critical Success FactorsCSF 1 CSF 5
4) Conduct "Star Wars Reads" Literacy night toengage students and parents in reading activities.
2.4, 2.6, 3.2 Principal,ReadingSpecialists,Teachers
-Parent-student interaction-students taking the activities home and usingthem-Greater student success on homework-Parent support of students' reading
Critical Success FactorsCSF 5
5) Parent-teacher conferences will be held at theend of each grading period by teachers to discussconcerns with parents.
3.1, 3.2 Principal, Asst.Principal,Teachers
Improved communication between parents andteachers. Parents working with students at homeon assignments.
Problem Statements: Parent and Community Engagement 1
Critical Success FactorsCSF 5
6) STAAR Information Night is held the secondsemester to show parents how to help theirchildren with state assessments.
3.2 Principal, MathSpecialist,ReadingSpecialist,Teachers
Exit tickets, students and parents working togetherat home on math, reading, writing and science,increase in math, reading, writing and sciencescores
Funding Sources: 199 - General Fund - 300.00
Critical Success FactorsCSF 5
7) STEM Night will be held during the secondsemester to encourage parent involvement inMath and Science activities.
3.2 Principal, ICoach,Math Coach
Increased engagement and support by parents ofmath and science instruction.
Funding Sources: 211 - Title 1-A - 500.00
8) 8.) Send home MAP data at BOY/MOY/EOYto share student progress with parents and theirstudents' expected/targeted growth by the end ofthe year.
2.4, 2.6, 3.2 Principal, Asst.Principal,Coaches, TeamLeaders.
Parents will have data to review and addressregarding student progress and growth.
= Accomplished = Continue/Modify = No Progress = Discontinue
Performance Objective 1 Problem Statements:
Parent and Community EngagementProblem Statement 1: While our PTO is involved in school activities, there is a greater need for parents to be more involved as parent volunteers in the classroom on a daily/weeklybasis. Root Cause 1: We have a large number of working parents; however, the direct communication and opportunity for parents to sign up to volunteer has not been communicated wellthroughout the years.
Cannan ElementaryGenerated by Plan4Learning.com 34 of 50
Campus #170-904-106February 4, 2020 3:01 pm
18-19 AAR Page 256
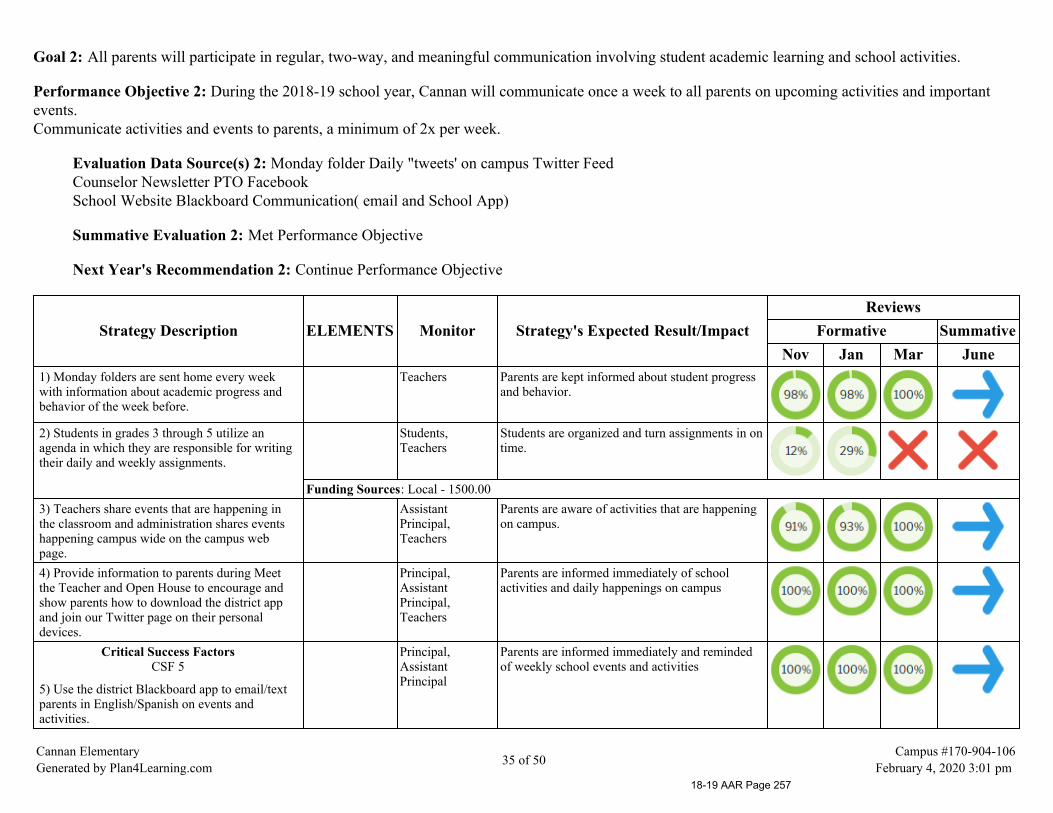
Goal 2: All parents will participate in regular, two-way, and meaningful communication involving student academic learning and school activities.
Performance Objective 2: During the 2018-19 school year, Cannan will communicate once a week to all parents on upcoming activities and importantevents.Communicate activities and events to parents, a minimum of 2x per week.
Evaluation Data Source(s) 2: Monday folder Daily "tweets' on campus Twitter FeedCounselor Newsletter PTO FacebookSchool Website Blackboard Communication( email and School App)
Summative Evaluation 2: Met Performance Objective
Next Year's Recommendation 2: Continue Performance Objective
Strategy Description ELEMENTS Monitor Strategy's Expected Result/ImpactReviews
Formative SummativeNov Jan Mar June
1) Monday folders are sent home every weekwith information about academic progress andbehavior of the week before.
Teachers Parents are kept informed about student progressand behavior.
2) Students in grades 3 through 5 utilize anagenda in which they are responsible for writingtheir daily and weekly assignments.
Students,Teachers
Students are organized and turn assignments in ontime.
Funding Sources: Local - 1500.003) Teachers share events that are happening inthe classroom and administration shares eventshappening campus wide on the campus webpage.
AssistantPrincipal,Teachers
Parents are aware of activities that are happeningon campus.
4) Provide information to parents during Meetthe Teacher and Open House to encourage andshow parents how to download the district appand join our Twitter page on their personaldevices.
Principal,AssistantPrincipal,Teachers
Parents are informed immediately of schoolactivities and daily happenings on campus
Critical Success FactorsCSF 5
5) Use the district Blackboard app to email/textparents in English/Spanish on events andactivities.
Principal,AssistantPrincipal
Parents are informed immediately and remindedof weekly school events and activities
Cannan ElementaryGenerated by Plan4Learning.com 35 of 50
Campus #170-904-106February 4, 2020 3:01 pm
18-19 AAR Page 257
Strategy Description ELEMENTS Monitor Strategy's Expected Result/ImpactReviews
Formative SummativeNov Jan Mar June
= Accomplished = Continue/Modify = No Progress = Discontinue
Cannan ElementaryGenerated by Plan4Learning.com 36 of 50
Campus #170-904-106February 4, 2020 3:01 pm
18-19 AAR Page 258
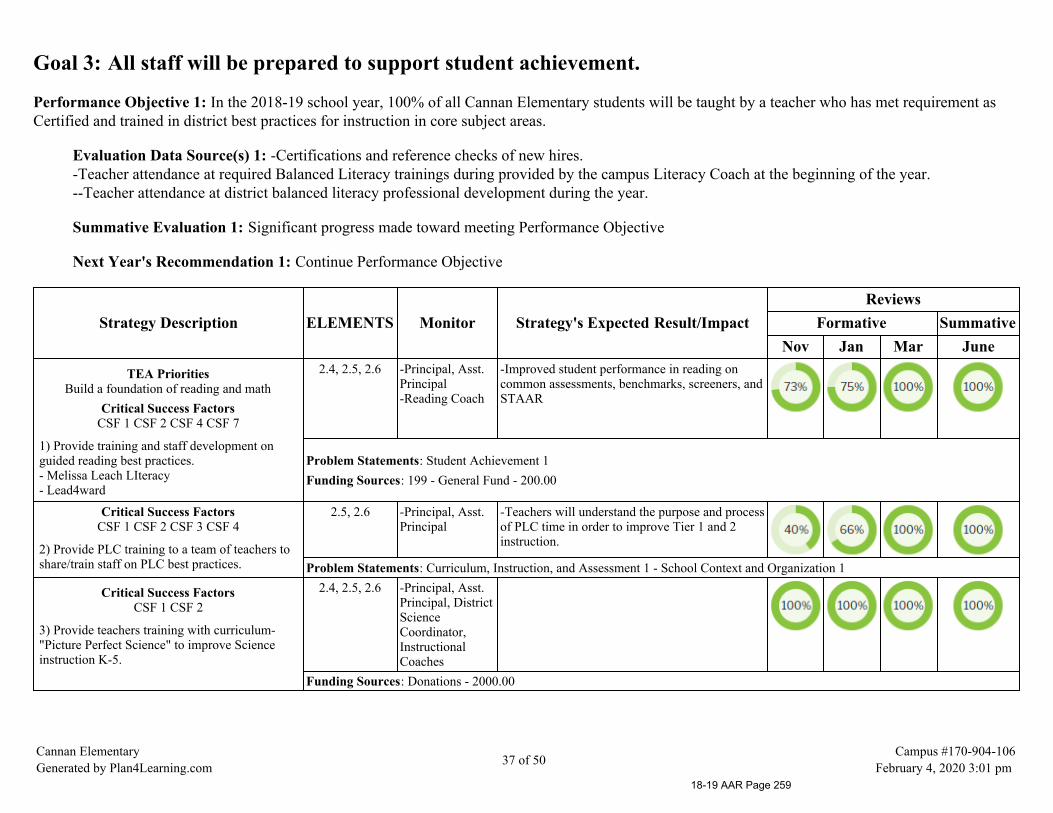
Goal 3: All staff will be prepared to support student achievement.
Performance Objective 1: In the 2018-19 school year, 100% of all Cannan Elementary students will be taught by a teacher who has met requirement asCertified and trained in district best practices for instruction in core subject areas.
Evaluation Data Source(s) 1: -Certifications and reference checks of new hires.-Teacher attendance at required Balanced Literacy trainings during provided by the campus Literacy Coach at the beginning of the year.--Teacher attendance at district balanced literacy professional development during the year.
Summative Evaluation 1: Significant progress made toward meeting Performance Objective
Next Year's Recommendation 1: Continue Performance Objective
Strategy Description ELEMENTS Monitor Strategy's Expected Result/ImpactReviews
Formative SummativeNov Jan Mar June
TEA PrioritiesBuild a foundation of reading and math
Critical Success FactorsCSF 1 CSF 2 CSF 4 CSF 7
1) Provide training and staff development onguided reading best practices.- Melissa Leach LIteracy- Lead4ward
2.4, 2.5, 2.6 -Principal, Asst.Principal-Reading Coach
-Improved student performance in reading oncommon assessments, benchmarks, screeners, andSTAAR
Problem Statements: Student Achievement 1Funding Sources: 199 - General Fund - 200.00
Critical Success FactorsCSF 1 CSF 2 CSF 3 CSF 4
2) Provide PLC training to a team of teachers toshare/train staff on PLC best practices.
2.5, 2.6 -Principal, Asst.Principal
-Teachers will understand the purpose and processof PLC time in order to improve Tier 1 and 2instruction.
Problem Statements: Curriculum, Instruction, and Assessment 1 - School Context and Organization 1
Critical Success FactorsCSF 1 CSF 2
3) Provide teachers training with curriculum-"Picture Perfect Science" to improve Scienceinstruction K-5.
2.4, 2.5, 2.6 -Principal, Asst.Principal, DistrictScienceCoordinator,InstructionalCoaches
Funding Sources: Donations - 2000.00
Cannan ElementaryGenerated by Plan4Learning.com 37 of 50
Campus #170-904-106February 4, 2020 3:01 pm
18-19 AAR Page 259

Strategy Description ELEMENTS Monitor Strategy's Expected Result/ImpactReviews
Formative SummativeNov Jan Mar June
= Accomplished = Continue/Modify = No Progress = Discontinue
Performance Objective 1 Problem Statements:
Student AchievementProblem Statement 1: 4th Grade STAAR Reading scores are below 70%. Root Cause 1: Insufficient reading comprehension strategies K-3rd.
Curriculum, Instruction, and AssessmentProblem Statement 1: Tier 2 intervention in reading and math using common assessment data is not implemented on a daily basis to help students understand currently taught concepts.Root Cause 1: Failure of teachers to plan as a team to share students in Tier 2 interventions. based on common assessment unit data.
School Context and OrganizationProblem Statement 1: Teachers have expressed difficulty in balancing meeting opportunities to discuss student data and plan for instruction within the given time frame. Root Cause 1:SMART Goals are not implemented during each meeting time to provide structure and directions to the meeting.
Cannan ElementaryGenerated by Plan4Learning.com 38 of 50
Campus #170-904-106February 4, 2020 3:01 pm
18-19 AAR Page 260

Goal 4: All district funds will be utilized for programs that ensure the success of every student.
Performance Objective 1: 100% of funding decisions made by the campus will be prioritized by campus initiatives during the 2018-2019 school year.
Evaluation Data Source(s) 1: Impact will be evaluated by campus budget audit to evaluate line by line alignment between budget spendingand campus improvement plan.
Summative Evaluation 1: Met Performance Objective
Next Year's Recommendation 1: Continue Performance Objective
Strategy Description ELEMENTS Monitor Strategy's Expected Result/ImpactReviews
Formative SummativeNov Jan Mar June
1) 1) All Title Funds, District Funds and StudentActivity Funds will be monitored and utilizedaccording to Federal, State and Local guidelines.
Principal Budgets will be utilized and balanced accordinglyat the end of the school year.
2) 2) Campus CEIC and Team Leaders will meetregularly to review campus needs, campus planand budget items.
Principal Regular attendance through sign in sheets,balanced budget and purchase orders reflectingcampus need.
= Accomplished = Continue/Modify = No Progress = Discontinue
Cannan ElementaryGenerated by Plan4Learning.com 39 of 50
Campus #170-904-106February 4, 2020 3:01 pm
18-19 AAR Page 261

Goal 5: All students will be educated in learning environments that are safe and conducive learning.
Performance Objective 1: During the 2018-19 school year, 100% of Cannan staff will be trained on campus safety and security procedures.
Evaluation Data Source(s) 1: -Staff sign up for the RAVE! Panic App-Installation of Bearacade door devices-Installation and use of electronic door keys--Sign In sheets from monthly meetings will address key concerns for building safety, cleanlinessand personal safety of students and staff.-Shelter in Place Drills-Lockdown Drills-Monthly safety checks of the building by the Constable.-Monthly fire/disaster drills-CPR and First Aid certification of Crisis Team
Summative Evaluation 1: Met Performance Objective
Next Year's Recommendation 1: Review campus safety and security procedures with staff.
Strategy Description ELEMENTS Monitor Strategy's Expected Result/ImpactReviews
Formative SummativeNov Jan Mar June
Critical Success FactorsCSF 6
1) Update staff weekly on safety issues andreporting safety concerns.
AssistantPrincipal,Teachers
Incidents of staff injuries are reduced. Any staffinjury is reported to the campus safetycoordinator.
Critical Success FactorsCSF 3 CSF 6
2) 1. Train 100% of staff on safety/securityprocedures:-Shelter in Place-Lock down-Fire/Disaster drills-CPR -First Aid certification for Crisis Team
Principal, Asst.Principal, localpolice authorities
All Staff will be trained and prepared onprocedures for potential emergency issues.
Cannan ElementaryGenerated by Plan4Learning.com 40 of 50
Campus #170-904-106February 4, 2020 3:01 pm
18-19 AAR Page 262
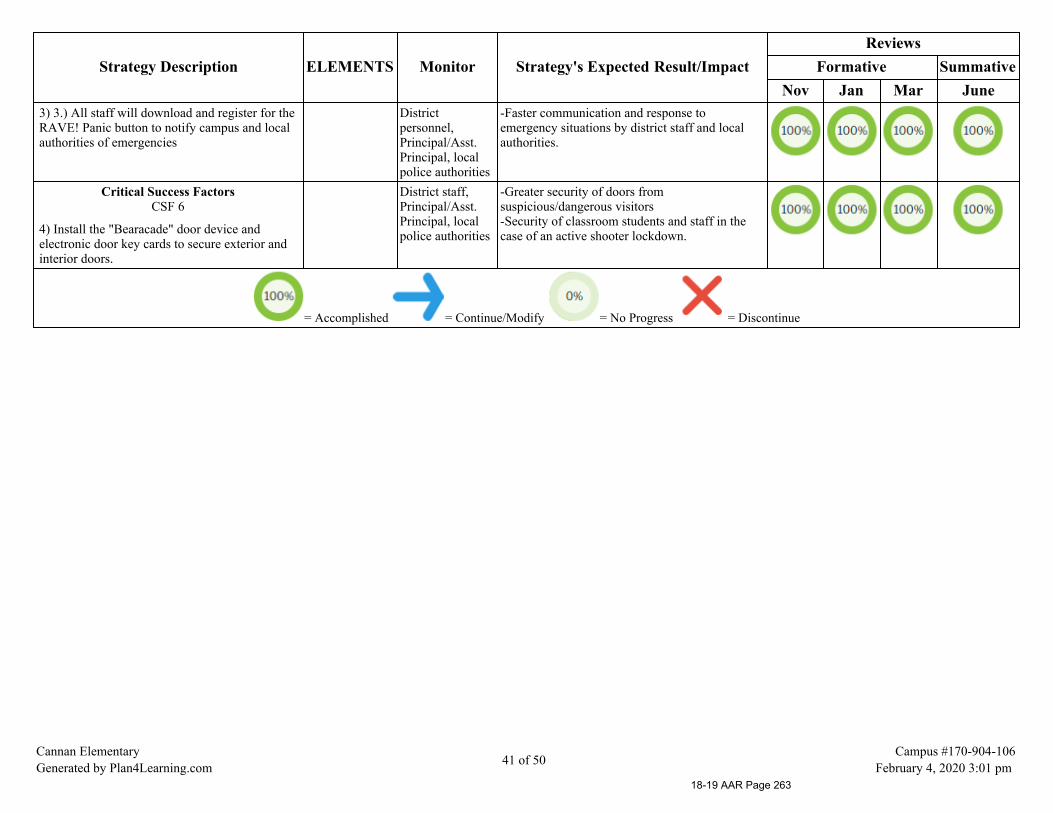
Strategy Description ELEMENTS Monitor Strategy's Expected Result/ImpactReviews
Formative SummativeNov Jan Mar June
3) 3.) All staff will download and register for theRAVE! Panic button to notify campus and localauthorities of emergencies
Districtpersonnel,Principal/Asst.Principal, localpolice authorities
-Faster communication and response toemergency situations by district staff and localauthorities.
Critical Success FactorsCSF 6
4) Install the "Bearacade" door device andelectronic door key cards to secure exterior andinterior doors.
District staff,Principal/Asst.Principal, localpolice authorities
-Greater security of doors fromsuspicious/dangerous visitors-Security of classroom students and staff in thecase of an active shooter lockdown.
= Accomplished = Continue/Modify = No Progress = Discontinue
Cannan ElementaryGenerated by Plan4Learning.com 41 of 50
Campus #170-904-106February 4, 2020 3:01 pm
18-19 AAR Page 263

Goal 5: All students will be educated in learning environments that are safe and conducive learning.
Performance Objective 2: Cannan behavior referrals will decrease by 10% in 2018-19 by using a campus wide Positive Behavior Support Program.
Evaluation Data Source(s) 2: Development of campus PBIS Matrix of behavior supports, decrease in referrals as seen in discipline reports
Summative Evaluation 2: Exceeded Performance Objective
Next Year's Recommendation 2: Continue Implementation of Campus wide Positive Behavior Supports PBIS
Strategy Description ELEMENTS Monitor Strategy's Expected Result/ImpactReviews
Formative SummativeNov Jan Mar June
Critical Success FactorsCSF 4 CSF 6
1) Develop a team of 5-7 staff members to trainstaff to implement Positive Behavior Supports(PBIS).
2.5 Principal Core team developed to communicate to staff andlead PBIS formation process.
Problem Statements: School Culture and Climate 1Funding Sources: Title Funds - 0.00
Critical Success FactorsCSF 6
2) Core Team to attend Region IV PBIS initialtraining- Summer '18
Principal Training and preparation for core team.
Critical Success FactorsCSF 6
3) Train all staff on PBIS strategies and supportsduring Spring/Fall of 2018.
Principal, PBISCore Team
Preparation of teachers to implement PBISstrategies in the Fall of 2018
Problem Statements: School Culture and Climate 1Funding Sources: Title Funds - 0.00
Critical Success FactorsCSF 6
4) 4.) Create a PBIS campus behavior matrix todelineate appropriate student behavior in variousareas and campus situations.
-PBIS Team,Principal
-Provide students and staff clear expectations ofbehaviors to reinforce or address.
Problem Statements: School Culture and Climate 1
Cannan ElementaryGenerated by Plan4Learning.com 42 of 50
Campus #170-904-106February 4, 2020 3:01 pm
18-19 AAR Page 264

Strategy Description ELEMENTS Monitor Strategy's Expected Result/ImpactReviews
Formative SummativeNov Jan Mar June
5) 5.)Develop and implement a campus incentiveplan to reinforce desired student behavior
-PBIS Team,teachers,Principal, Asst.Principal
-Improved behavior across classrooms-Improved behavior during unstructured times.
Problem Statements: School Culture and Climate 1Funding Sources: 199 - General Fund - 1000.00
= Accomplished = Continue/Modify = No Progress = Discontinue
Performance Objective 2 Problem Statements:
School Culture and ClimateProblem Statement 1: Campus behavior expectations between students in K-2nd and 3rd-5th appear to be different, which has led to more frequent discipline incidents within grades3rd-5th. Root Cause 1: School wide behavior expectations have been inconsistent and unenforced.
Cannan ElementaryGenerated by Plan4Learning.com 43 of 50
Campus #170-904-106February 4, 2020 3:01 pm
18-19 AAR Page 265
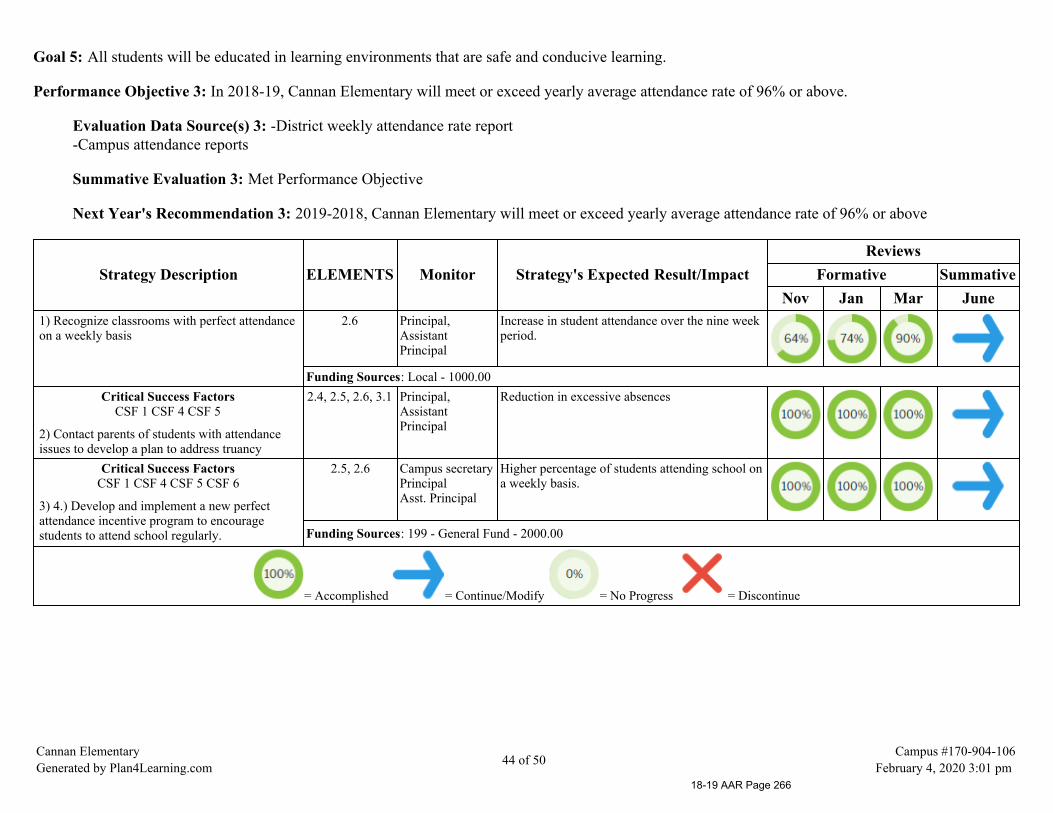
Goal 5: All students will be educated in learning environments that are safe and conducive learning.
Performance Objective 3: In 2018-19, Cannan Elementary will meet or exceed yearly average attendance rate of 96% or above.
Evaluation Data Source(s) 3: -District weekly attendance rate report-Campus attendance reports
Summative Evaluation 3: Met Performance Objective
Next Year's Recommendation 3: 2019-2018, Cannan Elementary will meet or exceed yearly average attendance rate of 96% or above
Strategy Description ELEMENTS Monitor Strategy's Expected Result/ImpactReviews
Formative SummativeNov Jan Mar June
1) Recognize classrooms with perfect attendanceon a weekly basis
2.6 Principal,AssistantPrincipal
Increase in student attendance over the nine weekperiod.
Funding Sources: Local - 1000.00Critical Success Factors
CSF 1 CSF 4 CSF 5
2) Contact parents of students with attendanceissues to develop a plan to address truancy
2.4, 2.5, 2.6, 3.1 Principal,AssistantPrincipal
Reduction in excessive absences
Critical Success FactorsCSF 1 CSF 4 CSF 5 CSF 6
3) 4.) Develop and implement a new perfectattendance incentive program to encouragestudents to attend school regularly.
2.5, 2.6 Campus secretaryPrincipalAsst. Principal
Higher percentage of students attending school ona weekly basis.
Funding Sources: 199 - General Fund - 2000.00
= Accomplished = Continue/Modify = No Progress = Discontinue
Cannan ElementaryGenerated by Plan4Learning.com 44 of 50
Campus #170-904-106February 4, 2020 3:01 pm
18-19 AAR Page 266

Goal 5: All students will be educated in learning environments that are safe and conducive learning.
Performance Objective 4: Cannan Elementary will increase the amount of technology on campus (hardware and softaware) by 20% to assist studentlearning in the 2018-19 school year.
Evaluation Data Source(s) 4: Campus software useHardware technology purchases
Summative Evaluation 4: Met Performance Objective
Next Year's Recommendation 4: Continue Performance Objective
Strategy Description ELEMENTS Monitor Strategy's Expected Result/ImpactReviews
Formative SummativeNov Jan Mar June
Critical Success FactorsCSF 1 CSF 2 CSF 4
1) Purchase/renew/implement educationalsoftware: -MyOn-Study Island-Exact Path-Flocabulary-Gynzy
2.5, 2.6 Principal, ICoach Use of technology programs to assist in studentlearning.
Funding Sources: 199 - General Fund - 4000.00, 211 - Title 1-A - 0.00
Critical Success FactorsCSF 1 CSF 2 CSF 4
2) Purchase computer hardware to engagestudent learning
2.4, 2.5, 2.6 Principal, ICoach Students will have greater access to technology toassist in learning
Funding Sources: 199 - General Fund - 5000.00
= Accomplished = Continue/Modify = No Progress = Discontinue
Cannan ElementaryGenerated by Plan4Learning.com 45 of 50
Campus #170-904-106February 4, 2020 3:01 pm
18-19 AAR Page 267

Comprehensive Support Strategies
Goal Objective Strategy Description1 3 1 Create a curriculum plan for rigorous science curriculum.2 1 7 STEM Night will be held during the second semester to encourage parent involvement in Math and Science activities.3 1 1 Provide training and staff development on guided reading best practices. - Melissa Leach LIteracy - Lead4ward3 1 3 Provide teachers training with curriculum- "Picture Perfect Science" to improve Science instruction K-5.5 2 1 Develop a team of 5-7 staff members to train staff to implement Positive Behavior Supports (PBIS).5 4 1 Purchase/renew/implement educational software: -MyOn -Study Island -Exact Path -Flocabulary -Gynzy
Cannan ElementaryGenerated by Plan4Learning.com 46 of 50
Campus #170-904-106February 4, 2020 3:01 pm
18-19 AAR Page 268
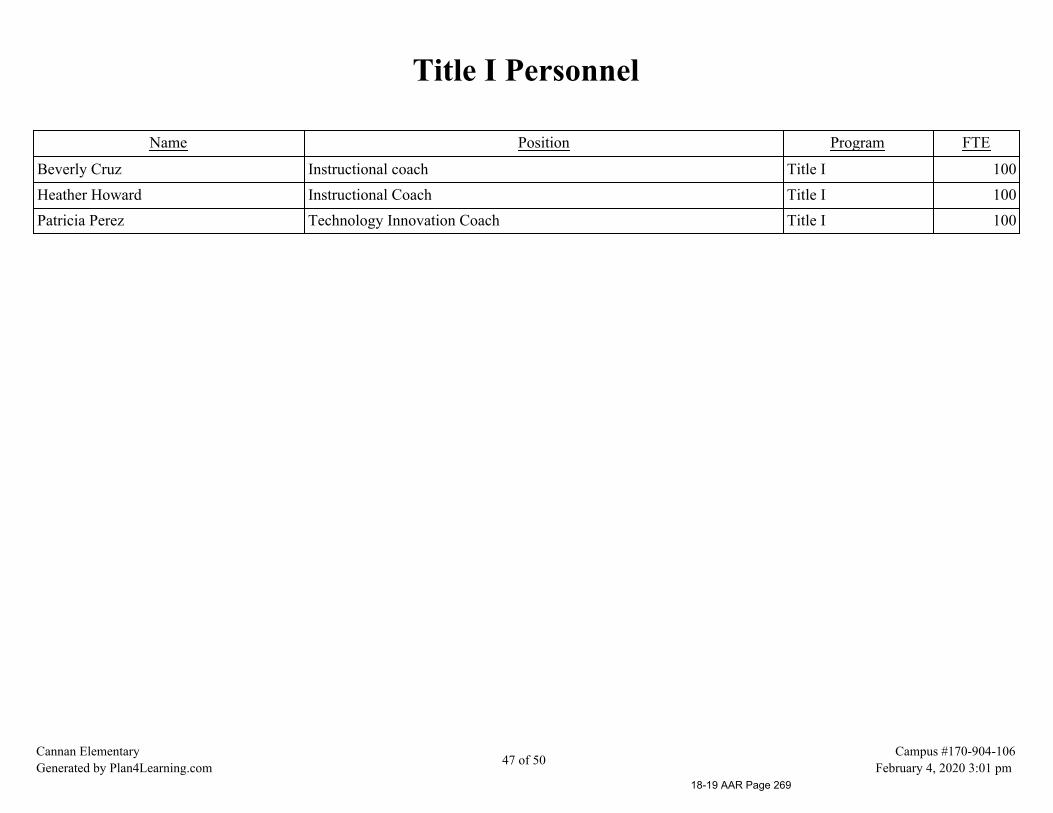
Title I Personnel
Name Position Program FTE
Beverly Cruz Instructional coach Title I 100Heather Howard Instructional Coach Title I 100Patricia Perez Technology Innovation Coach Title I 100
Cannan ElementaryGenerated by Plan4Learning.com 47 of 50
Campus #170-904-106February 4, 2020 3:01 pm
18-19 AAR Page 269
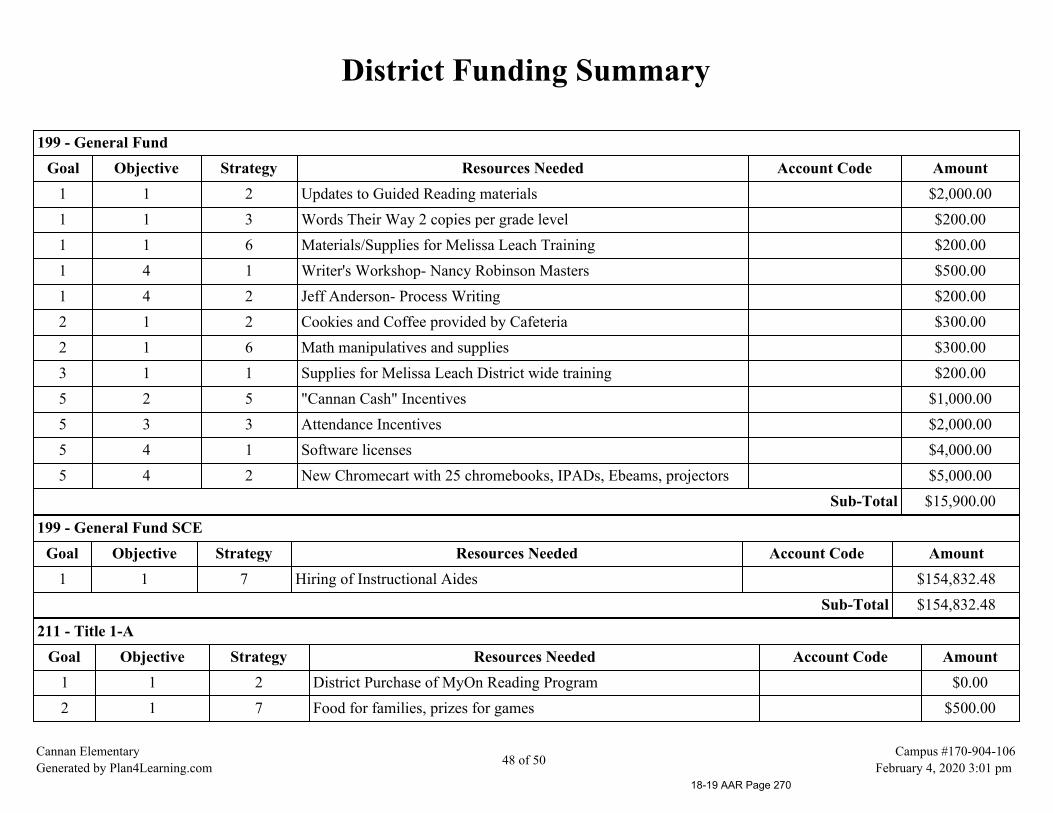
District Funding Summary
199 - General FundGoal Objective Strategy Resources Needed Account Code Amount
1 1 2 Updates to Guided Reading materials $2,000.001 1 3 Words Their Way 2 copies per grade level $200.001 1 6 Materials/Supplies for Melissa Leach Training $200.001 4 1 Writer's Workshop- Nancy Robinson Masters $500.001 4 2 Jeff Anderson- Process Writing $200.002 1 2 Cookies and Coffee provided by Cafeteria $300.002 1 6 Math manipulatives and supplies $300.003 1 1 Supplies for Melissa Leach District wide training $200.005 2 5 "Cannan Cash" Incentives $1,000.005 3 3 Attendance Incentives $2,000.005 4 1 Software licenses $4,000.005 4 2 New Chromecart with 25 chromebooks, IPADs, Ebeams, projectors $5,000.00
Sub-Total $15,900.00
199 - General Fund SCEGoal Objective Strategy Resources Needed Account Code Amount
1 1 7 Hiring of Instructional Aides $154,832.48Sub-Total $154,832.48
211 - Title 1-AGoal Objective Strategy Resources Needed Account Code Amount
1 1 2 District Purchase of MyOn Reading Program $0.002 1 7 Food for families, prizes for games $500.00
Cannan ElementaryGenerated by Plan4Learning.com 48 of 50
Campus #170-904-106February 4, 2020 3:01 pm
18-19 AAR Page 270
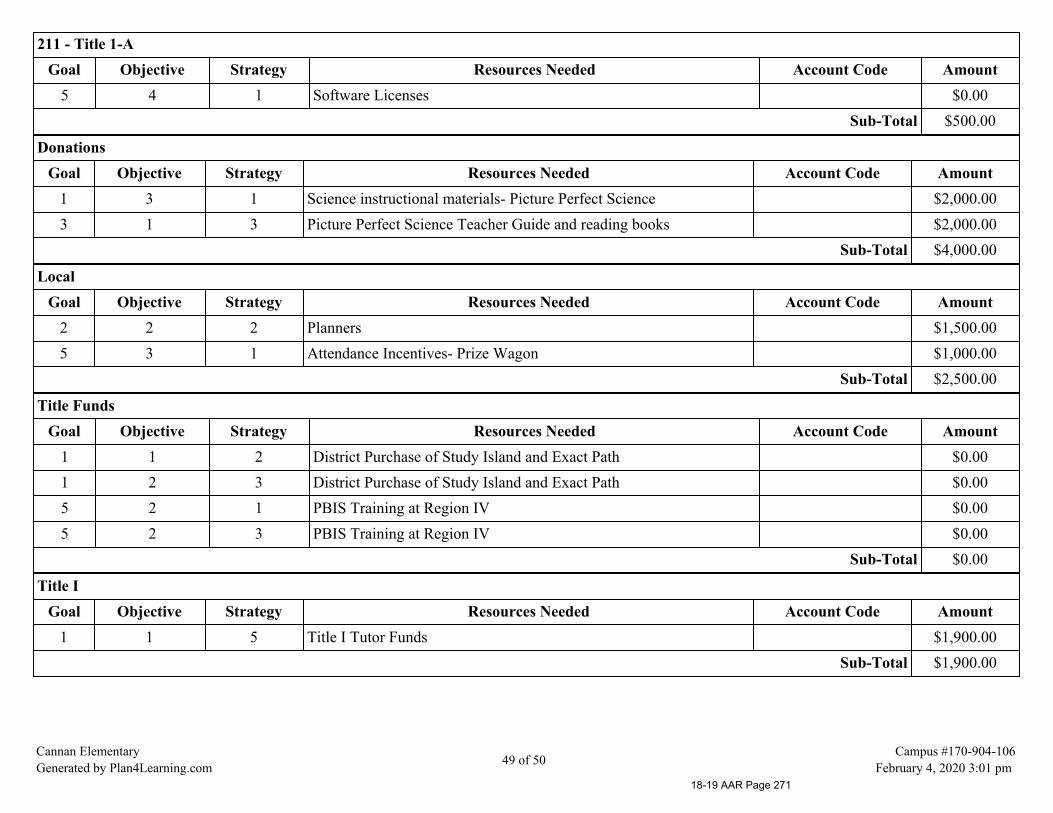
211 - Title 1-AGoal Objective Strategy Resources Needed Account Code Amount
5 4 1 Software Licenses $0.00Sub-Total $500.00
DonationsGoal Objective Strategy Resources Needed Account Code Amount
1 3 1 Science instructional materials- Picture Perfect Science $2,000.003 1 3 Picture Perfect Science Teacher Guide and reading books $2,000.00
Sub-Total $4,000.00
LocalGoal Objective Strategy Resources Needed Account Code Amount
2 2 2 Planners $1,500.005 3 1 Attendance Incentives- Prize Wagon $1,000.00
Sub-Total $2,500.00
Title FundsGoal Objective Strategy Resources Needed Account Code Amount
1 1 2 District Purchase of Study Island and Exact Path $0.001 2 3 District Purchase of Study Island and Exact Path $0.005 2 1 PBIS Training at Region IV $0.005 2 3 PBIS Training at Region IV $0.00
Sub-Total $0.00
Title IGoal Objective Strategy Resources Needed Account Code Amount
1 1 5 Title I Tutor Funds $1,900.00Sub-Total $1,900.00
Cannan ElementaryGenerated by Plan4Learning.com 49 of 50
Campus #170-904-106February 4, 2020 3:01 pm
18-19 AAR Page 271

Title IIIGoal Objective Strategy Resources Needed Account Code Amount
1 1 5 Title III Tutor Funds $3,200.00Sub-Total $3,200.00
Grand Total $182,832.48
Cannan ElementaryGenerated by Plan4Learning.com 50 of 50
Campus #170-904-106February 4, 2020 3:01 pm
18-19 AAR Page 272
Willis Independent School District
Meador Elementary
2018-2019 Accountability Rating: Met Standard
Distinction Designations:Top 25 Percent: Comparative Closing the Gaps
Postsecondary Readiness
Meador ElementaryGenerated by Plan4Learning.com 1 of 44
Campus #170-904-107February 4, 2020 3:02 pm
18-19 AAR Page 273
Mission StatementOur mission is to perpetuate life-long learning in a safe and engaging environment, while instilling the values of productive citizenship.
VisionWilliam Lloyd Meador Elementary School is a place where all students are encouraged to strive for excellence academically, socially, and emotionally in a
safe and supportive atmosphere. Our goal is to work in a partnership with our parents and community to create an environment where students areempowered to discover their strengths and to achieve their maximum potential. Opportunities are available for enrichment, intervention, and remediation as
necessary. We set high expectations for all students. Our entire school community shares the belief that all children can and will learn.
Value StatementEvery student, every standard.
Meador ElementaryGenerated by Plan4Learning.com 2 of 44
Campus #170-904-107February 4, 2020 3:02 pm
18-19 AAR Page 274

Table of Contents
Comprehensive Needs Assessment 4Needs Assessment Overview 4Demographics 5Student Academic Achievement 7School Processes & Programs 9Perceptions 11
Priority Problem Statements 13Comprehensive Needs Assessment Data Documentation 14Goals 16
Goal 1: All students will reach high academic standards, at a minimum attaining proficiency or better on state assessments. 16Goal 2: All parents will participate in regular, two-way, and meaningful communication involving student academic learning and school activities. 29Goal 3: All staff will be prepared to support student achievement. 33Goal 4: All district funds will be utilized for programs that ensure the success of every student. 36Goal 5: All students will be educated in learning environments that are safe and conducive learning. 37
Comprehensive Support Strategies 40Title I Schoolwide Elements 41
ELEMENT 1. SWP COMPREHENSIVE NEEDS ASSESSMENT (CNA) 41ELEMENT 2. SWP CAMPUS IMPROVEMENT PLAN (CIP) 41ELEMENT 3. PARENT AND FAMILY ENGAGEMENT (PFE) 41
Title I Personnel 42District Funding Summary 43
Meador ElementaryGenerated by Plan4Learning.com 3 of 44
Campus #170-904-107February 4, 2020 3:02 pm
18-19 AAR Page 275
Comprehensive Needs AssessmentRevised/Approved: September 18, 2018
Needs Assessment Overview
Through the collaborative effort of the grade level teams, Team Leaders and CEIC members, this Campus Improvement Plan was created to addressspecific areas identified as those in need of improvement, as well as maintain the successful supports we have in place. The staff at William Lloyd MeadorElementary continues to work collaboratively to successfully meet the individual needs of all students. The Texas Education Agency AccountabilitySummary deemed William Lloyd Meador Elementary as having Met Standard for the 2017-2018 school year. We also received distinctions in the area ofTop 25% Closing Performance Gaps and Postsecondary Readiness. This plan was built to ensure that these goals are met again this year and significantmovement is made in the areas of improving reading and writing skills, science, student attendance and continuing to push all students to meet theirindividual progress measures.
Through the examination of all pieces of data reflected in this needs assessment, we continue to struggle to meet the needs of the students in reading. Wewill continue to use LLI as a Tier 3 intervention and a Tier 2 intervention in grades K-2, as well as, SLI to support our ELL students. We will introduceStudy Island as a partner to our MAP data to bolster Tier 2 interventions. Exact Path is another partner to MAP and we plan to use that data to help us buildindividual support plans for our struggling students.
The teacher leadership team for the campus attended two professional development conferences focused on building a strong RtI program through the useof common assessments and targeted interventions across each grade level. A full hour block of time will be set and held sacred for each grade level tocollaborate, review data from common assessments and plan for the needs of the students in their grade level.
The 2018-2019 school year will once again challenge William Lloyd Meador Elementary to continue to experiment with ways to bring parents into ourschool and to work with them to build a clear understanding of the expectations of good attendance and how that correlates to the academic success of theirchild.
Feedback from parents supports the feeling of accomplishment and success of the formal organizations we currently have on campus. Other feedbackbrought ideas for offering specific evenings geared toward teaching parents how to support their students at home. We will continue to foster a welcomingenvironment by hosting additional family activity nights and use all media types to keep our parents and community involved and aware of the hard workand learning that is taking place at William Lloyd Meador Elementary.
Meador ElementaryGenerated by Plan4Learning.com 4 of 44
Campus #170-904-107February 4, 2020 3:02 pm
18-19 AAR Page 276
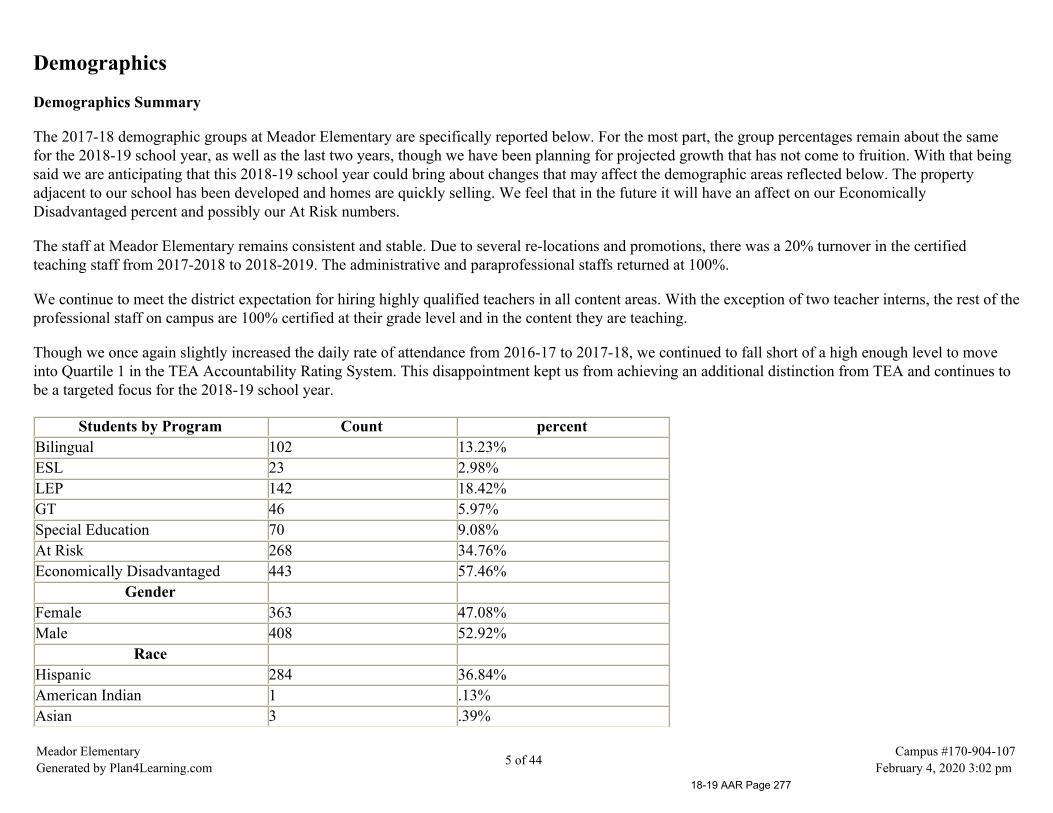
Demographics
Demographics Summary
The 2017-18 demographic groups at Meador Elementary are specifically reported below. For the most part, the group percentages remain about the samefor the 2018-19 school year, as well as the last two years, though we have been planning for projected growth that has not come to fruition. With that beingsaid we are anticipating that this 2018-19 school year could bring about changes that may affect the demographic areas reflected below. The propertyadjacent to our school has been developed and homes are quickly selling. We feel that in the future it will have an affect on our EconomicallyDisadvantaged percent and possibly our At Risk numbers.
The staff at Meador Elementary remains consistent and stable. Due to several re-locations and promotions, there was a 20% turnover in the certifiedteaching staff from 2017-2018 to 2018-2019. The administrative and paraprofessional staffs returned at 100%.
We continue to meet the district expectation for hiring highly qualified teachers in all content areas. With the exception of two teacher interns, the rest of theprofessional staff on campus are 100% certified at their grade level and in the content they are teaching.
Though we once again slightly increased the daily rate of attendance from 2016-17 to 2017-18, we continued to fall short of a high enough level to moveinto Quartile 1 in the TEA Accountability Rating System. This disappointment kept us from achieving an additional distinction from TEA and continues tobe a targeted focus for the 2018-19 school year.
Students by Program Count percentBilingual 102 13.23%ESL 23 2.98%LEP 142 18.42%GT 46 5.97%Special Education 70 9.08%At Risk 268 34.76%Economically Disadvantaged 443 57.46%
GenderFemale 363 47.08%Male 408 52.92%
RaceHispanic 284 36.84%American Indian 1 .13%Asian 3 .39%
Meador ElementaryGenerated by Plan4Learning.com 5 of 44
Campus #170-904-107February 4, 2020 3:02 pm
18-19 AAR Page 277

Students by Program Count percentBlack-African American 50 6.49%Native Hawaiian-Pacific Islander 0White 422 54.73%Two or more 11 1.43%
Demographics Strengths
95% of certified staff exceeded the district expectation for Professional Development hoursGrade level team leaders as well as other teacher leaders attended professional development conferences to collectively bring a common language tothe staff about PBIS, PLC collaboration and RtIAll bilingual teachers are fully bilingual certified
Problem Statements Identifying Demographics Needs
Problem Statement 1: Increase average daily attendance Root Cause: The current process is cumbersome and time consuming
Meador ElementaryGenerated by Plan4Learning.com 6 of 44
Campus #170-904-107February 4, 2020 3:02 pm
18-19 AAR Page 278
Student Academic Achievement
Student Academic Achievement Summary
When we started looking at the different resources we have for data, we started with DRA data across our campus. Knowing the subjectivity that comeswith this assessment, we were still shocked to see that in grades K-3 we were moving around 30% of students to the next grade level with a reading levelbelow the appropriate grade. This data helped us understand why we are not making headway in reading in our STAAR grades.
STAAR data revealed important facts, but the most significant one to us was the corelation between our At Risk population and lack of success on STAARreading. The label 'At Risk' has always carried red flags, but this year's data proved that we are not nearly meeting their needs and they will become thecenter of our focus this year.
Our TELPAS data was incomplete, but we were able to see that we are not advancing our students' writing proficiency. That also aligns with our fourthgrade students, who did not score well on the writing STAAR test. We feel that focusing on a more balanced literacy program including a stronger wordstudy would support them better.
MAP data is new to us and we are learning to identify helpful reports for individual students, classes and whole grade levels. One of the things we havebeen able to prove is the predicting aspect of their data. If a student takes the MAP assessments with integrity, their is almost parallel alignment to theirprediction of success on the state assessment. We have found all the data reports to be helpful and look forward to partnering it with Exact Path and StudyIsland.
For the 2nd year' our Science and Writing scores decreased on STAAR.
Student Academic Achievement Strengths
Looking at longitudinal data from 2015-2018 the 5th graders increased in every catagory except Math Masters3rd grade Reading scores jumped almost 20 pts from the previous yearOur SPED population showed gains in Math
Problem Statements Identifying Student Academic Achievement Needs
Problem Statement 1: Guided reading is not effectively meeting the needs of the students Root Cause: Lack of understanding of the important parts of theprocess
Meador ElementaryGenerated by Plan4Learning.com 7 of 44
Campus #170-904-107February 4, 2020 3:02 pm
18-19 AAR Page 279
Problem Statement 2: Science scores keep decreasing Root Cause: Lack of a dedicated science program
Problem Statement 3: Writing scores are decreasing Root Cause: Not doing a good enough job of building their skills
Meador ElementaryGenerated by Plan4Learning.com 8 of 44
Campus #170-904-107February 4, 2020 3:02 pm
18-19 AAR Page 280
School Processes & Programs
School Processes & Programs Summary
Curriculum, Instruction and Assessment
Through their continual hard work in PLCs and grade level content planning sessions, teachers have a greater understanding of their grade level curriculumand are using curriculum documents from TEKS Resource more independently. Instructional strategies for digging deeper into grade level content havecreated a greater awareness supporting tier 1; although, we need to get more specific and intentional with what we are intervening on in tier 2 and 3. Datafrom screeners (MAP, TPRI/tejas LEE, DRA) can be more effectively used to support all levels of instruction.
Allowing teachers to build their own common assessments in 2017-18 has grown the capacity of our teachers. With support from our Math and LiteracyInstructional coaches, we have identified areas of support still needed to grow teachers in depth of knowledge for their grade level standards. We also feel itwill be important to continue to build capacity amongst our vertical teams. to gain more clarity on the expectations of the next grade level.
We anticipate that the focus for the upcoming year will be able to shift from the development of depth of standard knowledge to effective instructionalpractices at all tiers. We will continue to utilize reports and data from our MAP program to target individualized instruction more effectively. Byimplementing effective instructional practices at all levels, we can close the gaps for all populations and individualize the learning enabling each student toprogress and show desired gains.
Technology
Once again we have shown great gains in our strive to effectively integrate technology for the enhanced learning of information in our classrooms. Datacollected by our iCoach showed that attendance at weekly T3 meetings was high and the requests for support, as they implemented the new learning in theirclassrooms, exceeded 2017-18 in all grade levels. With the introduction of MAP assessments and the necessity for online gathering of student data, teachersalso focused more attention on the collaborative use of technology to guide and target their instruction.
School Processes & Programs Strengths
Curriculum, Instruction and Assessment
Teachers using the curriculum documents more independentlyUtilizing Performance AssessmentsTeacher input for Pacing GuidesTeacher built Common Assessments
Meador ElementaryGenerated by Plan4Learning.com 9 of 44
Campus #170-904-107February 4, 2020 3:02 pm
18-19 AAR Page 281
New screener and diagnostic tool using MAP
Technology
Students have ample access to devicesRatio of 2 students to 1 device (389 portable devices and 108 computers)Teachers have ample access to technology tools (computers, devices, eBeams, etc.)Needs are continuously being assessed and updated devices are being purchased each year
Problem Statements Identifying School Processes & Programs Needs
Problem Statement 1: Expectations for student achievement are high with inconsistent or ineffective instructional support Root Cause: Lack of clarity onspecific needs
Problem Statement 2: Devices are often used to answer interactive worksheet questions Root Cause: Lack of knowledge on how to use other tools toengage and still stay in the learning space
Meador ElementaryGenerated by Plan4Learning.com 10 of 44
Campus #170-904-107February 4, 2020 3:02 pm
18-19 AAR Page 282
Perceptions
Perceptions Summary
A reoccuring theme in feedback from two years ago was the desire to create a more positive atmosphere on our campus especially during teacher andstudent interactions. It was the decision of the Team Leaders and the CEIC to reallocate resources (time, money and personel) to send a team ofrepresentatives to be trained in the Positive Behavior Intervention System. During the Spring of 2018, the PBIS Team slowly introduced their new learningto the staff with the intent to transition to campus wide implementation during the 2018-19 school year. Opportunities were provided for teachercollaboration and feedback creating a collegial climate and buy in for the new initiative. During the week of August 6-13, the PBIS Team introducedinformation on the importance of building relationships with the students, intervention strategies for Tier 1 and 2 students and instructional strategies toreinforce positive ways to engage students. The staff had targeted three times/areas of the school that needed to be addressed and strategic plans were putinto place to support the students to be more successful.
Recent feedback from the staff indicates that at least two of the areas are much calmer through the continual reinforcement of the four core values we havechosen...Be Safe, Be Responsible, Be Kind and Be Respectful. We started the school year with a 20 Day Lesson Plan to implement in every classroom. Thisplan was created by the PBIS Team and provided opportunities for teachers to teach the Core Values and clarify examples of what that would look like indifferent settings. The Core Values are coninually reinforced during the Morning Announcements.
The administrators of the school often receive emails and verbal feedback complimenting the staff on the friendly climate of the school. The feedbacktargets the helpfulness of the front office staff and different levels of support that are put in place to problem solve in partnership with the parents.
At Meador Elementary, we have two very successful programs that increase involvement with parents and give them the opportunity to work alongsideteachers, students, and staff. Watch D.O.G.S. and Meador M.O.M.S. give parents an active role in everyday school routines and gains trust with our school.PTO members help with these programs and others to help bring our community of parents and our teachers together.
For the last couple of years, we have offered Math and Literacy nights at Meador for our parents. Over the years, we have increased the number of familiesthat attend these nights. Literacy night attendance has been on the rise, while our math night still has not brought in the attendance we have hoped for overthe years. More exposure and awareness about these dates through flyers, announcements, and social media will hopefully bring more involvement from ourparents.
Perceptions Strengths
Multiple positive behavior motivators - Class Dojo, student check-ins, Kona Ice incentivesStaff morale strategies
Meador ElementaryGenerated by Plan4Learning.com 11 of 44
Campus #170-904-107February 4, 2020 3:02 pm
18-19 AAR Page 283
RtI process for behaviorSafetyPublic relations
Problem Statements Identifying Perceptions Needs
Problem Statement 1: Finding viable behavior strategies for the 5% Tier 3 students Root Cause: Limited options to choose from
Problem Statement 2: Our parent involvement beyond Watch D.O.G.S. is not at a level we want it to be Root Cause: Limited use of social mediacommunication
Meador ElementaryGenerated by Plan4Learning.com 12 of 44
Campus #170-904-107February 4, 2020 3:02 pm
18-19 AAR Page 284
Priority Problem Statements
Meador ElementaryGenerated by Plan4Learning.com 13 of 44
Campus #170-904-107February 4, 2020 3:02 pm
18-19 AAR Page 285
Comprehensive Needs Assessment Data DocumentationThe following data were used to verify the comprehensive needs assessment analysis:
Improvement Planning Data
District goalsCampus goalsCurrent and/or prior year(s) campus and/or district improvement plansCampus and/or district planning and decision making committee(s) meeting data
Accountability Data
Domain 1 - Student AchievementDomain 2 - Student ProgressDomain 3 - Closing the GapsEffective Schools Framework dataAccountability Distinction DesignationsPBMAS data
Student Data: Assessments
State and federally required assessment information (e.g. curriculum, eligibility, format, standards, accommodations, TEA information)State of Texas Assessments of Academic Readiness (STAAR) current and longitudinal results, including all versionsSTAAR End-of-Course current and longitudinal results, including all versionsSTAAR EL Progress Measure dataTexas English Language Proficiency Assessment System (TELPAS) resultsTexas Primary Reading Inventory (TPRI), Tejas LEE, or other alternate early reading assessment resultsPostsecondary college, career or military-ready graduates including enlisting in U. S. armed services, earning an industry based certification, earningan associate s degree, graduating with completed IEP and workforce readinessStudent Success Initiative (SSI) data for Grades 5 and 8Local diagnostic reading assessment dataLocal diagnostic math assessment dataLocal benchmark or common assessments dataStudent failure and/or retention rates
Student Data: Student Groups
Economically Disadvantaged / Non-economically disadvantaged performance, progress, and participation data
Meador ElementaryGenerated by Plan4Learning.com 14 of 44
Campus #170-904-107February 4, 2020 3:02 pm
18-19 AAR Page 286

Male / Female performance, progress, and participation dataSpecial education/non-special education population including discipline, progress and participation dataAt-risk/non-at-risk population including performance, progress, discipline, attendance, and mobility dataEL/non-EL or LEP data, including academic achievement, progress, support and accommodation needs, race, ethnicity, gender, etc.Section 504 dataGifted and talented data
Student Data: Behavior and Other Indicators
Attendance dataDiscipline records
Employee Data
Professional learning communities (PLC) dataStaff surveys and/or other feedbackState certified and high quality staff dataCampus leadership dataCampus department and/or faculty meeting discussions and dataProfessional development needs assessment dataTTESS data
Parent/Community Data
Parent surveys and/or other feedbackParent engagement rate
Support Systems and Other Data
Processes and procedures for teaching and learning, including program implementationCommunications dataCapacity and resources dataStudy of best practices
Meador ElementaryGenerated by Plan4Learning.com 15 of 44
Campus #170-904-107February 4, 2020 3:02 pm
18-19 AAR Page 287
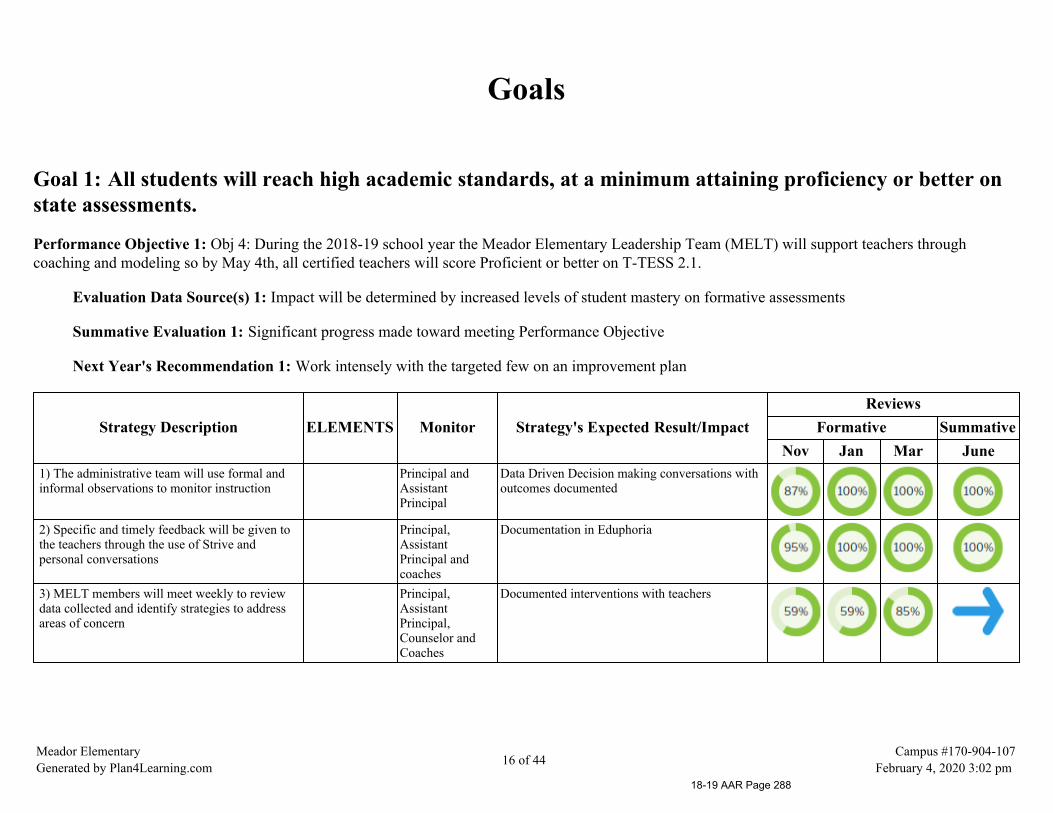
Goals
Goal 1: All students will reach high academic standards, at a minimum attaining proficiency or better onstate assessments.
Performance Objective 1: Obj 4: During the 2018-19 school year the Meador Elementary Leadership Team (MELT) will support teachers throughcoaching and modeling so by May 4th, all certified teachers will score Proficient or better on T-TESS 2.1.
Evaluation Data Source(s) 1: Impact will be determined by increased levels of student mastery on formative assessments
Summative Evaluation 1: Significant progress made toward meeting Performance Objective
Next Year's Recommendation 1: Work intensely with the targeted few on an improvement plan
Strategy Description ELEMENTS Monitor Strategy's Expected Result/ImpactReviews
Formative SummativeNov Jan Mar June
1) The administrative team will use formal andinformal observations to monitor instruction
Principal andAssistantPrincipal
Data Driven Decision making conversations withoutcomes documented
2) Specific and timely feedback will be given tothe teachers through the use of Strive andpersonal conversations
Principal,AssistantPrincipal andcoaches
Documentation in Eduphoria
3) MELT members will meet weekly to reviewdata collected and identify strategies to addressareas of concern
Principal,AssistantPrincipal,Counselor andCoaches
Documented interventions with teachers
Meador ElementaryGenerated by Plan4Learning.com 16 of 44
Campus #170-904-107February 4, 2020 3:02 pm
18-19 AAR Page 288
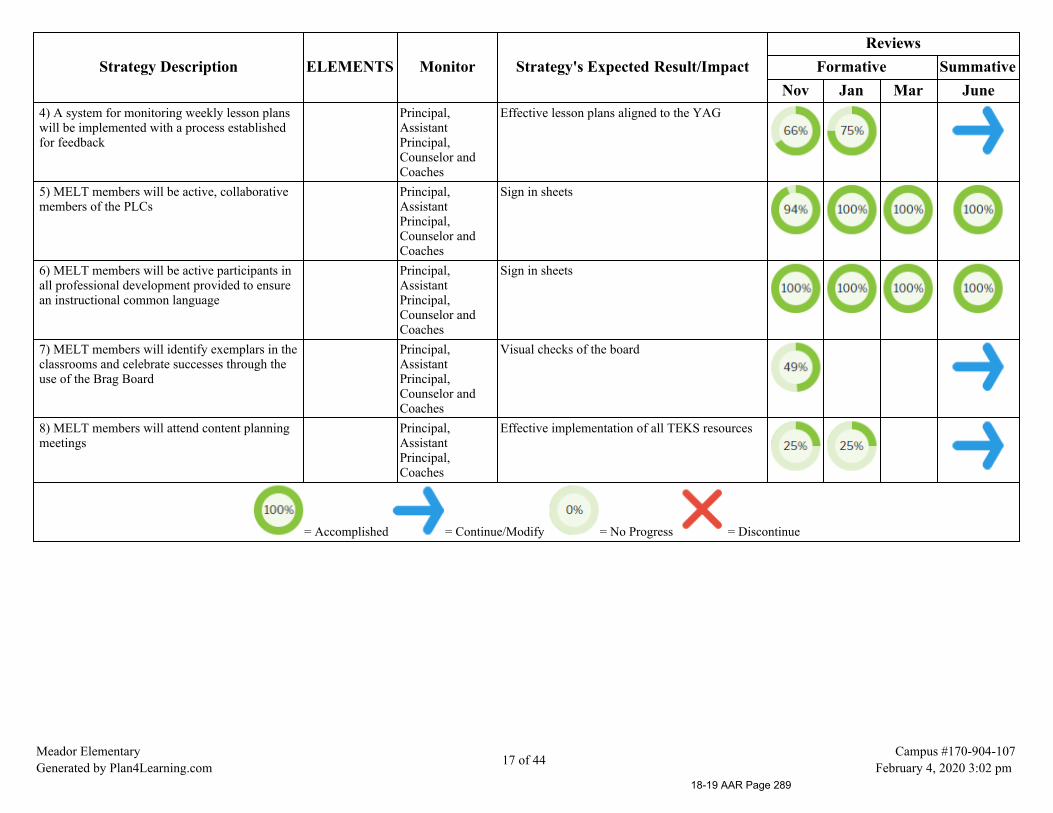
Strategy Description ELEMENTS Monitor Strategy's Expected Result/ImpactReviews
Formative SummativeNov Jan Mar June
4) A system for monitoring weekly lesson planswill be implemented with a process establishedfor feedback
Principal,AssistantPrincipal,Counselor andCoaches
Effective lesson plans aligned to the YAG
5) MELT members will be active, collaborativemembers of the PLCs
Principal,AssistantPrincipal,Counselor andCoaches
Sign in sheets
6) MELT members will be active participants inall professional development provided to ensurean instructional common language
Principal,AssistantPrincipal,Counselor andCoaches
Sign in sheets
7) MELT members will identify exemplars in theclassrooms and celebrate successes through theuse of the Brag Board
Principal,AssistantPrincipal,Counselor andCoaches
Visual checks of the board
8) MELT members will attend content planningmeetings
Principal,AssistantPrincipal,Coaches
Effective implementation of all TEKS resources
= Accomplished = Continue/Modify = No Progress = Discontinue
Meador ElementaryGenerated by Plan4Learning.com 17 of 44
Campus #170-904-107February 4, 2020 3:02 pm
18-19 AAR Page 289

Goal 1: All students will reach high academic standards, at a minimum attaining proficiency or better on state assessments.
Performance Objective 2: Students taking the 2019 STAAR Math will achieve 85% approaches and increase the meets and masters levels by 15% pergrade level.
Evaluation Data Source(s) 2: Impact will be determined by the increase in student scores on the STAAR test
Summative Evaluation 2: Some progress made toward meeting Performance Objective
Next Year's Recommendation 2: Look at longitudinal data to address 4th grade math. Making good progress on master's level
Strategy Description ELEMENTS Monitor Strategy's Expected Result/ImpactReviews
Formative SummativeNov Jan Mar June
1) Implementation of daily Kim Sutton FactFluency
Teachers,Administrators
Increase in successful answers
2) Interactive use of the number line Teachers,Administrators
Increase in student outcomes
3) Use of hands on manipulatives Teachers,Administrators
Increase in successful answers
4) Daily spiral of objectives through the use ofDaily Math Review
Teachers,Administrators
Increase in successful answers
5) Daily use of TEKS resource documents Teachers,Administrators
Aligned scope and sequence
6) Targeted instruction through the use of smallgroups
Teachers,Administrators
Advancing in reading levels and progress beingmade on district and state assessments.
7) Implement the use of math carpets in gradesK-2
Teachers,Administrators
Increase in student outcomes
Meador ElementaryGenerated by Plan4Learning.com 18 of 44
Campus #170-904-107February 4, 2020 3:02 pm
18-19 AAR Page 290

Strategy Description ELEMENTS Monitor Strategy's Expected Result/ImpactReviews
Formative SummativeNov Jan Mar June
Critical Success FactorsCSF 7
8) Continue to support and enrich studentlearning through the use of technology devices inthe classroom
Teachers, ICoach,Administrators
Increase in use of technology to supportinstruction in the classroom
9) Tier 1 interventions in the classroom for everystudent, every day
Teachers,Administrators
increase in student outcomes
10) Centers/stations created to reinforce thebuilding of necessary skills for student success
Teachers,Administrators
Increase in student outcomes
11) Math flashcards posted at each restroom forreinforcement during wait times
Teachers,Administrators
Increase in successful answers
12) Implementation of a dedicated interventionperiod at every grade level, every day
Teachers,Administrators,Interventionists
Increase in student outcomes
13) Use of district benchmarks to targetinterventions
Teachers Progress made on the following assessement
14) Use Eduphoria, MAP and TEAMS asresources for student data reports
Teachers,Administrators
Effective intervention groupings
15) Implementations of weekly PLCs to reviewstudent data, identify effective interventions andcollaborate on best practice strategies
Teachers,Administrators
Increase in collaborative problem solving
16) Use of ELPS to target instruction for the LEPstudents
Teachers,Administrators
Increase in student outcomes
17) Research based programs will beimplemented during Tier 3 pull out interventions
Interventionists,Administrators
Increase in student outcomes
Meador ElementaryGenerated by Plan4Learning.com 19 of 44
Campus #170-904-107February 4, 2020 3:02 pm
18-19 AAR Page 291

Strategy Description ELEMENTS Monitor Strategy's Expected Result/ImpactReviews
Formative SummativeNov Jan Mar June
18) A Learning Summit will be implementedthree weeks prior to all state assessmentsproviding targeted interventions for all students
Teachers,Administrators
Increase in student outcomes
19) Interventions across grade levels targetingspecific needs of the students
Teachers,Coaches,Administrators
Increase in student achievement
20) Before and after school tutorials Teachers Attendance logs and increase in student outcomes
21) Use of grade level common end of unitperformance assessments
Teachers Guaranteed and viable curriculum across thegrade level
22) Common planning with the use of identifiedstrategies to dig deep into the TEKS
Teachers,Coaches
Clear understanding of student expectations
23) Concentrate on the use of open-endedquestions
Teachers Practice on higher level thinking skills
= Accomplished = Continue/Modify = No Progress = Discontinue
Meador ElementaryGenerated by Plan4Learning.com 20 of 44
Campus #170-904-107February 4, 2020 3:02 pm
18-19 AAR Page 292
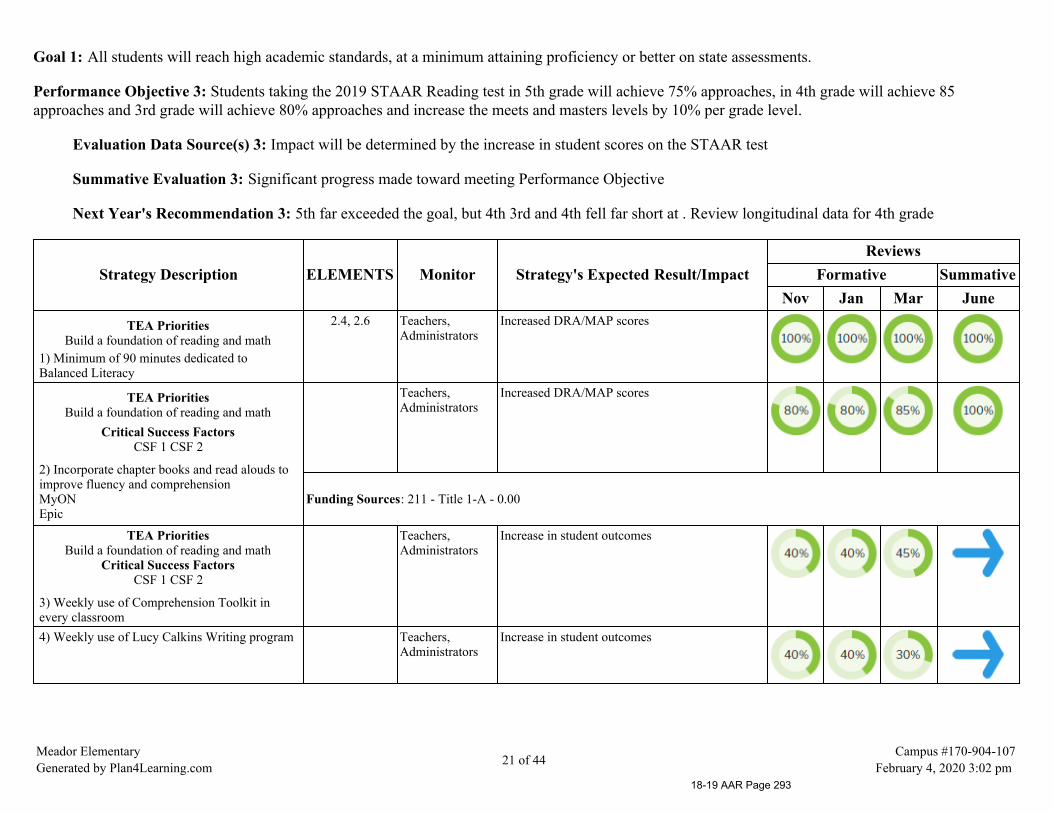
Goal 1: All students will reach high academic standards, at a minimum attaining proficiency or better on state assessments.
Performance Objective 3: Students taking the 2019 STAAR Reading test in 5th grade will achieve 75% approaches, in 4th grade will achieve 85approaches and 3rd grade will achieve 80% approaches and increase the meets and masters levels by 10% per grade level.
Evaluation Data Source(s) 3: Impact will be determined by the increase in student scores on the STAAR test
Summative Evaluation 3: Significant progress made toward meeting Performance Objective
Next Year's Recommendation 3: 5th far exceeded the goal, but 4th 3rd and 4th fell far short at . Review longitudinal data for 4th grade
Strategy Description ELEMENTS Monitor Strategy's Expected Result/ImpactReviews
Formative SummativeNov Jan Mar June
TEA PrioritiesBuild a foundation of reading and math
1) Minimum of 90 minutes dedicated toBalanced Literacy
2.4, 2.6 Teachers,Administrators
Increased DRA/MAP scores
TEA PrioritiesBuild a foundation of reading and math
Critical Success FactorsCSF 1 CSF 2
2) Incorporate chapter books and read alouds toimprove fluency and comprehensionMyONEpic
Teachers,Administrators
Increased DRA/MAP scores
Funding Sources: 211 - Title 1-A - 0.00
TEA PrioritiesBuild a foundation of reading and math
Critical Success FactorsCSF 1 CSF 2
3) Weekly use of Comprehension Toolkit inevery classroom
Teachers,Administrators
Increase in student outcomes
4) Weekly use of Lucy Calkins Writing program Teachers,Administrators
Increase in student outcomes
Meador ElementaryGenerated by Plan4Learning.com 21 of 44
Campus #170-904-107February 4, 2020 3:02 pm
18-19 AAR Page 293

Strategy Description ELEMENTS Monitor Strategy's Expected Result/ImpactReviews
Formative SummativeNov Jan Mar June
TEA PrioritiesBuild a foundation of reading and math
Critical Success FactorsCSF 1 CSF 2 CSF 4
5) Implementation of Leveled LiteracyIntervention in kindergarten and grades 1 and 2
2.4, 2.6 Teachers,Administrators
Increase in student comprehension
6) Provide home reading material to reinforcereading skills
Teachers,Administration
Progress measured through guided reading groupdata
7) Use of authentic text to model thinking andreading strategies
Teachers Increase in student comprehension
8) Targeted instruction through the use of smallgroups
Teachers,Administrators
Advancing in reading levels and progress beingmade on district and state assessments
TEA PrioritiesBuild a foundation of reading and math
Critical Success FactorsCSF 1 CSF 2 CSF 7
9) Continue to support and enrich studentlearning through the use of technology devices inthe classroom-MAP-MyON-Study Island, Exact Path, Reading Eggs-Flocabulary-Ipads-Chromebooks and carts
2.4, 2.5 Teachers,Administrators,InstructionalCoaches
Increase in use of technology to supportinstruction in the classroom
Funding Sources: 211 - Title 1-A - 24700.00
10) Tier 1 interventions in the classroom forevery student, every day
Teachers,Administrators
increase in student outcomes
11) Centers/stations created to reinforce thebuilding of necessary skills for student success
Teachers,Administrators
Increase in student outcomes
Meador ElementaryGenerated by Plan4Learning.com 22 of 44
Campus #170-904-107February 4, 2020 3:02 pm
18-19 AAR Page 294

Strategy Description ELEMENTS Monitor Strategy's Expected Result/ImpactReviews
Formative SummativeNov Jan Mar June
12) Implementation of a dedicated interventionperiod at every grade level, every day
Teachers,Administrators,Interventionists
Increase in student outcomes
13) Use of district benchmarks to targetinterventions
Teachers Progress made on the following assessement
TEA PrioritiesBuild a foundation of reading and math
Critical Success FactorsCSF 1 CSF 2
14) Implementations of weekly PLCs to reviewstudent data, identify effective interventions andcollaborate on best practice strategies
2.4, 2.5 Teachers,Administrators,Instructionalcoaches
Increase in collaborative problem solving
15) Use of ELPS to target instruction for the LEPstudents
Teachers,Administrators
Increase in student outcomes
16) Research based programs will beimplemented during Tier 3 pull out interventions.
Interventionists,Administrators
Increase in student outcomes
TEA PrioritiesBuild a foundation of reading and math
Critical Success FactorsCSF 1 CSF 2
17) A Learning Summit will be implemented twoweeks prior to all state assessments providingtargeted interventions for all students.
2.4, 2.5 Teachers,Administrators,Instructionalcoaches
Increase in student outcomes
18) Interventions across grade levels targetingspecific needs of the students
Teachers,Coaches,Administrators
Increase in student achievement
19) Use of grade level common end of unitperformance assessments
Teachers Guaranteed and viable curriculum across thegrade level
Meador ElementaryGenerated by Plan4Learning.com 23 of 44
Campus #170-904-107February 4, 2020 3:02 pm
18-19 AAR Page 295

Strategy Description ELEMENTS Monitor Strategy's Expected Result/ImpactReviews
Formative SummativeNov Jan Mar June
20) Common planning with the use of identifiedstrategies to dig deep into the TEKS
Teachers,Coaches
Clear understanding of student expectations
21) Concentrate on the use of open-endedquestions
Teachers Practice on higher level thinking skills
= Accomplished = Continue/Modify = No Progress = Discontinue
Meador ElementaryGenerated by Plan4Learning.com 24 of 44
Campus #170-904-107February 4, 2020 3:02 pm
18-19 AAR Page 296
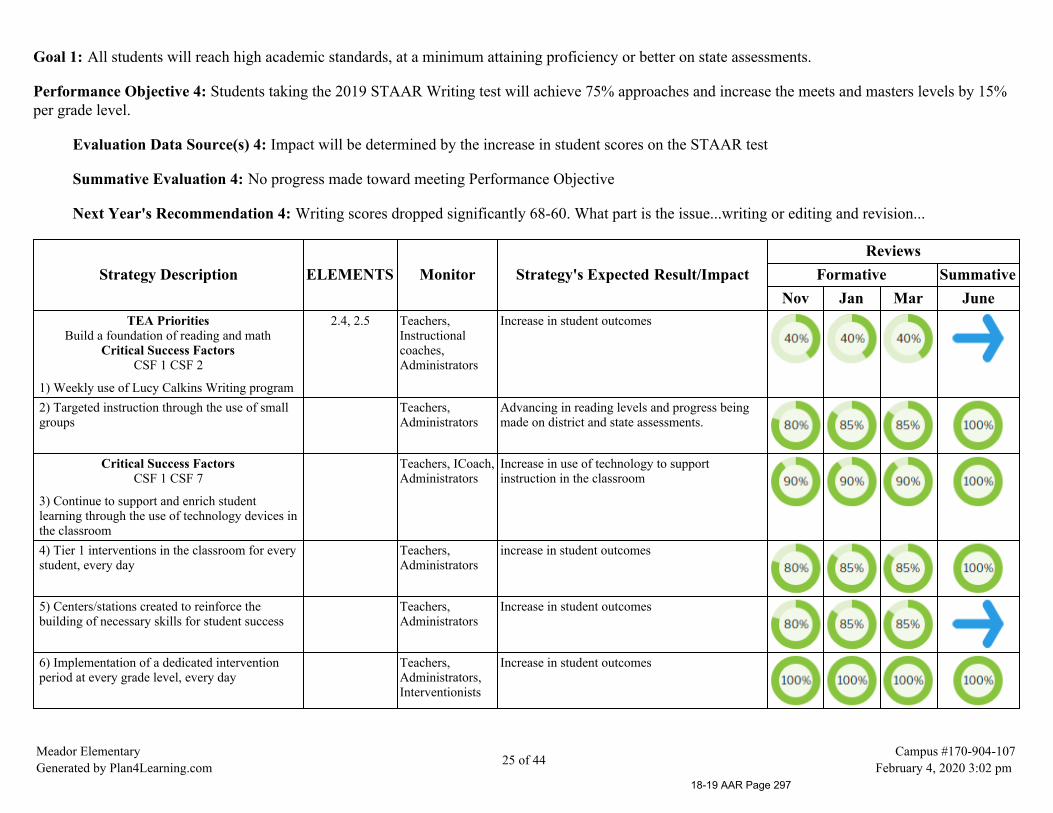
Goal 1: All students will reach high academic standards, at a minimum attaining proficiency or better on state assessments.
Performance Objective 4: Students taking the 2019 STAAR Writing test will achieve 75% approaches and increase the meets and masters levels by 15%per grade level.
Evaluation Data Source(s) 4: Impact will be determined by the increase in student scores on the STAAR test
Summative Evaluation 4: No progress made toward meeting Performance Objective
Next Year's Recommendation 4: Writing scores dropped significantly 68-60. What part is the issue...writing or editing and revision...
Strategy Description ELEMENTS Monitor Strategy's Expected Result/ImpactReviews
Formative SummativeNov Jan Mar June
TEA PrioritiesBuild a foundation of reading and math
Critical Success FactorsCSF 1 CSF 2
1) Weekly use of Lucy Calkins Writing program
2.4, 2.5 Teachers,Instructionalcoaches,Administrators
Increase in student outcomes
2) Targeted instruction through the use of smallgroups
Teachers,Administrators
Advancing in reading levels and progress beingmade on district and state assessments.
Critical Success FactorsCSF 1 CSF 7
3) Continue to support and enrich studentlearning through the use of technology devices inthe classroom
Teachers, ICoach,Administrators
Increase in use of technology to supportinstruction in the classroom
4) Tier 1 interventions in the classroom for everystudent, every day
Teachers,Administrators
increase in student outcomes
5) Centers/stations created to reinforce thebuilding of necessary skills for student success
Teachers,Administrators
Increase in student outcomes
6) Implementation of a dedicated interventionperiod at every grade level, every day
Teachers,Administrators,Interventionists
Increase in student outcomes
Meador ElementaryGenerated by Plan4Learning.com 25 of 44
Campus #170-904-107February 4, 2020 3:02 pm
18-19 AAR Page 297

Strategy Description ELEMENTS Monitor Strategy's Expected Result/ImpactReviews
Formative SummativeNov Jan Mar June
7) Use of district benchmarks to targetinterventions
Teachers Progress made on the following assessement
8) Implementations of weekly PLCs to reviewstudent data, identify effective interventions andcollaborate on best practice strategies
Teachers,Administrators
Increase in collaborative problem solving
9) Use of ELPS to target instruction for the LEPstudents
Teachers,Administrators
Increase in student outcomes
10) A Learning Summit will be implementedthree weeks prior to all state assessmentsproviding targeted interventions for all students
Teachers,Administrators
Increase in student outcomes
= Accomplished = Continue/Modify = No Progress = Discontinue
Meador ElementaryGenerated by Plan4Learning.com 26 of 44
Campus #170-904-107February 4, 2020 3:02 pm
18-19 AAR Page 298

Goal 1: All students will reach high academic standards, at a minimum attaining proficiency or better on state assessments.
Performance Objective 5: Students taking the 2019 STAAR Science test will achieve 85% approaches and increase the meets and masters levels by 15%per grade level.
Evaluation Data Source(s) 5: Impact will be determined by the increase in student scores on the STAAR test
Summative Evaluation 5: No progress made toward meeting Performance Objective
Next Year's Recommendation 5: same percentage as last year. need more realistic goals and review of what is being taught
Strategy Description ELEMENTS Monitor Strategy's Expected Result/ImpactReviews
Formative SummativeNov Jan Mar June
Critical Success FactorsCSF 1 CSF 2
1) Use of hands on experiments in theclassrooms
2.4, 2.5 Teachers,Administrators,instructionalcoaches, Districtcoordinator forScience
Increase of experiments in the classroom andimproved performance by students on assessments
2) Targeted instruction through the use of smallgroups
Teachers,Administrators
Advancing in reading levels and progress beingmade on district and state assessments.
TEA PrioritiesBuild a foundation of reading and math
Critical Success FactorsCSF 1 CSF 2 CSF 7
3) Continue to support and enrich studentlearning through the use of technology devicesand programs in the classroom
2.4, 2.5, 2.6 Teachers,Administrators,instructionalcoaches
Increase use of technology to support classroominstruction
4) Tier 1 interventions in the classroom for everystudent, every day
Teachers,Administrators
increase in student outcomes
5) Centers/stations created to reinforce thebuilding of necessary skills for student success
Teachers,Administrators
Increase in student outcomes
Meador ElementaryGenerated by Plan4Learning.com 27 of 44
Campus #170-904-107February 4, 2020 3:02 pm
18-19 AAR Page 299
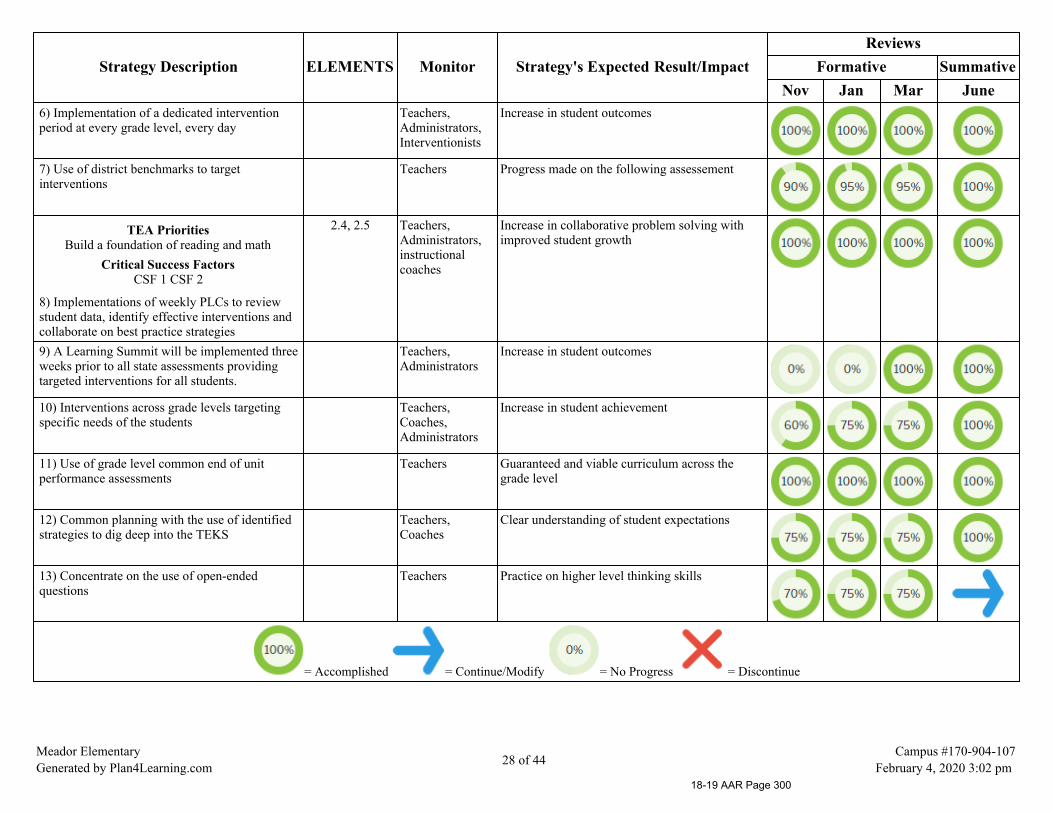
Strategy Description ELEMENTS Monitor Strategy's Expected Result/ImpactReviews
Formative SummativeNov Jan Mar June
6) Implementation of a dedicated interventionperiod at every grade level, every day
Teachers,Administrators,Interventionists
Increase in student outcomes
7) Use of district benchmarks to targetinterventions
Teachers Progress made on the following assessement
TEA PrioritiesBuild a foundation of reading and math
Critical Success FactorsCSF 1 CSF 2
8) Implementations of weekly PLCs to reviewstudent data, identify effective interventions andcollaborate on best practice strategies
2.4, 2.5 Teachers,Administrators,instructionalcoaches
Increase in collaborative problem solving withimproved student growth
9) A Learning Summit will be implemented threeweeks prior to all state assessments providingtargeted interventions for all students.
Teachers,Administrators
Increase in student outcomes
10) Interventions across grade levels targetingspecific needs of the students
Teachers,Coaches,Administrators
Increase in student achievement
11) Use of grade level common end of unitperformance assessments
Teachers Guaranteed and viable curriculum across thegrade level
12) Common planning with the use of identifiedstrategies to dig deep into the TEKS
Teachers,Coaches
Clear understanding of student expectations
13) Concentrate on the use of open-endedquestions
Teachers Practice on higher level thinking skills
= Accomplished = Continue/Modify = No Progress = Discontinue
Meador ElementaryGenerated by Plan4Learning.com 28 of 44
Campus #170-904-107February 4, 2020 3:02 pm
18-19 AAR Page 300

Goal 2: All parents will participate in regular, two-way, and meaningful communication involving studentacademic learning and school activities.
Performance Objective 1: To increase parent participation in school activities, during the 2018-19 school year, William Lloyd Meador Elementary willsend weekly communication to parents and guardians of all students, increasing activity attendance by 10%.
Evaluation Data Source(s) 1: Impact will be determined by the increased attendance this year over last year's events
Summative Evaluation 1: Significant progress made toward meeting Performance Objective
Next Year's Recommendation 1: Use phone and email system more to communicate activities more often
Strategy Description ELEMENTS Monitor Strategy's Expected Result/ImpactReviews
Formative SummativeNov Jan Mar June
1) Continue the Watch D.O.G.S. program oncampus (Dads of Great Students)
Principal andAssistantPrincipals
Increased visibility of Dads on campus
2) Parent/teacher conferences can be initiated byeither party with the focus being a solutionsbased conversation to identify supports for theconcerns brought forth
Principal andcampus staff
Increased number of conferences initiated byparents to address concerns
3) Conference with and provide information tostudents and parents concerning SSI initiativesand STAAR requirements (SSI letters andbrochures)
Principal,Counselor andcampus staffgrades 3-5
Parental feedback stating an understanding of theexpectations of the STAAR assessment process
4) Communication extending invitations toparticipate in upcoming events will be displayedon the school website, district app, notes home,social media and the message board on thecampus grounds
Principal Positive public relations and increased parentparticipation
5) The phone system will be used tocommunicate important information andinvitations to participate in important schoolevents in both English and Spanish
Principal Positive public relations and increased parentparticipation
6) Parent information nights will be offered toshare program awareness, homework help,LPAC committee information and assessmentinformation
Principal Positive public relations and increased parentparticipation
Meador ElementaryGenerated by Plan4Learning.com 29 of 44
Campus #170-904-107February 4, 2020 3:02 pm
18-19 AAR Page 301

Strategy Description ELEMENTS Monitor Strategy's Expected Result/ImpactReviews
Formative SummativeNov Jan Mar June
7) Student organizational planners will be usedin 5th grade to keep parents informed ofbehavioral and academic progress on a dailybasis. Kindergarten - 4th grade will use dailyfolders and Monday folders
Campus staff Two way communication with parents
8) Each teacher will maintain a classroomwebsite accessible to parents
AssistantPrincipal andcampus staff
Positive public relations and increased parentparticipation
9) Parents will be represented on the CEIC Principal Collaborative problem solving
10) A calendar of activities will be sent homemonthly as well as a school newsletter everynine weeks with happenings for the past, presentand future
Principal Positive public relations and increased parentparticipation
11) Information for off-site resources(counseling, district parent center, communitydonors) will be available to all parents
Counselor Positive parent relations
12) Family nights will be held for reading, mathand science and will provide strategies toimprove literacy and enrichment and extensionof the skills learned in those classes
Principal Positive public relations and increased parentparticipation
13) A parent survey will be conducted to gatherinput on the climate of the school
Principal Changes in the efficiency or effectiveness ofschool programs and policies
14) Flexible working hours of the para-professional staff will ensure that there is aSpanish speaker available to answer phones andgreet parents in the front office
Principal Positive public relations
15) Continue the Meador M.O.M.S. program toincrease the opportunity for parental involvementon the campus
Principal,AssistantPrincipal
Increased visibility of MOMS on campus
= Accomplished = Continue/Modify = No Progress = Discontinue
Meador ElementaryGenerated by Plan4Learning.com 30 of 44
Campus #170-904-107February 4, 2020 3:02 pm
18-19 AAR Page 302
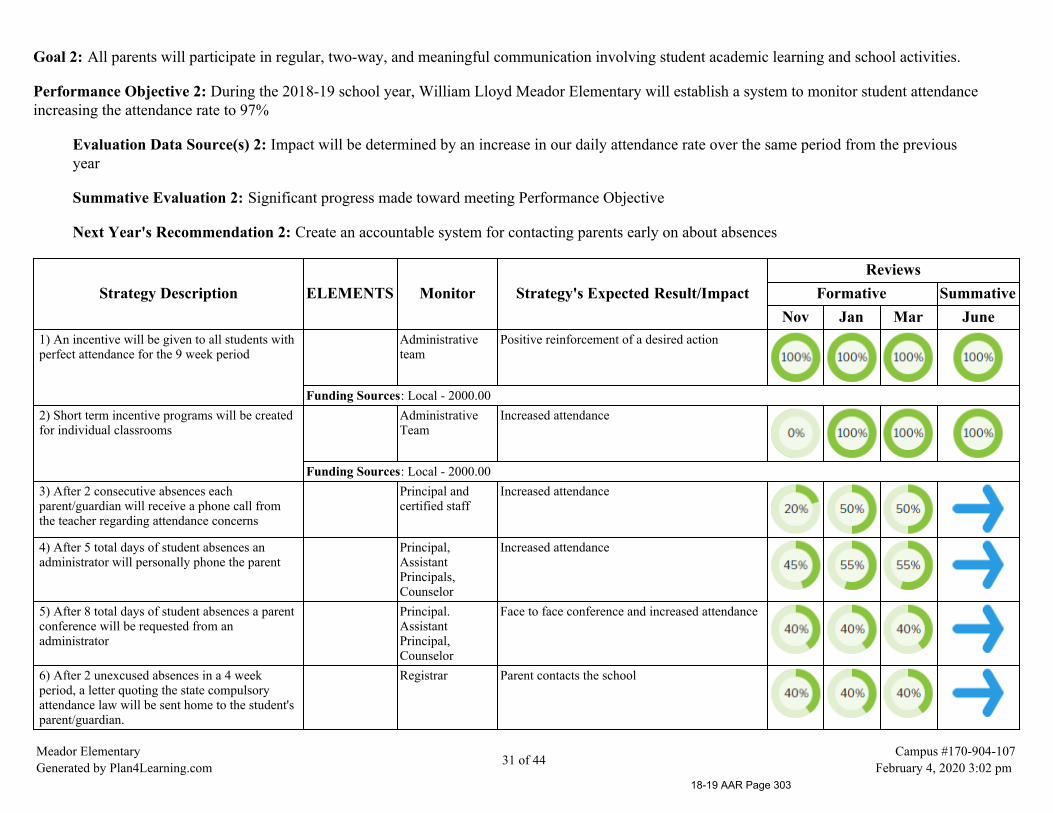
Goal 2: All parents will participate in regular, two-way, and meaningful communication involving student academic learning and school activities.
Performance Objective 2: During the 2018-19 school year, William Lloyd Meador Elementary will establish a system to monitor student attendanceincreasing the attendance rate to 97%
Evaluation Data Source(s) 2: Impact will be determined by an increase in our daily attendance rate over the same period from the previousyear
Summative Evaluation 2: Significant progress made toward meeting Performance Objective
Next Year's Recommendation 2: Create an accountable system for contacting parents early on about absences
Strategy Description ELEMENTS Monitor Strategy's Expected Result/ImpactReviews
Formative SummativeNov Jan Mar June
1) An incentive will be given to all students withperfect attendance for the 9 week period
Administrativeteam
Positive reinforcement of a desired action
Funding Sources: Local - 2000.002) Short term incentive programs will be createdfor individual classrooms
AdministrativeTeam
Increased attendance
Funding Sources: Local - 2000.003) After 2 consecutive absences eachparent/guardian will receive a phone call fromthe teacher regarding attendance concerns
Principal andcertified staff
Increased attendance
4) After 5 total days of student absences anadministrator will personally phone the parent
Principal,AssistantPrincipals,Counselor
Increased attendance
5) After 8 total days of student absences a parentconference will be requested from anadministrator
Principal.AssistantPrincipal,Counselor
Face to face conference and increased attendance
6) After 2 unexcused absences in a 4 weekperiod, a letter quoting the state compulsoryattendance law will be sent home to the student'sparent/guardian.
Registrar Parent contacts the school
Meador ElementaryGenerated by Plan4Learning.com 31 of 44
Campus #170-904-107February 4, 2020 3:02 pm
18-19 AAR Page 303
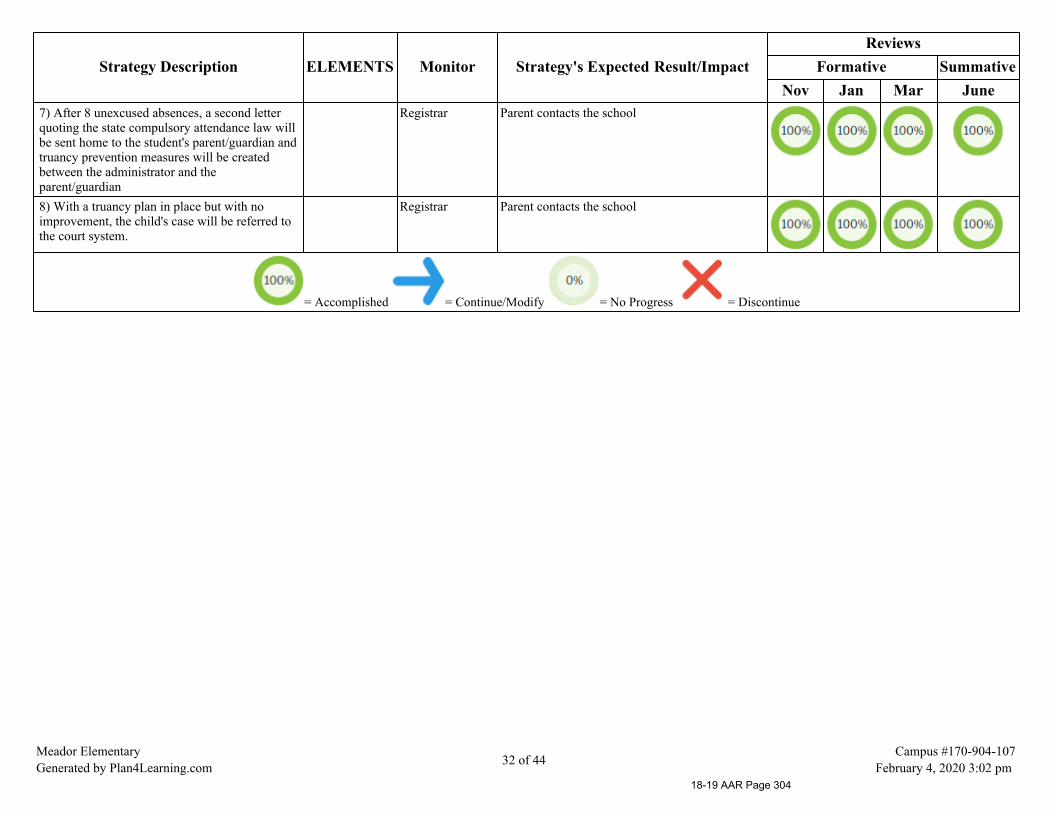
Strategy Description ELEMENTS Monitor Strategy's Expected Result/ImpactReviews
Formative SummativeNov Jan Mar June
7) After 8 unexcused absences, a second letterquoting the state compulsory attendance law willbe sent home to the student's parent/guardian andtruancy prevention measures will be createdbetween the administrator and theparent/guardian
Registrar Parent contacts the school
8) With a truancy plan in place but with noimprovement, the child's case will be referred tothe court system.
Registrar Parent contacts the school
= Accomplished = Continue/Modify = No Progress = Discontinue
Meador ElementaryGenerated by Plan4Learning.com 32 of 44
Campus #170-904-107February 4, 2020 3:02 pm
18-19 AAR Page 304
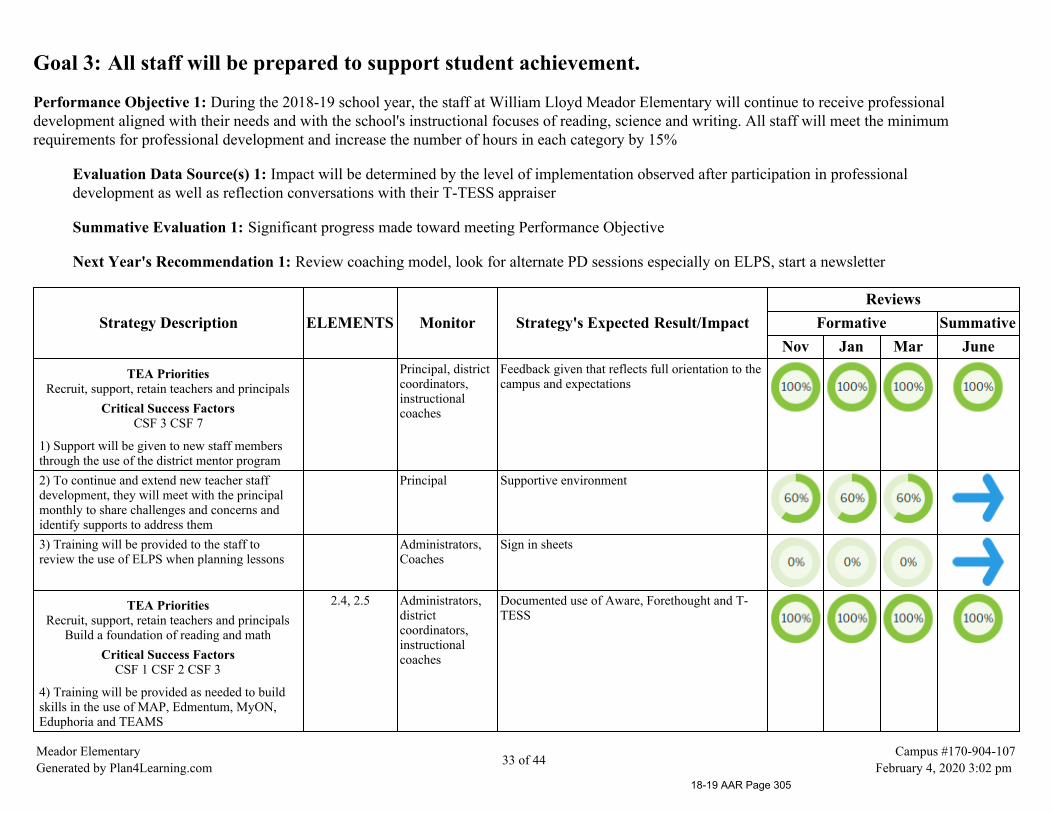
Goal 3: All staff will be prepared to support student achievement.
Performance Objective 1: During the 2018-19 school year, the staff at William Lloyd Meador Elementary will continue to receive professionaldevelopment aligned with their needs and with the school's instructional focuses of reading, science and writing. All staff will meet the minimumrequirements for professional development and increase the number of hours in each category by 15%
Evaluation Data Source(s) 1: Impact will be determined by the level of implementation observed after participation in professionaldevelopment as well as reflection conversations with their T-TESS appraiser
Summative Evaluation 1: Significant progress made toward meeting Performance Objective
Next Year's Recommendation 1: Review coaching model, look for alternate PD sessions especially on ELPS, start a newsletter
Strategy Description ELEMENTS Monitor Strategy's Expected Result/ImpactReviews
Formative SummativeNov Jan Mar June
TEA PrioritiesRecruit, support, retain teachers and principals
Critical Success FactorsCSF 3 CSF 7
1) Support will be given to new staff membersthrough the use of the district mentor program
Principal, districtcoordinators,instructionalcoaches
Feedback given that reflects full orientation to thecampus and expectations
2) To continue and extend new teacher staffdevelopment, they will meet with the principalmonthly to share challenges and concerns andidentify supports to address them
Principal Supportive environment
3) Training will be provided to the staff toreview the use of ELPS when planning lessons
Administrators,Coaches
Sign in sheets
TEA PrioritiesRecruit, support, retain teachers and principals
Build a foundation of reading and mathCritical Success Factors
CSF 1 CSF 2 CSF 3
4) Training will be provided as needed to buildskills in the use of MAP, Edmentum, MyON,Eduphoria and TEAMS
2.4, 2.5 Administrators,districtcoordinators,instructionalcoaches
Documented use of Aware, Forethought and T-TESS
Meador ElementaryGenerated by Plan4Learning.com 33 of 44
Campus #170-904-107February 4, 2020 3:02 pm
18-19 AAR Page 305
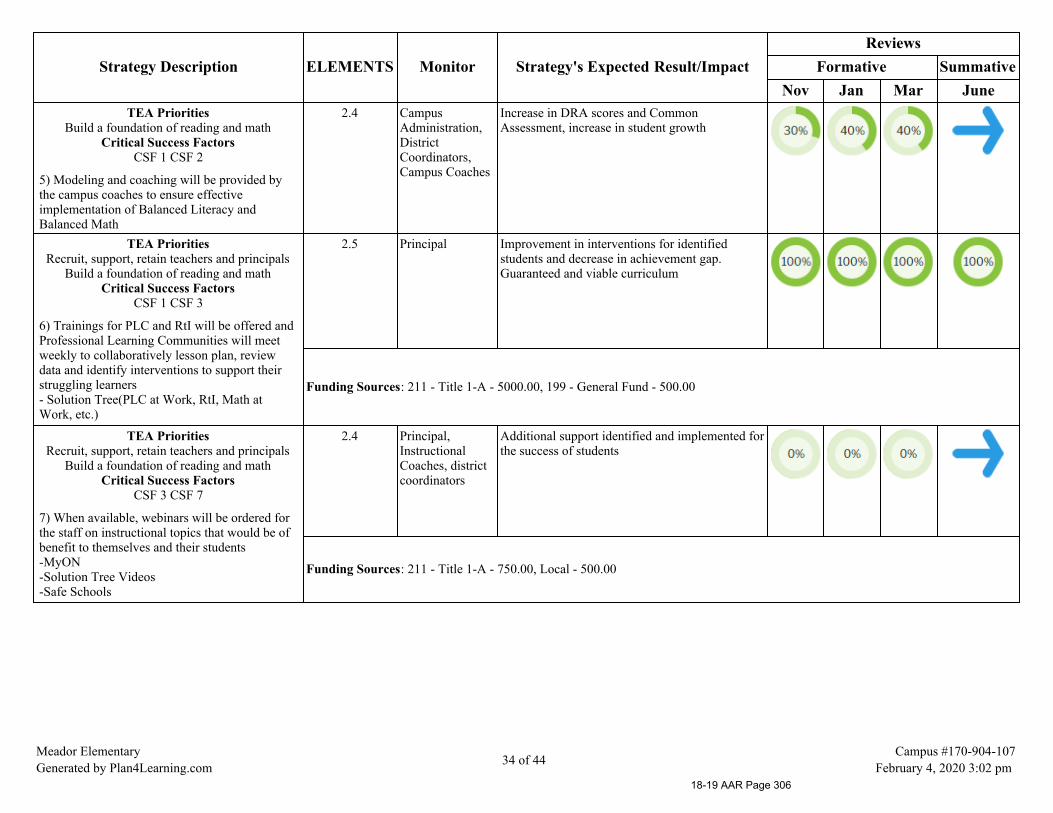
Strategy Description ELEMENTS Monitor Strategy's Expected Result/ImpactReviews
Formative SummativeNov Jan Mar June
TEA PrioritiesBuild a foundation of reading and math
Critical Success FactorsCSF 1 CSF 2
5) Modeling and coaching will be provided bythe campus coaches to ensure effectiveimplementation of Balanced Literacy andBalanced Math
2.4 CampusAdministration,DistrictCoordinators,Campus Coaches
Increase in DRA scores and CommonAssessment, increase in student growth
TEA PrioritiesRecruit, support, retain teachers and principals
Build a foundation of reading and mathCritical Success Factors
CSF 1 CSF 3
6) Trainings for PLC and RtI will be offered andProfessional Learning Communities will meetweekly to collaboratively lesson plan, reviewdata and identify interventions to support theirstruggling learners - Solution Tree(PLC at Work, RtI, Math atWork, etc.)
2.5 Principal Improvement in interventions for identifiedstudents and decrease in achievement gap.Guaranteed and viable curriculum
Funding Sources: 211 - Title 1-A - 5000.00, 199 - General Fund - 500.00
TEA PrioritiesRecruit, support, retain teachers and principals
Build a foundation of reading and mathCritical Success Factors
CSF 3 CSF 7
7) When available, webinars will be ordered forthe staff on instructional topics that would be ofbenefit to themselves and their students-MyON-Solution Tree Videos-Safe Schools
2.4 Principal,InstructionalCoaches, districtcoordinators
Additional support identified and implemented forthe success of students
Funding Sources: 211 - Title 1-A - 750.00, Local - 500.00
Meador ElementaryGenerated by Plan4Learning.com 34 of 44
Campus #170-904-107February 4, 2020 3:02 pm
18-19 AAR Page 306

Strategy Description ELEMENTS Monitor Strategy's Expected Result/ImpactReviews
Formative SummativeNov Jan Mar June
TEA PrioritiesRecruit, support, retain teachers and principals
Build a foundation of reading and mathCritical Success Factors
CSF 1 CSF 2 CSF 3 CSF 7
8) Opportunities will be provided for staff toattend off-site professional development - Solution Tree-Lead4ward-ESC 6
2.4, 2.5 Principal Registration documentation
Funding Sources: 211 - Title 1-A - 2000.00
9) Additional books will be purchased for theprofessional library to provide extra resourcesfor the staff
Principal Additional resources
10) Teachers will work collaboratively withadministrators and campus coaches to reflect ontheir own practice
Campus Coaches,Administrators
Increase in coaching/modeling sessions
11) All instructional staff includingparaprofessional will attend campus and districtprofessional development
Principal Reinforcement of instructional goals
TEA PrioritiesBuild a foundation of reading and math
Critical Success FactorsCSF 1 CSF 2 CSF 7
12) Training with Melissa Leach Literacy toimprove reading instruction will be offered in thedistrict
2.4, 2.5 Administrators,instructionalcoaches
Improved reading scores and increase in numberof students reading on level
Funding Sources: Title Funds - 2000.00
= Accomplished = Continue/Modify = No Progress = Discontinue
Meador ElementaryGenerated by Plan4Learning.com 35 of 44
Campus #170-904-107February 4, 2020 3:02 pm
18-19 AAR Page 307
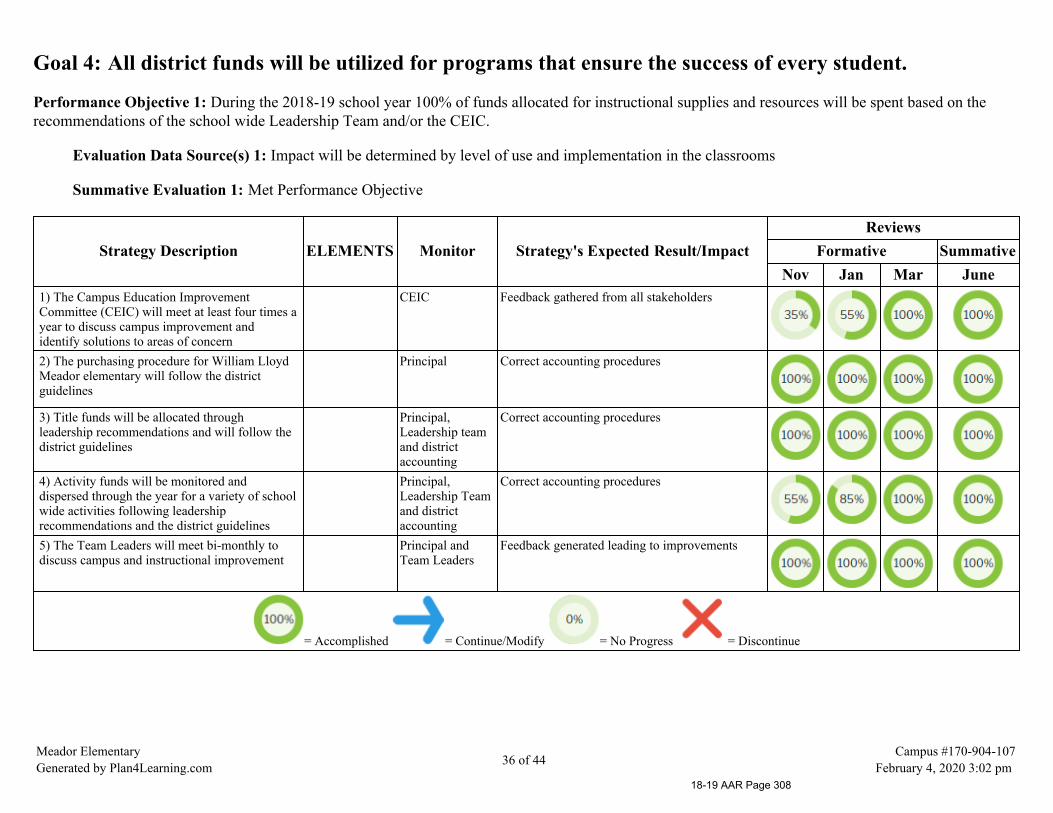
Goal 4: All district funds will be utilized for programs that ensure the success of every student.
Performance Objective 1: During the 2018-19 school year 100% of funds allocated for instructional supplies and resources will be spent based on therecommendations of the school wide Leadership Team and/or the CEIC.
Evaluation Data Source(s) 1: Impact will be determined by level of use and implementation in the classrooms
Summative Evaluation 1: Met Performance Objective
Strategy Description ELEMENTS Monitor Strategy's Expected Result/ImpactReviews
Formative SummativeNov Jan Mar June
1) The Campus Education ImprovementCommittee (CEIC) will meet at least four times ayear to discuss campus improvement andidentify solutions to areas of concern
CEIC Feedback gathered from all stakeholders
2) The purchasing procedure for William LloydMeador elementary will follow the districtguidelines
Principal Correct accounting procedures
3) Title funds will be allocated throughleadership recommendations and will follow thedistrict guidelines
Principal,Leadership teamand districtaccounting
Correct accounting procedures
4) Activity funds will be monitored anddispersed through the year for a variety of schoolwide activities following leadershiprecommendations and the district guidelines
Principal,Leadership Teamand districtaccounting
Correct accounting procedures
5) The Team Leaders will meet bi-monthly todiscuss campus and instructional improvement
Principal andTeam Leaders
Feedback generated leading to improvements
= Accomplished = Continue/Modify = No Progress = Discontinue
Meador ElementaryGenerated by Plan4Learning.com 36 of 44
Campus #170-904-107February 4, 2020 3:02 pm
18-19 AAR Page 308

Goal 5: All students will be educated in learning environments that are safe and conducive learning.
Performance Objective 1: To ensure the safety of all students, the staff of William Lloyd Elementary will conduct 9 safety procedures meetings starting inSeptember 2018 and ending May 2019.
Evaluation Data Source(s) 1: Impact will be determined by the lack of safety concerns on the campus
Summative Evaluation 1: Met Performance Objective
Strategy Description ELEMENTS Monitor Strategy's Expected Result/ImpactReviews
Formative SummativeNov Jan Mar June
1) School wide safety rules reviewed, enforcedand posted: playground rules, cafeteria rules,student car rider policy, bus discipline policy,visitor tags, and medication policy
AssistantPrincipal andcampus staff
Decrease in incidents
2) Review the crisis response team and crisismanagement procedures, assign roles and updateall staff two times a year
AssistantPrincipal
Roles successfully filled in drills
3) Require that all visitors wear ID badges andstaff will monitor and report suspicioussituations and/or unauthorized people in thebuilding
AssistantPrincipal
100% of adults in building identified
4) Monthly fire and/or tornado drills will bepracticed by students and staff to ensure theirsafety
AssistantPrincipal
Successful drills
5) Review lock down procedures with the fullstaff
AssistantPrincipal andConstables
Successful procedure if necessary
6) A daily walk of the building will be done toensure that all perimeter doors of the building arelocked and exits are free from obstruction
Principal,AssistantPrincipal,Custodial Leadand Constables
All children safely behind locked doors
Meador ElementaryGenerated by Plan4Learning.com 37 of 44
Campus #170-904-107February 4, 2020 3:02 pm
18-19 AAR Page 309

Strategy Description ELEMENTS Monitor Strategy's Expected Result/ImpactReviews
Formative SummativeNov Jan Mar June
7) Internal doors to all classrooms will be lockedat all times when students are present
Principal,AssistantPrincipal,Custodial Leadand Constables
All children safely behind locked doors
8) Staff will be trained on the use of theBearacade puchased for each classroom
Principal,AssistantPrincipal
In case of emergency all rooms will be lockeddown
= Accomplished = Continue/Modify = No Progress = Discontinue
Meador ElementaryGenerated by Plan4Learning.com 38 of 44
Campus #170-904-107February 4, 2020 3:02 pm
18-19 AAR Page 310

Goal 5: All students will be educated in learning environments that are safe and conducive learning.
Performance Objective 2: By January 2019, working in partnership with WISD Behavior Specialists, Meador Elementary will identify successfulstrategies to be used with Tier 3 RtI behavior students increasing their time in the classroom by 50%.
Evaluation Data Source(s) 2: Impact will be determined by the data collected recording successful in class time
Summative Evaluation 2:
Strategy Description ELEMENTS Monitor Strategy's Expected Result/ImpactReviews
Formative SummativeNov Jan Mar June
1) Following PBIS strategies, all Tier 2 and Tier3 RtI behavior students will have a check inperson
Leadership Team Meaningful relationships supporting the student tomake good decisions
2) Following PBIS strategies, all Tier 2 and Tier3 students will have incentives available to worktoward
Principal Positive reinforcement of desired behaviors
Funding Sources: Local - 0.003) Following PBIS strategies, all Tier 2 and Tier3 students will have incentives available to worktoward
Principal Positive reinforcement of desired behaviors
Funding Sources: Local - 100.004) Following PBIS strategies, a cool down roomwill be established for students who need toreflect on their actions
Principal,AssistantPrincipal,Counselor
Quick student cool down and return to classrooms
= Accomplished = Continue/Modify = No Progress = Discontinue
Meador ElementaryGenerated by Plan4Learning.com 39 of 44
Campus #170-904-107February 4, 2020 3:02 pm
18-19 AAR Page 311
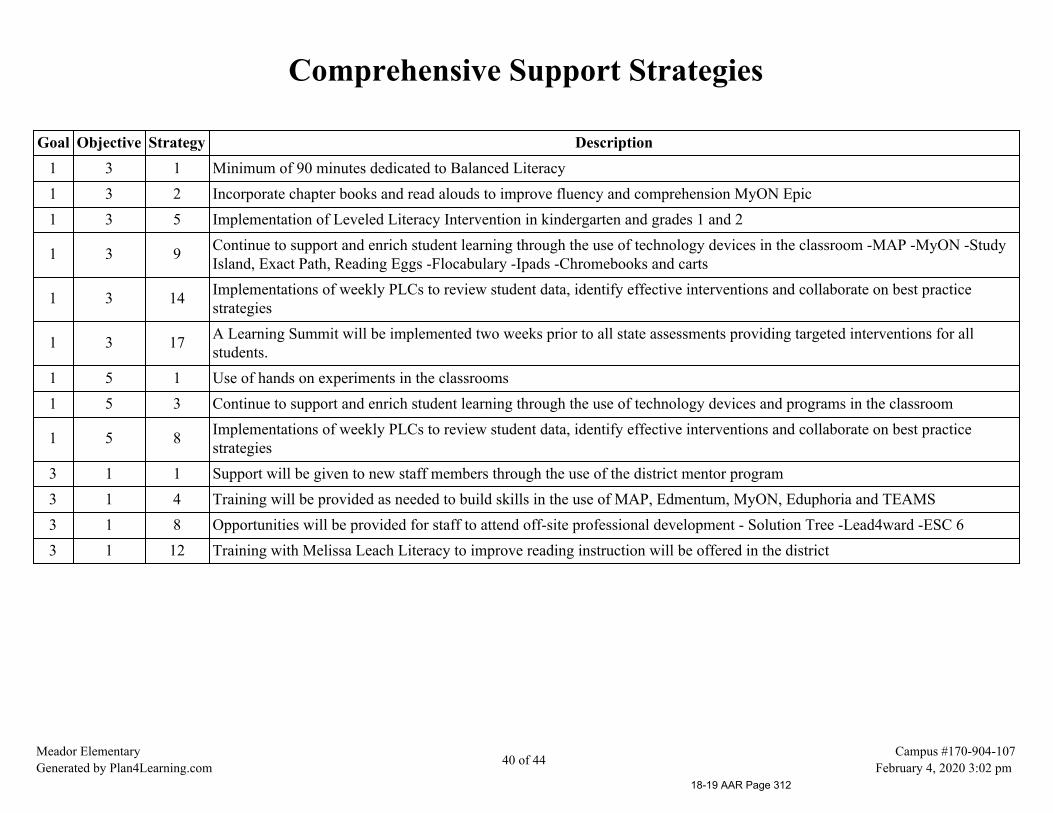
Comprehensive Support Strategies
Goal Objective Strategy Description1 3 1 Minimum of 90 minutes dedicated to Balanced Literacy1 3 2 Incorporate chapter books and read alouds to improve fluency and comprehension MyON Epic1 3 5 Implementation of Leveled Literacy Intervention in kindergarten and grades 1 and 2
1 3 9 Continue to support and enrich student learning through the use of technology devices in the classroom -MAP -MyON -StudyIsland, Exact Path, Reading Eggs -Flocabulary -Ipads -Chromebooks and carts
1 3 14 Implementations of weekly PLCs to review student data, identify effective interventions and collaborate on best practicestrategies
1 3 17 A Learning Summit will be implemented two weeks prior to all state assessments providing targeted interventions for allstudents.
1 5 1 Use of hands on experiments in the classrooms1 5 3 Continue to support and enrich student learning through the use of technology devices and programs in the classroom
1 5 8 Implementations of weekly PLCs to review student data, identify effective interventions and collaborate on best practicestrategies
3 1 1 Support will be given to new staff members through the use of the district mentor program3 1 4 Training will be provided as needed to build skills in the use of MAP, Edmentum, MyON, Eduphoria and TEAMS3 1 8 Opportunities will be provided for staff to attend off-site professional development - Solution Tree -Lead4ward -ESC 63 1 12 Training with Melissa Leach Literacy to improve reading instruction will be offered in the district
Meador ElementaryGenerated by Plan4Learning.com 40 of 44
Campus #170-904-107February 4, 2020 3:02 pm
18-19 AAR Page 312
Title I Schoolwide Elements
ELEMENT 1. SWP COMPREHENSIVE NEEDS ASSESSMENT (CNA)
ELEMENT 2. SWP CAMPUS IMPROVEMENT PLAN (CIP)
ELEMENT 3. PARENT AND FAMILY ENGAGEMENT (PFE)
Meador ElementaryGenerated by Plan4Learning.com 41 of 44
Campus #170-904-107February 4, 2020 3:02 pm
18-19 AAR Page 313
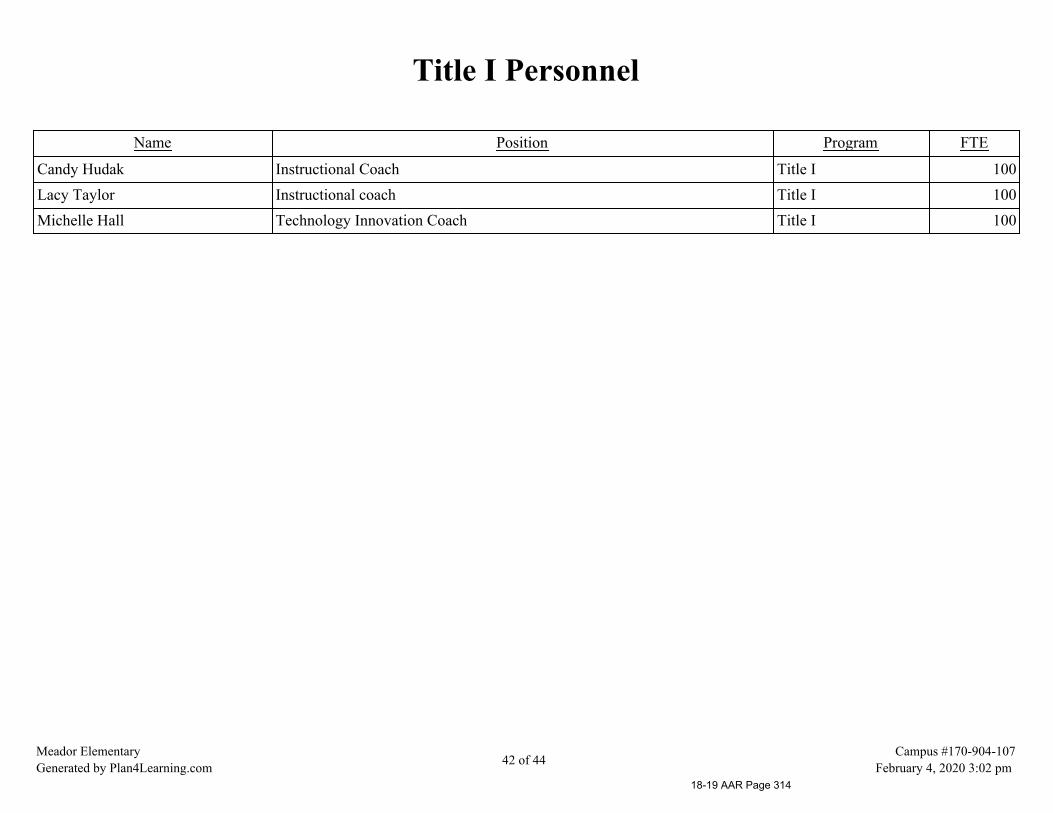
Title I Personnel
Name Position Program FTE
Candy Hudak Instructional Coach Title I 100Lacy Taylor Instructional coach Title I 100Michelle Hall Technology Innovation Coach Title I 100
Meador ElementaryGenerated by Plan4Learning.com 42 of 44
Campus #170-904-107February 4, 2020 3:02 pm
18-19 AAR Page 314
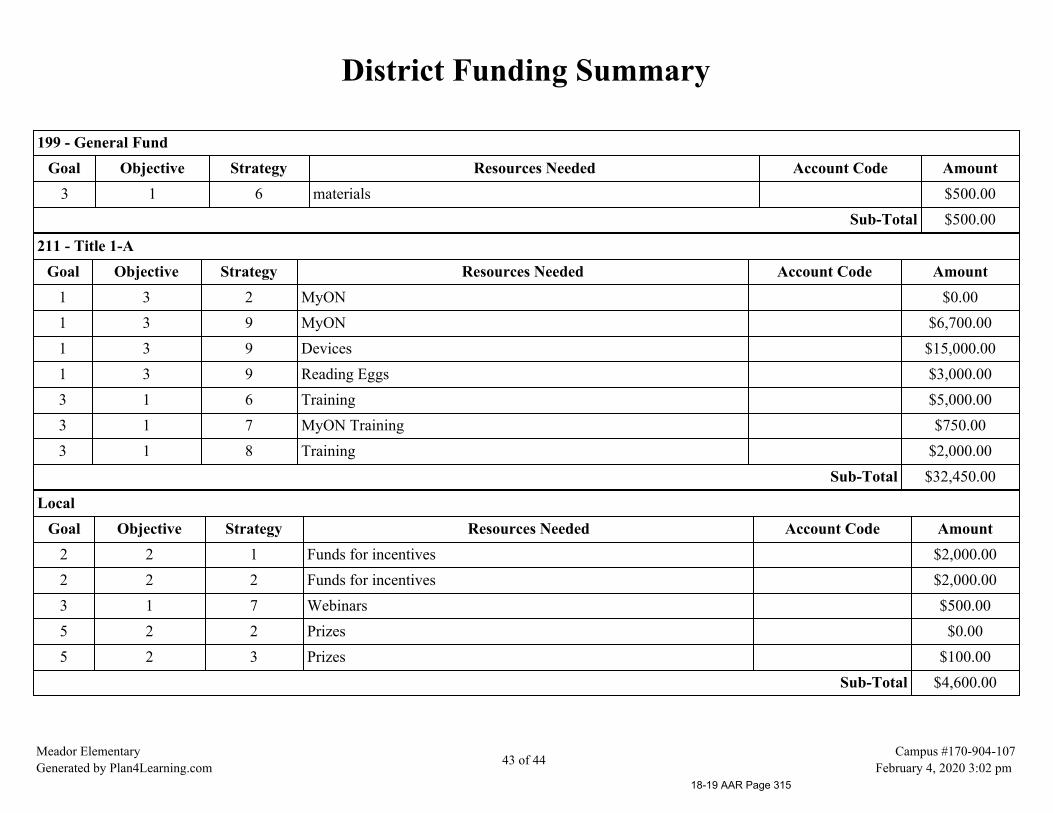
District Funding Summary
199 - General FundGoal Objective Strategy Resources Needed Account Code Amount
3 1 6 materials $500.00Sub-Total $500.00
211 - Title 1-AGoal Objective Strategy Resources Needed Account Code Amount
1 3 2 MyON $0.001 3 9 MyON $6,700.001 3 9 Devices $15,000.001 3 9 Reading Eggs $3,000.003 1 6 Training $5,000.003 1 7 MyON Training $750.003 1 8 Training $2,000.00
Sub-Total $32,450.00
LocalGoal Objective Strategy Resources Needed Account Code Amount
2 2 1 Funds for incentives $2,000.002 2 2 Funds for incentives $2,000.003 1 7 Webinars $500.005 2 2 Prizes $0.005 2 3 Prizes $100.00
Sub-Total $4,600.00
Meador ElementaryGenerated by Plan4Learning.com 43 of 44
Campus #170-904-107February 4, 2020 3:02 pm
18-19 AAR Page 315
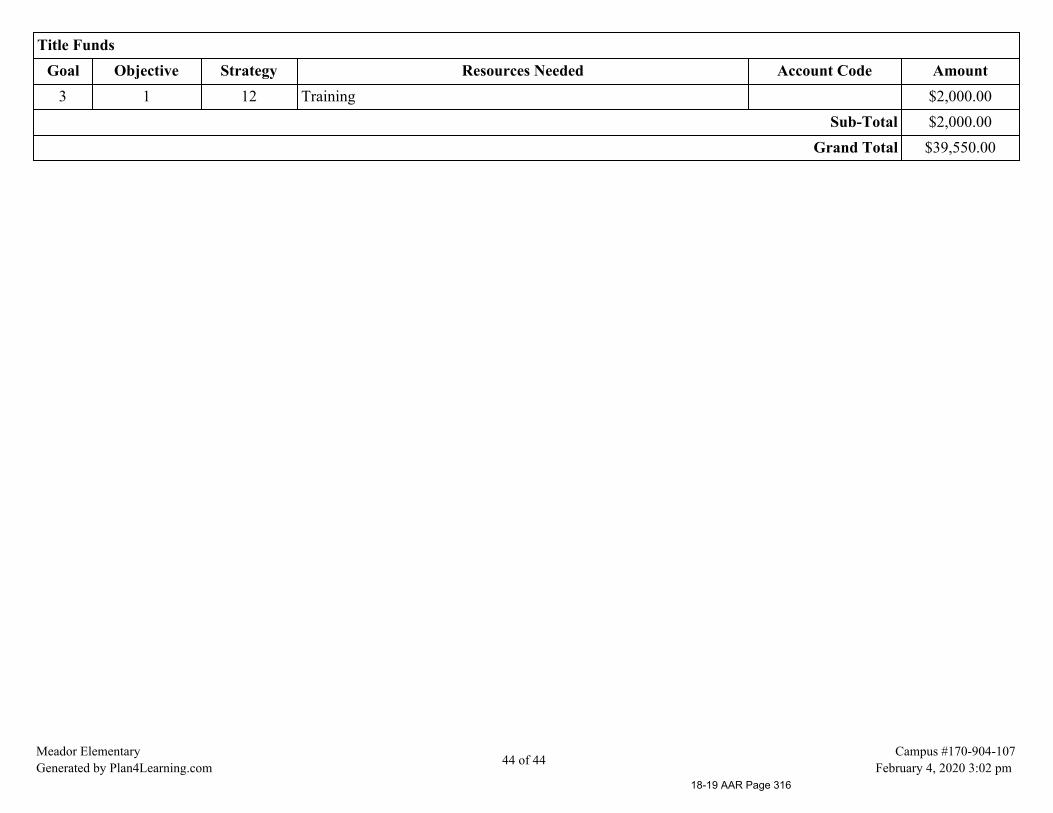
Title FundsGoal Objective Strategy Resources Needed Account Code Amount
3 1 12 Training $2,000.00Sub-Total $2,000.00
Grand Total $39,550.00
Meador ElementaryGenerated by Plan4Learning.com 44 of 44
Campus #170-904-107February 4, 2020 3:02 pm
18-19 AAR Page 316

2018-19 Texas Academic Performance Report2018-19 Texas Academic Performance Report
District Name: WILLIS ISD
District Number: 170904
2019 Accountability Rating: B
2019 Special Education Determination Status:
Needs Assistance
18-19 AAR Page 317

This page is intentionally blank.
18-19 AAR Page 318
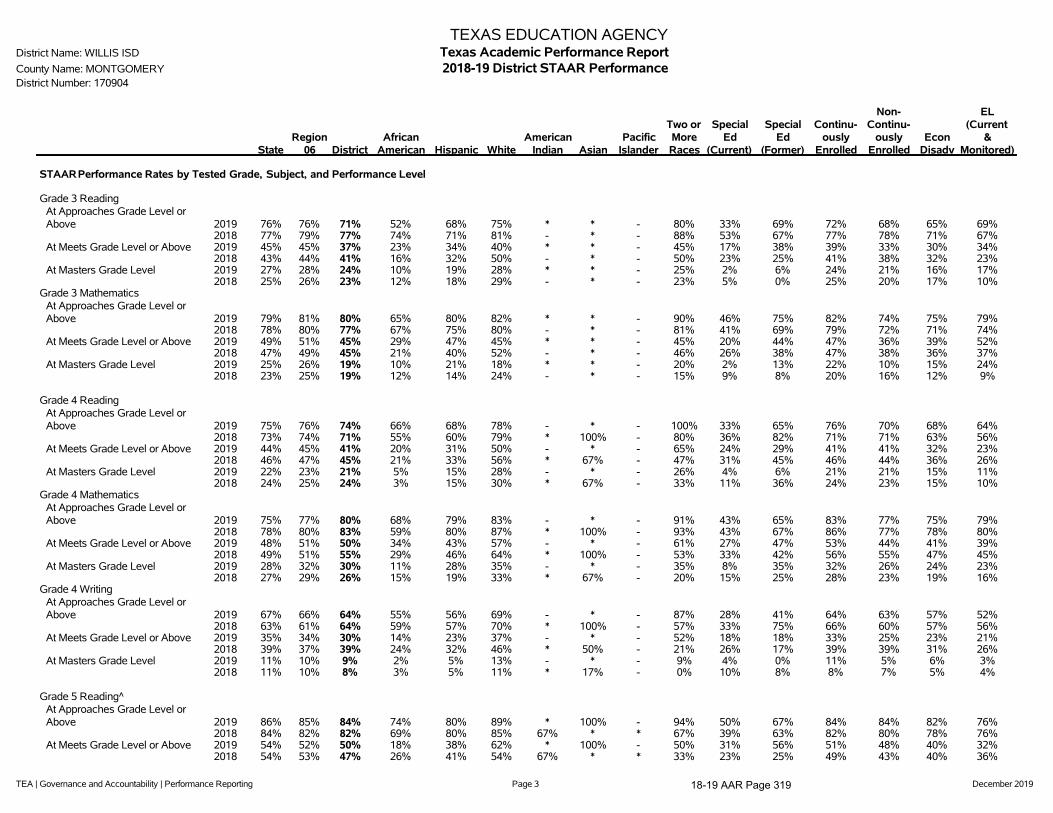
TEA | Governance and Accountability | Performance Reporting Page 3 December 2019
TEXAS EDUCATION AGENCYDistrict Name: WILLIS ISD Texas Academic Performance ReportCounty Name: MONTGOMERY 2018-19 District STAAR PerformanceDistrict Number: 170904
StateRegion
06 DistrictAfrican
American Hispanic WhiteAmerican
Indian AsianPacific
Islander
Two orMoreRaces
SpecialEd
(Current)
SpecialEd
(Former)
Continu-ously
Enrolled
Non-Continu-
ouslyEnrolled
EconDisadv
EL(Current
&Monitored)
STAARPerformance Rates by Tested Grade, Subject, and Performance Level
Grade 3 ReadingAt Approaches Grade Level orAbove 2019 76% 76% 71% 52% 68% 75% * * - 80% 33% 69% 72% 68% 65% 69%
2018 77% 79% 77% 74% 71% 81% - * - 88% 53% 67% 77% 78% 71% 67%At Meets Grade Level or Above 2019 45% 45% 37% 23% 34% 40% * * - 45% 17% 38% 39% 33% 30% 34%
2018 43% 44% 41% 16% 32% 50% - * - 50% 23% 25% 41% 38% 32% 23%At Masters Grade Level 2019 27% 28% 24% 10% 19% 28% * * - 25% 2% 6% 24% 21% 16% 17%
2018 25% 26% 23% 12% 18% 29% - * - 23% 5% 0% 25% 20% 17% 10%Grade 3 Mathematics
At Approaches Grade Level orAbove 2019 79% 81% 80% 65% 80% 82% * * - 90% 46% 75% 82% 74% 75% 79%
2018 78% 80% 77% 67% 75% 80% - * - 81% 41% 69% 79% 72% 71% 74%At Meets Grade Level or Above 2019 49% 51% 45% 29% 47% 45% * * - 45% 20% 44% 47% 36% 39% 52%
2018 47% 49% 45% 21% 40% 52% - * - 46% 26% 38% 47% 38% 36% 37%At Masters Grade Level 2019 25% 26% 19% 10% 21% 18% * * - 20% 2% 13% 22% 10% 15% 24%
2018 23% 25% 19% 12% 14% 24% - * - 15% 9% 8% 20% 16% 12% 9%
Grade 4 ReadingAt Approaches Grade Level orAbove 2019 75% 76% 74% 66% 68% 78% - * - 100% 33% 65% 76% 70% 68% 64%
2018 73% 74% 71% 55% 60% 79% * 100% - 80% 36% 82% 71% 71% 63% 56%At Meets Grade Level or Above 2019 44% 45% 41% 20% 31% 50% - * - 65% 24% 29% 41% 41% 32% 23%
2018 46% 47% 45% 21% 33% 56% * 67% - 47% 31% 45% 46% 44% 36% 26%At Masters Grade Level 2019 22% 23% 21% 5% 15% 28% - * - 26% 4% 6% 21% 21% 15% 11%
2018 24% 25% 24% 3% 15% 30% * 67% - 33% 11% 36% 24% 23% 15% 10%Grade 4 Mathematics
At Approaches Grade Level orAbove 2019 75% 77% 80% 68% 79% 83% - * - 91% 43% 65% 83% 77% 75% 79%
2018 78% 80% 83% 59% 80% 87% * 100% - 93% 43% 67% 86% 77% 78% 80%At Meets Grade Level or Above 2019 48% 51% 50% 34% 43% 57% - * - 61% 27% 47% 53% 44% 41% 39%
2018 49% 51% 55% 29% 46% 64% * 100% - 53% 33% 42% 56% 55% 47% 45%At Masters Grade Level 2019 28% 32% 30% 11% 28% 35% - * - 35% 8% 35% 32% 26% 24% 23%
2018 27% 29% 26% 15% 19% 33% * 67% - 20% 15% 25% 28% 23% 19% 16%Grade 4 Writing
At Approaches Grade Level orAbove 2019 67% 66% 64% 55% 56% 69% - * - 87% 28% 41% 64% 63% 57% 52%
2018 63% 61% 64% 59% 57% 70% * 100% - 57% 33% 75% 66% 60% 57% 56%At Meets Grade Level or Above 2019 35% 34% 30% 14% 23% 37% - * - 52% 18% 18% 33% 25% 23% 21%
2018 39% 37% 39% 24% 32% 46% * 50% - 21% 26% 17% 39% 39% 31% 26%At Masters Grade Level 2019 11% 10% 9% 2% 5% 13% - * - 9% 4% 0% 11% 5% 6% 3%
2018 11% 10% 8% 3% 5% 11% * 17% - 0% 10% 8% 8% 7% 5% 4%
Grade 5 Reading^At Approaches Grade Level orAbove 2019 86% 85% 84% 74% 80% 89% * 100% - 94% 50% 67% 84% 84% 82% 76%
2018 84% 82% 82% 69% 80% 85% 67% * * 67% 39% 63% 82% 80% 78% 76%At Meets Grade Level or Above 2019 54% 52% 50% 18% 38% 62% * 100% - 50% 31% 56% 51% 48% 40% 32%
2018 54% 53% 47% 26% 41% 54% 67% * * 33% 23% 25% 49% 43% 40% 36%
18-19 AAR Page 319

TEA | Governance and Accountability | Performance Reporting Page 4 December 2019
TEXAS EDUCATION AGENCYDistrict Name: WILLIS ISD Texas Academic Performance ReportCounty Name: MONTGOMERY 2018-19 District STAAR PerformanceDistrict Number: 170904
StateRegion
06 DistrictAfrican
American Hispanic WhiteAmerican
Indian AsianPacific
Islander
Two orMoreRaces
SpecialEd
(Current)
SpecialEd
(Former)
Continu-ously
Enrolled
Non-Continu-
ouslyEnrolled
EconDisadv
EL(Current
&Monitored)
At Masters Grade Level 2019 29% 29% 25% 6% 16% 31% * 80% - 31% 10% 22% 25% 24% 14% 9%2018 26% 26% 20% 5% 19% 24% 17% * * 0% 0% 25% 21% 18% 16% 16%
Grade 5 Mathematics^At Approaches Grade Level orAbove 2019 90% 88% 93% 88% 91% 96% * 100% - 100% 67% 78% 95% 90% 93% 91%
2018 91% 89% 92% 90% 91% 94% 83% * * 100% 64% 100% 93% 91% 90% 91%At Meets Grade Level or Above 2019 58% 56% 66% 56% 56% 76% * 100% - 50% 42% 56% 70% 60% 58% 59%
2018 58% 56% 64% 37% 63% 69% 67% * * 44% 33% 38% 66% 59% 57% 58%At Masters Grade Level 2019 36% 35% 44% 32% 35% 52% * 100% - 31% 19% 56% 46% 41% 33% 31%
2018 30% 30% 32% 15% 28% 36% 50% * * 33% 7% 25% 34% 28% 26% 25%Grade 5 Science
At Approaches Grade Level orAbove 2019 75% 76% 72% 50% 61% 81% * 100% - 75% 35% 67% 71% 72% 67% 54%
2018 76% 76% 72% 43% 63% 82% 67% * * 67% 53% 75% 72% 71% 65% 57%At Meets Grade Level or Above 2019 49% 52% 43% 18% 30% 54% * 100% - 38% 27% 56% 43% 43% 35% 27%
2018 41% 42% 33% 10% 25% 41% 33% * * 33% 29% 38% 34% 32% 26% 18%At Masters Grade Level 2019 24% 27% 18% 3% 12% 23% * 100% - 6% 10% 33% 18% 18% 10% 11%
2018 17% 18% 12% 5% 10% 15% 17% * * 0% 7% 0% 11% 14% 8% 8%
Grade 6 ReadingAt Approaches Grade Level orAbove 2019 68% 68% 61% 40% 58% 66% 60% * * 50% 21% 50% 61% 59% 52% 50%
2018 69% 70% 64% 68% 56% 68% * * - 58% 44% 57% 64% 63% 58% 50%At Meets Grade Level or Above 2019 37% 39% 30% 9% 24% 37% 20% * * 29% 17% 20% 28% 33% 24% 16%
2018 39% 40% 32% 32% 22% 38% * * - 32% 32% 14% 32% 31% 24% 14%At Masters Grade Level 2019 18% 19% 11% 7% 10% 12% 0% * * 21% 0% 20% 11% 13% 10% 5%
2018 19% 20% 15% 16% 10% 18% * * - 0% 17% 0% 14% 16% 12% 7%Grade 6 Mathematics
At Approaches Grade Level orAbove 2019 81% 83% 78% 67% 78% 80% 40% * * 79% 36% 70% 79% 76% 72% 75%
2018 77% 80% 80% 84% 75% 83% * * - 85% 54% 100% 81% 78% 75% 74%At Meets Grade Level or Above 2019 47% 51% 46% 18% 44% 52% 40% * * 43% 21% 40% 49% 42% 38% 36%
2018 44% 49% 45% 47% 33% 54% * * - 40% 25% 63% 46% 43% 38% 28%At Masters Grade Level 2019 21% 26% 17% 2% 14% 21% 0% * * 21% 8% 10% 17% 17% 10% 8%
2018 18% 23% 16% 13% 11% 20% * * - 10% 6% 0% 16% 15% 10% 8%
Grade 7 ReadingAt Approaches Grade Level orAbove 2019 76% 76% 73% 64% 71% 75% * * - 75% 38% 83% 76% 66% 66% 60%
2018 74% 75% 71% 42% 70% 75% * 100% - 59% 37% 40% 69% 74% 65% 66%At Meets Grade Level or Above 2019 49% 50% 40% 39% 30% 48% * * - 30% 25% 33% 43% 35% 30% 20%
2018 48% 49% 43% 16% 40% 48% * 71% - 41% 26% 30% 41% 46% 35% 38%At Masters Grade Level 2019 29% 31% 23% 21% 13% 30% * * - 10% 15% 8% 23% 22% 16% 9%
2018 29% 30% 21% 8% 17% 25% * 29% - 29% 13% 0% 19% 26% 15% 11%Grade 7 Mathematics
At Approaches Grade Level orAbove 2019 75% 73% 69% 63% 68% 72% * * - 73% 38% 90% 71% 66% 65% 64%
2018 72% 71% 67% 52% 67% 70% * * - 63% 31% 44% 68% 66% 65% 69%At Meets Grade Level or Above 2019 43% 39% 27% 22% 23% 31% * * - 33% 21% 60% 29% 25% 22% 22%
2018 40% 37% 30% 28% 30% 31% * * - 19% 21% 11% 28% 33% 27% 32%At Masters Grade Level 2019 17% 12% 4% 7% 4% 5% * * - 0% 11% 10% 4% 5% 3% 2%
18-19 AAR Page 320

TEA | Governance and Accountability | Performance Reporting Page 5 December 2019
TEXAS EDUCATION AGENCYDistrict Name: WILLIS ISD Texas Academic Performance ReportCounty Name: MONTGOMERY 2018-19 District STAAR PerformanceDistrict Number: 170904
StateRegion
06 DistrictAfrican
American Hispanic WhiteAmerican
Indian AsianPacific
Islander
Two orMoreRaces
SpecialEd
(Current)
SpecialEd
(Former)
Continu-ously
Enrolled
Non-Continu-
ouslyEnrolled
EconDisadv
EL(Current
&Monitored)
2018 18% 15% 7% 3% 4% 8% * * - 13% 5% 0% 5% 10% 6% 5%Grade 7 Writing
At Approaches Grade Level orAbove 2019 70% 70% 64% 56% 60% 67% * * - 65% 27% 67% 67% 57% 57% 47%
2018 69% 71% 66% 45% 66% 68% * 86% - 53% 26% 27% 66% 65% 60% 58%At Meets Grade Level or Above 2019 42% 41% 32% 26% 24% 37% * * - 30% 20% 0% 36% 23% 25% 14%
2018 43% 45% 37% 18% 31% 43% * 57% - 29% 21% 9% 37% 35% 31% 26%At Masters Grade Level 2019 18% 17% 12% 9% 8% 16% * * - 0% 12% 0% 13% 11% 8% 3%
2018 15% 16% 9% 3% 7% 11% * 14% - 18% 5% 0% 9% 9% 6% 3%
Grade 8 Reading^At Approaches Grade Level orAbove 2019 86% 86% 85% 61% 89% 86% - 100% - 65% 45% 63% 85% 84% 82% 86%
2018 86% 86% 83% 72% 82% 86% * * - 63% 40% 71% 84% 80% 80% 76%At Meets Grade Level or Above 2019 55% 57% 53% 39% 49% 59% - 71% - 47% 25% 25% 53% 54% 44% 33%
2018 49% 51% 41% 21% 36% 47% * * - 31% 19% 14% 44% 35% 34% 27%At Masters Grade Level 2019 28% 30% 25% 13% 20% 30% - 71% - 29% 5% 13% 26% 24% 19% 6%
2018 27% 28% 21% 3% 16% 28% * * - 13% 9% 14% 23% 17% 15% 11%Grade 8 Mathematics^
At Approaches Grade Level orAbove 2019 88% 89% 87% 66% 90% 90% * * - 71% 54% 78% 89% 84% 84% 89%
2018 86% 86% 85% 79% 85% 87% * 100% - 60% 38% 86% 86% 82% 80% 81%At Meets Grade Level or Above 2019 57% 62% 56% 40% 49% 64% * * - 38% 27% 33% 57% 53% 50% 40%
2018 51% 56% 49% 40% 46% 55% * 80% - 20% 27% 57% 50% 48% 42% 43%At Masters Grade Level 2019 17% 23% 15% 11% 10% 19% * * - 5% 2% 0% 12% 20% 9% 5%
2018 15% 21% 16% 2% 14% 19% * 60% - 0% 7% 14% 17% 14% 10% 11%Grade 8 Science
At Approaches Grade Level orAbove 2019 81% 83% 80% 63% 78% 85% - 100% - 65% 55% 75% 79% 82% 76% 70%
2018 76% 77% 74% 62% 69% 80% * * - 50% 36% 71% 74% 75% 69% 59%At Meets Grade Level or Above 2019 51% 55% 48% 24% 41% 57% - 71% - 35% 33% 38% 49% 48% 39% 25%
2018 52% 54% 47% 21% 38% 56% * * - 25% 20% 43% 50% 38% 38% 26%At Masters Grade Level 2019 25% 29% 22% 13% 17% 27% - 43% - 18% 10% 13% 22% 24% 15% 9%
2018 28% 31% 22% 3% 13% 31% * * - 13% 9% 14% 23% 19% 15% 10%Grade 8 Social Studies
At Approaches Grade Level orAbove 2019 69% 71% 70% 50% 70% 73% - 100% - 53% 30% 50% 71% 67% 65% 62%
2018 65% 67% 67% 51% 61% 73% * * - 56% 32% 43% 69% 62% 63% 53%At Meets Grade Level or Above 2019 37% 39% 35% 24% 29% 41% - 86% - 24% 20% 13% 36% 34% 26% 18%
2018 36% 38% 29% 16% 24% 34% * * - 31% 16% 14% 29% 29% 24% 16%At Masters Grade Level 2019 21% 23% 15% 11% 11% 17% - 43% - 18% 10% 13% 15% 14% 10% 4%
2018 21% 23% 14% 3% 10% 17% * * - 13% 9% 14% 14% 13% 10% 7%
End of Course English IAt Approaches Grade Level orAbove 2019 68% 69% 65% 58% 59% 71% * * - 67% 22% 60% 67% 62% 61% 45%
2018 65% 66% 62% 59% 55% 66% * - * 76% 22% * 64% 56% 56% 46%At Meets Grade Level or Above 2019 50% 51% 44% 30% 36% 52% * * - 52% 11% 60% 46% 42% 39% 21%
2018 44% 45% 36% 22% 26% 46% * - * 31% 10% * 39% 26% 26% 15%At Masters Grade Level 2019 11% 12% 6% 0% 3% 9% * * - 0% 1% 0% 6% 6% 3% 0%
2018 7% 8% 5% 3% 4% 6% * - * 7% 3% * 6% 4% 3% 1%
18-19 AAR Page 321

TEA | Governance and Accountability | Performance Reporting Page 6 December 2019
TEXAS EDUCATION AGENCYDistrict Name: WILLIS ISD Texas Academic Performance ReportCounty Name: MONTGOMERY 2018-19 District STAAR PerformanceDistrict Number: 170904
StateRegion
06 DistrictAfrican
American Hispanic WhiteAmerican
Indian AsianPacific
Islander
Two orMoreRaces
SpecialEd
(Current)
SpecialEd
(Former)
Continu-ously
Enrolled
Non-Continu-
ouslyEnrolled
EconDisadv
EL(Current
&Monitored)
End of Course English IIAt Approaches Grade Level orAbove 2019 68% 70% 67% 54% 60% 75% * - * 71% 29% * 70% 58% 63% 45%
2018 67% 69% 70% 69% 60% 78% * * - 72% 41% * 71% 64% 64% 45%At Meets Grade Level or Above 2019 49% 51% 45% 34% 37% 54% * - * 50% 17% * 48% 38% 39% 20%
2018 48% 50% 48% 43% 35% 59% * * - 56% 34% * 49% 46% 40% 17%At Masters Grade Level 2019 8% 8% 6% 8% 5% 8% * - * 4% 10% * 7% 5% 5% 1%
2018 8% 9% 7% 14% 3% 10% * * - 0% 17% * 7% 7% 4% 0%End of Course Algebra I
At Approaches Grade Level orAbove 2019 85% 82% 79% 70% 84% 77% * 100% - 65% 41% * 82% 72% 77% 75%
2018 83% 82% 78% 69% 73% 83% * * - 82% 33% * 82% 69% 73% 69%At Meets Grade Level or Above 2019 61% 57% 46% 32% 45% 49% * 83% - 24% 12% * 49% 39% 39% 35%
2018 55% 53% 49% 33% 42% 57% * * - 35% 13% * 54% 37% 41% 40%At Masters Grade Level 2019 37% 37% 25% 5% 22% 29% * 83% - 12% 3% * 27% 20% 17% 15%
2018 32% 33% 27% 17% 21% 34% * * - 12% 2% * 30% 21% 18% 18%End of Course Biology
At Approaches Grade Level orAbove 2019 88% 89% 90% 84% 88% 92% * * - 88% 60% * 92% 84% 87% 77%
2018 87% 87% 85% 80% 82% 88% * - * 95% 51% * 88% 79% 81% 74%At Meets Grade Level or Above 2019 62% 65% 61% 47% 57% 67% * * - 44% 22% * 64% 55% 57% 40%
2018 59% 62% 58% 48% 48% 67% * - * 55% 22% * 61% 49% 49% 36%At Masters Grade Level 2019 25% 27% 20% 5% 13% 26% * * - 31% 5% * 21% 19% 14% 3%
2018 24% 26% 18% 18% 14% 23% * - * 9% 10% * 19% 17% 13% 4%End of Course U.S. History
At Approaches Grade Level orAbove 2019 93% 93% 93% 87% 88% 97% * * - 100% 69% * 94% 90% 89% 75%
2018 92% 92% 92% 87% 85% 98% * 89% - 88% 65% - 94% 85% 88% 75%At Meets Grade Level or Above 2019 73% 78% 70% 54% 58% 84% * * - 64% 38% * 73% 61% 62% 28%
2018 70% 74% 69% 56% 60% 78% * 89% - 71% 35% - 71% 66% 62% 45%At Masters Grade Level 2019 45% 51% 41% 21% 32% 52% * * - 45% 15% * 42% 38% 33% 7%
2018 40% 46% 36% 13% 29% 44% * 56% - 35% 4% - 38% 32% 27% 14%
All Grades All SubjectsAt Approaches Grade Level orAbove 2019 78% 78% 76% 63% 73% 80% 64% 93% * 78% 40% 68% 78% 73% 71% 67%
2018 77% 77% 75% 65% 71% 80% 75% 93% 100% 73% 41% 65% 77% 72% 70% 65%At Meets Grade Level or Above 2019 50% 51% 45% 29% 39% 52% 36% 72% * 44% 23% 37% 47% 41% 38% 30%
2018 48% 49% 45% 28% 37% 52% 44% 72% 100% 39% 24% 32% 46% 41% 37% 30%At Masters Grade Level 2019 24% 25% 19% 9% 15% 24% 14% 58% * 17% 7% 14% 20% 18% 14% 10%
2018 22% 23% 18% 8% 14% 23% 17% 37% 40% 13% 8% 11% 19% 16% 13% 9%All Grades ELA/Reading
At Approaches Grade Level orAbove 2019 75% 75% 72% 58% 68% 76% 71% 95% * 76% 33% 65% 73% 69% 67% 61%
2018 74% 75% 72% 64% 66% 77% 69% 100% * 72% 38% 63% 73% 70% 66% 59%At Meets Grade Level or Above 2019 48% 49% 43% 27% 35% 50% 41% 73% * 47% 20% 34% 44% 41% 35% 25%
2018 46% 47% 41% 25% 33% 50% 44% 68% * 40% 24% 30% 43% 39% 33% 24%At Masters Grade Level 2019 21% 22% 17% 8% 12% 21% 12% 64% * 17% 6% 10% 17% 17% 12% 7%
2018 19% 21% 16% 8% 12% 21% 13% 28% * 13% 9% 12% 17% 16% 12% 8%
18-19 AAR Page 322
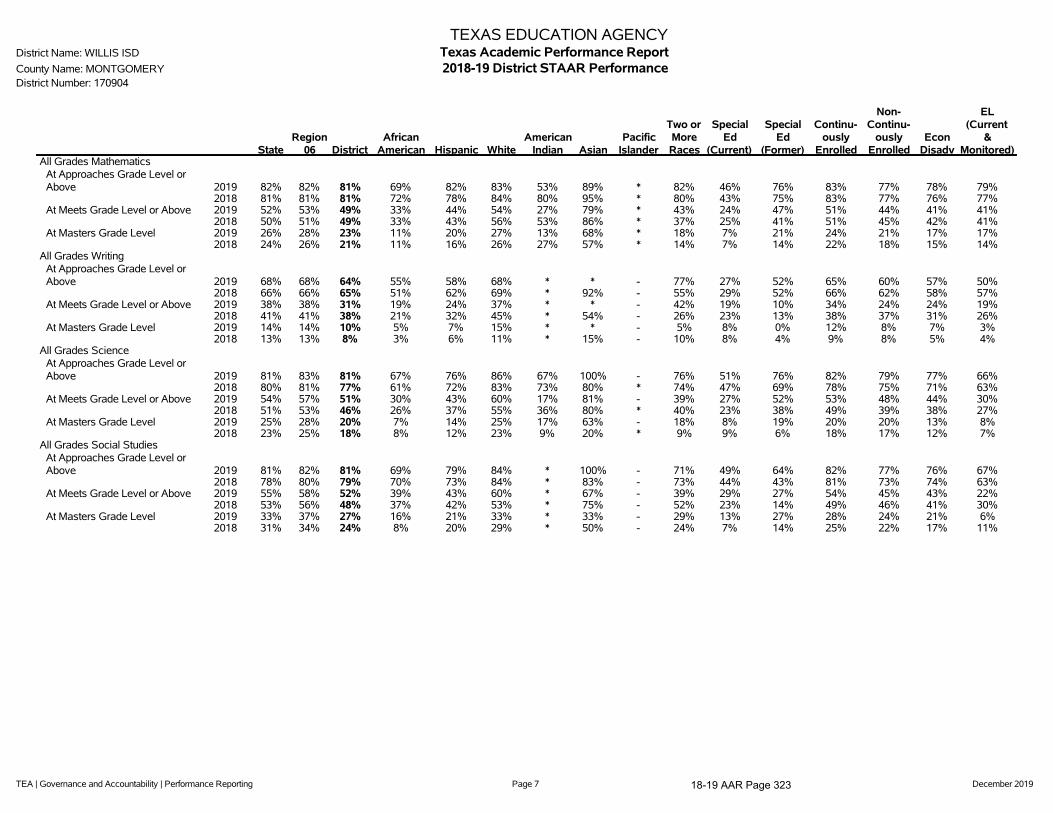
TEA | Governance and Accountability | Performance Reporting Page 7 December 2019
TEXAS EDUCATION AGENCYDistrict Name: WILLIS ISD Texas Academic Performance ReportCounty Name: MONTGOMERY 2018-19 District STAAR PerformanceDistrict Number: 170904
StateRegion
06 DistrictAfrican
American Hispanic WhiteAmerican
Indian AsianPacific
Islander
Two orMoreRaces
SpecialEd
(Current)
SpecialEd
(Former)
Continu-ously
Enrolled
Non-Continu-
ouslyEnrolled
EconDisadv
EL(Current
&Monitored)
All Grades MathematicsAt Approaches Grade Level orAbove 2019 82% 82% 81% 69% 82% 83% 53% 89% * 82% 46% 76% 83% 77% 78% 79%
2018 81% 81% 81% 72% 78% 84% 80% 95% * 80% 43% 75% 83% 77% 76% 77%At Meets Grade Level or Above 2019 52% 53% 49% 33% 44% 54% 27% 79% * 43% 24% 47% 51% 44% 41% 41%
2018 50% 51% 49% 33% 43% 56% 53% 86% * 37% 25% 41% 51% 45% 42% 41%At Masters Grade Level 2019 26% 28% 23% 11% 20% 27% 13% 68% * 18% 7% 21% 24% 21% 17% 17%
2018 24% 26% 21% 11% 16% 26% 27% 57% * 14% 7% 14% 22% 18% 15% 14%All Grades Writing
At Approaches Grade Level orAbove 2019 68% 68% 64% 55% 58% 68% * * - 77% 27% 52% 65% 60% 57% 50%
2018 66% 66% 65% 51% 62% 69% * 92% - 55% 29% 52% 66% 62% 58% 57%At Meets Grade Level or Above 2019 38% 38% 31% 19% 24% 37% * * - 42% 19% 10% 34% 24% 24% 19%
2018 41% 41% 38% 21% 32% 45% * 54% - 26% 23% 13% 38% 37% 31% 26%At Masters Grade Level 2019 14% 14% 10% 5% 7% 15% * * - 5% 8% 0% 12% 8% 7% 3%
2018 13% 13% 8% 3% 6% 11% * 15% - 10% 8% 4% 9% 8% 5% 4%All Grades Science
At Approaches Grade Level orAbove 2019 81% 83% 81% 67% 76% 86% 67% 100% - 76% 51% 76% 82% 79% 77% 66%
2018 80% 81% 77% 61% 72% 83% 73% 80% * 74% 47% 69% 78% 75% 71% 63%At Meets Grade Level or Above 2019 54% 57% 51% 30% 43% 60% 17% 81% - 39% 27% 52% 53% 48% 44% 30%
2018 51% 53% 46% 26% 37% 55% 36% 80% * 40% 23% 38% 49% 39% 38% 27%At Masters Grade Level 2019 25% 28% 20% 7% 14% 25% 17% 63% - 18% 8% 19% 20% 20% 13% 8%
2018 23% 25% 18% 8% 12% 23% 9% 20% * 9% 9% 6% 18% 17% 12% 7%All Grades Social Studies
At Approaches Grade Level orAbove 2019 81% 82% 81% 69% 79% 84% * 100% - 71% 49% 64% 82% 77% 76% 67%
2018 78% 80% 79% 70% 73% 84% * 83% - 73% 44% 43% 81% 73% 74% 63%At Meets Grade Level or Above 2019 55% 58% 52% 39% 43% 60% * 67% - 39% 29% 27% 54% 45% 43% 22%
2018 53% 56% 48% 37% 42% 53% * 75% - 52% 23% 14% 49% 46% 41% 30%At Masters Grade Level 2019 33% 37% 27% 16% 21% 33% * 33% - 29% 13% 27% 28% 24% 21% 6%
2018 31% 34% 24% 8% 20% 29% * 50% - 24% 7% 14% 25% 22% 17% 11%
18-19 AAR Page 323

TEA | Governance and Accountability | Performance Reporting Page 8 December 2019
TEXAS EDUCATION AGENCYDistrict Name: WILLIS ISD Texas Academic Performance ReportCounty Name: MONTGOMERY 2018-19 District ProgressDistrict Number: 170904
State Region 06 DistrictAfrican
American Hispanic WhiteAmerican
Indian AsianPacific
Islander
Two orMore
Races
SpecialEd
(Current)
SpecialEd
(Former)
Continu-ously
Enrolled
Non-Continu-
ouslyEnrolled
EconDisadv
EL(Current
&Monitored)
School Progress Domain - Academic Growth Score by Grade and Subject
Grade 4 ELA/Reading 2019 61 62 59 49 59 61 - * - 59 50 65 61 56 59 592018 63 64 67 55 65 69 * 83 - 83 79 77 69 64 66 64
Grade 4 Mathematics 2019 65 68 71 70 72 69 - * - 77 55 56 71 70 70 722018 65 66 70 67 69 70 * 100 - 83 78 50 71 68 69 69
Grade 5 ELA/Reading 2019 81 78 80 85 81 81 * 80 - 61 84 67 80 81 78 802018 80 76 79 81 81 79 80 * * 50 67 79 81 74 80 83
Grade 5 Mathematics 2019 83 79 87 91 83 90 * 100 - 68 84 67 85 90 85 782018 81 78 80 77 79 81 70 * * 94 83 86 78 85 81 77
Grade 6 ELA/Reading 2019 42 45 34 22 31 37 30 * * 38 29 56 32 36 33 272018 47 47 38 45 36 41 * * - 21 36 36 38 38 37 32
Grade 6 Mathematics 2019 54 61 43 44 37 48 20 * * 38 35 38 43 43 38 332018 56 61 55 68 45 59 * * - 55 48 44 52 60 51 40
Grade 7 ELA/Reading 2019 77 77 75 70 75 74 * * - 84 66 67 75 73 73 732018 76 73 70 57 75 68 * 79 - 74 58 40 69 71 68 76
Grade 7 Mathematics 2019 63 59 56 50 58 55 - * - 61 49 75 56 57 54 562018 67 65 61 57 59 63 * * - 63 59 39 63 57 61 67
Grade 8 ELA/Reading 2019 77 78 77 77 80 76 - 93 - 69 72 69 78 76 76 742018 79 79 84 88 83 85 * * - 90 78 100 84 85 85 84
Grade 8 Mathematics 2019 84 84 79 75 81 78 * 100 - 69 66 80 77 83 76 842018 81 80 78 70 78 78 * 90 - 93 67 100 77 81 76 77
End of Course English II 2019 69 69 70 70 70 71 * - * 68 71 * 69 72 71 672018 67 67 70 62 67 73 * * - 70 62 * 70 71 65 55
End of Course Algebra I 2019 75 71 62 51 65 63 * 92 - 54 31 * 64 57 58 572018 72 69 70 61 69 71 * * - 64 31 * 72 63 66 65
All Grades Both Subjects 2019 69 69 66 61 66 67 43 86 * 64 57 65 66 66 64 632018 69 69 69 67 67 70 74 81 * 68 62 63 69 68 67 66
All Grades ELA/Reading 2019 68 68 66 60 66 67 55 81 * 64 60 66 66 65 65 622018 69 68 68 66 68 69 71 74 * 64 63 66 69 67 67 66
All Grades Mathematics 2019 70 70 66 62 66 67 33 91 * 63 53 63 66 67 64 632018 70 70 69 68 67 71 77 89 * 73 61 59 69 70 68 66
18-19 AAR Page 324

TEA | Governance and Accountability | Performance Reporting Page 9 December 2019
TEXAS EDUCATION AGENCYDistrict Name: WILLIS ISD Texas Academic Performance ReportCounty Name: MONTGOMERY 2018-19 District Prior Year and Student Success InitiativeDistrict Number: 170904
State Region 06 DistrictAfrican
American Hispanic WhiteAmerican
Indian AsianPacific
Islander
Two orMore
RacesSpecial
EdEcon
DisadvEL
(Current)
Progress of Prior-Year Non-Proficient Students
Sum of Grades 4-8
Reading 2019 41% 38% 39% 28% 43% 37% * * - 37% 15% 37% 37%2018 38% 37% 37% 31% 35% 41% * - - * 14% 34% 30%
Mathematics 2019 45% 43% 48% 42% 49% 48% * * - 44% 23% 45% 42%2018 47% 44% 48% 50% 48% 48% * * - 48% 22% 46% 48%
Student Success Initiative
Grade 5 ReadingStudents Meeting Approaches Grade Level on First STAARAdministration
2019 78% 77% 76% 58% 71% 82% * 100% - 75% 24% 70% 54%Students Requiring Accelerated Instruction
2019 22% 23% 24% 42% 29% 18% 100% 0% - 25% 76% 30% 46%STAARCumulativeMet Standard
2019 86% 85% 84% 73% 79% 89% * 100% - 94% 37% 81% 66%STAARNon-Proficient Students Promoted by Grade Placement Committee
2018 97% 98% 100% 100% 100% 100% - - - * 100% 100% 100%STAARMet Standard (Non-Proficient in Previous Year)
Promoted to Grade 6 2019 9% 10% 2% 0% 3% 3% - - - * 0% 2% 4%
Grade 5 MathematicsStudents Meeting Approaches Grade Level on First STAARAdministration
2019 83% 82% 87% 73% 81% 92% * 100% - 94% 47% 84% 74%Students Requiring Accelerated Instruction
2019 17% 18% 13% 27% 19% 8% 50% 0% - 6% 53% 16% 26%STAARCumulativeMet Standard
2019 90% 88% 93% 88% 91% 95% * 100% - 100% 58% 93% 87%STAARNon-Proficient Students Promoted by Grade Placement Committee
2018 97% 98% 100% * 100% 100% * - - * 100% 100% 100%STAARMet Standard (Non-Proficient in Previous Year)
Promoted to Grade 6 2019 24% 27% 9% * 7% 13% * - - * 0% 7% 11%
Grade 8 ReadingStudents Meeting Approaches Grade Level on First STAARAdministration
2019 78% 79% 76% 53% 78% 79% - 71% - 53% 21% 72% 56%Students Requiring Accelerated Instruction
2019 22% 21% 24% 47% 22% 21% - 29% - 47% 79% 28% 44%STAARCumulativeMet Standard
2019 85% 86% 84% 61% 89% 85% - 100% - 60% 33% 81% 77%STAARNon-Proficient Students Promoted by Grade Placement Committee
2018 99% 99% 100% 100% 100% 100% - - - 100% 100% 100% 100%STAARMet Standard (Non-Proficient in Previous Year)
Promoted to Grade 9 2019 13% 13% 12% 25% 7% 12% - - - * 0% 13% 5%
Grade 8 MathematicsStudents Meeting Approaches Grade Level on First STAARAdministration
2019 82% 84% 83% 63% 83% 86% * * - 74% 41% 80% 74%Students Requiring Accelerated Instruction
2019 18% 16% 17% 37% 17% 14% * * - 26% 59% 20% 26%
18-19 AAR Page 325

TEA | Governance and Accountability | Performance Reporting Page 10 December 2019
TEXAS EDUCATION AGENCYDistrict Name: WILLIS ISD Texas Academic Performance ReportCounty Name: MONTGOMERY 2018-19 District Prior Year and Student Success InitiativeDistrict Number: 170904
State Region 06 DistrictAfrican
American Hispanic WhiteAmerican
Indian AsianPacific
Islander
Two orMore
RacesSpecial
EdEcon
DisadvEL
(Current)STAARCumulativeMet Standard
2019 88% 89% 88% 66% 90% 90% * * - 74% 47% 83% 81%STAARNon-Proficient Students Promoted by Grade Placement Committee
2018 98% 99% 100% 100% 100% 100% - - - * 100% 100% 100%STAARMet Standard (Non-Proficient in Previous Year)
Promoted to Grade 9 2019 50% 40% 43% 38% 48% 38% - - - * 35% 50% 33%
18-19 AAR Page 326
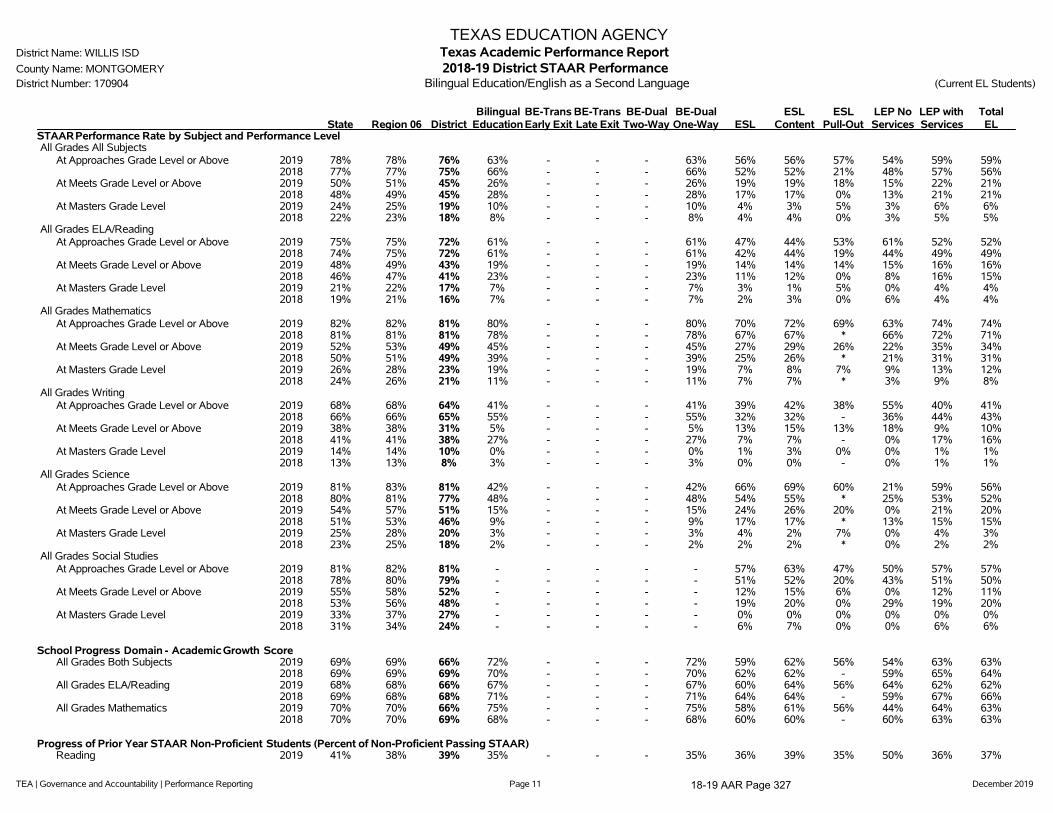
TEA | Governance and Accountability | Performance Reporting Page 11 December 2019
TEXAS EDUCATION AGENCYDistrict Name: WILLIS ISD Texas Academic Performance ReportCounty Name: MONTGOMERY 2018-19 District STAAR PerformanceDistrict Number: 170904 Bilingual Education/English as a Second Language (Current EL Students)
State Region 06 DistrictBilingual
EducationBE-TransEarly Exit
BE-TransLate Exit
BE-DualTwo-Way
BE-DualOne-Way ESL
ESLContent
ESLPull-Out
LEP NoServices
LEP withServices
TotalEL
STAARPerformance Rate by Subject and Performance LevelAll Grades All Subjects
At Approaches Grade Level or Above 2019 78% 78% 76% 63% - - - 63% 56% 56% 57% 54% 59% 59%2018 77% 77% 75% 66% - - - 66% 52% 52% 21% 48% 57% 56%
At Meets Grade Level or Above 2019 50% 51% 45% 26% - - - 26% 19% 19% 18% 15% 22% 21%2018 48% 49% 45% 28% - - - 28% 17% 17% 0% 13% 21% 21%
At Masters Grade Level 2019 24% 25% 19% 10% - - - 10% 4% 3% 5% 3% 6% 6%2018 22% 23% 18% 8% - - - 8% 4% 4% 0% 3% 5% 5%
All Grades ELA/ReadingAt Approaches Grade Level or Above 2019 75% 75% 72% 61% - - - 61% 47% 44% 53% 61% 52% 52%
2018 74% 75% 72% 61% - - - 61% 42% 44% 19% 44% 49% 49%At Meets Grade Level or Above 2019 48% 49% 43% 19% - - - 19% 14% 14% 14% 15% 16% 16%
2018 46% 47% 41% 23% - - - 23% 11% 12% 0% 8% 16% 15%At Masters Grade Level 2019 21% 22% 17% 7% - - - 7% 3% 1% 5% 0% 4% 4%
2018 19% 21% 16% 7% - - - 7% 2% 3% 0% 6% 4% 4%All Grades Mathematics
At Approaches Grade Level or Above 2019 82% 82% 81% 80% - - - 80% 70% 72% 69% 63% 74% 74%2018 81% 81% 81% 78% - - - 78% 67% 67% * 66% 72% 71%
At Meets Grade Level or Above 2019 52% 53% 49% 45% - - - 45% 27% 29% 26% 22% 35% 34%2018 50% 51% 49% 39% - - - 39% 25% 26% * 21% 31% 31%
At Masters Grade Level 2019 26% 28% 23% 19% - - - 19% 7% 8% 7% 9% 13% 12%2018 24% 26% 21% 11% - - - 11% 7% 7% * 3% 9% 8%
All Grades WritingAt Approaches Grade Level or Above 2019 68% 68% 64% 41% - - - 41% 39% 42% 38% 55% 40% 41%
2018 66% 66% 65% 55% - - - 55% 32% 32% - 36% 44% 43%At Meets Grade Level or Above 2019 38% 38% 31% 5% - - - 5% 13% 15% 13% 18% 9% 10%
2018 41% 41% 38% 27% - - - 27% 7% 7% - 0% 17% 16%At Masters Grade Level 2019 14% 14% 10% 0% - - - 0% 1% 3% 0% 0% 1% 1%
2018 13% 13% 8% 3% - - - 3% 0% 0% - 0% 1% 1%All Grades Science
At Approaches Grade Level or Above 2019 81% 83% 81% 42% - - - 42% 66% 69% 60% 21% 59% 56%2018 80% 81% 77% 48% - - - 48% 54% 55% * 25% 53% 52%
At Meets Grade Level or Above 2019 54% 57% 51% 15% - - - 15% 24% 26% 20% 0% 21% 20%2018 51% 53% 46% 9% - - - 9% 17% 17% * 13% 15% 15%
At Masters Grade Level 2019 25% 28% 20% 3% - - - 3% 4% 2% 7% 0% 4% 3%2018 23% 25% 18% 2% - - - 2% 2% 2% * 0% 2% 2%
All Grades Social StudiesAt Approaches Grade Level or Above 2019 81% 82% 81% - - - - - 57% 63% 47% 50% 57% 57%
2018 78% 80% 79% - - - - - 51% 52% 20% 43% 51% 50%At Meets Grade Level or Above 2019 55% 58% 52% - - - - - 12% 15% 6% 0% 12% 11%
2018 53% 56% 48% - - - - - 19% 20% 0% 29% 19% 20%At Masters Grade Level 2019 33% 37% 27% - - - - - 0% 0% 0% 0% 0% 0%
2018 31% 34% 24% - - - - - 6% 7% 0% 0% 6% 6%
School Progress Domain - Academic Growth ScoreAll Grades Both Subjects 2019 69% 69% 66% 72% - - - 72% 59% 62% 56% 54% 63% 63%
2018 69% 69% 69% 70% - - - 70% 62% 62% - 59% 65% 64%All Grades ELA/Reading 2019 68% 68% 66% 67% - - - 67% 60% 64% 56% 64% 62% 62%
2018 69% 68% 68% 71% - - - 71% 64% 64% - 59% 67% 66%All Grades Mathematics 2019 70% 70% 66% 75% - - - 75% 58% 61% 56% 44% 64% 63%
2018 70% 70% 69% 68% - - - 68% 60% 60% - 60% 63% 63%
Progress of Prior Year STAAR Non-Proficient Students (Percent of Non-Proficient Passing STAAR)Reading 2019 41% 38% 39% 35% - - - 35% 36% 39% 35% 50% 36% 37%
18-19 AAR Page 327

TEA | Governance and Accountability | Performance Reporting Page 12 December 2019
TEXAS EDUCATION AGENCYDistrict Name: WILLIS ISD Texas Academic Performance ReportCounty Name: MONTGOMERY 2018-19 District STAAR PerformanceDistrict Number: 170904 Bilingual Education/English as a Second Language (Current EL Students)
State Region 06 DistrictBilingual
EducationBE-TransEarly Exit
BE-TransLate Exit
BE-DualTwo-Way
BE-DualOne-Way ESL
ESLContent
ESLPull-Out
LEP NoServices
LEP withServices
TotalEL
2018 38% 37% 37% 39% - - - 39% 28% 28% - * 32% 30%Mathematics 2019 45% 43% 48% 44% - - - 44% 40% 28% 44% 50% 41% 42%
2018 47% 44% 48% 48% - - - 48% 49% 49% - * 49% 48%
18-19 AAR Page 328

TEA | Governance and Accountability | Performance Reporting Page 13 December 2019
TEXAS EDUCATION AGENCYDistrict Name: WILLIS ISD Texas Academic Performance ReportCounty Name: MONTGOMERY 2018-19 District STAAR ParticipationDistrict Number: 170904
State Region 06 DistrictAfrican
American Hispanic WhiteAmerican
Indian AsianPacific
Islander
Two orMore
RacesSpecial
EdEcon
DisadvEL
(Current)2019 STAARParticipation
(All Grades)
All TestsAssessment Participant 99% 99% 100% 99% 100% 100% 100% 100% * 100% 100% 99% 100%
Included in Accountability 94% 94% 94% 93% 94% 94% 79% 93% * 96% 92% 93% 94%Not Included in Accountability
Mobile 4% 4% 5% 6% 4% 5% 21% 3% * 3% 7% 5% 3%Other Exclusions 1% 1% 1% 0% 1% 0% 0% 4% * 0% 1% 1% 3%
Not Tested 1% 1% 0% 1% 0% 0% 0% 0% * 0% 0% 1% 0%Absent 1% 1% 0% 1% 0% 0% 0% 0% * 0% 0% 1% 0%Other 0% 0% 0% 0% 0% 0% 0% 0% * 0% 0% 0% 0%
2018 STAARParticipation(All Grades)
All TestsAssessment Participant 99% 99% 100% 99% 100% 100% 100% 100% 100% 99% 100% 100% 100%
Included in Accountability 94% 94% 93% 88% 94% 93% 94% 96% 100% 96% 88% 93% 94%Not Included in Accountability
Mobile 4% 4% 6% 12% 5% 6% 6% 0% 0% 4% 11% 6% 3%Other Exclusions 1% 1% 0% 0% 1% 0% 0% 4% 0% 0% 1% 1% 3%
Not Tested 1% 1% 0% 1% 0% 0% 0% 0% 0% 1% 0% 0% 0%Absent 1% 1% 0% 1% 0% 0% 0% 0% 0% 1% 0% 0% 0%Other 0% 0% 0% 0% 0% 0% 0% 0% 0% 0% 0% 0% 0%
18-19 AAR Page 329

TEA | Governance and Accountability | Performance Reporting Page 14 December 2019
TEXAS EDUCATION AGENCYDistrict Name: WILLIS ISD Texas Academic Performance ReportCounty Name: MONTGOMERY 2018-19 District Attendance, Graduation, and Dropout RatesDistrict Number: 170904
State Region 06 DistrictAfrican
American Hispanic WhiteAmerican
Indian AsianPacific
Islander
Two orMore
RacesSpecial
EdEcon
DisadvEL
(Current)
Attendance Rate2017-18 95.4% 95.8% 95.0% 94.6% 95.5% 94.8% 95.1% 97.7% * 94.2% 93.7% 94.7% 96.3%2016-17 95.7% 96.0% 95.2% 95.1% 95.7% 95.0% 95.0% 97.7% 95.1% 94.4% 94.2% 95.0% 96.4%
Annual Dropout Rate (Gr 7-8)2017-18 0.4% 0.2% 0.1% 0.0% 0.0% 0.1% * 0.0% - 0.0% 0.8% 0.1% 0.0%2016-17 0.3% 0.1% 0.2% 0.0% 0.2% 0.2% 0.0% 0.0% * 0.0% 0.9% 0.3% 0.0%
Annual Dropout Rate (Gr 9-12)2017-18 1.9% 1.6% 2.9% 2.8% 3.9% 2.3% 0.0% 0.0% * 2.8% 2.1% 3.2% 6.2%2016-17 1.9% 1.3% 1.5% 2.0% 2.0% 1.1% 0.0% 0.0% * 2.7% 2.3% 2.3% 2.1%
4-Year Longitudinal Rate (Gr 9-12)Class of 2018
Graduated 90.0% 91.5% 86.4% 83.3% 81.6% 89.3% * * * 81.8% 81.8% 82.8% 66.7%Received TxCHSE 0.4% 0.9% 0.4% 2.8% 0.0% 0.4% * * * 0.0% 0.0% 0.5% 0.0%Continued HS 3.8% 2.8% 4.0% 5.6% 6.8% 2.6% * * * 0.0% 3.0% 5.0% 9.5%Dropped Out 5.7% 4.7% 9.1% 8.3% 11.6% 7.8% * * * 18.2% 15.2% 11.8% 23.8%Graduates and TxCHSE 90.4% 92.4% 86.8% 86.1% 81.6% 89.6% * * * 81.8% 81.8% 83.3% 66.7%Graduates, TxCHSE,and Continuers 94.3% 95.3% 90.9% 91.7% 88.4% 92.2% * * * 81.8% 84.8% 88.2% 76.2%
Class of 2017Graduated 89.7% 91.4% 89.3% 90.7% 81.8% 93.0% * 100.0% - 87.5% 84.4% 85.7% 75.9%Received TxCHSE 0.4% 1.1% 1.1% 0.0% 1.5% 0.8% * 0.0% - 6.3% 0.0% 1.2% 0.0%Continued HS 4.0% 3.1% 4.6% 2.3% 10.2% 2.3% * 0.0% - 0.0% 0.0% 4.5% 10.3%Dropped Out 5.9% 4.4% 5.0% 7.0% 6.6% 3.9% * 0.0% - 6.3% 15.6% 8.6% 13.8%Graduates and TxCHSE 90.1% 92.5% 90.4% 90.7% 83.2% 93.8% * 100.0% - 93.8% 84.4% 86.9% 75.9%Graduates, TxCHSE,and Continuers 94.1% 95.6% 95.0% 93.0% 93.4% 96.1% * 100.0% - 93.8% 84.4% 91.4% 86.2%
5-Year Extended Longitudinal Rate (Gr 9-12)Class of 2017
Graduated 92.0% 93.3% 92.0% 93.0% 87.0% 94.5% * 100.0% - 87.5% 84.4% 87.3% 77.4%Received TxCHSE 0.6% 1.3% 1.3% 0.0% 2.2% 0.8% * 0.0% - 6.3% 0.0% 1.6% 0.0%Continued HS 1.1% 0.6% 0.2% 0.0% 0.7% 0.0% * 0.0% - 0.0% 0.0% 0.4% 3.2%Dropped Out 6.3% 4.8% 6.5% 7.0% 10.1% 4.7% * 0.0% - 6.3% 15.6% 10.6% 19.4%Graduates and TxCHSE 92.6% 94.6% 93.3% 93.0% 89.1% 95.3% * 100.0% - 93.8% 84.4% 89.0% 77.4%Graduates, TxCHSE,and Continuers 93.7% 95.2% 93.5% 93.0% 89.9% 95.3% * 100.0% - 93.8% 84.4% 89.4% 80.6%
Class of 2016Graduated 91.6% 92.1% 93.7% 91.4% 92.2% 94.3% * * * 100.0% 96.7% 89.2% 81.5%Received TxCHSE 0.7% 1.5% 1.1% 0.0% 1.6% 1.1% * * * 0.0% 0.0% 0.9% 0.0%Continued HS 1.2% 0.8% 0.0% 0.0% 0.0% 0.0% * * * 0.0% 0.0% 0.0% 0.0%Dropped Out 6.6% 5.5% 5.2% 8.6% 6.2% 4.5% * * * 0.0% 3.3% 9.9% 18.5%Graduates and TxCHSE 92.2% 93.6% 94.8% 91.4% 93.8% 95.5% * * * 100.0% 96.7% 90.1% 81.5%Graduates, TxCHSE,and Continuers 93.4% 94.5% 94.8% 91.4% 93.8% 95.5% * * * 100.0% 96.7% 90.1% 81.5%
6-Year Extended Longitudinal Rate (Gr 9-12)Class of 2016
Graduated 92.1% 92.6% 93.9% 91.4% 93.0% 94.3% * * * 100.0% 96.7% 89.6% 81.5%
18-19 AAR Page 330
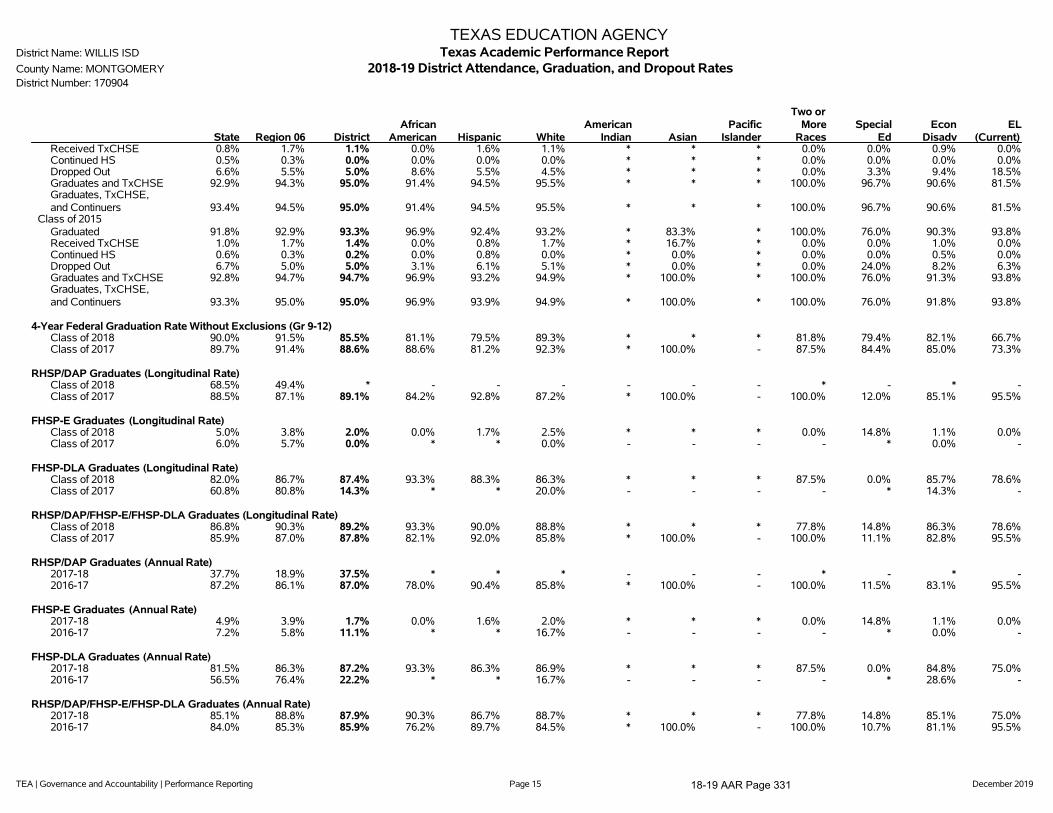
TEA | Governance and Accountability | Performance Reporting Page 15 December 2019
TEXAS EDUCATION AGENCYDistrict Name: WILLIS ISD Texas Academic Performance ReportCounty Name: MONTGOMERY 2018-19 District Attendance, Graduation, and Dropout RatesDistrict Number: 170904
State Region 06 DistrictAfrican
American Hispanic WhiteAmerican
Indian AsianPacific
Islander
Two orMore
RacesSpecial
EdEcon
DisadvEL
(Current)Received TxCHSE 0.8% 1.7% 1.1% 0.0% 1.6% 1.1% * * * 0.0% 0.0% 0.9% 0.0%Continued HS 0.5% 0.3% 0.0% 0.0% 0.0% 0.0% * * * 0.0% 0.0% 0.0% 0.0%Dropped Out 6.6% 5.5% 5.0% 8.6% 5.5% 4.5% * * * 0.0% 3.3% 9.4% 18.5%Graduates and TxCHSE 92.9% 94.3% 95.0% 91.4% 94.5% 95.5% * * * 100.0% 96.7% 90.6% 81.5%Graduates, TxCHSE,and Continuers 93.4% 94.5% 95.0% 91.4% 94.5% 95.5% * * * 100.0% 96.7% 90.6% 81.5%
Class of 2015Graduated 91.8% 92.9% 93.3% 96.9% 92.4% 93.2% * 83.3% * 100.0% 76.0% 90.3% 93.8%Received TxCHSE 1.0% 1.7% 1.4% 0.0% 0.8% 1.7% * 16.7% * 0.0% 0.0% 1.0% 0.0%Continued HS 0.6% 0.3% 0.2% 0.0% 0.8% 0.0% * 0.0% * 0.0% 0.0% 0.5% 0.0%Dropped Out 6.7% 5.0% 5.0% 3.1% 6.1% 5.1% * 0.0% * 0.0% 24.0% 8.2% 6.3%Graduates and TxCHSE 92.8% 94.7% 94.7% 96.9% 93.2% 94.9% * 100.0% * 100.0% 76.0% 91.3% 93.8%Graduates, TxCHSE,and Continuers 93.3% 95.0% 95.0% 96.9% 93.9% 94.9% * 100.0% * 100.0% 76.0% 91.8% 93.8%
4-Year Federal Graduation Rate Without Exclusions (Gr 9-12)Class of 2018 90.0% 91.5% 85.5% 81.1% 79.5% 89.3% * * * 81.8% 79.4% 82.1% 66.7%Class of 2017 89.7% 91.4% 88.6% 88.6% 81.2% 92.3% * 100.0% - 87.5% 84.4% 85.0% 73.3%
RHSP/DAP Graduates (Longitudinal Rate)Class of 2018 68.5% 49.4% * - - - - - - * - * -Class of 2017 88.5% 87.1% 89.1% 84.2% 92.8% 87.2% * 100.0% - 100.0% 12.0% 85.1% 95.5%
FHSP-E Graduates (Longitudinal Rate)Class of 2018 5.0% 3.8% 2.0% 0.0% 1.7% 2.5% * * * 0.0% 14.8% 1.1% 0.0%Class of 2017 6.0% 5.7% 0.0% * * 0.0% - - - - * 0.0% -
FHSP-DLA Graduates (Longitudinal Rate)Class of 2018 82.0% 86.7% 87.4% 93.3% 88.3% 86.3% * * * 87.5% 0.0% 85.7% 78.6%Class of 2017 60.8% 80.8% 14.3% * * 20.0% - - - - * 14.3% -
RHSP/DAP/FHSP-E/FHSP-DLA Graduates (Longitudinal Rate)Class of 2018 86.8% 90.3% 89.2% 93.3% 90.0% 88.8% * * * 77.8% 14.8% 86.3% 78.6%Class of 2017 85.9% 87.0% 87.8% 82.1% 92.0% 85.8% * 100.0% - 100.0% 11.1% 82.8% 95.5%
RHSP/DAP Graduates (Annual Rate)2017-18 37.7% 18.9% 37.5% * * * - - - * - * -2016-17 87.2% 86.1% 87.0% 78.0% 90.4% 85.8% * 100.0% - 100.0% 11.5% 83.1% 95.5%
FHSP-E Graduates (Annual Rate)2017-18 4.9% 3.9% 1.7% 0.0% 1.6% 2.0% * * * 0.0% 14.8% 1.1% 0.0%2016-17 7.2% 5.8% 11.1% * * 16.7% - - - - * 0.0% -
FHSP-DLA Graduates (Annual Rate)2017-18 81.5% 86.3% 87.2% 93.3% 86.3% 86.9% * * * 87.5% 0.0% 84.8% 75.0%2016-17 56.5% 76.4% 22.2% * * 16.7% - - - - * 28.6% -
RHSP/DAP/FHSP-E/FHSP-DLA Graduates (Annual Rate)2017-18 85.1% 88.8% 87.9% 90.3% 86.7% 88.7% * * * 77.8% 14.8% 85.1% 75.0%2016-17 84.0% 85.3% 85.9% 76.2% 89.7% 84.5% * 100.0% - 100.0% 10.7% 81.1% 95.5%
18-19 AAR Page 331
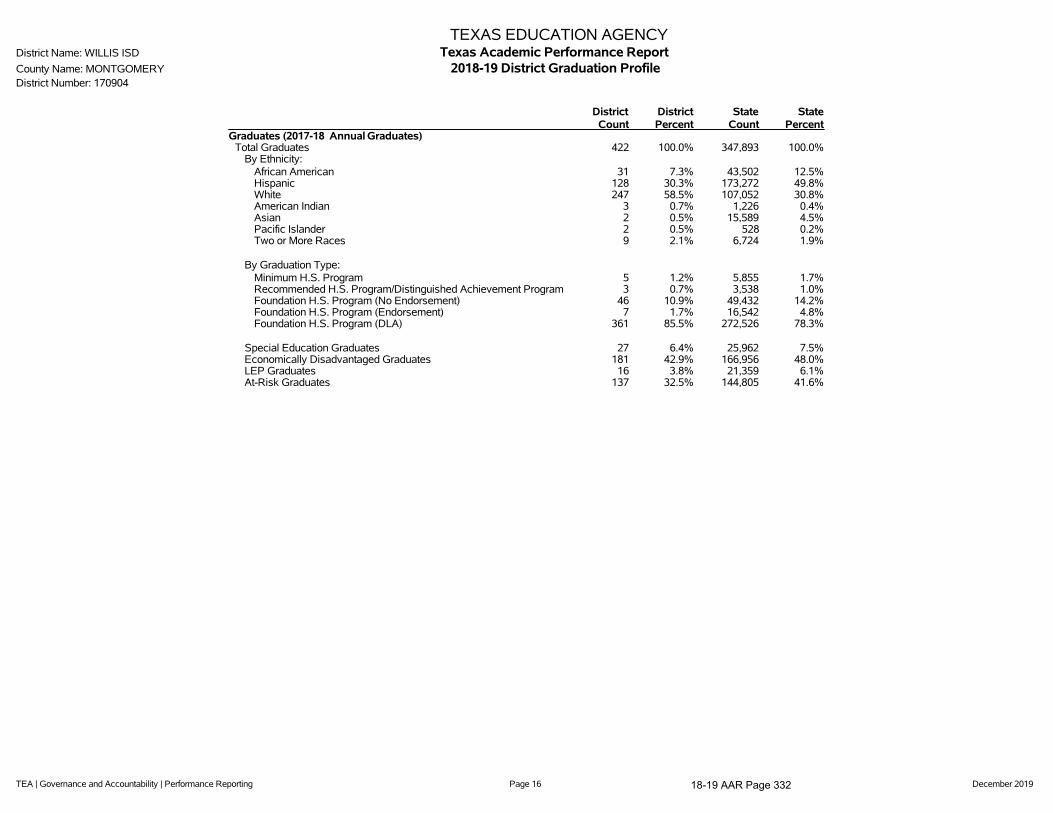
TEA | Governance and Accountability | Performance Reporting Page 16 December 2019
TEXAS EDUCATION AGENCYDistrict Name: WILLIS ISD Texas Academic Performance ReportCounty Name: MONTGOMERY 2018-19 District Graduation ProfileDistrict Number: 170904
DistrictCount
DistrictPercent
StateCount
StatePercent
Graduates (2017-18 Annual Graduates)Total Graduates 422 100.0% 347,893 100.0%
By Ethnicity:African American 31 7.3% 43,502 12.5%Hispanic 128 30.3% 173,272 49.8%White 247 58.5% 107,052 30.8%American Indian 3 0.7% 1,226 0.4%Asian 2 0.5% 15,589 4.5%Pacific Islander 2 0.5% 528 0.2%Two or More Races 9 2.1% 6,724 1.9%
By Graduation Type:Minimum H.S. Program 5 1.2% 5,855 1.7%Recommended H.S. Program/Distinguished Achievement Program 3 0.7% 3,538 1.0%Foundation H.S. Program (No Endorsement) 46 10.9% 49,432 14.2%Foundation H.S. Program (Endorsement) 7 1.7% 16,542 4.8%Foundation H.S. Program (DLA) 361 85.5% 272,526 78.3%
Special Education Graduates 27 6.4% 25,962 7.5%Economically Disadvantaged Graduates 181 42.9% 166,956 48.0%LEP Graduates 16 3.8% 21,359 6.1%At-Risk Graduates 137 32.5% 144,805 41.6%
18-19 AAR Page 332

TEA | Governance and Accountability | Performance Reporting Page 17 December 2019
TEXAS EDUCATION AGENCYDistrict Name: WILLIS ISD Texas Academic Performance ReportCounty Name: MONTGOMERY 2018-19 District College, Career, and Military Readiness (CCMR)District Number: 170904
State Region 06 DistrictAfrican
American Hispanic WhiteAmerican
Indian AsianPacific
Islander
Two orMore
RacesSpecial
EdEcon
DisadvEL
(Current)College, Career, and Military Ready Graduates (Student Achievement) ***
College, Career, or Military Ready (Annual Graduates)2017-18 65.5% 66.4% 64.0% 50.0% 56.6% 70.4% * * * 38.9% 100.0% 58.3% 34.4%
College Ready Graduates ***College Ready (Annual Graduates)
2017-18 50.0% 50.3% 34.4% 19.4% 26.6% 40.9% * * * 11.1% 0.0% 26.5% 12.5%
TSI Criteria Graduates (Annual Graduates)English Language Arts
2017-18 58.2% 61.9% 51.2% 45.2% 38.3% 58.7% * * * 44.4% 3.7% 43.6% 6.3%Mathematics
2017-18 46.0% 47.9% 29.9% 19.4% 21.9% 35.2% * * * 11.1% 0.0% 22.1% 0.0%Both Subjects
2017-18 42.1% 45.5% 28.4% 16.1% 20.3% 34.4% * * * 11.1% 0.0% 21.0% 0.0%
Dual Course Credits (Annual Graduates)Any Subject
2017-18 20.7% 21.2% 17.3% 6.5% 10.9% 22.3% * * * 0.0% 0.0% 11.0% 0.0%2016-17 19.9% 20.3% 21.6% 9.5% 17.2% 25.3% * 33.3% - 26.7% 3.6% 13.3% 0.0%
AP/IB Met Criteria in Any Subject (Annual Graduates)Any Subject
2017-18 20.4% 19.4% 9.5% 6.5% 10.2% 9.7% * * * 0.0% 0.0% 9.9% 12.5%2016-17 20.1% 19.8% 4.9% 2.4% 2.6% 6.1% * 16.7% - 6.7% 0.0% 2.0% 4.5%
Associate's DegreeAssociate's Degree (Annual Graduates)
2017-18 1.4% 0.8% 0.2% 0.0% 0.0% 0.4% * * * 0.0% 0.0% 0.0% 0.0%2016-17 0.8% 0.4% 0.0% 0.0% 0.0% 0.0% * 0.0% - 0.0% 0.0% 0.0% 0.0%
OnRampsCourse Credits (Annual Graduates)2017-18 1.0% 0.0% 0.0% 0.0% 0.0% 0.0% * * * 0.0% 0.0% 0.0% 0.0%
Career/Military Ready GraduatesCareer or Military Ready (Annual Graduates)
2017-18 28.7% 27.1% 41.6% 33.9% 39.1% 44.5% * * * 33.3% 100.0% 41.7% 25.0%2016-17 13.2% 11.2% 13.1% 6.0% 14.2% 13.9% * 8.3% - 13.3% 5.4% 14.0% 6.8%
Approved Industry-Based Certification (Annual Graduates)2017-18 4.8% 6.2% 9.0% 3.2% 8.6% 10.5% * * * 0.0% 3.7% 8.8% 12.5%2016-17 2.7% 1.6% 3.8% 0.0% 7.8% 2.4% * 0.0% - 6.7% 0.0% 5.1% 4.5%
Graduate with Completed IEP and Workforce Readiness (Annual Graduates)2017-18 1.7% 2.3% 6.2% 3.2% 4.7% 7.3% * * * 0.0% 96.3% 6.6% 0.0%2016-17 1.0% 0.8% 0.0% 0.0% 0.0% 0.0% * 0.0% - 0.0% 0.0% 0.0% 0.0%
CTE Coherent Sequence Coursework Aligned with Industry-Based Certifications (Annual Graduates)2017-18 38.7% 36.0% 58.8% 58.1% 54.7% 62.3% * * * 44.4% 51.9% 56.4% 31.3%2016-17 17.3% 14.9% 14.6% 2.4% 12.9% 18.4% * 16.7% - 0.0% 3.6% 11.2% 4.5%
18-19 AAR Page 333

TEA | Governance and Accountability | Performance Reporting Page 18 December 2019
TEXAS EDUCATION AGENCYDistrict Name: WILLIS ISD Texas Academic Performance ReportCounty Name: MONTGOMERY 2018-19 District College, Career, and Military Readiness (CCMR)District Number: 170904
State Region 06 DistrictAfrican
American Hispanic WhiteAmerican
Indian AsianPacific
Islander
Two orMore
RacesSpecial
EdEcon
DisadvEL
(Current)
U.S. Armed Forces Enlistment (Annual Graduates)2017-18 4.3% 2.6% 3.3% 0.0% 3.1% 3.6% * * * 11.1% 0.0% 3.9% 0.0%2016-17 2.2% 2.0% 2.8% 4.8% 1.7% 2.9% * 0.0% - 6.7% 3.6% 4.1% 0.0%
Graduates under an Advanced Degree Plan and Identified as a current Special Education Student (Annual Graduates)2017-18 2.6% 2.4% 0.9% 0.0% 1.6% 0.8% * * * 0.0% 14.8% 0.6% 0.0%
Graduates with Level I or Level II Certificate (Annual Graduates)2017-18 0.6% 0.1% 0.0% 0.0% 0.0% 0.0% * * * 0.0% 0.0% 0.0% 0.0%2016-17 0.5% 0.0% 0.0% 0.0% 0.0% 0.0% * 0.0% - 0.0% 0.0% 0.0% 0.0%
18-19 AAR Page 334

TEA | Governance and Accountability | Performance Reporting Page 19 December 2019
TEXAS EDUCATION AGENCYDistrict Name: WILLIS ISD Texas Academic Performance ReportCounty Name: MONTGOMERY 2018-19 District CCMR-Related IndicatorsDistrict Number: 170904
State Region 06 DistrictAfrican
American Hispanic WhiteAmerican
Indian AsianPacific
Islander
Two orMore
RacesSpecial
EdEcon
DisadvEL
(Current)TSIA Results (Graduates >= Criterion) (Annual Graduates)
Reading2017-18 32.1% 34.9% 36.5% 32.3% 28.9% 42.5% * * * 0.0% 3.7% 29.8% 0.0%2016-17 23.4% 23.3% 11.3% 11.9% 11.2% 11.0% * 16.7% - 13.3% 3.6% 10.7% 4.5%
Mathematics2017-18 23.7% 23.8% 21.8% 16.1% 17.2% 25.9% * * * 0.0% 0.0% 17.1% 0.0%2016-17 19.8% 19.3% 11.3% 16.7% 10.3% 11.0% * 0.0% - 13.3% 0.0% 10.2% 4.5%
Both Subjects2017-18 18.1% 19.7% 17.8% 12.9% 15.6% 20.2% * * * 0.0% 0.0% 14.9% 0.0%2016-17 12.9% 13.5% 5.4% 9.5% 6.0% 4.5% * 0.0% - 6.7% 0.0% 5.6% 4.5%
CTE Coherent Sequence (Annual Graduates)2017-18 58.4% 50.9% 61.8% 61.3% 57.8% 65.6% * * * 44.4% 51.9% 59.1% 43.8%2016-17 50.5% 41.2% 30.1% 19.0% 29.3% 32.7% * 16.7% - 26.7% 7.1% 26.5% 31.8%
Completed and Received Credit for College Prep Courses (Annual Graduates)English Language Arts
2017-18 2.0% 6.6% 0.0% 0.0% 0.0% 0.0% * * * 0.0% 0.0% 0.0% 0.0%2016-17 0.8% 2.5% 0.0% 0.0% 0.0% 0.0% * 0.0% - 0.0% 0.0% 0.0% 0.0%
Mathematics2017-18 3.9% 5.7% 0.0% 0.0% 0.0% 0.0% * * * 0.0% 0.0% 0.0% 0.0%2016-17 1.4% 3.9% 0.0% 0.0% 0.0% 0.0% * 0.0% - 0.0% 0.0% 0.0% 0.0%
Both Subjects2017-18 0.9% 2.8% 0.0% 0.0% 0.0% 0.0% * * * 0.0% 0.0% 0.0% 0.0%2016-17 0.2% 0.4% 0.0% 0.0% 0.0% 0.0% * 0.0% - 0.0% 0.0% 0.0% 0.0%
AP/IB Results (Participation) (Grades 11-12)All Subjects
2018 25.8% 23.1% 10.3% 9.1% 9.0% 11.4% * 30.0% * 3.8% n/a 9.0% n/a2017 26.2% 23.3% 12.1% 6.0% 8.9% 14.6% * 42.9% * 3.8% n/a 7.5% n/a
English Language Arts2018 15.3% 11.1% 6.5% 6.5% 5.1% 7.4% * 10.0% * 3.8% n/a 5.4% n/a2017 15.9% 10.8% 5.8% 3.6% 4.3% 7.2% * 14.3% * 0.0% n/a 3.7% n/a
Mathematics2018 7.3% 7.7% 0.8% 0.0% 0.0% 1.3% * 10.0% * 0.0% n/a 0.2% n/a2017 7.2% 7.7% 0.8% 0.0% 0.4% 1.1% * 0.0% * 0.0% n/a 0.2% n/a
Science2018 10.8% 10.2% 4.4% 2.6% 2.3% 5.5% * 30.0% * 3.8% n/a 3.8% n/a2017 10.9% 10.1% 4.2% 1.2% 1.4% 5.5% * 42.9% * 3.8% n/a 2.1% n/a
Social Studies2018 14.5% 12.5% 4.9% 3.9% 3.9% 5.9% * 10.0% * 0.0% n/a 3.8% n/a2017 15.0% 13.4% 8.8% 3.6% 5.4% 11.4% * 28.6% * 3.8% n/a 4.8% n/a
AP/IB Results (Examinees >= Criterion) (Grades 11-12)All Subjects
2018 50.7% 57.8% 48.5% 28.6% 46.4% 50.0% - * - * n/a 55.8% n/a2017 49.1% 57.0% 39.3% 40.0% 44.0% 39.0% * * - * n/a 38.9% n/a
English Language Arts2018 42.5% 53.2% 33.9% 40.0% 18.8% 35.9% - * - * n/a 26.9% n/a2017 41.3% 49.9% 38.9% * 16.7% 47.4% - * - - n/a 27.8% n/a
Mathematics2018 52.8% 59.5% 12.5% - - 14.3% - * - - n/a * n/a
18-19 AAR Page 335

TEA | Governance and Accountability | Performance Reporting Page 20 December 2019
TEXAS EDUCATION AGENCYDistrict Name: WILLIS ISD Texas Academic Performance ReportCounty Name: MONTGOMERY 2018-19 District CCMR-Related IndicatorsDistrict Number: 170904
State Region 06 DistrictAfrican
American Hispanic WhiteAmerican
Indian AsianPacific
Islander
Two orMore
RacesSpecial
EdEcon
DisadvEL
(Current)2017 51.3% 60.4% 14.3% - * 16.7% - - - - n/a * n/a
Science2018 38.0% 50.3% 21.4% * 28.6% 20.7% - * - * n/a 33.3% n/a2017 38.3% 49.6% 15.4% * * 13.8% * * - * n/a 10.0% n/a
Social Studies2018 44.6% 55.5% 51.1% * 33.3% 58.1% - * - - n/a 55.6% n/a2017 41.4% 50.4% 37.8% * 40.0% 38.3% * * - * n/a 26.1% n/a
SAT/ACT Results (Annual Graduates) ***Tested
2017-18 74.6% 61.2% 51.7% 77.4% 40.6% 54.3% * * * 55.6% n/a 45.0% n/a2016-17 73.5% 60.0% 53.6% 71.4% 45.7% 53.5% 100.0% 100.0% - 46.7% n/a 42.3% n/a
At/Above Criterion2017-18 37.9% 51.0% 33.0% 12.5% 32.7% 36.6% * * * 20.0% n/a 29.1% n/a
Average SAT Score (Annual Graduates) ***All Subjects
2017-18 1036 1097 1028 969 996 1051 * * * 974 n/a 998 n/aEnglish Language Artsand Writing
2017-18 521 553 527 492 505 543 * * * 516 n/a 514 n/aMathematics
2017-18 515 545 500 477 492 508 * * * 458 n/a 483 n/a
Average ACT Score (Annual Graduates) ***All Subjects
2017-18 20.6 22.4 20.0 15.7 18.7 21.5 * - - - n/a 18.4 n/aEnglish Language Arts
2017-18 20.3 22.1 19.6 14.8 18.8 21.1 * - - - n/a 18.0 n/aMathematics
2017-18 20.6 22.2 19.4 15.4 17.8 20.9 * - - - n/a 17.9 n/aScience
2017-18 20.9 22.6 20.8 17.1 18.7 22.4 * - - - n/a 19.1 n/a
18-19 AAR Page 336

TEA | Governance and Accountability | Performance Reporting Page 21 December 2019
TEXAS EDUCATION AGENCYDistrict Name: WILLIS ISD Texas Academic Performance ReportCounty Name: MONTGOMERY 2018-19 District Other Postsecondary IndicatorsDistrict Number: 170904
State Region 06 DistrictAfrican
American Hispanic WhiteAmerican
Indian AsianPacific
Islander
Two orMore
RacesSpecial
EdEcon
DisadvEL
(Current)Advanced Dual-Credit Course Completion (Grades 9-12)
Any Subject2017-18 43.4% 40.0% 32.6% 26.1% 26.7% 37.5% 42.9% 66.7% * 23.3% 4.8% 25.3% 11.4%2016-17 37.1% 31.5% 19.8% 13.8% 16.5% 22.4% 33.3% 45.5% * 17.2% 4.2% 15.1% 9.9%
English Language Arts2017-18 17.3% 14.2% 13.8% 9.9% 9.9% 17.1% 0.0% 41.7% * 10.2% 0.0% 9.0% 0.6%2016-17 16.8% 13.0% 13.1% 11.4% 9.9% 15.4% 16.7% 18.2% * 9.5% 0.7% 8.0% 1.7%
Mathematics2017-18 20.7% 19.7% 13.2% 7.6% 10.4% 16.1% 20.0% 50.0% * 5.4% 0.8% 8.8% 0.6%2016-17 19.5% 18.1% 12.1% 7.8% 8.7% 14.4% 16.7% 42.9% * 11.1% 0.0% 7.7% 3.4%
Science2017-18 21.2% 20.8% 19.7% 17.9% 15.4% 22.7% 28.6% 50.0% * 13.8% 3.9% 15.3% 6.5%2016-17 5.7% 5.0% 5.4% 4.8% 3.0% 7.0% * 11.8% * 5.4% 0.0% 2.7% 0.0%
Social Studies2017-18 22.8% 19.8% 11.7% 8.6% 8.9% 14.4% 14.3% 16.7% * 3.6% 0.0% 7.5% 0.6%2016-17 21.8% 19.3% 10.8% 8.0% 6.6% 14.1% 16.7% 9.5% * 8.5% 0.0% 6.4% 1.7%
Graduates Enrolled in Texas Institution of Higher Education (TX IHE)2016-17 54.6% 51.6% 48.0% 45.2% 47.4% 47.3% * 100.0% - 46.7% 17.9% 38.2% 40.9%2015-16 54.7% 51.2% 49.1% 56.7% 43.4% 51.2% * * * 28.6% 10.0% 40.4% 21.7%
Graduates in TX IHE Completing One Year Without Enrollment in a Developmental Education Course2016-17 59.2% 64.5% 54.6% 52.6% 39.6% 60.9% * 50.0% - 71.4% 20.0% 43.2% 11.1%2015-16 55.7% 63.4% 55.5% 31.3% 41.8% 65.0% * * * * * 37.3% 0.0%
18-19 AAR Page 337
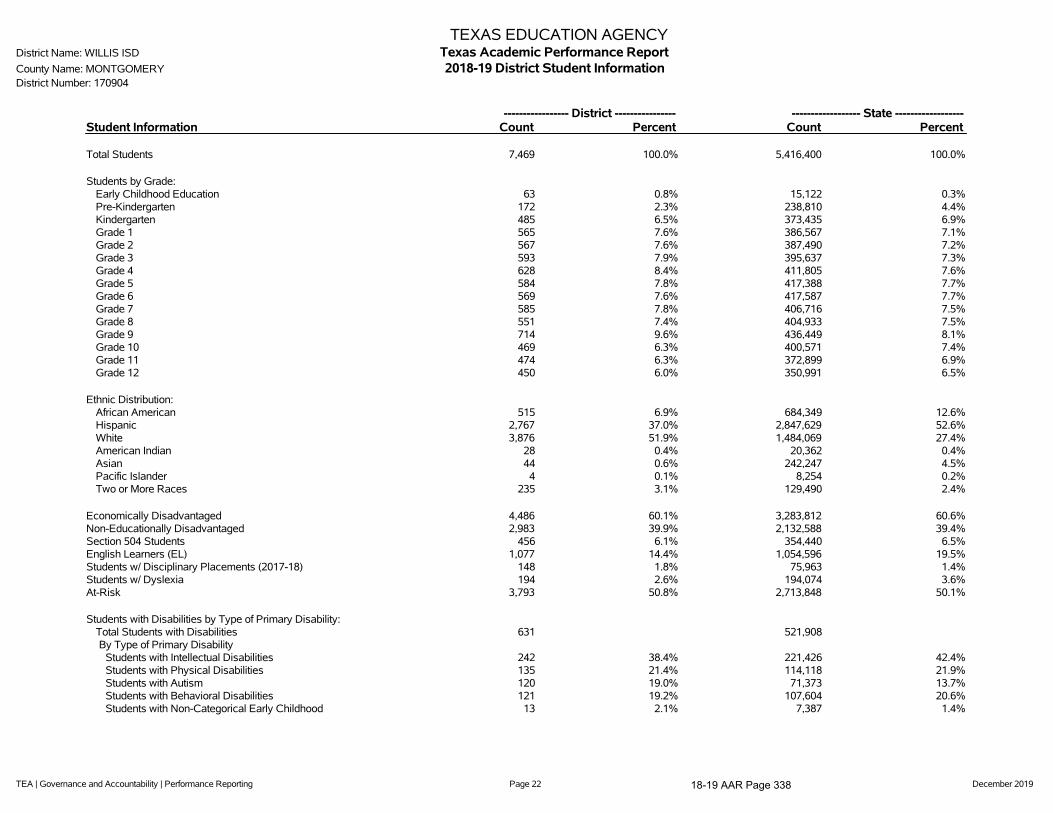
TEA | Governance and Accountability | Performance Reporting Page 22 December 2019
TEXAS EDUCATION AGENCYDistrict Name: WILLIS ISD Texas Academic Performance ReportCounty Name: MONTGOMERY 2018-19 District Student InformationDistrict Number: 170904
----------------- District ---------------- ------------------ State ------------------Student Information Count Percent Count Percent
Total Students 7,469 100.0% 5,416,400 100.0%
Students by Grade:Early Childhood Education 63 0.8% 15,122 0.3%Pre-Kindergarten 172 2.3% 238,810 4.4%Kindergarten 485 6.5% 373,435 6.9%Grade 1 565 7.6% 386,567 7.1%Grade 2 567 7.6% 387,490 7.2%Grade 3 593 7.9% 395,637 7.3%Grade 4 628 8.4% 411,805 7.6%Grade 5 584 7.8% 417,388 7.7%Grade 6 569 7.6% 417,587 7.7%Grade 7 585 7.8% 406,716 7.5%Grade 8 551 7.4% 404,933 7.5%Grade 9 714 9.6% 436,449 8.1%Grade 10 469 6.3% 400,571 7.4%Grade 11 474 6.3% 372,899 6.9%Grade 12 450 6.0% 350,991 6.5%
Ethnic Distribution:African American 515 6.9% 684,349 12.6%Hispanic 2,767 37.0% 2,847,629 52.6%White 3,876 51.9% 1,484,069 27.4%American Indian 28 0.4% 20,362 0.4%Asian 44 0.6% 242,247 4.5%Pacific Islander 4 0.1% 8,254 0.2%Two or More Races 235 3.1% 129,490 2.4%
Economically Disadvantaged 4,486 60.1% 3,283,812 60.6%Non-Educationally Disadvantaged 2,983 39.9% 2,132,588 39.4%Section 504 Students 456 6.1% 354,440 6.5%English Learners (EL) 1,077 14.4% 1,054,596 19.5%Students w/ Disciplinary Placements (2017-18) 148 1.8% 75,963 1.4%Students w/ Dyslexia 194 2.6% 194,074 3.6%At-Risk 3,793 50.8% 2,713,848 50.1%
Students with Disabilities by Type of Primary Disability:Total Students with Disabilities 631 521,908By Type of Primary Disability
Students with Intellectual Disabilities 242 38.4% 221,426 42.4%Students with Physical Disabilities 135 21.4% 114,118 21.9%Students with Autism 120 19.0% 71,373 13.7%Students with Behavioral Disabilities 121 19.2% 107,604 20.6%Students with Non-Categorical Early Childhood 13 2.1% 7,387 1.4%
18-19 AAR Page 338

TEA | Governance and Accountability | Performance Reporting Page 23 December 2019
TEXAS EDUCATION AGENCYDistrict Name: WILLIS ISD Texas Academic Performance ReportCounty Name: MONTGOMERY 2018-19 District Student InformationDistrict Number: 170904
- Non-Special Education Rates - - Special Education Rates -Student Information District State District State
Retention Rates by Grade:Kindergarten 0.4% 1.7% 3.8% 6.2%Grade 1 2.0% 3.1% 5.7% 5.5%Grade 2 1.3% 1.8% 2.2% 2.3%Grade 3 1.2% 1.1% 2.1% 0.9%Grade 4 0.0% 0.5% 0.0% 0.5%Grade 5 0.2% 0.5% 1.8% 0.6%Grade 6 0.4% 0.4% 0.0% 0.5%Grade 7 1.0% 0.6% 0.0% 0.6%Grade 8 0.0% 0.4% 0.0% 0.7%Grade 9 17.2% 7.2% 34.0% 12.7%
---------- District ----------- ------------ State ------------Count Percent Count Percent
Data Quality:Underreported Students 14 0.4% 6,321 0.3%
Class Size Information District State
Class Size Averages by Grade and Subject(Derived from teacher responsibility records):
Elementary:Kindergarten 20.9 18.9Grade 1 19.8 18.8Grade 2 19.1 18.7Grade 3 20.1 18.9Grade 4 20.0 19.2Grade 5 23.0 21.2Grade 6 19.3 20.4
Secondary:English/Language Arts 15.9 16.6Foreign Languages 21.8 18.9Mathematics 16.7 17.8Science 18.4 18.9Social Studies 18.1 19.3
18-19 AAR Page 339

TEA | Governance and Accountability | Performance Reporting Page 24 December 2019
TEXAS EDUCATION AGENCYDistrict Name: WILLIS ISD Texas Academic Performance ReportCounty Name: MONTGOMERY 2018-19 District Staff InformationDistrict Number: 170904
----------------- District ---------------- ------------------ State ------------------Staff Information Count Percent Count Percent
Total Staff 970.5 100.0% 719,502.5 100.0%
Professional Staff: 558.6 57.6% 461,380.1 64.1%Teachers 434.8 44.8% 358,450.1 49.8%Professional Support 89.6 9.2% 72,848.5 10.1%Campus Administration (School Leadership) 27.7 2.9% 21,812.7 3.0%Central Administration 6.5 0.7% 8,268.8 1.1%
Educational Aides: 106.5 11.0% 74,292.4 10.3%Auxiliary Staff: 305.4 31.5% 183,830.1 25.5%
Librarians & Counselors (Headcount):Librarians
Full-time 0.0 n/a 4,414.0 n/aPart-time 0.0 n/a 572.0 n/a
CounselorsFull-time 12.0 n/a 12,433.0 n/aPart-time 2.0 n/a 1,097.0 n/a
Total Minority Staff: 263.3 27.1% 362,803.7 50.4%
Teachers by Ethnicity and Sex:African American 12.0 2.8% 37,875.6 10.6%Hispanic 61.8 14.2% 99,261.7 27.7%White 357.0 82.1% 209,288.6 58.4%American Indian 1.0 0.2% 1,236.1 0.3%Asian 1.0 0.2% 6,037.0 1.7%Pacific Islander 0.0 0.0% 676.7 0.2%Two or More Races 2.0 0.5% 4,074.5 1.1%
Males 80.8 18.6% 85,138.1 23.8%Females 353.9 81.4% 273,312.0 76.2%
Teachers by Highest Degree Held:No Degree 2.0 0.5% 4,932.1 1.4%Bachelors 355.1 81.7% 263,991.5 73.6%Masters 75.6 17.4% 87,059.6 24.3%Doctorate 2.0 0.5% 2,466.8 0.7%
Teachers by Years of Experience:Beginning Teachers 34.8 8.0% 24,953.3 7.0%1-5 Years Experience 137.7 31.7% 103,762.4 28.9%6-10 Years Experience 76.0 17.5% 68,136.0 19.0%11-20 Years Experience 108.3 24.9% 105,158.7 29.3%Over 20 Years Experience 77.9 17.9% 56,439.7 15.7%
Number of Students per Teacher 17.2 n/a 15.1 n/a
18-19 AAR Page 340

TEA | Governance and Accountability | Performance Reporting Page 25 December 2019
TEXAS EDUCATION AGENCYDistrict Name: WILLIS ISD Texas Academic Performance ReportCounty Name: MONTGOMERY 2018-19 District Staff InformationDistrict Number: 170904
Staff Information District State
Experience of Campus Leadership:Average Years Experience of Principals 2.8 6.3Average Years Experience of Principals with District 2.8 5.4Average Years Experience of Assistant Principals 6.1 5.3Average Years Experience of Assistant Principals with District 4.2 4.7
Average Years Experience of Teachers: 10.7 11.1Average Years Experience of Teachers with District: 6.5 7.2
Average Teacher Salary by Years of Experience (regular duties only):Beginning Teachers $45,854 $47,2181-5 Years Experience $50,779 $50,4086-10 Years Experience $52,839 $52,78611-20 Years Experience $57,036 $56,041Over 20 Years Experience $63,917 $62,039
Average Actual Salaries (regular duties only):Teachers $54,658 $54,122Professional Support $65,409 $64,069Campus Administration (School Leadership) $78,467 $78,947Central Administration $142,003 $103,400
Instructional Staff Percent: 60.4% 64.5%
Turnover Rate for Teachers: 18.8% 16.5%
Staff Exclusions:Shared Services Arrangement Staff:
Professional Staff 0.0 1,074.9Educational Aides 0.0 189.4Auxiliary Staff 0.0 411.6
Contracted Instructional Staff: 1.5 6,043.6
18-19 AAR Page 341
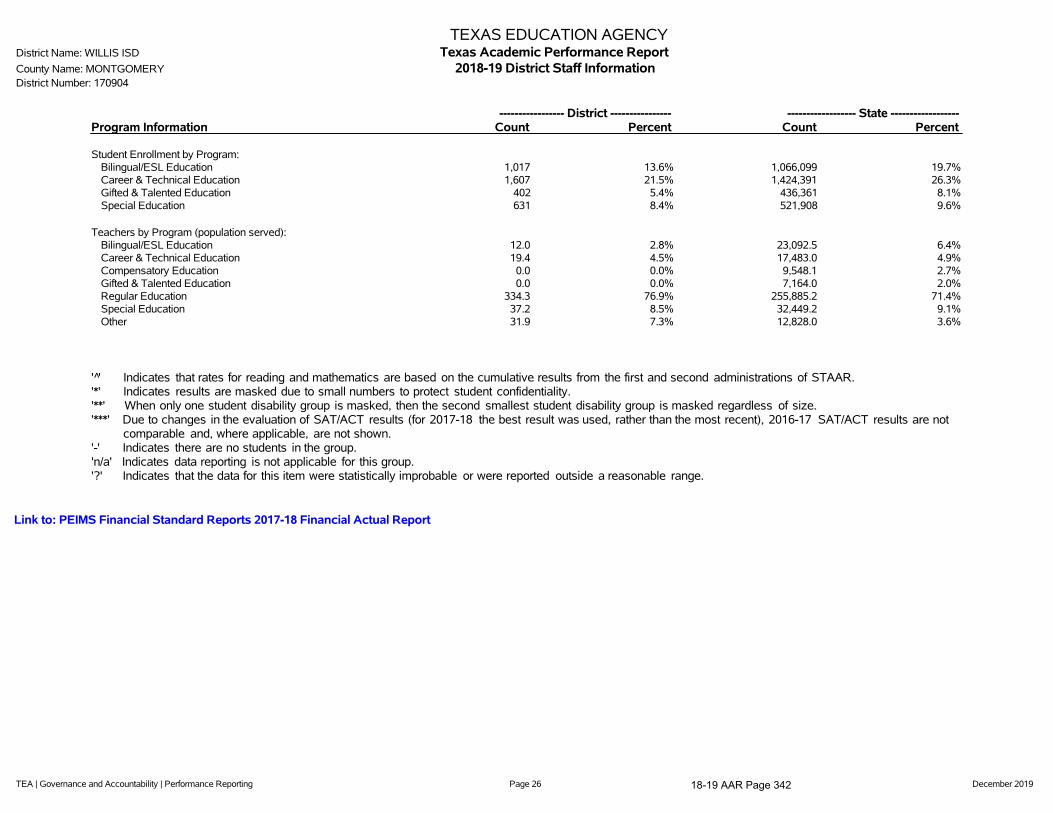
TEA | Governance and Accountability | Performance Reporting Page 26 December 2019
TEXAS EDUCATION AGENCYDistrict Name: WILLIS ISD Texas Academic Performance ReportCounty Name: MONTGOMERY 2018-19 District Staff InformationDistrict Number: 170904
----------------- District ---------------- ------------------ State ------------------Program Information Count Percent Count Percent
Student Enrollment by Program:Bilingual/ESL Education 1,017 13.6% 1,066,099 19.7%Career & Technical Education 1,607 21.5% 1,424,391 26.3%Gifted & Talented Education 402 5.4% 436,361 8.1%Special Education 631 8.4% 521,908 9.6%
Teachers by Program (population served):Bilingual/ESL Education 12.0 2.8% 23,092.5 6.4%Career & Technical Education 19.4 4.5% 17,483.0 4.9%Compensatory Education 0.0 0.0% 9,548.1 2.7%Gifted & Talented Education 0.0 0.0% 7,164.0 2.0%Regular Education 334.3 76.9% 255,885.2 71.4%Special Education 37.2 8.5% 32,449.2 9.1%Other 31.9 7.3% 12,828.0 3.6%
' '̂ Indicates that rates for reading and mathematics are based on the cumulative results from the first and second administrations of STAAR.'*' Indicates results are masked due to small numbers to protect student confidentiality.'**' When only one student disability group is masked, then the second smallest student disability group is masked regardless of size.'***' Due to changes in the evaluation of SAT/ACT results (for 2017-18 the best result was used, rather than the most recent), 2016-17 SAT/ACT results are not
comparable and, where applicable, are not shown.'-' Indicates there are no students in the group.'n/a' Indicates data reporting is not applicable for this group.'?' Indicates that the data for this item were statistically improbable or were reported outside a reasonable range.
Link to: PEIMS Financial Standard Reports 2017-18 Financial Actual Report
18-19 AAR Page 342

TEA | Governance and Accountability | Performance Reporting Page 1 December 2019
2018-19 Texas Academic Performance Report
District Name: WILLIS ISD
Campus Name: WILLIS H S
Campus Number: 170904002
2019 Accountability Rating: B
18-19 AAR Page 343

TEA | Governance and Accountability | Performance Reporting Page 2 December 2019
This page is intentionally blank.
18-19 AAR Page 344

TEA | Governance and Accountability | Performance Reporting Page 3 December 2019
TEXAS EDUCATION AGENCYDistrict Name: WILLIS ISD Texas Academic Performance Report Total Students: 2,085
Campus Name: WILLIS H S 2018-19 Campus STAAR Performance Grade Span: 09 - 12Campus Number: 170904002 School Type: High School
State District CampusAfrican
American Hispanic WhiteAmerican
Indian AsianPacific
Islander
Two orMoreRaces
SpecialEd
(Current)
SpecialEd
(Former)
Continu-ously
Enrolled
Non-Continu-
ouslyEnrolled
EconDisadv
EL(Current
&Monitored)
STAARPerformance Rates by Tested Grade, Subject, and Performance Level
End of Course English IAt Approaches Grade Level orAbove 2019 68% 65% 65% 58% 59% 71% * * - 67% 22% 60% 67% 62% 61% 45%
2018 65% 62% 62% 59% 55% 66% * - * 76% 22% * 64% 56% 56% 46%At Meets Grade Level or Above 2019 50% 44% 44% 30% 36% 52% * * - 52% 11% 60% 46% 42% 39% 21%
2018 44% 36% 36% 22% 26% 46% * - * 31% 10% * 39% 26% 26% 15%At Masters Grade Level 2019 11% 6% 6% 0% 3% 9% * * - 0% 1% 0% 6% 6% 3% 0%
2018 7% 5% 5% 3% 4% 6% * - * 7% 3% * 6% 4% 3% 1%End of Course English II
At Approaches Grade Level orAbove 2019 68% 67% 67% 54% 60% 75% * - * 71% 29% * 70% 58% 63% 45%
2018 67% 70% 70% 69% 60% 78% * * - 72% 41% * 71% 64% 64% 45%At Meets Grade Level or Above 2019 49% 45% 45% 34% 37% 54% * - * 50% 17% * 48% 38% 39% 20%
2018 48% 48% 48% 43% 35% 59% * * - 56% 34% * 49% 46% 40% 17%At Masters Grade Level 2019 8% 6% 6% 8% 5% 8% * - * 4% 10% * 7% 5% 5% 1%
2018 8% 7% 7% 14% 3% 10% * * - 0% 17% * 7% 7% 4% 0%End of Course Algebra I
At Approaches Grade Level orAbove 2019 85% 79% 72% 63% 80% 68% * * - 63% 41% * 76% 66% 72% 72%
2018 83% 78% 69% 65% 66% 73% * - - 80% 33% * 73% 62% 65% 64%At Meets Grade Level or Above 2019 61% 46% 33% 26% 33% 35% * * - 19% 12% * 35% 29% 30% 29%
2018 55% 49% 31% 29% 27% 35% * - - 33% 13% * 34% 26% 28% 30%At Masters Grade Level 2019 37% 25% 12% 4% 12% 14% * * - 6% 3% * 13% 11% 9% 10%
2018 32% 27% 10% 13% 9% 12% * - - 7% 2% * 10% 11% 8% 8%End of Course Biology
At Approaches Grade Level orAbove 2019 88% 90% 90% 84% 88% 92% * * - 88% 60% * 92% 84% 87% 77%
2018 87% 85% 85% 80% 82% 88% * - * 95% 51% * 88% 79% 81% 74%At Meets Grade Level or Above 2019 62% 61% 61% 47% 57% 67% * * - 44% 22% * 64% 55% 57% 40%
2018 59% 58% 58% 48% 48% 67% * - * 55% 22% * 61% 49% 49% 36%At Masters Grade Level 2019 25% 20% 20% 5% 13% 26% * * - 31% 5% * 21% 19% 14% 3%
2018 24% 18% 18% 18% 14% 23% * - * 9% 10% * 19% 17% 13% 4%End of Course U.S. History
At Approaches Grade Level orAbove 2019 93% 93% 93% 87% 88% 97% * * - 100% 69% * 94% 90% 89% 75%
2018 92% 92% 92% 87% 85% 98% * 89% - 88% 65% - 94% 85% 88% 75%At Meets Grade Level or Above 2019 73% 70% 70% 54% 58% 84% * * - 64% 38% * 73% 61% 62% 28%
2018 70% 69% 69% 56% 60% 78% * 89% - 71% 35% - 71% 66% 62% 45%At Masters Grade Level 2019 45% 41% 41% 21% 32% 52% * * - 45% 15% * 42% 38% 33% 7%
2018 40% 36% 36% 13% 29% 44% * 56% - 35% 4% - 38% 32% 27% 14%
All Grades All SubjectsAt Approaches Grade Level orAbove 2019 78% 76% 76% 67% 73% 80% 93% 100% * 75% 42% 76% 79% 71% 73% 60%
2018 77% 75% 75% 71% 68% 80% 75% 92% * 82% 39% 43% 77% 68% 69% 58%At Meets Grade Level or Above 2019 50% 45% 50% 37% 43% 58% 33% 55% * 45% 18% 53% 53% 44% 44% 27%
2018 48% 45% 48% 39% 38% 58% 50% 92% * 48% 21% 43% 51% 42% 40% 27%At Masters Grade Level 2019 24% 19% 15% 7% 12% 20% 13% 45% * 14% 6% 12% 16% 14% 11% 4%
18-19 AAR Page 345
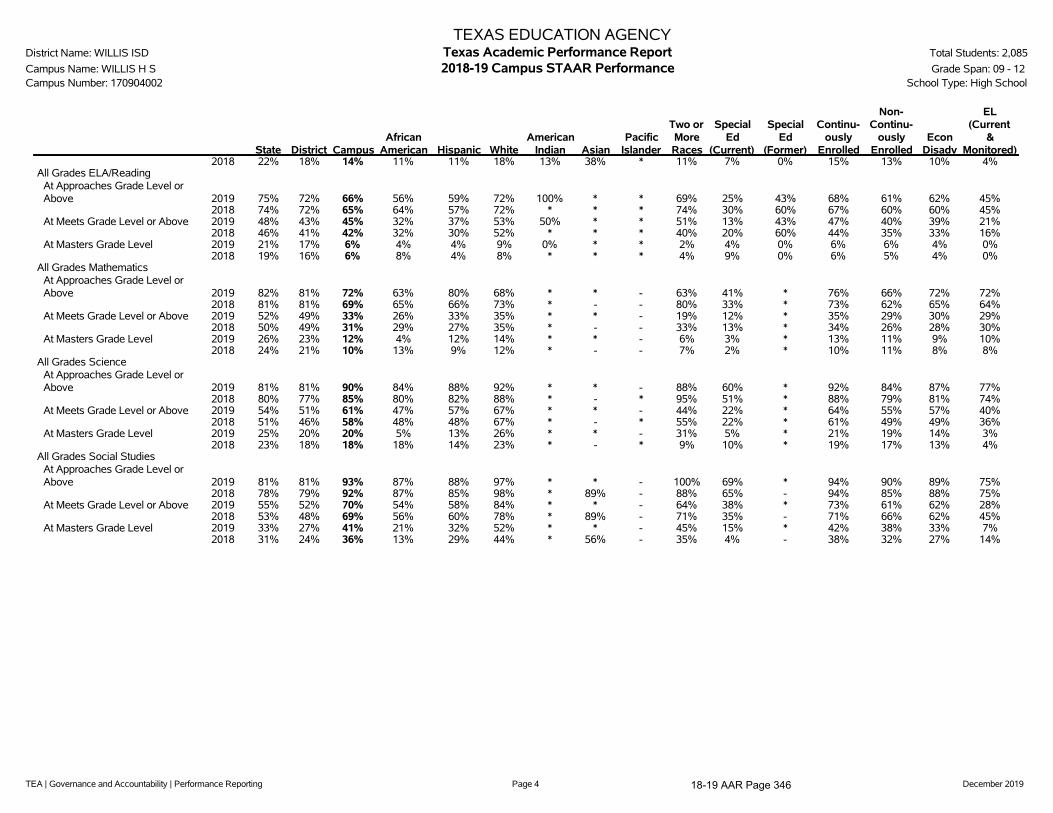
TEA | Governance and Accountability | Performance Reporting Page 4 December 2019
TEXAS EDUCATION AGENCYDistrict Name: WILLIS ISD Texas Academic Performance Report Total Students: 2,085
Campus Name: WILLIS H S 2018-19 Campus STAAR Performance Grade Span: 09 - 12Campus Number: 170904002 School Type: High School
State District CampusAfrican
American Hispanic WhiteAmerican
Indian AsianPacific
Islander
Two orMoreRaces
SpecialEd
(Current)
SpecialEd
(Former)
Continu-ously
Enrolled
Non-Continu-
ouslyEnrolled
EconDisadv
EL(Current
&Monitored)
2018 22% 18% 14% 11% 11% 18% 13% 38% * 11% 7% 0% 15% 13% 10% 4%All Grades ELA/Reading
At Approaches Grade Level orAbove 2019 75% 72% 66% 56% 59% 72% 100% * * 69% 25% 43% 68% 61% 62% 45%
2018 74% 72% 65% 64% 57% 72% * * * 74% 30% 60% 67% 60% 60% 45%At Meets Grade Level or Above 2019 48% 43% 45% 32% 37% 53% 50% * * 51% 13% 43% 47% 40% 39% 21%
2018 46% 41% 42% 32% 30% 52% * * * 40% 20% 60% 44% 35% 33% 16%At Masters Grade Level 2019 21% 17% 6% 4% 4% 9% 0% * * 2% 4% 0% 6% 6% 4% 0%
2018 19% 16% 6% 8% 4% 8% * * * 4% 9% 0% 6% 5% 4% 0%All Grades Mathematics
At Approaches Grade Level orAbove 2019 82% 81% 72% 63% 80% 68% * * - 63% 41% * 76% 66% 72% 72%
2018 81% 81% 69% 65% 66% 73% * - - 80% 33% * 73% 62% 65% 64%At Meets Grade Level or Above 2019 52% 49% 33% 26% 33% 35% * * - 19% 12% * 35% 29% 30% 29%
2018 50% 49% 31% 29% 27% 35% * - - 33% 13% * 34% 26% 28% 30%At Masters Grade Level 2019 26% 23% 12% 4% 12% 14% * * - 6% 3% * 13% 11% 9% 10%
2018 24% 21% 10% 13% 9% 12% * - - 7% 2% * 10% 11% 8% 8%All Grades Science
At Approaches Grade Level orAbove 2019 81% 81% 90% 84% 88% 92% * * - 88% 60% * 92% 84% 87% 77%
2018 80% 77% 85% 80% 82% 88% * - * 95% 51% * 88% 79% 81% 74%At Meets Grade Level or Above 2019 54% 51% 61% 47% 57% 67% * * - 44% 22% * 64% 55% 57% 40%
2018 51% 46% 58% 48% 48% 67% * - * 55% 22% * 61% 49% 49% 36%At Masters Grade Level 2019 25% 20% 20% 5% 13% 26% * * - 31% 5% * 21% 19% 14% 3%
2018 23% 18% 18% 18% 14% 23% * - * 9% 10% * 19% 17% 13% 4%All Grades Social Studies
At Approaches Grade Level orAbove 2019 81% 81% 93% 87% 88% 97% * * - 100% 69% * 94% 90% 89% 75%
2018 78% 79% 92% 87% 85% 98% * 89% - 88% 65% - 94% 85% 88% 75%At Meets Grade Level or Above 2019 55% 52% 70% 54% 58% 84% * * - 64% 38% * 73% 61% 62% 28%
2018 53% 48% 69% 56% 60% 78% * 89% - 71% 35% - 71% 66% 62% 45%At Masters Grade Level 2019 33% 27% 41% 21% 32% 52% * * - 45% 15% * 42% 38% 33% 7%
2018 31% 24% 36% 13% 29% 44% * 56% - 35% 4% - 38% 32% 27% 14%
18-19 AAR Page 346

TEA | Governance and Accountability | Performance Reporting Page 5 December 2019
TEXAS EDUCATION AGENCYDistrict Name: WILLIS ISD Texas Academic Performance Report Total Students: 2,085
Campus Name: WILLIS H S 2018-19 Campus Progress Grade Span: 09 - 12Campus Number: 170904002 School Type: High School
State District CampusAfrican
American Hispanic WhiteAmerican
Indian AsianPacific
Islander
Two orMore
Races
SpecialEd
(Current)
SpecialEd
(Former)
Continu-ously
Enrolled
Non-Continu-
ouslyEnrolled
EconDisadv
EL(Current
&Monitored)
School Progress Domain - Academic Growth Score by Grade and Subject
End of Course English II 2019 69 70 70 70 70 71 * - * 68 71 * 69 72 71 672018 67 70 70 62 67 73 * * - 70 62 * 70 71 65 55
End of Course Algebra I 2019 75 62 52 45 56 51 * * - 50 31 * 54 48 51 512018 72 70 57 56 58 57 * - - 63 31 * 59 54 56 57
All Grades Both Subjects 2019 69 66 61 57 63 62 50 * * 61 48 * 62 60 61 592018 69 69 65 59 63 67 * * - 66 46 * 66 63 61 56
All Grades ELA/Reading 2019 68 66 70 70 70 71 * - * 68 71 * 69 72 71 672018 69 68 70 62 67 73 * * - 70 62 * 70 71 65 55
All Grades Mathematics 2019 70 66 52 45 56 51 * * - 50 31 * 54 48 51 512018 70 69 57 56 58 57 * - - 63 31 * 59 54 56 57
18-19 AAR Page 347
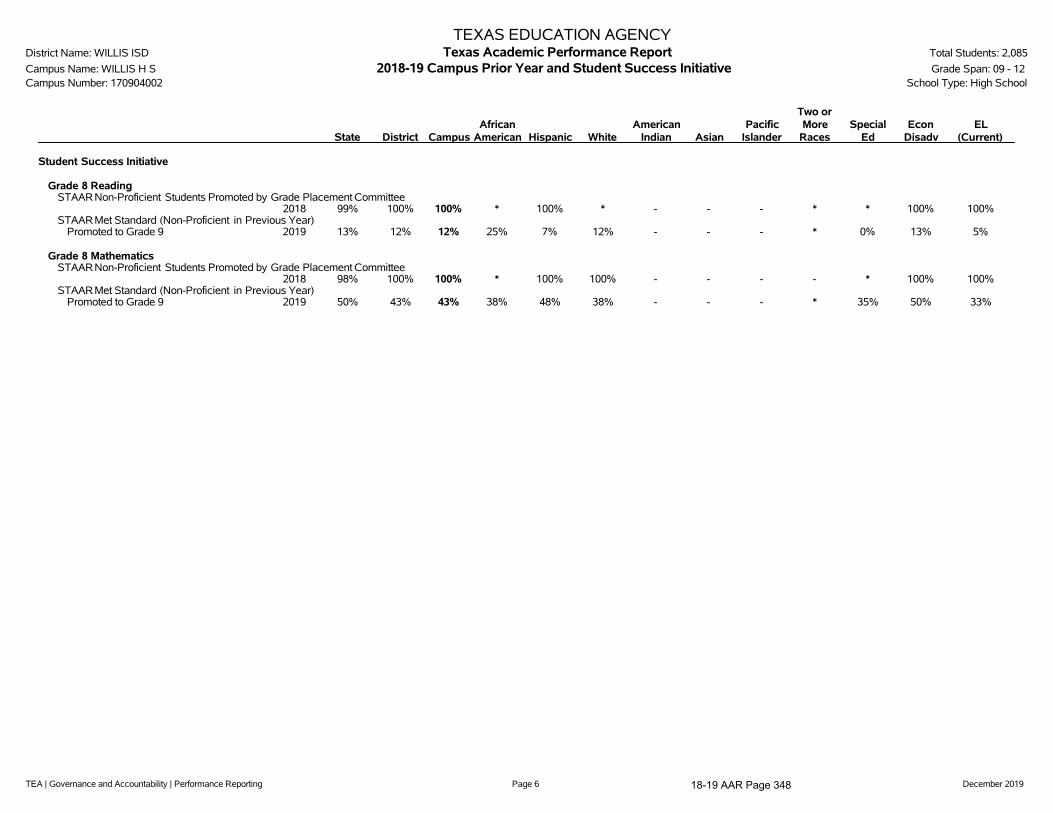
TEA | Governance and Accountability | Performance Reporting Page 6 December 2019
TEXAS EDUCATION AGENCYDistrict Name: WILLIS ISD Texas Academic Performance Report Total Students: 2,085
Campus Name: WILLIS H S 2018-19 Campus Prior Year and Student Success Initiative Grade Span: 09 - 12Campus Number: 170904002 School Type: High School
State District CampusAfrican
American Hispanic WhiteAmerican
Indian AsianPacific
Islander
Two orMore
RacesSpecial
EdEcon
DisadvEL
(Current)
Student Success Initiative
Grade 8 ReadingSTAARNon-Proficient Students Promoted by Grade Placement Committee
2018 99% 100% 100% * 100% * - - - * * 100% 100%STAARMet Standard (Non-Proficient in Previous Year)
Promoted to Grade 9 2019 13% 12% 12% 25% 7% 12% - - - * 0% 13% 5%
Grade 8 MathematicsSTAARNon-Proficient Students Promoted by Grade Placement Committee
2018 98% 100% 100% * 100% 100% - - - - * 100% 100%STAARMet Standard (Non-Proficient in Previous Year)
Promoted to Grade 9 2019 50% 43% 43% 38% 48% 38% - - - * 35% 50% 33%
18-19 AAR Page 348
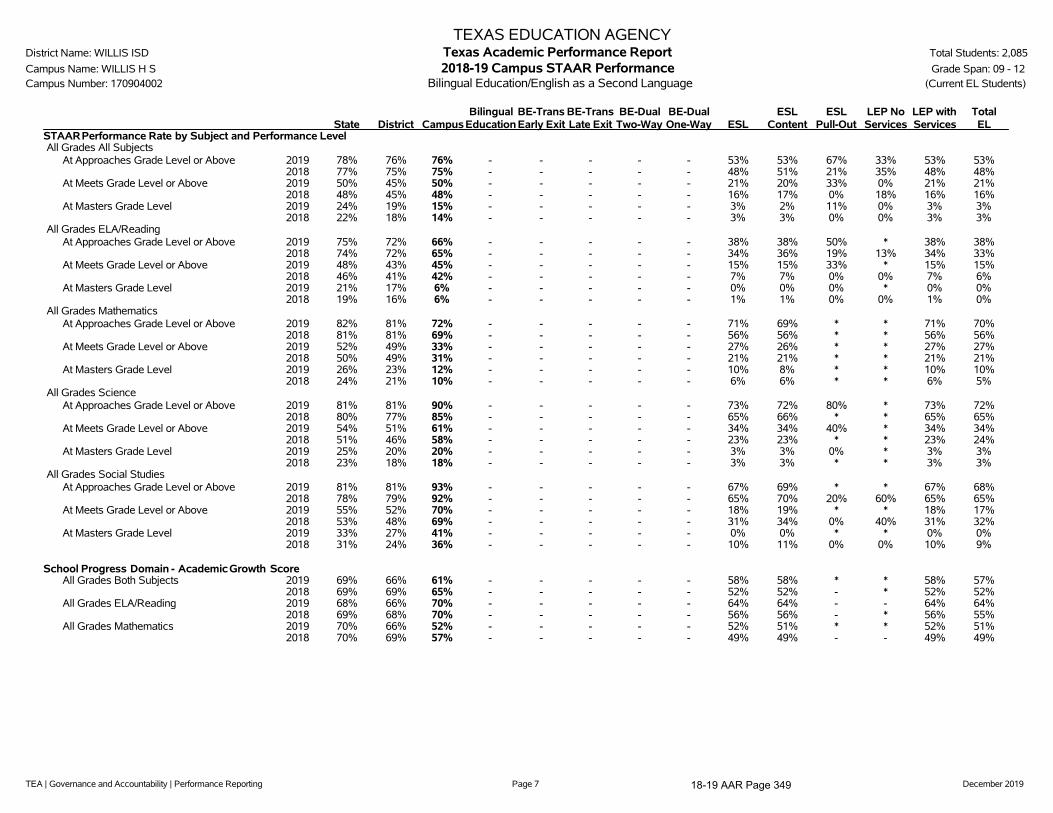
TEA | Governance and Accountability | Performance Reporting Page 7 December 2019
TEXAS EDUCATION AGENCYDistrict Name: WILLIS ISD Texas Academic Performance Report Total Students: 2,085
Campus Name: WILLIS H S 2018-19 Campus STAAR Performance Grade Span: 09 - 12Campus Number: 170904002 Bilingual Education/English as a Second Language (Current EL Students)
State District CampusBilingual
EducationBE-TransEarly Exit
BE-TransLate Exit
BE-DualTwo-Way
BE-DualOne-Way ESL
ESLContent
ESLPull-Out
LEP NoServices
LEP withServices
TotalEL
STAARPerformance Rate by Subject and Performance LevelAll Grades All Subjects
At Approaches Grade Level or Above 2019 78% 76% 76% - - - - - 53% 53% 67% 33% 53% 53%2018 77% 75% 75% - - - - - 48% 51% 21% 35% 48% 48%
At Meets Grade Level or Above 2019 50% 45% 50% - - - - - 21% 20% 33% 0% 21% 21%2018 48% 45% 48% - - - - - 16% 17% 0% 18% 16% 16%
At Masters Grade Level 2019 24% 19% 15% - - - - - 3% 2% 11% 0% 3% 3%2018 22% 18% 14% - - - - - 3% 3% 0% 0% 3% 3%
All Grades ELA/ReadingAt Approaches Grade Level or Above 2019 75% 72% 66% - - - - - 38% 38% 50% * 38% 38%
2018 74% 72% 65% - - - - - 34% 36% 19% 13% 34% 33%At Meets Grade Level or Above 2019 48% 43% 45% - - - - - 15% 15% 33% * 15% 15%
2018 46% 41% 42% - - - - - 7% 7% 0% 0% 7% 6%At Masters Grade Level 2019 21% 17% 6% - - - - - 0% 0% 0% * 0% 0%
2018 19% 16% 6% - - - - - 1% 1% 0% 0% 1% 0%All Grades Mathematics
At Approaches Grade Level or Above 2019 82% 81% 72% - - - - - 71% 69% * * 71% 70%2018 81% 81% 69% - - - - - 56% 56% * * 56% 56%
At Meets Grade Level or Above 2019 52% 49% 33% - - - - - 27% 26% * * 27% 27%2018 50% 49% 31% - - - - - 21% 21% * * 21% 21%
At Masters Grade Level 2019 26% 23% 12% - - - - - 10% 8% * * 10% 10%2018 24% 21% 10% - - - - - 6% 6% * * 6% 5%
All Grades ScienceAt Approaches Grade Level or Above 2019 81% 81% 90% - - - - - 73% 72% 80% * 73% 72%
2018 80% 77% 85% - - - - - 65% 66% * * 65% 65%At Meets Grade Level or Above 2019 54% 51% 61% - - - - - 34% 34% 40% * 34% 34%
2018 51% 46% 58% - - - - - 23% 23% * * 23% 24%At Masters Grade Level 2019 25% 20% 20% - - - - - 3% 3% 0% * 3% 3%
2018 23% 18% 18% - - - - - 3% 3% * * 3% 3%All Grades Social Studies
At Approaches Grade Level or Above 2019 81% 81% 93% - - - - - 67% 69% * * 67% 68%2018 78% 79% 92% - - - - - 65% 70% 20% 60% 65% 65%
At Meets Grade Level or Above 2019 55% 52% 70% - - - - - 18% 19% * * 18% 17%2018 53% 48% 69% - - - - - 31% 34% 0% 40% 31% 32%
At Masters Grade Level 2019 33% 27% 41% - - - - - 0% 0% * * 0% 0%2018 31% 24% 36% - - - - - 10% 11% 0% 0% 10% 9%
School Progress Domain - Academic Growth ScoreAll Grades Both Subjects 2019 69% 66% 61% - - - - - 58% 58% * * 58% 57%
2018 69% 69% 65% - - - - - 52% 52% - * 52% 52%All Grades ELA/Reading 2019 68% 66% 70% - - - - - 64% 64% - - 64% 64%
2018 69% 68% 70% - - - - - 56% 56% - * 56% 55%All Grades Mathematics 2019 70% 66% 52% - - - - - 52% 51% * * 52% 51%
2018 70% 69% 57% - - - - - 49% 49% - - 49% 49%
18-19 AAR Page 349

TEA | Governance and Accountability | Performance Reporting Page 8 December 2019
TEXAS EDUCATION AGENCYDistrict Name: WILLIS ISD Texas Academic Performance Report Total Students: 2,085
Campus Name: WILLIS H S 2018-19 Campus STAAR Participation Grade Span: 09 - 12Campus Number: 170904002 School Type: High School
State District CampusAfrican
American Hispanic WhiteAmerican
Indian AsianPacific
Islander
Two orMore
RacesSpecial
EdEcon
DisadvEL
(Current)2019 STAARParticipation
(All Grades)
All TestsAssessment Participant 99% 100% 99% 97% 99% 99% 100% 100% * 98% 100% 98% 100%
Included in Accountability 94% 94% 92% 92% 92% 93% 83% 69% * 94% 91% 92% 86%Not Included in Accountability
Mobile 4% 5% 5% 5% 3% 6% 17% 13% * 4% 8% 4% 2%Other Exclusions 1% 1% 2% 0% 4% 0% 0% 19% * 0% 1% 2% 11%
Not Tested 1% 0% 1% 3% 1% 1% 0% 0% * 2% 0% 2% 0%Absent 1% 0% 1% 3% 1% 1% 0% 0% * 2% 0% 2% 0%Other 0% 0% 0% 0% 0% 0% 0% 0% * 0% 0% 0% 0%
2018 STAARParticipation(All Grades)
All TestsAssessment Participant 99% 100% 99% 99% 99% 100% 100% 100% * 99% 99% 99% 99%
Included in Accountability 94% 93% 93% 86% 93% 94% 100% 93% * 97% 85% 92% 90%Not Included in Accountability
Mobile 4% 6% 5% 13% 4% 5% 0% 0% * 2% 13% 6% 3%Other Exclusions 1% 0% 1% 0% 2% 0% 0% 7% * 0% 1% 1% 6%
Not Tested 1% 0% 1% 1% 1% 0% 0% 0% * 1% 1% 1% 1%Absent 1% 0% 1% 1% 1% 0% 0% 0% * 1% 1% 1% 1%Other 0% 0% 0% 0% 0% 0% 0% 0% * 0% 0% 0% 0%
18-19 AAR Page 350
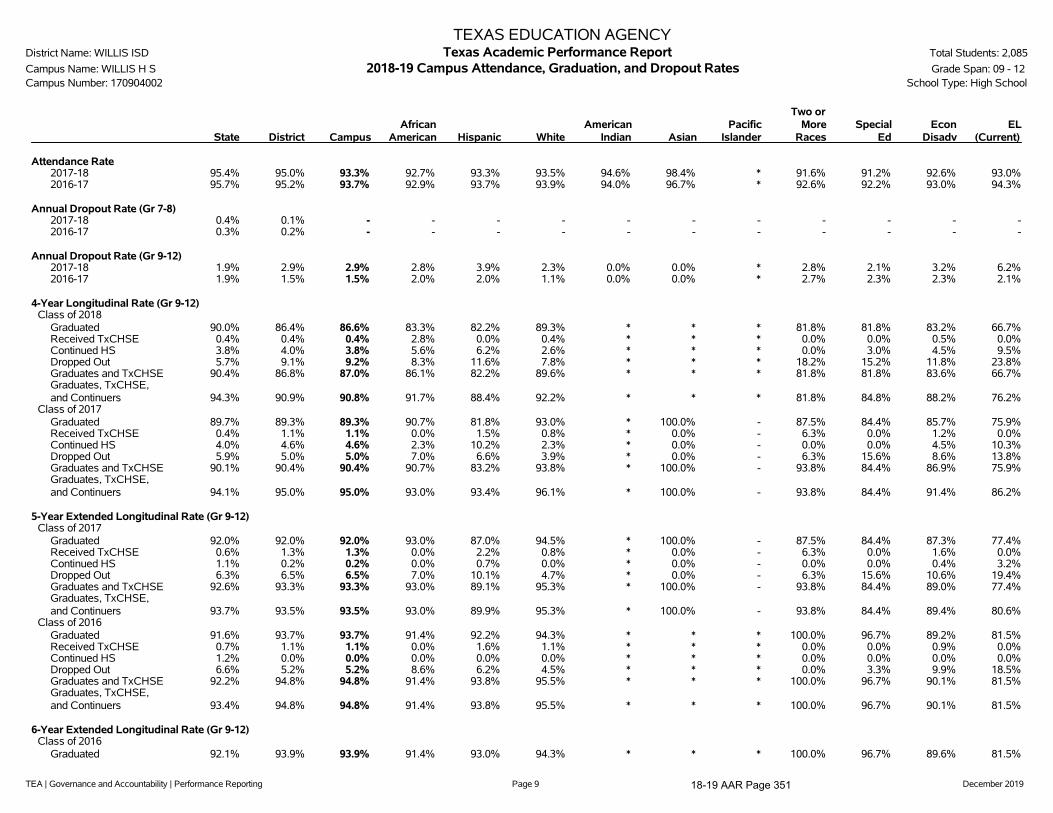
TEA | Governance and Accountability | Performance Reporting Page 9 December 2019
TEXAS EDUCATION AGENCYDistrict Name: WILLIS ISD Texas Academic Performance Report Total Students: 2,085
Campus Name: WILLIS H S 2018-19 Campus Attendance, Graduation, and Dropout Rates Grade Span: 09 - 12Campus Number: 170904002 School Type: High School
State District CampusAfrican
American Hispanic WhiteAmerican
Indian AsianPacific
Islander
Two orMore
RacesSpecial
EdEcon
DisadvEL
(Current)
Attendance Rate2017-18 95.4% 95.0% 93.3% 92.7% 93.3% 93.5% 94.6% 98.4% * 91.6% 91.2% 92.6% 93.0%2016-17 95.7% 95.2% 93.7% 92.9% 93.7% 93.9% 94.0% 96.7% * 92.6% 92.2% 93.0% 94.3%
Annual Dropout Rate (Gr 7-8)2017-18 0.4% 0.1% - - - - - - - - - - -2016-17 0.3% 0.2% - - - - - - - - - - -
Annual Dropout Rate (Gr 9-12)2017-18 1.9% 2.9% 2.9% 2.8% 3.9% 2.3% 0.0% 0.0% * 2.8% 2.1% 3.2% 6.2%2016-17 1.9% 1.5% 1.5% 2.0% 2.0% 1.1% 0.0% 0.0% * 2.7% 2.3% 2.3% 2.1%
4-Year Longitudinal Rate (Gr 9-12)Class of 2018
Graduated 90.0% 86.4% 86.6% 83.3% 82.2% 89.3% * * * 81.8% 81.8% 83.2% 66.7%Received TxCHSE 0.4% 0.4% 0.4% 2.8% 0.0% 0.4% * * * 0.0% 0.0% 0.5% 0.0%Continued HS 3.8% 4.0% 3.8% 5.6% 6.2% 2.6% * * * 0.0% 3.0% 4.5% 9.5%Dropped Out 5.7% 9.1% 9.2% 8.3% 11.6% 7.8% * * * 18.2% 15.2% 11.8% 23.8%Graduates and TxCHSE 90.4% 86.8% 87.0% 86.1% 82.2% 89.6% * * * 81.8% 81.8% 83.6% 66.7%Graduates, TxCHSE,and Continuers 94.3% 90.9% 90.8% 91.7% 88.4% 92.2% * * * 81.8% 84.8% 88.2% 76.2%
Class of 2017Graduated 89.7% 89.3% 89.3% 90.7% 81.8% 93.0% * 100.0% - 87.5% 84.4% 85.7% 75.9%Received TxCHSE 0.4% 1.1% 1.1% 0.0% 1.5% 0.8% * 0.0% - 6.3% 0.0% 1.2% 0.0%Continued HS 4.0% 4.6% 4.6% 2.3% 10.2% 2.3% * 0.0% - 0.0% 0.0% 4.5% 10.3%Dropped Out 5.9% 5.0% 5.0% 7.0% 6.6% 3.9% * 0.0% - 6.3% 15.6% 8.6% 13.8%Graduates and TxCHSE 90.1% 90.4% 90.4% 90.7% 83.2% 93.8% * 100.0% - 93.8% 84.4% 86.9% 75.9%Graduates, TxCHSE,and Continuers 94.1% 95.0% 95.0% 93.0% 93.4% 96.1% * 100.0% - 93.8% 84.4% 91.4% 86.2%
5-Year Extended Longitudinal Rate (Gr 9-12)Class of 2017
Graduated 92.0% 92.0% 92.0% 93.0% 87.0% 94.5% * 100.0% - 87.5% 84.4% 87.3% 77.4%Received TxCHSE 0.6% 1.3% 1.3% 0.0% 2.2% 0.8% * 0.0% - 6.3% 0.0% 1.6% 0.0%Continued HS 1.1% 0.2% 0.2% 0.0% 0.7% 0.0% * 0.0% - 0.0% 0.0% 0.4% 3.2%Dropped Out 6.3% 6.5% 6.5% 7.0% 10.1% 4.7% * 0.0% - 6.3% 15.6% 10.6% 19.4%Graduates and TxCHSE 92.6% 93.3% 93.3% 93.0% 89.1% 95.3% * 100.0% - 93.8% 84.4% 89.0% 77.4%Graduates, TxCHSE,and Continuers 93.7% 93.5% 93.5% 93.0% 89.9% 95.3% * 100.0% - 93.8% 84.4% 89.4% 80.6%
Class of 2016Graduated 91.6% 93.7% 93.7% 91.4% 92.2% 94.3% * * * 100.0% 96.7% 89.2% 81.5%Received TxCHSE 0.7% 1.1% 1.1% 0.0% 1.6% 1.1% * * * 0.0% 0.0% 0.9% 0.0%Continued HS 1.2% 0.0% 0.0% 0.0% 0.0% 0.0% * * * 0.0% 0.0% 0.0% 0.0%Dropped Out 6.6% 5.2% 5.2% 8.6% 6.2% 4.5% * * * 0.0% 3.3% 9.9% 18.5%Graduates and TxCHSE 92.2% 94.8% 94.8% 91.4% 93.8% 95.5% * * * 100.0% 96.7% 90.1% 81.5%Graduates, TxCHSE,and Continuers 93.4% 94.8% 94.8% 91.4% 93.8% 95.5% * * * 100.0% 96.7% 90.1% 81.5%
6-Year Extended Longitudinal Rate (Gr 9-12)Class of 2016
Graduated 92.1% 93.9% 93.9% 91.4% 93.0% 94.3% * * * 100.0% 96.7% 89.6% 81.5%
18-19 AAR Page 351

TEA | Governance and Accountability | Performance Reporting Page 10 December 2019
TEXAS EDUCATION AGENCYDistrict Name: WILLIS ISD Texas Academic Performance Report Total Students: 2,085
Campus Name: WILLIS H S 2018-19 Campus Attendance, Graduation, and Dropout Rates Grade Span: 09 - 12Campus Number: 170904002 School Type: High School
State District CampusAfrican
American Hispanic WhiteAmerican
Indian AsianPacific
Islander
Two orMore
RacesSpecial
EdEcon
DisadvEL
(Current)Received TxCHSE 0.8% 1.1% 1.1% 0.0% 1.6% 1.1% * * * 0.0% 0.0% 0.9% 0.0%Continued HS 0.5% 0.0% 0.0% 0.0% 0.0% 0.0% * * * 0.0% 0.0% 0.0% 0.0%Dropped Out 6.6% 5.0% 5.0% 8.6% 5.5% 4.5% * * * 0.0% 3.3% 9.4% 18.5%Graduates and TxCHSE 92.9% 95.0% 95.0% 91.4% 94.5% 95.5% * * * 100.0% 96.7% 90.6% 81.5%Graduates, TxCHSE,and Continuers 93.4% 95.0% 95.0% 91.4% 94.5% 95.5% * * * 100.0% 96.7% 90.6% 81.5%
Class of 2015Graduated 91.8% 93.3% 93.3% 96.9% 92.4% 93.2% * 83.3% * 100.0% 76.0% 90.3% 93.8%Received TxCHSE 1.0% 1.4% 1.4% 0.0% 0.8% 1.7% * 16.7% * 0.0% 0.0% 1.0% 0.0%Continued HS 0.6% 0.2% 0.2% 0.0% 0.8% 0.0% * 0.0% * 0.0% 0.0% 0.5% 0.0%Dropped Out 6.7% 5.0% 5.0% 3.1% 6.1% 5.1% * 0.0% * 0.0% 24.0% 8.2% 6.3%Graduates and TxCHSE 92.8% 94.7% 94.7% 96.9% 93.2% 94.9% * 100.0% * 100.0% 76.0% 91.3% 93.8%Graduates, TxCHSE,and Continuers 93.3% 95.0% 95.0% 96.9% 93.9% 94.9% * 100.0% * 100.0% 76.0% 91.8% 93.8%
4-Year Federal Graduation Rate Without Exclusions (Gr 9-12)Class of 2018 90.0% 85.5% 85.7% 81.1% 80.0% 89.3% * * * 81.8% 79.4% 82.4% 66.7%Class of 2017 89.7% 88.6% 88.6% 88.6% 81.2% 92.3% * 100.0% - 87.5% 84.4% 85.0% 73.3%
RHSP/DAP Graduates (Longitudinal Rate)Class of 2018 68.5% * * - - - - - - * - * -Class of 2017 88.5% 89.1% 89.1% 84.2% 92.8% 87.2% * 100.0% - 100.0% 12.0% 85.1% 95.5%
FHSP-E Graduates (Longitudinal Rate)Class of 2018 5.0% 2.0% 2.0% 0.0% 1.7% 2.5% * * * 0.0% 14.8% 1.1% 0.0%Class of 2017 6.0% 0.0% 0.0% * * 0.0% - - - - * 0.0% -
FHSP-DLA Graduates (Longitudinal Rate)Class of 2018 82.0% 87.4% 87.4% 93.3% 88.3% 86.3% * * * 87.5% 0.0% 85.7% 78.6%Class of 2017 60.8% 14.3% 14.3% * * 20.0% - - - - * 14.3% -
RHSP/DAP/FHSP-E/FHSP-DLA Graduates (Longitudinal Rate)Class of 2018 86.8% 89.2% 89.2% 93.3% 90.0% 88.8% * * * 77.8% 14.8% 86.3% 78.6%Class of 2017 85.9% 87.8% 87.8% 82.1% 92.0% 85.8% * 100.0% - 100.0% 11.1% 82.8% 95.5%
RHSP/DAP Graduates (Annual Rate)2017-18 37.7% 37.5% 37.5% * * * - - - * - * -2016-17 87.2% 87.0% 87.0% 78.0% 90.4% 85.8% * 100.0% - 100.0% 11.5% 83.1% 95.5%
FHSP-E Graduates (Annual Rate)2017-18 4.9% 1.7% 1.7% 0.0% 1.6% 2.0% * * * 0.0% 14.8% 1.1% 0.0%2016-17 7.2% 11.1% 11.1% * * 16.7% - - - - * 0.0% -
FHSP-DLA Graduates (Annual Rate)2017-18 81.5% 87.2% 87.2% 93.3% 86.3% 86.9% * * * 87.5% 0.0% 84.8% 75.0%2016-17 56.5% 22.2% 22.2% * * 16.7% - - - - * 28.6% -
RHSP/DAP/FHSP-E/FHSP-DLA Graduates (Annual Rate)2017-18 85.1% 87.9% 87.9% 90.3% 86.7% 88.7% * * * 77.8% 14.8% 85.1% 75.0%2016-17 84.0% 85.9% 85.9% 76.2% 89.7% 84.5% * 100.0% - 100.0% 10.7% 81.1% 95.5%
18-19 AAR Page 352

TEA | Governance and Accountability | Performance Reporting Page 11 December 2019
TEXAS EDUCATION AGENCYDistrict Name: WILLIS ISD Texas Academic Performance Report Total Students: 2,085
Campus Name: WILLIS H S 2018-19 Campus Graduation Profile Grade Span: 09 - 12Campus Number: 170904002 School Type: High School
CampusCount
CampusPercent
DistrictCount
StateCount
Graduates (2017-18 Annual Graduates)Total Graduates 422 100.0% 422 347,893
By Ethnicity:African American 31 7.3% 31 43,502Hispanic 128 30.3% 128 173,272White 247 58.5% 247 107,052American Indian 3 0.7% 3 1,226Asian 2 0.5% 2 15,589Pacific Islander 2 0.5% 2 528Two or More Races 9 2.1% 9 6,724
By Graduation Type:Minimum H.S. Program 5 1.2% 5 5,855Recommended H.S. Program/Distinguished Achievement Program 3 0.7% 3 3,538Foundation H.S. Program (No Endorsement) 46 10.9% 46 49,432Foundation H.S. Program (Endorsement) 7 1.7% 7 16,542Foundation H.S. Program (DLA) 361 85.5% 361 272,526
Special Education Graduates 27 6.4% 27 25,962Economically Disadvantaged Graduates 181 42.9% 181 166,956LEP Graduates 16 3.8% 16 21,359At-Risk Graduates 137 32.5% 137 144,805
18-19 AAR Page 353
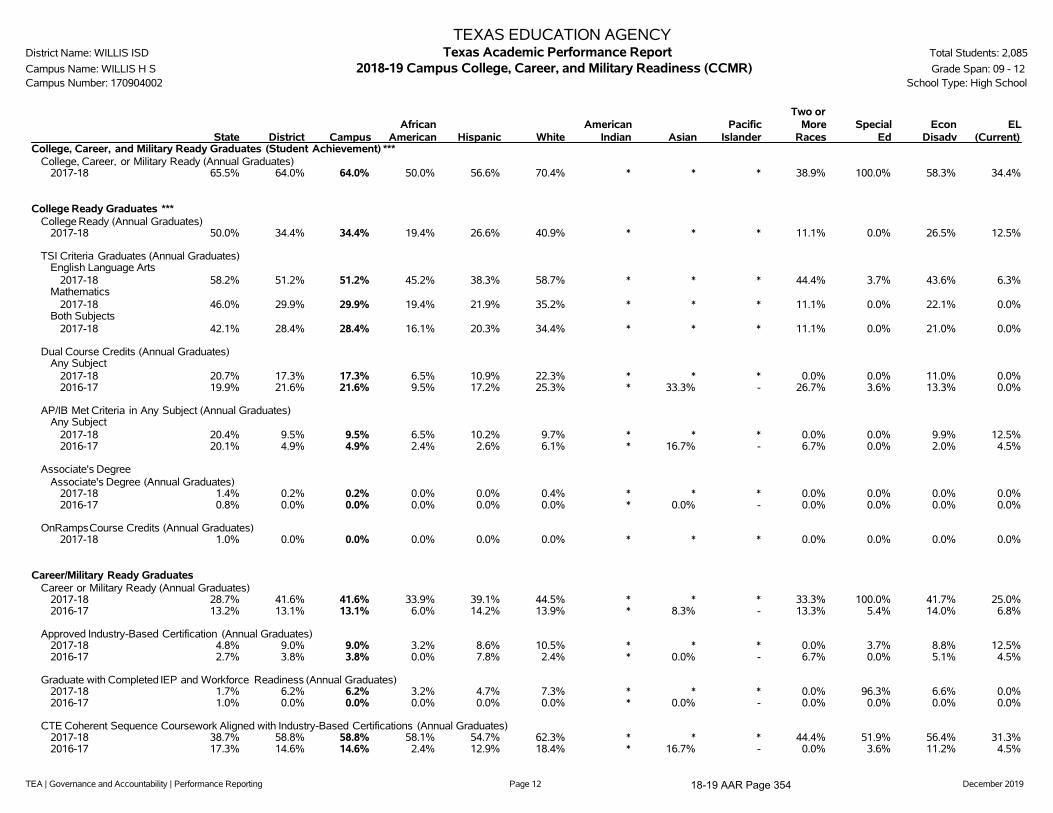
TEA | Governance and Accountability | Performance Reporting Page 12 December 2019
TEXAS EDUCATION AGENCYDistrict Name: WILLIS ISD Texas Academic Performance Report Total Students: 2,085
Campus Name: WILLIS H S 2018-19 Campus College, Career, and Military Readiness (CCMR) Grade Span: 09 - 12Campus Number: 170904002 School Type: High School
State District CampusAfrican
American Hispanic WhiteAmerican
Indian AsianPacific
Islander
Two orMore
RacesSpecial
EdEcon
DisadvEL
(Current)College, Career, and Military Ready Graduates (Student Achievement) ***
College, Career, or Military Ready (Annual Graduates)2017-18 65.5% 64.0% 64.0% 50.0% 56.6% 70.4% * * * 38.9% 100.0% 58.3% 34.4%
College Ready Graduates ***College Ready (Annual Graduates)
2017-18 50.0% 34.4% 34.4% 19.4% 26.6% 40.9% * * * 11.1% 0.0% 26.5% 12.5%
TSI Criteria Graduates (Annual Graduates)English Language Arts
2017-18 58.2% 51.2% 51.2% 45.2% 38.3% 58.7% * * * 44.4% 3.7% 43.6% 6.3%Mathematics
2017-18 46.0% 29.9% 29.9% 19.4% 21.9% 35.2% * * * 11.1% 0.0% 22.1% 0.0%Both Subjects
2017-18 42.1% 28.4% 28.4% 16.1% 20.3% 34.4% * * * 11.1% 0.0% 21.0% 0.0%
Dual Course Credits (Annual Graduates)Any Subject
2017-18 20.7% 17.3% 17.3% 6.5% 10.9% 22.3% * * * 0.0% 0.0% 11.0% 0.0%2016-17 19.9% 21.6% 21.6% 9.5% 17.2% 25.3% * 33.3% - 26.7% 3.6% 13.3% 0.0%
AP/IB Met Criteria in Any Subject (Annual Graduates)Any Subject
2017-18 20.4% 9.5% 9.5% 6.5% 10.2% 9.7% * * * 0.0% 0.0% 9.9% 12.5%2016-17 20.1% 4.9% 4.9% 2.4% 2.6% 6.1% * 16.7% - 6.7% 0.0% 2.0% 4.5%
Associate's DegreeAssociate's Degree (Annual Graduates)
2017-18 1.4% 0.2% 0.2% 0.0% 0.0% 0.4% * * * 0.0% 0.0% 0.0% 0.0%2016-17 0.8% 0.0% 0.0% 0.0% 0.0% 0.0% * 0.0% - 0.0% 0.0% 0.0% 0.0%
OnRampsCourse Credits (Annual Graduates)2017-18 1.0% 0.0% 0.0% 0.0% 0.0% 0.0% * * * 0.0% 0.0% 0.0% 0.0%
Career/Military Ready GraduatesCareer or Military Ready (Annual Graduates)
2017-18 28.7% 41.6% 41.6% 33.9% 39.1% 44.5% * * * 33.3% 100.0% 41.7% 25.0%2016-17 13.2% 13.1% 13.1% 6.0% 14.2% 13.9% * 8.3% - 13.3% 5.4% 14.0% 6.8%
Approved Industry-Based Certification (Annual Graduates)2017-18 4.8% 9.0% 9.0% 3.2% 8.6% 10.5% * * * 0.0% 3.7% 8.8% 12.5%2016-17 2.7% 3.8% 3.8% 0.0% 7.8% 2.4% * 0.0% - 6.7% 0.0% 5.1% 4.5%
Graduate with Completed IEP and Workforce Readiness (Annual Graduates)2017-18 1.7% 6.2% 6.2% 3.2% 4.7% 7.3% * * * 0.0% 96.3% 6.6% 0.0%2016-17 1.0% 0.0% 0.0% 0.0% 0.0% 0.0% * 0.0% - 0.0% 0.0% 0.0% 0.0%
CTE Coherent Sequence Coursework Aligned with Industry-Based Certifications (Annual Graduates)2017-18 38.7% 58.8% 58.8% 58.1% 54.7% 62.3% * * * 44.4% 51.9% 56.4% 31.3%2016-17 17.3% 14.6% 14.6% 2.4% 12.9% 18.4% * 16.7% - 0.0% 3.6% 11.2% 4.5%
18-19 AAR Page 354

TEA | Governance and Accountability | Performance Reporting Page 13 December 2019
TEXAS EDUCATION AGENCYDistrict Name: WILLIS ISD Texas Academic Performance Report Total Students: 2,085
Campus Name: WILLIS H S 2018-19 Campus College, Career, and Military Readiness (CCMR) Grade Span: 09 - 12Campus Number: 170904002 School Type: High School
State District CampusAfrican
American Hispanic WhiteAmerican
Indian AsianPacific
Islander
Two orMore
RacesSpecial
EdEcon
DisadvEL
(Current)
U.S. Armed Forces Enlistment (Annual Graduates)2017-18 4.3% 3.3% 3.3% 0.0% 3.1% 3.6% * * * 11.1% 0.0% 3.9% 0.0%2016-17 2.2% 2.8% 2.8% 4.8% 1.7% 2.9% * 0.0% - 6.7% 3.6% 4.1% 0.0%
Graduates under an Advanced Degree Plan and Identified as a current Special Education Student (Annual Graduates)2017-18 2.6% 0.9% 0.9% 0.0% 1.6% 0.8% * * * 0.0% 14.8% 0.6% 0.0%
Graduates with Level I or Level II Certificate (Annual Graduates)2017-18 0.6% 0.0% 0.0% 0.0% 0.0% 0.0% * * * 0.0% 0.0% 0.0% 0.0%2016-17 0.5% 0.0% 0.0% 0.0% 0.0% 0.0% * 0.0% - 0.0% 0.0% 0.0% 0.0%
18-19 AAR Page 355

TEA | Governance and Accountability | Performance Reporting Page 14 December 2019
TEXAS EDUCATION AGENCYDistrict Name: WILLIS ISD Texas Academic Performance Report Total Students: 2,085
Campus Name: WILLIS H S 2018-19 Campus CCMR-Related Indicators Grade Span: 09 - 12Campus Number: 170904002 School Type: High School
State District CampusAfrican
American Hispanic WhiteAmerican
Indian AsianPacific
Islander
Two orMore
RacesSpecial
EdEcon
DisadvEL
(Current)TSIA Results (Graduates >= Criterion) (Annual Graduates)
Reading2017-18 32.1% 36.5% 36.5% 32.3% 28.9% 42.5% * * * 0.0% 3.7% 29.8% 0.0%2016-17 23.4% 11.3% 11.3% 11.9% 11.2% 11.0% * 16.7% - 13.3% 3.6% 10.7% 4.5%
Mathematics2017-18 23.7% 21.8% 21.8% 16.1% 17.2% 25.9% * * * 0.0% 0.0% 17.1% 0.0%2016-17 19.8% 11.3% 11.3% 16.7% 10.3% 11.0% * 0.0% - 13.3% 0.0% 10.2% 4.5%
Both Subjects2017-18 18.1% 17.8% 17.8% 12.9% 15.6% 20.2% * * * 0.0% 0.0% 14.9% 0.0%2016-17 12.9% 5.4% 5.4% 9.5% 6.0% 4.5% * 0.0% - 6.7% 0.0% 5.6% 4.5%
CTE Coherent Sequence (Annual Graduates)2017-18 58.4% 61.8% 61.8% 61.3% 57.8% 65.6% * * * 44.4% 51.9% 59.1% 43.8%2016-17 50.5% 30.1% 30.1% 19.0% 29.3% 32.7% * 16.7% - 26.7% 7.1% 26.5% 31.8%
Completed and Received Credit for College Prep Courses (Annual Graduates)English Language Arts
2017-18 2.0% 0.0% 0.0% 0.0% 0.0% 0.0% * * * 0.0% 0.0% 0.0% 0.0%2016-17 0.8% 0.0% 0.0% 0.0% 0.0% 0.0% * 0.0% - 0.0% 0.0% 0.0% 0.0%
Mathematics2017-18 3.9% 0.0% 0.0% 0.0% 0.0% 0.0% * * * 0.0% 0.0% 0.0% 0.0%2016-17 1.4% 0.0% 0.0% 0.0% 0.0% 0.0% * 0.0% - 0.0% 0.0% 0.0% 0.0%
Both Subjects2017-18 0.9% 0.0% 0.0% 0.0% 0.0% 0.0% * * * 0.0% 0.0% 0.0% 0.0%2016-17 0.2% 0.0% 0.0% 0.0% 0.0% 0.0% * 0.0% - 0.0% 0.0% 0.0% 0.0%
AP/IB Results (Participation) (Grades 11-12)All Subjects
2018 25.8% 10.3% 10.3% 9.1% 9.0% 11.4% * 30.0% * 3.8% n/a 9.0% n/a2017 26.2% 12.1% 12.1% 6.0% 8.9% 14.6% * 42.9% * 3.8% n/a 7.5% n/a
English Language Arts2018 15.3% 6.5% 6.5% 6.5% 5.1% 7.4% * 10.0% * 3.8% n/a 5.4% n/a2017 15.9% 5.8% 5.8% 3.6% 4.3% 7.2% * 14.3% * 0.0% n/a 3.7% n/a
Mathematics2018 7.3% 0.8% 0.8% 0.0% 0.0% 1.3% * 10.0% * 0.0% n/a 0.2% n/a2017 7.2% 0.8% 0.8% 0.0% 0.4% 1.1% * 0.0% * 0.0% n/a 0.2% n/a
Science2018 10.8% 4.4% 4.4% 2.6% 2.3% 5.5% * 30.0% * 3.8% n/a 3.8% n/a2017 10.9% 4.2% 4.2% 1.2% 1.4% 5.5% * 42.9% * 3.8% n/a 2.1% n/a
Social Studies2018 14.5% 4.9% 4.9% 3.9% 3.9% 5.9% * 10.0% * 0.0% n/a 3.8% n/a2017 15.0% 8.8% 8.8% 3.6% 5.4% 11.4% * 28.6% * 3.8% n/a 4.8% n/a
AP/IB Results (Examinees >= Criterion) (Grades 11-12)All Subjects
2018 50.7% 48.5% 48.5% 28.6% 46.4% 50.0% - * - * n/a 55.8% n/a2017 49.1% 39.3% 39.3% 40.0% 44.0% 39.0% * * - * n/a 38.9% n/a
English Language Arts2018 42.5% 33.9% 33.9% 40.0% 18.8% 35.9% - * - * n/a 26.9% n/a2017 41.3% 38.9% 38.9% * 16.7% 47.4% - * - - n/a 27.8% n/a
Mathematics2018 52.8% 12.5% 12.5% - - 14.3% - * - - n/a * n/a
18-19 AAR Page 356

TEA | Governance and Accountability | Performance Reporting Page 15 December 2019
TEXAS EDUCATION AGENCYDistrict Name: WILLIS ISD Texas Academic Performance Report Total Students: 2,085
Campus Name: WILLIS H S 2018-19 Campus CCMR-Related Indicators Grade Span: 09 - 12Campus Number: 170904002 School Type: High School
State District CampusAfrican
American Hispanic WhiteAmerican
Indian AsianPacific
Islander
Two orMore
RacesSpecial
EdEcon
DisadvEL
(Current)2017 51.3% 14.3% 14.3% - * 16.7% - - - - n/a * n/a
Science2018 38.0% 21.4% 21.4% * 28.6% 20.7% - * - * n/a 33.3% n/a2017 38.3% 15.4% 15.4% * * 13.8% * * - * n/a 10.0% n/a
Social Studies2018 44.6% 51.1% 51.1% * 33.3% 58.1% - * - - n/a 55.6% n/a2017 41.4% 37.8% 37.8% * 40.0% 38.3% * * - * n/a 26.1% n/a
SAT/ACT Results (Annual Graduates) ***Tested
2017-18 74.6% 51.7% 51.7% 77.4% 40.6% 54.3% * * * 55.6% n/a 45.0% n/a2016-17 73.5% 53.6% 53.6% 71.4% 45.7% 53.5% 100.0% 100.0% - 46.7% n/a 42.3% n/a
At/Above Criterion2017-18 37.9% 33.0% 33.0% 12.5% 32.7% 36.6% * * * 20.0% n/a 29.1% n/a
Average SAT Score (Annual Graduates) ***All Subjects
2017-18 1036 1028 1028 969 996 1051 * * * 974 n/a 998 n/aEnglish Language Artsand Writing
2017-18 521 527 527 492 505 543 * * * 516 n/a 514 n/aMathematics
2017-18 515 500 500 477 492 508 * * * 458 n/a 483 n/a
Average ACT Score (Annual Graduates) ***All Subjects
2017-18 20.6 20.0 20.0 15.7 18.7 21.5 * - - - n/a 18.4 n/aEnglish Language Arts
2017-18 20.3 19.6 19.6 14.8 18.8 21.1 * - - - n/a 18.0 n/aMathematics
2017-18 20.6 19.4 19.4 15.4 17.8 20.9 * - - - n/a 17.9 n/aScience
2017-18 20.9 20.8 20.8 17.1 18.7 22.4 * - - - n/a 19.1 n/a
18-19 AAR Page 357

TEA | Governance and Accountability | Performance Reporting Page 16 December 2019
TEXAS EDUCATION AGENCYDistrict Name: WILLIS ISD Texas Academic Performance Report Total Students: 2,085
Campus Name: WILLIS H S 2018-19 Campus Other Postsecondary Indicators Grade Span: 09 - 12Campus Number: 170904002 School Type: High School
State District CampusAfrican
American Hispanic WhiteAmerican
Indian AsianPacific
Islander
Two orMore
RacesSpecial
EdEcon
DisadvEL
(Current)Advanced Dual-Credit Course Completion (Grades 9-12)
Any Subject2017-18 43.4% 32.6% 32.6% 26.3% 26.6% 37.5% 42.9% 66.7% * 23.3% 4.8% 25.2% 11.4%2016-17 37.1% 19.8% 19.8% 13.8% 16.5% 22.4% 33.3% 45.5% * 17.2% 4.2% 15.1% 9.9%
English Language Arts2017-18 17.3% 13.8% 13.9% 9.9% 9.9% 17.1% 0.0% 41.7% * 10.2% 0.0% 9.1% 0.6%2016-17 16.8% 13.1% 13.1% 11.4% 9.9% 15.4% 16.7% 18.2% * 9.5% 0.7% 8.0% 1.7%
Mathematics2017-18 20.7% 13.2% 13.2% 7.6% 10.2% 16.1% 20.0% 50.0% * 5.4% 0.8% 8.7% 0.6%2016-17 19.5% 12.1% 12.1% 7.8% 8.7% 14.4% 16.7% 42.9% * 11.1% 0.0% 7.7% 3.4%
Science2017-18 21.2% 19.7% 19.6% 18.0% 15.2% 22.7% 28.6% 50.0% * 13.8% 3.9% 15.2% 6.5%2016-17 5.7% 5.4% 5.4% 4.8% 3.0% 7.0% * 11.8% * 5.4% 0.0% 2.7% 0.0%
Social Studies2017-18 22.8% 11.7% 11.7% 8.7% 9.0% 14.4% 14.3% 16.7% * 3.6% 0.0% 7.5% 0.6%2016-17 21.8% 10.8% 10.8% 8.0% 6.6% 14.1% 16.7% 9.5% * 8.5% 0.0% 6.4% 1.7%
Graduates Enrolled in Texas Institution of Higher Education (TX IHE)2016-17 54.6% 48.0% 48.0% 45.2% 47.4% 47.3% * 100.0% - 46.7% 17.9% 38.2% 40.9%2015-16 54.7% 49.1% 49.1% 56.7% 43.4% 51.2% * * * 28.6% 10.0% 40.4% 21.7%
Graduates in TX IHE Completing One Year Without Enrollment in a Developmental Education Course2016-17 59.2% 54.6% 54.6% 52.6% 39.6% 60.9% * 50.0% - 71.4% 20.0% 43.2% 11.1%2015-16 55.7% 55.5% 55.5% 31.3% 41.8% 65.0% * * * * * 37.3% 0.0%
18-19 AAR Page 358
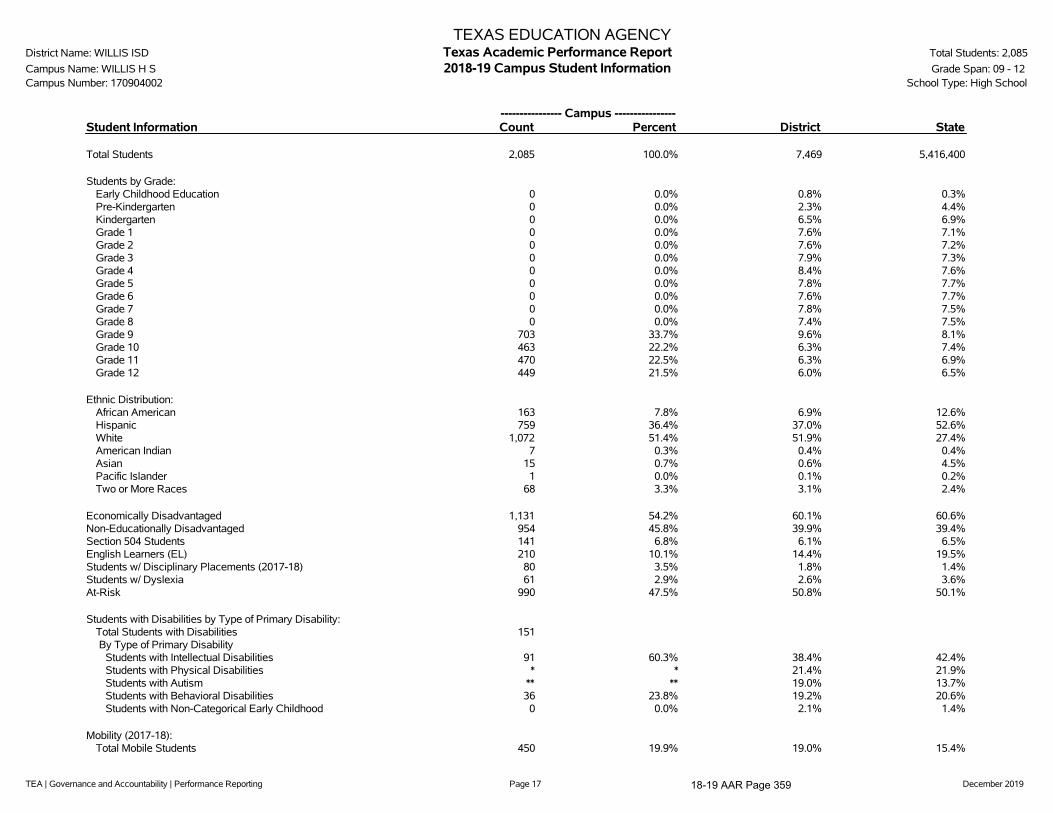
TEA | Governance and Accountability | Performance Reporting Page 17 December 2019
TEXAS EDUCATION AGENCYDistrict Name: WILLIS ISD Texas Academic Performance Report Total Students: 2,085
Campus Name: WILLIS H S 2018-19 Campus Student Information Grade Span: 09 - 12Campus Number: 170904002 School Type: High School
---------------- Campus ----------------Student Information Count Percent District State
Total Students 2,085 100.0% 7,469 5,416,400
Students by Grade:Early Childhood Education 0 0.0% 0.8% 0.3%Pre-Kindergarten 0 0.0% 2.3% 4.4%Kindergarten 0 0.0% 6.5% 6.9%Grade 1 0 0.0% 7.6% 7.1%Grade 2 0 0.0% 7.6% 7.2%Grade 3 0 0.0% 7.9% 7.3%Grade 4 0 0.0% 8.4% 7.6%Grade 5 0 0.0% 7.8% 7.7%Grade 6 0 0.0% 7.6% 7.7%Grade 7 0 0.0% 7.8% 7.5%Grade 8 0 0.0% 7.4% 7.5%Grade 9 703 33.7% 9.6% 8.1%Grade 10 463 22.2% 6.3% 7.4%Grade 11 470 22.5% 6.3% 6.9%Grade 12 449 21.5% 6.0% 6.5%
Ethnic Distribution:African American 163 7.8% 6.9% 12.6%Hispanic 759 36.4% 37.0% 52.6%White 1,072 51.4% 51.9% 27.4%American Indian 7 0.3% 0.4% 0.4%Asian 15 0.7% 0.6% 4.5%Pacific Islander 1 0.0% 0.1% 0.2%Two or More Races 68 3.3% 3.1% 2.4%
Economically Disadvantaged 1,131 54.2% 60.1% 60.6%Non-Educationally Disadvantaged 954 45.8% 39.9% 39.4%Section 504 Students 141 6.8% 6.1% 6.5%English Learners (EL) 210 10.1% 14.4% 19.5%Students w/ Disciplinary Placements (2017-18) 80 3.5% 1.8% 1.4%Students w/ Dyslexia 61 2.9% 2.6% 3.6%At-Risk 990 47.5% 50.8% 50.1%
Students with Disabilities by Type of Primary Disability:Total Students with Disabilities 151By Type of Primary Disability
Students with Intellectual Disabilities 91 60.3% 38.4% 42.4%Students with Physical Disabilities * * 21.4% 21.9%Students with Autism ** ** 19.0% 13.7%Students with Behavioral Disabilities 36 23.8% 19.2% 20.6%Students with Non-Categorical Early Childhood 0 0.0% 2.1% 1.4%
Mobility (2017-18):Total Mobile Students 450 19.9% 19.0% 15.4%
18-19 AAR Page 359

TEA | Governance and Accountability | Performance Reporting Page 18 December 2019
TEXAS EDUCATION AGENCYDistrict Name: WILLIS ISD Texas Academic Performance Report Total Students: 2,085
Campus Name: WILLIS H S 2018-19 Campus Student Information Grade Span: 09 - 12Campus Number: 170904002 School Type: High School
---------------- Campus ----------------Student Information Count Percent District State
By Ethnicity:African American 79 3.5%Hispanic 133 5.9%White 218 9.6%American Indian 2 0.1%Asian 1 0.0%Pacific Islander 1 0.0%Two or More Races 16 0.7%
--------Non-Special Education Rates-------- --------Special Education Rates--------Student Information Campus District State Campus District State
Retention Rates by Grade:Kindergarten - 0.4% 1.7% - 3.8% 6.2%Grade 1 - 2.0% 3.1% - 5.7% 5.5%Grade 2 - 1.3% 1.8% - 2.2% 2.3%Grade 3 - 1.2% 1.1% - 2.1% 0.9%Grade 4 - 0.0% 0.5% - 0.0% 0.5%Grade 5 - 0.2% 0.5% - 1.8% 0.6%Grade 6 - 0.4% 0.4% - 0.0% 0.5%Grade 7 - 1.0% 0.6% - 0.0% 0.6%Grade 8 - 0.0% 0.4% - 0.0% 0.7%Grade 9 17.3% 17.2% 7.2% 31.4% 34.0% 12.7%
Class Size Information Campus District State
Class Size Averages by Grade and Subject(Derived from teacher responsibility records):
Elementary:Kindergarten - 20.9 18.9Grade 1 - 19.8 18.8Grade 2 - 19.1 18.7Grade 3 - 20.1 18.9Grade 4 - 20.0 19.2Grade 5 - 23.0 21.2Grade 6 - 19.3 20.4
Secondary:English/Language Arts 17.0 15.9 16.6Foreign Languages 21.3 21.8 18.9Mathematics 17.1 16.7 17.8Science 19.6 18.4 18.9Social Studies 19.0 18.1 19.3
18-19 AAR Page 360

TEA | Governance and Accountability | Performance Reporting Page 19 December 2019
TEXAS EDUCATION AGENCYDistrict Name: WILLIS ISD Texas Academic Performance Report Total Students: 2,085
Campus Name: WILLIS H S 2018-19 Campus Staff Information Grade Span: 09 - 12Campus Number: 170904002 School Type: High School
---------------- Campus ----------------Staff Information Count/Average Percent District State
Total Staff 147.1 100.0% 100.0% 100.0%
Professional Staff: 137.2 93.3% 57.6% 64.1%Teachers 120.5 81.9% 44.8% 49.8%Professional Support 9.0 6.1% 9.2% 10.1%Campus Administration (School Leadership) 7.7 5.3% 2.9% 3.0%
Educational Aides: 9.9 6.7% 11.0% 10.3%
Librarians & Counselors (Headcount):Librarians
Full-time 0.0 n/a 0.0 4,414.0Part-time 0.0 n/a 0.0 572.0
CounselorsFull-time 5.0 n/a 12.0 12,433.0Part-time 0.0 n/a 2.0 1,097.0
Total Minority Staff: 18.9 12.8% 27.1% 50.4%
Teachers by Ethnicity and Sex:African American 4.0 3.3% 2.8% 10.6%Hispanic 6.0 5.0% 14.2% 27.7%White 110.5 91.7% 82.1% 58.4%American Indian 0.0 0.0% 0.2% 0.3%Asian 0.0 0.0% 0.2% 1.7%Pacific Islander 0.0 0.0% 0.0% 0.2%Two or More Races 0.0 0.0% 0.5% 1.1%
Males 46.7 38.8% 18.6% 23.8%Females 73.8 61.2% 81.4% 76.2%
Teachers by Highest Degree Held:No Degree 2.0 1.7% 0.5% 1.4%Bachelors 81.7 67.8% 81.7% 73.6%Masters 35.8 29.7% 17.4% 24.3%Doctorate 1.0 0.8% 0.5% 0.7%
Teachers by Years of Experience:Beginning Teachers 12.9 10.7% 8.0% 7.0%1-5 Years Experience 32.8 27.2% 31.7% 28.9%6-10 Years Experience 19.0 15.8% 17.5% 19.0%11-20 Years Experience 32.0 26.6% 24.9% 29.3%Over 20 Years Experience 23.8 19.7% 17.9% 15.7%
Number of Students per Teacher 17.3 n/a 17.2 15.1
18-19 AAR Page 361

TEA | Governance and Accountability | Performance Reporting Page 20 December 2019
TEXAS EDUCATION AGENCYDistrict Name: WILLIS ISD Texas Academic Performance Report Total Students: 2,085
Campus Name: WILLIS H S 2018-19 Campus Staff Information Grade Span: 09 - 12Campus Number: 170904002 School Type: High School
Staff Information Campus District State
Experience of Campus Leadership:Average Years Experience of Principals 1.0 2.8 6.3Average Years Experience of Principals with District 1.0 2.8 5.4Average Years Experience of Assistant Principals 5.0 6.1 5.3Average Years Experience of Assistant Principals with District 4.2 4.2 4.7
Average Years Experience of Teachers: 11.4 10.7 11.1Average Years Experience of Teachers with District: 6.5 6.5 7.2
Average Teacher Salary by Years of Experience (regular duties only):Beginning Teachers $46,530 $45,854 $47,2181-5 Years Experience $52,113 $50,779 $50,4086-10 Years Experience $52,995 $52,839 $52,78611-20 Years Experience $56,911 $57,036 $56,041Over 20 Years Experience $65,131 $63,917 $62,039
Average Actual Salaries (regular duties only):Teachers $55,495 $54,658 $54,122Professional Support $67,836 $65,409 $64,069Campus Administration (School Leadership) $77,413 $78,467 $78,947
Instructional Staff Percent: n/a 60.4% 64.5%
Contracted Instructional Staff (not incl. above): 0.0 1.5 6,043.6
18-19 AAR Page 362

TEA | Governance and Accountability | Performance Reporting Page 21 December 2019
TEXAS EDUCATION AGENCYDistrict Name: WILLIS ISD Texas Academic Performance Report Total Students: 2,085
Campus Name: WILLIS H S 2018-19 Campus Staff Information Grade Span: 09 - 12Campus Number: 170904002 School Type: High School
---------------- Campus ----------------Program Information Count Percent District State
Student Enrollment by Program:Bilingual/ESL Education 205 9.8% 13.6% 19.7%Career & Technical Education 1,605 77.0% 21.5% 26.3%Gifted & Talented Education 106 5.1% 5.4% 8.1%Special Education 151 7.2% 8.4% 9.6%
Teachers by Program (population served):Bilingual/ESL Education 1.8 1.5% 2.8% 6.4%Career & Technical Education 19.2 16.0% 4.5% 4.9%Compensatory Education 0.0 0.0% 0.0% 2.7%Gifted & Talented Education 0.0 0.0% 0.0% 2.0%Regular Education 72.4 60.1% 76.9% 71.4%Special Education 9.9 8.2% 8.5% 9.1%Other 17.2 14.3% 7.3% 3.6%
' '̂ Indicates that rates for reading and mathematics are based on the cumulative results from the first and second administrations of STAAR.'*' Indicates results are masked due to small numbers to protect student confidentiality.'**' When only one student disability group is masked, then the second smallest student disability group is masked regardless of size.'***' Due to changes in the evaluation of SAT/ACT results (for 2017-18 the best result was used, rather than the most recent), 2016-17 SAT/ACT results are not
comparable and, where applicable, are not shown.'-' Indicates there are no students in the group.'n/a' Indicates data reporting is not applicable for this group.'?' Indicates that the data for this item were statistically improbable or were reported outside a reasonable range.
Link to: PEIMS Financial Standard Reports 2017-18 Financial Actual Report
18-19 AAR Page 363
TEA | Governance and Accountability | Performance Reporting Page 22 December 2019
2018-19 Texas Academic Performance Report
District Name: WILLIS ISD
Campus Name: STUBBLEFIELD ALTERNATIVE ACADEMY
Campus Number: 170904003
2019 Accountability Rating: Not Rated
18-19 AAR Page 364

TEA | Governance and Accountability | Performance Reporting Page 23 December 2019
This page is intentionally blank.
18-19 AAR Page 365
TEA | Governance and Accountability | Performance Reporting Page 24 December 2019
TEXAS EDUCATION AGENCYDistrict Name: WILLIS ISD Texas Academic Performance Report Total Students: 26
Campus Name: STUBBLEFIELD ALTERNATIVE ACADEMY 2018-19 Campus STAAR Performance Grade Span: 04 - 12Campus Number: 170904003 School Type: Elementary/Secondary
There is no data for this campus.
18-19 AAR Page 366

TEA | Governance and Accountability | Performance Reporting Page 25 December 2019
TEXAS EDUCATION AGENCYDistrict Name: WILLIS ISD Texas Academic Performance Report Total Students: 26
Campus Name: STUBBLEFIELD ALTERNATIVE ACADEMY 2018-19 Campus Progress Grade Span: 04 - 12Campus Number: 170904003 School Type: Elementary/Secondary
There is no data for this campus.
18-19 AAR Page 367

TEA | Governance and Accountability | Performance Reporting Page 26 December 2019
TEXAS EDUCATION AGENCYDistrict Name: WILLIS ISD Texas Academic Performance Report Total Students: 26
Campus Name: STUBBLEFIELD ALTERNATIVE ACADEMY 2018-19 Campus Prior Year and Student Success Initiative Grade Span: 04 - 12Campus Number: 170904003 School Type: Elementary/Secondary
State District CampusAfrican
American Hispanic WhiteAmerican
Indian AsianPacific
Islander
Two orMore
RacesSpecial
EdEcon
DisadvEL
(Current)
Student Success Initiative
Grade 8 ReadingSTAARNon-Proficient Students Promoted by Grade Placement Committee
2018 99% 100% * - * - - - - * * * -
Grade 8 MathematicsSTAARNon-Proficient Students Promoted by Grade Placement Committee
2018 98% 100% * - - - - - - * - * -
18-19 AAR Page 368
TEA | Governance and Accountability | Performance Reporting Page 27 December 2019
TEXAS EDUCATION AGENCYDistrict Name: WILLIS ISD Texas Academic Performance Report Total Students: 26
Campus Name: STUBBLEFIELD ALTERNATIVE ACADEMY 2018-19 Campus STAAR Performance Grade Span: 04 - 12Campus Number: 170904003 Bilingual Education/English as a Second Language (Current EL Students)
There is no data for this campus.
18-19 AAR Page 369

TEA | Governance and Accountability | Performance Reporting Page 28 December 2019
TEXAS EDUCATION AGENCYDistrict Name: WILLIS ISD Texas Academic Performance Report Total Students: 26
Campus Name: STUBBLEFIELD ALTERNATIVE ACADEMY 2018-19 Campus STAAR Participation Grade Span: 04 - 12Campus Number: 170904003 School Type: Elementary/Secondary
State District CampusAfrican
American Hispanic WhiteAmerican
Indian AsianPacific
Islander
Two orMore
RacesSpecial
EdEcon
DisadvEL
(Current)2019 STAARParticipation
(All Grades)
All TestsAssessment Participant 99% 100% - - - - - - - - - - -
Included in Accountability 94% 94% - - - - - - - - - - -Not Included in Accountability
Mobile 4% 5% - - - - - - - - - - -Other Exclusions 1% 1% - - - - - - - - - - -
Not Tested 1% 0% - - - - - - - - - - -Absent 1% 0% - - - - - - - - - - -Other 0% 0% - - - - - - - - - - -
2018 STAARParticipation(All Grades)
All TestsAssessment Participant 99% 100% - - - - - - - - - - -
Included in Accountability 94% 93% - - - - - - - - - - -Not Included in Accountability
Mobile 4% 6% - - - - - - - - - - -Other Exclusions 1% 0% - - - - - - - - - - -
Not Tested 1% 0% - - - - - - - - - - -Absent 1% 0% - - - - - - - - - - -Other 0% 0% - - - - - - - - - - -
18-19 AAR Page 370
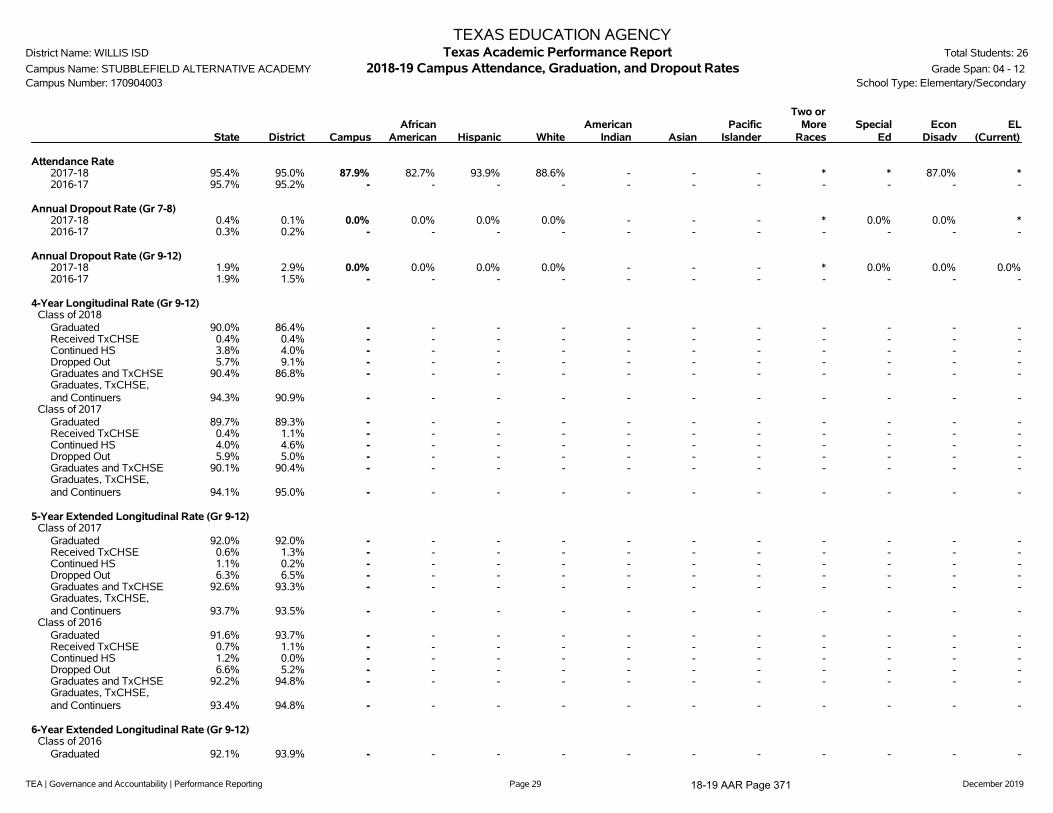
TEA | Governance and Accountability | Performance Reporting Page 29 December 2019
TEXAS EDUCATION AGENCYDistrict Name: WILLIS ISD Texas Academic Performance Report Total Students: 26
Campus Name: STUBBLEFIELD ALTERNATIVE ACADEMY 2018-19 Campus Attendance, Graduation, and Dropout Rates Grade Span: 04 - 12Campus Number: 170904003 School Type: Elementary/Secondary
State District CampusAfrican
American Hispanic WhiteAmerican
Indian AsianPacific
Islander
Two orMore
RacesSpecial
EdEcon
DisadvEL
(Current)
Attendance Rate2017-18 95.4% 95.0% 87.9% 82.7% 93.9% 88.6% - - - * * 87.0% *2016-17 95.7% 95.2% - - - - - - - - - - -
Annual Dropout Rate (Gr 7-8)2017-18 0.4% 0.1% 0.0% 0.0% 0.0% 0.0% - - - * 0.0% 0.0% *2016-17 0.3% 0.2% - - - - - - - - - - -
Annual Dropout Rate (Gr 9-12)2017-18 1.9% 2.9% 0.0% 0.0% 0.0% 0.0% - - - * 0.0% 0.0% 0.0%2016-17 1.9% 1.5% - - - - - - - - - - -
4-Year Longitudinal Rate (Gr 9-12)Class of 2018
Graduated 90.0% 86.4% - - - - - - - - - - -Received TxCHSE 0.4% 0.4% - - - - - - - - - - -Continued HS 3.8% 4.0% - - - - - - - - - - -Dropped Out 5.7% 9.1% - - - - - - - - - - -Graduates and TxCHSE 90.4% 86.8% - - - - - - - - - - -Graduates, TxCHSE,and Continuers 94.3% 90.9% - - - - - - - - - - -
Class of 2017Graduated 89.7% 89.3% - - - - - - - - - - -Received TxCHSE 0.4% 1.1% - - - - - - - - - - -Continued HS 4.0% 4.6% - - - - - - - - - - -Dropped Out 5.9% 5.0% - - - - - - - - - - -Graduates and TxCHSE 90.1% 90.4% - - - - - - - - - - -Graduates, TxCHSE,and Continuers 94.1% 95.0% - - - - - - - - - - -
5-Year Extended Longitudinal Rate (Gr 9-12)Class of 2017
Graduated 92.0% 92.0% - - - - - - - - - - -Received TxCHSE 0.6% 1.3% - - - - - - - - - - -Continued HS 1.1% 0.2% - - - - - - - - - - -Dropped Out 6.3% 6.5% - - - - - - - - - - -Graduates and TxCHSE 92.6% 93.3% - - - - - - - - - - -Graduates, TxCHSE,and Continuers 93.7% 93.5% - - - - - - - - - - -
Class of 2016Graduated 91.6% 93.7% - - - - - - - - - - -Received TxCHSE 0.7% 1.1% - - - - - - - - - - -Continued HS 1.2% 0.0% - - - - - - - - - - -Dropped Out 6.6% 5.2% - - - - - - - - - - -Graduates and TxCHSE 92.2% 94.8% - - - - - - - - - - -Graduates, TxCHSE,and Continuers 93.4% 94.8% - - - - - - - - - - -
6-Year Extended Longitudinal Rate (Gr 9-12)Class of 2016
Graduated 92.1% 93.9% - - - - - - - - - - -
18-19 AAR Page 371
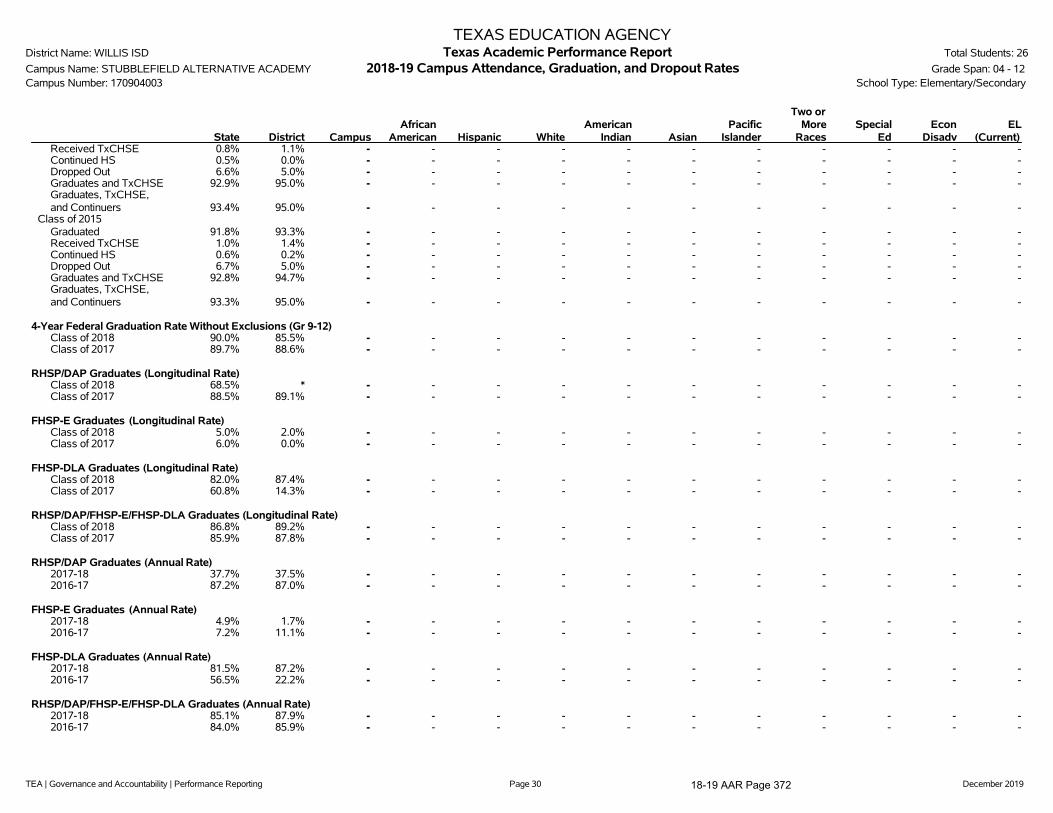
TEA | Governance and Accountability | Performance Reporting Page 30 December 2019
TEXAS EDUCATION AGENCYDistrict Name: WILLIS ISD Texas Academic Performance Report Total Students: 26
Campus Name: STUBBLEFIELD ALTERNATIVE ACADEMY 2018-19 Campus Attendance, Graduation, and Dropout Rates Grade Span: 04 - 12Campus Number: 170904003 School Type: Elementary/Secondary
State District CampusAfrican
American Hispanic WhiteAmerican
Indian AsianPacific
Islander
Two orMore
RacesSpecial
EdEcon
DisadvEL
(Current)Received TxCHSE 0.8% 1.1% - - - - - - - - - - -Continued HS 0.5% 0.0% - - - - - - - - - - -Dropped Out 6.6% 5.0% - - - - - - - - - - -Graduates and TxCHSE 92.9% 95.0% - - - - - - - - - - -Graduates, TxCHSE,and Continuers 93.4% 95.0% - - - - - - - - - - -
Class of 2015Graduated 91.8% 93.3% - - - - - - - - - - -Received TxCHSE 1.0% 1.4% - - - - - - - - - - -Continued HS 0.6% 0.2% - - - - - - - - - - -Dropped Out 6.7% 5.0% - - - - - - - - - - -Graduates and TxCHSE 92.8% 94.7% - - - - - - - - - - -Graduates, TxCHSE,and Continuers 93.3% 95.0% - - - - - - - - - - -
4-Year Federal Graduation Rate Without Exclusions (Gr 9-12)Class of 2018 90.0% 85.5% - - - - - - - - - - -Class of 2017 89.7% 88.6% - - - - - - - - - - -
RHSP/DAP Graduates (Longitudinal Rate)Class of 2018 68.5% * - - - - - - - - - - -Class of 2017 88.5% 89.1% - - - - - - - - - - -
FHSP-E Graduates (Longitudinal Rate)Class of 2018 5.0% 2.0% - - - - - - - - - - -Class of 2017 6.0% 0.0% - - - - - - - - - - -
FHSP-DLA Graduates (Longitudinal Rate)Class of 2018 82.0% 87.4% - - - - - - - - - - -Class of 2017 60.8% 14.3% - - - - - - - - - - -
RHSP/DAP/FHSP-E/FHSP-DLA Graduates (Longitudinal Rate)Class of 2018 86.8% 89.2% - - - - - - - - - - -Class of 2017 85.9% 87.8% - - - - - - - - - - -
RHSP/DAP Graduates (Annual Rate)2017-18 37.7% 37.5% - - - - - - - - - - -2016-17 87.2% 87.0% - - - - - - - - - - -
FHSP-E Graduates (Annual Rate)2017-18 4.9% 1.7% - - - - - - - - - - -2016-17 7.2% 11.1% - - - - - - - - - - -
FHSP-DLA Graduates (Annual Rate)2017-18 81.5% 87.2% - - - - - - - - - - -2016-17 56.5% 22.2% - - - - - - - - - - -
RHSP/DAP/FHSP-E/FHSP-DLA Graduates (Annual Rate)2017-18 85.1% 87.9% - - - - - - - - - - -2016-17 84.0% 85.9% - - - - - - - - - - -
18-19 AAR Page 372

TEA | Governance and Accountability | Performance Reporting Page 31 December 2019
TEXAS EDUCATION AGENCYDistrict Name: WILLIS ISD Texas Academic Performance Report Total Students: 26
Campus Name: STUBBLEFIELD ALTERNATIVE ACADEMY 2018-19 Campus Graduation Profile Grade Span: 04 - 12Campus Number: 170904003 School Type: Elementary/Secondary
CampusCount
CampusPercent
DistrictCount
StateCount
Graduates (2017-18 Annual Graduates)Total Graduates - - 422 347,893
By Ethnicity:African American - - 31 43,502Hispanic - - 128 173,272White - - 247 107,052American Indian - - 3 1,226Asian - - 2 15,589Pacific Islander - - 2 528Two or More Races - - 9 6,724
By Graduation Type:Minimum H.S. Program - - 5 5,855Recommended H.S. Program/Distinguished Achievement Program - - 3 3,538Foundation H.S. Program (No Endorsement) - - 46 49,432Foundation H.S. Program (Endorsement) - - 7 16,542Foundation H.S. Program (DLA) - - 361 272,526
Special Education Graduates - - 27 25,962Economically Disadvantaged Graduates - - 181 166,956LEP Graduates - - 16 21,359At-Risk Graduates - - 137 144,805
18-19 AAR Page 373

TEA | Governance and Accountability | Performance Reporting Page 32 December 2019
TEXAS EDUCATION AGENCYDistrict Name: WILLIS ISD Texas Academic Performance Report Total Students: 26
Campus Name: STUBBLEFIELD ALTERNATIVE ACADEMY 2018-19 Campus College, Career, and Military Readiness (CCMR) Grade Span: 04 - 12Campus Number: 170904003 School Type: Elementary/Secondary
State District CampusAfrican
American Hispanic WhiteAmerican
Indian AsianPacific
Islander
Two orMore
RacesSpecial
EdEcon
DisadvEL
(Current)College, Career, and Military Ready Graduates (Student Achievement) ***
College, Career, or Military Ready (Annual Graduates)2017-18 65.5% 64.0% - - - - - - - - - - -
College Ready Graduates ***College Ready (Annual Graduates)
2017-18 50.0% 34.4% - - - - - - - - - - -
TSI Criteria Graduates (Annual Graduates)English Language Arts
2017-18 58.2% 51.2% - - - - - - - - - - -Mathematics
2017-18 46.0% 29.9% - - - - - - - - - - -Both Subjects
2017-18 42.1% 28.4% - - - - - - - - - - -
Dual Course Credits (Annual Graduates)Any Subject
2017-18 20.7% 17.3% - - - - - - - - - - -2016-17 19.9% 21.6% - - - - - - - - - - -
AP/IB Met Criteria in Any Subject (Annual Graduates)Any Subject
2017-18 20.4% 9.5% - - - - - - - - - - -2016-17 20.1% 4.9% - - - - - - - - - - -
Associate's DegreeAssociate's Degree (Annual Graduates)
2017-18 1.4% 0.2% - - - - - - - - - - -2016-17 0.8% 0.0% - - - - - - - - - - -
OnRampsCourse Credits (Annual Graduates)2017-18 1.0% 0.0% - - - - - - - - - - -
Career/Military Ready GraduatesCareer or Military Ready (Annual Graduates)
2017-18 28.7% 41.6% - - - - - - - - - - -2016-17 13.2% 13.1% - - - - - - - - - - -
Approved Industry-Based Certification (Annual Graduates)2017-18 4.8% 9.0% - - - - - - - - - - -2016-17 2.7% 3.8% - - - - - - - - - - -
Graduate with Completed IEP and Workforce Readiness (Annual Graduates)2017-18 1.7% 6.2% - - - - - - - - - - -2016-17 1.0% 0.0% - - - - - - - - - - -
CTE Coherent Sequence Coursework Aligned with Industry-Based Certifications (Annual Graduates)2017-18 38.7% 58.8% - - - - - - - - - - -2016-17 17.3% 14.6% - - - - - - - - - - -
18-19 AAR Page 374

TEA | Governance and Accountability | Performance Reporting Page 33 December 2019
TEXAS EDUCATION AGENCYDistrict Name: WILLIS ISD Texas Academic Performance Report Total Students: 26
Campus Name: STUBBLEFIELD ALTERNATIVE ACADEMY 2018-19 Campus College, Career, and Military Readiness (CCMR) Grade Span: 04 - 12Campus Number: 170904003 School Type: Elementary/Secondary
State District CampusAfrican
American Hispanic WhiteAmerican
Indian AsianPacific
Islander
Two orMore
RacesSpecial
EdEcon
DisadvEL
(Current)
U.S. Armed Forces Enlistment (Annual Graduates)2017-18 4.3% 3.3% - - - - - - - - - - -2016-17 2.2% 2.8% - - - - - - - - - - -
Graduates under an Advanced Degree Plan and Identified as a current Special Education Student (Annual Graduates)2017-18 2.6% 0.9% - - - - - - - - - - -
Graduates with Level I or Level II Certificate (Annual Graduates)2017-18 0.6% 0.0% - - - - - - - - - - -2016-17 0.5% 0.0% - - - - - - - - - - -
18-19 AAR Page 375

TEA | Governance and Accountability | Performance Reporting Page 34 December 2019
TEXAS EDUCATION AGENCYDistrict Name: WILLIS ISD Texas Academic Performance Report Total Students: 26
Campus Name: STUBBLEFIELD ALTERNATIVE ACADEMY 2018-19 Campus CCMR-Related Indicators Grade Span: 04 - 12Campus Number: 170904003 School Type: Elementary/Secondary
State District CampusAfrican
American Hispanic WhiteAmerican
Indian AsianPacific
Islander
Two orMore
RacesSpecial
EdEcon
DisadvEL
(Current)TSIA Results (Graduates >= Criterion) (Annual Graduates)
Reading2017-18 32.1% 36.5% - - - - - - - - - - -2016-17 23.4% 11.3% - - - - - - - - - - -
Mathematics2017-18 23.7% 21.8% - - - - - - - - - - -2016-17 19.8% 11.3% - - - - - - - - - - -
Both Subjects2017-18 18.1% 17.8% - - - - - - - - - - -2016-17 12.9% 5.4% - - - - - - - - - - -
CTE Coherent Sequence (Annual Graduates)2017-18 58.4% 61.8% - - - - - - - - - - -2016-17 50.5% 30.1% - - - - - - - - - - -
Completed and Received Credit for College Prep Courses (Annual Graduates)English Language Arts
2017-18 2.0% 0.0% - - - - - - - - - - -2016-17 0.8% 0.0% - - - - - - - - - - -
Mathematics2017-18 3.9% 0.0% - - - - - - - - - - -2016-17 1.4% 0.0% - - - - - - - - - - -
Both Subjects2017-18 0.9% 0.0% - - - - - - - - - - -2016-17 0.2% 0.0% - - - - - - - - - - -
AP/IB Results (Participation) (Grades 11-12)All Subjects
2018 25.8% 10.3% - - - - - - - - n/a - n/a2017 26.2% 12.1% - - - - - - - - n/a - n/a
English Language Arts2018 15.3% 6.5% - - - - - - - - n/a - n/a2017 15.9% 5.8% - - - - - - - - n/a - n/a
Mathematics2018 7.3% 0.8% - - - - - - - - n/a - n/a2017 7.2% 0.8% - - - - - - - - n/a - n/a
Science2018 10.8% 4.4% - - - - - - - - n/a - n/a2017 10.9% 4.2% - - - - - - - - n/a - n/a
Social Studies2018 14.5% 4.9% - - - - - - - - n/a - n/a2017 15.0% 8.8% - - - - - - - - n/a - n/a
AP/IB Results (Examinees >= Criterion) (Grades 11-12)All Subjects
2018 50.7% 48.5% - - - - - - - - n/a - n/a2017 49.1% 39.3% - - - - - - - - n/a - n/a
English Language Arts2018 42.5% 33.9% - - - - - - - - n/a - n/a2017 41.3% 38.9% - - - - - - - - n/a - n/a
Mathematics2018 52.8% 12.5% - - - - - - - - n/a - n/a
18-19 AAR Page 376

TEA | Governance and Accountability | Performance Reporting Page 35 December 2019
TEXAS EDUCATION AGENCYDistrict Name: WILLIS ISD Texas Academic Performance Report Total Students: 26
Campus Name: STUBBLEFIELD ALTERNATIVE ACADEMY 2018-19 Campus CCMR-Related Indicators Grade Span: 04 - 12Campus Number: 170904003 School Type: Elementary/Secondary
State District CampusAfrican
American Hispanic WhiteAmerican
Indian AsianPacific
Islander
Two orMore
RacesSpecial
EdEcon
DisadvEL
(Current)2017 51.3% 14.3% - - - - - - - - n/a - n/a
Science2018 38.0% 21.4% - - - - - - - - n/a - n/a2017 38.3% 15.4% - - - - - - - - n/a - n/a
Social Studies2018 44.6% 51.1% - - - - - - - - n/a - n/a2017 41.4% 37.8% - - - - - - - - n/a - n/a
SAT/ACT Results (Annual Graduates) ***Tested
2017-18 74.6% 51.7% - - - - - - - - n/a - n/a2016-17 73.5% 53.6% - - - - - - - - n/a - n/a
At/Above Criterion2017-18 37.9% 33.0% - - - - - - - - n/a - n/a
Average SAT Score (Annual Graduates) ***All Subjects
2017-18 1036 1028 - - - - - - - - n/a - n/aEnglish Language Artsand Writing
2017-18 521 527 - - - - - - - - n/a - n/aMathematics
2017-18 515 500 - - - - - - - - n/a - n/a
Average ACT Score (Annual Graduates) ***All Subjects
2017-18 20.6 20.0 - - - - - - - - n/a - n/aEnglish Language Arts
2017-18 20.3 19.6 - - - - - - - - n/a - n/aMathematics
2017-18 20.6 19.4 - - - - - - - - n/a - n/aScience
2017-18 20.9 20.8 - - - - - - - - n/a - n/a
18-19 AAR Page 377
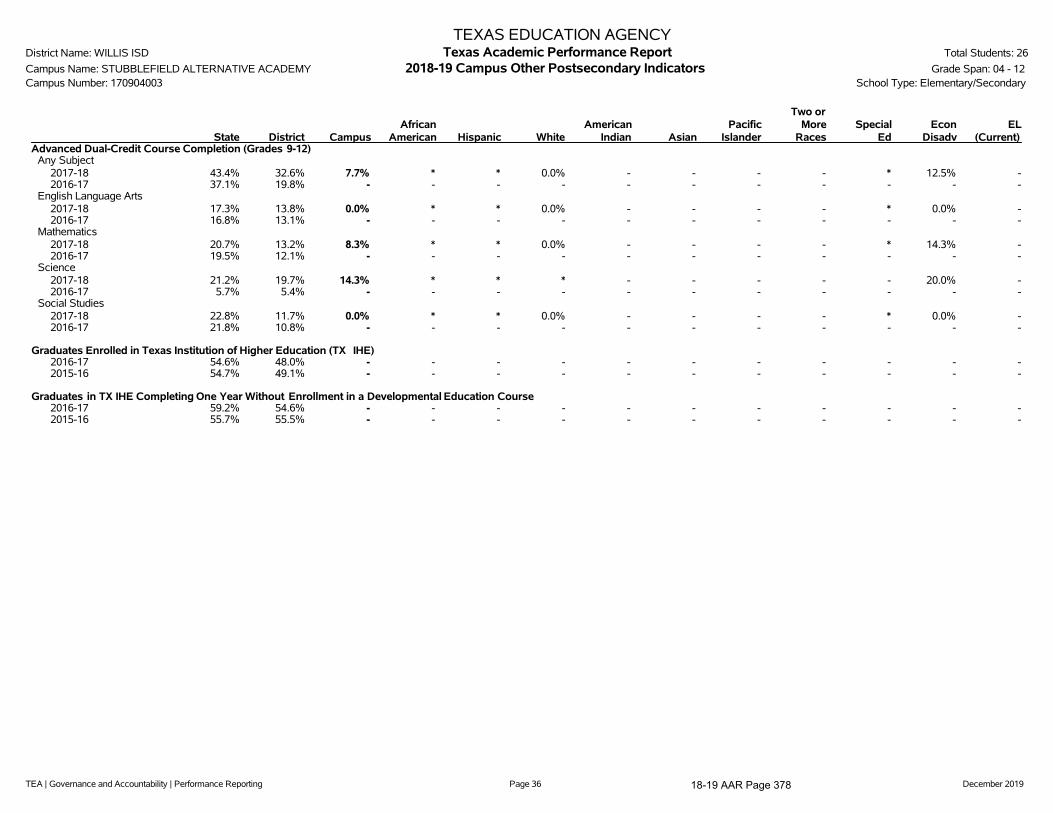
TEA | Governance and Accountability | Performance Reporting Page 36 December 2019
TEXAS EDUCATION AGENCYDistrict Name: WILLIS ISD Texas Academic Performance Report Total Students: 26
Campus Name: STUBBLEFIELD ALTERNATIVE ACADEMY 2018-19 Campus Other Postsecondary Indicators Grade Span: 04 - 12Campus Number: 170904003 School Type: Elementary/Secondary
State District CampusAfrican
American Hispanic WhiteAmerican
Indian AsianPacific
Islander
Two orMore
RacesSpecial
EdEcon
DisadvEL
(Current)Advanced Dual-Credit Course Completion (Grades 9-12)
Any Subject2017-18 43.4% 32.6% 7.7% * * 0.0% - - - - * 12.5% -2016-17 37.1% 19.8% - - - - - - - - - - -
English Language Arts2017-18 17.3% 13.8% 0.0% * * 0.0% - - - - * 0.0% -2016-17 16.8% 13.1% - - - - - - - - - - -
Mathematics2017-18 20.7% 13.2% 8.3% * * 0.0% - - - - * 14.3% -2016-17 19.5% 12.1% - - - - - - - - - - -
Science2017-18 21.2% 19.7% 14.3% * * * - - - - - 20.0% -2016-17 5.7% 5.4% - - - - - - - - - - -
Social Studies2017-18 22.8% 11.7% 0.0% * * 0.0% - - - - * 0.0% -2016-17 21.8% 10.8% - - - - - - - - - - -
Graduates Enrolled in Texas Institution of Higher Education (TX IHE)2016-17 54.6% 48.0% - - - - - - - - - - -2015-16 54.7% 49.1% - - - - - - - - - - -
Graduates in TX IHE Completing One Year Without Enrollment in a Developmental Education Course2016-17 59.2% 54.6% - - - - - - - - - - -2015-16 55.7% 55.5% - - - - - - - - - - -
18-19 AAR Page 378
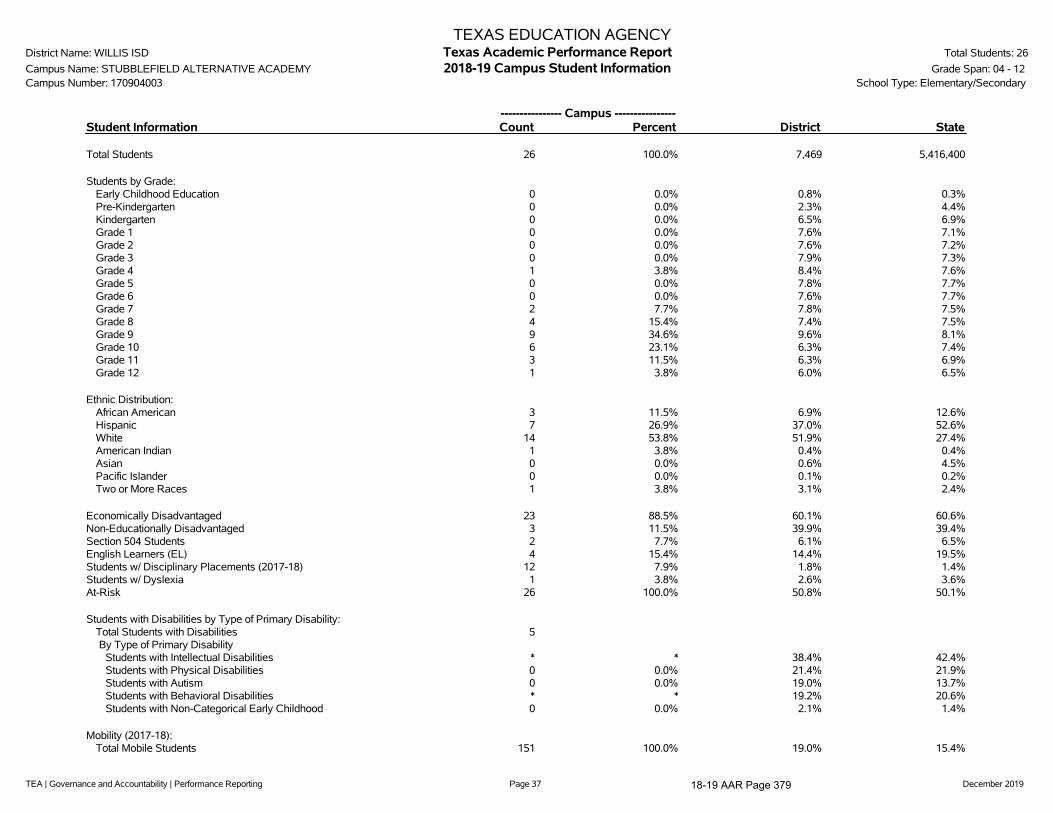
TEA | Governance and Accountability | Performance Reporting Page 37 December 2019
TEXAS EDUCATION AGENCYDistrict Name: WILLIS ISD Texas Academic Performance Report Total Students: 26
Campus Name: STUBBLEFIELD ALTERNATIVE ACADEMY 2018-19 Campus Student Information Grade Span: 04 - 12Campus Number: 170904003 School Type: Elementary/Secondary
---------------- Campus ----------------Student Information Count Percent District State
Total Students 26 100.0% 7,469 5,416,400
Students by Grade:Early Childhood Education 0 0.0% 0.8% 0.3%Pre-Kindergarten 0 0.0% 2.3% 4.4%Kindergarten 0 0.0% 6.5% 6.9%Grade 1 0 0.0% 7.6% 7.1%Grade 2 0 0.0% 7.6% 7.2%Grade 3 0 0.0% 7.9% 7.3%Grade 4 1 3.8% 8.4% 7.6%Grade 5 0 0.0% 7.8% 7.7%Grade 6 0 0.0% 7.6% 7.7%Grade 7 2 7.7% 7.8% 7.5%Grade 8 4 15.4% 7.4% 7.5%Grade 9 9 34.6% 9.6% 8.1%Grade 10 6 23.1% 6.3% 7.4%Grade 11 3 11.5% 6.3% 6.9%Grade 12 1 3.8% 6.0% 6.5%
Ethnic Distribution:African American 3 11.5% 6.9% 12.6%Hispanic 7 26.9% 37.0% 52.6%White 14 53.8% 51.9% 27.4%American Indian 1 3.8% 0.4% 0.4%Asian 0 0.0% 0.6% 4.5%Pacific Islander 0 0.0% 0.1% 0.2%Two or More Races 1 3.8% 3.1% 2.4%
Economically Disadvantaged 23 88.5% 60.1% 60.6%Non-Educationally Disadvantaged 3 11.5% 39.9% 39.4%Section 504 Students 2 7.7% 6.1% 6.5%English Learners (EL) 4 15.4% 14.4% 19.5%Students w/ Disciplinary Placements (2017-18) 12 7.9% 1.8% 1.4%Students w/ Dyslexia 1 3.8% 2.6% 3.6%At-Risk 26 100.0% 50.8% 50.1%
Students with Disabilities by Type of Primary Disability:Total Students with Disabilities 5By Type of Primary Disability
Students with Intellectual Disabilities * * 38.4% 42.4%Students with Physical Disabilities 0 0.0% 21.4% 21.9%Students with Autism 0 0.0% 19.0% 13.7%Students with Behavioral Disabilities * * 19.2% 20.6%Students with Non-Categorical Early Childhood 0 0.0% 2.1% 1.4%
Mobility (2017-18):Total Mobile Students 151 100.0% 19.0% 15.4%
18-19 AAR Page 379
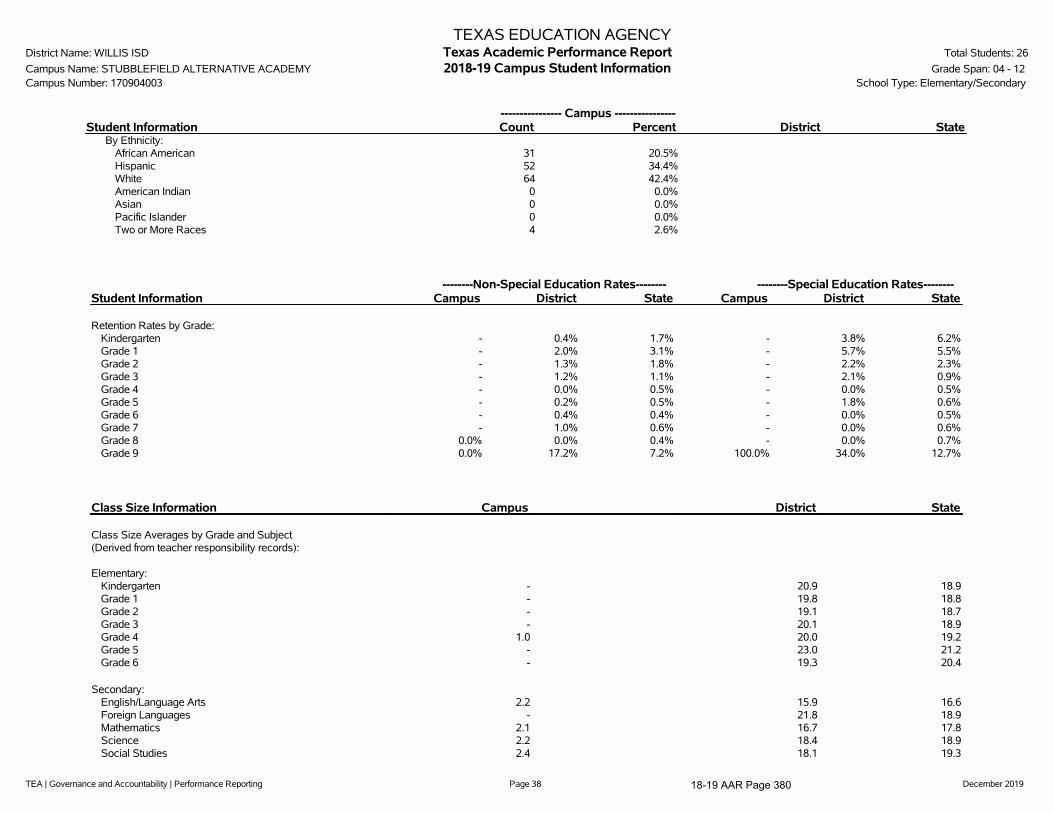
TEA | Governance and Accountability | Performance Reporting Page 38 December 2019
TEXAS EDUCATION AGENCYDistrict Name: WILLIS ISD Texas Academic Performance Report Total Students: 26
Campus Name: STUBBLEFIELD ALTERNATIVE ACADEMY 2018-19 Campus Student Information Grade Span: 04 - 12Campus Number: 170904003 School Type: Elementary/Secondary
---------------- Campus ----------------Student Information Count Percent District State
By Ethnicity:African American 31 20.5%Hispanic 52 34.4%White 64 42.4%American Indian 0 0.0%Asian 0 0.0%Pacific Islander 0 0.0%Two or More Races 4 2.6%
--------Non-Special Education Rates-------- --------Special Education Rates--------Student Information Campus District State Campus District State
Retention Rates by Grade:Kindergarten - 0.4% 1.7% - 3.8% 6.2%Grade 1 - 2.0% 3.1% - 5.7% 5.5%Grade 2 - 1.3% 1.8% - 2.2% 2.3%Grade 3 - 1.2% 1.1% - 2.1% 0.9%Grade 4 - 0.0% 0.5% - 0.0% 0.5%Grade 5 - 0.2% 0.5% - 1.8% 0.6%Grade 6 - 0.4% 0.4% - 0.0% 0.5%Grade 7 - 1.0% 0.6% - 0.0% 0.6%Grade 8 0.0% 0.0% 0.4% - 0.0% 0.7%Grade 9 0.0% 17.2% 7.2% 100.0% 34.0% 12.7%
Class Size Information Campus District State
Class Size Averages by Grade and Subject(Derived from teacher responsibility records):
Elementary:Kindergarten - 20.9 18.9Grade 1 - 19.8 18.8Grade 2 - 19.1 18.7Grade 3 - 20.1 18.9Grade 4 1.0 20.0 19.2Grade 5 - 23.0 21.2Grade 6 - 19.3 20.4
Secondary:English/Language Arts 2.2 15.9 16.6Foreign Languages - 21.8 18.9Mathematics 2.1 16.7 17.8Science 2.2 18.4 18.9Social Studies 2.4 18.1 19.3
18-19 AAR Page 380
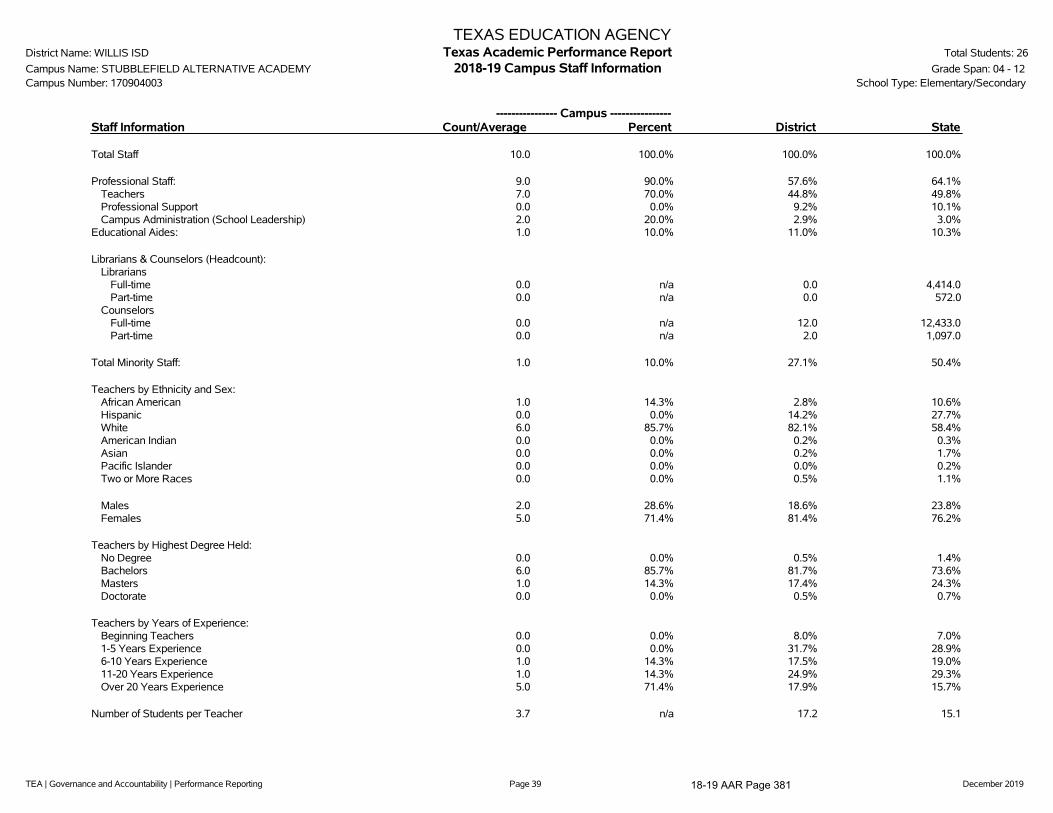
TEA | Governance and Accountability | Performance Reporting Page 39 December 2019
TEXAS EDUCATION AGENCYDistrict Name: WILLIS ISD Texas Academic Performance Report Total Students: 26
Campus Name: STUBBLEFIELD ALTERNATIVE ACADEMY 2018-19 Campus Staff Information Grade Span: 04 - 12Campus Number: 170904003 School Type: Elementary/Secondary
---------------- Campus ----------------Staff Information Count/Average Percent District State
Total Staff 10.0 100.0% 100.0% 100.0%
Professional Staff: 9.0 90.0% 57.6% 64.1%Teachers 7.0 70.0% 44.8% 49.8%Professional Support 0.0 0.0% 9.2% 10.1%Campus Administration (School Leadership) 2.0 20.0% 2.9% 3.0%
Educational Aides: 1.0 10.0% 11.0% 10.3%
Librarians & Counselors (Headcount):Librarians
Full-time 0.0 n/a 0.0 4,414.0Part-time 0.0 n/a 0.0 572.0
CounselorsFull-time 0.0 n/a 12.0 12,433.0Part-time 0.0 n/a 2.0 1,097.0
Total Minority Staff: 1.0 10.0% 27.1% 50.4%
Teachers by Ethnicity and Sex:African American 1.0 14.3% 2.8% 10.6%Hispanic 0.0 0.0% 14.2% 27.7%White 6.0 85.7% 82.1% 58.4%American Indian 0.0 0.0% 0.2% 0.3%Asian 0.0 0.0% 0.2% 1.7%Pacific Islander 0.0 0.0% 0.0% 0.2%Two or More Races 0.0 0.0% 0.5% 1.1%
Males 2.0 28.6% 18.6% 23.8%Females 5.0 71.4% 81.4% 76.2%
Teachers by Highest Degree Held:No Degree 0.0 0.0% 0.5% 1.4%Bachelors 6.0 85.7% 81.7% 73.6%Masters 1.0 14.3% 17.4% 24.3%Doctorate 0.0 0.0% 0.5% 0.7%
Teachers by Years of Experience:Beginning Teachers 0.0 0.0% 8.0% 7.0%1-5 Years Experience 0.0 0.0% 31.7% 28.9%6-10 Years Experience 1.0 14.3% 17.5% 19.0%11-20 Years Experience 1.0 14.3% 24.9% 29.3%Over 20 Years Experience 5.0 71.4% 17.9% 15.7%
Number of Students per Teacher 3.7 n/a 17.2 15.1
18-19 AAR Page 381
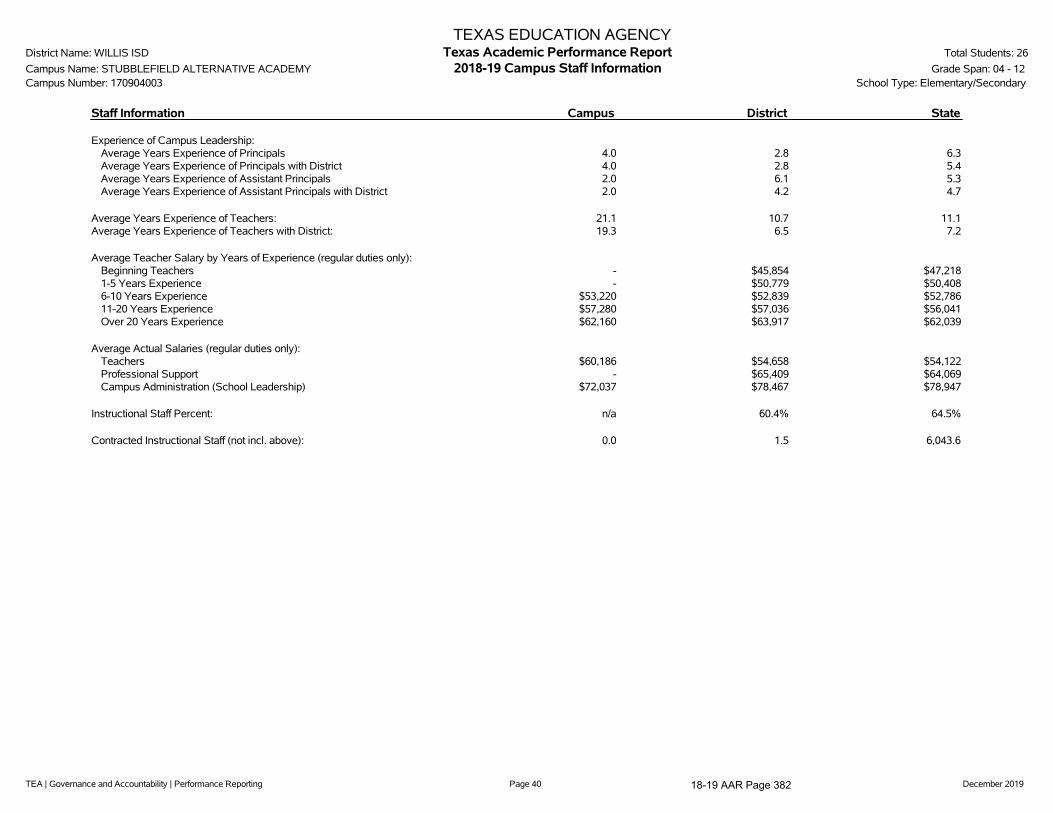
TEA | Governance and Accountability | Performance Reporting Page 40 December 2019
TEXAS EDUCATION AGENCYDistrict Name: WILLIS ISD Texas Academic Performance Report Total Students: 26
Campus Name: STUBBLEFIELD ALTERNATIVE ACADEMY 2018-19 Campus Staff Information Grade Span: 04 - 12Campus Number: 170904003 School Type: Elementary/Secondary
Staff Information Campus District State
Experience of Campus Leadership:Average Years Experience of Principals 4.0 2.8 6.3Average Years Experience of Principals with District 4.0 2.8 5.4Average Years Experience of Assistant Principals 2.0 6.1 5.3Average Years Experience of Assistant Principals with District 2.0 4.2 4.7
Average Years Experience of Teachers: 21.1 10.7 11.1Average Years Experience of Teachers with District: 19.3 6.5 7.2
Average Teacher Salary by Years of Experience (regular duties only):Beginning Teachers - $45,854 $47,2181-5 Years Experience - $50,779 $50,4086-10 Years Experience $53,220 $52,839 $52,78611-20 Years Experience $57,280 $57,036 $56,041Over 20 Years Experience $62,160 $63,917 $62,039
Average Actual Salaries (regular duties only):Teachers $60,186 $54,658 $54,122Professional Support - $65,409 $64,069Campus Administration (School Leadership) $72,037 $78,467 $78,947
Instructional Staff Percent: n/a 60.4% 64.5%
Contracted Instructional Staff (not incl. above): 0.0 1.5 6,043.6
18-19 AAR Page 382

TEA | Governance and Accountability | Performance Reporting Page 41 December 2019
TEXAS EDUCATION AGENCYDistrict Name: WILLIS ISD Texas Academic Performance Report Total Students: 26
Campus Name: STUBBLEFIELD ALTERNATIVE ACADEMY 2018-19 Campus Staff Information Grade Span: 04 - 12Campus Number: 170904003 School Type: Elementary/Secondary
---------------- Campus ----------------Program Information Count Percent District State
Student Enrollment by Program:Bilingual/ESL Education 4 15.4% 13.6% 19.7%Career & Technical Education 2 7.7% 21.5% 26.3%Gifted & Talented Education 1 3.8% 5.4% 8.1%Special Education 5 19.2% 8.4% 9.6%
Teachers by Program (population served):Bilingual/ESL Education 0.0 0.0% 2.8% 6.4%Career & Technical Education 0.2 2.3% 4.5% 4.9%Compensatory Education 0.0 0.0% 0.0% 2.7%Gifted & Talented Education 0.0 0.0% 0.0% 2.0%Regular Education 6.5 93.3% 76.9% 71.4%Special Education 0.1 1.1% 8.5% 9.1%Other 0.2 3.4% 7.3% 3.6%
' '̂ Indicates that rates for reading and mathematics are based on the cumulative results from the first and second administrations of STAAR.'*' Indicates results are masked due to small numbers to protect student confidentiality.'**' When only one student disability group is masked, then the second smallest student disability group is masked regardless of size.'***' Due to changes in the evaluation of SAT/ACT results (for 2017-18 the best result was used, rather than the most recent), 2016-17 SAT/ACT results are not
comparable and, where applicable, are not shown.'-' Indicates there are no students in the group.'n/a' Indicates data reporting is not applicable for this group.'?' Indicates that the data for this item were statistically improbable or were reported outside a reasonable range.
Link to: PEIMS Financial Standard Reports 2017-18 Financial Actual Report
18-19 AAR Page 383
TEA | Governance and Accountability | Performance Reporting Page 42 December 2019
2018-19 Texas Academic Performance Report
District Name: WILLIS ISD
Campus Name: JJAEP
Campus Number: 170904004
2019 Accountability Rating: Not Rated
18-19 AAR Page 384

TEA | Governance and Accountability | Performance Reporting Page 43 December 2019
This page is intentionally blank.
18-19 AAR Page 385
TEA | Governance and Accountability | Performance Reporting Page 44 December 2019
TEXAS EDUCATION AGENCYDistrict Name: WILLIS ISD Texas Academic Performance Report Total Students: 3
Campus Name: JJAEP 2018-19 Campus STAAR Performance Grade Span: 09 - 11Campus Number: 170904004 School Type: High School
There is no data for this campus.
18-19 AAR Page 386
TEA | Governance and Accountability | Performance Reporting Page 45 December 2019
TEXAS EDUCATION AGENCYDistrict Name: WILLIS ISD Texas Academic Performance Report Total Students: 3
Campus Name: JJAEP 2018-19 Campus Progress Grade Span: 09 - 11Campus Number: 170904004 School Type: High School
There is no data for this campus.
18-19 AAR Page 387
TEA | Governance and Accountability | Performance Reporting Page 46 December 2019
TEXAS EDUCATION AGENCYDistrict Name: WILLIS ISD Texas Academic Performance Report Total Students: 3
Campus Name: JJAEP 2018-19 Campus Prior Year and Student Success Initiative Grade Span: 09 - 11Campus Number: 170904004 School Type: High School
There is no data for this campus.
18-19 AAR Page 388

TEA | Governance and Accountability | Performance Reporting Page 47 December 2019
TEXAS EDUCATION AGENCYDistrict Name: WILLIS ISD Texas Academic Performance Report Total Students: 3
Campus Name: JJAEP 2018-19 Campus STAAR Performance Grade Span: 09 - 11Campus Number: 170904004 Bilingual Education/English as a Second Language (Current EL Students)
There is no data for this campus.
18-19 AAR Page 389

TEA | Governance and Accountability | Performance Reporting Page 48 December 2019
TEXAS EDUCATION AGENCYDistrict Name: WILLIS ISD Texas Academic Performance Report Total Students: 3
Campus Name: JJAEP 2018-19 Campus STAAR Participation Grade Span: 09 - 11Campus Number: 170904004 School Type: High School
State District CampusAfrican
American Hispanic WhiteAmerican
Indian AsianPacific
Islander
Two orMore
RacesSpecial
EdEcon
DisadvEL
(Current)2019 STAARParticipation
(All Grades)
All TestsAssessment Participant 99% 100% - - - - - - - - - - -
Included in Accountability 94% 94% - - - - - - - - - - -Not Included in Accountability
Mobile 4% 5% - - - - - - - - - - -Other Exclusions 1% 1% - - - - - - - - - - -
Not Tested 1% 0% - - - - - - - - - - -Absent 1% 0% - - - - - - - - - - -Other 0% 0% - - - - - - - - - - -
2018 STAARParticipation(All Grades)
All TestsAssessment Participant 99% 100% - - - - - - - - - - -
Included in Accountability 94% 93% - - - - - - - - - - -Not Included in Accountability
Mobile 4% 6% - - - - - - - - - - -Other Exclusions 1% 0% - - - - - - - - - - -
Not Tested 1% 0% - - - - - - - - - - -Absent 1% 0% - - - - - - - - - - -Other 0% 0% - - - - - - - - - - -
18-19 AAR Page 390

TEA | Governance and Accountability | Performance Reporting Page 49 December 2019
TEXAS EDUCATION AGENCYDistrict Name: WILLIS ISD Texas Academic Performance Report Total Students: 3
Campus Name: JJAEP 2018-19 Campus Attendance, Graduation, and Dropout Rates Grade Span: 09 - 11Campus Number: 170904004 School Type: High School
State District CampusAfrican
American Hispanic WhiteAmerican
Indian AsianPacific
Islander
Two orMore
RacesSpecial
EdEcon
DisadvEL
(Current)
Attendance Rate2017-18 95.4% 95.0% * * * * - - - - - * -2016-17 95.7% 95.2% * - * * - - - - - * -
Annual Dropout Rate (Gr 7-8)2017-18 0.4% 0.1% * - * - - - - - - * -2016-17 0.3% 0.2% - - - - - - - - - - -
Annual Dropout Rate (Gr 9-12)2017-18 1.9% 2.9% * * - * - - - - - * -2016-17 1.9% 1.5% * - * * - - - - - * -
4-Year Longitudinal Rate (Gr 9-12)Class of 2018
Graduated 90.0% 86.4% - - - - - - - - - - -Received TxCHSE 0.4% 0.4% - - - - - - - - - - -Continued HS 3.8% 4.0% - - - - - - - - - - -Dropped Out 5.7% 9.1% - - - - - - - - - - -Graduates and TxCHSE 90.4% 86.8% - - - - - - - - - - -Graduates, TxCHSE,and Continuers 94.3% 90.9% - - - - - - - - - - -
Class of 2017Graduated 89.7% 89.3% - - - - - - - - - - -Received TxCHSE 0.4% 1.1% - - - - - - - - - - -Continued HS 4.0% 4.6% - - - - - - - - - - -Dropped Out 5.9% 5.0% - - - - - - - - - - -Graduates and TxCHSE 90.1% 90.4% - - - - - - - - - - -Graduates, TxCHSE,and Continuers 94.1% 95.0% - - - - - - - - - - -
5-Year Extended Longitudinal Rate (Gr 9-12)Class of 2017
Graduated 92.0% 92.0% - - - - - - - - - - -Received TxCHSE 0.6% 1.3% - - - - - - - - - - -Continued HS 1.1% 0.2% - - - - - - - - - - -Dropped Out 6.3% 6.5% - - - - - - - - - - -Graduates and TxCHSE 92.6% 93.3% - - - - - - - - - - -Graduates, TxCHSE,and Continuers 93.7% 93.5% - - - - - - - - - - -
Class of 2016Graduated 91.6% 93.7% - - - - - - - - - - -Received TxCHSE 0.7% 1.1% - - - - - - - - - - -Continued HS 1.2% 0.0% - - - - - - - - - - -Dropped Out 6.6% 5.2% - - - - - - - - - - -Graduates and TxCHSE 92.2% 94.8% - - - - - - - - - - -Graduates, TxCHSE,and Continuers 93.4% 94.8% - - - - - - - - - - -
6-Year Extended Longitudinal Rate (Gr 9-12)Class of 2016
Graduated 92.1% 93.9% - - - - - - - - - - -
18-19 AAR Page 391

TEA | Governance and Accountability | Performance Reporting Page 50 December 2019
TEXAS EDUCATION AGENCYDistrict Name: WILLIS ISD Texas Academic Performance Report Total Students: 3
Campus Name: JJAEP 2018-19 Campus Attendance, Graduation, and Dropout Rates Grade Span: 09 - 11Campus Number: 170904004 School Type: High School
State District CampusAfrican
American Hispanic WhiteAmerican
Indian AsianPacific
Islander
Two orMore
RacesSpecial
EdEcon
DisadvEL
(Current)Received TxCHSE 0.8% 1.1% - - - - - - - - - - -Continued HS 0.5% 0.0% - - - - - - - - - - -Dropped Out 6.6% 5.0% - - - - - - - - - - -Graduates and TxCHSE 92.9% 95.0% - - - - - - - - - - -Graduates, TxCHSE,and Continuers 93.4% 95.0% - - - - - - - - - - -
Class of 2015Graduated 91.8% 93.3% - - - - - - - - - - -Received TxCHSE 1.0% 1.4% - - - - - - - - - - -Continued HS 0.6% 0.2% - - - - - - - - - - -Dropped Out 6.7% 5.0% - - - - - - - - - - -Graduates and TxCHSE 92.8% 94.7% - - - - - - - - - - -Graduates, TxCHSE,and Continuers 93.3% 95.0% - - - - - - - - - - -
4-Year Federal Graduation Rate Without Exclusions (Gr 9-12)Class of 2018 90.0% 85.5% - - - - - - - - - - -Class of 2017 89.7% 88.6% - - - - - - - - - - -
RHSP/DAP Graduates (Longitudinal Rate)Class of 2018 68.5% * - - - - - - - - - - -Class of 2017 88.5% 89.1% - - - - - - - - - - -
FHSP-E Graduates (Longitudinal Rate)Class of 2018 5.0% 2.0% - - - - - - - - - - -Class of 2017 6.0% 0.0% - - - - - - - - - - -
FHSP-DLA Graduates (Longitudinal Rate)Class of 2018 82.0% 87.4% - - - - - - - - - - -Class of 2017 60.8% 14.3% - - - - - - - - - - -
RHSP/DAP/FHSP-E/FHSP-DLA Graduates (Longitudinal Rate)Class of 2018 86.8% 89.2% - - - - - - - - - - -Class of 2017 85.9% 87.8% - - - - - - - - - - -
RHSP/DAP Graduates (Annual Rate)2017-18 37.7% 37.5% - - - - - - - - - - -2016-17 87.2% 87.0% - - - - - - - - - - -
FHSP-E Graduates (Annual Rate)2017-18 4.9% 1.7% - - - - - - - - - - -2016-17 7.2% 11.1% - - - - - - - - - - -
FHSP-DLA Graduates (Annual Rate)2017-18 81.5% 87.2% - - - - - - - - - - -2016-17 56.5% 22.2% - - - - - - - - - - -
RHSP/DAP/FHSP-E/FHSP-DLA Graduates (Annual Rate)2017-18 85.1% 87.9% - - - - - - - - - - -2016-17 84.0% 85.9% - - - - - - - - - - -
18-19 AAR Page 392

TEA | Governance and Accountability | Performance Reporting Page 51 December 2019
TEXAS EDUCATION AGENCYDistrict Name: WILLIS ISD Texas Academic Performance Report Total Students: 3
Campus Name: JJAEP 2018-19 Campus Graduation Profile Grade Span: 09 - 11Campus Number: 170904004 School Type: High School
CampusCount
CampusPercent
DistrictCount
StateCount
Graduates (2017-18 Annual Graduates)Total Graduates - - 422 347,893
By Ethnicity:African American - - 31 43,502Hispanic - - 128 173,272White - - 247 107,052American Indian - - 3 1,226Asian - - 2 15,589Pacific Islander - - 2 528Two or More Races - - 9 6,724
By Graduation Type:Minimum H.S. Program - - 5 5,855Recommended H.S. Program/Distinguished Achievement Program - - 3 3,538Foundation H.S. Program (No Endorsement) - - 46 49,432Foundation H.S. Program (Endorsement) - - 7 16,542Foundation H.S. Program (DLA) - - 361 272,526
Special Education Graduates - - 27 25,962Economically Disadvantaged Graduates - - 181 166,956LEP Graduates - - 16 21,359At-Risk Graduates - - 137 144,805
18-19 AAR Page 393

TEA | Governance and Accountability | Performance Reporting Page 52 December 2019
TEXAS EDUCATION AGENCYDistrict Name: WILLIS ISD Texas Academic Performance Report Total Students: 3
Campus Name: JJAEP 2018-19 Campus College, Career, and Military Readiness (CCMR) Grade Span: 09 - 11Campus Number: 170904004 School Type: High School
State District CampusAfrican
American Hispanic WhiteAmerican
Indian AsianPacific
Islander
Two orMore
RacesSpecial
EdEcon
DisadvEL
(Current)College, Career, and Military Ready Graduates (Student Achievement) ***
College, Career, or Military Ready (Annual Graduates)2017-18 65.5% 64.0% - - - - - - - - - - -
College Ready Graduates ***College Ready (Annual Graduates)
2017-18 50.0% 34.4% - - - - - - - - - - -
TSI Criteria Graduates (Annual Graduates)English Language Arts
2017-18 58.2% 51.2% - - - - - - - - - - -Mathematics
2017-18 46.0% 29.9% - - - - - - - - - - -Both Subjects
2017-18 42.1% 28.4% - - - - - - - - - - -
Dual Course Credits (Annual Graduates)Any Subject
2017-18 20.7% 17.3% - - - - - - - - - - -2016-17 19.9% 21.6% - - - - - - - - - - -
AP/IB Met Criteria in Any Subject (Annual Graduates)Any Subject
2017-18 20.4% 9.5% - - - - - - - - - - -2016-17 20.1% 4.9% - - - - - - - - - - -
Associate's DegreeAssociate's Degree (Annual Graduates)
2017-18 1.4% 0.2% - - - - - - - - - - -2016-17 0.8% 0.0% - - - - - - - - - - -
OnRampsCourse Credits (Annual Graduates)2017-18 1.0% 0.0% - - - - - - - - - - -
Career/Military Ready GraduatesCareer or Military Ready (Annual Graduates)
2017-18 28.7% 41.6% - - - - - - - - - - -2016-17 13.2% 13.1% - - - - - - - - - - -
Approved Industry-Based Certification (Annual Graduates)2017-18 4.8% 9.0% - - - - - - - - - - -2016-17 2.7% 3.8% - - - - - - - - - - -
Graduate with Completed IEP and Workforce Readiness (Annual Graduates)2017-18 1.7% 6.2% - - - - - - - - - - -2016-17 1.0% 0.0% - - - - - - - - - - -
CTE Coherent Sequence Coursework Aligned with Industry-Based Certifications (Annual Graduates)2017-18 38.7% 58.8% - - - - - - - - - - -2016-17 17.3% 14.6% - - - - - - - - - - -
18-19 AAR Page 394

TEA | Governance and Accountability | Performance Reporting Page 53 December 2019
TEXAS EDUCATION AGENCYDistrict Name: WILLIS ISD Texas Academic Performance Report Total Students: 3
Campus Name: JJAEP 2018-19 Campus College, Career, and Military Readiness (CCMR) Grade Span: 09 - 11Campus Number: 170904004 School Type: High School
State District CampusAfrican
American Hispanic WhiteAmerican
Indian AsianPacific
Islander
Two orMore
RacesSpecial
EdEcon
DisadvEL
(Current)
U.S. Armed Forces Enlistment (Annual Graduates)2017-18 4.3% 3.3% - - - - - - - - - - -2016-17 2.2% 2.8% - - - - - - - - - - -
Graduates under an Advanced Degree Plan and Identified as a current Special Education Student (Annual Graduates)2017-18 2.6% 0.9% - - - - - - - - - - -
Graduates with Level I or Level II Certificate (Annual Graduates)2017-18 0.6% 0.0% - - - - - - - - - - -2016-17 0.5% 0.0% - - - - - - - - - - -
18-19 AAR Page 395

TEA | Governance and Accountability | Performance Reporting Page 54 December 2019
TEXAS EDUCATION AGENCYDistrict Name: WILLIS ISD Texas Academic Performance Report Total Students: 3
Campus Name: JJAEP 2018-19 Campus CCMR-Related Indicators Grade Span: 09 - 11Campus Number: 170904004 School Type: High School
State District CampusAfrican
American Hispanic WhiteAmerican
Indian AsianPacific
Islander
Two orMore
RacesSpecial
EdEcon
DisadvEL
(Current)TSIA Results (Graduates >= Criterion) (Annual Graduates)
Reading2017-18 32.1% 36.5% - - - - - - - - - - -2016-17 23.4% 11.3% - - - - - - - - - - -
Mathematics2017-18 23.7% 21.8% - - - - - - - - - - -2016-17 19.8% 11.3% - - - - - - - - - - -
Both Subjects2017-18 18.1% 17.8% - - - - - - - - - - -2016-17 12.9% 5.4% - - - - - - - - - - -
CTE Coherent Sequence (Annual Graduates)2017-18 58.4% 61.8% - - - - - - - - - - -2016-17 50.5% 30.1% - - - - - - - - - - -
Completed and Received Credit for College Prep Courses (Annual Graduates)English Language Arts
2017-18 2.0% 0.0% - - - - - - - - - - -2016-17 0.8% 0.0% - - - - - - - - - - -
Mathematics2017-18 3.9% 0.0% - - - - - - - - - - -2016-17 1.4% 0.0% - - - - - - - - - - -
Both Subjects2017-18 0.9% 0.0% - - - - - - - - - - -2016-17 0.2% 0.0% - - - - - - - - - - -
AP/IB Results (Participation) (Grades 11-12)All Subjects
2018 25.8% 10.3% - - - - - - - - n/a - n/a2017 26.2% 12.1% - - - - - - - - n/a - n/a
English Language Arts2018 15.3% 6.5% - - - - - - - - n/a - n/a2017 15.9% 5.8% - - - - - - - - n/a - n/a
Mathematics2018 7.3% 0.8% - - - - - - - - n/a - n/a2017 7.2% 0.8% - - - - - - - - n/a - n/a
Science2018 10.8% 4.4% - - - - - - - - n/a - n/a2017 10.9% 4.2% - - - - - - - - n/a - n/a
Social Studies2018 14.5% 4.9% - - - - - - - - n/a - n/a2017 15.0% 8.8% - - - - - - - - n/a - n/a
AP/IB Results (Examinees >= Criterion) (Grades 11-12)All Subjects
2018 50.7% 48.5% - - - - - - - - n/a - n/a2017 49.1% 39.3% - - - - - - - - n/a - n/a
English Language Arts2018 42.5% 33.9% - - - - - - - - n/a - n/a2017 41.3% 38.9% - - - - - - - - n/a - n/a
Mathematics2018 52.8% 12.5% - - - - - - - - n/a - n/a
18-19 AAR Page 396
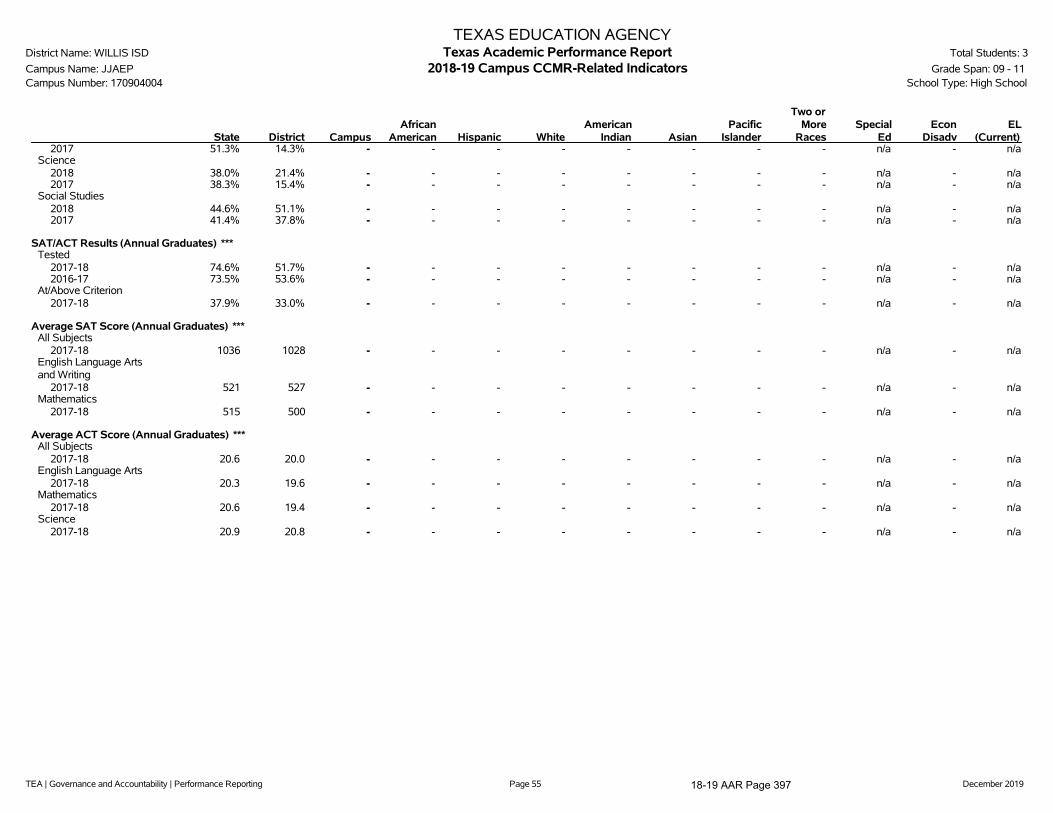
TEA | Governance and Accountability | Performance Reporting Page 55 December 2019
TEXAS EDUCATION AGENCYDistrict Name: WILLIS ISD Texas Academic Performance Report Total Students: 3
Campus Name: JJAEP 2018-19 Campus CCMR-Related Indicators Grade Span: 09 - 11Campus Number: 170904004 School Type: High School
State District CampusAfrican
American Hispanic WhiteAmerican
Indian AsianPacific
Islander
Two orMore
RacesSpecial
EdEcon
DisadvEL
(Current)2017 51.3% 14.3% - - - - - - - - n/a - n/a
Science2018 38.0% 21.4% - - - - - - - - n/a - n/a2017 38.3% 15.4% - - - - - - - - n/a - n/a
Social Studies2018 44.6% 51.1% - - - - - - - - n/a - n/a2017 41.4% 37.8% - - - - - - - - n/a - n/a
SAT/ACT Results (Annual Graduates) ***Tested
2017-18 74.6% 51.7% - - - - - - - - n/a - n/a2016-17 73.5% 53.6% - - - - - - - - n/a - n/a
At/Above Criterion2017-18 37.9% 33.0% - - - - - - - - n/a - n/a
Average SAT Score (Annual Graduates) ***All Subjects
2017-18 1036 1028 - - - - - - - - n/a - n/aEnglish Language Artsand Writing
2017-18 521 527 - - - - - - - - n/a - n/aMathematics
2017-18 515 500 - - - - - - - - n/a - n/a
Average ACT Score (Annual Graduates) ***All Subjects
2017-18 20.6 20.0 - - - - - - - - n/a - n/aEnglish Language Arts
2017-18 20.3 19.6 - - - - - - - - n/a - n/aMathematics
2017-18 20.6 19.4 - - - - - - - - n/a - n/aScience
2017-18 20.9 20.8 - - - - - - - - n/a - n/a
18-19 AAR Page 397

TEA | Governance and Accountability | Performance Reporting Page 56 December 2019
TEXAS EDUCATION AGENCYDistrict Name: WILLIS ISD Texas Academic Performance Report Total Students: 3
Campus Name: JJAEP 2018-19 Campus Other Postsecondary Indicators Grade Span: 09 - 11Campus Number: 170904004 School Type: High School
State District CampusAfrican
American Hispanic WhiteAmerican
Indian AsianPacific
Islander
Two orMore
RacesSpecial
EdEcon
DisadvEL
(Current)Advanced Dual-Credit Course Completion (Grades 9-12)
Any Subject2017-18 43.4% 32.6% - - - - - - - - - - -2016-17 37.1% 19.8% - - - - - - - - - - -
English Language Arts2017-18 17.3% 13.8% - - - - - - - - - - -2016-17 16.8% 13.1% - - - - - - - - - - -
Mathematics2017-18 20.7% 13.2% - - - - - - - - - - -2016-17 19.5% 12.1% - - - - - - - - - - -
Science2017-18 21.2% 19.7% - - - - - - - - - - -2016-17 5.7% 5.4% - - - - - - - - - - -
Social Studies2017-18 22.8% 11.7% - - - - - - - - - - -2016-17 21.8% 10.8% - - - - - - - - - - -
Graduates Enrolled in Texas Institution of Higher Education (TX IHE)2016-17 54.6% 48.0% - - - - - - - - - - -2015-16 54.7% 49.1% - - - - - - - - - - -
Graduates in TX IHE Completing One Year Without Enrollment in a Developmental Education Course2016-17 59.2% 54.6% - - - - - - - - - - -2015-16 55.7% 55.5% - - - - - - - - - - -
18-19 AAR Page 398

TEA | Governance and Accountability | Performance Reporting Page 57 December 2019
TEXAS EDUCATION AGENCYDistrict Name: WILLIS ISD Texas Academic Performance Report Total Students: 3
Campus Name: JJAEP 2018-19 Campus Student Information Grade Span: 09 - 11Campus Number: 170904004 School Type: High School
---------------- Campus ----------------Student Information Count Percent District State
Total Students 3 100.0% 7,469 5,416,400
Students by Grade:Early Childhood Education 0 0.0% 0.8% 0.3%Pre-Kindergarten 0 0.0% 2.3% 4.4%Kindergarten 0 0.0% 6.5% 6.9%Grade 1 0 0.0% 7.6% 7.1%Grade 2 0 0.0% 7.6% 7.2%Grade 3 0 0.0% 7.9% 7.3%Grade 4 0 0.0% 8.4% 7.6%Grade 5 0 0.0% 7.8% 7.7%Grade 6 0 0.0% 7.6% 7.7%Grade 7 0 0.0% 7.8% 7.5%Grade 8 0 0.0% 7.4% 7.5%Grade 9 2 66.7% 9.6% 8.1%Grade 10 0 0.0% 6.3% 7.4%Grade 11 1 33.3% 6.3% 6.9%Grade 12 0 0.0% 6.0% 6.5%
Ethnic Distribution:African American 0 0.0% 6.9% 12.6%Hispanic 0 0.0% 37.0% 52.6%White 3 100.0% 51.9% 27.4%American Indian 0 0.0% 0.4% 0.4%Asian 0 0.0% 0.6% 4.5%Pacific Islander 0 0.0% 0.1% 0.2%Two or More Races 0 0.0% 3.1% 2.4%
Economically Disadvantaged 3 100.0% 60.1% 60.6%Non-Educationally Disadvantaged 0 0.0% 39.9% 39.4%Section 504 Students 0 0.0% 6.1% 6.5%English Learners (EL) 0 0.0% 14.4% 19.5%Students w/ Disciplinary Placements (2017-18) 0 0.0% 1.8% 1.4%Students w/ Dyslexia 0 0.0% 2.6% 3.6%At-Risk 2 66.7% 50.8% 50.1%
Students with Disabilities by Type of Primary Disability:Total Students with Disabilities *By Type of Primary Disability
Students with Intellectual Disabilities 0 0.0% 38.4% 42.4%Students with Physical Disabilities 0 0.0% 21.4% 21.9%Students with Autism 0 0.0% 19.0% 13.7%Students with Behavioral Disabilities * * 19.2% 20.6%Students with Non-Categorical Early Childhood 0 0.0% 2.1% 1.4%
Mobility (2017-18):Total Mobile Students 7 100.0% 19.0% 15.4%
18-19 AAR Page 399

TEA | Governance and Accountability | Performance Reporting Page 58 December 2019
TEXAS EDUCATION AGENCYDistrict Name: WILLIS ISD Texas Academic Performance Report Total Students: 3
Campus Name: JJAEP 2018-19 Campus Student Information Grade Span: 09 - 11Campus Number: 170904004 School Type: High School
---------------- Campus ----------------Student Information Count Percent District State
By Ethnicity:African American 2 28.6%Hispanic 3 42.9%White 2 28.6%American Indian 0 0.0%Asian 0 0.0%Pacific Islander 0 0.0%Two or More Races 0 0.0%
--------Non-Special Education Rates-------- --------Special Education Rates--------Student Information Campus District State Campus District State
Retention Rates by Grade:Kindergarten - 0.4% 1.7% - 3.8% 6.2%Grade 1 - 2.0% 3.1% - 5.7% 5.5%Grade 2 - 1.3% 1.8% - 2.2% 2.3%Grade 3 - 1.2% 1.1% - 2.1% 0.9%Grade 4 - 0.0% 0.5% - 0.0% 0.5%Grade 5 - 0.2% 0.5% - 1.8% 0.6%Grade 6 0.0% 0.4% 0.4% - 0.0% 0.5%Grade 7 0.0% 1.0% 0.6% - 0.0% 0.6%Grade 8 0.0% 0.0% 0.4% - 0.0% 0.7%Grade 9 0.0% 17.2% 7.2% - 34.0% 12.7%
Class Size Information Campus District State
Class Size Averages by Grade and Subject(Derived from teacher responsibility records):
Elementary:Kindergarten - 20.9 18.9Grade 1 - 19.8 18.8Grade 2 - 19.1 18.7Grade 3 - 20.1 18.9Grade 4 - 20.0 19.2Grade 5 - 23.0 21.2Grade 6 - 19.3 20.4
Secondary:English/Language Arts - 15.9 16.6Foreign Languages - 21.8 18.9Mathematics - 16.7 17.8Science - 18.4 18.9Social Studies - 18.1 19.3
18-19 AAR Page 400

TEA | Governance and Accountability | Performance Reporting Page 59 December 2019
TEXAS EDUCATION AGENCYDistrict Name: WILLIS ISD Texas Academic Performance Report Total Students: 3
Campus Name: JJAEP 2018-19 Campus Staff Information Grade Span: 09 - 11Campus Number: 170904004 School Type: High School
---------------- Campus ----------------Staff Information Count/Average Percent District State
Total Staff - 100.0% 100.0% 100.0%
Professional Staff: - - 57.6% 64.1%Teachers - - 44.8% 49.8%Professional Support - - 9.2% 10.1%Campus Administration (School Leadership) - - 2.9% 3.0%
Educational Aides: - - 11.0% 10.3%
Librarians & Counselors (Headcount):Librarians
Full-time - n/a 0.0 4,414.0Part-time - n/a 0.0 572.0
CounselorsFull-time - n/a 12.0 12,433.0Part-time - n/a 2.0 1,097.0
Total Minority Staff: - - 27.1% 50.4%
Teachers by Ethnicity and Sex:African American - - 2.8% 10.6%Hispanic - - 14.2% 27.7%White - - 82.1% 58.4%American Indian - - 0.2% 0.3%Asian - - 0.2% 1.7%Pacific Islander - - 0.0% 0.2%Two or More Races - - 0.5% 1.1%
Males - - 18.6% 23.8%Females - - 81.4% 76.2%
Teachers by Highest Degree Held:No Degree - - 0.5% 1.4%Bachelors - - 81.7% 73.6%Masters - - 17.4% 24.3%Doctorate - - 0.5% 0.7%
Teachers by Years of Experience:Beginning Teachers - - 8.0% 7.0%1-5 Years Experience - - 31.7% 28.9%6-10 Years Experience - - 17.5% 19.0%11-20 Years Experience - - 24.9% 29.3%Over 20 Years Experience - - 17.9% 15.7%
Number of Students per Teacher - n/a 17.2 15.1
18-19 AAR Page 401

TEA | Governance and Accountability | Performance Reporting Page 60 December 2019
TEXAS EDUCATION AGENCYDistrict Name: WILLIS ISD Texas Academic Performance Report Total Students: 3
Campus Name: JJAEP 2018-19 Campus Staff Information Grade Span: 09 - 11Campus Number: 170904004 School Type: High School
Staff Information Campus District State
Experience of Campus Leadership:Average Years Experience of Principals - 2.8 6.3Average Years Experience of Principals with District - 2.8 5.4Average Years Experience of Assistant Principals - 6.1 5.3Average Years Experience of Assistant Principals with District - 4.2 4.7
Average Years Experience of Teachers: - 10.7 11.1Average Years Experience of Teachers with District: - 6.5 7.2
Average Teacher Salary by Years of Experience (regular duties only):Beginning Teachers - $45,854 $47,2181-5 Years Experience - $50,779 $50,4086-10 Years Experience - $52,839 $52,78611-20 Years Experience - $57,036 $56,041Over 20 Years Experience - $63,917 $62,039
Average Actual Salaries (regular duties only):Teachers - $54,658 $54,122Professional Support - $65,409 $64,069Campus Administration (School Leadership) - $78,467 $78,947
Instructional Staff Percent: n/a 60.4% 64.5%
Contracted Instructional Staff (not incl. above): - 1.5 6,043.6
18-19 AAR Page 402

TEA | Governance and Accountability | Performance Reporting Page 61 December 2019
TEXAS EDUCATION AGENCYDistrict Name: WILLIS ISD Texas Academic Performance Report Total Students: 3
Campus Name: JJAEP 2018-19 Campus Staff Information Grade Span: 09 - 11Campus Number: 170904004 School Type: High School
---------------- Campus ----------------Program Information Count Percent District State
Student Enrollment by Program:Bilingual/ESL Education 0 0.0% 13.6% 19.7%Career & Technical Education 0 0.0% 21.5% 26.3%Gifted & Talented Education 1 33.3% 5.4% 8.1%Special Education 1 33.3% 8.4% 9.6%
Teachers by Program (population served):Bilingual/ESL Education - - 2.8% 6.4%Career & Technical Education - - 4.5% 4.9%Compensatory Education - - 0.0% 2.7%Gifted & Talented Education - - 0.0% 2.0%Regular Education - - 76.9% 71.4%Special Education - - 8.5% 9.1%Other - - 7.3% 3.6%
' '̂ Indicates that rates for reading and mathematics are based on the cumulative results from the first and second administrations of STAAR.'*' Indicates results are masked due to small numbers to protect student confidentiality.'**' When only one student disability group is masked, then the second smallest student disability group is masked regardless of size.'***' Due to changes in the evaluation of SAT/ACT results (for 2017-18 the best result was used, rather than the most recent), 2016-17 SAT/ACT results are not
comparable and, where applicable, are not shown.'-' Indicates there are no students in the group.'n/a' Indicates data reporting is not applicable for this group.'?' Indicates that the data for this item were statistically improbable or were reported outside a reasonable range.
Link to: PEIMS Financial Standard Reports 2017-18 Financial Actual Report
18-19 AAR Page 403

TEA | Governance and Accountability | Performance Reporting Page 62 December 2019
2018-19 Texas Academic Performance Report
District Name: WILLIS ISD
Campus Name: LYNN LUCAS MIDDLE
Campus Number: 170904042
2019 Accountability Rating: D
18-19 AAR Page 404

TEA | Governance and Accountability | Performance Reporting Page 63 December 2019
This page is intentionally blank.
18-19 AAR Page 405
TEA | Governance and Accountability | Performance Reporting Page 64 December 2019
TEXAS EDUCATION AGENCYDistrict Name: WILLIS ISD Texas Academic Performance Report Total Students: 810
Campus Name: LYNN LUCAS MIDDLE 2018-19 Campus STAAR Performance Grade Span: 06 - 08Campus Number: 170904042 School Type: Middle
18-19 AAR Page 406
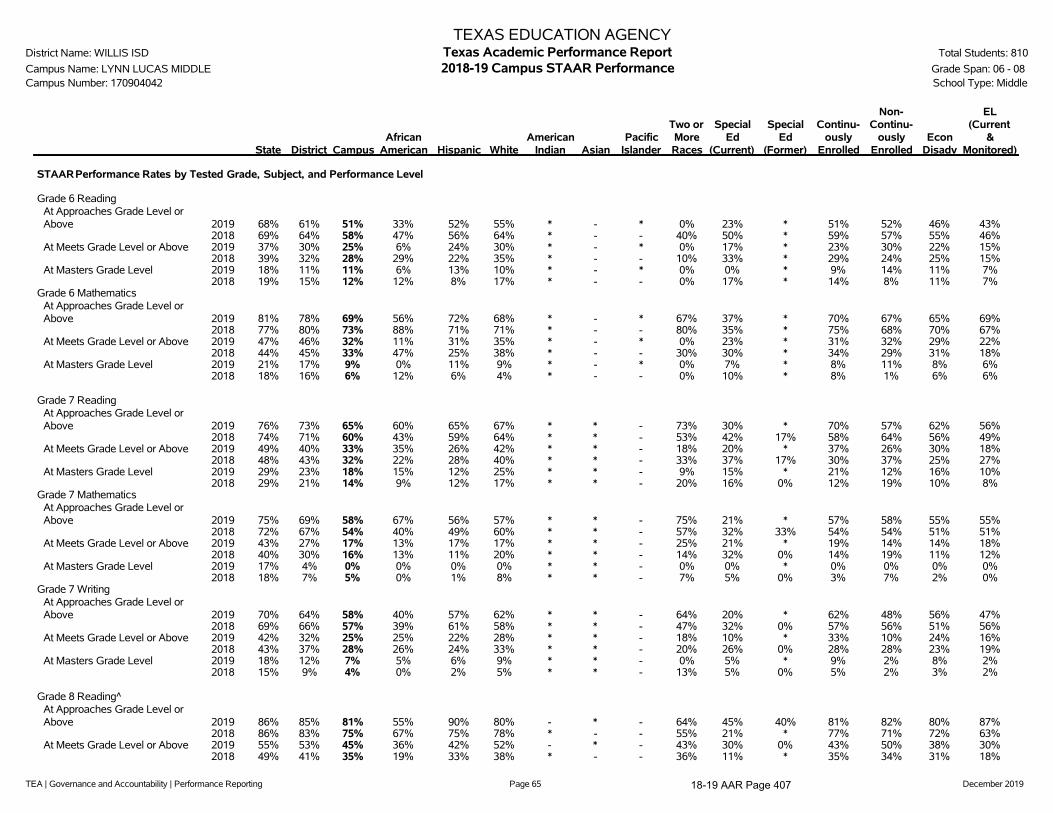
TEA | Governance and Accountability | Performance Reporting Page 65 December 2019
TEXAS EDUCATION AGENCYDistrict Name: WILLIS ISD Texas Academic Performance Report Total Students: 810
Campus Name: LYNN LUCAS MIDDLE 2018-19 Campus STAAR Performance Grade Span: 06 - 08Campus Number: 170904042 School Type: Middle
State District CampusAfrican
American Hispanic WhiteAmerican
Indian AsianPacific
Islander
Two orMoreRaces
SpecialEd
(Current)
SpecialEd
(Former)
Continu-ously
Enrolled
Non-Continu-
ouslyEnrolled
EconDisadv
EL(Current
&Monitored)
STAARPerformance Rates by Tested Grade, Subject, and Performance Level
Grade 6 ReadingAt Approaches Grade Level orAbove 2019 68% 61% 51% 33% 52% 55% * - * 0% 23% * 51% 52% 46% 43%
2018 69% 64% 58% 47% 56% 64% * - - 40% 50% * 59% 57% 55% 46%At Meets Grade Level or Above 2019 37% 30% 25% 6% 24% 30% * - * 0% 17% * 23% 30% 22% 15%
2018 39% 32% 28% 29% 22% 35% * - - 10% 33% * 29% 24% 25% 15%At Masters Grade Level 2019 18% 11% 11% 6% 13% 10% * - * 0% 0% * 9% 14% 11% 7%
2018 19% 15% 12% 12% 8% 17% * - - 0% 17% * 14% 8% 11% 7%Grade 6 Mathematics
At Approaches Grade Level orAbove 2019 81% 78% 69% 56% 72% 68% * - * 67% 37% * 70% 67% 65% 69%
2018 77% 80% 73% 88% 71% 71% * - - 80% 35% * 75% 68% 70% 67%At Meets Grade Level or Above 2019 47% 46% 32% 11% 31% 35% * - * 0% 23% * 31% 32% 29% 22%
2018 44% 45% 33% 47% 25% 38% * - - 30% 30% * 34% 29% 31% 18%At Masters Grade Level 2019 21% 17% 9% 0% 11% 9% * - * 0% 7% * 8% 11% 8% 6%
2018 18% 16% 6% 12% 6% 4% * - - 0% 10% * 8% 1% 6% 6%
Grade 7 ReadingAt Approaches Grade Level orAbove 2019 76% 73% 65% 60% 65% 67% * * - 73% 30% * 70% 57% 62% 56%
2018 74% 71% 60% 43% 59% 64% * * - 53% 42% 17% 58% 64% 56% 49%At Meets Grade Level or Above 2019 49% 40% 33% 35% 26% 42% * * - 18% 20% * 37% 26% 30% 18%
2018 48% 43% 32% 22% 28% 40% * * - 33% 37% 17% 30% 37% 25% 27%At Masters Grade Level 2019 29% 23% 18% 15% 12% 25% * * - 9% 15% * 21% 12% 16% 10%
2018 29% 21% 14% 9% 12% 17% * * - 20% 16% 0% 12% 19% 10% 8%Grade 7 Mathematics
At Approaches Grade Level orAbove 2019 75% 69% 58% 67% 56% 57% * * - 75% 21% * 57% 58% 55% 55%
2018 72% 67% 54% 40% 49% 60% * * - 57% 32% 33% 54% 54% 51% 51%At Meets Grade Level or Above 2019 43% 27% 17% 13% 17% 17% * * - 25% 21% * 19% 14% 14% 18%
2018 40% 30% 16% 13% 11% 20% * * - 14% 32% 0% 14% 19% 11% 12%At Masters Grade Level 2019 17% 4% 0% 0% 0% 0% * * - 0% 0% * 0% 0% 0% 0%
2018 18% 7% 5% 0% 1% 8% * * - 7% 5% 0% 3% 7% 2% 0%Grade 7 Writing
At Approaches Grade Level orAbove 2019 70% 64% 58% 40% 57% 62% * * - 64% 20% * 62% 48% 56% 47%
2018 69% 66% 57% 39% 61% 58% * * - 47% 32% 0% 57% 56% 51% 56%At Meets Grade Level or Above 2019 42% 32% 25% 25% 22% 28% * * - 18% 10% * 33% 10% 24% 16%
2018 43% 37% 28% 26% 24% 33% * * - 20% 26% 0% 28% 28% 23% 19%At Masters Grade Level 2019 18% 12% 7% 5% 6% 9% * * - 0% 5% * 9% 2% 8% 2%
2018 15% 9% 4% 0% 2% 5% * * - 13% 5% 0% 5% 2% 3% 2%
Grade 8 Reading^At Approaches Grade Level orAbove 2019 86% 85% 81% 55% 90% 80% - * - 64% 45% 40% 81% 82% 80% 87%
2018 86% 83% 75% 67% 75% 78% * - - 55% 21% * 77% 71% 72% 63%At Meets Grade Level or Above 2019 55% 53% 45% 36% 42% 52% - * - 43% 30% 0% 43% 50% 38% 30%
2018 49% 41% 35% 19% 33% 38% * - - 36% 11% * 35% 34% 31% 18%
18-19 AAR Page 407

TEA | Governance and Accountability | Performance Reporting Page 66 December 2019
TEXAS EDUCATION AGENCYDistrict Name: WILLIS ISD Texas Academic Performance Report Total Students: 810
Campus Name: LYNN LUCAS MIDDLE 2018-19 Campus STAAR Performance Grade Span: 06 - 08Campus Number: 170904042 School Type: Middle
State District CampusAfrican
American Hispanic WhiteAmerican
Indian AsianPacific
Islander
Two orMoreRaces
SpecialEd
(Current)
SpecialEd
(Former)
Continu-ously
Enrolled
Non-Continu-
ouslyEnrolled
EconDisadv
EL(Current
&Monitored)
At Masters Grade Level 2019 28% 25% 17% 14% 14% 19% - * - 29% 5% 0% 16% 20% 14% 6%2018 27% 21% 15% 5% 14% 18% * - - 18% 7% * 15% 16% 14% 8%
Grade 8 Mathematics^At Approaches Grade Level orAbove 2019 88% 87% 81% 45% 90% 83% * * - 63% 52% 67% 83% 76% 79% 90%
2018 86% 85% 72% 73% 72% 74% * - - 50% 20% * 73% 71% 66% 67%At Meets Grade Level or Above 2019 57% 56% 39% 25% 36% 46% * * - 25% 29% 17% 40% 35% 37% 29%
2018 51% 49% 24% 31% 22% 26% * - - 10% 10% * 23% 26% 22% 19%At Masters Grade Level 2019 17% 15% 4% 5% 3% 6% * * - 0% 0% 0% 3% 7% 4% 2%
2018 15% 16% 2% 0% 3% 2% * - - 0% 0% * 2% 2% 2% 0%Grade 8 Science
At Approaches Grade Level orAbove 2019 81% 80% 72% 59% 70% 77% - * - 64% 55% 60% 70% 75% 69% 65%
2018 76% 74% 64% 52% 62% 70% * - - 45% 17% * 64% 66% 62% 50%At Meets Grade Level or Above 2019 51% 48% 41% 32% 33% 52% - * - 36% 40% 20% 39% 45% 36% 20%
2018 52% 47% 35% 19% 26% 46% * - - 18% 10% * 37% 32% 31% 14%At Masters Grade Level 2019 25% 22% 15% 14% 10% 20% - * - 14% 15% 0% 13% 21% 11% 6%
2018 28% 22% 17% 5% 10% 25% * - - 9% 3% * 18% 16% 15% 6%Grade 8 Social Studies
At Approaches Grade Level orAbove 2019 69% 70% 64% 45% 64% 69% - * - 50% 35% 20% 64% 66% 62% 59%
2018 65% 67% 62% 53% 60% 65% * - - 55% 24% * 63% 62% 61% 47%At Meets Grade Level or Above 2019 37% 35% 29% 27% 21% 38% - * - 21% 25% 0% 28% 32% 23% 13%
2018 36% 29% 29% 16% 23% 35% * - - 27% 10% * 28% 31% 25% 14%At Masters Grade Level 2019 21% 15% 12% 9% 8% 16% - * - 14% 15% 0% 9% 18% 9% 2%
2018 21% 14% 14% 5% 11% 18% * - - 18% 10% * 14% 17% 12% 6%End of Course Algebra I
At Approaches Grade Level orAbove 2019 85% 79% 100% 100% 100% 100% - - - * - - 100% 100% 100% 100%
2018 83% 78% 100% * 100% 100% - - - * - - 100% 100% 100% 100%At Meets Grade Level or Above 2019 61% 46% 75% 50% 89% 70% - - - * - - 74% 79% 73% 78%
2018 55% 49% 81% * 84% 83% - - - * - - 81% 77% 79% 100%At Masters Grade Level 2019 37% 25% 38% 0% 44% 41% - - - * - - 35% 47% 33% 44%
2018 32% 27% 39% * 32% 45% - - - * - - 39% 38% 34% 50%
All Grades All SubjectsAt Approaches Grade Level orAbove 2019 78% 76% 68% 53% 69% 70% 63% 64% * 60% 35% 50% 69% 65% 65% 63%
2018 77% 75% 65% 57% 64% 69% 92% 67% - 54% 28% 48% 66% 64% 62% 56%At Meets Grade Level or Above 2019 50% 45% 33% 25% 30% 39% 63% 9% * 25% 24% 18% 34% 31% 29% 21%
2018 48% 45% 31% 25% 26% 37% 23% 17% - 23% 20% 23% 31% 30% 27% 19%At Masters Grade Level 2019 24% 19% 11% 8% 10% 14% 25% 0% * 10% 7% 5% 11% 12% 10% 5%
2018 22% 18% 11% 5% 8% 14% 15% 0% - 11% 8% 6% 11% 10% 9% 6%All Grades ELA/Reading
At Approaches Grade Level orAbove 2019 75% 72% 66% 50% 69% 66% * * * 55% 31% 46% 67% 63% 63% 60%
2018 74% 72% 65% 52% 63% 70% * * - 50% 35% 50% 65% 64% 61% 52%At Meets Grade Level or Above 2019 48% 43% 34% 27% 30% 41% * * * 26% 21% 15% 34% 35% 30% 20%
2018 46% 41% 32% 23% 27% 38% * * - 28% 25% 20% 32% 32% 27% 20%At Masters Grade Level 2019 21% 17% 15% 12% 13% 18% * * * 16% 6% 15% 15% 15% 14% 8%
2018 19% 16% 14% 8% 11% 17% * * - 14% 12% 10% 14% 15% 12% 8%
18-19 AAR Page 408
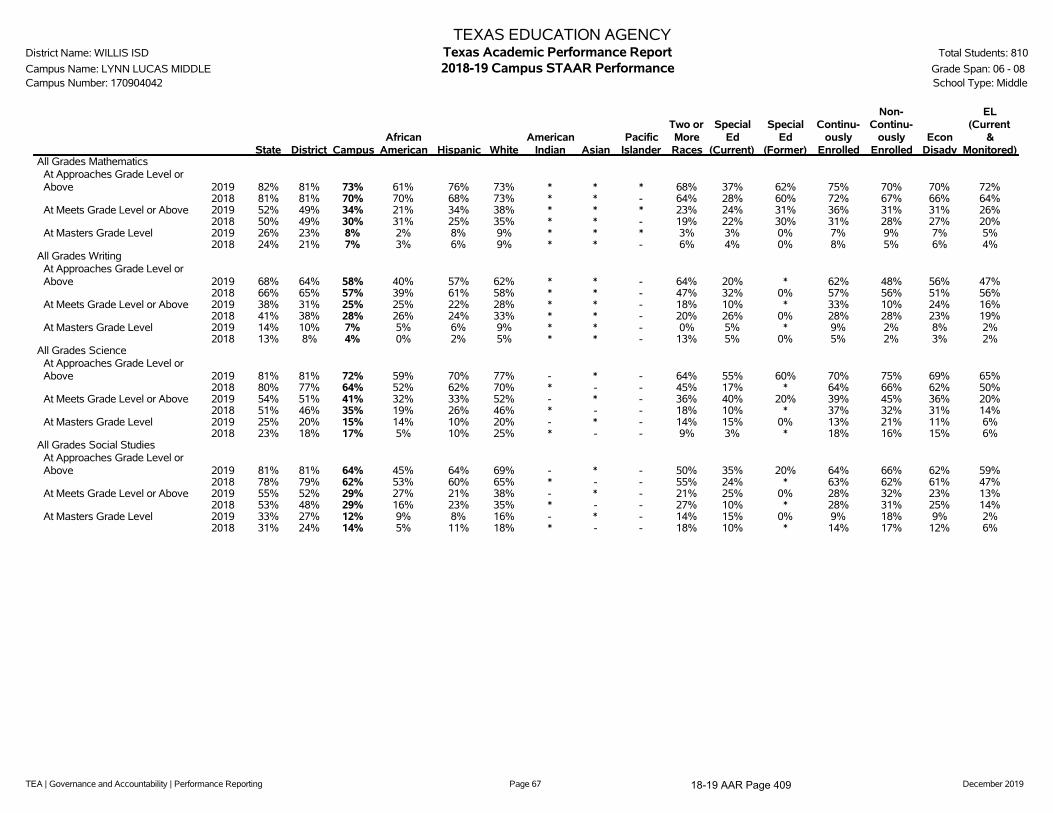
TEA | Governance and Accountability | Performance Reporting Page 67 December 2019
TEXAS EDUCATION AGENCYDistrict Name: WILLIS ISD Texas Academic Performance Report Total Students: 810
Campus Name: LYNN LUCAS MIDDLE 2018-19 Campus STAAR Performance Grade Span: 06 - 08Campus Number: 170904042 School Type: Middle
State District CampusAfrican
American Hispanic WhiteAmerican
Indian AsianPacific
Islander
Two orMoreRaces
SpecialEd
(Current)
SpecialEd
(Former)
Continu-ously
Enrolled
Non-Continu-
ouslyEnrolled
EconDisadv
EL(Current
&Monitored)
All Grades MathematicsAt Approaches Grade Level orAbove 2019 82% 81% 73% 61% 76% 73% * * * 68% 37% 62% 75% 70% 70% 72%
2018 81% 81% 70% 70% 68% 73% * * - 64% 28% 60% 72% 67% 66% 64%At Meets Grade Level or Above 2019 52% 49% 34% 21% 34% 38% * * * 23% 24% 31% 36% 31% 31% 26%
2018 50% 49% 30% 31% 25% 35% * * - 19% 22% 30% 31% 28% 27% 20%At Masters Grade Level 2019 26% 23% 8% 2% 8% 9% * * * 3% 3% 0% 7% 9% 7% 5%
2018 24% 21% 7% 3% 6% 9% * * - 6% 4% 0% 8% 5% 6% 4%All Grades Writing
At Approaches Grade Level orAbove 2019 68% 64% 58% 40% 57% 62% * * - 64% 20% * 62% 48% 56% 47%
2018 66% 65% 57% 39% 61% 58% * * - 47% 32% 0% 57% 56% 51% 56%At Meets Grade Level or Above 2019 38% 31% 25% 25% 22% 28% * * - 18% 10% * 33% 10% 24% 16%
2018 41% 38% 28% 26% 24% 33% * * - 20% 26% 0% 28% 28% 23% 19%At Masters Grade Level 2019 14% 10% 7% 5% 6% 9% * * - 0% 5% * 9% 2% 8% 2%
2018 13% 8% 4% 0% 2% 5% * * - 13% 5% 0% 5% 2% 3% 2%All Grades Science
At Approaches Grade Level orAbove 2019 81% 81% 72% 59% 70% 77% - * - 64% 55% 60% 70% 75% 69% 65%
2018 80% 77% 64% 52% 62% 70% * - - 45% 17% * 64% 66% 62% 50%At Meets Grade Level or Above 2019 54% 51% 41% 32% 33% 52% - * - 36% 40% 20% 39% 45% 36% 20%
2018 51% 46% 35% 19% 26% 46% * - - 18% 10% * 37% 32% 31% 14%At Masters Grade Level 2019 25% 20% 15% 14% 10% 20% - * - 14% 15% 0% 13% 21% 11% 6%
2018 23% 18% 17% 5% 10% 25% * - - 9% 3% * 18% 16% 15% 6%All Grades Social Studies
At Approaches Grade Level orAbove 2019 81% 81% 64% 45% 64% 69% - * - 50% 35% 20% 64% 66% 62% 59%
2018 78% 79% 62% 53% 60% 65% * - - 55% 24% * 63% 62% 61% 47%At Meets Grade Level or Above 2019 55% 52% 29% 27% 21% 38% - * - 21% 25% 0% 28% 32% 23% 13%
2018 53% 48% 29% 16% 23% 35% * - - 27% 10% * 28% 31% 25% 14%At Masters Grade Level 2019 33% 27% 12% 9% 8% 16% - * - 14% 15% 0% 9% 18% 9% 2%
2018 31% 24% 14% 5% 11% 18% * - - 18% 10% * 14% 17% 12% 6%
18-19 AAR Page 409
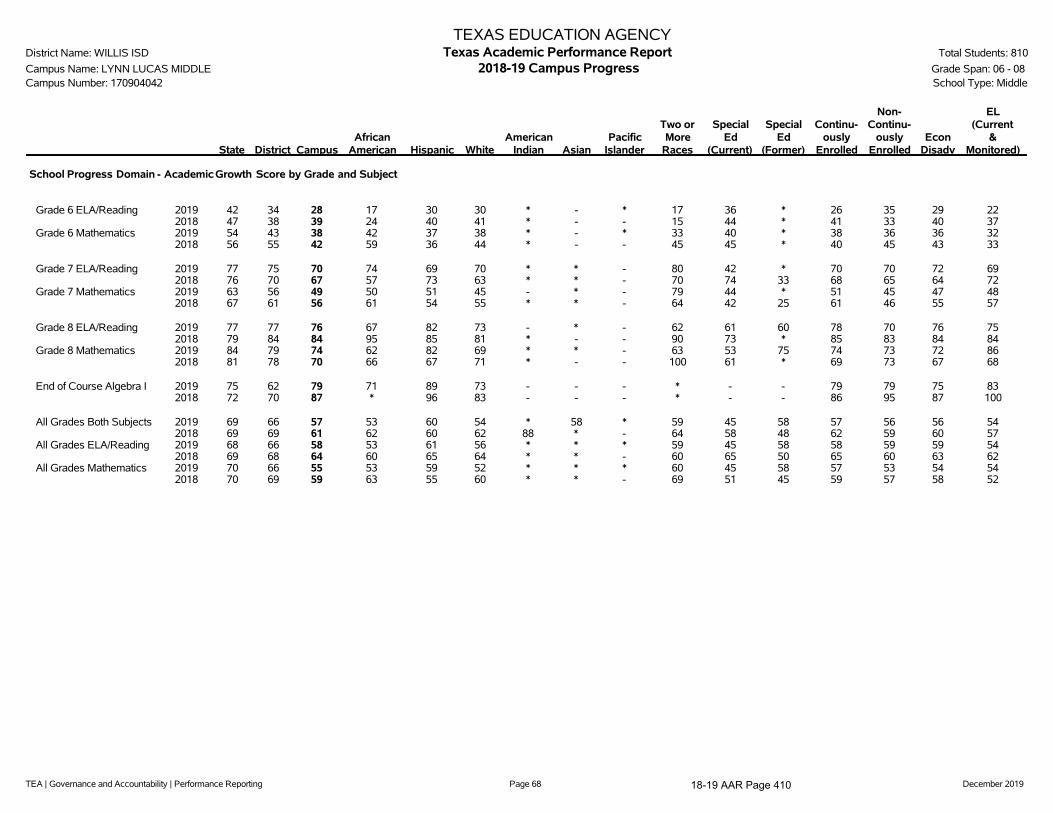
TEA | Governance and Accountability | Performance Reporting Page 68 December 2019
TEXAS EDUCATION AGENCYDistrict Name: WILLIS ISD Texas Academic Performance Report Total Students: 810
Campus Name: LYNN LUCAS MIDDLE 2018-19 Campus Progress Grade Span: 06 - 08Campus Number: 170904042 School Type: Middle
State District CampusAfrican
American Hispanic WhiteAmerican
Indian AsianPacific
Islander
Two orMore
Races
SpecialEd
(Current)
SpecialEd
(Former)
Continu-ously
Enrolled
Non-Continu-
ouslyEnrolled
EconDisadv
EL(Current
&Monitored)
School Progress Domain - Academic Growth Score by Grade and Subject
Grade 6 ELA/Reading 2019 42 34 28 17 30 30 * - * 17 36 * 26 35 29 222018 47 38 39 24 40 41 * - - 15 44 * 41 33 40 37
Grade 6 Mathematics 2019 54 43 38 42 37 38 * - * 33 40 * 38 36 36 322018 56 55 42 59 36 44 * - - 45 45 * 40 45 43 33
Grade 7 ELA/Reading 2019 77 75 70 74 69 70 * * - 80 42 * 70 70 72 692018 76 70 67 57 73 63 * * - 70 74 33 68 65 64 72
Grade 7 Mathematics 2019 63 56 49 50 51 45 - * - 79 44 * 51 45 47 482018 67 61 56 61 54 55 * * - 64 42 25 61 46 55 57
Grade 8 ELA/Reading 2019 77 77 76 67 82 73 - * - 62 61 60 78 70 76 752018 79 84 84 95 85 81 * - - 90 73 * 85 83 84 84
Grade 8 Mathematics 2019 84 79 74 62 82 69 * * - 63 53 75 74 73 72 862018 81 78 70 66 67 71 * - - 100 61 * 69 73 67 68
End of Course Algebra I 2019 75 62 79 71 89 73 - - - * - - 79 79 75 832018 72 70 87 * 96 83 - - - * - - 86 95 87 100
All Grades Both Subjects 2019 69 66 57 53 60 54 * 58 * 59 45 58 57 56 56 542018 69 69 61 62 60 62 88 * - 64 58 48 62 59 60 57
All Grades ELA/Reading 2019 68 66 58 53 61 56 * * * 59 45 58 58 59 59 542018 69 68 64 60 65 64 * * - 60 65 50 65 60 63 62
All Grades Mathematics 2019 70 66 55 53 59 52 * * * 60 45 58 57 53 54 542018 70 69 59 63 55 60 * * - 69 51 45 59 57 58 52
18-19 AAR Page 410
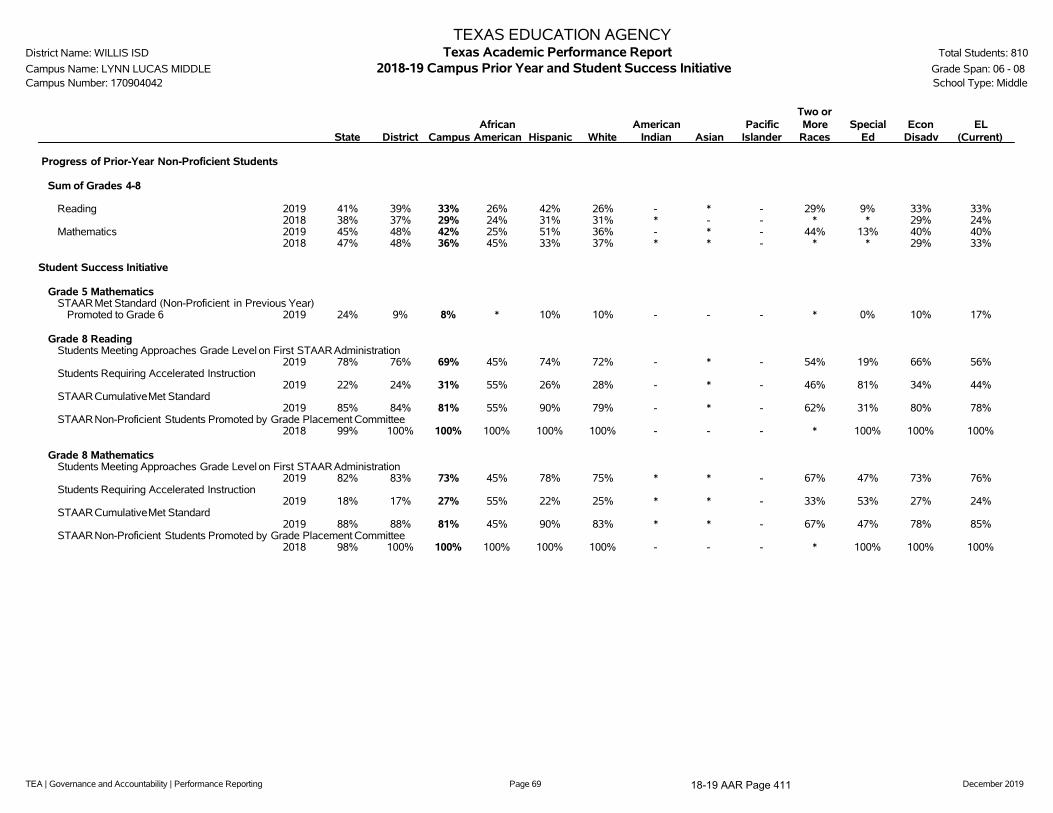
TEA | Governance and Accountability | Performance Reporting Page 69 December 2019
TEXAS EDUCATION AGENCYDistrict Name: WILLIS ISD Texas Academic Performance Report Total Students: 810
Campus Name: LYNN LUCAS MIDDLE 2018-19 Campus Prior Year and Student Success Initiative Grade Span: 06 - 08Campus Number: 170904042 School Type: Middle
State District CampusAfrican
American Hispanic WhiteAmerican
Indian AsianPacific
Islander
Two orMore
RacesSpecial
EdEcon
DisadvEL
(Current)
Progress of Prior-Year Non-Proficient Students
Sum of Grades 4-8
Reading 2019 41% 39% 33% 26% 42% 26% - * - 29% 9% 33% 33%2018 38% 37% 29% 24% 31% 31% * - - * * 29% 24%
Mathematics 2019 45% 48% 42% 25% 51% 36% - * - 44% 13% 40% 40%2018 47% 48% 36% 45% 33% 37% * * - * * 29% 33%
Student Success Initiative
Grade 5 MathematicsSTAARMet Standard (Non-Proficient in Previous Year)
Promoted to Grade 6 2019 24% 9% 8% * 10% 10% - - - * 0% 10% 17%
Grade 8 ReadingStudents Meeting Approaches Grade Level on First STAARAdministration
2019 78% 76% 69% 45% 74% 72% - * - 54% 19% 66% 56%Students Requiring Accelerated Instruction
2019 22% 24% 31% 55% 26% 28% - * - 46% 81% 34% 44%STAARCumulativeMet Standard
2019 85% 84% 81% 55% 90% 79% - * - 62% 31% 80% 78%STAARNon-Proficient Students Promoted by Grade Placement Committee
2018 99% 100% 100% 100% 100% 100% - - - * 100% 100% 100%
Grade 8 MathematicsStudents Meeting Approaches Grade Level on First STAARAdministration
2019 82% 83% 73% 45% 78% 75% * * - 67% 47% 73% 76%Students Requiring Accelerated Instruction
2019 18% 17% 27% 55% 22% 25% * * - 33% 53% 27% 24%STAARCumulativeMet Standard
2019 88% 88% 81% 45% 90% 83% * * - 67% 47% 78% 85%STAARNon-Proficient Students Promoted by Grade Placement Committee
2018 98% 100% 100% 100% 100% 100% - - - * 100% 100% 100%
18-19 AAR Page 411
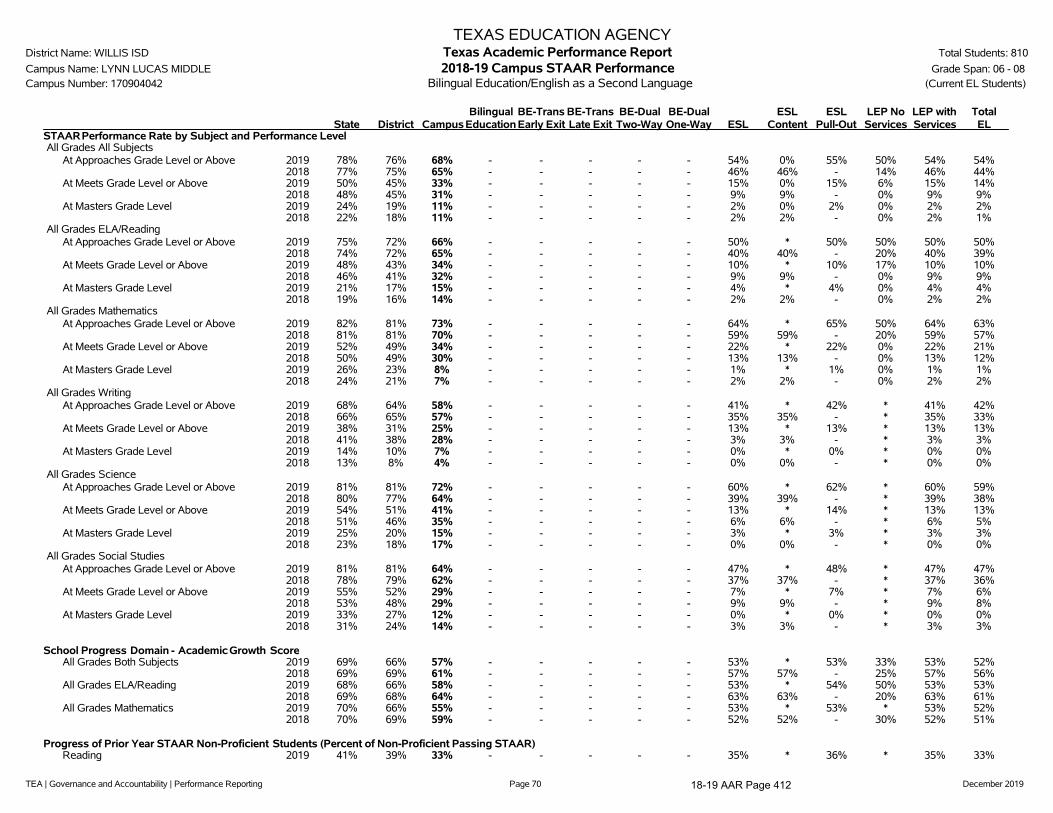
TEA | Governance and Accountability | Performance Reporting Page 70 December 2019
TEXAS EDUCATION AGENCYDistrict Name: WILLIS ISD Texas Academic Performance Report Total Students: 810
Campus Name: LYNN LUCAS MIDDLE 2018-19 Campus STAAR Performance Grade Span: 06 - 08Campus Number: 170904042 Bilingual Education/English as a Second Language (Current EL Students)
State District CampusBilingual
EducationBE-TransEarly Exit
BE-TransLate Exit
BE-DualTwo-Way
BE-DualOne-Way ESL
ESLContent
ESLPull-Out
LEP NoServices
LEP withServices
TotalEL
STAARPerformance Rate by Subject and Performance LevelAll Grades All Subjects
At Approaches Grade Level or Above 2019 78% 76% 68% - - - - - 54% 0% 55% 50% 54% 54%2018 77% 75% 65% - - - - - 46% 46% - 14% 46% 44%
At Meets Grade Level or Above 2019 50% 45% 33% - - - - - 15% 0% 15% 6% 15% 14%2018 48% 45% 31% - - - - - 9% 9% - 0% 9% 9%
At Masters Grade Level 2019 24% 19% 11% - - - - - 2% 0% 2% 0% 2% 2%2018 22% 18% 11% - - - - - 2% 2% - 0% 2% 1%
All Grades ELA/ReadingAt Approaches Grade Level or Above 2019 75% 72% 66% - - - - - 50% * 50% 50% 50% 50%
2018 74% 72% 65% - - - - - 40% 40% - 20% 40% 39%At Meets Grade Level or Above 2019 48% 43% 34% - - - - - 10% * 10% 17% 10% 10%
2018 46% 41% 32% - - - - - 9% 9% - 0% 9% 9%At Masters Grade Level 2019 21% 17% 15% - - - - - 4% * 4% 0% 4% 4%
2018 19% 16% 14% - - - - - 2% 2% - 0% 2% 2%All Grades Mathematics
At Approaches Grade Level or Above 2019 82% 81% 73% - - - - - 64% * 65% 50% 64% 63%2018 81% 81% 70% - - - - - 59% 59% - 20% 59% 57%
At Meets Grade Level or Above 2019 52% 49% 34% - - - - - 22% * 22% 0% 22% 21%2018 50% 49% 30% - - - - - 13% 13% - 0% 13% 12%
At Masters Grade Level 2019 26% 23% 8% - - - - - 1% * 1% 0% 1% 1%2018 24% 21% 7% - - - - - 2% 2% - 0% 2% 2%
All Grades WritingAt Approaches Grade Level or Above 2019 68% 64% 58% - - - - - 41% * 42% * 41% 42%
2018 66% 65% 57% - - - - - 35% 35% - * 35% 33%At Meets Grade Level or Above 2019 38% 31% 25% - - - - - 13% * 13% * 13% 13%
2018 41% 38% 28% - - - - - 3% 3% - * 3% 3%At Masters Grade Level 2019 14% 10% 7% - - - - - 0% * 0% * 0% 0%
2018 13% 8% 4% - - - - - 0% 0% - * 0% 0%All Grades Science
At Approaches Grade Level or Above 2019 81% 81% 72% - - - - - 60% * 62% * 60% 59%2018 80% 77% 64% - - - - - 39% 39% - * 39% 38%
At Meets Grade Level or Above 2019 54% 51% 41% - - - - - 13% * 14% * 13% 13%2018 51% 46% 35% - - - - - 6% 6% - * 6% 5%
At Masters Grade Level 2019 25% 20% 15% - - - - - 3% * 3% * 3% 3%2018 23% 18% 17% - - - - - 0% 0% - * 0% 0%
All Grades Social StudiesAt Approaches Grade Level or Above 2019 81% 81% 64% - - - - - 47% * 48% * 47% 47%
2018 78% 79% 62% - - - - - 37% 37% - * 37% 36%At Meets Grade Level or Above 2019 55% 52% 29% - - - - - 7% * 7% * 7% 6%
2018 53% 48% 29% - - - - - 9% 9% - * 9% 8%At Masters Grade Level 2019 33% 27% 12% - - - - - 0% * 0% * 0% 0%
2018 31% 24% 14% - - - - - 3% 3% - * 3% 3%
School Progress Domain - Academic Growth ScoreAll Grades Both Subjects 2019 69% 66% 57% - - - - - 53% * 53% 33% 53% 52%
2018 69% 69% 61% - - - - - 57% 57% - 25% 57% 56%All Grades ELA/Reading 2019 68% 66% 58% - - - - - 53% * 54% 50% 53% 53%
2018 69% 68% 64% - - - - - 63% 63% - 20% 63% 61%All Grades Mathematics 2019 70% 66% 55% - - - - - 53% * 53% * 53% 52%
2018 70% 69% 59% - - - - - 52% 52% - 30% 52% 51%
Progress of Prior Year STAAR Non-Proficient Students (Percent of Non-Proficient Passing STAAR)Reading 2019 41% 39% 33% - - - - - 35% * 36% * 35% 33%
18-19 AAR Page 412
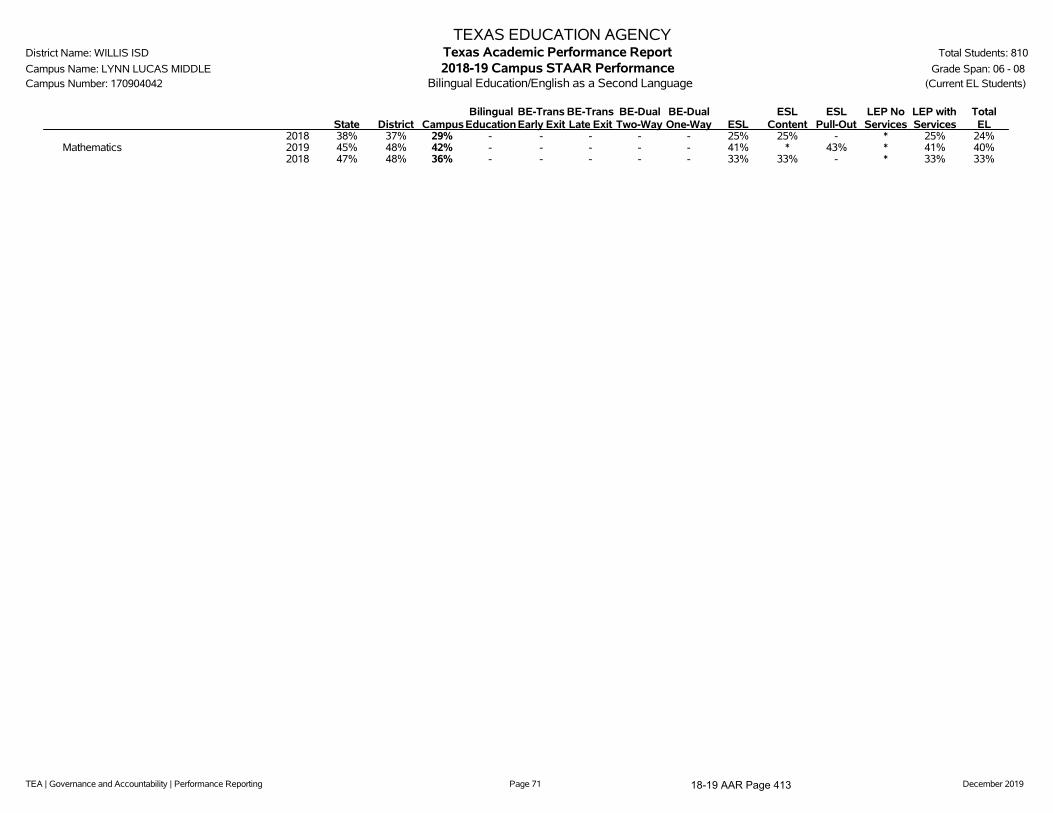
TEA | Governance and Accountability | Performance Reporting Page 71 December 2019
TEXAS EDUCATION AGENCYDistrict Name: WILLIS ISD Texas Academic Performance Report Total Students: 810
Campus Name: LYNN LUCAS MIDDLE 2018-19 Campus STAAR Performance Grade Span: 06 - 08Campus Number: 170904042 Bilingual Education/English as a Second Language (Current EL Students)
State District CampusBilingual
EducationBE-TransEarly Exit
BE-TransLate Exit
BE-DualTwo-Way
BE-DualOne-Way ESL
ESLContent
ESLPull-Out
LEP NoServices
LEP withServices
TotalEL
2018 38% 37% 29% - - - - - 25% 25% - * 25% 24%Mathematics 2019 45% 48% 42% - - - - - 41% * 43% * 41% 40%
2018 47% 48% 36% - - - - - 33% 33% - * 33% 33%
18-19 AAR Page 413
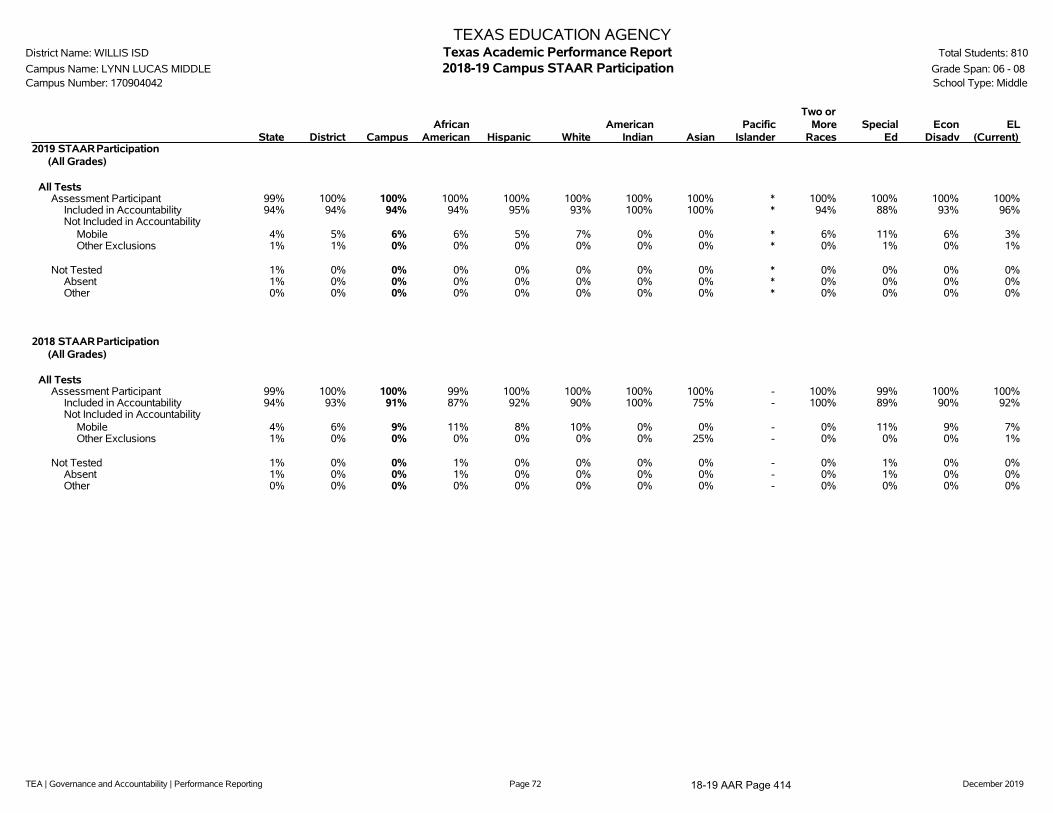
TEA | Governance and Accountability | Performance Reporting Page 72 December 2019
TEXAS EDUCATION AGENCYDistrict Name: WILLIS ISD Texas Academic Performance Report Total Students: 810
Campus Name: LYNN LUCAS MIDDLE 2018-19 Campus STAAR Participation Grade Span: 06 - 08Campus Number: 170904042 School Type: Middle
State District CampusAfrican
American Hispanic WhiteAmerican
Indian AsianPacific
Islander
Two orMore
RacesSpecial
EdEcon
DisadvEL
(Current)2019 STAARParticipation
(All Grades)
All TestsAssessment Participant 99% 100% 100% 100% 100% 100% 100% 100% * 100% 100% 100% 100%
Included in Accountability 94% 94% 94% 94% 95% 93% 100% 100% * 94% 88% 93% 96%Not Included in Accountability
Mobile 4% 5% 6% 6% 5% 7% 0% 0% * 6% 11% 6% 3%Other Exclusions 1% 1% 0% 0% 0% 0% 0% 0% * 0% 1% 0% 1%
Not Tested 1% 0% 0% 0% 0% 0% 0% 0% * 0% 0% 0% 0%Absent 1% 0% 0% 0% 0% 0% 0% 0% * 0% 0% 0% 0%Other 0% 0% 0% 0% 0% 0% 0% 0% * 0% 0% 0% 0%
2018 STAARParticipation(All Grades)
All TestsAssessment Participant 99% 100% 100% 99% 100% 100% 100% 100% - 100% 99% 100% 100%
Included in Accountability 94% 93% 91% 87% 92% 90% 100% 75% - 100% 89% 90% 92%Not Included in Accountability
Mobile 4% 6% 9% 11% 8% 10% 0% 0% - 0% 11% 9% 7%Other Exclusions 1% 0% 0% 0% 0% 0% 0% 25% - 0% 0% 0% 1%
Not Tested 1% 0% 0% 1% 0% 0% 0% 0% - 0% 1% 0% 0%Absent 1% 0% 0% 1% 0% 0% 0% 0% - 0% 1% 0% 0%Other 0% 0% 0% 0% 0% 0% 0% 0% - 0% 0% 0% 0%
18-19 AAR Page 414

TEA | Governance and Accountability | Performance Reporting Page 73 December 2019
TEXAS EDUCATION AGENCYDistrict Name: WILLIS ISD Texas Academic Performance Report Total Students: 810
Campus Name: LYNN LUCAS MIDDLE 2018-19 Campus Attendance, Graduation, and Dropout Rates Grade Span: 06 - 08Campus Number: 170904042 School Type: Middle
State District CampusAfrican
American Hispanic WhiteAmerican
Indian AsianPacific
Islander
Two orMore
RacesSpecial
EdEcon
DisadvEL
(Current)
Attendance Rate2017-18 95.4% 95.0% 95.0% 94.5% 96.1% 94.2% * * - 94.8% 92.3% 95.0% 97.1%2016-17 95.7% 95.2% 94.8% 95.5% 95.8% 94.0% * * * 94.2% 93.6% 94.8% 96.3%
Annual Dropout Rate (Gr 7-8)2017-18 0.4% 0.1% 0.2% 0.0% 0.0% 0.3% * * - 0.0% 1.3% 0.2% 0.0%2016-17 0.3% 0.2% 0.3% 0.0% 0.5% 0.3% * - * 0.0% 1.2% 0.4% 0.0%
Annual Dropout Rate (Gr 9-12)2017-18 1.9% 2.9% - - - - - - - - - - -2016-17 1.9% 1.5% - - - - - - - - - - -
4-Year Longitudinal Rate (Gr 9-12)Class of 2018
Graduated 90.0% 86.4% - - - - - - - - - - -Received TxCHSE 0.4% 0.4% - - - - - - - - - - -Continued HS 3.8% 4.0% - - - - - - - - - - -Dropped Out 5.7% 9.1% - - - - - - - - - - -Graduates and TxCHSE 90.4% 86.8% - - - - - - - - - - -Graduates, TxCHSE,and Continuers 94.3% 90.9% - - - - - - - - - - -
Class of 2017Graduated 89.7% 89.3% - - - - - - - - - - -Received TxCHSE 0.4% 1.1% - - - - - - - - - - -Continued HS 4.0% 4.6% - - - - - - - - - - -Dropped Out 5.9% 5.0% - - - - - - - - - - -Graduates and TxCHSE 90.1% 90.4% - - - - - - - - - - -Graduates, TxCHSE,and Continuers 94.1% 95.0% - - - - - - - - - - -
5-Year Extended Longitudinal Rate (Gr 9-12)Class of 2017
Graduated 92.0% 92.0% - - - - - - - - - - -Received TxCHSE 0.6% 1.3% - - - - - - - - - - -Continued HS 1.1% 0.2% - - - - - - - - - - -Dropped Out 6.3% 6.5% - - - - - - - - - - -Graduates and TxCHSE 92.6% 93.3% - - - - - - - - - - -Graduates, TxCHSE,and Continuers 93.7% 93.5% - - - - - - - - - - -
Class of 2016Graduated 91.6% 93.7% - - - - - - - - - - -Received TxCHSE 0.7% 1.1% - - - - - - - - - - -Continued HS 1.2% 0.0% - - - - - - - - - - -Dropped Out 6.6% 5.2% - - - - - - - - - - -Graduates and TxCHSE 92.2% 94.8% - - - - - - - - - - -Graduates, TxCHSE,and Continuers 93.4% 94.8% - - - - - - - - - - -
6-Year Extended Longitudinal Rate (Gr 9-12)Class of 2016
Graduated 92.1% 93.9% - - - - - - - - - - -
18-19 AAR Page 415

TEA | Governance and Accountability | Performance Reporting Page 74 December 2019
TEXAS EDUCATION AGENCYDistrict Name: WILLIS ISD Texas Academic Performance Report Total Students: 810
Campus Name: LYNN LUCAS MIDDLE 2018-19 Campus Attendance, Graduation, and Dropout Rates Grade Span: 06 - 08Campus Number: 170904042 School Type: Middle
State District CampusAfrican
American Hispanic WhiteAmerican
Indian AsianPacific
Islander
Two orMore
RacesSpecial
EdEcon
DisadvEL
(Current)Received TxCHSE 0.8% 1.1% - - - - - - - - - - -Continued HS 0.5% 0.0% - - - - - - - - - - -Dropped Out 6.6% 5.0% - - - - - - - - - - -Graduates and TxCHSE 92.9% 95.0% - - - - - - - - - - -Graduates, TxCHSE,and Continuers 93.4% 95.0% - - - - - - - - - - -
Class of 2015Graduated 91.8% 93.3% - - - - - - - - - - -Received TxCHSE 1.0% 1.4% - - - - - - - - - - -Continued HS 0.6% 0.2% - - - - - - - - - - -Dropped Out 6.7% 5.0% - - - - - - - - - - -Graduates and TxCHSE 92.8% 94.7% - - - - - - - - - - -Graduates, TxCHSE,and Continuers 93.3% 95.0% - - - - - - - - - - -
4-Year Federal Graduation Rate Without Exclusions (Gr 9-12)Class of 2018 90.0% 85.5% - - - - - - - - - - -Class of 2017 89.7% 88.6% - - - - - - - - - - -
RHSP/DAP Graduates (Longitudinal Rate)Class of 2018 68.5% * - - - - - - - - - - -Class of 2017 88.5% 89.1% - - - - - - - - - - -
FHSP-E Graduates (Longitudinal Rate)Class of 2018 5.0% 2.0% - - - - - - - - - - -Class of 2017 6.0% 0.0% - - - - - - - - - - -
FHSP-DLA Graduates (Longitudinal Rate)Class of 2018 82.0% 87.4% - - - - - - - - - - -Class of 2017 60.8% 14.3% - - - - - - - - - - -
RHSP/DAP/FHSP-E/FHSP-DLA Graduates (Longitudinal Rate)Class of 2018 86.8% 89.2% - - - - - - - - - - -Class of 2017 85.9% 87.8% - - - - - - - - - - -
RHSP/DAP Graduates (Annual Rate)2017-18 37.7% 37.5% - - - - - - - - - - -2016-17 87.2% 87.0% - - - - - - - - - - -
FHSP-E Graduates (Annual Rate)2017-18 4.9% 1.7% - - - - - - - - - - -2016-17 7.2% 11.1% - - - - - - - - - - -
FHSP-DLA Graduates (Annual Rate)2017-18 81.5% 87.2% - - - - - - - - - - -2016-17 56.5% 22.2% - - - - - - - - - - -
RHSP/DAP/FHSP-E/FHSP-DLA Graduates (Annual Rate)2017-18 85.1% 87.9% - - - - - - - - - - -2016-17 84.0% 85.9% - - - - - - - - - - -
18-19 AAR Page 416

TEA | Governance and Accountability | Performance Reporting Page 75 December 2019
TEXAS EDUCATION AGENCYDistrict Name: WILLIS ISD Texas Academic Performance Report Total Students: 810
Campus Name: LYNN LUCAS MIDDLE 2018-19 Campus Graduation Profile Grade Span: 06 - 08Campus Number: 170904042 School Type: Middle
CampusCount
CampusPercent
DistrictCount
StateCount
Graduates (2017-18 Annual Graduates)Total Graduates - - 422 347,893
By Ethnicity:African American - - 31 43,502Hispanic - - 128 173,272White - - 247 107,052American Indian - - 3 1,226Asian - - 2 15,589Pacific Islander - - 2 528Two or More Races - - 9 6,724
By Graduation Type:Minimum H.S. Program - - 5 5,855Recommended H.S. Program/Distinguished Achievement Program - - 3 3,538Foundation H.S. Program (No Endorsement) - - 46 49,432Foundation H.S. Program (Endorsement) - - 7 16,542Foundation H.S. Program (DLA) - - 361 272,526
Special Education Graduates - - 27 25,962Economically Disadvantaged Graduates - - 181 166,956LEP Graduates - - 16 21,359At-Risk Graduates - - 137 144,805
18-19 AAR Page 417

TEA | Governance and Accountability | Performance Reporting Page 76 December 2019
TEXAS EDUCATION AGENCYDistrict Name: WILLIS ISD Texas Academic Performance Report Total Students: 810
Campus Name: LYNN LUCAS MIDDLE 2018-19 Campus College, Career, and Military Readiness (CCMR) Grade Span: 06 - 08Campus Number: 170904042 School Type: Middle
State District CampusAfrican
American Hispanic WhiteAmerican
Indian AsianPacific
Islander
Two orMore
RacesSpecial
EdEcon
DisadvEL
(Current)College, Career, and Military Ready Graduates (Student Achievement) ***
College, Career, or Military Ready (Annual Graduates)2017-18 65.5% 64.0% - - - - - - - - - - -
College Ready Graduates ***College Ready (Annual Graduates)
2017-18 50.0% 34.4% - - - - - - - - - - -
TSI Criteria Graduates (Annual Graduates)English Language Arts
2017-18 58.2% 51.2% - - - - - - - - - - -Mathematics
2017-18 46.0% 29.9% - - - - - - - - - - -Both Subjects
2017-18 42.1% 28.4% - - - - - - - - - - -
Dual Course Credits (Annual Graduates)Any Subject
2017-18 20.7% 17.3% - - - - - - - - - - -2016-17 19.9% 21.6% - - - - - - - - - - -
AP/IB Met Criteria in Any Subject (Annual Graduates)Any Subject
2017-18 20.4% 9.5% - - - - - - - - - - -2016-17 20.1% 4.9% - - - - - - - - - - -
Associate's DegreeAssociate's Degree (Annual Graduates)
2017-18 1.4% 0.2% - - - - - - - - - - -2016-17 0.8% 0.0% - - - - - - - - - - -
OnRampsCourse Credits (Annual Graduates)2017-18 1.0% 0.0% - - - - - - - - - - -
Career/Military Ready GraduatesCareer or Military Ready (Annual Graduates)
2017-18 28.7% 41.6% - - - - - - - - - - -2016-17 13.2% 13.1% - - - - - - - - - - -
Approved Industry-Based Certification (Annual Graduates)2017-18 4.8% 9.0% - - - - - - - - - - -2016-17 2.7% 3.8% - - - - - - - - - - -
Graduate with Completed IEP and Workforce Readiness (Annual Graduates)2017-18 1.7% 6.2% - - - - - - - - - - -2016-17 1.0% 0.0% - - - - - - - - - - -
CTE Coherent Sequence Coursework Aligned with Industry-Based Certifications (Annual Graduates)2017-18 38.7% 58.8% - - - - - - - - - - -2016-17 17.3% 14.6% - - - - - - - - - - -
18-19 AAR Page 418
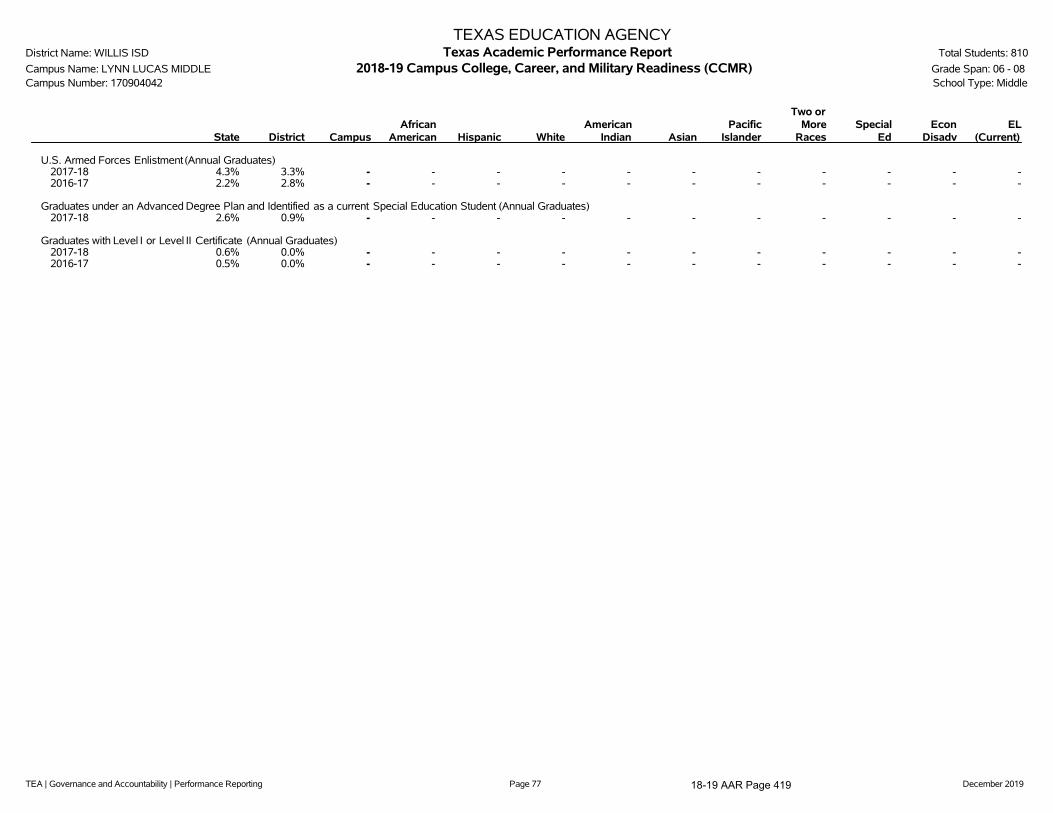
TEA | Governance and Accountability | Performance Reporting Page 77 December 2019
TEXAS EDUCATION AGENCYDistrict Name: WILLIS ISD Texas Academic Performance Report Total Students: 810
Campus Name: LYNN LUCAS MIDDLE 2018-19 Campus College, Career, and Military Readiness (CCMR) Grade Span: 06 - 08Campus Number: 170904042 School Type: Middle
State District CampusAfrican
American Hispanic WhiteAmerican
Indian AsianPacific
Islander
Two orMore
RacesSpecial
EdEcon
DisadvEL
(Current)
U.S. Armed Forces Enlistment (Annual Graduates)2017-18 4.3% 3.3% - - - - - - - - - - -2016-17 2.2% 2.8% - - - - - - - - - - -
Graduates under an Advanced Degree Plan and Identified as a current Special Education Student (Annual Graduates)2017-18 2.6% 0.9% - - - - - - - - - - -
Graduates with Level I or Level II Certificate (Annual Graduates)2017-18 0.6% 0.0% - - - - - - - - - - -2016-17 0.5% 0.0% - - - - - - - - - - -
18-19 AAR Page 419

TEA | Governance and Accountability | Performance Reporting Page 78 December 2019
TEXAS EDUCATION AGENCYDistrict Name: WILLIS ISD Texas Academic Performance Report Total Students: 810
Campus Name: LYNN LUCAS MIDDLE 2018-19 Campus CCMR-Related Indicators Grade Span: 06 - 08Campus Number: 170904042 School Type: Middle
State District CampusAfrican
American Hispanic WhiteAmerican
Indian AsianPacific
Islander
Two orMore
RacesSpecial
EdEcon
DisadvEL
(Current)TSIA Results (Graduates >= Criterion) (Annual Graduates)
Reading2017-18 32.1% 36.5% - - - - - - - - - - -2016-17 23.4% 11.3% - - - - - - - - - - -
Mathematics2017-18 23.7% 21.8% - - - - - - - - - - -2016-17 19.8% 11.3% - - - - - - - - - - -
Both Subjects2017-18 18.1% 17.8% - - - - - - - - - - -2016-17 12.9% 5.4% - - - - - - - - - - -
CTE Coherent Sequence (Annual Graduates)2017-18 58.4% 61.8% - - - - - - - - - - -2016-17 50.5% 30.1% - - - - - - - - - - -
Completed and Received Credit for College Prep Courses (Annual Graduates)English Language Arts
2017-18 2.0% 0.0% - - - - - - - - - - -2016-17 0.8% 0.0% - - - - - - - - - - -
Mathematics2017-18 3.9% 0.0% - - - - - - - - - - -2016-17 1.4% 0.0% - - - - - - - - - - -
Both Subjects2017-18 0.9% 0.0% - - - - - - - - - - -2016-17 0.2% 0.0% - - - - - - - - - - -
AP/IB Results (Participation) (Grades 11-12)All Subjects
2018 25.8% 10.3% - - - - - - - - n/a - n/a2017 26.2% 12.1% - - - - - - - - n/a - n/a
English Language Arts2018 15.3% 6.5% - - - - - - - - n/a - n/a2017 15.9% 5.8% - - - - - - - - n/a - n/a
Mathematics2018 7.3% 0.8% - - - - - - - - n/a - n/a2017 7.2% 0.8% - - - - - - - - n/a - n/a
Science2018 10.8% 4.4% - - - - - - - - n/a - n/a2017 10.9% 4.2% - - - - - - - - n/a - n/a
Social Studies2018 14.5% 4.9% - - - - - - - - n/a - n/a2017 15.0% 8.8% - - - - - - - - n/a - n/a
AP/IB Results (Examinees >= Criterion) (Grades 11-12)All Subjects
2018 50.7% 48.5% - - - - - - - - n/a - n/a2017 49.1% 39.3% - - - - - - - - n/a - n/a
English Language Arts2018 42.5% 33.9% - - - - - - - - n/a - n/a2017 41.3% 38.9% - - - - - - - - n/a - n/a
Mathematics2018 52.8% 12.5% - - - - - - - - n/a - n/a
18-19 AAR Page 420

TEA | Governance and Accountability | Performance Reporting Page 79 December 2019
TEXAS EDUCATION AGENCYDistrict Name: WILLIS ISD Texas Academic Performance Report Total Students: 810
Campus Name: LYNN LUCAS MIDDLE 2018-19 Campus CCMR-Related Indicators Grade Span: 06 - 08Campus Number: 170904042 School Type: Middle
State District CampusAfrican
American Hispanic WhiteAmerican
Indian AsianPacific
Islander
Two orMore
RacesSpecial
EdEcon
DisadvEL
(Current)2017 51.3% 14.3% - - - - - - - - n/a - n/a
Science2018 38.0% 21.4% - - - - - - - - n/a - n/a2017 38.3% 15.4% - - - - - - - - n/a - n/a
Social Studies2018 44.6% 51.1% - - - - - - - - n/a - n/a2017 41.4% 37.8% - - - - - - - - n/a - n/a
SAT/ACT Results (Annual Graduates) ***Tested
2017-18 74.6% 51.7% - - - - - - - - n/a - n/a2016-17 73.5% 53.6% - - - - - - - - n/a - n/a
At/Above Criterion2017-18 37.9% 33.0% - - - - - - - - n/a - n/a
Average SAT Score (Annual Graduates) ***All Subjects
2017-18 1036 1028 - - - - - - - - n/a - n/aEnglish Language Artsand Writing
2017-18 521 527 - - - - - - - - n/a - n/aMathematics
2017-18 515 500 - - - - - - - - n/a - n/a
Average ACT Score (Annual Graduates) ***All Subjects
2017-18 20.6 20.0 - - - - - - - - n/a - n/aEnglish Language Arts
2017-18 20.3 19.6 - - - - - - - - n/a - n/aMathematics
2017-18 20.6 19.4 - - - - - - - - n/a - n/aScience
2017-18 20.9 20.8 - - - - - - - - n/a - n/a
18-19 AAR Page 421

TEA | Governance and Accountability | Performance Reporting Page 80 December 2019
TEXAS EDUCATION AGENCYDistrict Name: WILLIS ISD Texas Academic Performance Report Total Students: 810
Campus Name: LYNN LUCAS MIDDLE 2018-19 Campus Other Postsecondary Indicators Grade Span: 06 - 08Campus Number: 170904042 School Type: Middle
State District CampusAfrican
American Hispanic WhiteAmerican
Indian AsianPacific
Islander
Two orMore
RacesSpecial
EdEcon
DisadvEL
(Current)Advanced Dual-Credit Course Completion (Grades 9-12)
Any Subject2017-18 43.4% 32.6% - - - - - - - - - - -2016-17 37.1% 19.8% - - - - - - - - - - -
English Language Arts2017-18 17.3% 13.8% - - - - - - - - - - -2016-17 16.8% 13.1% - - - - - - - - - - -
Mathematics2017-18 20.7% 13.2% - - - - - - - - - - -2016-17 19.5% 12.1% - - - - - - - - - - -
Science2017-18 21.2% 19.7% - - - - - - - - - - -2016-17 5.7% 5.4% - - - - - - - - - - -
Social Studies2017-18 22.8% 11.7% - - - - - - - - - - -2016-17 21.8% 10.8% - - - - - - - - - - -
Graduates Enrolled in Texas Institution of Higher Education (TX IHE)2016-17 54.6% 48.0% - - - - - - - - - - -2015-16 54.7% 49.1% - - - - - - - - - - -
Graduates in TX IHE Completing One Year Without Enrollment in a Developmental Education Course2016-17 59.2% 54.6% - - - - - - - - - - -2015-16 55.7% 55.5% - - - - - - - - - - -
18-19 AAR Page 422
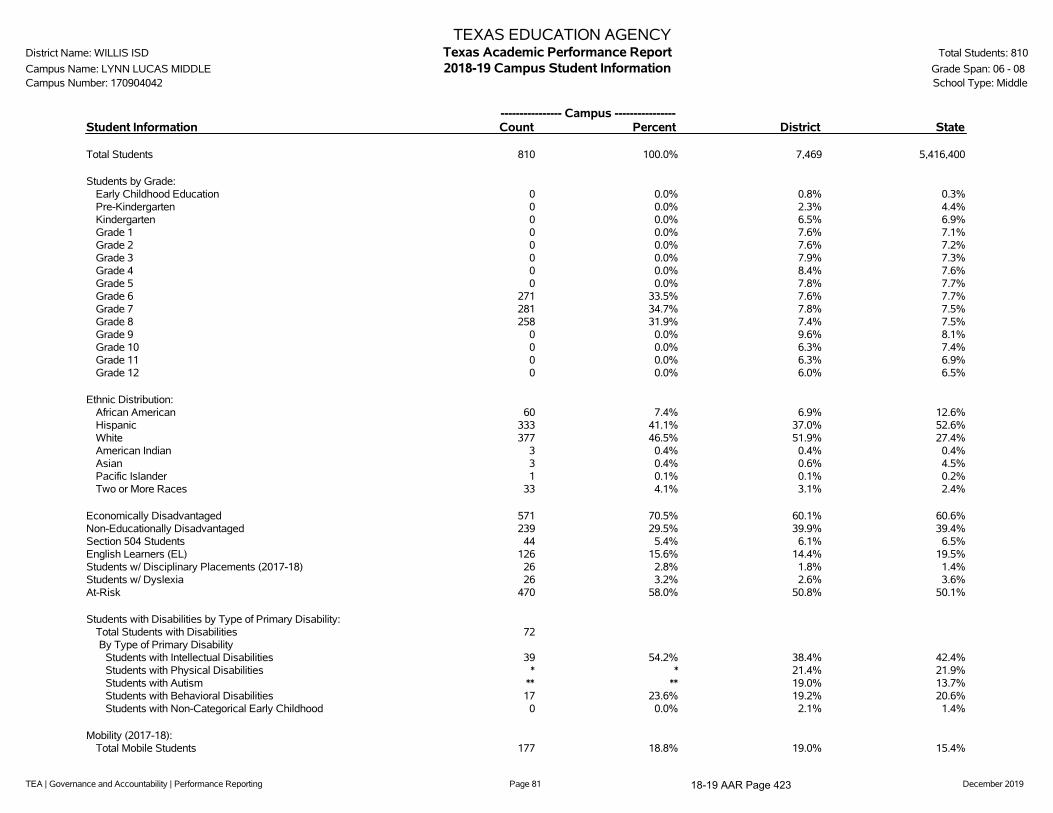
TEA | Governance and Accountability | Performance Reporting Page 81 December 2019
TEXAS EDUCATION AGENCYDistrict Name: WILLIS ISD Texas Academic Performance Report Total Students: 810
Campus Name: LYNN LUCAS MIDDLE 2018-19 Campus Student Information Grade Span: 06 - 08Campus Number: 170904042 School Type: Middle
---------------- Campus ----------------Student Information Count Percent District State
Total Students 810 100.0% 7,469 5,416,400
Students by Grade:Early Childhood Education 0 0.0% 0.8% 0.3%Pre-Kindergarten 0 0.0% 2.3% 4.4%Kindergarten 0 0.0% 6.5% 6.9%Grade 1 0 0.0% 7.6% 7.1%Grade 2 0 0.0% 7.6% 7.2%Grade 3 0 0.0% 7.9% 7.3%Grade 4 0 0.0% 8.4% 7.6%Grade 5 0 0.0% 7.8% 7.7%Grade 6 271 33.5% 7.6% 7.7%Grade 7 281 34.7% 7.8% 7.5%Grade 8 258 31.9% 7.4% 7.5%Grade 9 0 0.0% 9.6% 8.1%Grade 10 0 0.0% 6.3% 7.4%Grade 11 0 0.0% 6.3% 6.9%Grade 12 0 0.0% 6.0% 6.5%
Ethnic Distribution:African American 60 7.4% 6.9% 12.6%Hispanic 333 41.1% 37.0% 52.6%White 377 46.5% 51.9% 27.4%American Indian 3 0.4% 0.4% 0.4%Asian 3 0.4% 0.6% 4.5%Pacific Islander 1 0.1% 0.1% 0.2%Two or More Races 33 4.1% 3.1% 2.4%
Economically Disadvantaged 571 70.5% 60.1% 60.6%Non-Educationally Disadvantaged 239 29.5% 39.9% 39.4%Section 504 Students 44 5.4% 6.1% 6.5%English Learners (EL) 126 15.6% 14.4% 19.5%Students w/ Disciplinary Placements (2017-18) 26 2.8% 1.8% 1.4%Students w/ Dyslexia 26 3.2% 2.6% 3.6%At-Risk 470 58.0% 50.8% 50.1%
Students with Disabilities by Type of Primary Disability:Total Students with Disabilities 72By Type of Primary Disability
Students with Intellectual Disabilities 39 54.2% 38.4% 42.4%Students with Physical Disabilities * * 21.4% 21.9%Students with Autism ** ** 19.0% 13.7%Students with Behavioral Disabilities 17 23.6% 19.2% 20.6%Students with Non-Categorical Early Childhood 0 0.0% 2.1% 1.4%
Mobility (2017-18):Total Mobile Students 177 18.8% 19.0% 15.4%
18-19 AAR Page 423

TEA | Governance and Accountability | Performance Reporting Page 82 December 2019
TEXAS EDUCATION AGENCYDistrict Name: WILLIS ISD Texas Academic Performance Report Total Students: 810
Campus Name: LYNN LUCAS MIDDLE 2018-19 Campus Student Information Grade Span: 06 - 08Campus Number: 170904042 School Type: Middle
---------------- Campus ----------------Student Information Count Percent District State
By Ethnicity:African American 29 3.1%Hispanic 57 6.1%White 86 9.1%American Indian 0 0.0%Asian 0 0.0%Pacific Islander 0 0.0%Two or More Races 5 0.5%
--------Non-Special Education Rates-------- --------Special Education Rates--------Student Information Campus District State Campus District State
Retention Rates by Grade:Kindergarten - 0.4% 1.7% - 3.8% 6.2%Grade 1 - 2.0% 3.1% - 5.7% 5.5%Grade 2 - 1.3% 1.8% - 2.2% 2.3%Grade 3 - 1.2% 1.1% - 2.1% 0.9%Grade 4 - 0.0% 0.5% - 0.0% 0.5%Grade 5 - 0.2% 0.5% - 1.8% 0.6%Grade 6 0.0% 0.4% 0.4% 0.0% 0.0% 0.5%Grade 7 1.6% 1.0% 0.6% 0.0% 0.0% 0.6%Grade 8 0.0% 0.0% 0.4% 0.0% 0.0% 0.7%Grade 9 - 17.2% 7.2% - 34.0% 12.7%
Class Size Information Campus District State
Class Size Averages by Grade and Subject(Derived from teacher responsibility records):
Elementary:Kindergarten - 20.9 18.9Grade 1 - 19.8 18.8Grade 2 - 19.1 18.7Grade 3 - 20.1 18.9Grade 4 - 20.0 19.2Grade 5 - 23.0 21.2Grade 6 18.0 19.3 20.4
Secondary:English/Language Arts 15.5 15.9 16.6Foreign Languages 20.0 21.8 18.9Mathematics 16.9 16.7 17.8Science 17.7 18.4 18.9Social Studies 17.1 18.1 19.3
18-19 AAR Page 424

TEA | Governance and Accountability | Performance Reporting Page 83 December 2019
TEXAS EDUCATION AGENCYDistrict Name: WILLIS ISD Texas Academic Performance Report Total Students: 810
Campus Name: LYNN LUCAS MIDDLE 2018-19 Campus Staff Information Grade Span: 06 - 08Campus Number: 170904042 School Type: Middle
---------------- Campus ----------------Staff Information Count/Average Percent District State
Total Staff 63.4 100.0% 100.0% 100.0%
Professional Staff: 54.6 86.1% 57.6% 64.1%Teachers 49.4 78.0% 44.8% 49.8%Professional Support 2.2 3.4% 9.2% 10.1%Campus Administration (School Leadership) 3.0 4.7% 2.9% 3.0%
Educational Aides: 8.8 13.9% 11.0% 10.3%
Librarians & Counselors (Headcount):Librarians
Full-time 0.0 n/a 0.0 4,414.0Part-time 0.0 n/a 0.0 572.0
CounselorsFull-time 1.0 n/a 12.0 12,433.0Part-time 1.0 n/a 2.0 1,097.0
Total Minority Staff: 14.7 23.1% 27.1% 50.4%
Teachers by Ethnicity and Sex:African American 2.0 4.0% 2.8% 10.6%Hispanic 6.9 13.9% 14.2% 27.7%White 40.6 82.1% 82.1% 58.4%American Indian 0.0 0.0% 0.2% 0.3%Asian 0.0 0.0% 0.2% 1.7%Pacific Islander 0.0 0.0% 0.0% 0.2%Two or More Races 0.0 0.0% 0.5% 1.1%
Males 11.9 24.0% 18.6% 23.8%Females 37.6 76.0% 81.4% 76.2%
Teachers by Highest Degree Held:No Degree 0.0 0.0% 0.5% 1.4%Bachelors 41.6 84.1% 81.7% 73.6%Masters 7.8 15.9% 17.4% 24.3%Doctorate 0.0 0.0% 0.5% 0.7%
Teachers by Years of Experience:Beginning Teachers 4.9 9.9% 8.0% 7.0%1-5 Years Experience 21.0 42.5% 31.7% 28.9%6-10 Years Experience 8.0 16.2% 17.5% 19.0%11-20 Years Experience 9.6 19.3% 24.9% 29.3%Over 20 Years Experience 6.0 12.1% 17.9% 15.7%
Number of Students per Teacher 16.4 n/a 17.2 15.1
18-19 AAR Page 425
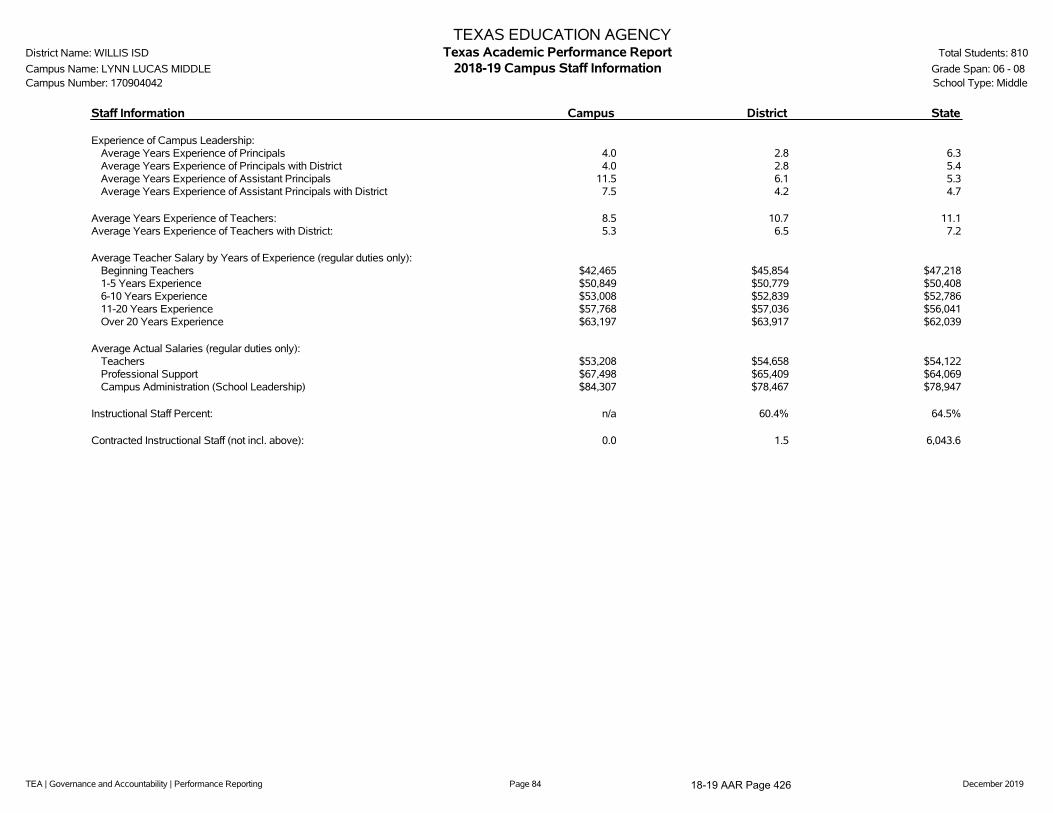
TEA | Governance and Accountability | Performance Reporting Page 84 December 2019
TEXAS EDUCATION AGENCYDistrict Name: WILLIS ISD Texas Academic Performance Report Total Students: 810
Campus Name: LYNN LUCAS MIDDLE 2018-19 Campus Staff Information Grade Span: 06 - 08Campus Number: 170904042 School Type: Middle
Staff Information Campus District State
Experience of Campus Leadership:Average Years Experience of Principals 4.0 2.8 6.3Average Years Experience of Principals with District 4.0 2.8 5.4Average Years Experience of Assistant Principals 11.5 6.1 5.3Average Years Experience of Assistant Principals with District 7.5 4.2 4.7
Average Years Experience of Teachers: 8.5 10.7 11.1Average Years Experience of Teachers with District: 5.3 6.5 7.2
Average Teacher Salary by Years of Experience (regular duties only):Beginning Teachers $42,465 $45,854 $47,2181-5 Years Experience $50,849 $50,779 $50,4086-10 Years Experience $53,008 $52,839 $52,78611-20 Years Experience $57,768 $57,036 $56,041Over 20 Years Experience $63,197 $63,917 $62,039
Average Actual Salaries (regular duties only):Teachers $53,208 $54,658 $54,122Professional Support $67,498 $65,409 $64,069Campus Administration (School Leadership) $84,307 $78,467 $78,947
Instructional Staff Percent: n/a 60.4% 64.5%
Contracted Instructional Staff (not incl. above): 0.0 1.5 6,043.6
18-19 AAR Page 426

TEA | Governance and Accountability | Performance Reporting Page 85 December 2019
TEXAS EDUCATION AGENCYDistrict Name: WILLIS ISD Texas Academic Performance Report Total Students: 810
Campus Name: LYNN LUCAS MIDDLE 2018-19 Campus Staff Information Grade Span: 06 - 08Campus Number: 170904042 School Type: Middle
---------------- Campus ----------------Program Information Count Percent District State
Student Enrollment by Program:Bilingual/ESL Education 119 14.7% 13.6% 19.7%Career & Technical Education 0 0.0% 21.5% 26.3%Gifted & Talented Education 50 6.2% 5.4% 8.1%Special Education 72 8.9% 8.4% 9.6%
Teachers by Program (population served):Bilingual/ESL Education 0.0 0.0% 2.8% 6.4%Career & Technical Education 0.0 0.0% 4.5% 4.9%Compensatory Education 0.0 0.0% 0.0% 2.7%Gifted & Talented Education 0.0 0.0% 0.0% 2.0%Regular Education 38.4 77.6% 76.9% 71.4%Special Education 4.3 8.6% 8.5% 9.1%Other 6.8 13.7% 7.3% 3.6%
' '̂ Indicates that rates for reading and mathematics are based on the cumulative results from the first and second administrations of STAAR.'*' Indicates results are masked due to small numbers to protect student confidentiality.'**' When only one student disability group is masked, then the second smallest student disability group is masked regardless of size.'***' Due to changes in the evaluation of SAT/ACT results (for 2017-18 the best result was used, rather than the most recent), 2016-17 SAT/ACT results are not
comparable and, where applicable, are not shown.'-' Indicates there are no students in the group.'n/a' Indicates data reporting is not applicable for this group.'?' Indicates that the data for this item were statistically improbable or were reported outside a reasonable range.
Link to: PEIMS Financial Standard Reports 2017-18 Financial Actual Report
18-19 AAR Page 427
TEA | Governance and Accountability | Performance Reporting Page 86 December 2019
2018-19 Texas Academic Performance Report
District Name: WILLIS ISD
Campus Name: ROBERT P BRABHAM MIDDLE
Campus Number: 170904043
2019 Accountability Rating: B
Distinction Designations:
Academic Achievement in Science
Postsecondary Readiness
18-19 AAR Page 428

TEA | Governance and Accountability | Performance Reporting Page 87 December 2019
This page is intentionally blank.
18-19 AAR Page 429

TEA | Governance and Accountability | Performance Reporting Page 88 December 2019
TEXAS EDUCATION AGENCYDistrict Name: WILLIS ISD Texas Academic Performance Report Total Students: 889
Campus Name: ROBERT P BRABHAM MIDDLE 2018-19 Campus STAAR Performance Grade Span: 06 - 08Campus Number: 170904043 School Type: Middle
18-19 AAR Page 430
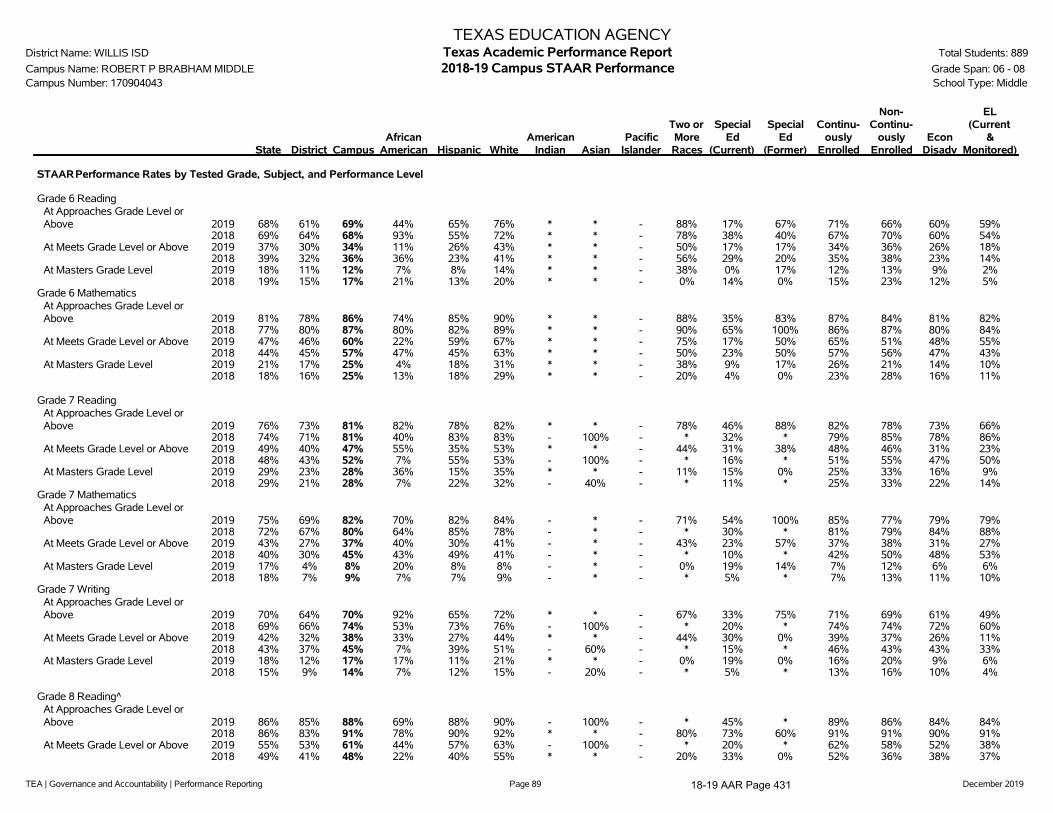
TEA | Governance and Accountability | Performance Reporting Page 89 December 2019
TEXAS EDUCATION AGENCYDistrict Name: WILLIS ISD Texas Academic Performance Report Total Students: 889
Campus Name: ROBERT P BRABHAM MIDDLE 2018-19 Campus STAAR Performance Grade Span: 06 - 08Campus Number: 170904043 School Type: Middle
State District CampusAfrican
American Hispanic WhiteAmerican
Indian AsianPacific
Islander
Two orMoreRaces
SpecialEd
(Current)
SpecialEd
(Former)
Continu-ously
Enrolled
Non-Continu-
ouslyEnrolled
EconDisadv
EL(Current
&Monitored)
STAARPerformance Rates by Tested Grade, Subject, and Performance Level
Grade 6 ReadingAt Approaches Grade Level orAbove 2019 68% 61% 69% 44% 65% 76% * * - 88% 17% 67% 71% 66% 60% 59%
2018 69% 64% 68% 93% 55% 72% * * - 78% 38% 40% 67% 70% 60% 54%At Meets Grade Level or Above 2019 37% 30% 34% 11% 26% 43% * * - 50% 17% 17% 34% 36% 26% 18%
2018 39% 32% 36% 36% 23% 41% * * - 56% 29% 20% 35% 38% 23% 14%At Masters Grade Level 2019 18% 11% 12% 7% 8% 14% * * - 38% 0% 17% 12% 13% 9% 2%
2018 19% 15% 17% 21% 13% 20% * * - 0% 14% 0% 15% 23% 12% 5%Grade 6 Mathematics
At Approaches Grade Level orAbove 2019 81% 78% 86% 74% 85% 90% * * - 88% 35% 83% 87% 84% 81% 82%
2018 77% 80% 87% 80% 82% 89% * * - 90% 65% 100% 86% 87% 80% 84%At Meets Grade Level or Above 2019 47% 46% 60% 22% 59% 67% * * - 75% 17% 50% 65% 51% 48% 55%
2018 44% 45% 57% 47% 45% 63% * * - 50% 23% 50% 57% 56% 47% 43%At Masters Grade Level 2019 21% 17% 25% 4% 18% 31% * * - 38% 9% 17% 26% 21% 14% 10%
2018 18% 16% 25% 13% 18% 29% * * - 20% 4% 0% 23% 28% 16% 11%
Grade 7 ReadingAt Approaches Grade Level orAbove 2019 76% 73% 81% 82% 78% 82% * * - 78% 46% 88% 82% 78% 73% 66%
2018 74% 71% 81% 40% 83% 83% - 100% - * 32% * 79% 85% 78% 86%At Meets Grade Level or Above 2019 49% 40% 47% 55% 35% 53% * * - 44% 31% 38% 48% 46% 31% 23%
2018 48% 43% 52% 7% 55% 53% - 100% - * 16% * 51% 55% 47% 50%At Masters Grade Level 2019 29% 23% 28% 36% 15% 35% * * - 11% 15% 0% 25% 33% 16% 9%
2018 29% 21% 28% 7% 22% 32% - 40% - * 11% * 25% 33% 22% 14%Grade 7 Mathematics
At Approaches Grade Level orAbove 2019 75% 69% 82% 70% 82% 84% - * - 71% 54% 100% 85% 77% 79% 79%
2018 72% 67% 80% 64% 85% 78% - * - * 30% * 81% 79% 84% 88%At Meets Grade Level or Above 2019 43% 27% 37% 40% 30% 41% - * - 43% 23% 57% 37% 38% 31% 27%
2018 40% 30% 45% 43% 49% 41% - * - * 10% * 42% 50% 48% 53%At Masters Grade Level 2019 17% 4% 8% 20% 8% 8% - * - 0% 19% 14% 7% 12% 6% 6%
2018 18% 7% 9% 7% 7% 9% - * - * 5% * 7% 13% 11% 10%Grade 7 Writing
At Approaches Grade Level orAbove 2019 70% 64% 70% 92% 65% 72% * * - 67% 33% 75% 71% 69% 61% 49%
2018 69% 66% 74% 53% 73% 76% - 100% - * 20% * 74% 74% 72% 60%At Meets Grade Level or Above 2019 42% 32% 38% 33% 27% 44% * * - 44% 30% 0% 39% 37% 26% 11%
2018 43% 37% 45% 7% 39% 51% - 60% - * 15% * 46% 43% 43% 33%At Masters Grade Level 2019 18% 12% 17% 17% 11% 21% * * - 0% 19% 0% 16% 20% 9% 6%
2018 15% 9% 14% 7% 12% 15% - 20% - * 5% * 13% 16% 10% 4%
Grade 8 Reading^At Approaches Grade Level orAbove 2019 86% 85% 88% 69% 88% 90% - 100% - * 45% * 89% 86% 84% 84%
2018 86% 83% 91% 78% 90% 92% * * - 80% 73% 60% 91% 91% 90% 91%At Meets Grade Level or Above 2019 55% 53% 61% 44% 57% 63% - 100% - * 20% * 62% 58% 52% 38%
2018 49% 41% 48% 22% 40% 55% * * - 20% 33% 0% 52% 36% 38% 37%
18-19 AAR Page 431
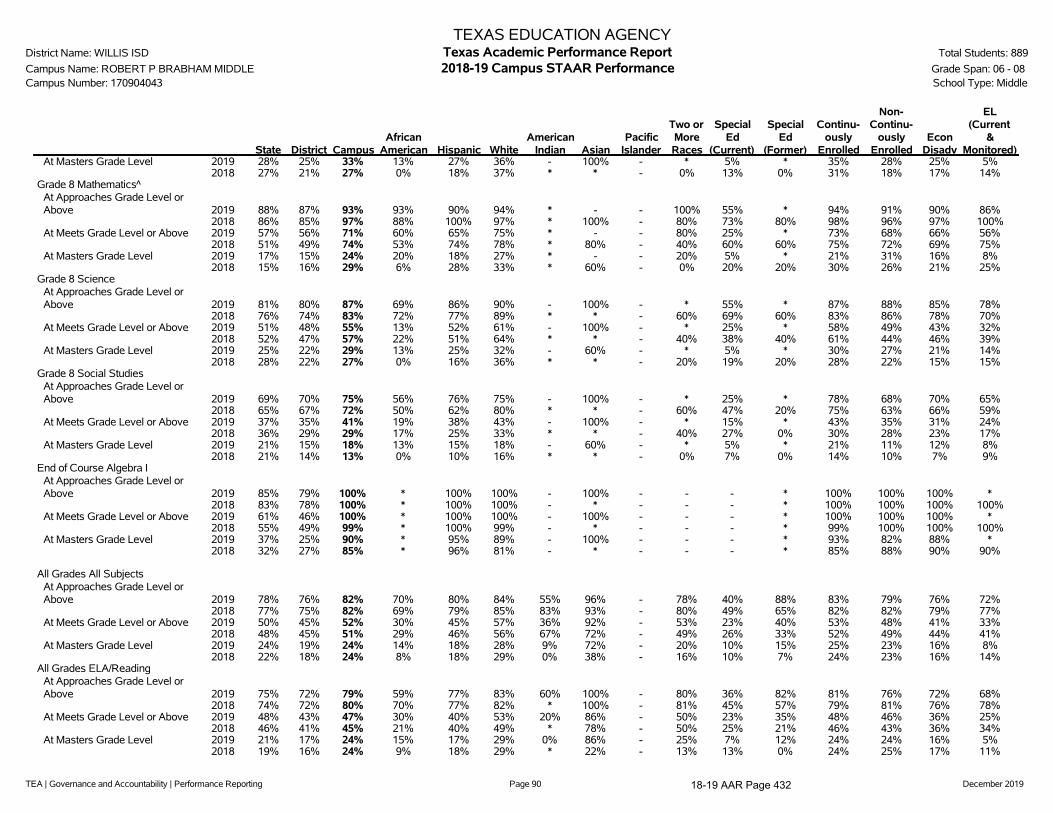
TEA | Governance and Accountability | Performance Reporting Page 90 December 2019
TEXAS EDUCATION AGENCYDistrict Name: WILLIS ISD Texas Academic Performance Report Total Students: 889
Campus Name: ROBERT P BRABHAM MIDDLE 2018-19 Campus STAAR Performance Grade Span: 06 - 08Campus Number: 170904043 School Type: Middle
State District CampusAfrican
American Hispanic WhiteAmerican
Indian AsianPacific
Islander
Two orMoreRaces
SpecialEd
(Current)
SpecialEd
(Former)
Continu-ously
Enrolled
Non-Continu-
ouslyEnrolled
EconDisadv
EL(Current
&Monitored)
At Masters Grade Level 2019 28% 25% 33% 13% 27% 36% - 100% - * 5% * 35% 28% 25% 5%2018 27% 21% 27% 0% 18% 37% * * - 0% 13% 0% 31% 18% 17% 14%
Grade 8 Mathematics^At Approaches Grade Level orAbove 2019 88% 87% 93% 93% 90% 94% * - - 100% 55% * 94% 91% 90% 86%
2018 86% 85% 97% 88% 100% 97% * 100% - 80% 73% 80% 98% 96% 97% 100%At Meets Grade Level or Above 2019 57% 56% 71% 60% 65% 75% * - - 80% 25% * 73% 68% 66% 56%
2018 51% 49% 74% 53% 74% 78% * 80% - 40% 60% 60% 75% 72% 69% 75%At Masters Grade Level 2019 17% 15% 24% 20% 18% 27% * - - 20% 5% * 21% 31% 16% 8%
2018 15% 16% 29% 6% 28% 33% * 60% - 0% 20% 20% 30% 26% 21% 25%Grade 8 Science
At Approaches Grade Level orAbove 2019 81% 80% 87% 69% 86% 90% - 100% - * 55% * 87% 88% 85% 78%
2018 76% 74% 83% 72% 77% 89% * * - 60% 69% 60% 83% 86% 78% 70%At Meets Grade Level or Above 2019 51% 48% 55% 13% 52% 61% - 100% - * 25% * 58% 49% 43% 32%
2018 52% 47% 57% 22% 51% 64% * * - 40% 38% 40% 61% 44% 46% 39%At Masters Grade Level 2019 25% 22% 29% 13% 25% 32% - 60% - * 5% * 30% 27% 21% 14%
2018 28% 22% 27% 0% 16% 36% * * - 20% 19% 20% 28% 22% 15% 15%Grade 8 Social Studies
At Approaches Grade Level orAbove 2019 69% 70% 75% 56% 76% 75% - 100% - * 25% * 78% 68% 70% 65%
2018 65% 67% 72% 50% 62% 80% * * - 60% 47% 20% 75% 63% 66% 59%At Meets Grade Level or Above 2019 37% 35% 41% 19% 38% 43% - 100% - * 15% * 43% 35% 31% 24%
2018 36% 29% 29% 17% 25% 33% * * - 40% 27% 0% 30% 28% 23% 17%At Masters Grade Level 2019 21% 15% 18% 13% 15% 18% - 60% - * 5% * 21% 11% 12% 8%
2018 21% 14% 13% 0% 10% 16% * * - 0% 7% 0% 14% 10% 7% 9%End of Course Algebra I
At Approaches Grade Level orAbove 2019 85% 79% 100% * 100% 100% - 100% - - - * 100% 100% 100% *
2018 83% 78% 100% * 100% 100% - * - - - * 100% 100% 100% 100%At Meets Grade Level or Above 2019 61% 46% 100% * 100% 100% - 100% - - - * 100% 100% 100% *
2018 55% 49% 99% * 100% 99% - * - - - * 99% 100% 100% 100%At Masters Grade Level 2019 37% 25% 90% * 95% 89% - 100% - - - * 93% 82% 88% *
2018 32% 27% 85% * 96% 81% - * - - - * 85% 88% 90% 90%
All Grades All SubjectsAt Approaches Grade Level orAbove 2019 78% 76% 82% 70% 80% 84% 55% 96% - 78% 40% 88% 83% 79% 76% 72%
2018 77% 75% 82% 69% 79% 85% 83% 93% - 80% 49% 65% 82% 82% 79% 77%At Meets Grade Level or Above 2019 50% 45% 52% 30% 45% 57% 36% 92% - 53% 23% 40% 53% 48% 41% 33%
2018 48% 45% 51% 29% 46% 56% 67% 72% - 49% 26% 33% 52% 49% 44% 41%At Masters Grade Level 2019 24% 19% 24% 14% 18% 28% 9% 72% - 20% 10% 15% 25% 23% 16% 8%
2018 22% 18% 24% 8% 18% 29% 0% 38% - 16% 10% 7% 24% 23% 16% 14%All Grades ELA/Reading
At Approaches Grade Level orAbove 2019 75% 72% 79% 59% 77% 83% 60% 100% - 80% 36% 82% 81% 76% 72% 68%
2018 74% 72% 80% 70% 77% 82% * 100% - 81% 45% 57% 79% 81% 76% 78%At Meets Grade Level or Above 2019 48% 43% 47% 30% 40% 53% 20% 86% - 50% 23% 35% 48% 46% 36% 25%
2018 46% 41% 45% 21% 40% 49% * 78% - 50% 25% 21% 46% 43% 36% 34%At Masters Grade Level 2019 21% 17% 24% 15% 17% 29% 0% 86% - 25% 7% 12% 24% 24% 16% 5%
2018 19% 16% 24% 9% 18% 29% * 22% - 13% 13% 0% 24% 25% 17% 11%
18-19 AAR Page 432

TEA | Governance and Accountability | Performance Reporting Page 91 December 2019
TEXAS EDUCATION AGENCYDistrict Name: WILLIS ISD Texas Academic Performance Report Total Students: 889
Campus Name: ROBERT P BRABHAM MIDDLE 2018-19 Campus STAAR Performance Grade Span: 06 - 08Campus Number: 170904043 School Type: Middle
State District CampusAfrican
American Hispanic WhiteAmerican
Indian AsianPacific
Islander
Two orMoreRaces
SpecialEd
(Current)
SpecialEd
(Former)
Continu-ously
Enrolled
Non-Continu-
ouslyEnrolled
EconDisadv
EL(Current
&Monitored)
All Grades MathematicsAt Approaches Grade Level orAbove 2019 82% 81% 89% 80% 87% 91% 40% 100% - 85% 48% 94% 90% 86% 84% 83%
2018 81% 81% 90% 79% 90% 91% * 100% - 88% 56% 87% 91% 89% 88% 91%At Meets Grade Level or Above 2019 52% 49% 62% 39% 57% 68% 40% 100% - 65% 22% 59% 65% 56% 52% 49%
2018 50% 49% 65% 50% 60% 68% * 89% - 47% 28% 53% 65% 63% 58% 60%At Masters Grade Level 2019 26% 23% 27% 13% 22% 31% 20% 86% - 20% 12% 18% 27% 26% 17% 10%
2018 24% 21% 30% 13% 25% 34% * 67% - 18% 8% 13% 31% 28% 22% 21%All Grades Writing
At Approaches Grade Level orAbove 2019 68% 64% 70% 92% 65% 72% * * - 67% 33% 75% 71% 69% 61% 49%
2018 66% 65% 74% 53% 73% 76% - 100% - * 20% * 74% 74% 72% 60%At Meets Grade Level or Above 2019 38% 31% 38% 33% 27% 44% * * - 44% 30% 0% 39% 37% 26% 11%
2018 41% 38% 45% 7% 39% 51% - 60% - * 15% * 46% 43% 43% 33%At Masters Grade Level 2019 14% 10% 17% 17% 11% 21% * * - 0% 19% 0% 16% 20% 9% 6%
2018 13% 8% 14% 7% 12% 15% - 20% - * 5% * 13% 16% 10% 4%All Grades Science
At Approaches Grade Level orAbove 2019 81% 81% 87% 69% 86% 90% - 100% - * 55% * 87% 88% 85% 78%
2018 80% 77% 83% 72% 77% 89% * * - 60% 69% 60% 83% 86% 78% 70%At Meets Grade Level or Above 2019 54% 51% 55% 13% 52% 61% - 100% - * 25% * 58% 49% 43% 32%
2018 51% 46% 57% 22% 51% 64% * * - 40% 38% 40% 61% 44% 46% 39%At Masters Grade Level 2019 25% 20% 29% 13% 25% 32% - 60% - * 5% * 30% 27% 21% 14%
2018 23% 18% 27% 0% 16% 36% * * - 20% 19% 20% 28% 22% 15% 15%All Grades Social Studies
At Approaches Grade Level orAbove 2019 81% 81% 75% 56% 76% 75% - 100% - * 25% * 78% 68% 70% 65%
2018 78% 79% 72% 50% 62% 80% * * - 60% 47% 20% 75% 63% 66% 59%At Meets Grade Level or Above 2019 55% 52% 41% 19% 38% 43% - 100% - * 15% * 43% 35% 31% 24%
2018 53% 48% 29% 17% 25% 33% * * - 40% 27% 0% 30% 28% 23% 17%At Masters Grade Level 2019 33% 27% 18% 13% 15% 18% - 60% - * 5% * 21% 11% 12% 8%
2018 31% 24% 13% 0% 10% 16% * * - 0% 7% 0% 14% 10% 7% 9%
18-19 AAR Page 433
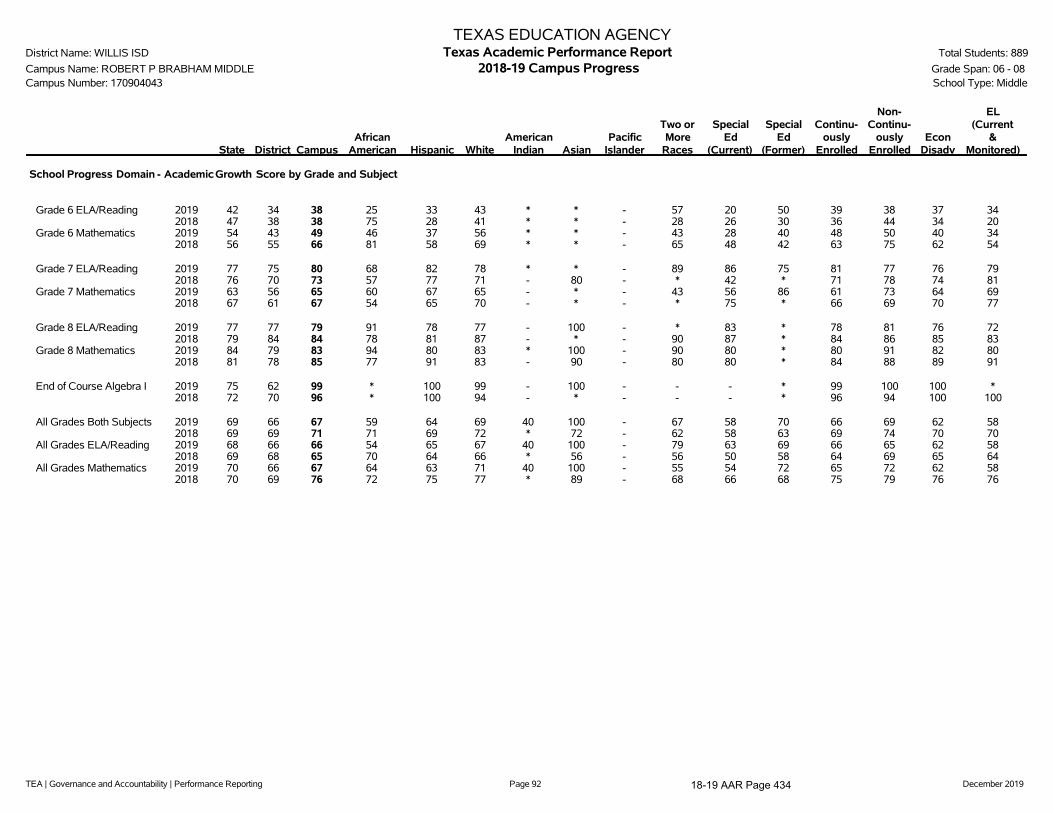
TEA | Governance and Accountability | Performance Reporting Page 92 December 2019
TEXAS EDUCATION AGENCYDistrict Name: WILLIS ISD Texas Academic Performance Report Total Students: 889
Campus Name: ROBERT P BRABHAM MIDDLE 2018-19 Campus Progress Grade Span: 06 - 08Campus Number: 170904043 School Type: Middle
State District CampusAfrican
American Hispanic WhiteAmerican
Indian AsianPacific
Islander
Two orMore
Races
SpecialEd
(Current)
SpecialEd
(Former)
Continu-ously
Enrolled
Non-Continu-
ouslyEnrolled
EconDisadv
EL(Current
&Monitored)
School Progress Domain - Academic Growth Score by Grade and Subject
Grade 6 ELA/Reading 2019 42 34 38 25 33 43 * * - 57 20 50 39 38 37 342018 47 38 38 75 28 41 * * - 28 26 30 36 44 34 20
Grade 6 Mathematics 2019 54 43 49 46 37 56 * * - 43 28 40 48 50 40 342018 56 55 66 81 58 69 * * - 65 48 42 63 75 62 54
Grade 7 ELA/Reading 2019 77 75 80 68 82 78 * * - 89 86 75 81 77 76 792018 76 70 73 57 77 71 - 80 - * 42 * 71 78 74 81
Grade 7 Mathematics 2019 63 56 65 60 67 65 - * - 43 56 86 61 73 64 692018 67 61 67 54 65 70 - * - * 75 * 66 69 70 77
Grade 8 ELA/Reading 2019 77 77 79 91 78 77 - 100 - * 83 * 78 81 76 722018 79 84 84 78 81 87 - * - 90 87 * 84 86 85 83
Grade 8 Mathematics 2019 84 79 83 94 80 83 * 100 - 90 80 * 80 91 82 802018 81 78 85 77 91 83 - 90 - 80 80 * 84 88 89 91
End of Course Algebra I 2019 75 62 99 * 100 99 - 100 - - - * 99 100 100 *2018 72 70 96 * 100 94 - * - - - * 96 94 100 100
All Grades Both Subjects 2019 69 66 67 59 64 69 40 100 - 67 58 70 66 69 62 582018 69 69 71 71 69 72 * 72 - 62 58 63 69 74 70 70
All Grades ELA/Reading 2019 68 66 66 54 65 67 40 100 - 79 63 69 66 65 62 582018 69 68 65 70 64 66 * 56 - 56 50 58 64 69 65 64
All Grades Mathematics 2019 70 66 67 64 63 71 40 100 - 55 54 72 65 72 62 582018 70 69 76 72 75 77 * 89 - 68 66 68 75 79 76 76
18-19 AAR Page 434

TEA | Governance and Accountability | Performance Reporting Page 93 December 2019
TEXAS EDUCATION AGENCYDistrict Name: WILLIS ISD Texas Academic Performance Report Total Students: 889
Campus Name: ROBERT P BRABHAM MIDDLE 2018-19 Campus Prior Year and Student Success Initiative Grade Span: 06 - 08Campus Number: 170904043 School Type: Middle
State District CampusAfrican
American Hispanic WhiteAmerican
Indian AsianPacific
Islander
Two orMore
RacesSpecial
EdEcon
DisadvEL
(Current)
Progress of Prior-Year Non-Proficient Students
Sum of Grades 4-8
Reading 2019 41% 39% 43% 20% 46% 46% * - - 33% 16% 37% 35%2018 38% 37% 43% 40% 39% 46% - - - * 26% 38% 35%
Mathematics 2019 45% 48% 48% 63% 34% 57% * - - * 23% 42% 38%2018 47% 48% 66% 62% 81% 58% - - - * 34% 70% 80%
Student Success Initiative
Grade 5 ReadingSTAARMet Standard (Non-Proficient in Previous Year)
Promoted to Grade 6 2019 9% 2% 7% 0% 8% 8% - - - - 0% 4% 14%
Grade 5 MathematicsSTAARMet Standard (Non-Proficient in Previous Year)
Promoted to Grade 6 2019 24% 9% 10% - * 20% * - - - 0% 0% *
Grade 8 ReadingStudents Meeting Approaches Grade Level on First STAARAdministration
2019 78% 76% 82% 63% 83% 83% - 100% - * 24% 78% 55%Students Requiring Accelerated Instruction
2019 22% 24% 18% 38% 17% 17% - 0% - * 76% 22% 45%STAARCumulativeMet Standard
2019 85% 84% 88% 69% 88% 90% - 100% - * 35% 83% 75%
Grade 8 MathematicsStudents Meeting Approaches Grade Level on First STAARAdministration
2019 82% 83% 91% 87% 89% 92% * - - * 35% 89% 70%Students Requiring Accelerated Instruction
2019 18% 17% 9% 13% 11% 8% * - - * 65% 11% 30%STAARCumulativeMet Standard
2019 88% 88% 93% 93% 90% 94% * - - * 47% 90% 75%
18-19 AAR Page 435

TEA | Governance and Accountability | Performance Reporting Page 94 December 2019
TEXAS EDUCATION AGENCYDistrict Name: WILLIS ISD Texas Academic Performance Report Total Students: 889
Campus Name: ROBERT P BRABHAM MIDDLE 2018-19 Campus STAAR Performance Grade Span: 06 - 08Campus Number: 170904043 Bilingual Education/English as a Second Language (Current EL Students)
State District CampusBilingual
EducationBE-TransEarly Exit
BE-TransLate Exit
BE-DualTwo-Way
BE-DualOne-Way ESL
ESLContent
ESLPull-Out
LEP NoServices
LEP withServices
TotalEL
STAARPerformance Rate by Subject and Performance LevelAll Grades All Subjects
At Approaches Grade Level or Above 2019 78% 76% 82% - - - - - 61% 61% - 42% 61% 59%2018 77% 75% 82% - - - - - 62% 62% - 17% 62% 61%
At Meets Grade Level or Above 2019 50% 45% 52% - - - - - 18% 18% - 25% 18% 19%2018 48% 45% 51% - - - - - 25% 25% - 0% 25% 24%
At Masters Grade Level 2019 24% 19% 24% - - - - - 3% 3% - 0% 3% 2%2018 22% 18% 24% - - - - - 6% 6% - 0% 6% 6%
All Grades ELA/ReadingAt Approaches Grade Level or Above 2019 75% 72% 79% - - - - - 58% 58% - * 58% 57%
2018 74% 72% 80% - - - - - 60% 60% - * 60% 60%At Meets Grade Level or Above 2019 48% 43% 47% - - - - - 14% 14% - * 14% 14%
2018 46% 41% 45% - - - - - 22% 22% - * 22% 21%At Masters Grade Level 2019 21% 17% 24% - - - - - 2% 2% - * 2% 1%
2018 19% 16% 24% - - - - - 4% 4% - * 4% 4%All Grades Mathematics
At Approaches Grade Level or Above 2019 82% 81% 89% - - - - - 71% 71% - * 71% 71%2018 81% 81% 90% - - - - - 84% 84% - * 84% 83%
At Meets Grade Level or Above 2019 52% 49% 62% - - - - - 33% 33% - * 33% 34%2018 50% 49% 65% - - - - - 40% 40% - * 40% 39%
At Masters Grade Level 2019 26% 23% 27% - - - - - 5% 5% - * 5% 4%2018 24% 21% 30% - - - - - 10% 10% - * 10% 10%
All Grades WritingAt Approaches Grade Level or Above 2019 68% 64% 70% - - - - - 40% 40% - - 40% 40%
2018 66% 65% 74% - - - - - 26% 26% - * 26% 25%At Meets Grade Level or Above 2019 38% 31% 38% - - - - - 12% 12% - - 12% 12%
2018 41% 38% 45% - - - - - 11% 11% - * 11% 10%At Masters Grade Level 2019 14% 10% 17% - - - - - 4% 4% - - 4% 4%
2018 13% 8% 14% - - - - - 0% 0% - * 0% 0%All Grades Science
At Approaches Grade Level or Above 2019 81% 81% 87% - - - - - 68% 68% - * 68% 62%2018 80% 77% 83% - - - - - 57% 57% - * 57% 54%
At Meets Grade Level or Above 2019 54% 51% 55% - - - - - 5% 5% - * 5% 5%2018 51% 46% 57% - - - - - 17% 17% - * 17% 17%
At Masters Grade Level 2019 25% 20% 29% - - - - - 0% 0% - * 0% 0%2018 23% 18% 27% - - - - - 4% 4% - * 4% 4%
All Grades Social StudiesAt Approaches Grade Level or Above 2019 81% 81% 75% - - - - - 53% 53% - * 53% 48%
2018 78% 79% 72% - - - - - 39% 39% - * 39% 38%At Meets Grade Level or Above 2019 55% 52% 41% - - - - - 5% 5% - * 5% 5%
2018 53% 48% 29% - - - - - 9% 9% - * 9% 8%At Masters Grade Level 2019 33% 27% 18% - - - - - 0% 0% - * 0% 0%
2018 31% 24% 13% - - - - - 4% 4% - * 4% 4%
School Progress Domain - Academic Growth ScoreAll Grades Both Subjects 2019 69% 66% 67% - - - - - 63% 63% - 75% 63% 64%
2018 69% 69% 71% - - - - - 67% 67% - * 67% 68%All Grades ELA/Reading 2019 68% 66% 66% - - - - - 63% 63% - * 63% 64%
2018 69% 68% 65% - - - - - 61% 61% - * 61% 62%All Grades Mathematics 2019 70% 66% 67% - - - - - 63% 63% - * 63% 64%
2018 70% 69% 76% - - - - - 73% 73% - * 73% 73%
Progress of Prior Year STAAR Non-Proficient Students (Percent of Non-Proficient Passing STAAR)Reading 2019 41% 39% 43% - - - - - 36% 36% - * 36% 35%
18-19 AAR Page 436

TEA | Governance and Accountability | Performance Reporting Page 95 December 2019
TEXAS EDUCATION AGENCYDistrict Name: WILLIS ISD Texas Academic Performance Report Total Students: 889
Campus Name: ROBERT P BRABHAM MIDDLE 2018-19 Campus STAAR Performance Grade Span: 06 - 08Campus Number: 170904043 Bilingual Education/English as a Second Language (Current EL Students)
State District CampusBilingual
EducationBE-TransEarly Exit
BE-TransLate Exit
BE-DualTwo-Way
BE-DualOne-Way ESL
ESLContent
ESLPull-Out
LEP NoServices
LEP withServices
TotalEL
2018 38% 37% 43% - - - - - 36% 36% - * 36% 35%Mathematics 2019 45% 48% 48% - - - - - 33% 33% - * 33% 38%
2018 47% 48% 66% - - - - - 86% 86% - * 86% 80%
18-19 AAR Page 437

TEA | Governance and Accountability | Performance Reporting Page 96 December 2019
TEXAS EDUCATION AGENCYDistrict Name: WILLIS ISD Texas Academic Performance Report Total Students: 889
Campus Name: ROBERT P BRABHAM MIDDLE 2018-19 Campus STAAR Participation Grade Span: 06 - 08Campus Number: 170904043 School Type: Middle
State District CampusAfrican
American Hispanic WhiteAmerican
Indian AsianPacific
Islander
Two orMore
RacesSpecial
EdEcon
DisadvEL
(Current)2019 STAARParticipation
(All Grades)
All TestsAssessment Participant 99% 100% 100% 100% 100% 100% 100% 100% - 100% 100% 100% 100%
Included in Accountability 94% 94% 94% 92% 94% 94% 100% 100% - 96% 91% 94% 95%Not Included in Accountability
Mobile 4% 5% 6% 8% 6% 5% 0% 0% - 4% 9% 6% 5%Other Exclusions 1% 1% 0% 0% 0% 0% 0% 0% - 0% 0% 0% 0%
Not Tested 1% 0% 0% 0% 0% 0% 0% 0% - 0% 0% 0% 0%Absent 1% 0% 0% 0% 0% 0% 0% 0% - 0% 0% 0% 0%Other 0% 0% 0% 0% 0% 0% 0% 0% - 0% 0% 0% 0%
2018 STAARParticipation(All Grades)
All TestsAssessment Participant 99% 100% 100% 100% 100% 100% 100% 100% - 100% 100% 100% 100%
Included in Accountability 94% 93% 96% 92% 97% 95% 100% 100% - 100% 92% 96% 93%Not Included in Accountability
Mobile 4% 6% 4% 8% 1% 5% 0% 0% - 0% 7% 3% 2%Other Exclusions 1% 0% 0% 0% 1% 0% 0% 0% - 0% 2% 1% 5%
Not Tested 1% 0% 0% 0% 0% 0% 0% 0% - 0% 0% 0% 0%Absent 1% 0% 0% 0% 0% 0% 0% 0% - 0% 0% 0% 0%Other 0% 0% 0% 0% 0% 0% 0% 0% - 0% 0% 0% 0%
18-19 AAR Page 438

TEA | Governance and Accountability | Performance Reporting Page 97 December 2019
TEXAS EDUCATION AGENCYDistrict Name: WILLIS ISD Texas Academic Performance Report Total Students: 889
Campus Name: ROBERT P BRABHAM MIDDLE 2018-19 Campus Attendance, Graduation, and Dropout Rates Grade Span: 06 - 08Campus Number: 170904043 School Type: Middle
State District CampusAfrican
American Hispanic WhiteAmerican
Indian AsianPacific
Islander
Two orMore
RacesSpecial
EdEcon
DisadvEL
(Current)
Attendance Rate2017-18 95.4% 95.0% 96.1% 96.6% 96.7% 95.7% * 98.1% - 97.2% 94.9% 95.7% 96.6%2016-17 95.7% 95.2% 96.3% 96.9% 97.0% 95.9% * 99.0% - 95.6% 95.6% 96.3% 97.2%
Annual Dropout Rate (Gr 7-8)2017-18 0.4% 0.1% 0.0% 0.0% 0.0% 0.0% * 0.0% - 0.0% 0.0% 0.0% 0.0%2016-17 0.3% 0.2% 0.0% 0.0% 0.0% 0.0% * 0.0% - 0.0% 0.0% 0.0% 0.0%
Annual Dropout Rate (Gr 9-12)2017-18 1.9% 2.9% - - - - - - - - - - -2016-17 1.9% 1.5% - - - - - - - - - - -
4-Year Longitudinal Rate (Gr 9-12)Class of 2018
Graduated 90.0% 86.4% - - - - - - - - - - -Received TxCHSE 0.4% 0.4% - - - - - - - - - - -Continued HS 3.8% 4.0% - - - - - - - - - - -Dropped Out 5.7% 9.1% - - - - - - - - - - -Graduates and TxCHSE 90.4% 86.8% - - - - - - - - - - -Graduates, TxCHSE,and Continuers 94.3% 90.9% - - - - - - - - - - -
Class of 2017Graduated 89.7% 89.3% - - - - - - - - - - -Received TxCHSE 0.4% 1.1% - - - - - - - - - - -Continued HS 4.0% 4.6% - - - - - - - - - - -Dropped Out 5.9% 5.0% - - - - - - - - - - -Graduates and TxCHSE 90.1% 90.4% - - - - - - - - - - -Graduates, TxCHSE,and Continuers 94.1% 95.0% - - - - - - - - - - -
5-Year Extended Longitudinal Rate (Gr 9-12)Class of 2017
Graduated 92.0% 92.0% - - - - - - - - - - -Received TxCHSE 0.6% 1.3% - - - - - - - - - - -Continued HS 1.1% 0.2% - - - - - - - - - - -Dropped Out 6.3% 6.5% - - - - - - - - - - -Graduates and TxCHSE 92.6% 93.3% - - - - - - - - - - -Graduates, TxCHSE,and Continuers 93.7% 93.5% - - - - - - - - - - -
Class of 2016Graduated 91.6% 93.7% - - - - - - - - - - -Received TxCHSE 0.7% 1.1% - - - - - - - - - - -Continued HS 1.2% 0.0% - - - - - - - - - - -Dropped Out 6.6% 5.2% - - - - - - - - - - -Graduates and TxCHSE 92.2% 94.8% - - - - - - - - - - -Graduates, TxCHSE,and Continuers 93.4% 94.8% - - - - - - - - - - -
6-Year Extended Longitudinal Rate (Gr 9-12)Class of 2016
Graduated 92.1% 93.9% - - - - - - - - - - -
18-19 AAR Page 439

TEA | Governance and Accountability | Performance Reporting Page 98 December 2019
TEXAS EDUCATION AGENCYDistrict Name: WILLIS ISD Texas Academic Performance Report Total Students: 889
Campus Name: ROBERT P BRABHAM MIDDLE 2018-19 Campus Attendance, Graduation, and Dropout Rates Grade Span: 06 - 08Campus Number: 170904043 School Type: Middle
State District CampusAfrican
American Hispanic WhiteAmerican
Indian AsianPacific
Islander
Two orMore
RacesSpecial
EdEcon
DisadvEL
(Current)Received TxCHSE 0.8% 1.1% - - - - - - - - - - -Continued HS 0.5% 0.0% - - - - - - - - - - -Dropped Out 6.6% 5.0% - - - - - - - - - - -Graduates and TxCHSE 92.9% 95.0% - - - - - - - - - - -Graduates, TxCHSE,and Continuers 93.4% 95.0% - - - - - - - - - - -
Class of 2015Graduated 91.8% 93.3% - - - - - - - - - - -Received TxCHSE 1.0% 1.4% - - - - - - - - - - -Continued HS 0.6% 0.2% - - - - - - - - - - -Dropped Out 6.7% 5.0% - - - - - - - - - - -Graduates and TxCHSE 92.8% 94.7% - - - - - - - - - - -Graduates, TxCHSE,and Continuers 93.3% 95.0% - - - - - - - - - - -
4-Year Federal Graduation Rate Without Exclusions (Gr 9-12)Class of 2018 90.0% 85.5% - - - - - - - - - - -Class of 2017 89.7% 88.6% - - - - - - - - - - -
RHSP/DAP Graduates (Longitudinal Rate)Class of 2018 68.5% * - - - - - - - - - - -Class of 2017 88.5% 89.1% - - - - - - - - - - -
FHSP-E Graduates (Longitudinal Rate)Class of 2018 5.0% 2.0% - - - - - - - - - - -Class of 2017 6.0% 0.0% - - - - - - - - - - -
FHSP-DLA Graduates (Longitudinal Rate)Class of 2018 82.0% 87.4% - - - - - - - - - - -Class of 2017 60.8% 14.3% - - - - - - - - - - -
RHSP/DAP/FHSP-E/FHSP-DLA Graduates (Longitudinal Rate)Class of 2018 86.8% 89.2% - - - - - - - - - - -Class of 2017 85.9% 87.8% - - - - - - - - - - -
RHSP/DAP Graduates (Annual Rate)2017-18 37.7% 37.5% - - - - - - - - - - -2016-17 87.2% 87.0% - - - - - - - - - - -
FHSP-E Graduates (Annual Rate)2017-18 4.9% 1.7% - - - - - - - - - - -2016-17 7.2% 11.1% - - - - - - - - - - -
FHSP-DLA Graduates (Annual Rate)2017-18 81.5% 87.2% - - - - - - - - - - -2016-17 56.5% 22.2% - - - - - - - - - - -
RHSP/DAP/FHSP-E/FHSP-DLA Graduates (Annual Rate)2017-18 85.1% 87.9% - - - - - - - - - - -2016-17 84.0% 85.9% - - - - - - - - - - -
18-19 AAR Page 440

TEA | Governance and Accountability | Performance Reporting Page 99 December 2019
TEXAS EDUCATION AGENCYDistrict Name: WILLIS ISD Texas Academic Performance Report Total Students: 889
Campus Name: ROBERT P BRABHAM MIDDLE 2018-19 Campus Graduation Profile Grade Span: 06 - 08Campus Number: 170904043 School Type: Middle
CampusCount
CampusPercent
DistrictCount
StateCount
Graduates (2017-18 Annual Graduates)Total Graduates - - 422 347,893
By Ethnicity:African American - - 31 43,502Hispanic - - 128 173,272White - - 247 107,052American Indian - - 3 1,226Asian - - 2 15,589Pacific Islander - - 2 528Two or More Races - - 9 6,724
By Graduation Type:Minimum H.S. Program - - 5 5,855Recommended H.S. Program/Distinguished Achievement Program - - 3 3,538Foundation H.S. Program (No Endorsement) - - 46 49,432Foundation H.S. Program (Endorsement) - - 7 16,542Foundation H.S. Program (DLA) - - 361 272,526
Special Education Graduates - - 27 25,962Economically Disadvantaged Graduates - - 181 166,956LEP Graduates - - 16 21,359At-Risk Graduates - - 137 144,805
18-19 AAR Page 441

TEA | Governance and Accountability | Performance Reporting Page 100 December 2019
TEXAS EDUCATION AGENCYDistrict Name: WILLIS ISD Texas Academic Performance Report Total Students: 889
Campus Name: ROBERT P BRABHAM MIDDLE 2018-19 Campus College, Career, and Military Readiness (CCMR) Grade Span: 06 - 08Campus Number: 170904043 School Type: Middle
State District CampusAfrican
American Hispanic WhiteAmerican
Indian AsianPacific
Islander
Two orMore
RacesSpecial
EdEcon
DisadvEL
(Current)College, Career, and Military Ready Graduates (Student Achievement) ***
College, Career, or Military Ready (Annual Graduates)2017-18 65.5% 64.0% - - - - - - - - - - -
College Ready Graduates ***College Ready (Annual Graduates)
2017-18 50.0% 34.4% - - - - - - - - - - -
TSI Criteria Graduates (Annual Graduates)English Language Arts
2017-18 58.2% 51.2% - - - - - - - - - - -Mathematics
2017-18 46.0% 29.9% - - - - - - - - - - -Both Subjects
2017-18 42.1% 28.4% - - - - - - - - - - -
Dual Course Credits (Annual Graduates)Any Subject
2017-18 20.7% 17.3% - - - - - - - - - - -2016-17 19.9% 21.6% - - - - - - - - - - -
AP/IB Met Criteria in Any Subject (Annual Graduates)Any Subject
2017-18 20.4% 9.5% - - - - - - - - - - -2016-17 20.1% 4.9% - - - - - - - - - - -
Associate's DegreeAssociate's Degree (Annual Graduates)
2017-18 1.4% 0.2% - - - - - - - - - - -2016-17 0.8% 0.0% - - - - - - - - - - -
OnRampsCourse Credits (Annual Graduates)2017-18 1.0% 0.0% - - - - - - - - - - -
Career/Military Ready GraduatesCareer or Military Ready (Annual Graduates)
2017-18 28.7% 41.6% - - - - - - - - - - -2016-17 13.2% 13.1% - - - - - - - - - - -
Approved Industry-Based Certification (Annual Graduates)2017-18 4.8% 9.0% - - - - - - - - - - -2016-17 2.7% 3.8% - - - - - - - - - - -
Graduate with Completed IEP and Workforce Readiness (Annual Graduates)2017-18 1.7% 6.2% - - - - - - - - - - -2016-17 1.0% 0.0% - - - - - - - - - - -
CTE Coherent Sequence Coursework Aligned with Industry-Based Certifications (Annual Graduates)2017-18 38.7% 58.8% - - - - - - - - - - -2016-17 17.3% 14.6% - - - - - - - - - - -
18-19 AAR Page 442

TEA | Governance and Accountability | Performance Reporting Page 101 December 2019
TEXAS EDUCATION AGENCYDistrict Name: WILLIS ISD Texas Academic Performance Report Total Students: 889
Campus Name: ROBERT P BRABHAM MIDDLE 2018-19 Campus College, Career, and Military Readiness (CCMR) Grade Span: 06 - 08Campus Number: 170904043 School Type: Middle
State District CampusAfrican
American Hispanic WhiteAmerican
Indian AsianPacific
Islander
Two orMore
RacesSpecial
EdEcon
DisadvEL
(Current)
U.S. Armed Forces Enlistment (Annual Graduates)2017-18 4.3% 3.3% - - - - - - - - - - -2016-17 2.2% 2.8% - - - - - - - - - - -
Graduates under an Advanced Degree Plan and Identified as a current Special Education Student (Annual Graduates)2017-18 2.6% 0.9% - - - - - - - - - - -
Graduates with Level I or Level II Certificate (Annual Graduates)2017-18 0.6% 0.0% - - - - - - - - - - -2016-17 0.5% 0.0% - - - - - - - - - - -
18-19 AAR Page 443

TEA | Governance and Accountability | Performance Reporting Page 102 December 2019
TEXAS EDUCATION AGENCYDistrict Name: WILLIS ISD Texas Academic Performance Report Total Students: 889
Campus Name: ROBERT P BRABHAM MIDDLE 2018-19 Campus CCMR-Related Indicators Grade Span: 06 - 08Campus Number: 170904043 School Type: Middle
State District CampusAfrican
American Hispanic WhiteAmerican
Indian AsianPacific
Islander
Two orMore
RacesSpecial
EdEcon
DisadvEL
(Current)TSIA Results (Graduates >= Criterion) (Annual Graduates)
Reading2017-18 32.1% 36.5% - - - - - - - - - - -2016-17 23.4% 11.3% - - - - - - - - - - -
Mathematics2017-18 23.7% 21.8% - - - - - - - - - - -2016-17 19.8% 11.3% - - - - - - - - - - -
Both Subjects2017-18 18.1% 17.8% - - - - - - - - - - -2016-17 12.9% 5.4% - - - - - - - - - - -
CTE Coherent Sequence (Annual Graduates)2017-18 58.4% 61.8% - - - - - - - - - - -2016-17 50.5% 30.1% - - - - - - - - - - -
Completed and Received Credit for College Prep Courses (Annual Graduates)English Language Arts
2017-18 2.0% 0.0% - - - - - - - - - - -2016-17 0.8% 0.0% - - - - - - - - - - -
Mathematics2017-18 3.9% 0.0% - - - - - - - - - - -2016-17 1.4% 0.0% - - - - - - - - - - -
Both Subjects2017-18 0.9% 0.0% - - - - - - - - - - -2016-17 0.2% 0.0% - - - - - - - - - - -
AP/IB Results (Participation) (Grades 11-12)All Subjects
2018 25.8% 10.3% - - - - - - - - n/a - n/a2017 26.2% 12.1% - - - - - - - - n/a - n/a
English Language Arts2018 15.3% 6.5% - - - - - - - - n/a - n/a2017 15.9% 5.8% - - - - - - - - n/a - n/a
Mathematics2018 7.3% 0.8% - - - - - - - - n/a - n/a2017 7.2% 0.8% - - - - - - - - n/a - n/a
Science2018 10.8% 4.4% - - - - - - - - n/a - n/a2017 10.9% 4.2% - - - - - - - - n/a - n/a
Social Studies2018 14.5% 4.9% - - - - - - - - n/a - n/a2017 15.0% 8.8% - - - - - - - - n/a - n/a
AP/IB Results (Examinees >= Criterion) (Grades 11-12)All Subjects
2018 50.7% 48.5% - - - - - - - - n/a - n/a2017 49.1% 39.3% - - - - - - - - n/a - n/a
English Language Arts2018 42.5% 33.9% - - - - - - - - n/a - n/a2017 41.3% 38.9% - - - - - - - - n/a - n/a
Mathematics2018 52.8% 12.5% - - - - - - - - n/a - n/a
18-19 AAR Page 444

TEA | Governance and Accountability | Performance Reporting Page 103 December 2019
TEXAS EDUCATION AGENCYDistrict Name: WILLIS ISD Texas Academic Performance Report Total Students: 889
Campus Name: ROBERT P BRABHAM MIDDLE 2018-19 Campus CCMR-Related Indicators Grade Span: 06 - 08Campus Number: 170904043 School Type: Middle
State District CampusAfrican
American Hispanic WhiteAmerican
Indian AsianPacific
Islander
Two orMore
RacesSpecial
EdEcon
DisadvEL
(Current)2017 51.3% 14.3% - - - - - - - - n/a - n/a
Science2018 38.0% 21.4% - - - - - - - - n/a - n/a2017 38.3% 15.4% - - - - - - - - n/a - n/a
Social Studies2018 44.6% 51.1% - - - - - - - - n/a - n/a2017 41.4% 37.8% - - - - - - - - n/a - n/a
SAT/ACT Results (Annual Graduates) ***Tested
2017-18 74.6% 51.7% - - - - - - - - n/a - n/a2016-17 73.5% 53.6% - - - - - - - - n/a - n/a
At/Above Criterion2017-18 37.9% 33.0% - - - - - - - - n/a - n/a
Average SAT Score (Annual Graduates) ***All Subjects
2017-18 1036 1028 - - - - - - - - n/a - n/aEnglish Language Artsand Writing
2017-18 521 527 - - - - - - - - n/a - n/aMathematics
2017-18 515 500 - - - - - - - - n/a - n/a
Average ACT Score (Annual Graduates) ***All Subjects
2017-18 20.6 20.0 - - - - - - - - n/a - n/aEnglish Language Arts
2017-18 20.3 19.6 - - - - - - - - n/a - n/aMathematics
2017-18 20.6 19.4 - - - - - - - - n/a - n/aScience
2017-18 20.9 20.8 - - - - - - - - n/a - n/a
18-19 AAR Page 445

TEA | Governance and Accountability | Performance Reporting Page 104 December 2019
TEXAS EDUCATION AGENCYDistrict Name: WILLIS ISD Texas Academic Performance Report Total Students: 889
Campus Name: ROBERT P BRABHAM MIDDLE 2018-19 Campus Other Postsecondary Indicators Grade Span: 06 - 08Campus Number: 170904043 School Type: Middle
State District CampusAfrican
American Hispanic WhiteAmerican
Indian AsianPacific
Islander
Two orMore
RacesSpecial
EdEcon
DisadvEL
(Current)Advanced Dual-Credit Course Completion (Grades 9-12)
Any Subject2017-18 43.4% 32.6% - - - - - - - - - - -2016-17 37.1% 19.8% - - - - - - - - - - -
English Language Arts2017-18 17.3% 13.8% - - - - - - - - - - -2016-17 16.8% 13.1% - - - - - - - - - - -
Mathematics2017-18 20.7% 13.2% - - - - - - - - - - -2016-17 19.5% 12.1% - - - - - - - - - - -
Science2017-18 21.2% 19.7% - - - - - - - - - - -2016-17 5.7% 5.4% - - - - - - - - - - -
Social Studies2017-18 22.8% 11.7% - - - - - - - - - - -2016-17 21.8% 10.8% - - - - - - - - - - -
Graduates Enrolled in Texas Institution of Higher Education (TX IHE)2016-17 54.6% 48.0% - - - - - - - - - - -2015-16 54.7% 49.1% - - - - - - - - - - -
Graduates in TX IHE Completing One Year Without Enrollment in a Developmental Education Course2016-17 59.2% 54.6% - - - - - - - - - - -2015-16 55.7% 55.5% - - - - - - - - - - -
18-19 AAR Page 446
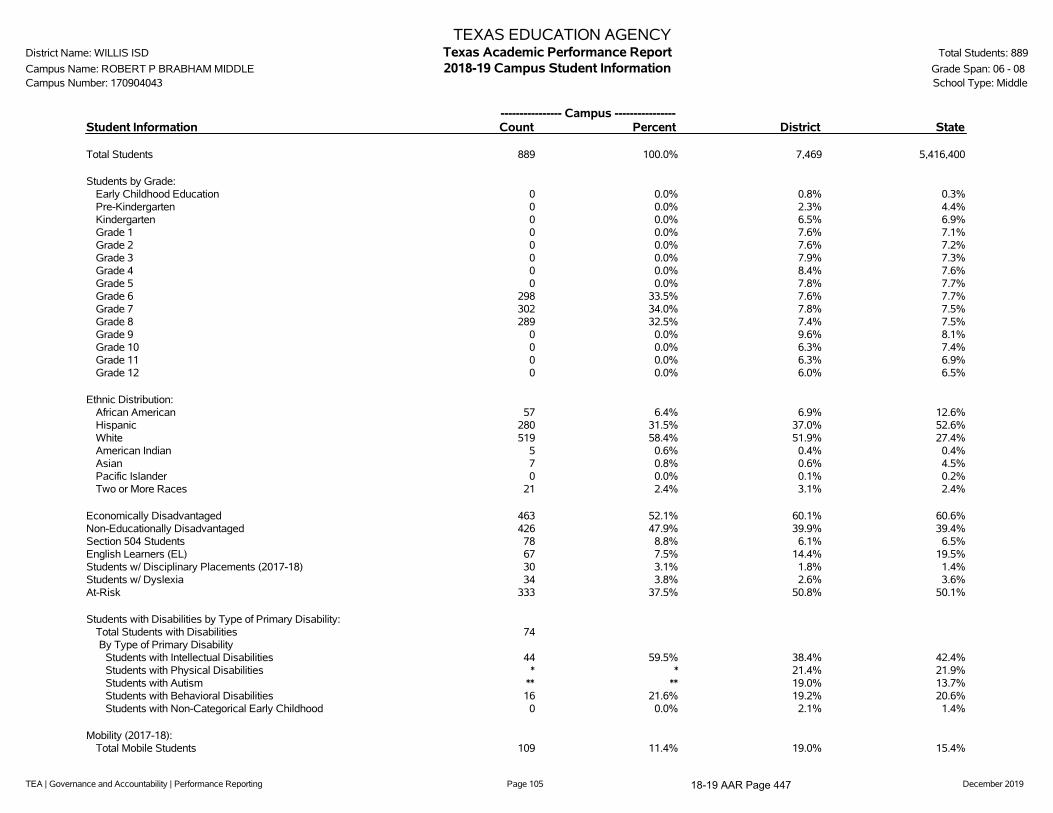
TEA | Governance and Accountability | Performance Reporting Page 105 December 2019
TEXAS EDUCATION AGENCYDistrict Name: WILLIS ISD Texas Academic Performance Report Total Students: 889
Campus Name: ROBERT P BRABHAM MIDDLE 2018-19 Campus Student Information Grade Span: 06 - 08Campus Number: 170904043 School Type: Middle
---------------- Campus ----------------Student Information Count Percent District State
Total Students 889 100.0% 7,469 5,416,400
Students by Grade:Early Childhood Education 0 0.0% 0.8% 0.3%Pre-Kindergarten 0 0.0% 2.3% 4.4%Kindergarten 0 0.0% 6.5% 6.9%Grade 1 0 0.0% 7.6% 7.1%Grade 2 0 0.0% 7.6% 7.2%Grade 3 0 0.0% 7.9% 7.3%Grade 4 0 0.0% 8.4% 7.6%Grade 5 0 0.0% 7.8% 7.7%Grade 6 298 33.5% 7.6% 7.7%Grade 7 302 34.0% 7.8% 7.5%Grade 8 289 32.5% 7.4% 7.5%Grade 9 0 0.0% 9.6% 8.1%Grade 10 0 0.0% 6.3% 7.4%Grade 11 0 0.0% 6.3% 6.9%Grade 12 0 0.0% 6.0% 6.5%
Ethnic Distribution:African American 57 6.4% 6.9% 12.6%Hispanic 280 31.5% 37.0% 52.6%White 519 58.4% 51.9% 27.4%American Indian 5 0.6% 0.4% 0.4%Asian 7 0.8% 0.6% 4.5%Pacific Islander 0 0.0% 0.1% 0.2%Two or More Races 21 2.4% 3.1% 2.4%
Economically Disadvantaged 463 52.1% 60.1% 60.6%Non-Educationally Disadvantaged 426 47.9% 39.9% 39.4%Section 504 Students 78 8.8% 6.1% 6.5%English Learners (EL) 67 7.5% 14.4% 19.5%Students w/ Disciplinary Placements (2017-18) 30 3.1% 1.8% 1.4%Students w/ Dyslexia 34 3.8% 2.6% 3.6%At-Risk 333 37.5% 50.8% 50.1%
Students with Disabilities by Type of Primary Disability:Total Students with Disabilities 74By Type of Primary Disability
Students with Intellectual Disabilities 44 59.5% 38.4% 42.4%Students with Physical Disabilities * * 21.4% 21.9%Students with Autism ** ** 19.0% 13.7%Students with Behavioral Disabilities 16 21.6% 19.2% 20.6%Students with Non-Categorical Early Childhood 0 0.0% 2.1% 1.4%
Mobility (2017-18):Total Mobile Students 109 11.4% 19.0% 15.4%
18-19 AAR Page 447

TEA | Governance and Accountability | Performance Reporting Page 106 December 2019
TEXAS EDUCATION AGENCYDistrict Name: WILLIS ISD Texas Academic Performance Report Total Students: 889
Campus Name: ROBERT P BRABHAM MIDDLE 2018-19 Campus Student Information Grade Span: 06 - 08Campus Number: 170904043 School Type: Middle
---------------- Campus ----------------Student Information Count Percent District State
By Ethnicity:African American 12 1.3%Hispanic 26 2.7%White 68 7.1%American Indian 0 0.0%Asian 0 0.0%Pacific Islander 0 0.0%Two or More Races 3 0.3%
--------Non-Special Education Rates-------- --------Special Education Rates--------Student Information Campus District State Campus District State
Retention Rates by Grade:Kindergarten - 0.4% 1.7% - 3.8% 6.2%Grade 1 - 2.0% 3.1% - 5.7% 5.5%Grade 2 - 1.3% 1.8% - 2.2% 2.3%Grade 3 - 1.2% 1.1% - 2.1% 0.9%Grade 4 - 0.0% 0.5% - 0.0% 0.5%Grade 5 - 0.2% 0.5% - 1.8% 0.6%Grade 6 0.8% 0.4% 0.4% 0.0% 0.0% 0.5%Grade 7 0.4% 1.0% 0.6% 0.0% 0.0% 0.6%Grade 8 0.0% 0.0% 0.4% 0.0% 0.0% 0.7%Grade 9 - 17.2% 7.2% - 34.0% 12.7%
Class Size Information Campus District State
Class Size Averages by Grade and Subject(Derived from teacher responsibility records):
Elementary:Kindergarten - 20.9 18.9Grade 1 - 19.8 18.8Grade 2 - 19.1 18.7Grade 3 - 20.1 18.9Grade 4 - 20.0 19.2Grade 5 - 23.0 21.2Grade 6 20.7 19.3 20.4
Secondary:English/Language Arts 16.9 15.9 16.6Foreign Languages 30.0 21.8 18.9Mathematics 21.3 16.7 17.8Science 21.7 18.4 18.9Social Studies 21.3 18.1 19.3
18-19 AAR Page 448
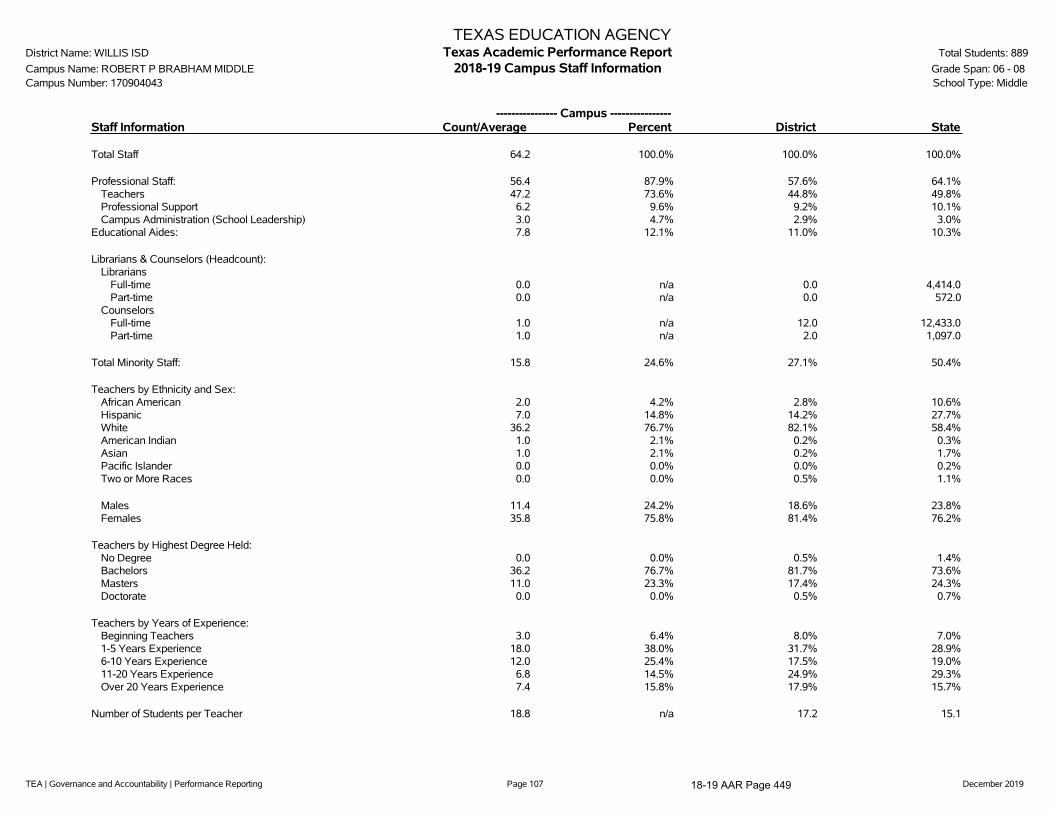
TEA | Governance and Accountability | Performance Reporting Page 107 December 2019
TEXAS EDUCATION AGENCYDistrict Name: WILLIS ISD Texas Academic Performance Report Total Students: 889
Campus Name: ROBERT P BRABHAM MIDDLE 2018-19 Campus Staff Information Grade Span: 06 - 08Campus Number: 170904043 School Type: Middle
---------------- Campus ----------------Staff Information Count/Average Percent District State
Total Staff 64.2 100.0% 100.0% 100.0%
Professional Staff: 56.4 87.9% 57.6% 64.1%Teachers 47.2 73.6% 44.8% 49.8%Professional Support 6.2 9.6% 9.2% 10.1%Campus Administration (School Leadership) 3.0 4.7% 2.9% 3.0%
Educational Aides: 7.8 12.1% 11.0% 10.3%
Librarians & Counselors (Headcount):Librarians
Full-time 0.0 n/a 0.0 4,414.0Part-time 0.0 n/a 0.0 572.0
CounselorsFull-time 1.0 n/a 12.0 12,433.0Part-time 1.0 n/a 2.0 1,097.0
Total Minority Staff: 15.8 24.6% 27.1% 50.4%
Teachers by Ethnicity and Sex:African American 2.0 4.2% 2.8% 10.6%Hispanic 7.0 14.8% 14.2% 27.7%White 36.2 76.7% 82.1% 58.4%American Indian 1.0 2.1% 0.2% 0.3%Asian 1.0 2.1% 0.2% 1.7%Pacific Islander 0.0 0.0% 0.0% 0.2%Two or More Races 0.0 0.0% 0.5% 1.1%
Males 11.4 24.2% 18.6% 23.8%Females 35.8 75.8% 81.4% 76.2%
Teachers by Highest Degree Held:No Degree 0.0 0.0% 0.5% 1.4%Bachelors 36.2 76.7% 81.7% 73.6%Masters 11.0 23.3% 17.4% 24.3%Doctorate 0.0 0.0% 0.5% 0.7%
Teachers by Years of Experience:Beginning Teachers 3.0 6.4% 8.0% 7.0%1-5 Years Experience 18.0 38.0% 31.7% 28.9%6-10 Years Experience 12.0 25.4% 17.5% 19.0%11-20 Years Experience 6.8 14.5% 24.9% 29.3%Over 20 Years Experience 7.4 15.8% 17.9% 15.7%
Number of Students per Teacher 18.8 n/a 17.2 15.1
18-19 AAR Page 449
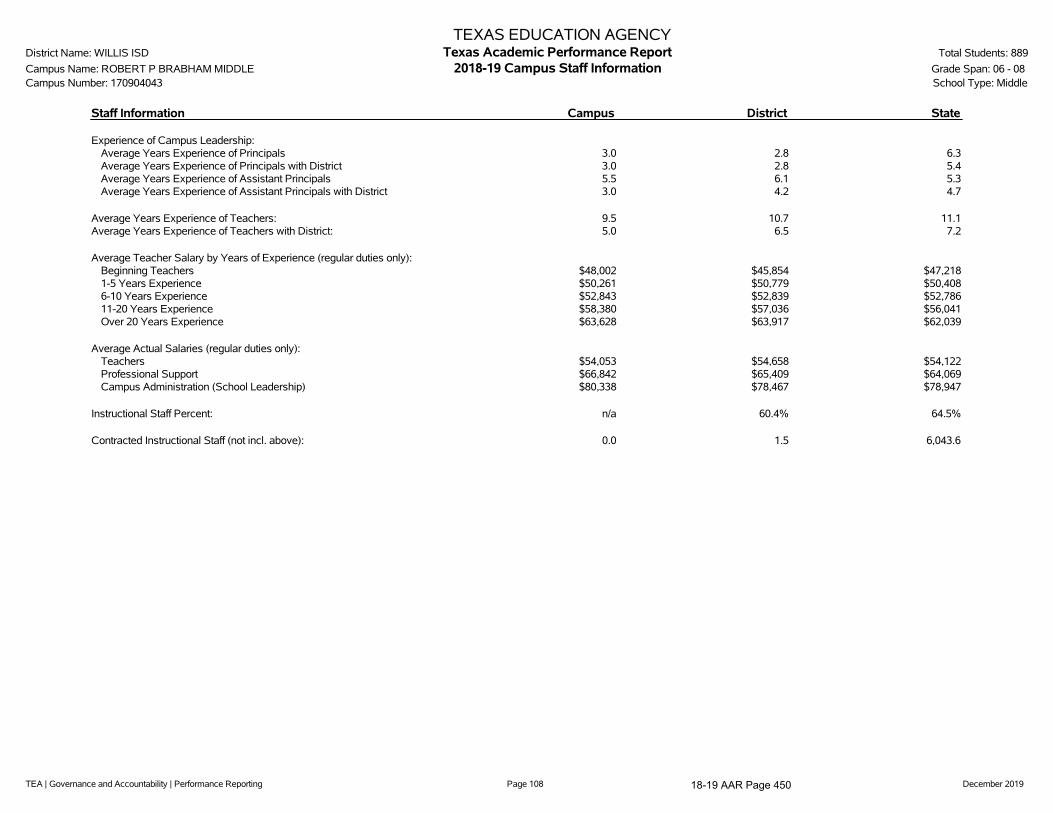
TEA | Governance and Accountability | Performance Reporting Page 108 December 2019
TEXAS EDUCATION AGENCYDistrict Name: WILLIS ISD Texas Academic Performance Report Total Students: 889
Campus Name: ROBERT P BRABHAM MIDDLE 2018-19 Campus Staff Information Grade Span: 06 - 08Campus Number: 170904043 School Type: Middle
Staff Information Campus District State
Experience of Campus Leadership:Average Years Experience of Principals 3.0 2.8 6.3Average Years Experience of Principals with District 3.0 2.8 5.4Average Years Experience of Assistant Principals 5.5 6.1 5.3Average Years Experience of Assistant Principals with District 3.0 4.2 4.7
Average Years Experience of Teachers: 9.5 10.7 11.1Average Years Experience of Teachers with District: 5.0 6.5 7.2
Average Teacher Salary by Years of Experience (regular duties only):Beginning Teachers $48,002 $45,854 $47,2181-5 Years Experience $50,261 $50,779 $50,4086-10 Years Experience $52,843 $52,839 $52,78611-20 Years Experience $58,380 $57,036 $56,041Over 20 Years Experience $63,628 $63,917 $62,039
Average Actual Salaries (regular duties only):Teachers $54,053 $54,658 $54,122Professional Support $66,842 $65,409 $64,069Campus Administration (School Leadership) $80,338 $78,467 $78,947
Instructional Staff Percent: n/a 60.4% 64.5%
Contracted Instructional Staff (not incl. above): 0.0 1.5 6,043.6
18-19 AAR Page 450

TEA | Governance and Accountability | Performance Reporting Page 109 December 2019
TEXAS EDUCATION AGENCYDistrict Name: WILLIS ISD Texas Academic Performance Report Total Students: 889
Campus Name: ROBERT P BRABHAM MIDDLE 2018-19 Campus Staff Information Grade Span: 06 - 08Campus Number: 170904043 School Type: Middle
---------------- Campus ----------------Program Information Count Percent District State
Student Enrollment by Program:Bilingual/ESL Education 63 7.1% 13.6% 19.7%Career & Technical Education 0 0.0% 21.5% 26.3%Gifted & Talented Education 110 12.4% 5.4% 8.1%Special Education 74 8.3% 8.4% 9.6%
Teachers by Program (population served):Bilingual/ESL Education 0.4 0.8% 2.8% 6.4%Career & Technical Education 0.0 0.0% 4.5% 4.9%Compensatory Education 0.0 0.0% 0.0% 2.7%Gifted & Talented Education 0.0 0.0% 0.0% 2.0%Regular Education 31.5 66.8% 76.9% 71.4%Special Education 7.6 16.1% 8.5% 9.1%Other 7.7 16.3% 7.3% 3.6%
' '̂ Indicates that rates for reading and mathematics are based on the cumulative results from the first and second administrations of STAAR.'*' Indicates results are masked due to small numbers to protect student confidentiality.'**' When only one student disability group is masked, then the second smallest student disability group is masked regardless of size.'***' Due to changes in the evaluation of SAT/ACT results (for 2017-18 the best result was used, rather than the most recent), 2016-17 SAT/ACT results are not
comparable and, where applicable, are not shown.'-' Indicates there are no students in the group.'n/a' Indicates data reporting is not applicable for this group.'?' Indicates that the data for this item were statistically improbable or were reported outside a reasonable range.
Link to: PEIMS Financial Standard Reports 2017-18 Financial Actual Report
18-19 AAR Page 451
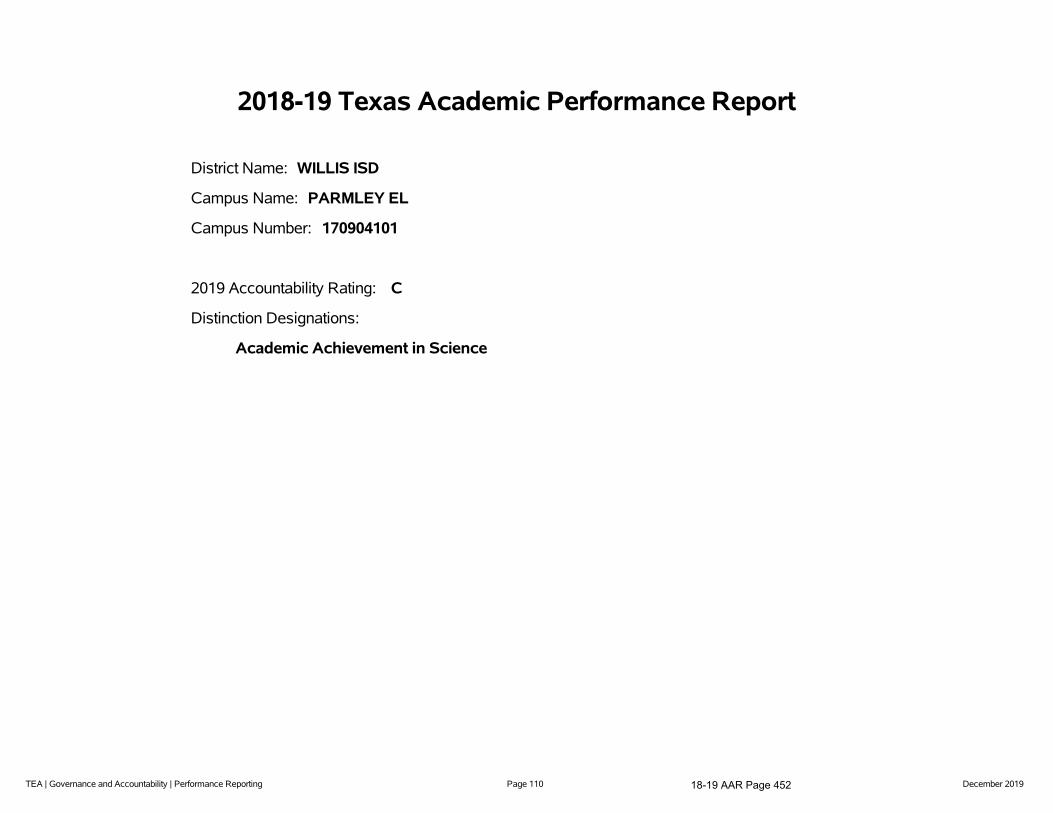
TEA | Governance and Accountability | Performance Reporting Page 110 December 2019
2018-19 Texas Academic Performance Report
District Name: WILLIS ISD
Campus Name: PARMLEY EL
Campus Number: 170904101
2019 Accountability Rating: C
Distinction Designations:
Academic Achievement in Science
18-19 AAR Page 452

TEA | Governance and Accountability | Performance Reporting Page 111 December 2019
This page is intentionally blank.
18-19 AAR Page 453

TEA | Governance and Accountability | Performance Reporting Page 112 December 2019
TEXAS EDUCATION AGENCYDistrict Name: WILLIS ISD Texas Academic Performance Report Total Students: 640
Campus Name: PARMLEY EL 2018-19 Campus STAAR Performance Grade Span: KG - 05Campus Number: 170904101 School Type: Elementary
State District CampusAfrican
American Hispanic WhiteAmerican
Indian AsianPacific
Islander
Two orMoreRaces
SpecialEd
(Current)
SpecialEd
(Former)
Continu-ously
Enrolled
Non-Continu-
ouslyEnrolled
EconDisadv
EL(Current
&Monitored)
STAARPerformance Rates by Tested Grade, Subject, and Performance Level
Grade 3 ReadingAt Approaches Grade Level orAbove 2019 76% 71% 57% 25% 61% 62% - - - * 8% 50% 57% 56% 59% *
2018 77% 77% 70% 69% 63% 73% - * - * 40% * 68% 75% 66% 56%At Meets Grade Level or Above 2019 45% 37% 26% 0% 26% 29% - - - * 0% 0% 28% 20% 27% *
2018 43% 41% 34% 13% 31% 39% - * - * 20% * 33% 34% 26% 22%At Masters Grade Level 2019 27% 24% 11% 0% 13% 11% - - - * 0% 0% 14% 4% 11% *
2018 25% 23% 23% 6% 25% 27% - * - * 0% * 22% 25% 18% 22%Grade 3 Mathematics
At Approaches Grade Level orAbove 2019 79% 80% 67% 38% 65% 71% - - - * 38% 33% 65% 72% 68% *
2018 78% 77% 68% 56% 66% 70% - * - * 36% * 69% 64% 60% 67%At Meets Grade Level or Above 2019 49% 45% 28% 13% 22% 33% - - - * 8% 33% 28% 28% 24% *
2018 47% 45% 36% 19% 31% 40% - * - * 36% * 37% 33% 28% 33%At Masters Grade Level 2019 25% 19% 10% 0% 13% 9% - - - * 0% 0% 12% 4% 13% *
2018 23% 19% 14% 6% 3% 21% - * - * 0% * 15% 12% 5% 11%
Grade 4 ReadingAt Approaches Grade Level orAbove 2019 75% 74% 69% 64% 61% 75% - - - * 20% * 74% 61% 66% 60%
2018 73% 71% 71% 83% 60% 76% * * - * 57% * 69% 75% 66% 67%At Meets Grade Level or Above 2019 44% 41% 37% 7% 26% 51% - - - * 20% * 32% 45% 35% 30%
2018 46% 45% 46% 17% 27% 63% * * - * 57% * 43% 54% 39% 17%At Masters Grade Level 2019 22% 21% 20% 7% 8% 30% - - - * 0% * 15% 27% 15% 0%
2018 24% 24% 20% 0% 17% 24% * * - * 0% * 20% 21% 15% 17%Grade 4 Mathematics
At Approaches Grade Level orAbove 2019 75% 80% 75% 57% 71% 81% - - - * 40% * 82% 64% 69% 70%
2018 78% 83% 86% 83% 87% 85% * * - * 57% * 88% 80% 84% 75%At Meets Grade Level or Above 2019 48% 50% 43% 29% 34% 51% - - - * 30% * 47% 36% 35% 20%
2018 49% 55% 60% 83% 35% 70% * * - * 57% * 58% 64% 55% 42%At Masters Grade Level 2019 28% 30% 27% 7% 29% 30% - - - * 0% * 26% 27% 25% 20%
2018 27% 26% 28% 50% 10% 37% * * - * 29% * 25% 36% 21% 8%Grade 4 Writing
At Approaches Grade Level orAbove 2019 67% 64% 56% 50% 50% 60% - - - * 20% * 54% 59% 53% 40%
2018 63% 64% 54% 83% 39% 59% * * - * 57% * 52% 60% 48% 42%At Meets Grade Level or Above 2019 35% 30% 28% 7% 26% 32% - - - * 20% * 29% 25% 24% 30%
2018 39% 39% 38% 33% 32% 41% * * - * 57% * 34% 48% 35% 8%At Masters Grade Level 2019 11% 9% 10% 7% 11% 11% - - - * 0% * 11% 9% 8% 20%
2018 11% 8% 3% 0% 6% 2% * * - * 0% * 2% 8% 2% 0%
Grade 5 Reading^At Approaches Grade Level orAbove 2019 86% 84% 78% 100% 70% 80% * * - * 50% * 78% 77% 79% 78%
2018 84% 82% 75% 78% 65% 78% * - * - 43% * 77% 73% 74% 38%At Meets Grade Level or Above 2019 54% 50% 46% 60% 30% 54% * * - * 40% * 47% 42% 45% 22%
2018 54% 47% 39% 22% 30% 42% * - * - 29% * 44% 33% 35% 0%
18-19 AAR Page 454
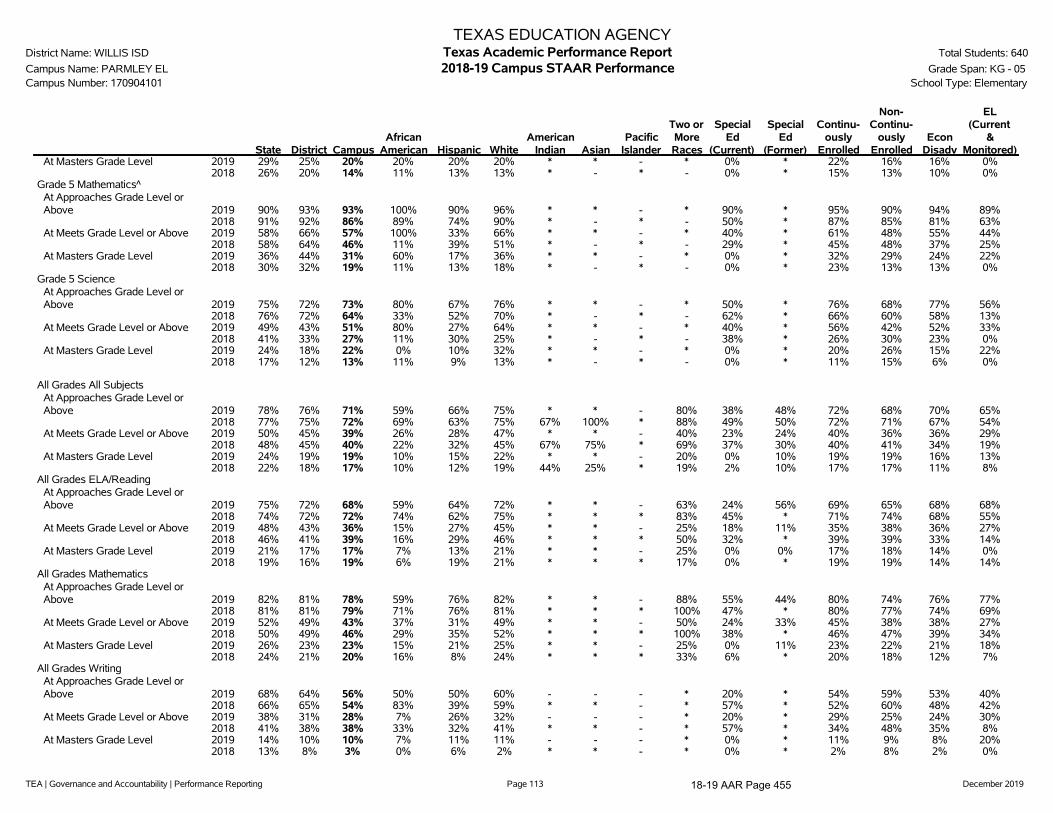
TEA | Governance and Accountability | Performance Reporting Page 113 December 2019
TEXAS EDUCATION AGENCYDistrict Name: WILLIS ISD Texas Academic Performance Report Total Students: 640
Campus Name: PARMLEY EL 2018-19 Campus STAAR Performance Grade Span: KG - 05Campus Number: 170904101 School Type: Elementary
State District CampusAfrican
American Hispanic WhiteAmerican
Indian AsianPacific
Islander
Two orMoreRaces
SpecialEd
(Current)
SpecialEd
(Former)
Continu-ously
Enrolled
Non-Continu-
ouslyEnrolled
EconDisadv
EL(Current
&Monitored)
At Masters Grade Level 2019 29% 25% 20% 20% 20% 20% * * - * 0% * 22% 16% 16% 0%2018 26% 20% 14% 11% 13% 13% * - * - 0% * 15% 13% 10% 0%
Grade 5 Mathematics^At Approaches Grade Level orAbove 2019 90% 93% 93% 100% 90% 96% * * - * 90% * 95% 90% 94% 89%
2018 91% 92% 86% 89% 74% 90% * - * - 50% * 87% 85% 81% 63%At Meets Grade Level or Above 2019 58% 66% 57% 100% 33% 66% * * - * 40% * 61% 48% 55% 44%
2018 58% 64% 46% 11% 39% 51% * - * - 29% * 45% 48% 37% 25%At Masters Grade Level 2019 36% 44% 31% 60% 17% 36% * * - * 0% * 32% 29% 24% 22%
2018 30% 32% 19% 11% 13% 18% * - * - 0% * 23% 13% 13% 0%Grade 5 Science
At Approaches Grade Level orAbove 2019 75% 72% 73% 80% 67% 76% * * - * 50% * 76% 68% 77% 56%
2018 76% 72% 64% 33% 52% 70% * - * - 62% * 66% 60% 58% 13%At Meets Grade Level or Above 2019 49% 43% 51% 80% 27% 64% * * - * 40% * 56% 42% 52% 33%
2018 41% 33% 27% 11% 30% 25% * - * - 38% * 26% 30% 23% 0%At Masters Grade Level 2019 24% 18% 22% 0% 10% 32% * * - * 0% * 20% 26% 15% 22%
2018 17% 12% 13% 11% 9% 13% * - * - 0% * 11% 15% 6% 0%
All Grades All SubjectsAt Approaches Grade Level orAbove 2019 78% 76% 71% 59% 66% 75% * * - 80% 38% 48% 72% 68% 70% 65%
2018 77% 75% 72% 69% 63% 75% 67% 100% * 88% 49% 50% 72% 71% 67% 54%At Meets Grade Level or Above 2019 50% 45% 39% 26% 28% 47% * * - 40% 23% 24% 40% 36% 36% 29%
2018 48% 45% 40% 22% 32% 45% 67% 75% * 69% 37% 30% 40% 41% 34% 19%At Masters Grade Level 2019 24% 19% 19% 10% 15% 22% * * - 20% 0% 10% 19% 19% 16% 13%
2018 22% 18% 17% 10% 12% 19% 44% 25% * 19% 2% 10% 17% 17% 11% 8%All Grades ELA/Reading
At Approaches Grade Level orAbove 2019 75% 72% 68% 59% 64% 72% * * - 63% 24% 56% 69% 65% 68% 68%
2018 74% 72% 72% 74% 62% 75% * * * 83% 45% * 71% 74% 68% 55%At Meets Grade Level or Above 2019 48% 43% 36% 15% 27% 45% * * - 25% 18% 11% 35% 38% 36% 27%
2018 46% 41% 39% 16% 29% 46% * * * 50% 32% * 39% 39% 33% 14%At Masters Grade Level 2019 21% 17% 17% 7% 13% 21% * * - 25% 0% 0% 17% 18% 14% 0%
2018 19% 16% 19% 6% 19% 21% * * * 17% 0% * 19% 19% 14% 14%All Grades Mathematics
At Approaches Grade Level orAbove 2019 82% 81% 78% 59% 76% 82% * * - 88% 55% 44% 80% 74% 76% 77%
2018 81% 81% 79% 71% 76% 81% * * * 100% 47% * 80% 77% 74% 69%At Meets Grade Level or Above 2019 52% 49% 43% 37% 31% 49% * * - 50% 24% 33% 45% 38% 38% 27%
2018 50% 49% 46% 29% 35% 52% * * * 100% 38% * 46% 47% 39% 34%At Masters Grade Level 2019 26% 23% 23% 15% 21% 25% * * - 25% 0% 11% 23% 22% 21% 18%
2018 24% 21% 20% 16% 8% 24% * * * 33% 6% * 20% 18% 12% 7%All Grades Writing
At Approaches Grade Level orAbove 2019 68% 64% 56% 50% 50% 60% - - - * 20% * 54% 59% 53% 40%
2018 66% 65% 54% 83% 39% 59% * * - * 57% * 52% 60% 48% 42%At Meets Grade Level or Above 2019 38% 31% 28% 7% 26% 32% - - - * 20% * 29% 25% 24% 30%
2018 41% 38% 38% 33% 32% 41% * * - * 57% * 34% 48% 35% 8%At Masters Grade Level 2019 14% 10% 10% 7% 11% 11% - - - * 0% * 11% 9% 8% 20%
2018 13% 8% 3% 0% 6% 2% * * - * 0% * 2% 8% 2% 0%
18-19 AAR Page 455
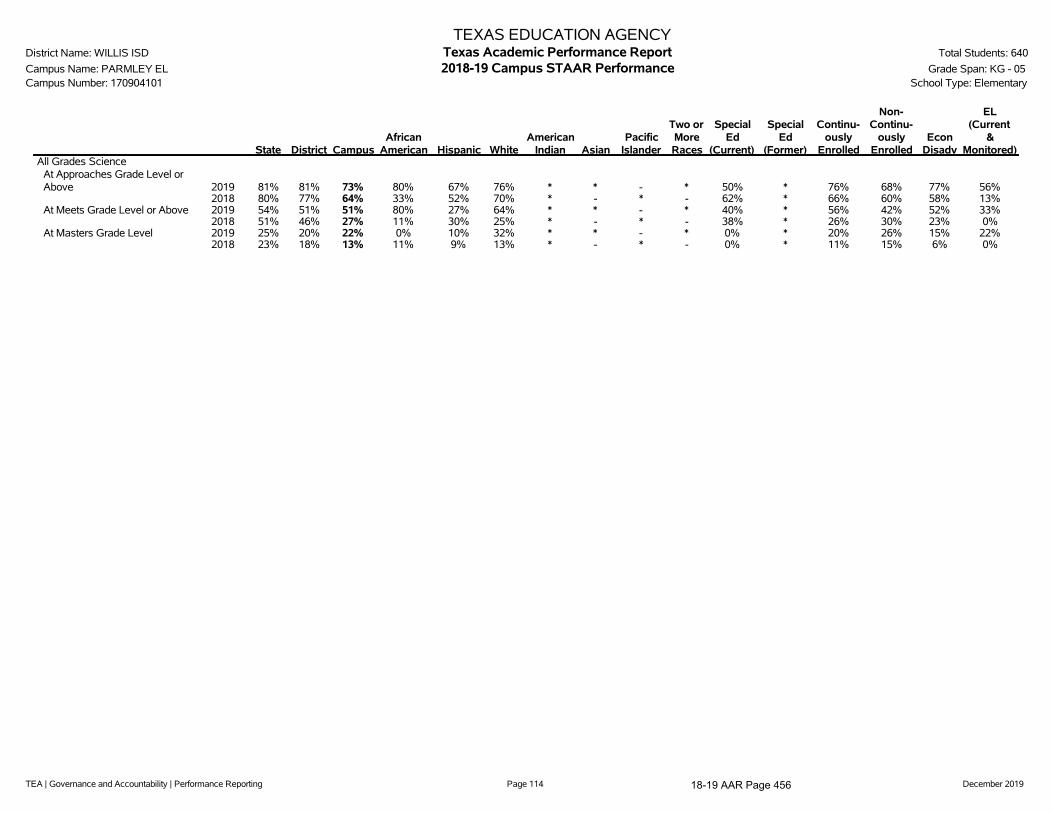
TEA | Governance and Accountability | Performance Reporting Page 114 December 2019
TEXAS EDUCATION AGENCYDistrict Name: WILLIS ISD Texas Academic Performance Report Total Students: 640
Campus Name: PARMLEY EL 2018-19 Campus STAAR Performance Grade Span: KG - 05Campus Number: 170904101 School Type: Elementary
State District CampusAfrican
American Hispanic WhiteAmerican
Indian AsianPacific
Islander
Two orMoreRaces
SpecialEd
(Current)
SpecialEd
(Former)
Continu-ously
Enrolled
Non-Continu-
ouslyEnrolled
EconDisadv
EL(Current
&Monitored)
All Grades ScienceAt Approaches Grade Level orAbove 2019 81% 81% 73% 80% 67% 76% * * - * 50% * 76% 68% 77% 56%
2018 80% 77% 64% 33% 52% 70% * - * - 62% * 66% 60% 58% 13%At Meets Grade Level or Above 2019 54% 51% 51% 80% 27% 64% * * - * 40% * 56% 42% 52% 33%
2018 51% 46% 27% 11% 30% 25% * - * - 38% * 26% 30% 23% 0%At Masters Grade Level 2019 25% 20% 22% 0% 10% 32% * * - * 0% * 20% 26% 15% 22%
2018 23% 18% 13% 11% 9% 13% * - * - 0% * 11% 15% 6% 0%
18-19 AAR Page 456

TEA | Governance and Accountability | Performance Reporting Page 115 December 2019
TEXAS EDUCATION AGENCYDistrict Name: WILLIS ISD Texas Academic Performance Report Total Students: 640
Campus Name: PARMLEY EL 2018-19 Campus Progress Grade Span: KG - 05Campus Number: 170904101 School Type: Elementary
State District CampusAfrican
American Hispanic WhiteAmerican
Indian AsianPacific
Islander
Two orMore
Races
SpecialEd
(Current)
SpecialEd
(Former)
Continu-ously
Enrolled
Non-Continu-
ouslyEnrolled
EconDisadv
EL(Current
&Monitored)
School Progress Domain - Academic Growth Score by Grade and Subject
Grade 4 ELA/Reading 2019 61 59 64 57 58 70 - - - * 70 * 64 64 64 502018 63 67 66 40 55 71 * * - * 100 * 66 67 64 67
Grade 4 Mathematics 2019 65 71 78 71 89 74 - - - * 50 * 79 77 78 802018 65 70 73 80 66 73 * * - * 83 * 73 70 68 71
Grade 5 ELA/Reading 2019 81 80 76 100 84 71 * * - * 100 * 75 78 78 612018 80 79 72 89 65 73 * - * - 73 * 77 64 71 63
Grade 5 Mathematics 2019 83 87 77 80 78 80 * * - * 75 * 69 93 75 782018 81 80 78 94 76 75 * - * - 73 * 75 82 88 94
All Grades Both Subjects 2019 69 66 73 71 77 74 * * - 44 74 42 72 77 73 672018 69 69 72 80 65 73 83 * * 94 79 * 73 71 73 73
All Grades ELA/Reading 2019 68 66 69 68 70 71 * * - * 85 * 69 70 70 552018 69 68 69 71 59 72 * * * * 82 * 71 65 67 65
All Grades Mathematics 2019 70 66 78 74 84 77 * * - * 63 * 74 84 77 792018 70 69 75 89 70 74 * * * * 76 * 74 78 78 80
18-19 AAR Page 457
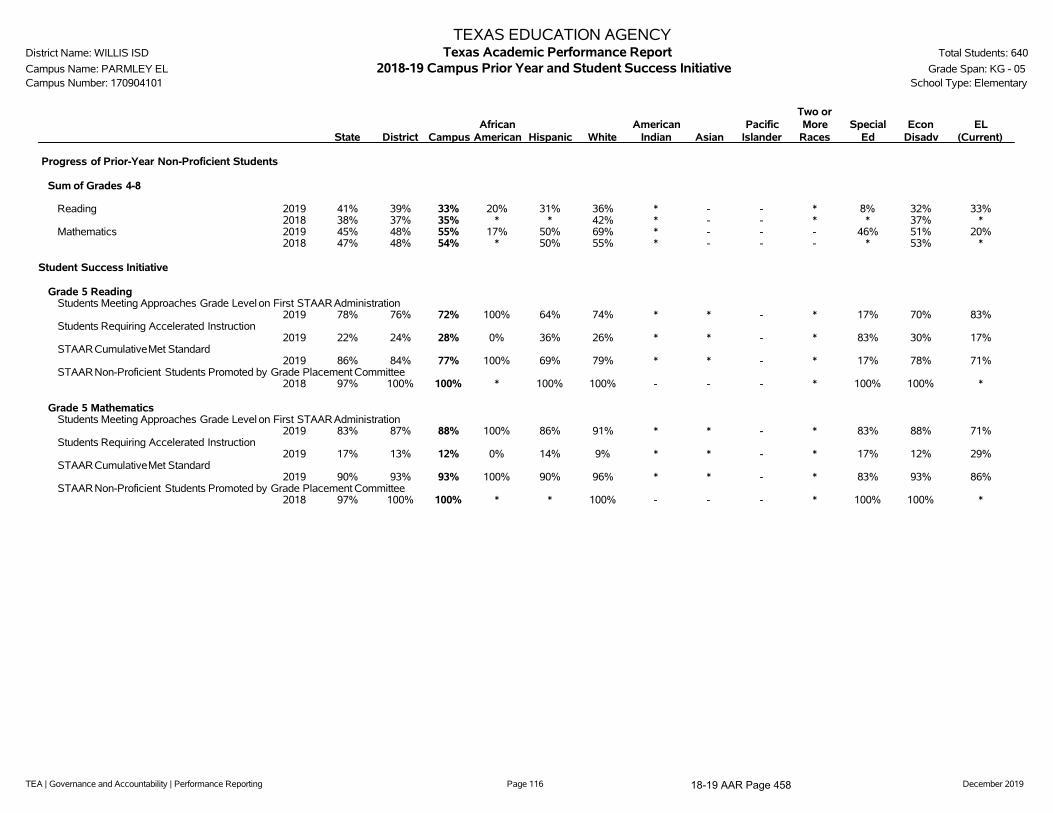
TEA | Governance and Accountability | Performance Reporting Page 116 December 2019
TEXAS EDUCATION AGENCYDistrict Name: WILLIS ISD Texas Academic Performance Report Total Students: 640
Campus Name: PARMLEY EL 2018-19 Campus Prior Year and Student Success Initiative Grade Span: KG - 05Campus Number: 170904101 School Type: Elementary
State District CampusAfrican
American Hispanic WhiteAmerican
Indian AsianPacific
Islander
Two orMore
RacesSpecial
EdEcon
DisadvEL
(Current)
Progress of Prior-Year Non-Proficient Students
Sum of Grades 4-8
Reading 2019 41% 39% 33% 20% 31% 36% * - - * 8% 32% 33%2018 38% 37% 35% * * 42% * - - * * 37% *
Mathematics 2019 45% 48% 55% 17% 50% 69% * - - - 46% 51% 20%2018 47% 48% 54% * 50% 55% * - - - * 53% *
Student Success Initiative
Grade 5 ReadingStudents Meeting Approaches Grade Level on First STAARAdministration
2019 78% 76% 72% 100% 64% 74% * * - * 17% 70% 83%Students Requiring Accelerated Instruction
2019 22% 24% 28% 0% 36% 26% * * - * 83% 30% 17%STAARCumulativeMet Standard
2019 86% 84% 77% 100% 69% 79% * * - * 17% 78% 71%STAARNon-Proficient Students Promoted by Grade Placement Committee
2018 97% 100% 100% * 100% 100% - - - * 100% 100% *
Grade 5 MathematicsStudents Meeting Approaches Grade Level on First STAARAdministration
2019 83% 87% 88% 100% 86% 91% * * - * 83% 88% 71%Students Requiring Accelerated Instruction
2019 17% 13% 12% 0% 14% 9% * * - * 17% 12% 29%STAARCumulativeMet Standard
2019 90% 93% 93% 100% 90% 96% * * - * 83% 93% 86%STAARNon-Proficient Students Promoted by Grade Placement Committee
2018 97% 100% 100% * * 100% - - - * 100% 100% *
18-19 AAR Page 458

TEA | Governance and Accountability | Performance Reporting Page 117 December 2019
TEXAS EDUCATION AGENCYDistrict Name: WILLIS ISD Texas Academic Performance Report Total Students: 640
Campus Name: PARMLEY EL 2018-19 Campus STAAR Performance Grade Span: KG - 05Campus Number: 170904101 Bilingual Education/English as a Second Language (Current EL Students)
State District CampusBilingual
EducationBE-TransEarly Exit
BE-TransLate Exit
BE-DualTwo-Way
BE-DualOne-Way ESL
ESLContent
ESLPull-Out
LEP NoServices
LEP withServices
TotalEL
STAARPerformance Rate by Subject and Performance LevelAll Grades All Subjects
At Approaches Grade Level or Above 2019 78% 76% 71% - - - - - 50% - 50% 64% 50% 54%2018 77% 75% 72% - - - - - 49% 49% - 60% 49% 52%
At Meets Grade Level or Above 2019 50% 45% 39% - - - - - 9% - 9% 21% 9% 13%2018 48% 45% 40% - - - - - 24% 24% - 10% 24% 20%
At Masters Grade Level 2019 24% 19% 19% - - - - - 6% - 6% 0% 6% 4%2018 22% 18% 17% - - - - - 12% 12% - 0% 12% 9%
All Grades ELA/ReadingAt Approaches Grade Level or Above 2019 75% 72% 68% - - - - - 50% - 50% 80% 50% 59%
2018 74% 72% 72% - - - - - 47% 47% - 71% 47% 54%At Meets Grade Level or Above 2019 48% 43% 36% - - - - - 0% - 0% 40% 0% 12%
2018 46% 41% 39% - - - - - 21% 21% - 0% 21% 15%At Masters Grade Level 2019 21% 17% 17% - - - - - 0% - 0% 0% 0% 0%
2018 19% 16% 19% - - - - - 21% 21% - 0% 21% 15%All Grades Mathematics
At Approaches Grade Level or Above 2019 82% 81% 78% - - - - - 67% - 67% 80% 67% 71%2018 81% 81% 79% - - - - - 68% 68% - 71% 68% 69%
At Meets Grade Level or Above 2019 52% 49% 43% - - - - - 17% - 17% 0% 17% 12%2018 50% 49% 46% - - - - - 37% 37% - 29% 37% 35%
At Masters Grade Level 2019 26% 23% 23% - - - - - 8% - 8% 0% 8% 6%2018 24% 21% 20% - - - - - 11% 11% - 0% 11% 8%
All Grades WritingAt Approaches Grade Level or Above 2019 68% 64% 56% - - - - - 0% - 0% * 0% 14%
2018 66% 65% 54% - - - - - 33% 33% - 40% 33% 36%At Meets Grade Level or Above 2019 38% 31% 28% - - - - - 0% - 0% * 0% 14%
2018 41% 38% 38% - - - - - 17% 17% - 0% 17% 9%At Masters Grade Level 2019 14% 10% 10% - - - - - 0% - 0% * 0% 0%
2018 13% 8% 3% - - - - - 0% 0% - 0% 0% 0%All Grades Science
At Approaches Grade Level or Above 2019 81% 81% 73% - - - - - * - * * * 43%2018 80% 77% 64% - - - - - 0% 0% - * 0% 0%
At Meets Grade Level or Above 2019 54% 51% 51% - - - - - * - * * * 14%2018 51% 46% 27% - - - - - 0% 0% - * 0% 0%
At Masters Grade Level 2019 25% 20% 22% - - - - - * - * * * 14%2018 23% 18% 13% - - - - - 0% 0% - * 0% 0%
School Progress Domain - Academic Growth ScoreAll Grades Both Subjects 2019 69% 66% 73% - - - - - 70% - 70% 81% 70% 73%
2018 69% 69% 72% - - - - - 80% 80% - 71% 80% 76%All Grades ELA/Reading 2019 68% 66% 69% - - - - - 60% - 60% * 60% 71%
2018 69% 68% 69% - - - - - 73% 73% - 67% 73% 71%All Grades Mathematics 2019 70% 66% 78% - - - - - 80% - 80% * 80% 75%
2018 70% 69% 75% - - - - - 86% 86% - 75% 86% 82%
Progress of Prior Year STAAR Non-Proficient Students (Percent of Non-Proficient Passing STAAR)Reading 2019 41% 39% 33% - - - - - 29% - 29% * 29% 33%
2018 38% 37% 35% - - - - - * * - * * *Mathematics 2019 45% 48% 55% - - - - - * - * * * 20%
2018 47% 48% 54% - - - - - * * - * * *
18-19 AAR Page 459

TEA | Governance and Accountability | Performance Reporting Page 118 December 2019
TEXAS EDUCATION AGENCYDistrict Name: WILLIS ISD Texas Academic Performance Report Total Students: 640
Campus Name: PARMLEY EL 2018-19 Campus STAAR Participation Grade Span: KG - 05Campus Number: 170904101 School Type: Elementary
State District CampusAfrican
American Hispanic WhiteAmerican
Indian AsianPacific
Islander
Two orMore
RacesSpecial
EdEcon
DisadvEL
(Current)2019 STAARParticipation
(All Grades)
All TestsAssessment Participant 99% 100% 100% 100% 100% 100% 100% * - 100% 100% 100% 100%
Included in Accountability 94% 94% 90% 97% 88% 91% 27% * - 91% 92% 88% 91%Not Included in Accountability
Mobile 4% 5% 10% 3% 11% 9% 73% * - 9% 4% 11% 9%Other Exclusions 1% 1% 0% 0% 1% 0% 0% * - 0% 3% 0% 0%
Not Tested 1% 0% 0% 0% 0% 0% 0% * - 0% 0% 0% 0%Absent 1% 0% 0% 0% 0% 0% 0% * - 0% 0% 0% 0%Other 0% 0% 0% 0% 0% 0% 0% * - 0% 0% 0% 0%
2018 STAARParticipation(All Grades)
All TestsAssessment Participant 99% 100% 100% 100% 100% 100% 100% 100% * 100% 100% 100% 100%
Included in Accountability 94% 93% 90% 97% 93% 88% 100% 100% * 67% 77% 90% 99%Not Included in Accountability
Mobile 4% 6% 10% 3% 7% 12% 0% 0% * 33% 20% 9% 1%Other Exclusions 1% 0% 0% 0% 0% 1% 0% 0% * 0% 3% 1% 0%
Not Tested 1% 0% 0% 0% 0% 0% 0% 0% * 0% 0% 0% 0%Absent 1% 0% 0% 0% 0% 0% 0% 0% * 0% 0% 0% 0%Other 0% 0% 0% 0% 0% 0% 0% 0% * 0% 0% 0% 0%
18-19 AAR Page 460
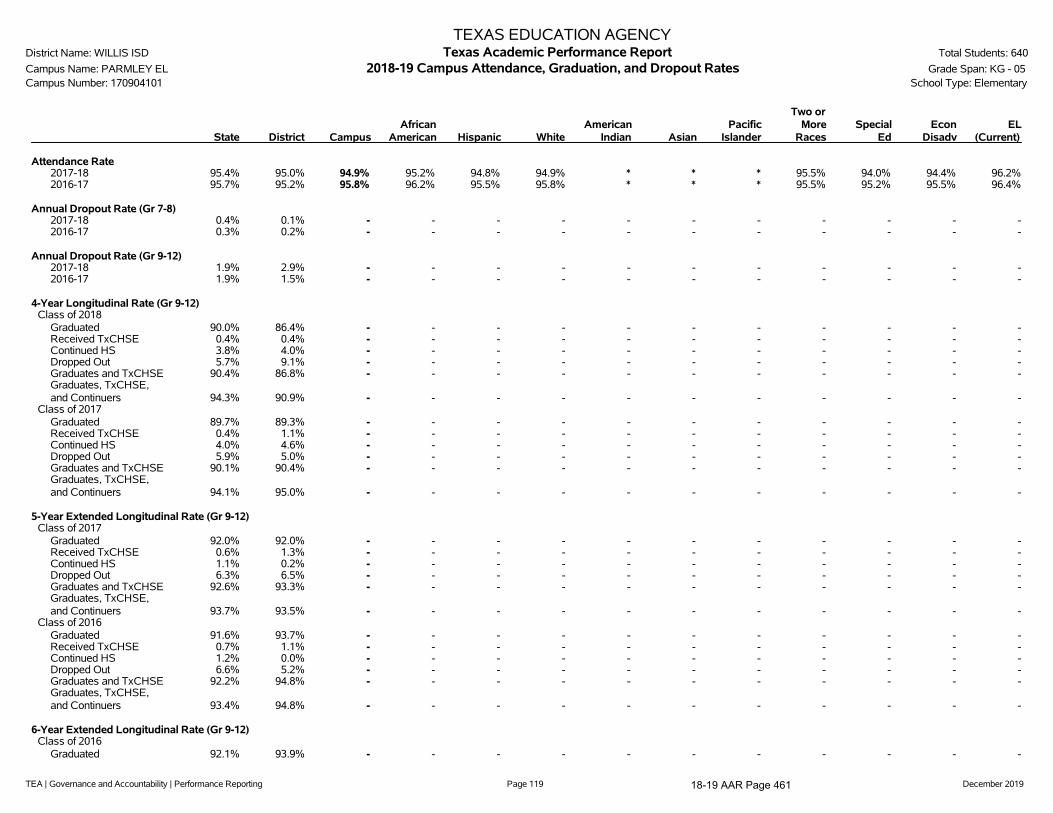
TEA | Governance and Accountability | Performance Reporting Page 119 December 2019
TEXAS EDUCATION AGENCYDistrict Name: WILLIS ISD Texas Academic Performance Report Total Students: 640
Campus Name: PARMLEY EL 2018-19 Campus Attendance, Graduation, and Dropout Rates Grade Span: KG - 05Campus Number: 170904101 School Type: Elementary
State District CampusAfrican
American Hispanic WhiteAmerican
Indian AsianPacific
Islander
Two orMore
RacesSpecial
EdEcon
DisadvEL
(Current)
Attendance Rate2017-18 95.4% 95.0% 94.9% 95.2% 94.8% 94.9% * * * 95.5% 94.0% 94.4% 96.2%2016-17 95.7% 95.2% 95.8% 96.2% 95.5% 95.8% * * * 95.5% 95.2% 95.5% 96.4%
Annual Dropout Rate (Gr 7-8)2017-18 0.4% 0.1% - - - - - - - - - - -2016-17 0.3% 0.2% - - - - - - - - - - -
Annual Dropout Rate (Gr 9-12)2017-18 1.9% 2.9% - - - - - - - - - - -2016-17 1.9% 1.5% - - - - - - - - - - -
4-Year Longitudinal Rate (Gr 9-12)Class of 2018
Graduated 90.0% 86.4% - - - - - - - - - - -Received TxCHSE 0.4% 0.4% - - - - - - - - - - -Continued HS 3.8% 4.0% - - - - - - - - - - -Dropped Out 5.7% 9.1% - - - - - - - - - - -Graduates and TxCHSE 90.4% 86.8% - - - - - - - - - - -Graduates, TxCHSE,and Continuers 94.3% 90.9% - - - - - - - - - - -
Class of 2017Graduated 89.7% 89.3% - - - - - - - - - - -Received TxCHSE 0.4% 1.1% - - - - - - - - - - -Continued HS 4.0% 4.6% - - - - - - - - - - -Dropped Out 5.9% 5.0% - - - - - - - - - - -Graduates and TxCHSE 90.1% 90.4% - - - - - - - - - - -Graduates, TxCHSE,and Continuers 94.1% 95.0% - - - - - - - - - - -
5-Year Extended Longitudinal Rate (Gr 9-12)Class of 2017
Graduated 92.0% 92.0% - - - - - - - - - - -Received TxCHSE 0.6% 1.3% - - - - - - - - - - -Continued HS 1.1% 0.2% - - - - - - - - - - -Dropped Out 6.3% 6.5% - - - - - - - - - - -Graduates and TxCHSE 92.6% 93.3% - - - - - - - - - - -Graduates, TxCHSE,and Continuers 93.7% 93.5% - - - - - - - - - - -
Class of 2016Graduated 91.6% 93.7% - - - - - - - - - - -Received TxCHSE 0.7% 1.1% - - - - - - - - - - -Continued HS 1.2% 0.0% - - - - - - - - - - -Dropped Out 6.6% 5.2% - - - - - - - - - - -Graduates and TxCHSE 92.2% 94.8% - - - - - - - - - - -Graduates, TxCHSE,and Continuers 93.4% 94.8% - - - - - - - - - - -
6-Year Extended Longitudinal Rate (Gr 9-12)Class of 2016
Graduated 92.1% 93.9% - - - - - - - - - - -
18-19 AAR Page 461

TEA | Governance and Accountability | Performance Reporting Page 120 December 2019
TEXAS EDUCATION AGENCYDistrict Name: WILLIS ISD Texas Academic Performance Report Total Students: 640
Campus Name: PARMLEY EL 2018-19 Campus Attendance, Graduation, and Dropout Rates Grade Span: KG - 05Campus Number: 170904101 School Type: Elementary
State District CampusAfrican
American Hispanic WhiteAmerican
Indian AsianPacific
Islander
Two orMore
RacesSpecial
EdEcon
DisadvEL
(Current)Received TxCHSE 0.8% 1.1% - - - - - - - - - - -Continued HS 0.5% 0.0% - - - - - - - - - - -Dropped Out 6.6% 5.0% - - - - - - - - - - -Graduates and TxCHSE 92.9% 95.0% - - - - - - - - - - -Graduates, TxCHSE,and Continuers 93.4% 95.0% - - - - - - - - - - -
Class of 2015Graduated 91.8% 93.3% - - - - - - - - - - -Received TxCHSE 1.0% 1.4% - - - - - - - - - - -Continued HS 0.6% 0.2% - - - - - - - - - - -Dropped Out 6.7% 5.0% - - - - - - - - - - -Graduates and TxCHSE 92.8% 94.7% - - - - - - - - - - -Graduates, TxCHSE,and Continuers 93.3% 95.0% - - - - - - - - - - -
4-Year Federal Graduation Rate Without Exclusions (Gr 9-12)Class of 2018 90.0% 85.5% - - - - - - - - - - -Class of 2017 89.7% 88.6% - - - - - - - - - - -
RHSP/DAP Graduates (Longitudinal Rate)Class of 2018 68.5% * - - - - - - - - - - -Class of 2017 88.5% 89.1% - - - - - - - - - - -
FHSP-E Graduates (Longitudinal Rate)Class of 2018 5.0% 2.0% - - - - - - - - - - -Class of 2017 6.0% 0.0% - - - - - - - - - - -
FHSP-DLA Graduates (Longitudinal Rate)Class of 2018 82.0% 87.4% - - - - - - - - - - -Class of 2017 60.8% 14.3% - - - - - - - - - - -
RHSP/DAP/FHSP-E/FHSP-DLA Graduates (Longitudinal Rate)Class of 2018 86.8% 89.2% - - - - - - - - - - -Class of 2017 85.9% 87.8% - - - - - - - - - - -
RHSP/DAP Graduates (Annual Rate)2017-18 37.7% 37.5% - - - - - - - - - - -2016-17 87.2% 87.0% - - - - - - - - - - -
FHSP-E Graduates (Annual Rate)2017-18 4.9% 1.7% - - - - - - - - - - -2016-17 7.2% 11.1% - - - - - - - - - - -
FHSP-DLA Graduates (Annual Rate)2017-18 81.5% 87.2% - - - - - - - - - - -2016-17 56.5% 22.2% - - - - - - - - - - -
RHSP/DAP/FHSP-E/FHSP-DLA Graduates (Annual Rate)2017-18 85.1% 87.9% - - - - - - - - - - -2016-17 84.0% 85.9% - - - - - - - - - - -
18-19 AAR Page 462

TEA | Governance and Accountability | Performance Reporting Page 121 December 2019
TEXAS EDUCATION AGENCYDistrict Name: WILLIS ISD Texas Academic Performance Report Total Students: 640
Campus Name: PARMLEY EL 2018-19 Campus Graduation Profile Grade Span: KG - 05Campus Number: 170904101 School Type: Elementary
CampusCount
CampusPercent
DistrictCount
StateCount
Graduates (2017-18 Annual Graduates)Total Graduates - - 422 347,893
By Ethnicity:African American - - 31 43,502Hispanic - - 128 173,272White - - 247 107,052American Indian - - 3 1,226Asian - - 2 15,589Pacific Islander - - 2 528Two or More Races - - 9 6,724
By Graduation Type:Minimum H.S. Program - - 5 5,855Recommended H.S. Program/Distinguished Achievement Program - - 3 3,538Foundation H.S. Program (No Endorsement) - - 46 49,432Foundation H.S. Program (Endorsement) - - 7 16,542Foundation H.S. Program (DLA) - - 361 272,526
Special Education Graduates - - 27 25,962Economically Disadvantaged Graduates - - 181 166,956LEP Graduates - - 16 21,359At-Risk Graduates - - 137 144,805
18-19 AAR Page 463

TEA | Governance and Accountability | Performance Reporting Page 122 December 2019
TEXAS EDUCATION AGENCYDistrict Name: WILLIS ISD Texas Academic Performance Report Total Students: 640
Campus Name: PARMLEY EL 2018-19 Campus College, Career, and Military Readiness (CCMR) Grade Span: KG - 05Campus Number: 170904101 School Type: Elementary
State District CampusAfrican
American Hispanic WhiteAmerican
Indian AsianPacific
Islander
Two orMore
RacesSpecial
EdEcon
DisadvEL
(Current)College, Career, and Military Ready Graduates (Student Achievement) ***
College, Career, or Military Ready (Annual Graduates)2017-18 65.5% 64.0% - - - - - - - - - - -
College Ready Graduates ***College Ready (Annual Graduates)
2017-18 50.0% 34.4% - - - - - - - - - - -
TSI Criteria Graduates (Annual Graduates)English Language Arts
2017-18 58.2% 51.2% - - - - - - - - - - -Mathematics
2017-18 46.0% 29.9% - - - - - - - - - - -Both Subjects
2017-18 42.1% 28.4% - - - - - - - - - - -
Dual Course Credits (Annual Graduates)Any Subject
2017-18 20.7% 17.3% - - - - - - - - - - -2016-17 19.9% 21.6% - - - - - - - - - - -
AP/IB Met Criteria in Any Subject (Annual Graduates)Any Subject
2017-18 20.4% 9.5% - - - - - - - - - - -2016-17 20.1% 4.9% - - - - - - - - - - -
Associate's DegreeAssociate's Degree (Annual Graduates)
2017-18 1.4% 0.2% - - - - - - - - - - -2016-17 0.8% 0.0% - - - - - - - - - - -
OnRampsCourse Credits (Annual Graduates)2017-18 1.0% 0.0% - - - - - - - - - - -
Career/Military Ready GraduatesCareer or Military Ready (Annual Graduates)
2017-18 28.7% 41.6% - - - - - - - - - - -2016-17 13.2% 13.1% - - - - - - - - - - -
Approved Industry-Based Certification (Annual Graduates)2017-18 4.8% 9.0% - - - - - - - - - - -2016-17 2.7% 3.8% - - - - - - - - - - -
Graduate with Completed IEP and Workforce Readiness (Annual Graduates)2017-18 1.7% 6.2% - - - - - - - - - - -2016-17 1.0% 0.0% - - - - - - - - - - -
CTE Coherent Sequence Coursework Aligned with Industry-Based Certifications (Annual Graduates)2017-18 38.7% 58.8% - - - - - - - - - - -2016-17 17.3% 14.6% - - - - - - - - - - -
18-19 AAR Page 464
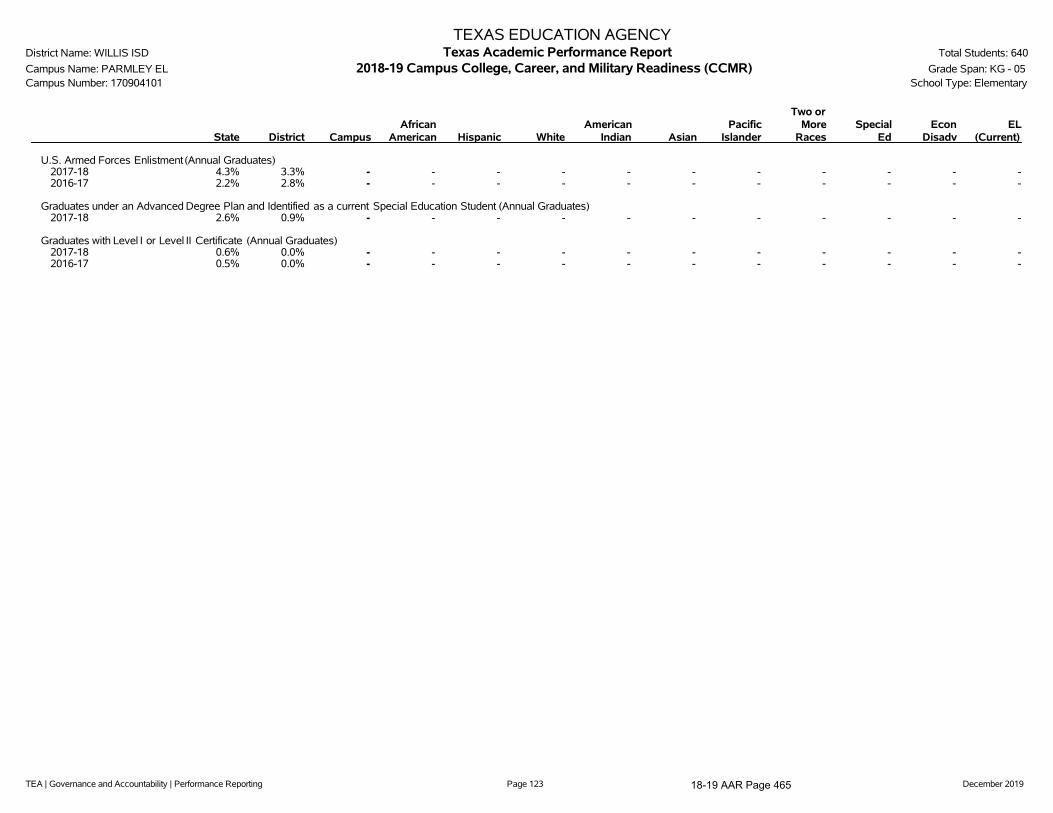
TEA | Governance and Accountability | Performance Reporting Page 123 December 2019
TEXAS EDUCATION AGENCYDistrict Name: WILLIS ISD Texas Academic Performance Report Total Students: 640
Campus Name: PARMLEY EL 2018-19 Campus College, Career, and Military Readiness (CCMR) Grade Span: KG - 05Campus Number: 170904101 School Type: Elementary
State District CampusAfrican
American Hispanic WhiteAmerican
Indian AsianPacific
Islander
Two orMore
RacesSpecial
EdEcon
DisadvEL
(Current)
U.S. Armed Forces Enlistment (Annual Graduates)2017-18 4.3% 3.3% - - - - - - - - - - -2016-17 2.2% 2.8% - - - - - - - - - - -
Graduates under an Advanced Degree Plan and Identified as a current Special Education Student (Annual Graduates)2017-18 2.6% 0.9% - - - - - - - - - - -
Graduates with Level I or Level II Certificate (Annual Graduates)2017-18 0.6% 0.0% - - - - - - - - - - -2016-17 0.5% 0.0% - - - - - - - - - - -
18-19 AAR Page 465
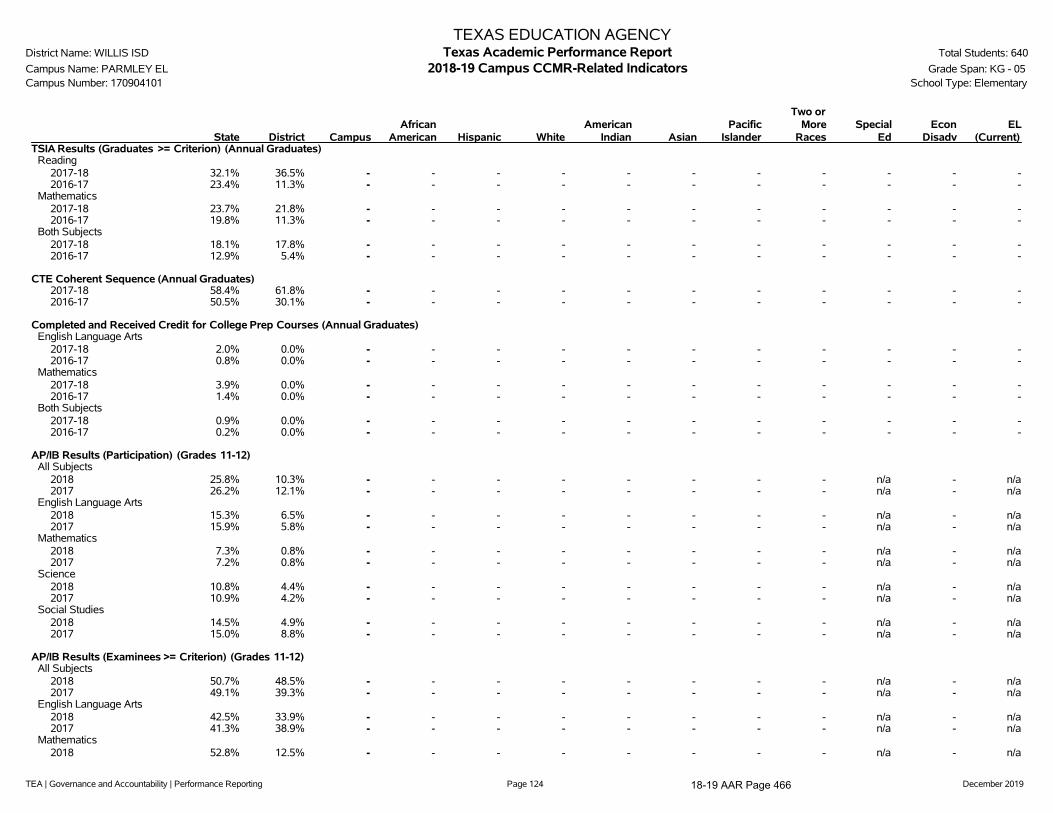
TEA | Governance and Accountability | Performance Reporting Page 124 December 2019
TEXAS EDUCATION AGENCYDistrict Name: WILLIS ISD Texas Academic Performance Report Total Students: 640
Campus Name: PARMLEY EL 2018-19 Campus CCMR-Related Indicators Grade Span: KG - 05Campus Number: 170904101 School Type: Elementary
State District CampusAfrican
American Hispanic WhiteAmerican
Indian AsianPacific
Islander
Two orMore
RacesSpecial
EdEcon
DisadvEL
(Current)TSIA Results (Graduates >= Criterion) (Annual Graduates)
Reading2017-18 32.1% 36.5% - - - - - - - - - - -2016-17 23.4% 11.3% - - - - - - - - - - -
Mathematics2017-18 23.7% 21.8% - - - - - - - - - - -2016-17 19.8% 11.3% - - - - - - - - - - -
Both Subjects2017-18 18.1% 17.8% - - - - - - - - - - -2016-17 12.9% 5.4% - - - - - - - - - - -
CTE Coherent Sequence (Annual Graduates)2017-18 58.4% 61.8% - - - - - - - - - - -2016-17 50.5% 30.1% - - - - - - - - - - -
Completed and Received Credit for College Prep Courses (Annual Graduates)English Language Arts
2017-18 2.0% 0.0% - - - - - - - - - - -2016-17 0.8% 0.0% - - - - - - - - - - -
Mathematics2017-18 3.9% 0.0% - - - - - - - - - - -2016-17 1.4% 0.0% - - - - - - - - - - -
Both Subjects2017-18 0.9% 0.0% - - - - - - - - - - -2016-17 0.2% 0.0% - - - - - - - - - - -
AP/IB Results (Participation) (Grades 11-12)All Subjects
2018 25.8% 10.3% - - - - - - - - n/a - n/a2017 26.2% 12.1% - - - - - - - - n/a - n/a
English Language Arts2018 15.3% 6.5% - - - - - - - - n/a - n/a2017 15.9% 5.8% - - - - - - - - n/a - n/a
Mathematics2018 7.3% 0.8% - - - - - - - - n/a - n/a2017 7.2% 0.8% - - - - - - - - n/a - n/a
Science2018 10.8% 4.4% - - - - - - - - n/a - n/a2017 10.9% 4.2% - - - - - - - - n/a - n/a
Social Studies2018 14.5% 4.9% - - - - - - - - n/a - n/a2017 15.0% 8.8% - - - - - - - - n/a - n/a
AP/IB Results (Examinees >= Criterion) (Grades 11-12)All Subjects
2018 50.7% 48.5% - - - - - - - - n/a - n/a2017 49.1% 39.3% - - - - - - - - n/a - n/a
English Language Arts2018 42.5% 33.9% - - - - - - - - n/a - n/a2017 41.3% 38.9% - - - - - - - - n/a - n/a
Mathematics2018 52.8% 12.5% - - - - - - - - n/a - n/a
18-19 AAR Page 466

TEA | Governance and Accountability | Performance Reporting Page 125 December 2019
TEXAS EDUCATION AGENCYDistrict Name: WILLIS ISD Texas Academic Performance Report Total Students: 640
Campus Name: PARMLEY EL 2018-19 Campus CCMR-Related Indicators Grade Span: KG - 05Campus Number: 170904101 School Type: Elementary
State District CampusAfrican
American Hispanic WhiteAmerican
Indian AsianPacific
Islander
Two orMore
RacesSpecial
EdEcon
DisadvEL
(Current)2017 51.3% 14.3% - - - - - - - - n/a - n/a
Science2018 38.0% 21.4% - - - - - - - - n/a - n/a2017 38.3% 15.4% - - - - - - - - n/a - n/a
Social Studies2018 44.6% 51.1% - - - - - - - - n/a - n/a2017 41.4% 37.8% - - - - - - - - n/a - n/a
SAT/ACT Results (Annual Graduates) ***Tested
2017-18 74.6% 51.7% - - - - - - - - n/a - n/a2016-17 73.5% 53.6% - - - - - - - - n/a - n/a
At/Above Criterion2017-18 37.9% 33.0% - - - - - - - - n/a - n/a
Average SAT Score (Annual Graduates) ***All Subjects
2017-18 1036 1028 - - - - - - - - n/a - n/aEnglish Language Artsand Writing
2017-18 521 527 - - - - - - - - n/a - n/aMathematics
2017-18 515 500 - - - - - - - - n/a - n/a
Average ACT Score (Annual Graduates) ***All Subjects
2017-18 20.6 20.0 - - - - - - - - n/a - n/aEnglish Language Arts
2017-18 20.3 19.6 - - - - - - - - n/a - n/aMathematics
2017-18 20.6 19.4 - - - - - - - - n/a - n/aScience
2017-18 20.9 20.8 - - - - - - - - n/a - n/a
18-19 AAR Page 467

TEA | Governance and Accountability | Performance Reporting Page 126 December 2019
TEXAS EDUCATION AGENCYDistrict Name: WILLIS ISD Texas Academic Performance Report Total Students: 640
Campus Name: PARMLEY EL 2018-19 Campus Other Postsecondary Indicators Grade Span: KG - 05Campus Number: 170904101 School Type: Elementary
State District CampusAfrican
American Hispanic WhiteAmerican
Indian AsianPacific
Islander
Two orMore
RacesSpecial
EdEcon
DisadvEL
(Current)Advanced Dual-Credit Course Completion (Grades 9-12)
Any Subject2017-18 43.4% 32.6% - - - - - - - - - - -2016-17 37.1% 19.8% - - - - - - - - - - -
English Language Arts2017-18 17.3% 13.8% - - - - - - - - - - -2016-17 16.8% 13.1% - - - - - - - - - - -
Mathematics2017-18 20.7% 13.2% - - - - - - - - - - -2016-17 19.5% 12.1% - - - - - - - - - - -
Science2017-18 21.2% 19.7% - - - - - - - - - - -2016-17 5.7% 5.4% - - - - - - - - - - -
Social Studies2017-18 22.8% 11.7% - - - - - - - - - - -2016-17 21.8% 10.8% - - - - - - - - - - -
Graduates Enrolled in Texas Institution of Higher Education (TX IHE)2016-17 54.6% 48.0% - - - - - - - - - - -2015-16 54.7% 49.1% - - - - - - - - - - -
Graduates in TX IHE Completing One Year Without Enrollment in a Developmental Education Course2016-17 59.2% 54.6% - - - - - - - - - - -2015-16 55.7% 55.5% - - - - - - - - - - -
18-19 AAR Page 468

TEA | Governance and Accountability | Performance Reporting Page 127 December 2019
TEXAS EDUCATION AGENCYDistrict Name: WILLIS ISD Texas Academic Performance Report Total Students: 640
Campus Name: PARMLEY EL 2018-19 Campus Student Information Grade Span: KG - 05Campus Number: 170904101 School Type: Elementary
---------------- Campus ----------------Student Information Count Percent District State
Total Students 640 100.0% 7,469 5,416,400
Students by Grade:Early Childhood Education 0 0.0% 0.8% 0.3%Pre-Kindergarten 0 0.0% 2.3% 4.4%Kindergarten 98 15.3% 6.5% 6.9%Grade 1 102 15.9% 7.6% 7.1%Grade 2 118 18.4% 7.6% 7.2%Grade 3 101 15.8% 7.9% 7.3%Grade 4 124 19.4% 8.4% 7.6%Grade 5 97 15.2% 7.8% 7.7%Grade 6 0 0.0% 7.6% 7.7%Grade 7 0 0.0% 7.8% 7.5%Grade 8 0 0.0% 7.4% 7.5%Grade 9 0 0.0% 9.6% 8.1%Grade 10 0 0.0% 6.3% 7.4%Grade 11 0 0.0% 6.3% 6.9%Grade 12 0 0.0% 6.0% 6.5%
Ethnic Distribution:African American 52 8.1% 6.9% 12.6%Hispanic 199 31.1% 37.0% 52.6%White 356 55.6% 51.9% 27.4%American Indian 4 0.6% 0.4% 0.4%Asian 3 0.5% 0.6% 4.5%Pacific Islander 1 0.2% 0.1% 0.2%Two or More Races 25 3.9% 3.1% 2.4%
Economically Disadvantaged 452 70.6% 60.1% 60.6%Non-Educationally Disadvantaged 188 29.4% 39.9% 39.4%Section 504 Students 47 7.3% 6.1% 6.5%English Learners (EL) 33 5.2% 14.4% 19.5%Students w/ Disciplinary Placements (2017-18) 1 0.1% 1.8% 1.4%Students w/ Dyslexia 20 3.1% 2.6% 3.6%At-Risk 305 47.7% 50.8% 50.1%
Students with Disabilities by Type of Primary Disability:Total Students with Disabilities 67By Type of Primary Disability
Students with Intellectual Disabilities 16 23.9% 38.4% 42.4%Students with Physical Disabilities 22 32.8% 21.4% 21.9%Students with Autism ** ** 19.0% 13.7%Students with Behavioral Disabilities 15 22.4% 19.2% 20.6%Students with Non-Categorical Early Childhood * * 2.1% 1.4%
Mobility (2017-18):Total Mobile Students 145 22.6% 19.0% 15.4%
18-19 AAR Page 469
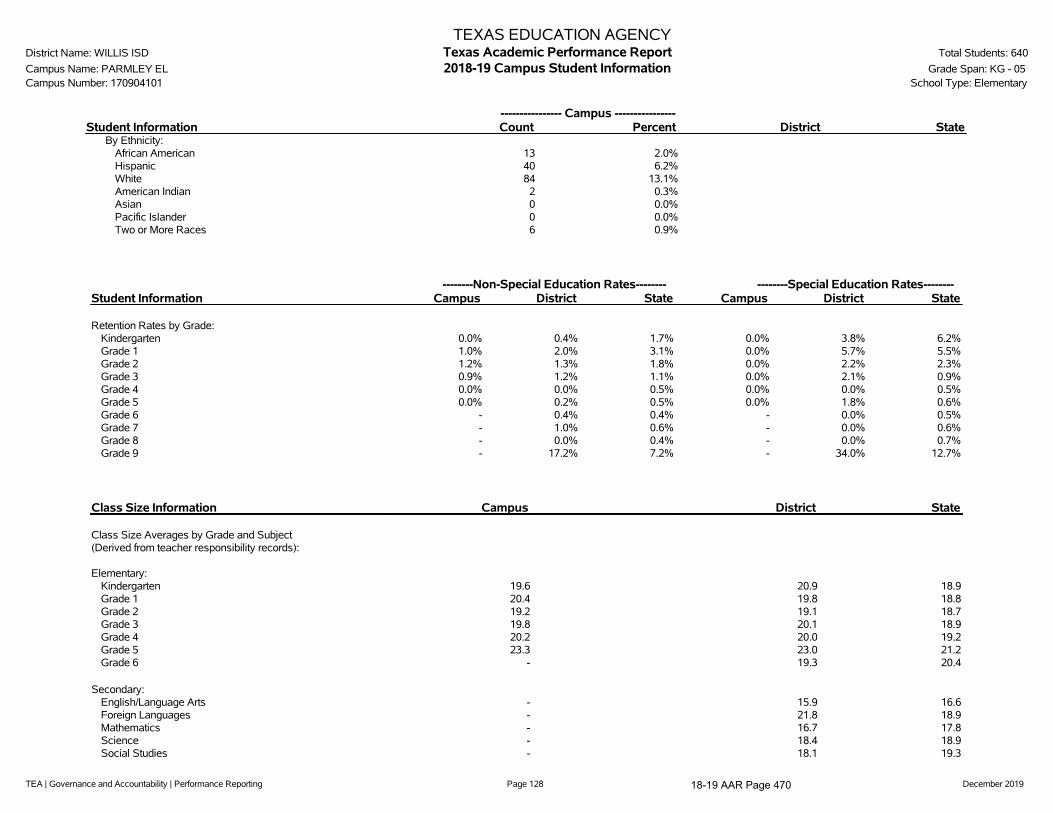
TEA | Governance and Accountability | Performance Reporting Page 128 December 2019
TEXAS EDUCATION AGENCYDistrict Name: WILLIS ISD Texas Academic Performance Report Total Students: 640
Campus Name: PARMLEY EL 2018-19 Campus Student Information Grade Span: KG - 05Campus Number: 170904101 School Type: Elementary
---------------- Campus ----------------Student Information Count Percent District State
By Ethnicity:African American 13 2.0%Hispanic 40 6.2%White 84 13.1%American Indian 2 0.3%Asian 0 0.0%Pacific Islander 0 0.0%Two or More Races 6 0.9%
--------Non-Special Education Rates-------- --------Special Education Rates--------Student Information Campus District State Campus District State
Retention Rates by Grade:Kindergarten 0.0% 0.4% 1.7% 0.0% 3.8% 6.2%Grade 1 1.0% 2.0% 3.1% 0.0% 5.7% 5.5%Grade 2 1.2% 1.3% 1.8% 0.0% 2.2% 2.3%Grade 3 0.9% 1.2% 1.1% 0.0% 2.1% 0.9%Grade 4 0.0% 0.0% 0.5% 0.0% 0.0% 0.5%Grade 5 0.0% 0.2% 0.5% 0.0% 1.8% 0.6%Grade 6 - 0.4% 0.4% - 0.0% 0.5%Grade 7 - 1.0% 0.6% - 0.0% 0.6%Grade 8 - 0.0% 0.4% - 0.0% 0.7%Grade 9 - 17.2% 7.2% - 34.0% 12.7%
Class Size Information Campus District State
Class Size Averages by Grade and Subject(Derived from teacher responsibility records):
Elementary:Kindergarten 19.6 20.9 18.9Grade 1 20.4 19.8 18.8Grade 2 19.2 19.1 18.7Grade 3 19.8 20.1 18.9Grade 4 20.2 20.0 19.2Grade 5 23.3 23.0 21.2Grade 6 - 19.3 20.4
Secondary:English/Language Arts - 15.9 16.6Foreign Languages - 21.8 18.9Mathematics - 16.7 17.8Science - 18.4 18.9Social Studies - 18.1 19.3
18-19 AAR Page 470

TEA | Governance and Accountability | Performance Reporting Page 129 December 2019
TEXAS EDUCATION AGENCYDistrict Name: WILLIS ISD Texas Academic Performance Report Total Students: 640
Campus Name: PARMLEY EL 2018-19 Campus Staff Information Grade Span: KG - 05Campus Number: 170904101 School Type: Elementary
---------------- Campus ----------------Staff Information Count/Average Percent District State
Total Staff 82.9 100.0% 100.0% 100.0%
Professional Staff: 69.0 83.2% 57.6% 64.1%Teachers 43.0 51.8% 44.8% 49.8%Professional Support 23.0 27.7% 9.2% 10.1%Campus Administration (School Leadership) 3.0 3.6% 2.9% 3.0%
Educational Aides: 13.9 16.8% 11.0% 10.3%
Librarians & Counselors (Headcount):Librarians
Full-time 0.0 n/a 0.0 4,414.0Part-time 0.0 n/a 0.0 572.0
CounselorsFull-time 1.0 n/a 12.0 12,433.0Part-time 0.0 n/a 2.0 1,097.0
Total Minority Staff: 12.0 14.5% 27.1% 50.4%
Teachers by Ethnicity and Sex:African American 0.0 0.0% 2.8% 10.6%Hispanic 4.0 9.3% 14.2% 27.7%White 39.0 90.7% 82.1% 58.4%American Indian 0.0 0.0% 0.2% 0.3%Asian 0.0 0.0% 0.2% 1.7%Pacific Islander 0.0 0.0% 0.0% 0.2%Two or More Races 0.0 0.0% 0.5% 1.1%
Males 1.0 2.3% 18.6% 23.8%Females 42.0 97.7% 81.4% 76.2%
Teachers by Highest Degree Held:No Degree 0.0 0.0% 0.5% 1.4%Bachelors 40.0 93.0% 81.7% 73.6%Masters 3.0 7.0% 17.4% 24.3%Doctorate 0.0 0.0% 0.5% 0.7%
Teachers by Years of Experience:Beginning Teachers 3.0 7.0% 8.0% 7.0%1-5 Years Experience 10.0 23.3% 31.7% 28.9%6-10 Years Experience 8.0 18.6% 17.5% 19.0%11-20 Years Experience 19.0 44.2% 24.9% 29.3%Over 20 Years Experience 3.0 7.0% 17.9% 15.7%
Number of Students per Teacher 14.9 n/a 17.2 15.1
18-19 AAR Page 471
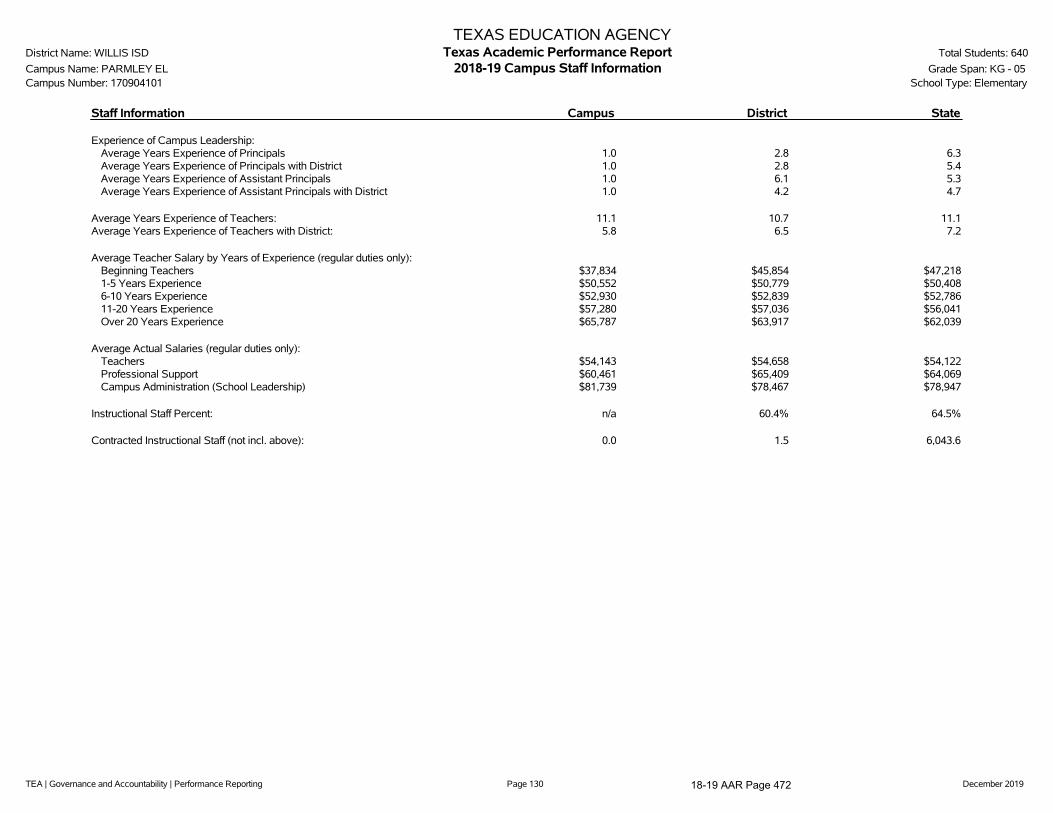
TEA | Governance and Accountability | Performance Reporting Page 130 December 2019
TEXAS EDUCATION AGENCYDistrict Name: WILLIS ISD Texas Academic Performance Report Total Students: 640
Campus Name: PARMLEY EL 2018-19 Campus Staff Information Grade Span: KG - 05Campus Number: 170904101 School Type: Elementary
Staff Information Campus District State
Experience of Campus Leadership:Average Years Experience of Principals 1.0 2.8 6.3Average Years Experience of Principals with District 1.0 2.8 5.4Average Years Experience of Assistant Principals 1.0 6.1 5.3Average Years Experience of Assistant Principals with District 1.0 4.2 4.7
Average Years Experience of Teachers: 11.1 10.7 11.1Average Years Experience of Teachers with District: 5.8 6.5 7.2
Average Teacher Salary by Years of Experience (regular duties only):Beginning Teachers $37,834 $45,854 $47,2181-5 Years Experience $50,552 $50,779 $50,4086-10 Years Experience $52,930 $52,839 $52,78611-20 Years Experience $57,280 $57,036 $56,041Over 20 Years Experience $65,787 $63,917 $62,039
Average Actual Salaries (regular duties only):Teachers $54,143 $54,658 $54,122Professional Support $60,461 $65,409 $64,069Campus Administration (School Leadership) $81,739 $78,467 $78,947
Instructional Staff Percent: n/a 60.4% 64.5%
Contracted Instructional Staff (not incl. above): 0.0 1.5 6,043.6
18-19 AAR Page 472

TEA | Governance and Accountability | Performance Reporting Page 131 December 2019
TEXAS EDUCATION AGENCYDistrict Name: WILLIS ISD Texas Academic Performance Report Total Students: 640
Campus Name: PARMLEY EL 2018-19 Campus Staff Information Grade Span: KG - 05Campus Number: 170904101 School Type: Elementary
---------------- Campus ----------------Program Information Count Percent District State
Student Enrollment by Program:Bilingual/ESL Education 24 3.8% 13.6% 19.7%Career & Technical Education 0 0.0% 21.5% 26.3%Gifted & Talented Education 21 3.3% 5.4% 8.1%Special Education 67 10.5% 8.4% 9.6%
Teachers by Program (population served):Bilingual/ESL Education 0.0 0.0% 2.8% 6.4%Career & Technical Education 0.0 0.0% 4.5% 4.9%Compensatory Education 0.0 0.0% 0.0% 2.7%Gifted & Talented Education 0.0 0.0% 0.0% 2.0%Regular Education 39.2 91.3% 76.9% 71.4%Special Education 3.8 8.7% 8.5% 9.1%Other 0.0 0.0% 7.3% 3.6%
' '̂ Indicates that rates for reading and mathematics are based on the cumulative results from the first and second administrations of STAAR.'*' Indicates results are masked due to small numbers to protect student confidentiality.'**' When only one student disability group is masked, then the second smallest student disability group is masked regardless of size.'***' Due to changes in the evaluation of SAT/ACT results (for 2017-18 the best result was used, rather than the most recent), 2016-17 SAT/ACT results are not
comparable and, where applicable, are not shown.'-' Indicates there are no students in the group.'n/a' Indicates data reporting is not applicable for this group.'?' Indicates that the data for this item were statistically improbable or were reported outside a reasonable range.
Link to: PEIMS Financial Standard Reports 2017-18 Financial Actual Report
18-19 AAR Page 473
TEA | Governance and Accountability | Performance Reporting Page 132 December 2019
2018-19 Texas Academic Performance Report
District Name: WILLIS ISD
Campus Name: C C HARDY EL
Campus Number: 170904103
2019 Accountability Rating: C
18-19 AAR Page 474

TEA | Governance and Accountability | Performance Reporting Page 133 December 2019
This page is intentionally blank.
18-19 AAR Page 475

TEA | Governance and Accountability | Performance Reporting Page 134 December 2019
TEXAS EDUCATION AGENCYDistrict Name: WILLIS ISD Texas Academic Performance Report Total Students: 613
Campus Name: C C HARDY EL 2018-19 Campus STAAR Performance Grade Span: KG - 05Campus Number: 170904103 School Type: Elementary
State District CampusAfrican
American Hispanic WhiteAmerican
Indian AsianPacific
Islander
Two orMoreRaces
SpecialEd
(Current)
SpecialEd
(Former)
Continu-ously
Enrolled
Non-Continu-
ouslyEnrolled
EconDisadv
EL(Current
&Monitored)
STAARPerformance Rates by Tested Grade, Subject, and Performance Level
Grade 3 ReadingAt Approaches Grade Level orAbove 2019 76% 71% 76% 71% 73% 81% - - - 83% 86% - 77% 71% 73% 76%
2018 77% 77% 67% 73% 69% 59% - - - 83% 44% * 68% 67% 66% 65%At Meets Grade Level or Above 2019 45% 37% 40% 43% 44% 31% - - - 33% 43% - 43% 29% 37% 48%
2018 43% 41% 24% 9% 17% 37% - - - 50% 0% * 26% 17% 19% 12%At Masters Grade Level 2019 27% 24% 22% 14% 21% 23% - - - 33% 0% - 21% 24% 18% 21%
2018 25% 23% 12% 9% 10% 15% - - - 17% 0% * 15% 4% 11% 7%Grade 3 Mathematics
At Approaches Grade Level orAbove 2019 79% 80% 84% 86% 85% 81% - - - 83% 71% - 84% 81% 79% 82%
2018 78% 77% 71% 64% 71% 70% - - - 83% 33% * 71% 71% 67% 70%At Meets Grade Level or Above 2019 49% 45% 46% 29% 46% 46% - - - 67% 43% - 49% 38% 44% 52%
2018 47% 45% 27% 0% 27% 37% - - - 33% 11% * 31% 17% 22% 26%At Masters Grade Level 2019 25% 19% 20% 14% 17% 19% - - - 50% 0% - 21% 14% 17% 18%
2018 23% 19% 14% 0% 10% 26% - - - 17% 0% * 15% 13% 10% 7%
Grade 4 ReadingAt Approaches Grade Level orAbove 2019 75% 74% 70% 50% 65% 82% - - - * 25% * 68% 72% 68% 62%
2018 73% 71% 57% 15% 58% 73% - - - 60% 0% * 54% 63% 52% 47%At Meets Grade Level or Above 2019 44% 41% 30% 17% 19% 54% - - - * 25% * 30% 31% 26% 14%
2018 46% 45% 36% 0% 35% 53% - - - 40% 0% * 38% 31% 33% 36%At Masters Grade Level 2019 22% 21% 12% 0% 8% 21% - - - * 0% * 12% 13% 11% 5%
2018 24% 24% 18% 0% 12% 33% - - - 40% 0% * 18% 17% 15% 11%Grade 4 Mathematics
At Approaches Grade Level orAbove 2019 75% 80% 73% 58% 75% 75% - - - * 25% * 73% 72% 69% 71%
2018 78% 83% 78% 46% 83% 80% - - - 100% 29% * 82% 71% 77% 83%At Meets Grade Level or Above 2019 48% 50% 38% 25% 31% 54% - - - * 25% * 37% 41% 36% 26%
2018 49% 55% 29% 0% 31% 43% - - - 0% 0% * 31% 26% 27% 28%At Masters Grade Level 2019 28% 30% 23% 8% 19% 36% - - - * 13% * 25% 19% 17% 19%
2018 27% 26% 7% 0% 6% 13% - - - 0% 0% * 9% 3% 6% 3%Grade 4 Writing
At Approaches Grade Level orAbove 2019 67% 64% 46% 33% 42% 56% - - - * 25% * 47% 45% 46% 38%
2018 63% 64% 52% 23% 54% 62% - - - 40% 14% * 53% 49% 47% 50%At Meets Grade Level or Above 2019 35% 30% 14% 17% 10% 19% - - - * 13% * 17% 10% 13% 10%
2018 39% 39% 23% 0% 21% 41% - - - 0% 0% * 23% 23% 21% 22%At Masters Grade Level 2019 11% 9% 2% 0% 0% 4% - - - * 0% * 3% 0% 1% 0%
2018 11% 8% 4% 0% 2% 10% - - - 0% 0% * 5% 3% 5% 3%
Grade 5 Reading^At Approaches Grade Level orAbove 2019 86% 84% 76% 58% 76% 86% * - - 86% 40% * 75% 78% 78% 67%
2018 84% 82% 78% 70% 82% 82% * - - * * * 76% 86% 78% 77%At Meets Grade Level or Above 2019 54% 50% 36% 17% 32% 54% * - - 43% 10% * 34% 40% 35% 33%
2018 54% 47% 37% 30% 32% 55% * - - * * * 36% 43% 32% 32%
18-19 AAR Page 476
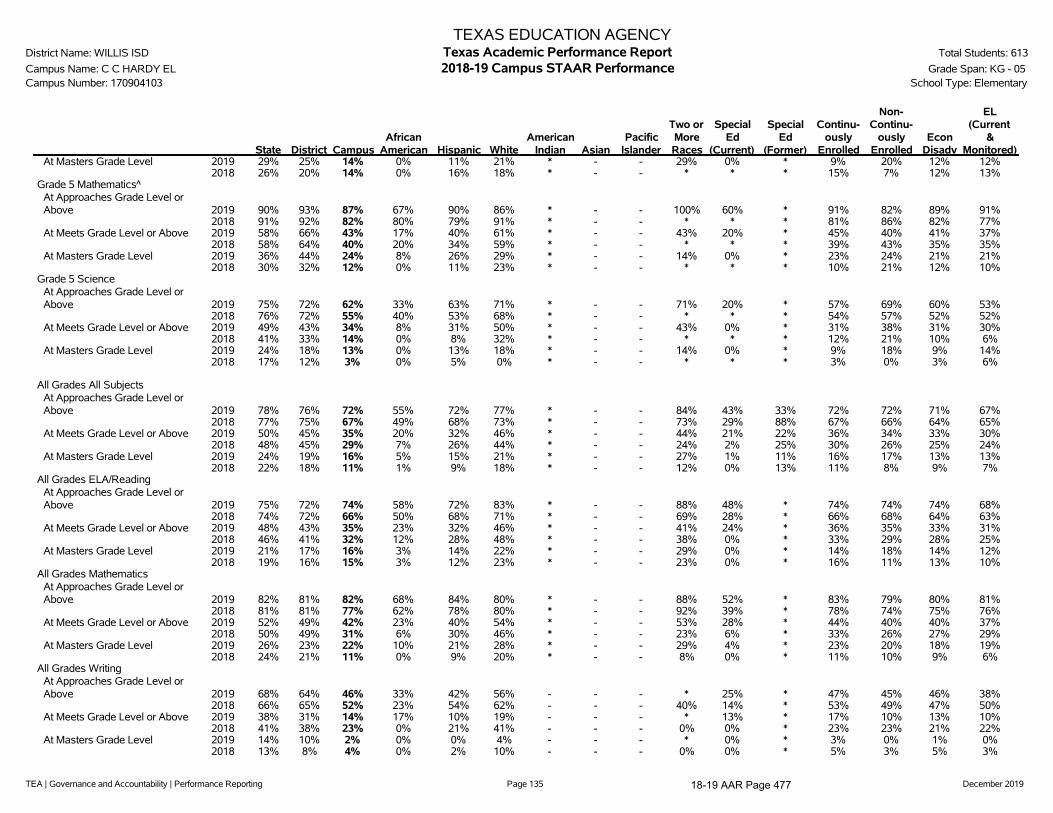
TEA | Governance and Accountability | Performance Reporting Page 135 December 2019
TEXAS EDUCATION AGENCYDistrict Name: WILLIS ISD Texas Academic Performance Report Total Students: 613
Campus Name: C C HARDY EL 2018-19 Campus STAAR Performance Grade Span: KG - 05Campus Number: 170904103 School Type: Elementary
State District CampusAfrican
American Hispanic WhiteAmerican
Indian AsianPacific
Islander
Two orMoreRaces
SpecialEd
(Current)
SpecialEd
(Former)
Continu-ously
Enrolled
Non-Continu-
ouslyEnrolled
EconDisadv
EL(Current
&Monitored)
At Masters Grade Level 2019 29% 25% 14% 0% 11% 21% * - - 29% 0% * 9% 20% 12% 12%2018 26% 20% 14% 0% 16% 18% * - - * * * 15% 7% 12% 13%
Grade 5 Mathematics^At Approaches Grade Level orAbove 2019 90% 93% 87% 67% 90% 86% * - - 100% 60% * 91% 82% 89% 91%
2018 91% 92% 82% 80% 79% 91% * - - * * * 81% 86% 82% 77%At Meets Grade Level or Above 2019 58% 66% 43% 17% 40% 61% * - - 43% 20% * 45% 40% 41% 37%
2018 58% 64% 40% 20% 34% 59% * - - * * * 39% 43% 35% 35%At Masters Grade Level 2019 36% 44% 24% 8% 26% 29% * - - 14% 0% * 23% 24% 21% 21%
2018 30% 32% 12% 0% 11% 23% * - - * * * 10% 21% 12% 10%Grade 5 Science
At Approaches Grade Level orAbove 2019 75% 72% 62% 33% 63% 71% * - - 71% 20% * 57% 69% 60% 53%
2018 76% 72% 55% 40% 53% 68% * - - * * * 54% 57% 52% 52%At Meets Grade Level or Above 2019 49% 43% 34% 8% 31% 50% * - - 43% 0% * 31% 38% 31% 30%
2018 41% 33% 14% 0% 8% 32% * - - * * * 12% 21% 10% 6%At Masters Grade Level 2019 24% 18% 13% 0% 13% 18% * - - 14% 0% * 9% 18% 9% 14%
2018 17% 12% 3% 0% 5% 0% * - - * * * 3% 0% 3% 6%
All Grades All SubjectsAt Approaches Grade Level orAbove 2019 78% 76% 72% 55% 72% 77% * - - 84% 43% 33% 72% 72% 71% 67%
2018 77% 75% 67% 49% 68% 73% * - - 73% 29% 88% 67% 66% 64% 65%At Meets Grade Level or Above 2019 50% 45% 35% 20% 32% 46% * - - 44% 21% 22% 36% 34% 33% 30%
2018 48% 45% 29% 7% 26% 44% * - - 24% 2% 25% 30% 26% 25% 24%At Masters Grade Level 2019 24% 19% 16% 5% 15% 21% * - - 27% 1% 11% 16% 17% 13% 13%
2018 22% 18% 11% 1% 9% 18% * - - 12% 0% 13% 11% 8% 9% 7%All Grades ELA/Reading
At Approaches Grade Level orAbove 2019 75% 72% 74% 58% 72% 83% * - - 88% 48% * 74% 74% 74% 68%
2018 74% 72% 66% 50% 68% 71% * - - 69% 28% * 66% 68% 64% 63%At Meets Grade Level or Above 2019 48% 43% 35% 23% 32% 46% * - - 41% 24% * 36% 35% 33% 31%
2018 46% 41% 32% 12% 28% 48% * - - 38% 0% * 33% 29% 28% 25%At Masters Grade Level 2019 21% 17% 16% 3% 14% 22% * - - 29% 0% * 14% 18% 14% 12%
2018 19% 16% 15% 3% 12% 23% * - - 23% 0% * 16% 11% 13% 10%All Grades Mathematics
At Approaches Grade Level orAbove 2019 82% 81% 82% 68% 84% 80% * - - 88% 52% * 83% 79% 80% 81%
2018 81% 81% 77% 62% 78% 80% * - - 92% 39% * 78% 74% 75% 76%At Meets Grade Level or Above 2019 52% 49% 42% 23% 40% 54% * - - 53% 28% * 44% 40% 40% 37%
2018 50% 49% 31% 6% 30% 46% * - - 23% 6% * 33% 26% 27% 29%At Masters Grade Level 2019 26% 23% 22% 10% 21% 28% * - - 29% 4% * 23% 20% 18% 19%
2018 24% 21% 11% 0% 9% 20% * - - 8% 0% * 11% 10% 9% 6%All Grades Writing
At Approaches Grade Level orAbove 2019 68% 64% 46% 33% 42% 56% - - - * 25% * 47% 45% 46% 38%
2018 66% 65% 52% 23% 54% 62% - - - 40% 14% * 53% 49% 47% 50%At Meets Grade Level or Above 2019 38% 31% 14% 17% 10% 19% - - - * 13% * 17% 10% 13% 10%
2018 41% 38% 23% 0% 21% 41% - - - 0% 0% * 23% 23% 21% 22%At Masters Grade Level 2019 14% 10% 2% 0% 0% 4% - - - * 0% * 3% 0% 1% 0%
2018 13% 8% 4% 0% 2% 10% - - - 0% 0% * 5% 3% 5% 3%
18-19 AAR Page 477

TEA | Governance and Accountability | Performance Reporting Page 136 December 2019
TEXAS EDUCATION AGENCYDistrict Name: WILLIS ISD Texas Academic Performance Report Total Students: 613
Campus Name: C C HARDY EL 2018-19 Campus STAAR Performance Grade Span: KG - 05Campus Number: 170904103 School Type: Elementary
State District CampusAfrican
American Hispanic WhiteAmerican
Indian AsianPacific
Islander
Two orMoreRaces
SpecialEd
(Current)
SpecialEd
(Former)
Continu-ously
Enrolled
Non-Continu-
ouslyEnrolled
EconDisadv
EL(Current
&Monitored)
All Grades ScienceAt Approaches Grade Level orAbove 2019 81% 81% 62% 33% 63% 71% * - - 71% 20% * 57% 69% 60% 53%
2018 80% 77% 55% 40% 53% 68% * - - * * * 54% 57% 52% 52%At Meets Grade Level or Above 2019 54% 51% 34% 8% 31% 50% * - - 43% 0% * 31% 38% 31% 30%
2018 51% 46% 14% 0% 8% 32% * - - * * * 12% 21% 10% 6%At Masters Grade Level 2019 25% 20% 13% 0% 13% 18% * - - 14% 0% * 9% 18% 9% 14%
2018 23% 18% 3% 0% 5% 0% * - - * * * 3% 0% 3% 6%
18-19 AAR Page 478
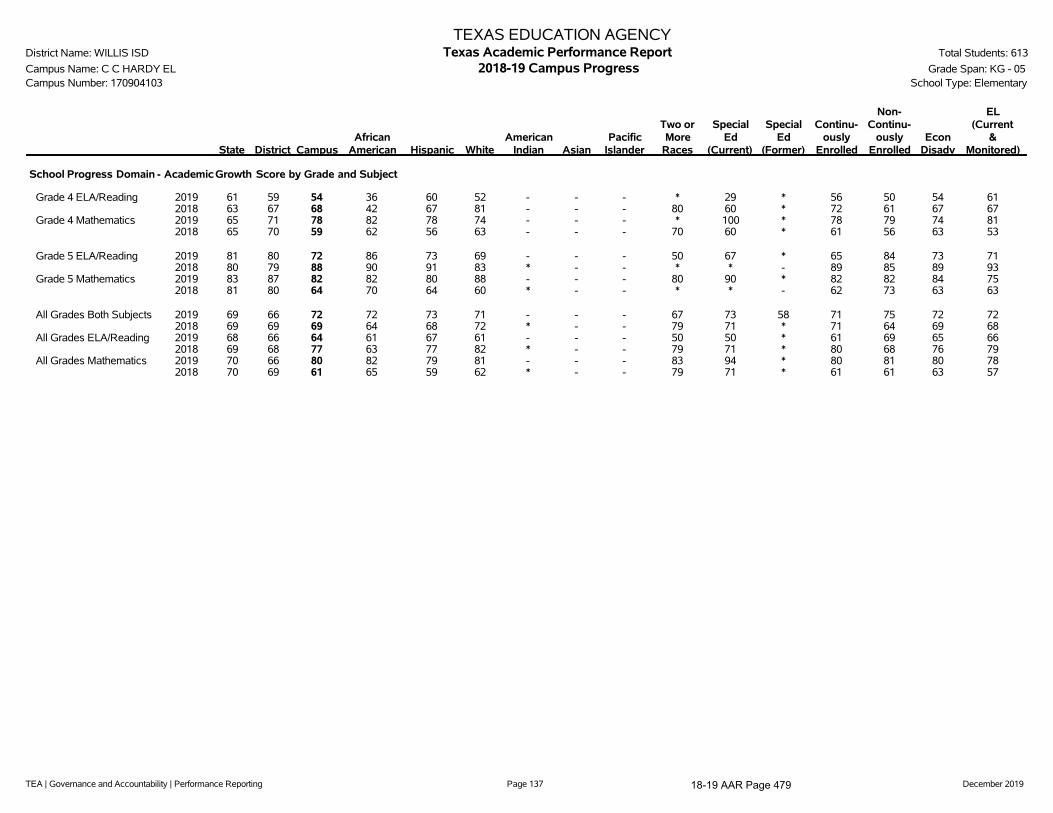
TEA | Governance and Accountability | Performance Reporting Page 137 December 2019
TEXAS EDUCATION AGENCYDistrict Name: WILLIS ISD Texas Academic Performance Report Total Students: 613
Campus Name: C C HARDY EL 2018-19 Campus Progress Grade Span: KG - 05Campus Number: 170904103 School Type: Elementary
State District CampusAfrican
American Hispanic WhiteAmerican
Indian AsianPacific
Islander
Two orMore
Races
SpecialEd
(Current)
SpecialEd
(Former)
Continu-ously
Enrolled
Non-Continu-
ouslyEnrolled
EconDisadv
EL(Current
&Monitored)
School Progress Domain - Academic Growth Score by Grade and Subject
Grade 4 ELA/Reading 2019 61 59 54 36 60 52 - - - * 29 * 56 50 54 612018 63 67 68 42 67 81 - - - 80 60 * 72 61 67 67
Grade 4 Mathematics 2019 65 71 78 82 78 74 - - - * 100 * 78 79 74 812018 65 70 59 62 56 63 - - - 70 60 * 61 56 63 53
Grade 5 ELA/Reading 2019 81 80 72 86 73 69 - - - 50 67 * 65 84 73 712018 80 79 88 90 91 83 * - - * * - 89 85 89 93
Grade 5 Mathematics 2019 83 87 82 82 80 88 - - - 80 90 * 82 82 84 752018 81 80 64 70 64 60 * - - * * - 62 73 63 63
All Grades Both Subjects 2019 69 66 72 72 73 71 - - - 67 73 58 71 75 72 722018 69 69 69 64 68 72 * - - 79 71 * 71 64 69 68
All Grades ELA/Reading 2019 68 66 64 61 67 61 - - - 50 50 * 61 69 65 662018 69 68 77 63 77 82 * - - 79 71 * 80 68 76 79
All Grades Mathematics 2019 70 66 80 82 79 81 - - - 83 94 * 80 81 80 782018 70 69 61 65 59 62 * - - 79 71 * 61 61 63 57
18-19 AAR Page 479

TEA | Governance and Accountability | Performance Reporting Page 138 December 2019
TEXAS EDUCATION AGENCYDistrict Name: WILLIS ISD Texas Academic Performance Report Total Students: 613
Campus Name: C C HARDY EL 2018-19 Campus Prior Year and Student Success Initiative Grade Span: KG - 05Campus Number: 170904103 School Type: Elementary
State District CampusAfrican
American Hispanic WhiteAmerican
Indian AsianPacific
Islander
Two orMore
RacesSpecial
EdEcon
DisadvEL
(Current)
Progress of Prior-Year Non-Proficient Students
Sum of Grades 4-8
Reading 2019 41% 39% 43% 38% 41% 47% - - - * 29% 47% 38%2018 38% 37% 31% * 39% * * - - * * 29% 31%
Mathematics 2019 45% 48% 36% 25% 48% 20% - - - * 23% 38% 40%2018 47% 48% 40% * 35% 55% * - - * * 41% 39%
Student Success Initiative
Grade 5 ReadingStudents Meeting Approaches Grade Level on First STAARAdministration
2019 78% 76% 65% 42% 66% 71% * - - 71% 10% 66% 50%Students Requiring Accelerated Instruction
2019 22% 24% 35% 58% 34% 29% * - - 29% 90% 34% 50%STAARCumulativeMet Standard
2019 86% 84% 76% 58% 76% 86% * - - 86% 40% 78% 59%STAARNon-Proficient Students Promoted by Grade Placement Committee
2018 97% 100% 100% * 100% 100% - - - * * 100% *
Grade 5 MathematicsStudents Meeting Approaches Grade Level on First STAARAdministration
2019 83% 87% 69% 42% 68% 75% * - - 100% 30% 70% 65%Students Requiring Accelerated Instruction
2019 17% 13% 31% 58% 32% 25% * - - 0% 70% 30% 35%STAARCumulativeMet Standard
2019 90% 93% 87% 67% 90% 86% * - - 100% 60% 89% 88%STAARNon-Proficient Students Promoted by Grade Placement Committee
2018 97% 100% 100% * 100% 100% * - - - * 100% 100%
18-19 AAR Page 480
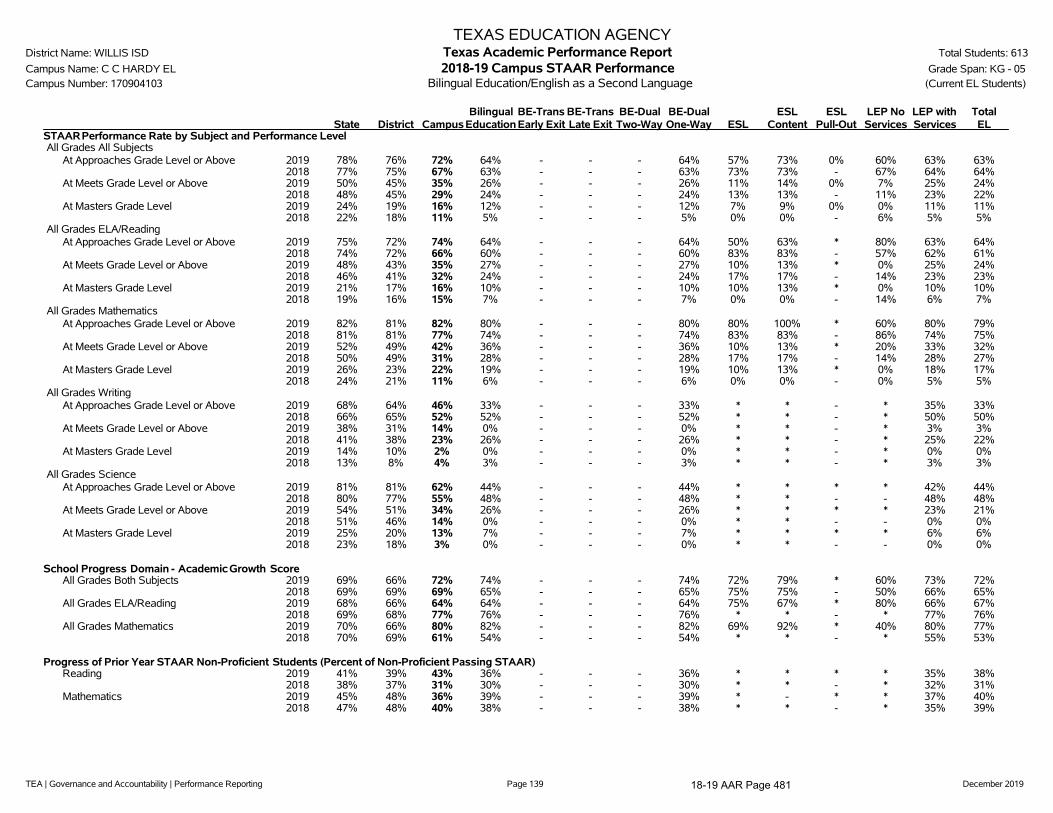
TEA | Governance and Accountability | Performance Reporting Page 139 December 2019
TEXAS EDUCATION AGENCYDistrict Name: WILLIS ISD Texas Academic Performance Report Total Students: 613
Campus Name: C C HARDY EL 2018-19 Campus STAAR Performance Grade Span: KG - 05Campus Number: 170904103 Bilingual Education/English as a Second Language (Current EL Students)
State District CampusBilingual
EducationBE-TransEarly Exit
BE-TransLate Exit
BE-DualTwo-Way
BE-DualOne-Way ESL
ESLContent
ESLPull-Out
LEP NoServices
LEP withServices
TotalEL
STAARPerformance Rate by Subject and Performance LevelAll Grades All Subjects
At Approaches Grade Level or Above 2019 78% 76% 72% 64% - - - 64% 57% 73% 0% 60% 63% 63%2018 77% 75% 67% 63% - - - 63% 73% 73% - 67% 64% 64%
At Meets Grade Level or Above 2019 50% 45% 35% 26% - - - 26% 11% 14% 0% 7% 25% 24%2018 48% 45% 29% 24% - - - 24% 13% 13% - 11% 23% 22%
At Masters Grade Level 2019 24% 19% 16% 12% - - - 12% 7% 9% 0% 0% 11% 11%2018 22% 18% 11% 5% - - - 5% 0% 0% - 6% 5% 5%
All Grades ELA/ReadingAt Approaches Grade Level or Above 2019 75% 72% 74% 64% - - - 64% 50% 63% * 80% 63% 64%
2018 74% 72% 66% 60% - - - 60% 83% 83% - 57% 62% 61%At Meets Grade Level or Above 2019 48% 43% 35% 27% - - - 27% 10% 13% * 0% 25% 24%
2018 46% 41% 32% 24% - - - 24% 17% 17% - 14% 23% 23%At Masters Grade Level 2019 21% 17% 16% 10% - - - 10% 10% 13% * 0% 10% 10%
2018 19% 16% 15% 7% - - - 7% 0% 0% - 14% 6% 7%All Grades Mathematics
At Approaches Grade Level or Above 2019 82% 81% 82% 80% - - - 80% 80% 100% * 60% 80% 79%2018 81% 81% 77% 74% - - - 74% 83% 83% - 86% 74% 75%
At Meets Grade Level or Above 2019 52% 49% 42% 36% - - - 36% 10% 13% * 20% 33% 32%2018 50% 49% 31% 28% - - - 28% 17% 17% - 14% 28% 27%
At Masters Grade Level 2019 26% 23% 22% 19% - - - 19% 10% 13% * 0% 18% 17%2018 24% 21% 11% 6% - - - 6% 0% 0% - 0% 5% 5%
All Grades WritingAt Approaches Grade Level or Above 2019 68% 64% 46% 33% - - - 33% * * - * 35% 33%
2018 66% 65% 52% 52% - - - 52% * * - * 50% 50%At Meets Grade Level or Above 2019 38% 31% 14% 0% - - - 0% * * - * 3% 3%
2018 41% 38% 23% 26% - - - 26% * * - * 25% 22%At Masters Grade Level 2019 14% 10% 2% 0% - - - 0% * * - * 0% 0%
2018 13% 8% 4% 3% - - - 3% * * - * 3% 3%All Grades Science
At Approaches Grade Level or Above 2019 81% 81% 62% 44% - - - 44% * * * * 42% 44%2018 80% 77% 55% 48% - - - 48% * * - - 48% 48%
At Meets Grade Level or Above 2019 54% 51% 34% 26% - - - 26% * * * * 23% 21%2018 51% 46% 14% 0% - - - 0% * * - - 0% 0%
At Masters Grade Level 2019 25% 20% 13% 7% - - - 7% * * * * 6% 6%2018 23% 18% 3% 0% - - - 0% * * - - 0% 0%
School Progress Domain - Academic Growth ScoreAll Grades Both Subjects 2019 69% 66% 72% 74% - - - 74% 72% 79% * 60% 73% 72%
2018 69% 69% 69% 65% - - - 65% 75% 75% - 50% 66% 65%All Grades ELA/Reading 2019 68% 66% 64% 64% - - - 64% 75% 67% * 80% 66% 67%
2018 69% 68% 77% 76% - - - 76% * * - * 77% 76%All Grades Mathematics 2019 70% 66% 80% 82% - - - 82% 69% 92% * 40% 80% 77%
2018 70% 69% 61% 54% - - - 54% * * - * 55% 53%
Progress of Prior Year STAAR Non-Proficient Students (Percent of Non-Proficient Passing STAAR)Reading 2019 41% 39% 43% 36% - - - 36% * * * * 35% 38%
2018 38% 37% 31% 30% - - - 30% * * - * 32% 31%Mathematics 2019 45% 48% 36% 39% - - - 39% * - * * 37% 40%
2018 47% 48% 40% 38% - - - 38% * * - * 35% 39%
18-19 AAR Page 481
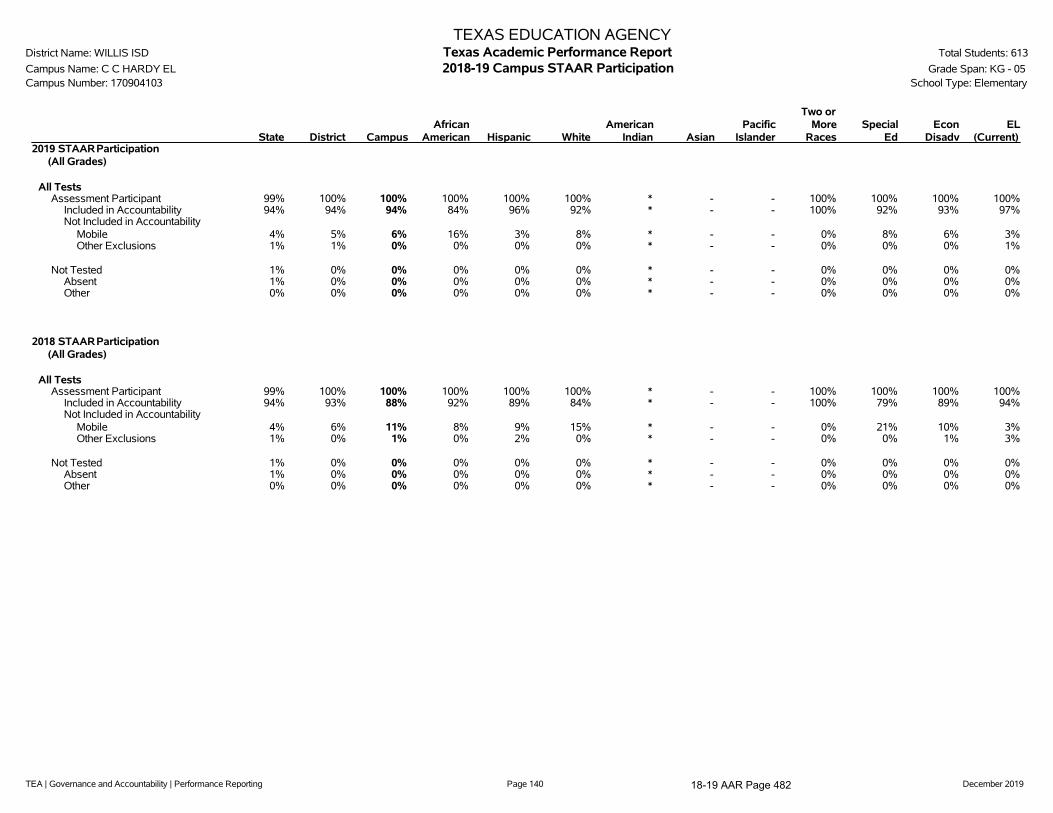
TEA | Governance and Accountability | Performance Reporting Page 140 December 2019
TEXAS EDUCATION AGENCYDistrict Name: WILLIS ISD Texas Academic Performance Report Total Students: 613
Campus Name: C C HARDY EL 2018-19 Campus STAAR Participation Grade Span: KG - 05Campus Number: 170904103 School Type: Elementary
State District CampusAfrican
American Hispanic WhiteAmerican
Indian AsianPacific
Islander
Two orMore
RacesSpecial
EdEcon
DisadvEL
(Current)2019 STAARParticipation
(All Grades)
All TestsAssessment Participant 99% 100% 100% 100% 100% 100% * - - 100% 100% 100% 100%
Included in Accountability 94% 94% 94% 84% 96% 92% * - - 100% 92% 93% 97%Not Included in Accountability
Mobile 4% 5% 6% 16% 3% 8% * - - 0% 8% 6% 3%Other Exclusions 1% 1% 0% 0% 0% 0% * - - 0% 0% 0% 1%
Not Tested 1% 0% 0% 0% 0% 0% * - - 0% 0% 0% 0%Absent 1% 0% 0% 0% 0% 0% * - - 0% 0% 0% 0%Other 0% 0% 0% 0% 0% 0% * - - 0% 0% 0% 0%
2018 STAARParticipation(All Grades)
All TestsAssessment Participant 99% 100% 100% 100% 100% 100% * - - 100% 100% 100% 100%
Included in Accountability 94% 93% 88% 92% 89% 84% * - - 100% 79% 89% 94%Not Included in Accountability
Mobile 4% 6% 11% 8% 9% 15% * - - 0% 21% 10% 3%Other Exclusions 1% 0% 1% 0% 2% 0% * - - 0% 0% 1% 3%
Not Tested 1% 0% 0% 0% 0% 0% * - - 0% 0% 0% 0%Absent 1% 0% 0% 0% 0% 0% * - - 0% 0% 0% 0%Other 0% 0% 0% 0% 0% 0% * - - 0% 0% 0% 0%
18-19 AAR Page 482

TEA | Governance and Accountability | Performance Reporting Page 141 December 2019
TEXAS EDUCATION AGENCYDistrict Name: WILLIS ISD Texas Academic Performance Report Total Students: 613
Campus Name: C C HARDY EL 2018-19 Campus Attendance, Graduation, and Dropout Rates Grade Span: KG - 05Campus Number: 170904103 School Type: Elementary
State District CampusAfrican
American Hispanic WhiteAmerican
Indian AsianPacific
Islander
Two orMore
RacesSpecial
EdEcon
DisadvEL
(Current)
Attendance Rate2017-18 95.4% 95.0% 95.9% 96.1% 96.6% 94.8% * - - 94.9% 95.2% 95.8% 97.0%2016-17 95.7% 95.2% 95.7% 96.3% 96.5% 94.8% * - * 93.2% 94.5% 95.6% 97.0%
Annual Dropout Rate (Gr 7-8)2017-18 0.4% 0.1% - - - - - - - - - - -2016-17 0.3% 0.2% - - - - - - - - - - -
Annual Dropout Rate (Gr 9-12)2017-18 1.9% 2.9% - - - - - - - - - - -2016-17 1.9% 1.5% - - - - - - - - - - -
4-Year Longitudinal Rate (Gr 9-12)Class of 2018
Graduated 90.0% 86.4% - - - - - - - - - - -Received TxCHSE 0.4% 0.4% - - - - - - - - - - -Continued HS 3.8% 4.0% - - - - - - - - - - -Dropped Out 5.7% 9.1% - - - - - - - - - - -Graduates and TxCHSE 90.4% 86.8% - - - - - - - - - - -Graduates, TxCHSE,and Continuers 94.3% 90.9% - - - - - - - - - - -
Class of 2017Graduated 89.7% 89.3% - - - - - - - - - - -Received TxCHSE 0.4% 1.1% - - - - - - - - - - -Continued HS 4.0% 4.6% - - - - - - - - - - -Dropped Out 5.9% 5.0% - - - - - - - - - - -Graduates and TxCHSE 90.1% 90.4% - - - - - - - - - - -Graduates, TxCHSE,and Continuers 94.1% 95.0% - - - - - - - - - - -
5-Year Extended Longitudinal Rate (Gr 9-12)Class of 2017
Graduated 92.0% 92.0% - - - - - - - - - - -Received TxCHSE 0.6% 1.3% - - - - - - - - - - -Continued HS 1.1% 0.2% - - - - - - - - - - -Dropped Out 6.3% 6.5% - - - - - - - - - - -Graduates and TxCHSE 92.6% 93.3% - - - - - - - - - - -Graduates, TxCHSE,and Continuers 93.7% 93.5% - - - - - - - - - - -
Class of 2016Graduated 91.6% 93.7% - - - - - - - - - - -Received TxCHSE 0.7% 1.1% - - - - - - - - - - -Continued HS 1.2% 0.0% - - - - - - - - - - -Dropped Out 6.6% 5.2% - - - - - - - - - - -Graduates and TxCHSE 92.2% 94.8% - - - - - - - - - - -Graduates, TxCHSE,and Continuers 93.4% 94.8% - - - - - - - - - - -
6-Year Extended Longitudinal Rate (Gr 9-12)Class of 2016
Graduated 92.1% 93.9% - - - - - - - - - - -
18-19 AAR Page 483

TEA | Governance and Accountability | Performance Reporting Page 142 December 2019
TEXAS EDUCATION AGENCYDistrict Name: WILLIS ISD Texas Academic Performance Report Total Students: 613
Campus Name: C C HARDY EL 2018-19 Campus Attendance, Graduation, and Dropout Rates Grade Span: KG - 05Campus Number: 170904103 School Type: Elementary
State District CampusAfrican
American Hispanic WhiteAmerican
Indian AsianPacific
Islander
Two orMore
RacesSpecial
EdEcon
DisadvEL
(Current)Received TxCHSE 0.8% 1.1% - - - - - - - - - - -Continued HS 0.5% 0.0% - - - - - - - - - - -Dropped Out 6.6% 5.0% - - - - - - - - - - -Graduates and TxCHSE 92.9% 95.0% - - - - - - - - - - -Graduates, TxCHSE,and Continuers 93.4% 95.0% - - - - - - - - - - -
Class of 2015Graduated 91.8% 93.3% - - - - - - - - - - -Received TxCHSE 1.0% 1.4% - - - - - - - - - - -Continued HS 0.6% 0.2% - - - - - - - - - - -Dropped Out 6.7% 5.0% - - - - - - - - - - -Graduates and TxCHSE 92.8% 94.7% - - - - - - - - - - -Graduates, TxCHSE,and Continuers 93.3% 95.0% - - - - - - - - - - -
4-Year Federal Graduation Rate Without Exclusions (Gr 9-12)Class of 2018 90.0% 85.5% - - - - - - - - - - -Class of 2017 89.7% 88.6% - - - - - - - - - - -
RHSP/DAP Graduates (Longitudinal Rate)Class of 2018 68.5% * - - - - - - - - - - -Class of 2017 88.5% 89.1% - - - - - - - - - - -
FHSP-E Graduates (Longitudinal Rate)Class of 2018 5.0% 2.0% - - - - - - - - - - -Class of 2017 6.0% 0.0% - - - - - - - - - - -
FHSP-DLA Graduates (Longitudinal Rate)Class of 2018 82.0% 87.4% - - - - - - - - - - -Class of 2017 60.8% 14.3% - - - - - - - - - - -
RHSP/DAP/FHSP-E/FHSP-DLA Graduates (Longitudinal Rate)Class of 2018 86.8% 89.2% - - - - - - - - - - -Class of 2017 85.9% 87.8% - - - - - - - - - - -
RHSP/DAP Graduates (Annual Rate)2017-18 37.7% 37.5% - - - - - - - - - - -2016-17 87.2% 87.0% - - - - - - - - - - -
FHSP-E Graduates (Annual Rate)2017-18 4.9% 1.7% - - - - - - - - - - -2016-17 7.2% 11.1% - - - - - - - - - - -
FHSP-DLA Graduates (Annual Rate)2017-18 81.5% 87.2% - - - - - - - - - - -2016-17 56.5% 22.2% - - - - - - - - - - -
RHSP/DAP/FHSP-E/FHSP-DLA Graduates (Annual Rate)2017-18 85.1% 87.9% - - - - - - - - - - -2016-17 84.0% 85.9% - - - - - - - - - - -
18-19 AAR Page 484

TEA | Governance and Accountability | Performance Reporting Page 143 December 2019
TEXAS EDUCATION AGENCYDistrict Name: WILLIS ISD Texas Academic Performance Report Total Students: 613
Campus Name: C C HARDY EL 2018-19 Campus Graduation Profile Grade Span: KG - 05Campus Number: 170904103 School Type: Elementary
CampusCount
CampusPercent
DistrictCount
StateCount
Graduates (2017-18 Annual Graduates)Total Graduates - - 422 347,893
By Ethnicity:African American - - 31 43,502Hispanic - - 128 173,272White - - 247 107,052American Indian - - 3 1,226Asian - - 2 15,589Pacific Islander - - 2 528Two or More Races - - 9 6,724
By Graduation Type:Minimum H.S. Program - - 5 5,855Recommended H.S. Program/Distinguished Achievement Program - - 3 3,538Foundation H.S. Program (No Endorsement) - - 46 49,432Foundation H.S. Program (Endorsement) - - 7 16,542Foundation H.S. Program (DLA) - - 361 272,526
Special Education Graduates - - 27 25,962Economically Disadvantaged Graduates - - 181 166,956LEP Graduates - - 16 21,359At-Risk Graduates - - 137 144,805
18-19 AAR Page 485

TEA | Governance and Accountability | Performance Reporting Page 144 December 2019
TEXAS EDUCATION AGENCYDistrict Name: WILLIS ISD Texas Academic Performance Report Total Students: 613
Campus Name: C C HARDY EL 2018-19 Campus College, Career, and Military Readiness (CCMR) Grade Span: KG - 05Campus Number: 170904103 School Type: Elementary
State District CampusAfrican
American Hispanic WhiteAmerican
Indian AsianPacific
Islander
Two orMore
RacesSpecial
EdEcon
DisadvEL
(Current)College, Career, and Military Ready Graduates (Student Achievement) ***
College, Career, or Military Ready (Annual Graduates)2017-18 65.5% 64.0% - - - - - - - - - - -
College Ready Graduates ***College Ready (Annual Graduates)
2017-18 50.0% 34.4% - - - - - - - - - - -
TSI Criteria Graduates (Annual Graduates)English Language Arts
2017-18 58.2% 51.2% - - - - - - - - - - -Mathematics
2017-18 46.0% 29.9% - - - - - - - - - - -Both Subjects
2017-18 42.1% 28.4% - - - - - - - - - - -
Dual Course Credits (Annual Graduates)Any Subject
2017-18 20.7% 17.3% - - - - - - - - - - -2016-17 19.9% 21.6% - - - - - - - - - - -
AP/IB Met Criteria in Any Subject (Annual Graduates)Any Subject
2017-18 20.4% 9.5% - - - - - - - - - - -2016-17 20.1% 4.9% - - - - - - - - - - -
Associate's DegreeAssociate's Degree (Annual Graduates)
2017-18 1.4% 0.2% - - - - - - - - - - -2016-17 0.8% 0.0% - - - - - - - - - - -
OnRampsCourse Credits (Annual Graduates)2017-18 1.0% 0.0% - - - - - - - - - - -
Career/Military Ready GraduatesCareer or Military Ready (Annual Graduates)
2017-18 28.7% 41.6% - - - - - - - - - - -2016-17 13.2% 13.1% - - - - - - - - - - -
Approved Industry-Based Certification (Annual Graduates)2017-18 4.8% 9.0% - - - - - - - - - - -2016-17 2.7% 3.8% - - - - - - - - - - -
Graduate with Completed IEP and Workforce Readiness (Annual Graduates)2017-18 1.7% 6.2% - - - - - - - - - - -2016-17 1.0% 0.0% - - - - - - - - - - -
CTE Coherent Sequence Coursework Aligned with Industry-Based Certifications (Annual Graduates)2017-18 38.7% 58.8% - - - - - - - - - - -2016-17 17.3% 14.6% - - - - - - - - - - -
18-19 AAR Page 486

TEA | Governance and Accountability | Performance Reporting Page 145 December 2019
TEXAS EDUCATION AGENCYDistrict Name: WILLIS ISD Texas Academic Performance Report Total Students: 613
Campus Name: C C HARDY EL 2018-19 Campus College, Career, and Military Readiness (CCMR) Grade Span: KG - 05Campus Number: 170904103 School Type: Elementary
State District CampusAfrican
American Hispanic WhiteAmerican
Indian AsianPacific
Islander
Two orMore
RacesSpecial
EdEcon
DisadvEL
(Current)
U.S. Armed Forces Enlistment (Annual Graduates)2017-18 4.3% 3.3% - - - - - - - - - - -2016-17 2.2% 2.8% - - - - - - - - - - -
Graduates under an Advanced Degree Plan and Identified as a current Special Education Student (Annual Graduates)2017-18 2.6% 0.9% - - - - - - - - - - -
Graduates with Level I or Level II Certificate (Annual Graduates)2017-18 0.6% 0.0% - - - - - - - - - - -2016-17 0.5% 0.0% - - - - - - - - - - -
18-19 AAR Page 487

TEA | Governance and Accountability | Performance Reporting Page 146 December 2019
TEXAS EDUCATION AGENCYDistrict Name: WILLIS ISD Texas Academic Performance Report Total Students: 613
Campus Name: C C HARDY EL 2018-19 Campus CCMR-Related Indicators Grade Span: KG - 05Campus Number: 170904103 School Type: Elementary
State District CampusAfrican
American Hispanic WhiteAmerican
Indian AsianPacific
Islander
Two orMore
RacesSpecial
EdEcon
DisadvEL
(Current)TSIA Results (Graduates >= Criterion) (Annual Graduates)
Reading2017-18 32.1% 36.5% - - - - - - - - - - -2016-17 23.4% 11.3% - - - - - - - - - - -
Mathematics2017-18 23.7% 21.8% - - - - - - - - - - -2016-17 19.8% 11.3% - - - - - - - - - - -
Both Subjects2017-18 18.1% 17.8% - - - - - - - - - - -2016-17 12.9% 5.4% - - - - - - - - - - -
CTE Coherent Sequence (Annual Graduates)2017-18 58.4% 61.8% - - - - - - - - - - -2016-17 50.5% 30.1% - - - - - - - - - - -
Completed and Received Credit for College Prep Courses (Annual Graduates)English Language Arts
2017-18 2.0% 0.0% - - - - - - - - - - -2016-17 0.8% 0.0% - - - - - - - - - - -
Mathematics2017-18 3.9% 0.0% - - - - - - - - - - -2016-17 1.4% 0.0% - - - - - - - - - - -
Both Subjects2017-18 0.9% 0.0% - - - - - - - - - - -2016-17 0.2% 0.0% - - - - - - - - - - -
AP/IB Results (Participation) (Grades 11-12)All Subjects
2018 25.8% 10.3% - - - - - - - - n/a - n/a2017 26.2% 12.1% - - - - - - - - n/a - n/a
English Language Arts2018 15.3% 6.5% - - - - - - - - n/a - n/a2017 15.9% 5.8% - - - - - - - - n/a - n/a
Mathematics2018 7.3% 0.8% - - - - - - - - n/a - n/a2017 7.2% 0.8% - - - - - - - - n/a - n/a
Science2018 10.8% 4.4% - - - - - - - - n/a - n/a2017 10.9% 4.2% - - - - - - - - n/a - n/a
Social Studies2018 14.5% 4.9% - - - - - - - - n/a - n/a2017 15.0% 8.8% - - - - - - - - n/a - n/a
AP/IB Results (Examinees >= Criterion) (Grades 11-12)All Subjects
2018 50.7% 48.5% - - - - - - - - n/a - n/a2017 49.1% 39.3% - - - - - - - - n/a - n/a
English Language Arts2018 42.5% 33.9% - - - - - - - - n/a - n/a2017 41.3% 38.9% - - - - - - - - n/a - n/a
Mathematics2018 52.8% 12.5% - - - - - - - - n/a - n/a
18-19 AAR Page 488

TEA | Governance and Accountability | Performance Reporting Page 147 December 2019
TEXAS EDUCATION AGENCYDistrict Name: WILLIS ISD Texas Academic Performance Report Total Students: 613
Campus Name: C C HARDY EL 2018-19 Campus CCMR-Related Indicators Grade Span: KG - 05Campus Number: 170904103 School Type: Elementary
State District CampusAfrican
American Hispanic WhiteAmerican
Indian AsianPacific
Islander
Two orMore
RacesSpecial
EdEcon
DisadvEL
(Current)2017 51.3% 14.3% - - - - - - - - n/a - n/a
Science2018 38.0% 21.4% - - - - - - - - n/a - n/a2017 38.3% 15.4% - - - - - - - - n/a - n/a
Social Studies2018 44.6% 51.1% - - - - - - - - n/a - n/a2017 41.4% 37.8% - - - - - - - - n/a - n/a
SAT/ACT Results (Annual Graduates) ***Tested
2017-18 74.6% 51.7% - - - - - - - - n/a - n/a2016-17 73.5% 53.6% - - - - - - - - n/a - n/a
At/Above Criterion2017-18 37.9% 33.0% - - - - - - - - n/a - n/a
Average SAT Score (Annual Graduates) ***All Subjects
2017-18 1036 1028 - - - - - - - - n/a - n/aEnglish Language Artsand Writing
2017-18 521 527 - - - - - - - - n/a - n/aMathematics
2017-18 515 500 - - - - - - - - n/a - n/a
Average ACT Score (Annual Graduates) ***All Subjects
2017-18 20.6 20.0 - - - - - - - - n/a - n/aEnglish Language Arts
2017-18 20.3 19.6 - - - - - - - - n/a - n/aMathematics
2017-18 20.6 19.4 - - - - - - - - n/a - n/aScience
2017-18 20.9 20.8 - - - - - - - - n/a - n/a
18-19 AAR Page 489
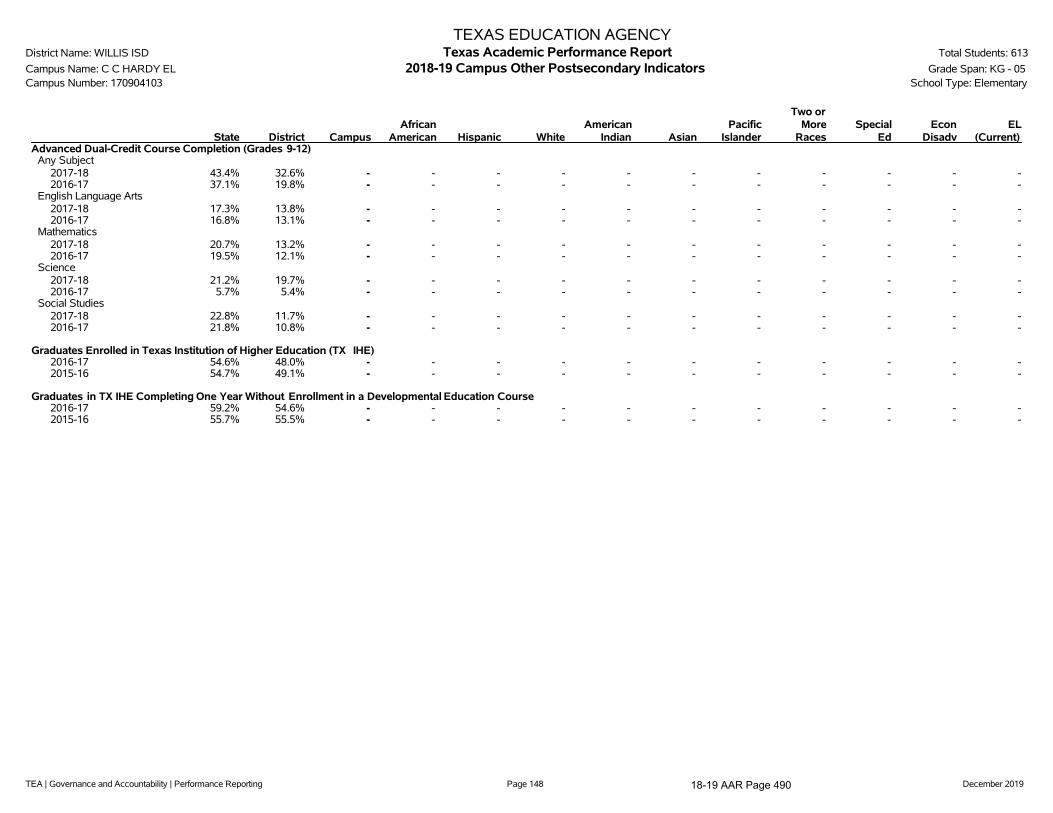
TEA | Governance and Accountability | Performance Reporting Page 148 December 2019
TEXAS EDUCATION AGENCYDistrict Name: WILLIS ISD Texas Academic Performance Report Total Students: 613
Campus Name: C C HARDY EL 2018-19 Campus Other Postsecondary Indicators Grade Span: KG - 05Campus Number: 170904103 School Type: Elementary
State District CampusAfrican
American Hispanic WhiteAmerican
Indian AsianPacific
Islander
Two orMore
RacesSpecial
EdEcon
DisadvEL
(Current)Advanced Dual-Credit Course Completion (Grades 9-12)
Any Subject2017-18 43.4% 32.6% - - - - - - - - - - -2016-17 37.1% 19.8% - - - - - - - - - - -
English Language Arts2017-18 17.3% 13.8% - - - - - - - - - - -2016-17 16.8% 13.1% - - - - - - - - - - -
Mathematics2017-18 20.7% 13.2% - - - - - - - - - - -2016-17 19.5% 12.1% - - - - - - - - - - -
Science2017-18 21.2% 19.7% - - - - - - - - - - -2016-17 5.7% 5.4% - - - - - - - - - - -
Social Studies2017-18 22.8% 11.7% - - - - - - - - - - -2016-17 21.8% 10.8% - - - - - - - - - - -
Graduates Enrolled in Texas Institution of Higher Education (TX IHE)2016-17 54.6% 48.0% - - - - - - - - - - -2015-16 54.7% 49.1% - - - - - - - - - - -
Graduates in TX IHE Completing One Year Without Enrollment in a Developmental Education Course2016-17 59.2% 54.6% - - - - - - - - - - -2015-16 55.7% 55.5% - - - - - - - - - - -
18-19 AAR Page 490

TEA | Governance and Accountability | Performance Reporting Page 149 December 2019
TEXAS EDUCATION AGENCYDistrict Name: WILLIS ISD Texas Academic Performance Report Total Students: 613
Campus Name: C C HARDY EL 2018-19 Campus Student Information Grade Span: KG - 05Campus Number: 170904103 School Type: Elementary
---------------- Campus ----------------Student Information Count Percent District State
Total Students 613 100.0% 7,469 5,416,400
Students by Grade:Early Childhood Education 0 0.0% 0.8% 0.3%Pre-Kindergarten 0 0.0% 2.3% 4.4%Kindergarten 86 14.0% 6.5% 6.9%Grade 1 104 17.0% 7.6% 7.1%Grade 2 106 17.3% 7.6% 7.2%Grade 3 102 16.6% 7.9% 7.3%Grade 4 95 15.5% 8.4% 7.6%Grade 5 120 19.6% 7.8% 7.7%Grade 6 0 0.0% 7.6% 7.7%Grade 7 0 0.0% 7.8% 7.5%Grade 8 0 0.0% 7.4% 7.5%Grade 9 0 0.0% 9.6% 8.1%Grade 10 0 0.0% 6.3% 7.4%Grade 11 0 0.0% 6.3% 6.9%Grade 12 0 0.0% 6.0% 6.5%
Ethnic Distribution:African American 61 10.0% 6.9% 12.6%Hispanic 321 52.4% 37.0% 52.6%White 201 32.8% 51.9% 27.4%American Indian 1 0.2% 0.4% 0.4%Asian 1 0.2% 0.6% 4.5%Pacific Islander 0 0.0% 0.1% 0.2%Two or More Races 28 4.6% 3.1% 2.4%
Economically Disadvantaged 480 78.3% 60.1% 60.6%Non-Educationally Disadvantaged 133 21.7% 39.9% 39.4%Section 504 Students 16 2.6% 6.1% 6.5%English Learners (EL) 198 32.3% 14.4% 19.5%Students w/ Disciplinary Placements (2017-18) 0 0.0% 1.8% 1.4%Students w/ Dyslexia 12 2.0% 2.6% 3.6%At-Risk 429 70.0% 50.8% 50.1%
Students with Disabilities by Type of Primary Disability:Total Students with Disabilities 53By Type of Primary Disability
Students with Intellectual Disabilities 13 24.5% 38.4% 42.4%Students with Physical Disabilities 26 49.1% 21.4% 21.9%Students with Autism 5 9.4% 19.0% 13.7%Students with Behavioral Disabilities 9 17.0% 19.2% 20.6%Students with Non-Categorical Early Childhood 0 0.0% 2.1% 1.4%
Mobility (2017-18):Total Mobile Students 110 19.5% 19.0% 15.4%
18-19 AAR Page 491

TEA | Governance and Accountability | Performance Reporting Page 150 December 2019
TEXAS EDUCATION AGENCYDistrict Name: WILLIS ISD Texas Academic Performance Report Total Students: 613
Campus Name: C C HARDY EL 2018-19 Campus Student Information Grade Span: KG - 05Campus Number: 170904103 School Type: Elementary
---------------- Campus ----------------Student Information Count Percent District State
By Ethnicity:African American 13 2.3%Hispanic 37 6.6%White 59 10.5%American Indian 1 0.2%Asian 0 0.0%Pacific Islander 0 0.0%Two or More Races 0 0.0%
--------Non-Special Education Rates-------- --------Special Education Rates--------Student Information Campus District State Campus District State
Retention Rates by Grade:Kindergarten 0.0% 0.4% 1.7% 33.3% 3.8% 6.2%Grade 1 1.1% 2.0% 3.1% 8.3% 5.7% 5.5%Grade 2 1.1% 1.3% 1.8% 0.0% 2.2% 2.3%Grade 3 1.1% 1.2% 1.1% 0.0% 2.1% 0.9%Grade 4 0.0% 0.0% 0.5% 0.0% 0.0% 0.5%Grade 5 0.0% 0.2% 0.5% 0.0% 1.8% 0.6%Grade 6 - 0.4% 0.4% - 0.0% 0.5%Grade 7 - 1.0% 0.6% - 0.0% 0.6%Grade 8 - 0.0% 0.4% - 0.0% 0.7%Grade 9 - 17.2% 7.2% - 34.0% 12.7%
Class Size Information Campus District State
Class Size Averages by Grade and Subject(Derived from teacher responsibility records):
Elementary:Kindergarten 21.7 20.9 18.9Grade 1 18.2 19.8 18.8Grade 2 20.6 19.1 18.7Grade 3 16.7 20.1 18.9Grade 4 18.8 20.0 19.2Grade 5 24.0 23.0 21.2Grade 6 - 19.3 20.4
Secondary:English/Language Arts - 15.9 16.6Foreign Languages - 21.8 18.9Mathematics - 16.7 17.8Science - 18.4 18.9Social Studies - 18.1 19.3
18-19 AAR Page 492
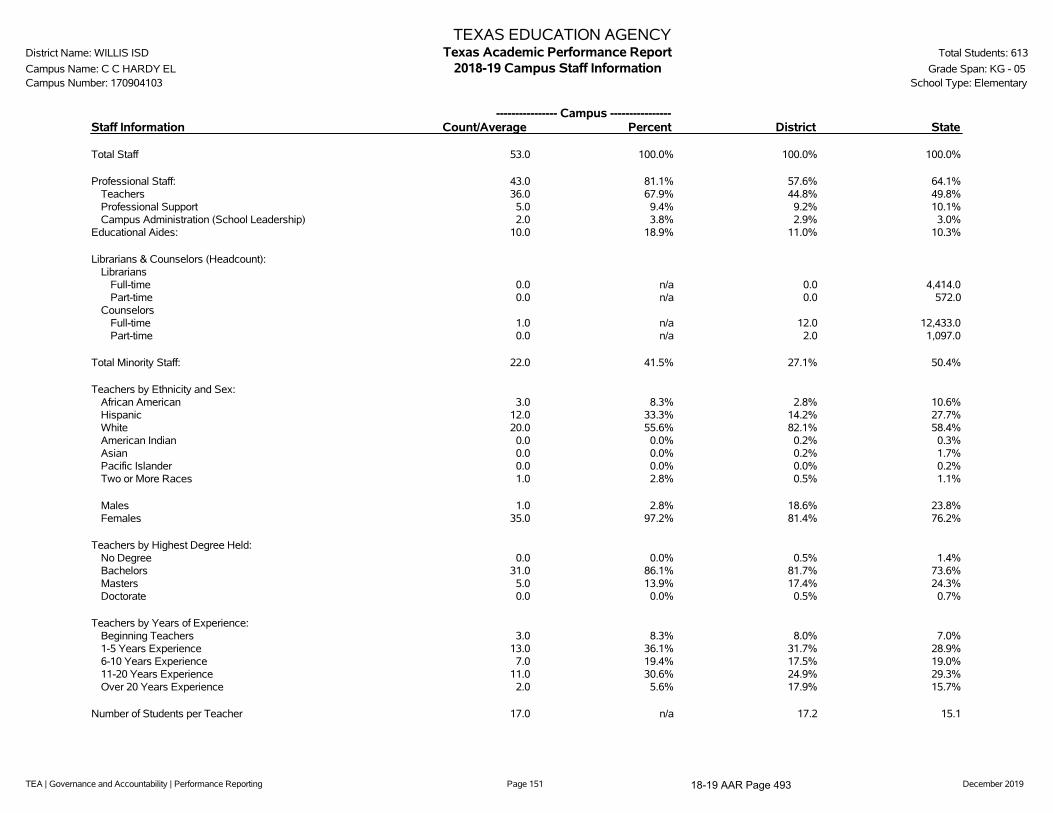
TEA | Governance and Accountability | Performance Reporting Page 151 December 2019
TEXAS EDUCATION AGENCYDistrict Name: WILLIS ISD Texas Academic Performance Report Total Students: 613
Campus Name: C C HARDY EL 2018-19 Campus Staff Information Grade Span: KG - 05Campus Number: 170904103 School Type: Elementary
---------------- Campus ----------------Staff Information Count/Average Percent District State
Total Staff 53.0 100.0% 100.0% 100.0%
Professional Staff: 43.0 81.1% 57.6% 64.1%Teachers 36.0 67.9% 44.8% 49.8%Professional Support 5.0 9.4% 9.2% 10.1%Campus Administration (School Leadership) 2.0 3.8% 2.9% 3.0%
Educational Aides: 10.0 18.9% 11.0% 10.3%
Librarians & Counselors (Headcount):Librarians
Full-time 0.0 n/a 0.0 4,414.0Part-time 0.0 n/a 0.0 572.0
CounselorsFull-time 1.0 n/a 12.0 12,433.0Part-time 0.0 n/a 2.0 1,097.0
Total Minority Staff: 22.0 41.5% 27.1% 50.4%
Teachers by Ethnicity and Sex:African American 3.0 8.3% 2.8% 10.6%Hispanic 12.0 33.3% 14.2% 27.7%White 20.0 55.6% 82.1% 58.4%American Indian 0.0 0.0% 0.2% 0.3%Asian 0.0 0.0% 0.2% 1.7%Pacific Islander 0.0 0.0% 0.0% 0.2%Two or More Races 1.0 2.8% 0.5% 1.1%
Males 1.0 2.8% 18.6% 23.8%Females 35.0 97.2% 81.4% 76.2%
Teachers by Highest Degree Held:No Degree 0.0 0.0% 0.5% 1.4%Bachelors 31.0 86.1% 81.7% 73.6%Masters 5.0 13.9% 17.4% 24.3%Doctorate 0.0 0.0% 0.5% 0.7%
Teachers by Years of Experience:Beginning Teachers 3.0 8.3% 8.0% 7.0%1-5 Years Experience 13.0 36.1% 31.7% 28.9%6-10 Years Experience 7.0 19.4% 17.5% 19.0%11-20 Years Experience 11.0 30.6% 24.9% 29.3%Over 20 Years Experience 2.0 5.6% 17.9% 15.7%
Number of Students per Teacher 17.0 n/a 17.2 15.1
18-19 AAR Page 493

TEA | Governance and Accountability | Performance Reporting Page 152 December 2019
TEXAS EDUCATION AGENCYDistrict Name: WILLIS ISD Texas Academic Performance Report Total Students: 613
Campus Name: C C HARDY EL 2018-19 Campus Staff Information Grade Span: KG - 05Campus Number: 170904103 School Type: Elementary
Staff Information Campus District State
Experience of Campus Leadership:Average Years Experience of Principals 2.0 2.8 6.3Average Years Experience of Principals with District 2.0 2.8 5.4Average Years Experience of Assistant Principals 5.0 6.1 5.3Average Years Experience of Assistant Principals with District 5.0 4.2 4.7
Average Years Experience of Teachers: 8.4 10.7 11.1Average Years Experience of Teachers with District: 4.9 6.5 7.2
Average Teacher Salary by Years of Experience (regular duties only):Beginning Teachers $48,002 $45,854 $47,2181-5 Years Experience $49,386 $50,779 $50,4086-10 Years Experience $53,066 $52,839 $52,78611-20 Years Experience $57,185 $57,036 $56,041Over 20 Years Experience $63,680 $63,917 $62,039
Average Actual Salaries (regular duties only):Teachers $53,164 $54,658 $54,122Professional Support $63,358 $65,409 $64,069Campus Administration (School Leadership) $73,196 $78,467 $78,947
Instructional Staff Percent: n/a 60.4% 64.5%
Contracted Instructional Staff (not incl. above): 0.7 1.5 6,043.6
18-19 AAR Page 494

TEA | Governance and Accountability | Performance Reporting Page 153 December 2019
TEXAS EDUCATION AGENCYDistrict Name: WILLIS ISD Texas Academic Performance Report Total Students: 613
Campus Name: C C HARDY EL 2018-19 Campus Staff Information Grade Span: KG - 05Campus Number: 170904103 School Type: Elementary
---------------- Campus ----------------Program Information Count Percent District State
Student Enrollment by Program:Bilingual/ESL Education 191 31.2% 13.6% 19.7%Career & Technical Education 0 0.0% 21.5% 26.3%Gifted & Talented Education 9 1.5% 5.4% 8.1%Special Education 53 8.6% 8.4% 9.6%
Teachers by Program (population served):Bilingual/ESL Education 3.0 8.3% 2.8% 6.4%Career & Technical Education 0.0 0.0% 4.5% 4.9%Compensatory Education 0.0 0.0% 0.0% 2.7%Gifted & Talented Education 0.0 0.0% 0.0% 2.0%Regular Education 32.0 88.9% 76.9% 71.4%Special Education 1.0 2.8% 8.5% 9.1%Other 0.0 0.0% 7.3% 3.6%
' '̂ Indicates that rates for reading and mathematics are based on the cumulative results from the first and second administrations of STAAR.'*' Indicates results are masked due to small numbers to protect student confidentiality.'**' When only one student disability group is masked, then the second smallest student disability group is masked regardless of size.'***' Due to changes in the evaluation of SAT/ACT results (for 2017-18 the best result was used, rather than the most recent), 2016-17 SAT/ACT results are not
comparable and, where applicable, are not shown.'-' Indicates there are no students in the group.'n/a' Indicates data reporting is not applicable for this group.'?' Indicates that the data for this item were statistically improbable or were reported outside a reasonable range.
Link to: PEIMS Financial Standard Reports 2017-18 Financial Actual Report
18-19 AAR Page 495
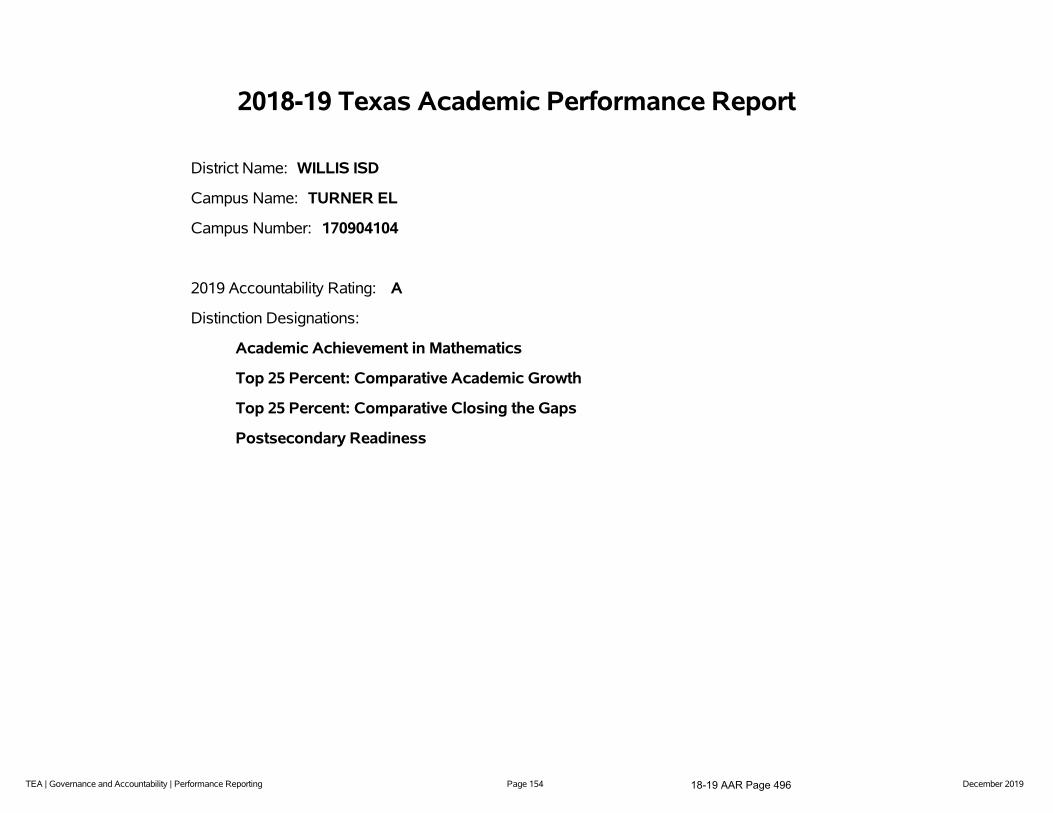
TEA | Governance and Accountability | Performance Reporting Page 154 December 2019
2018-19 Texas Academic Performance Report
District Name: WILLIS ISD
Campus Name: TURNER EL
Campus Number: 170904104
2019 Accountability Rating: A
Distinction Designations:
Academic Achievement in Mathematics
Top 25 Percent: Comparative Academic Growth
Top 25 Percent: Comparative Closing the Gaps
Postsecondary Readiness
18-19 AAR Page 496

TEA | Governance and Accountability | Performance Reporting Page 155 December 2019
This page is intentionally blank.
18-19 AAR Page 497
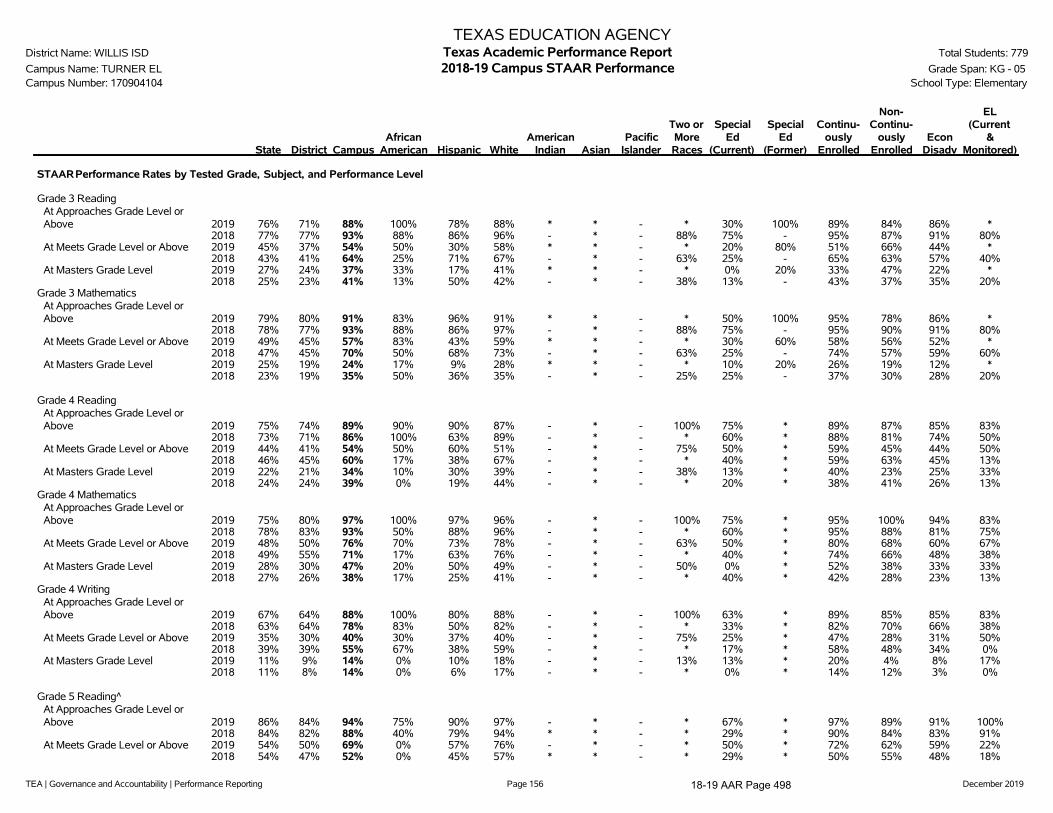
TEA | Governance and Accountability | Performance Reporting Page 156 December 2019
TEXAS EDUCATION AGENCYDistrict Name: WILLIS ISD Texas Academic Performance Report Total Students: 779
Campus Name: TURNER EL 2018-19 Campus STAAR Performance Grade Span: KG - 05Campus Number: 170904104 School Type: Elementary
State District CampusAfrican
American Hispanic WhiteAmerican
Indian AsianPacific
Islander
Two orMoreRaces
SpecialEd
(Current)
SpecialEd
(Former)
Continu-ously
Enrolled
Non-Continu-
ouslyEnrolled
EconDisadv
EL(Current
&Monitored)
STAARPerformance Rates by Tested Grade, Subject, and Performance Level
Grade 3 ReadingAt Approaches Grade Level orAbove 2019 76% 71% 88% 100% 78% 88% * * - * 30% 100% 89% 84% 86% *
2018 77% 77% 93% 88% 86% 96% - * - 88% 75% - 95% 87% 91% 80%At Meets Grade Level or Above 2019 45% 37% 54% 50% 30% 58% * * - * 20% 80% 51% 66% 44% *
2018 43% 41% 64% 25% 71% 67% - * - 63% 25% - 65% 63% 57% 40%At Masters Grade Level 2019 27% 24% 37% 33% 17% 41% * * - * 0% 20% 33% 47% 22% *
2018 25% 23% 41% 13% 50% 42% - * - 38% 13% - 43% 37% 35% 20%Grade 3 Mathematics
At Approaches Grade Level orAbove 2019 79% 80% 91% 83% 96% 91% * * - * 50% 100% 95% 78% 86% *
2018 78% 77% 93% 88% 86% 97% - * - 88% 75% - 95% 90% 91% 80%At Meets Grade Level or Above 2019 49% 45% 57% 83% 43% 59% * * - * 30% 60% 58% 56% 52% *
2018 47% 45% 70% 50% 68% 73% - * - 63% 25% - 74% 57% 59% 60%At Masters Grade Level 2019 25% 19% 24% 17% 9% 28% * * - * 10% 20% 26% 19% 12% *
2018 23% 19% 35% 50% 36% 35% - * - 25% 25% - 37% 30% 28% 20%
Grade 4 ReadingAt Approaches Grade Level orAbove 2019 75% 74% 89% 90% 90% 87% - * - 100% 75% * 89% 87% 85% 83%
2018 73% 71% 86% 100% 63% 89% - * - * 60% * 88% 81% 74% 50%At Meets Grade Level or Above 2019 44% 41% 54% 50% 60% 51% - * - 75% 50% * 59% 45% 44% 50%
2018 46% 45% 60% 17% 38% 67% - * - * 40% * 59% 63% 45% 13%At Masters Grade Level 2019 22% 21% 34% 10% 30% 39% - * - 38% 13% * 40% 23% 25% 33%
2018 24% 24% 39% 0% 19% 44% - * - * 20% * 38% 41% 26% 13%Grade 4 Mathematics
At Approaches Grade Level orAbove 2019 75% 80% 97% 100% 97% 96% - * - 100% 75% * 95% 100% 94% 83%
2018 78% 83% 93% 50% 88% 96% - * - * 60% * 95% 88% 81% 75%At Meets Grade Level or Above 2019 48% 50% 76% 70% 73% 78% - * - 63% 50% * 80% 68% 60% 67%
2018 49% 55% 71% 17% 63% 76% - * - * 40% * 74% 66% 48% 38%At Masters Grade Level 2019 28% 30% 47% 20% 50% 49% - * - 50% 0% * 52% 38% 33% 33%
2018 27% 26% 38% 17% 25% 41% - * - * 40% * 42% 28% 23% 13%Grade 4 Writing
At Approaches Grade Level orAbove 2019 67% 64% 88% 100% 80% 88% - * - 100% 63% * 89% 85% 85% 83%
2018 63% 64% 78% 83% 50% 82% - * - * 33% * 82% 70% 66% 38%At Meets Grade Level or Above 2019 35% 30% 40% 30% 37% 40% - * - 75% 25% * 47% 28% 31% 50%
2018 39% 39% 55% 67% 38% 59% - * - * 17% * 58% 48% 34% 0%At Masters Grade Level 2019 11% 9% 14% 0% 10% 18% - * - 13% 13% * 20% 4% 8% 17%
2018 11% 8% 14% 0% 6% 17% - * - * 0% * 14% 12% 3% 0%
Grade 5 Reading^At Approaches Grade Level orAbove 2019 86% 84% 94% 75% 90% 97% - * - * 67% * 97% 89% 91% 100%
2018 84% 82% 88% 40% 79% 94% * * - * 29% * 90% 84% 83% 91%At Meets Grade Level or Above 2019 54% 50% 69% 0% 57% 76% - * - * 50% * 72% 62% 59% 22%
2018 54% 47% 52% 0% 45% 57% * * - * 29% * 50% 55% 48% 18%
18-19 AAR Page 498

TEA | Governance and Accountability | Performance Reporting Page 157 December 2019
TEXAS EDUCATION AGENCYDistrict Name: WILLIS ISD Texas Academic Performance Report Total Students: 779
Campus Name: TURNER EL 2018-19 Campus STAAR Performance Grade Span: KG - 05Campus Number: 170904104 School Type: Elementary
State District CampusAfrican
American Hispanic WhiteAmerican
Indian AsianPacific
Islander
Two orMoreRaces
SpecialEd
(Current)
SpecialEd
(Former)
Continu-ously
Enrolled
Non-Continu-
ouslyEnrolled
EconDisadv
EL(Current
&Monitored)
At Masters Grade Level 2019 29% 25% 39% 0% 29% 43% - * - * 33% * 43% 31% 21% 22%2018 26% 20% 22% 0% 12% 28% * * - * 0% * 22% 21% 10% 0%
Grade 5 Mathematics^At Approaches Grade Level orAbove 2019 90% 93% 98% 100% 90% 100% - * - * 67% * 100% 96% 97% 100%
2018 91% 92% 99% 100% 97% 100% * * - * 86% * 100% 97% 98% 100%At Meets Grade Level or Above 2019 58% 66% 84% 75% 81% 85% - * - * 50% * 86% 80% 69% 89%
2018 58% 64% 84% 80% 82% 85% * * - * 57% * 88% 76% 88% 73%At Masters Grade Level 2019 36% 44% 68% 38% 71% 70% - * - * 33% * 71% 63% 49% 78%
2018 30% 32% 54% 60% 52% 53% * * - * 29% * 59% 45% 52% 45%Grade 5 Science
At Approaches Grade Level orAbove 2019 75% 72% 83% 63% 57% 91% - * - * 33% * 86% 80% 68% 56%
2018 76% 72% 84% 40% 70% 93% * * - * 71% * 87% 79% 77% 64%At Meets Grade Level or Above 2019 49% 43% 55% 0% 43% 63% - * - * 33% * 62% 44% 41% 22%
2018 41% 33% 43% 0% 27% 50% * * - * 29% * 41% 47% 35% 9%At Masters Grade Level 2019 24% 18% 27% 0% 24% 28% - * - * 33% * 32% 20% 12% 22%
2018 17% 12% 13% 0% 9% 17% * * - * 14% * 10% 18% 10% 0%
All Grades All SubjectsAt Approaches Grade Level orAbove 2019 78% 76% 91% 89% 85% 92% * 100% - 100% 56% 86% 93% 88% 87% 86%
2018 77% 75% 89% 76% 79% 93% * 100% - 93% 62% 94% 92% 85% 84% 73%At Meets Grade Level or Above 2019 50% 45% 61% 44% 53% 64% * 88% - 66% 37% 57% 63% 56% 49% 45%
2018 48% 45% 63% 33% 55% 67% * 71% - 71% 32% 61% 64% 59% 53% 30%At Masters Grade Level 2019 24% 19% 36% 14% 30% 40% * 75% - 26% 15% 29% 39% 30% 22% 33%
2018 22% 18% 32% 18% 28% 35% * 41% - 32% 17% 39% 33% 29% 24% 13%All Grades ELA/Reading
At Approaches Grade Level orAbove 2019 75% 72% 90% 88% 86% 91% * 100% - 100% 54% 91% 92% 87% 87% 94%
2018 74% 72% 89% 79% 78% 93% * 100% - 92% 55% 100% 91% 84% 84% 75%At Meets Grade Level or Above 2019 48% 43% 59% 33% 50% 62% * 83% - 77% 38% 64% 60% 56% 48% 29%
2018 46% 41% 59% 16% 53% 64% * 50% - 67% 30% 50% 58% 60% 50% 21%At Masters Grade Level 2019 21% 17% 36% 13% 26% 41% * 67% - 31% 13% 27% 38% 32% 23% 24%
2018 19% 16% 34% 5% 27% 38% * 50% - 33% 10% 50% 35% 32% 23% 8%All Grades Mathematics
At Approaches Grade Level orAbove 2019 82% 81% 95% 96% 95% 96% * 100% - 100% 63% 91% 97% 93% 92% 94%
2018 81% 81% 95% 79% 91% 98% * 100% - 92% 75% 100% 96% 92% 91% 88%At Meets Grade Level or Above 2019 52% 49% 72% 75% 66% 74% * 100% - 54% 42% 64% 73% 70% 59% 71%
2018 50% 49% 75% 47% 73% 78% * 100% - 75% 40% 67% 79% 67% 67% 58%At Masters Grade Level 2019 26% 23% 46% 25% 43% 49% * 83% - 31% 13% 36% 48% 42% 29% 53%
2018 24% 21% 42% 42% 40% 43% * 67% - 42% 30% 50% 45% 35% 36% 29%All Grades Writing
At Approaches Grade Level orAbove 2019 68% 64% 88% 100% 80% 88% - * - 100% 63% * 89% 85% 85% 83%
2018 66% 65% 78% 83% 50% 82% - * - * 33% * 82% 70% 66% 38%At Meets Grade Level or Above 2019 38% 31% 40% 30% 37% 40% - * - 75% 25% * 47% 28% 31% 50%
2018 41% 38% 55% 67% 38% 59% - * - * 17% * 58% 48% 34% 0%At Masters Grade Level 2019 14% 10% 14% 0% 10% 18% - * - 13% 13% * 20% 4% 8% 17%
2018 13% 8% 14% 0% 6% 17% - * - * 0% * 14% 12% 3% 0%
18-19 AAR Page 499

TEA | Governance and Accountability | Performance Reporting Page 158 December 2019
TEXAS EDUCATION AGENCYDistrict Name: WILLIS ISD Texas Academic Performance Report Total Students: 779
Campus Name: TURNER EL 2018-19 Campus STAAR Performance Grade Span: KG - 05Campus Number: 170904104 School Type: Elementary
State District CampusAfrican
American Hispanic WhiteAmerican
Indian AsianPacific
Islander
Two orMoreRaces
SpecialEd
(Current)
SpecialEd
(Former)
Continu-ously
Enrolled
Non-Continu-
ouslyEnrolled
EconDisadv
EL(Current
&Monitored)
All Grades ScienceAt Approaches Grade Level orAbove 2019 81% 81% 83% 63% 57% 91% - * - * 33% * 86% 80% 68% 56%
2018 80% 77% 84% 40% 70% 93% * * - * 71% * 87% 79% 77% 64%At Meets Grade Level or Above 2019 54% 51% 55% 0% 43% 63% - * - * 33% * 62% 44% 41% 22%
2018 51% 46% 43% 0% 27% 50% * * - * 29% * 41% 47% 35% 9%At Masters Grade Level 2019 25% 20% 27% 0% 24% 28% - * - * 33% * 32% 20% 12% 22%
2018 23% 18% 13% 0% 9% 17% * * - * 14% * 10% 18% 10% 0%
18-19 AAR Page 500

TEA | Governance and Accountability | Performance Reporting Page 159 December 2019
TEXAS EDUCATION AGENCYDistrict Name: WILLIS ISD Texas Academic Performance Report Total Students: 779
Campus Name: TURNER EL 2018-19 Campus Progress Grade Span: KG - 05Campus Number: 170904104 School Type: Elementary
State District CampusAfrican
American Hispanic WhiteAmerican
Indian AsianPacific
Islander
Two orMore
Races
SpecialEd
(Current)
SpecialEd
(Former)
Continu-ously
Enrolled
Non-Continu-
ouslyEnrolled
EconDisadv
EL(Current
&Monitored)
School Progress Domain - Academic Growth Score by Grade and Subject
Grade 4 ELA/Reading 2019 61 59 59 45 52 63 - * - 63 50 * 59 57 52 752018 63 67 69 67 69 69 - * - * 80 * 67 73 73 69
Grade 4 Mathematics 2019 65 71 74 70 80 74 - * - 63 38 * 72 80 72 832018 65 70 66 17 78 66 - * - * 100 * 67 63 69 75
Grade 5 ELA/Reading 2019 81 80 84 94 88 83 - * - * 83 * 86 81 82 1002018 80 79 79 80 80 81 - * - * 57 * 79 79 83 100
Grade 5 Mathematics 2019 83 87 94 100 98 94 - * - * 100 * 92 98 94 1002018 81 80 90 100 88 90 - * - * 86 * 90 91 89 82
All Grades Both Subjects 2019 69 66 78 75 77 79 - 94 - 56 64 83 77 79 73 912018 69 69 76 64 81 76 - 90 - 63 79 79 76 77 80 83
All Grades ELA/Reading 2019 68 66 71 67 66 74 - * - 56 64 83 72 69 65 892018 69 68 74 73 77 74 - 80 - * 67 92 73 76 79 87
All Grades Mathematics 2019 70 66 84 83 87 84 - * - 56 64 83 81 89 82 932018 70 69 79 55 85 77 - 100 - * 92 67 79 78 81 79
18-19 AAR Page 501

TEA | Governance and Accountability | Performance Reporting Page 160 December 2019
TEXAS EDUCATION AGENCYDistrict Name: WILLIS ISD Texas Academic Performance Report Total Students: 779
Campus Name: TURNER EL 2018-19 Campus Prior Year and Student Success Initiative Grade Span: KG - 05Campus Number: 170904104 School Type: Elementary
State District CampusAfrican
American Hispanic WhiteAmerican
Indian AsianPacific
Islander
Two orMore
RacesSpecial
EdEcon
DisadvEL
(Current)
Progress of Prior-Year Non-Proficient Students
Sum of Grades 4-8
Reading 2019 41% 39% 56% * 64% 55% - - - - * 50% *2018 38% 37% 46% * * 68% - - - - * 33% *
Mathematics 2019 45% 48% 69% 100% 50% 60% - - - - 20% 75% *2018 47% 48% 79% * 67% 89% - - - - * 71% *
Student Success Initiative
Grade 5 ReadingStudents Meeting Approaches Grade Level on First STAARAdministration
2019 78% 76% 88% 63% 81% 92% - * - * 67% 74% 60%Students Requiring Accelerated Instruction
2019 22% 24% 12% 38% 19% 8% - * - * 33% 26% 40%STAARCumulativeMet Standard
2019 86% 84% 94% 75% 90% 97% - * - * 67% 91% 100%STAARNon-Proficient Students Promoted by Grade Placement Committee
2018 97% 100% 100% * 100% * - - - - 100% 100% -
Grade 5 MathematicsStudents Meeting Approaches Grade Level on First STAARAdministration
2019 83% 87% 98% 100% 90% 99% - * - * 67% 97% 100%Students Requiring Accelerated Instruction
2019 17% 13% 2% 0% 10% 1% - * - * 33% 3% 0%STAARCumulativeMet Standard
2019 90% 93% 98% 100% 90% 100% - * - * 67% 97% 100%STAARNon-Proficient Students Promoted by Grade Placement Committee
2018 97% 100% * - * * - - - - * * -
18-19 AAR Page 502
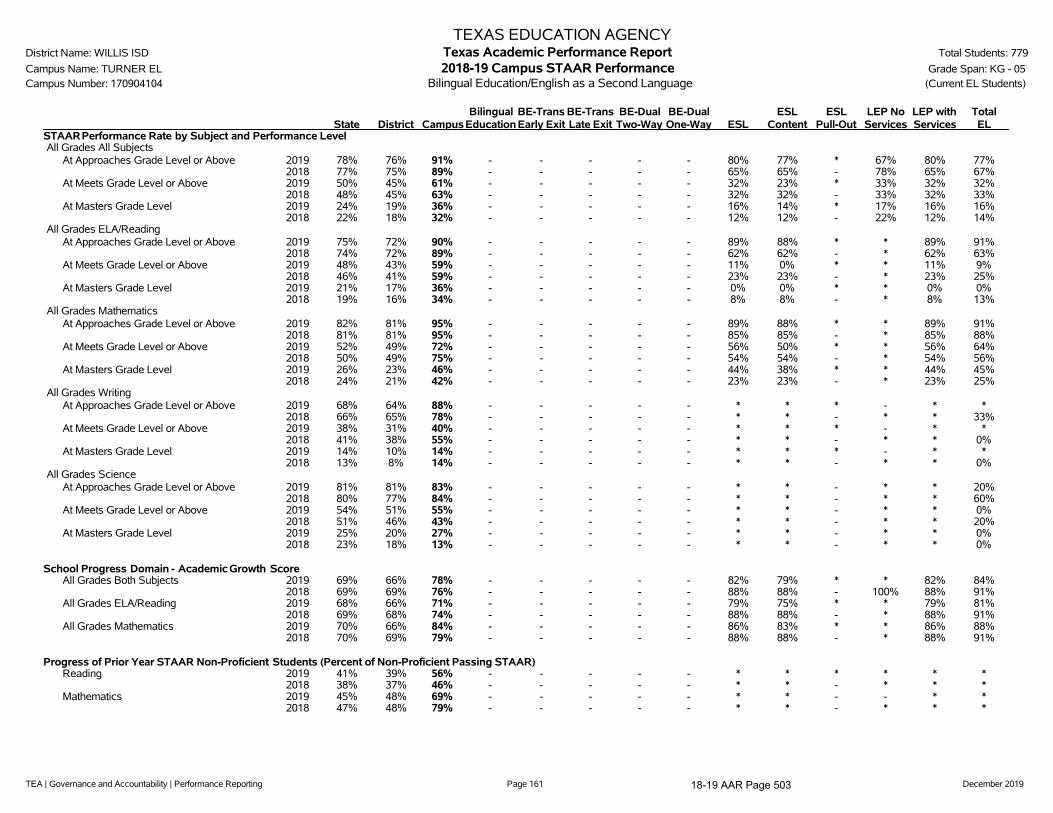
TEA | Governance and Accountability | Performance Reporting Page 161 December 2019
TEXAS EDUCATION AGENCYDistrict Name: WILLIS ISD Texas Academic Performance Report Total Students: 779
Campus Name: TURNER EL 2018-19 Campus STAAR Performance Grade Span: KG - 05Campus Number: 170904104 Bilingual Education/English as a Second Language (Current EL Students)
State District CampusBilingual
EducationBE-TransEarly Exit
BE-TransLate Exit
BE-DualTwo-Way
BE-DualOne-Way ESL
ESLContent
ESLPull-Out
LEP NoServices
LEP withServices
TotalEL
STAARPerformance Rate by Subject and Performance LevelAll Grades All Subjects
At Approaches Grade Level or Above 2019 78% 76% 91% - - - - - 80% 77% * 67% 80% 77%2018 77% 75% 89% - - - - - 65% 65% - 78% 65% 67%
At Meets Grade Level or Above 2019 50% 45% 61% - - - - - 32% 23% * 33% 32% 32%2018 48% 45% 63% - - - - - 32% 32% - 33% 32% 33%
At Masters Grade Level 2019 24% 19% 36% - - - - - 16% 14% * 17% 16% 16%2018 22% 18% 32% - - - - - 12% 12% - 22% 12% 14%
All Grades ELA/ReadingAt Approaches Grade Level or Above 2019 75% 72% 90% - - - - - 89% 88% * * 89% 91%
2018 74% 72% 89% - - - - - 62% 62% - * 62% 63%At Meets Grade Level or Above 2019 48% 43% 59% - - - - - 11% 0% * * 11% 9%
2018 46% 41% 59% - - - - - 23% 23% - * 23% 25%At Masters Grade Level 2019 21% 17% 36% - - - - - 0% 0% * * 0% 0%
2018 19% 16% 34% - - - - - 8% 8% - * 8% 13%All Grades Mathematics
At Approaches Grade Level or Above 2019 82% 81% 95% - - - - - 89% 88% * * 89% 91%2018 81% 81% 95% - - - - - 85% 85% - * 85% 88%
At Meets Grade Level or Above 2019 52% 49% 72% - - - - - 56% 50% * * 56% 64%2018 50% 49% 75% - - - - - 54% 54% - * 54% 56%
At Masters Grade Level 2019 26% 23% 46% - - - - - 44% 38% * * 44% 45%2018 24% 21% 42% - - - - - 23% 23% - * 23% 25%
All Grades WritingAt Approaches Grade Level or Above 2019 68% 64% 88% - - - - - * * * - * *
2018 66% 65% 78% - - - - - * * - * * 33%At Meets Grade Level or Above 2019 38% 31% 40% - - - - - * * * - * *
2018 41% 38% 55% - - - - - * * - * * 0%At Masters Grade Level 2019 14% 10% 14% - - - - - * * * - * *
2018 13% 8% 14% - - - - - * * - * * 0%All Grades Science
At Approaches Grade Level or Above 2019 81% 81% 83% - - - - - * * - * * 20%2018 80% 77% 84% - - - - - * * - * * 60%
At Meets Grade Level or Above 2019 54% 51% 55% - - - - - * * - * * 0%2018 51% 46% 43% - - - - - * * - * * 20%
At Masters Grade Level 2019 25% 20% 27% - - - - - * * - * * 0%2018 23% 18% 13% - - - - - * * - * * 0%
School Progress Domain - Academic Growth ScoreAll Grades Both Subjects 2019 69% 66% 78% - - - - - 82% 79% * * 82% 84%
2018 69% 69% 76% - - - - - 88% 88% - 100% 88% 91%All Grades ELA/Reading 2019 68% 66% 71% - - - - - 79% 75% * * 79% 81%
2018 69% 68% 74% - - - - - 88% 88% - * 88% 91%All Grades Mathematics 2019 70% 66% 84% - - - - - 86% 83% * * 86% 88%
2018 70% 69% 79% - - - - - 88% 88% - * 88% 91%
Progress of Prior Year STAAR Non-Proficient Students (Percent of Non-Proficient Passing STAAR)Reading 2019 41% 39% 56% - - - - - * * * * * *
2018 38% 37% 46% - - - - - * * - * * *Mathematics 2019 45% 48% 69% - - - - - * * - - * *
2018 47% 48% 79% - - - - - * * - * * *
18-19 AAR Page 503
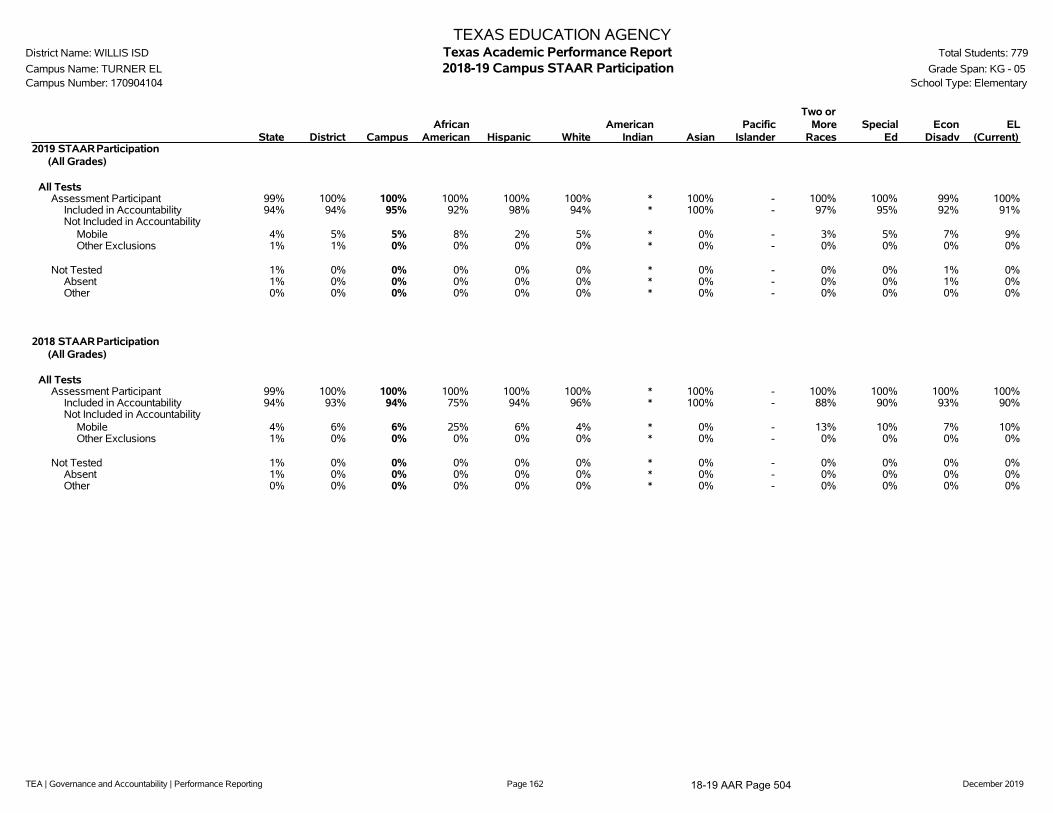
TEA | Governance and Accountability | Performance Reporting Page 162 December 2019
TEXAS EDUCATION AGENCYDistrict Name: WILLIS ISD Texas Academic Performance Report Total Students: 779
Campus Name: TURNER EL 2018-19 Campus STAAR Participation Grade Span: KG - 05Campus Number: 170904104 School Type: Elementary
State District CampusAfrican
American Hispanic WhiteAmerican
Indian AsianPacific
Islander
Two orMore
RacesSpecial
EdEcon
DisadvEL
(Current)2019 STAARParticipation
(All Grades)
All TestsAssessment Participant 99% 100% 100% 100% 100% 100% * 100% - 100% 100% 99% 100%
Included in Accountability 94% 94% 95% 92% 98% 94% * 100% - 97% 95% 92% 91%Not Included in Accountability
Mobile 4% 5% 5% 8% 2% 5% * 0% - 3% 5% 7% 9%Other Exclusions 1% 1% 0% 0% 0% 0% * 0% - 0% 0% 0% 0%
Not Tested 1% 0% 0% 0% 0% 0% * 0% - 0% 0% 1% 0%Absent 1% 0% 0% 0% 0% 0% * 0% - 0% 0% 1% 0%Other 0% 0% 0% 0% 0% 0% * 0% - 0% 0% 0% 0%
2018 STAARParticipation(All Grades)
All TestsAssessment Participant 99% 100% 100% 100% 100% 100% * 100% - 100% 100% 100% 100%
Included in Accountability 94% 93% 94% 75% 94% 96% * 100% - 88% 90% 93% 90%Not Included in Accountability
Mobile 4% 6% 6% 25% 6% 4% * 0% - 13% 10% 7% 10%Other Exclusions 1% 0% 0% 0% 0% 0% * 0% - 0% 0% 0% 0%
Not Tested 1% 0% 0% 0% 0% 0% * 0% - 0% 0% 0% 0%Absent 1% 0% 0% 0% 0% 0% * 0% - 0% 0% 0% 0%Other 0% 0% 0% 0% 0% 0% * 0% - 0% 0% 0% 0%
18-19 AAR Page 504
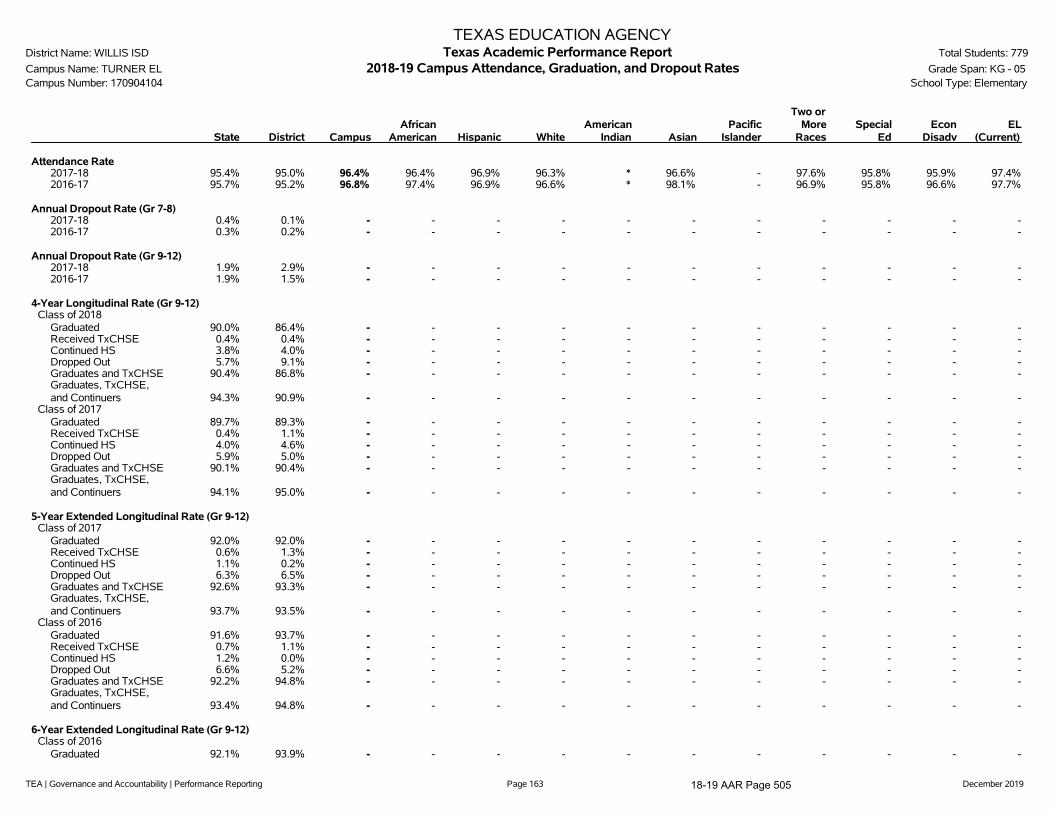
TEA | Governance and Accountability | Performance Reporting Page 163 December 2019
TEXAS EDUCATION AGENCYDistrict Name: WILLIS ISD Texas Academic Performance Report Total Students: 779
Campus Name: TURNER EL 2018-19 Campus Attendance, Graduation, and Dropout Rates Grade Span: KG - 05Campus Number: 170904104 School Type: Elementary
State District CampusAfrican
American Hispanic WhiteAmerican
Indian AsianPacific
Islander
Two orMore
RacesSpecial
EdEcon
DisadvEL
(Current)
Attendance Rate2017-18 95.4% 95.0% 96.4% 96.4% 96.9% 96.3% * 96.6% - 97.6% 95.8% 95.9% 97.4%2016-17 95.7% 95.2% 96.8% 97.4% 96.9% 96.6% * 98.1% - 96.9% 95.8% 96.6% 97.7%
Annual Dropout Rate (Gr 7-8)2017-18 0.4% 0.1% - - - - - - - - - - -2016-17 0.3% 0.2% - - - - - - - - - - -
Annual Dropout Rate (Gr 9-12)2017-18 1.9% 2.9% - - - - - - - - - - -2016-17 1.9% 1.5% - - - - - - - - - - -
4-Year Longitudinal Rate (Gr 9-12)Class of 2018
Graduated 90.0% 86.4% - - - - - - - - - - -Received TxCHSE 0.4% 0.4% - - - - - - - - - - -Continued HS 3.8% 4.0% - - - - - - - - - - -Dropped Out 5.7% 9.1% - - - - - - - - - - -Graduates and TxCHSE 90.4% 86.8% - - - - - - - - - - -Graduates, TxCHSE,and Continuers 94.3% 90.9% - - - - - - - - - - -
Class of 2017Graduated 89.7% 89.3% - - - - - - - - - - -Received TxCHSE 0.4% 1.1% - - - - - - - - - - -Continued HS 4.0% 4.6% - - - - - - - - - - -Dropped Out 5.9% 5.0% - - - - - - - - - - -Graduates and TxCHSE 90.1% 90.4% - - - - - - - - - - -Graduates, TxCHSE,and Continuers 94.1% 95.0% - - - - - - - - - - -
5-Year Extended Longitudinal Rate (Gr 9-12)Class of 2017
Graduated 92.0% 92.0% - - - - - - - - - - -Received TxCHSE 0.6% 1.3% - - - - - - - - - - -Continued HS 1.1% 0.2% - - - - - - - - - - -Dropped Out 6.3% 6.5% - - - - - - - - - - -Graduates and TxCHSE 92.6% 93.3% - - - - - - - - - - -Graduates, TxCHSE,and Continuers 93.7% 93.5% - - - - - - - - - - -
Class of 2016Graduated 91.6% 93.7% - - - - - - - - - - -Received TxCHSE 0.7% 1.1% - - - - - - - - - - -Continued HS 1.2% 0.0% - - - - - - - - - - -Dropped Out 6.6% 5.2% - - - - - - - - - - -Graduates and TxCHSE 92.2% 94.8% - - - - - - - - - - -Graduates, TxCHSE,and Continuers 93.4% 94.8% - - - - - - - - - - -
6-Year Extended Longitudinal Rate (Gr 9-12)Class of 2016
Graduated 92.1% 93.9% - - - - - - - - - - -
18-19 AAR Page 505

TEA | Governance and Accountability | Performance Reporting Page 164 December 2019
TEXAS EDUCATION AGENCYDistrict Name: WILLIS ISD Texas Academic Performance Report Total Students: 779
Campus Name: TURNER EL 2018-19 Campus Attendance, Graduation, and Dropout Rates Grade Span: KG - 05Campus Number: 170904104 School Type: Elementary
State District CampusAfrican
American Hispanic WhiteAmerican
Indian AsianPacific
Islander
Two orMore
RacesSpecial
EdEcon
DisadvEL
(Current)Received TxCHSE 0.8% 1.1% - - - - - - - - - - -Continued HS 0.5% 0.0% - - - - - - - - - - -Dropped Out 6.6% 5.0% - - - - - - - - - - -Graduates and TxCHSE 92.9% 95.0% - - - - - - - - - - -Graduates, TxCHSE,and Continuers 93.4% 95.0% - - - - - - - - - - -
Class of 2015Graduated 91.8% 93.3% - - - - - - - - - - -Received TxCHSE 1.0% 1.4% - - - - - - - - - - -Continued HS 0.6% 0.2% - - - - - - - - - - -Dropped Out 6.7% 5.0% - - - - - - - - - - -Graduates and TxCHSE 92.8% 94.7% - - - - - - - - - - -Graduates, TxCHSE,and Continuers 93.3% 95.0% - - - - - - - - - - -
4-Year Federal Graduation Rate Without Exclusions (Gr 9-12)Class of 2018 90.0% 85.5% - - - - - - - - - - -Class of 2017 89.7% 88.6% - - - - - - - - - - -
RHSP/DAP Graduates (Longitudinal Rate)Class of 2018 68.5% * - - - - - - - - - - -Class of 2017 88.5% 89.1% - - - - - - - - - - -
FHSP-E Graduates (Longitudinal Rate)Class of 2018 5.0% 2.0% - - - - - - - - - - -Class of 2017 6.0% 0.0% - - - - - - - - - - -
FHSP-DLA Graduates (Longitudinal Rate)Class of 2018 82.0% 87.4% - - - - - - - - - - -Class of 2017 60.8% 14.3% - - - - - - - - - - -
RHSP/DAP/FHSP-E/FHSP-DLA Graduates (Longitudinal Rate)Class of 2018 86.8% 89.2% - - - - - - - - - - -Class of 2017 85.9% 87.8% - - - - - - - - - - -
RHSP/DAP Graduates (Annual Rate)2017-18 37.7% 37.5% - - - - - - - - - - -2016-17 87.2% 87.0% - - - - - - - - - - -
FHSP-E Graduates (Annual Rate)2017-18 4.9% 1.7% - - - - - - - - - - -2016-17 7.2% 11.1% - - - - - - - - - - -
FHSP-DLA Graduates (Annual Rate)2017-18 81.5% 87.2% - - - - - - - - - - -2016-17 56.5% 22.2% - - - - - - - - - - -
RHSP/DAP/FHSP-E/FHSP-DLA Graduates (Annual Rate)2017-18 85.1% 87.9% - - - - - - - - - - -2016-17 84.0% 85.9% - - - - - - - - - - -
18-19 AAR Page 506

TEA | Governance and Accountability | Performance Reporting Page 165 December 2019
TEXAS EDUCATION AGENCYDistrict Name: WILLIS ISD Texas Academic Performance Report Total Students: 779
Campus Name: TURNER EL 2018-19 Campus Graduation Profile Grade Span: KG - 05Campus Number: 170904104 School Type: Elementary
CampusCount
CampusPercent
DistrictCount
StateCount
Graduates (2017-18 Annual Graduates)Total Graduates - - 422 347,893
By Ethnicity:African American - - 31 43,502Hispanic - - 128 173,272White - - 247 107,052American Indian - - 3 1,226Asian - - 2 15,589Pacific Islander - - 2 528Two or More Races - - 9 6,724
By Graduation Type:Minimum H.S. Program - - 5 5,855Recommended H.S. Program/Distinguished Achievement Program - - 3 3,538Foundation H.S. Program (No Endorsement) - - 46 49,432Foundation H.S. Program (Endorsement) - - 7 16,542Foundation H.S. Program (DLA) - - 361 272,526
Special Education Graduates - - 27 25,962Economically Disadvantaged Graduates - - 181 166,956LEP Graduates - - 16 21,359At-Risk Graduates - - 137 144,805
18-19 AAR Page 507
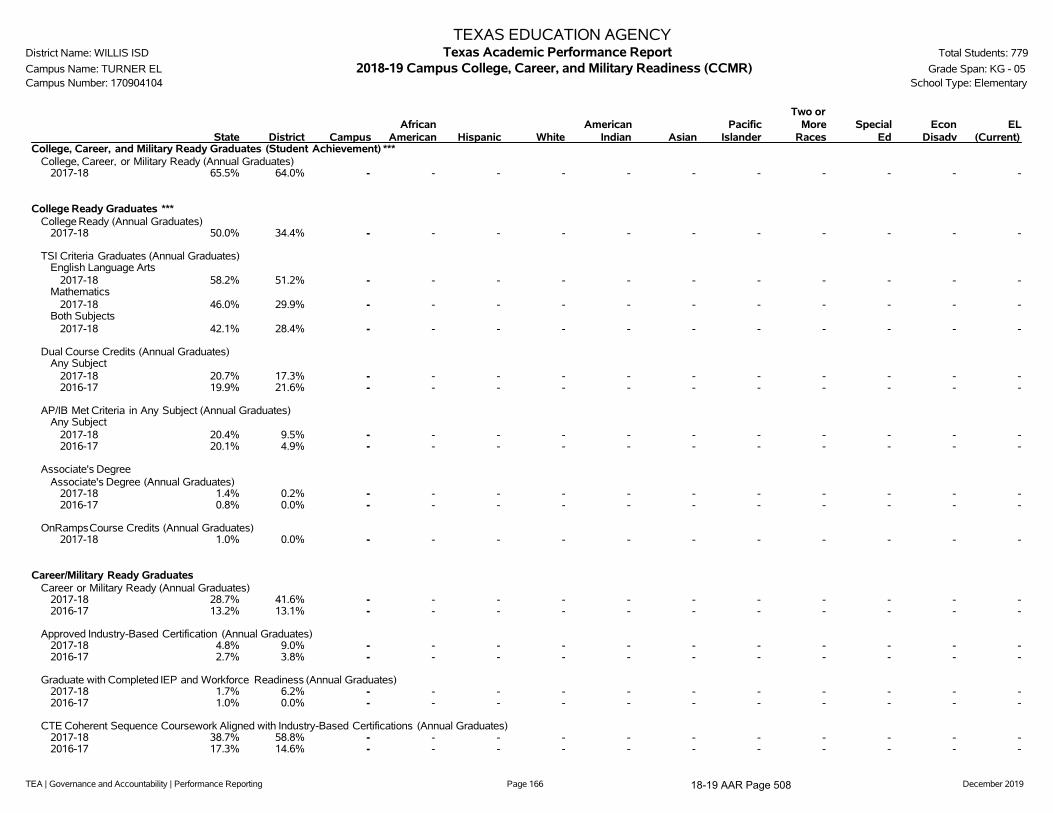
TEA | Governance and Accountability | Performance Reporting Page 166 December 2019
TEXAS EDUCATION AGENCYDistrict Name: WILLIS ISD Texas Academic Performance Report Total Students: 779
Campus Name: TURNER EL 2018-19 Campus College, Career, and Military Readiness (CCMR) Grade Span: KG - 05Campus Number: 170904104 School Type: Elementary
State District CampusAfrican
American Hispanic WhiteAmerican
Indian AsianPacific
Islander
Two orMore
RacesSpecial
EdEcon
DisadvEL
(Current)College, Career, and Military Ready Graduates (Student Achievement) ***
College, Career, or Military Ready (Annual Graduates)2017-18 65.5% 64.0% - - - - - - - - - - -
College Ready Graduates ***College Ready (Annual Graduates)
2017-18 50.0% 34.4% - - - - - - - - - - -
TSI Criteria Graduates (Annual Graduates)English Language Arts
2017-18 58.2% 51.2% - - - - - - - - - - -Mathematics
2017-18 46.0% 29.9% - - - - - - - - - - -Both Subjects
2017-18 42.1% 28.4% - - - - - - - - - - -
Dual Course Credits (Annual Graduates)Any Subject
2017-18 20.7% 17.3% - - - - - - - - - - -2016-17 19.9% 21.6% - - - - - - - - - - -
AP/IB Met Criteria in Any Subject (Annual Graduates)Any Subject
2017-18 20.4% 9.5% - - - - - - - - - - -2016-17 20.1% 4.9% - - - - - - - - - - -
Associate's DegreeAssociate's Degree (Annual Graduates)
2017-18 1.4% 0.2% - - - - - - - - - - -2016-17 0.8% 0.0% - - - - - - - - - - -
OnRampsCourse Credits (Annual Graduates)2017-18 1.0% 0.0% - - - - - - - - - - -
Career/Military Ready GraduatesCareer or Military Ready (Annual Graduates)
2017-18 28.7% 41.6% - - - - - - - - - - -2016-17 13.2% 13.1% - - - - - - - - - - -
Approved Industry-Based Certification (Annual Graduates)2017-18 4.8% 9.0% - - - - - - - - - - -2016-17 2.7% 3.8% - - - - - - - - - - -
Graduate with Completed IEP and Workforce Readiness (Annual Graduates)2017-18 1.7% 6.2% - - - - - - - - - - -2016-17 1.0% 0.0% - - - - - - - - - - -
CTE Coherent Sequence Coursework Aligned with Industry-Based Certifications (Annual Graduates)2017-18 38.7% 58.8% - - - - - - - - - - -2016-17 17.3% 14.6% - - - - - - - - - - -
18-19 AAR Page 508

TEA | Governance and Accountability | Performance Reporting Page 167 December 2019
TEXAS EDUCATION AGENCYDistrict Name: WILLIS ISD Texas Academic Performance Report Total Students: 779
Campus Name: TURNER EL 2018-19 Campus College, Career, and Military Readiness (CCMR) Grade Span: KG - 05Campus Number: 170904104 School Type: Elementary
State District CampusAfrican
American Hispanic WhiteAmerican
Indian AsianPacific
Islander
Two orMore
RacesSpecial
EdEcon
DisadvEL
(Current)
U.S. Armed Forces Enlistment (Annual Graduates)2017-18 4.3% 3.3% - - - - - - - - - - -2016-17 2.2% 2.8% - - - - - - - - - - -
Graduates under an Advanced Degree Plan and Identified as a current Special Education Student (Annual Graduates)2017-18 2.6% 0.9% - - - - - - - - - - -
Graduates with Level I or Level II Certificate (Annual Graduates)2017-18 0.6% 0.0% - - - - - - - - - - -2016-17 0.5% 0.0% - - - - - - - - - - -
18-19 AAR Page 509

TEA | Governance and Accountability | Performance Reporting Page 168 December 2019
TEXAS EDUCATION AGENCYDistrict Name: WILLIS ISD Texas Academic Performance Report Total Students: 779
Campus Name: TURNER EL 2018-19 Campus CCMR-Related Indicators Grade Span: KG - 05Campus Number: 170904104 School Type: Elementary
State District CampusAfrican
American Hispanic WhiteAmerican
Indian AsianPacific
Islander
Two orMore
RacesSpecial
EdEcon
DisadvEL
(Current)TSIA Results (Graduates >= Criterion) (Annual Graduates)
Reading2017-18 32.1% 36.5% - - - - - - - - - - -2016-17 23.4% 11.3% - - - - - - - - - - -
Mathematics2017-18 23.7% 21.8% - - - - - - - - - - -2016-17 19.8% 11.3% - - - - - - - - - - -
Both Subjects2017-18 18.1% 17.8% - - - - - - - - - - -2016-17 12.9% 5.4% - - - - - - - - - - -
CTE Coherent Sequence (Annual Graduates)2017-18 58.4% 61.8% - - - - - - - - - - -2016-17 50.5% 30.1% - - - - - - - - - - -
Completed and Received Credit for College Prep Courses (Annual Graduates)English Language Arts
2017-18 2.0% 0.0% - - - - - - - - - - -2016-17 0.8% 0.0% - - - - - - - - - - -
Mathematics2017-18 3.9% 0.0% - - - - - - - - - - -2016-17 1.4% 0.0% - - - - - - - - - - -
Both Subjects2017-18 0.9% 0.0% - - - - - - - - - - -2016-17 0.2% 0.0% - - - - - - - - - - -
AP/IB Results (Participation) (Grades 11-12)All Subjects
2018 25.8% 10.3% - - - - - - - - n/a - n/a2017 26.2% 12.1% - - - - - - - - n/a - n/a
English Language Arts2018 15.3% 6.5% - - - - - - - - n/a - n/a2017 15.9% 5.8% - - - - - - - - n/a - n/a
Mathematics2018 7.3% 0.8% - - - - - - - - n/a - n/a2017 7.2% 0.8% - - - - - - - - n/a - n/a
Science2018 10.8% 4.4% - - - - - - - - n/a - n/a2017 10.9% 4.2% - - - - - - - - n/a - n/a
Social Studies2018 14.5% 4.9% - - - - - - - - n/a - n/a2017 15.0% 8.8% - - - - - - - - n/a - n/a
AP/IB Results (Examinees >= Criterion) (Grades 11-12)All Subjects
2018 50.7% 48.5% - - - - - - - - n/a - n/a2017 49.1% 39.3% - - - - - - - - n/a - n/a
English Language Arts2018 42.5% 33.9% - - - - - - - - n/a - n/a2017 41.3% 38.9% - - - - - - - - n/a - n/a
Mathematics2018 52.8% 12.5% - - - - - - - - n/a - n/a
18-19 AAR Page 510

TEA | Governance and Accountability | Performance Reporting Page 169 December 2019
TEXAS EDUCATION AGENCYDistrict Name: WILLIS ISD Texas Academic Performance Report Total Students: 779
Campus Name: TURNER EL 2018-19 Campus CCMR-Related Indicators Grade Span: KG - 05Campus Number: 170904104 School Type: Elementary
State District CampusAfrican
American Hispanic WhiteAmerican
Indian AsianPacific
Islander
Two orMore
RacesSpecial
EdEcon
DisadvEL
(Current)2017 51.3% 14.3% - - - - - - - - n/a - n/a
Science2018 38.0% 21.4% - - - - - - - - n/a - n/a2017 38.3% 15.4% - - - - - - - - n/a - n/a
Social Studies2018 44.6% 51.1% - - - - - - - - n/a - n/a2017 41.4% 37.8% - - - - - - - - n/a - n/a
SAT/ACT Results (Annual Graduates) ***Tested
2017-18 74.6% 51.7% - - - - - - - - n/a - n/a2016-17 73.5% 53.6% - - - - - - - - n/a - n/a
At/Above Criterion2017-18 37.9% 33.0% - - - - - - - - n/a - n/a
Average SAT Score (Annual Graduates) ***All Subjects
2017-18 1036 1028 - - - - - - - - n/a - n/aEnglish Language Artsand Writing
2017-18 521 527 - - - - - - - - n/a - n/aMathematics
2017-18 515 500 - - - - - - - - n/a - n/a
Average ACT Score (Annual Graduates) ***All Subjects
2017-18 20.6 20.0 - - - - - - - - n/a - n/aEnglish Language Arts
2017-18 20.3 19.6 - - - - - - - - n/a - n/aMathematics
2017-18 20.6 19.4 - - - - - - - - n/a - n/aScience
2017-18 20.9 20.8 - - - - - - - - n/a - n/a
18-19 AAR Page 511

TEA | Governance and Accountability | Performance Reporting Page 170 December 2019
TEXAS EDUCATION AGENCYDistrict Name: WILLIS ISD Texas Academic Performance Report Total Students: 779
Campus Name: TURNER EL 2018-19 Campus Other Postsecondary Indicators Grade Span: KG - 05Campus Number: 170904104 School Type: Elementary
State District CampusAfrican
American Hispanic WhiteAmerican
Indian AsianPacific
Islander
Two orMore
RacesSpecial
EdEcon
DisadvEL
(Current)Advanced Dual-Credit Course Completion (Grades 9-12)
Any Subject2017-18 43.4% 32.6% - - - - - - - - - - -2016-17 37.1% 19.8% - - - - - - - - - - -
English Language Arts2017-18 17.3% 13.8% - - - - - - - - - - -2016-17 16.8% 13.1% - - - - - - - - - - -
Mathematics2017-18 20.7% 13.2% - - - - - - - - - - -2016-17 19.5% 12.1% - - - - - - - - - - -
Science2017-18 21.2% 19.7% - - - - - - - - - - -2016-17 5.7% 5.4% - - - - - - - - - - -
Social Studies2017-18 22.8% 11.7% - - - - - - - - - - -2016-17 21.8% 10.8% - - - - - - - - - - -
Graduates Enrolled in Texas Institution of Higher Education (TX IHE)2016-17 54.6% 48.0% - - - - - - - - - - -2015-16 54.7% 49.1% - - - - - - - - - - -
Graduates in TX IHE Completing One Year Without Enrollment in a Developmental Education Course2016-17 59.2% 54.6% - - - - - - - - - - -2015-16 55.7% 55.5% - - - - - - - - - - -
18-19 AAR Page 512

TEA | Governance and Accountability | Performance Reporting Page 171 December 2019
TEXAS EDUCATION AGENCYDistrict Name: WILLIS ISD Texas Academic Performance Report Total Students: 779
Campus Name: TURNER EL 2018-19 Campus Student Information Grade Span: KG - 05Campus Number: 170904104 School Type: Elementary
---------------- Campus ----------------Student Information Count Percent District State
Total Students 779 100.0% 7,469 5,416,400
Students by Grade:Early Childhood Education 0 0.0% 0.8% 0.3%Pre-Kindergarten 0 0.0% 2.3% 4.4%Kindergarten 115 14.8% 6.5% 6.9%Grade 1 121 15.5% 7.6% 7.1%Grade 2 129 16.6% 7.6% 7.2%Grade 3 143 18.4% 7.9% 7.3%Grade 4 139 17.8% 8.4% 7.6%Grade 5 132 16.9% 7.8% 7.7%Grade 6 0 0.0% 7.6% 7.7%Grade 7 0 0.0% 7.8% 7.5%Grade 8 0 0.0% 7.4% 7.5%Grade 9 0 0.0% 9.6% 8.1%Grade 10 0 0.0% 6.3% 7.4%Grade 11 0 0.0% 6.3% 6.9%Grade 12 0 0.0% 6.0% 6.5%
Ethnic Distribution:African American 50 6.4% 6.9% 12.6%Hispanic 167 21.4% 37.0% 52.6%White 525 67.4% 51.9% 27.4%American Indian 6 0.8% 0.4% 0.4%Asian 12 1.5% 0.6% 4.5%Pacific Islander 0 0.0% 0.1% 0.2%Two or More Races 19 2.4% 3.1% 2.4%
Economically Disadvantaged 288 37.0% 60.1% 60.6%Non-Educationally Disadvantaged 491 63.0% 39.9% 39.4%Section 504 Students 44 5.6% 6.1% 6.5%English Learners (EL) 32 4.1% 14.4% 19.5%Students w/ Disciplinary Placements (2017-18) 0 0.0% 1.8% 1.4%Students w/ Dyslexia 19 2.4% 2.6% 3.6%At-Risk 357 45.8% 50.8% 50.1%
Students with Disabilities by Type of Primary Disability:Total Students with Disabilities 50By Type of Primary Disability
Students with Intellectual Disabilities ** ** 38.4% 42.4%Students with Physical Disabilities 23 46.0% 21.4% 21.9%Students with Autism 13 26.0% 19.0% 13.7%Students with Behavioral Disabilities 8 16.0% 19.2% 20.6%Students with Non-Categorical Early Childhood * * 2.1% 1.4%
Mobility (2017-18):Total Mobile Students 92 13.8% 19.0% 15.4%
18-19 AAR Page 513

TEA | Governance and Accountability | Performance Reporting Page 172 December 2019
TEXAS EDUCATION AGENCYDistrict Name: WILLIS ISD Texas Academic Performance Report Total Students: 779
Campus Name: TURNER EL 2018-19 Campus Student Information Grade Span: KG - 05Campus Number: 170904104 School Type: Elementary
---------------- Campus ----------------Student Information Count Percent District State
By Ethnicity:African American 16 2.4%Hispanic 19 2.8%White 52 7.8%American Indian 0 0.0%Asian 2 0.3%Pacific Islander 0 0.0%Two or More Races 3 0.4%
--------Non-Special Education Rates-------- --------Special Education Rates--------Student Information Campus District State Campus District State
Retention Rates by Grade:Kindergarten 2.2% 0.4% 1.7% 0.0% 3.8% 6.2%Grade 1 2.8% 2.0% 3.1% 8.3% 5.7% 5.5%Grade 2 0.8% 1.3% 1.8% 8.3% 2.2% 2.3%Grade 3 2.4% 1.2% 1.1% 12.5% 2.1% 0.9%Grade 4 0.0% 0.0% 0.5% 0.0% 0.0% 0.5%Grade 5 0.0% 0.2% 0.5% 0.0% 1.8% 0.6%Grade 6 - 0.4% 0.4% - 0.0% 0.5%Grade 7 - 1.0% 0.6% - 0.0% 0.6%Grade 8 - 0.0% 0.4% - 0.0% 0.7%Grade 9 - 17.2% 7.2% - 34.0% 12.7%
Class Size Information Campus District State
Class Size Averages by Grade and Subject(Derived from teacher responsibility records):
Elementary:Kindergarten 22.4 20.9 18.9Grade 1 19.8 19.8 18.8Grade 2 21.2 19.1 18.7Grade 3 23.5 20.1 18.9Grade 4 19.7 20.0 19.2Grade 5 26.4 23.0 21.2Grade 6 - 19.3 20.4
Secondary:English/Language Arts - 15.9 16.6Foreign Languages - 21.8 18.9Mathematics - 16.7 17.8Science - 18.4 18.9Social Studies - 18.1 19.3
18-19 AAR Page 514

TEA | Governance and Accountability | Performance Reporting Page 173 December 2019
TEXAS EDUCATION AGENCYDistrict Name: WILLIS ISD Texas Academic Performance Report Total Students: 779
Campus Name: TURNER EL 2018-19 Campus Staff Information Grade Span: KG - 05Campus Number: 170904104 School Type: Elementary
---------------- Campus ----------------Staff Information Count/Average Percent District State
Total Staff 57.6 100.0% 100.0% 100.0%
Professional Staff: 46.8 81.1% 57.6% 64.1%Teachers 39.8 69.0% 44.8% 49.8%Professional Support 5.0 8.7% 9.2% 10.1%Campus Administration (School Leadership) 2.0 3.5% 2.9% 3.0%
Educational Aides: 10.9 18.9% 11.0% 10.3%
Librarians & Counselors (Headcount):Librarians
Full-time 0.0 n/a 0.0 4,414.0Part-time 0.0 n/a 0.0 572.0
CounselorsFull-time 1.0 n/a 12.0 12,433.0Part-time 0.0 n/a 2.0 1,097.0
Total Minority Staff: 6.9 11.9% 27.1% 50.4%
Teachers by Ethnicity and Sex:African American 0.0 0.0% 2.8% 10.6%Hispanic 1.0 2.5% 14.2% 27.7%White 38.8 97.5% 82.1% 58.4%American Indian 0.0 0.0% 0.2% 0.3%Asian 0.0 0.0% 0.2% 1.7%Pacific Islander 0.0 0.0% 0.0% 0.2%Two or More Races 0.0 0.0% 0.5% 1.1%
Males 1.8 4.5% 18.6% 23.8%Females 38.0 95.5% 81.4% 76.2%
Teachers by Highest Degree Held:No Degree 0.0 0.0% 0.5% 1.4%Bachelors 36.8 92.5% 81.7% 73.6%Masters 3.0 7.5% 17.4% 24.3%Doctorate 0.0 0.0% 0.5% 0.7%
Teachers by Years of Experience:Beginning Teachers 0.0 0.0% 8.0% 7.0%1-5 Years Experience 12.0 30.1% 31.7% 28.9%6-10 Years Experience 6.0 15.1% 17.5% 19.0%11-20 Years Experience 10.0 25.1% 24.9% 29.3%Over 20 Years Experience 11.8 29.6% 17.9% 15.7%
Number of Students per Teacher 19.6 n/a 17.2 15.1
18-19 AAR Page 515

TEA | Governance and Accountability | Performance Reporting Page 174 December 2019
TEXAS EDUCATION AGENCYDistrict Name: WILLIS ISD Texas Academic Performance Report Total Students: 779
Campus Name: TURNER EL 2018-19 Campus Staff Information Grade Span: KG - 05Campus Number: 170904104 School Type: Elementary
Staff Information Campus District State
Experience of Campus Leadership:Average Years Experience of Principals 3.0 2.8 6.3Average Years Experience of Principals with District 3.0 2.8 5.4Average Years Experience of Assistant Principals 7.0 6.1 5.3Average Years Experience of Assistant Principals with District 4.0 4.2 4.7
Average Years Experience of Teachers: 13.2 10.7 11.1Average Years Experience of Teachers with District: 9.1 6.5 7.2
Average Teacher Salary by Years of Experience (regular duties only):Beginning Teachers - $45,854 $47,2181-5 Years Experience $51,146 $50,779 $50,4086-10 Years Experience $52,543 $52,839 $52,78611-20 Years Experience $57,168 $57,036 $56,041Over 20 Years Experience $62,522 $63,917 $62,039
Average Actual Salaries (regular duties only):Teachers $56,244 $54,658 $54,122Professional Support $65,234 $65,409 $64,069Campus Administration (School Leadership) $77,436 $78,467 $78,947
Instructional Staff Percent: n/a 60.4% 64.5%
Contracted Instructional Staff (not incl. above): 0.0 1.5 6,043.6
18-19 AAR Page 516

TEA | Governance and Accountability | Performance Reporting Page 175 December 2019
TEXAS EDUCATION AGENCYDistrict Name: WILLIS ISD Texas Academic Performance Report Total Students: 779
Campus Name: TURNER EL 2018-19 Campus Staff Information Grade Span: KG - 05Campus Number: 170904104 School Type: Elementary
---------------- Campus ----------------Program Information Count Percent District State
Student Enrollment by Program:Bilingual/ESL Education 24 3.1% 13.6% 19.7%Career & Technical Education 0 0.0% 21.5% 26.3%Gifted & Talented Education 48 6.2% 5.4% 8.1%Special Education 50 6.4% 8.4% 9.6%
Teachers by Program (population served):Bilingual/ESL Education 0.0 0.0% 2.8% 6.4%Career & Technical Education 0.0 0.0% 4.5% 4.9%Compensatory Education 0.0 0.0% 0.0% 2.7%Gifted & Talented Education 0.0 0.0% 0.0% 2.0%Regular Education 38.8 97.6% 76.9% 71.4%Special Education 1.0 2.4% 8.5% 9.1%Other 0.0 0.0% 7.3% 3.6%
' '̂ Indicates that rates for reading and mathematics are based on the cumulative results from the first and second administrations of STAAR.'*' Indicates results are masked due to small numbers to protect student confidentiality.'**' When only one student disability group is masked, then the second smallest student disability group is masked regardless of size.'***' Due to changes in the evaluation of SAT/ACT results (for 2017-18 the best result was used, rather than the most recent), 2016-17 SAT/ACT results are not
comparable and, where applicable, are not shown.'-' Indicates there are no students in the group.'n/a' Indicates data reporting is not applicable for this group.'?' Indicates that the data for this item were statistically improbable or were reported outside a reasonable range.
Link to: PEIMS Financial Standard Reports 2017-18 Financial Actual Report
18-19 AAR Page 517

TEA | Governance and Accountability | Performance Reporting Page 176 December 2019
2018-19 Texas Academic Performance Report
District Name: WILLIS ISD
Campus Name: EDWARD B CANNAN EL
Campus Number: 170904106
2019 Accountability Rating: B
Distinction Designations:
Top 25 Percent: Comparative Academic Growth
18-19 AAR Page 518

TEA | Governance and Accountability | Performance Reporting Page 177 December 2019
This page is intentionally blank.
18-19 AAR Page 519
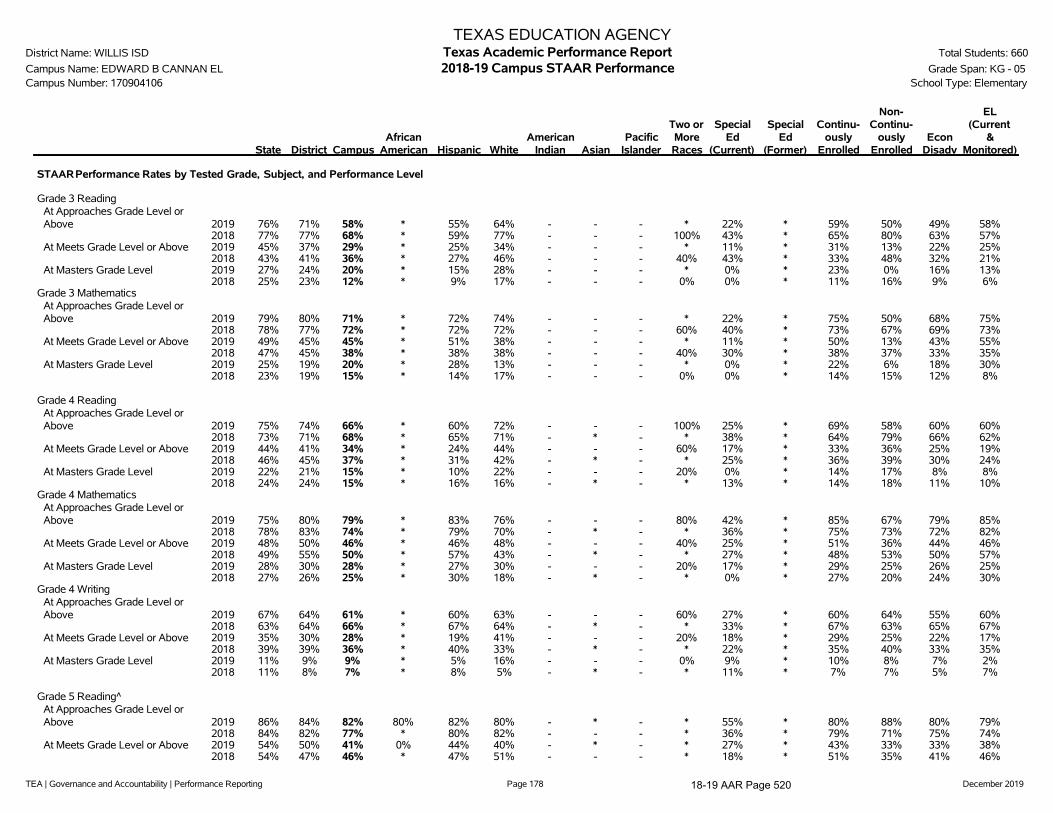
TEA | Governance and Accountability | Performance Reporting Page 178 December 2019
TEXAS EDUCATION AGENCYDistrict Name: WILLIS ISD Texas Academic Performance Report Total Students: 660
Campus Name: EDWARD B CANNAN EL 2018-19 Campus STAAR Performance Grade Span: KG - 05Campus Number: 170904106 School Type: Elementary
State District CampusAfrican
American Hispanic WhiteAmerican
Indian AsianPacific
Islander
Two orMoreRaces
SpecialEd
(Current)
SpecialEd
(Former)
Continu-ously
Enrolled
Non-Continu-
ouslyEnrolled
EconDisadv
EL(Current
&Monitored)
STAARPerformance Rates by Tested Grade, Subject, and Performance Level
Grade 3 ReadingAt Approaches Grade Level orAbove 2019 76% 71% 58% * 55% 64% - - - * 22% * 59% 50% 49% 58%
2018 77% 77% 68% * 59% 77% - - - 100% 43% * 65% 80% 63% 57%At Meets Grade Level or Above 2019 45% 37% 29% * 25% 34% - - - * 11% * 31% 13% 22% 25%
2018 43% 41% 36% * 27% 46% - - - 40% 43% * 33% 48% 32% 21%At Masters Grade Level 2019 27% 24% 20% * 15% 28% - - - * 0% * 23% 0% 16% 13%
2018 25% 23% 12% * 9% 17% - - - 0% 0% * 11% 16% 9% 6%Grade 3 Mathematics
At Approaches Grade Level orAbove 2019 79% 80% 71% * 72% 74% - - - * 22% * 75% 50% 68% 75%
2018 78% 77% 72% * 72% 72% - - - 60% 40% * 73% 67% 69% 73%At Meets Grade Level or Above 2019 49% 45% 45% * 51% 38% - - - * 11% * 50% 13% 43% 55%
2018 47% 45% 38% * 38% 38% - - - 40% 30% * 38% 37% 33% 35%At Masters Grade Level 2019 25% 19% 20% * 28% 13% - - - * 0% * 22% 6% 18% 30%
2018 23% 19% 15% * 14% 17% - - - 0% 0% * 14% 15% 12% 8%
Grade 4 ReadingAt Approaches Grade Level orAbove 2019 75% 74% 66% * 60% 72% - - - 100% 25% * 69% 58% 60% 60%
2018 73% 71% 68% * 65% 71% - * - * 38% * 64% 79% 66% 62%At Meets Grade Level or Above 2019 44% 41% 34% * 24% 44% - - - 60% 17% * 33% 36% 25% 19%
2018 46% 45% 37% * 31% 42% - * - * 25% * 36% 39% 30% 24%At Masters Grade Level 2019 22% 21% 15% * 10% 22% - - - 20% 0% * 14% 17% 8% 8%
2018 24% 24% 15% * 16% 16% - * - * 13% * 14% 18% 11% 10%Grade 4 Mathematics
At Approaches Grade Level orAbove 2019 75% 80% 79% * 83% 76% - - - 80% 42% * 85% 67% 79% 85%
2018 78% 83% 74% * 79% 70% - * - * 36% * 75% 73% 72% 82%At Meets Grade Level or Above 2019 48% 50% 46% * 46% 48% - - - 40% 25% * 51% 36% 44% 46%
2018 49% 55% 50% * 57% 43% - * - * 27% * 48% 53% 50% 57%At Masters Grade Level 2019 28% 30% 28% * 27% 30% - - - 20% 17% * 29% 25% 26% 25%
2018 27% 26% 25% * 30% 18% - * - * 0% * 27% 20% 24% 30%Grade 4 Writing
At Approaches Grade Level orAbove 2019 67% 64% 61% * 60% 63% - - - 60% 27% * 60% 64% 55% 60%
2018 63% 64% 66% * 67% 64% - * - * 33% * 67% 63% 65% 67%At Meets Grade Level or Above 2019 35% 30% 28% * 19% 41% - - - 20% 18% * 29% 25% 22% 17%
2018 39% 39% 36% * 40% 33% - * - * 22% * 35% 40% 33% 35%At Masters Grade Level 2019 11% 9% 9% * 5% 16% - - - 0% 9% * 10% 8% 7% 2%
2018 11% 8% 7% * 8% 5% - * - * 11% * 7% 7% 5% 7%
Grade 5 Reading^At Approaches Grade Level orAbove 2019 86% 84% 82% 80% 82% 80% - * - * 55% * 80% 88% 80% 79%
2018 84% 82% 77% * 80% 82% - - - * 36% * 79% 71% 75% 74%At Meets Grade Level or Above 2019 54% 50% 41% 0% 44% 40% - * - * 27% * 43% 33% 33% 38%
2018 54% 47% 46% * 47% 51% - - - * 18% * 51% 35% 41% 46%
18-19 AAR Page 520
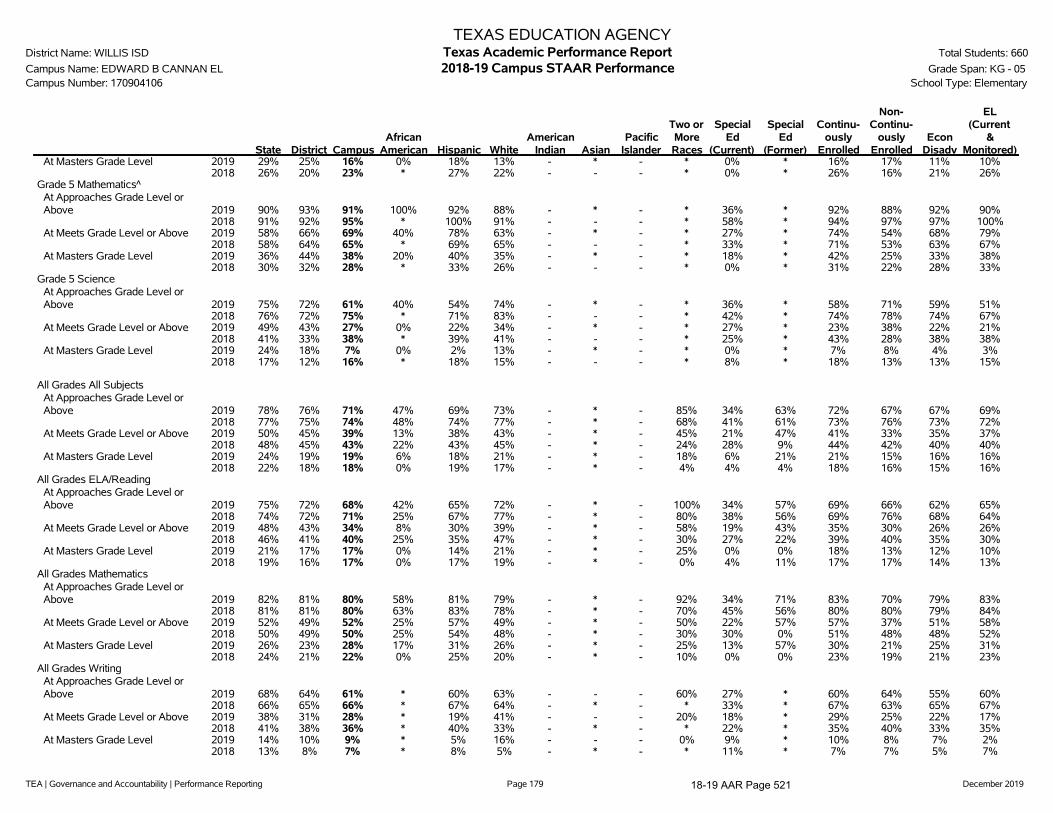
TEA | Governance and Accountability | Performance Reporting Page 179 December 2019
TEXAS EDUCATION AGENCYDistrict Name: WILLIS ISD Texas Academic Performance Report Total Students: 660
Campus Name: EDWARD B CANNAN EL 2018-19 Campus STAAR Performance Grade Span: KG - 05Campus Number: 170904106 School Type: Elementary
State District CampusAfrican
American Hispanic WhiteAmerican
Indian AsianPacific
Islander
Two orMoreRaces
SpecialEd
(Current)
SpecialEd
(Former)
Continu-ously
Enrolled
Non-Continu-
ouslyEnrolled
EconDisadv
EL(Current
&Monitored)
At Masters Grade Level 2019 29% 25% 16% 0% 18% 13% - * - * 0% * 16% 17% 11% 10%2018 26% 20% 23% * 27% 22% - - - * 0% * 26% 16% 21% 26%
Grade 5 Mathematics^At Approaches Grade Level orAbove 2019 90% 93% 91% 100% 92% 88% - * - * 36% * 92% 88% 92% 90%
2018 91% 92% 95% * 100% 91% - - - * 58% * 94% 97% 97% 100%At Meets Grade Level or Above 2019 58% 66% 69% 40% 78% 63% - * - * 27% * 74% 54% 68% 79%
2018 58% 64% 65% * 69% 65% - - - * 33% * 71% 53% 63% 67%At Masters Grade Level 2019 36% 44% 38% 20% 40% 35% - * - * 18% * 42% 25% 33% 38%
2018 30% 32% 28% * 33% 26% - - - * 0% * 31% 22% 28% 33%Grade 5 Science
At Approaches Grade Level orAbove 2019 75% 72% 61% 40% 54% 74% - * - * 36% * 58% 71% 59% 51%
2018 76% 72% 75% * 71% 83% - - - * 42% * 74% 78% 74% 67%At Meets Grade Level or Above 2019 49% 43% 27% 0% 22% 34% - * - * 27% * 23% 38% 22% 21%
2018 41% 33% 38% * 39% 41% - - - * 25% * 43% 28% 38% 38%At Masters Grade Level 2019 24% 18% 7% 0% 2% 13% - * - * 0% * 7% 8% 4% 3%
2018 17% 12% 16% * 18% 15% - - - * 8% * 18% 13% 13% 15%
All Grades All SubjectsAt Approaches Grade Level orAbove 2019 78% 76% 71% 47% 69% 73% - * - 85% 34% 63% 72% 67% 67% 69%
2018 77% 75% 74% 48% 74% 77% - * - 68% 41% 61% 73% 76% 73% 72%At Meets Grade Level or Above 2019 50% 45% 39% 13% 38% 43% - * - 45% 21% 47% 41% 33% 35% 37%
2018 48% 45% 43% 22% 43% 45% - * - 24% 28% 9% 44% 42% 40% 40%At Masters Grade Level 2019 24% 19% 19% 6% 18% 21% - * - 18% 6% 21% 21% 15% 16% 16%
2018 22% 18% 18% 0% 19% 17% - * - 4% 4% 4% 18% 16% 15% 16%All Grades ELA/Reading
At Approaches Grade Level orAbove 2019 75% 72% 68% 42% 65% 72% - * - 100% 34% 57% 69% 66% 62% 65%
2018 74% 72% 71% 25% 67% 77% - * - 80% 38% 56% 69% 76% 68% 64%At Meets Grade Level or Above 2019 48% 43% 34% 8% 30% 39% - * - 58% 19% 43% 35% 30% 26% 26%
2018 46% 41% 40% 25% 35% 47% - * - 30% 27% 22% 39% 40% 35% 30%At Masters Grade Level 2019 21% 17% 17% 0% 14% 21% - * - 25% 0% 0% 18% 13% 12% 10%
2018 19% 16% 17% 0% 17% 19% - * - 0% 4% 11% 17% 17% 14% 13%All Grades Mathematics
At Approaches Grade Level orAbove 2019 82% 81% 80% 58% 81% 79% - * - 92% 34% 71% 83% 70% 79% 83%
2018 81% 81% 80% 63% 83% 78% - * - 70% 45% 56% 80% 80% 79% 84%At Meets Grade Level or Above 2019 52% 49% 52% 25% 57% 49% - * - 50% 22% 57% 57% 37% 51% 58%
2018 50% 49% 50% 25% 54% 48% - * - 30% 30% 0% 51% 48% 48% 52%At Masters Grade Level 2019 26% 23% 28% 17% 31% 26% - * - 25% 13% 57% 30% 21% 25% 31%
2018 24% 21% 22% 0% 25% 20% - * - 10% 0% 0% 23% 19% 21% 23%All Grades Writing
At Approaches Grade Level orAbove 2019 68% 64% 61% * 60% 63% - - - 60% 27% * 60% 64% 55% 60%
2018 66% 65% 66% * 67% 64% - * - * 33% * 67% 63% 65% 67%At Meets Grade Level or Above 2019 38% 31% 28% * 19% 41% - - - 20% 18% * 29% 25% 22% 17%
2018 41% 38% 36% * 40% 33% - * - * 22% * 35% 40% 33% 35%At Masters Grade Level 2019 14% 10% 9% * 5% 16% - - - 0% 9% * 10% 8% 7% 2%
2018 13% 8% 7% * 8% 5% - * - * 11% * 7% 7% 5% 7%
18-19 AAR Page 521

TEA | Governance and Accountability | Performance Reporting Page 180 December 2019
TEXAS EDUCATION AGENCYDistrict Name: WILLIS ISD Texas Academic Performance Report Total Students: 660
Campus Name: EDWARD B CANNAN EL 2018-19 Campus STAAR Performance Grade Span: KG - 05Campus Number: 170904106 School Type: Elementary
State District CampusAfrican
American Hispanic WhiteAmerican
Indian AsianPacific
Islander
Two orMoreRaces
SpecialEd
(Current)
SpecialEd
(Former)
Continu-ously
Enrolled
Non-Continu-
ouslyEnrolled
EconDisadv
EL(Current
&Monitored)
All Grades ScienceAt Approaches Grade Level orAbove 2019 81% 81% 61% 40% 54% 74% - * - * 36% * 58% 71% 59% 51%
2018 80% 77% 75% * 71% 83% - - - * 42% * 74% 78% 74% 67%At Meets Grade Level or Above 2019 54% 51% 27% 0% 22% 34% - * - * 27% * 23% 38% 22% 21%
2018 51% 46% 38% * 39% 41% - - - * 25% * 43% 28% 38% 38%At Masters Grade Level 2019 25% 20% 7% 0% 2% 13% - * - * 0% * 7% 8% 4% 3%
2018 23% 18% 16% * 18% 15% - - - * 8% * 18% 13% 13% 15%
18-19 AAR Page 522
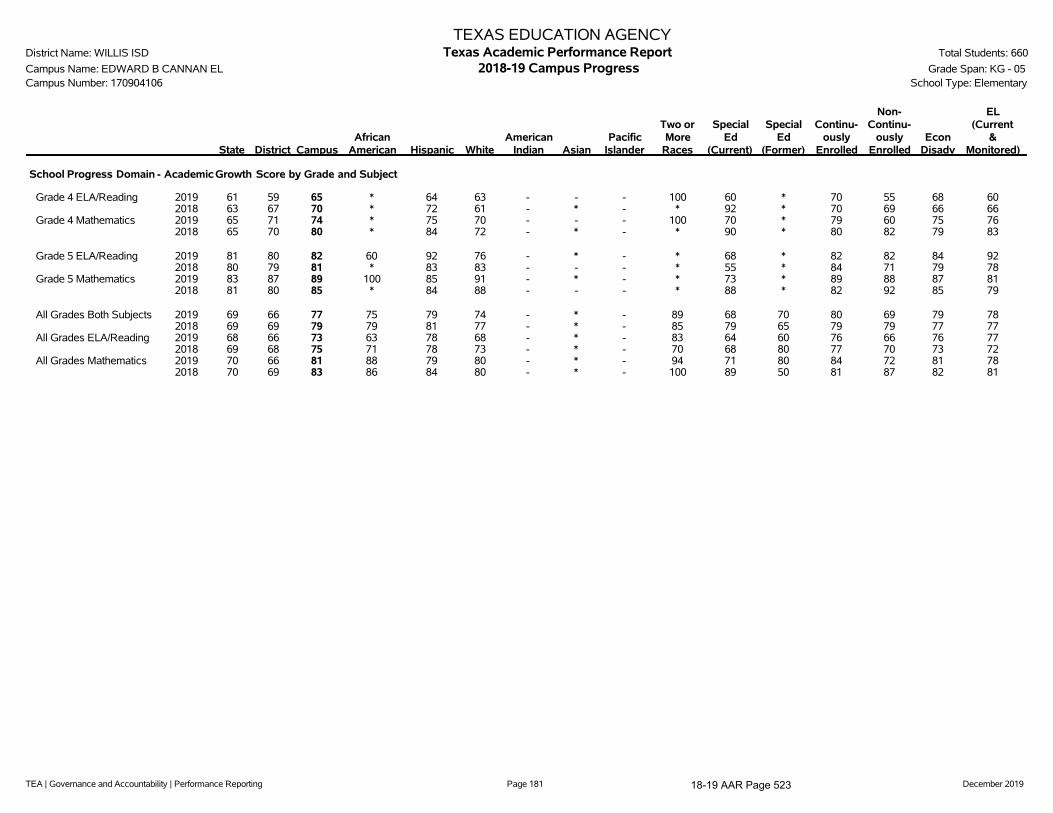
TEA | Governance and Accountability | Performance Reporting Page 181 December 2019
TEXAS EDUCATION AGENCYDistrict Name: WILLIS ISD Texas Academic Performance Report Total Students: 660
Campus Name: EDWARD B CANNAN EL 2018-19 Campus Progress Grade Span: KG - 05Campus Number: 170904106 School Type: Elementary
State District CampusAfrican
American Hispanic WhiteAmerican
Indian AsianPacific
Islander
Two orMore
Races
SpecialEd
(Current)
SpecialEd
(Former)
Continu-ously
Enrolled
Non-Continu-
ouslyEnrolled
EconDisadv
EL(Current
&Monitored)
School Progress Domain - Academic Growth Score by Grade and Subject
Grade 4 ELA/Reading 2019 61 59 65 * 64 63 - - - 100 60 * 70 55 68 602018 63 67 70 * 72 61 - * - * 92 * 70 69 66 66
Grade 4 Mathematics 2019 65 71 74 * 75 70 - - - 100 70 * 79 60 75 762018 65 70 80 * 84 72 - * - * 90 * 80 82 79 83
Grade 5 ELA/Reading 2019 81 80 82 60 92 76 - * - * 68 * 82 82 84 922018 80 79 81 * 83 83 - - - * 55 * 84 71 79 78
Grade 5 Mathematics 2019 83 87 89 100 85 91 - * - * 73 * 89 88 87 812018 81 80 85 * 84 88 - - - * 88 * 82 92 85 79
All Grades Both Subjects 2019 69 66 77 75 79 74 - * - 89 68 70 80 69 79 782018 69 69 79 79 81 77 - * - 85 79 65 79 79 77 77
All Grades ELA/Reading 2019 68 66 73 63 78 68 - * - 83 64 60 76 66 76 772018 69 68 75 71 78 73 - * - 70 68 80 77 70 73 72
All Grades Mathematics 2019 70 66 81 88 79 80 - * - 94 71 80 84 72 81 782018 70 69 83 86 84 80 - * - 100 89 50 81 87 82 81
18-19 AAR Page 523
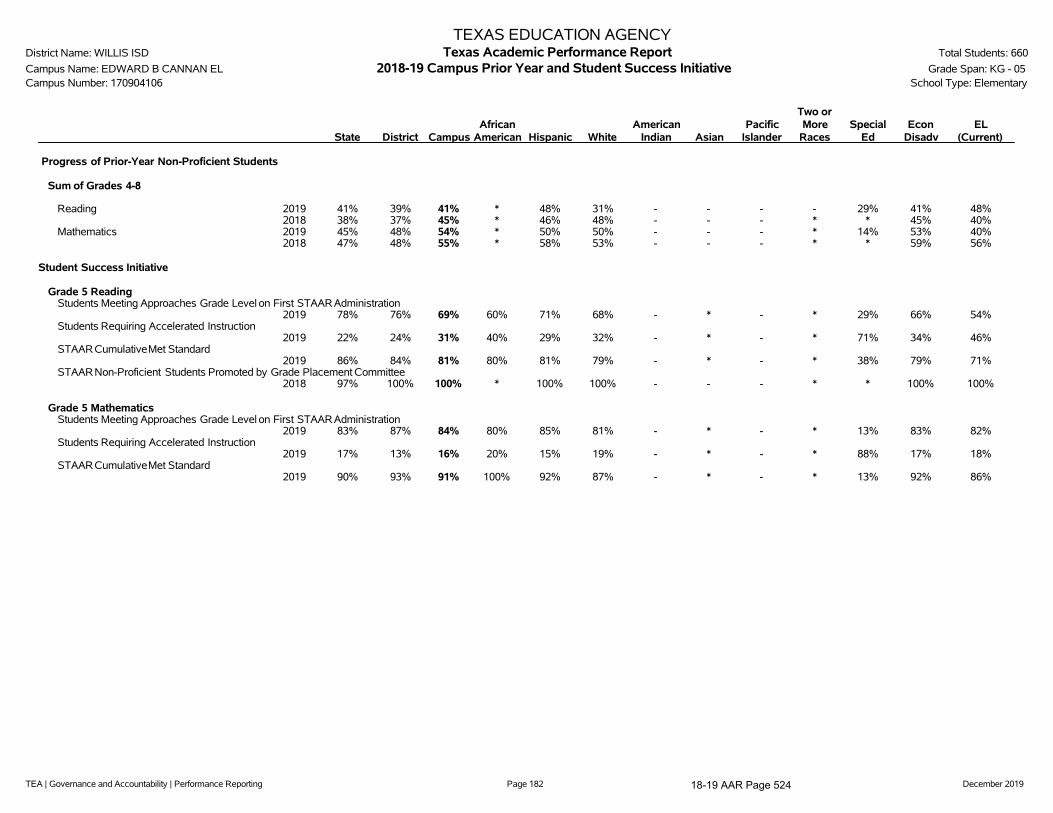
TEA | Governance and Accountability | Performance Reporting Page 182 December 2019
TEXAS EDUCATION AGENCYDistrict Name: WILLIS ISD Texas Academic Performance Report Total Students: 660
Campus Name: EDWARD B CANNAN EL 2018-19 Campus Prior Year and Student Success Initiative Grade Span: KG - 05Campus Number: 170904106 School Type: Elementary
State District CampusAfrican
American Hispanic WhiteAmerican
Indian AsianPacific
Islander
Two orMore
RacesSpecial
EdEcon
DisadvEL
(Current)
Progress of Prior-Year Non-Proficient Students
Sum of Grades 4-8
Reading 2019 41% 39% 41% * 48% 31% - - - - 29% 41% 48%2018 38% 37% 45% * 46% 48% - - - * * 45% 40%
Mathematics 2019 45% 48% 54% * 50% 50% - - - * 14% 53% 40%2018 47% 48% 55% * 58% 53% - - - * * 59% 56%
Student Success Initiative
Grade 5 ReadingStudents Meeting Approaches Grade Level on First STAARAdministration
2019 78% 76% 69% 60% 71% 68% - * - * 29% 66% 54%Students Requiring Accelerated Instruction
2019 22% 24% 31% 40% 29% 32% - * - * 71% 34% 46%STAARCumulativeMet Standard
2019 86% 84% 81% 80% 81% 79% - * - * 38% 79% 71%STAARNon-Proficient Students Promoted by Grade Placement Committee
2018 97% 100% 100% * 100% 100% - - - * * 100% 100%
Grade 5 MathematicsStudents Meeting Approaches Grade Level on First STAARAdministration
2019 83% 87% 84% 80% 85% 81% - * - * 13% 83% 82%Students Requiring Accelerated Instruction
2019 17% 13% 16% 20% 15% 19% - * - * 88% 17% 18%STAARCumulativeMet Standard
2019 90% 93% 91% 100% 92% 87% - * - * 13% 92% 86%
18-19 AAR Page 524

TEA | Governance and Accountability | Performance Reporting Page 183 December 2019
TEXAS EDUCATION AGENCYDistrict Name: WILLIS ISD Texas Academic Performance Report Total Students: 660
Campus Name: EDWARD B CANNAN EL 2018-19 Campus STAAR Performance Grade Span: KG - 05Campus Number: 170904106 Bilingual Education/English as a Second Language (Current EL Students)
State District CampusBilingual
EducationBE-TransEarly Exit
BE-TransLate Exit
BE-DualTwo-Way
BE-DualOne-Way ESL
ESLContent
ESLPull-Out
LEP NoServices
LEP withServices
TotalEL
STAARPerformance Rate by Subject and Performance LevelAll Grades All Subjects
At Approaches Grade Level or Above 2019 78% 76% 71% 64% - - - 64% 79% - 79% 71% 65% 65%2018 77% 75% 74% 68% - - - 68% 64% 64% - 40% 67% 67%
At Meets Grade Level or Above 2019 50% 45% 39% 29% - - - 29% 41% - 41% 24% 30% 30%2018 48% 45% 43% 33% - - - 33% 32% 32% - 0% 33% 32%
At Masters Grade Level 2019 24% 19% 19% 10% - - - 10% 28% - 28% 12% 12% 12%2018 22% 18% 18% 9% - - - 9% 4% 4% - 0% 9% 9%
All Grades ELA/ReadingAt Approaches Grade Level or Above 2019 75% 72% 68% 57% - - - 57% 85% - 85% 67% 60% 60%
2018 74% 72% 71% 59% - - - 59% 56% 56% - * 58% 57%At Meets Grade Level or Above 2019 48% 43% 34% 16% - - - 16% 38% - 38% 17% 18% 18%
2018 46% 41% 40% 23% - - - 23% 33% 33% - * 24% 23%At Masters Grade Level 2019 21% 17% 17% 6% - - - 6% 23% - 23% 0% 7% 7%
2018 19% 16% 17% 6% - - - 6% 0% 0% - * 6% 6%All Grades Mathematics
At Approaches Grade Level or Above 2019 82% 81% 80% 82% - - - 82% 77% - 77% 67% 81% 80%2018 81% 81% 80% 81% - - - 81% 78% 78% - * 81% 81%
At Meets Grade Level or Above 2019 52% 49% 52% 56% - - - 56% 46% - 46% 33% 55% 54%2018 50% 49% 50% 45% - - - 45% 33% 33% - * 44% 43%
At Masters Grade Level 2019 26% 23% 28% 22% - - - 22% 38% - 38% 33% 24% 24%2018 24% 21% 22% 16% - - - 16% 11% 11% - * 16% 15%
All Grades WritingAt Approaches Grade Level or Above 2019 68% 64% 61% 51% - - - 51% * - * 80% 52% 55%
2018 66% 65% 66% 66% - - - 66% * * - - 63% 63%At Meets Grade Level or Above 2019 38% 31% 28% 7% - - - 7% * - * 20% 7% 9%
2018 41% 38% 36% 31% - - - 31% * * - - 29% 29%At Masters Grade Level 2019 14% 10% 9% 0% - - - 0% * - * 0% 0% 0%
2018 13% 8% 7% 3% - - - 3% * * - - 3% 3%All Grades Science
At Approaches Grade Level or Above 2019 81% 81% 61% 37% - - - 37% * - * - 38% 38%2018 80% 77% 75% 50% - - - 50% * * - * 54% 52%
At Meets Grade Level or Above 2019 54% 51% 27% 4% - - - 4% * - * - 7% 7%2018 51% 46% 38% 23% - - - 23% * * - * 27% 26%
At Masters Grade Level 2019 25% 20% 7% 0% - - - 0% * - * - 0% 0%2018 23% 18% 16% 5% - - - 5% * * - * 4% 4%
School Progress Domain - Academic Growth ScoreAll Grades Both Subjects 2019 69% 66% 77% 77% - - - 77% 100% - 100% 20% 78% 74%
2018 69% 69% 79% 71% - - - 71% 88% 88% - * 73% 73%All Grades ELA/Reading 2019 68% 66% 73% 76% - - - 76% * - * 20% 78% 72%
2018 69% 68% 75% 63% - - - 63% 88% 88% - * 67% 66%All Grades Mathematics 2019 70% 66% 81% 78% - - - 78% * - * 20% 79% 75%
2018 70% 69% 83% 78% - - - 78% 88% 88% - * 79% 80%
Progress of Prior Year STAAR Non-Proficient Students (Percent of Non-Proficient Passing STAAR)Reading 2019 41% 39% 41% 43% - - - 43% * - * * 45% 48%
2018 38% 37% 45% 42% - - - 42% * * - * 41% 40%Mathematics 2019 45% 48% 54% 33% - - - 33% * - * - 40% 40%
2018 47% 48% 55% 55% - - - 55% * * - - 56% 56%
18-19 AAR Page 525

TEA | Governance and Accountability | Performance Reporting Page 184 December 2019
TEXAS EDUCATION AGENCYDistrict Name: WILLIS ISD Texas Academic Performance Report Total Students: 660
Campus Name: EDWARD B CANNAN EL 2018-19 Campus STAAR Participation Grade Span: KG - 05Campus Number: 170904106 School Type: Elementary
State District CampusAfrican
American Hispanic WhiteAmerican
Indian AsianPacific
Islander
Two orMore
RacesSpecial
EdEcon
DisadvEL
(Current)2019 STAARParticipation
(All Grades)
All TestsAssessment Participant 99% 100% 100% 100% 100% 99% - * - 100% 100% 100% 100%
Included in Accountability 94% 94% 95% 100% 95% 93% - * - 100% 97% 95% 97%Not Included in Accountability
Mobile 4% 5% 4% 0% 3% 5% - * - 0% 0% 3% 1%Other Exclusions 1% 1% 1% 0% 1% 1% - * - 0% 3% 1% 2%
Not Tested 1% 0% 0% 0% 0% 1% - * - 0% 0% 0% 0%Absent 1% 0% 0% 0% 0% 1% - * - 0% 0% 0% 0%Other 0% 0% 0% 0% 0% 0% - * - 0% 0% 0% 0%
2018 STAARParticipation(All Grades)
All TestsAssessment Participant 99% 100% 100% 100% 100% 100% - * - 100% 100% 100% 100%
Included in Accountability 94% 93% 94% 74% 96% 93% - * - 100% 84% 94% 97%Not Included in Accountability
Mobile 4% 6% 5% 26% 3% 6% - * - 0% 14% 5% 2%Other Exclusions 1% 0% 1% 0% 1% 1% - * - 0% 2% 0% 1%
Not Tested 1% 0% 0% 0% 0% 0% - * - 0% 0% 0% 0%Absent 1% 0% 0% 0% 0% 0% - * - 0% 0% 0% 0%Other 0% 0% 0% 0% 0% 0% - * - 0% 0% 0% 0%
18-19 AAR Page 526

TEA | Governance and Accountability | Performance Reporting Page 185 December 2019
TEXAS EDUCATION AGENCYDistrict Name: WILLIS ISD Texas Academic Performance Report Total Students: 660
Campus Name: EDWARD B CANNAN EL 2018-19 Campus Attendance, Graduation, and Dropout Rates Grade Span: KG - 05Campus Number: 170904106 School Type: Elementary
State District CampusAfrican
American Hispanic WhiteAmerican
Indian AsianPacific
Islander
Two orMore
RacesSpecial
EdEcon
DisadvEL
(Current)
Attendance Rate2017-18 95.4% 95.0% 96.2% 96.5% 97.4% 94.8% - * - 95.9% 95.0% 96.4% 97.6%2016-17 95.7% 95.2% 96.2% 95.6% 97.1% 95.1% - * - 97.1% 95.1% 96.3% 97.2%
Annual Dropout Rate (Gr 7-8)2017-18 0.4% 0.1% - - - - - - - - - - -2016-17 0.3% 0.2% - - - - - - - - - - -
Annual Dropout Rate (Gr 9-12)2017-18 1.9% 2.9% - - - - - - - - - - -2016-17 1.9% 1.5% - - - - - - - - - - -
4-Year Longitudinal Rate (Gr 9-12)Class of 2018
Graduated 90.0% 86.4% - - - - - - - - - - -Received TxCHSE 0.4% 0.4% - - - - - - - - - - -Continued HS 3.8% 4.0% - - - - - - - - - - -Dropped Out 5.7% 9.1% - - - - - - - - - - -Graduates and TxCHSE 90.4% 86.8% - - - - - - - - - - -Graduates, TxCHSE,and Continuers 94.3% 90.9% - - - - - - - - - - -
Class of 2017Graduated 89.7% 89.3% - - - - - - - - - - -Received TxCHSE 0.4% 1.1% - - - - - - - - - - -Continued HS 4.0% 4.6% - - - - - - - - - - -Dropped Out 5.9% 5.0% - - - - - - - - - - -Graduates and TxCHSE 90.1% 90.4% - - - - - - - - - - -Graduates, TxCHSE,and Continuers 94.1% 95.0% - - - - - - - - - - -
5-Year Extended Longitudinal Rate (Gr 9-12)Class of 2017
Graduated 92.0% 92.0% - - - - - - - - - - -Received TxCHSE 0.6% 1.3% - - - - - - - - - - -Continued HS 1.1% 0.2% - - - - - - - - - - -Dropped Out 6.3% 6.5% - - - - - - - - - - -Graduates and TxCHSE 92.6% 93.3% - - - - - - - - - - -Graduates, TxCHSE,and Continuers 93.7% 93.5% - - - - - - - - - - -
Class of 2016Graduated 91.6% 93.7% - - - - - - - - - - -Received TxCHSE 0.7% 1.1% - - - - - - - - - - -Continued HS 1.2% 0.0% - - - - - - - - - - -Dropped Out 6.6% 5.2% - - - - - - - - - - -Graduates and TxCHSE 92.2% 94.8% - - - - - - - - - - -Graduates, TxCHSE,and Continuers 93.4% 94.8% - - - - - - - - - - -
6-Year Extended Longitudinal Rate (Gr 9-12)Class of 2016
Graduated 92.1% 93.9% - - - - - - - - - - -
18-19 AAR Page 527
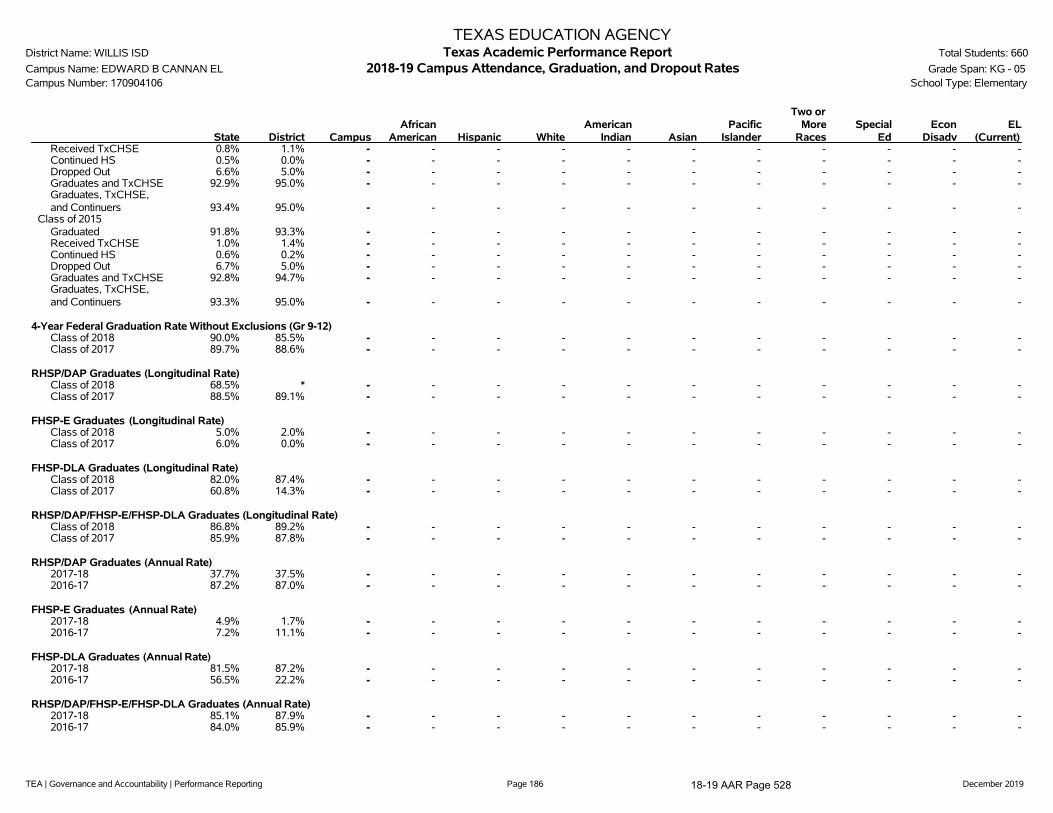
TEA | Governance and Accountability | Performance Reporting Page 186 December 2019
TEXAS EDUCATION AGENCYDistrict Name: WILLIS ISD Texas Academic Performance Report Total Students: 660
Campus Name: EDWARD B CANNAN EL 2018-19 Campus Attendance, Graduation, and Dropout Rates Grade Span: KG - 05Campus Number: 170904106 School Type: Elementary
State District CampusAfrican
American Hispanic WhiteAmerican
Indian AsianPacific
Islander
Two orMore
RacesSpecial
EdEcon
DisadvEL
(Current)Received TxCHSE 0.8% 1.1% - - - - - - - - - - -Continued HS 0.5% 0.0% - - - - - - - - - - -Dropped Out 6.6% 5.0% - - - - - - - - - - -Graduates and TxCHSE 92.9% 95.0% - - - - - - - - - - -Graduates, TxCHSE,and Continuers 93.4% 95.0% - - - - - - - - - - -
Class of 2015Graduated 91.8% 93.3% - - - - - - - - - - -Received TxCHSE 1.0% 1.4% - - - - - - - - - - -Continued HS 0.6% 0.2% - - - - - - - - - - -Dropped Out 6.7% 5.0% - - - - - - - - - - -Graduates and TxCHSE 92.8% 94.7% - - - - - - - - - - -Graduates, TxCHSE,and Continuers 93.3% 95.0% - - - - - - - - - - -
4-Year Federal Graduation Rate Without Exclusions (Gr 9-12)Class of 2018 90.0% 85.5% - - - - - - - - - - -Class of 2017 89.7% 88.6% - - - - - - - - - - -
RHSP/DAP Graduates (Longitudinal Rate)Class of 2018 68.5% * - - - - - - - - - - -Class of 2017 88.5% 89.1% - - - - - - - - - - -
FHSP-E Graduates (Longitudinal Rate)Class of 2018 5.0% 2.0% - - - - - - - - - - -Class of 2017 6.0% 0.0% - - - - - - - - - - -
FHSP-DLA Graduates (Longitudinal Rate)Class of 2018 82.0% 87.4% - - - - - - - - - - -Class of 2017 60.8% 14.3% - - - - - - - - - - -
RHSP/DAP/FHSP-E/FHSP-DLA Graduates (Longitudinal Rate)Class of 2018 86.8% 89.2% - - - - - - - - - - -Class of 2017 85.9% 87.8% - - - - - - - - - - -
RHSP/DAP Graduates (Annual Rate)2017-18 37.7% 37.5% - - - - - - - - - - -2016-17 87.2% 87.0% - - - - - - - - - - -
FHSP-E Graduates (Annual Rate)2017-18 4.9% 1.7% - - - - - - - - - - -2016-17 7.2% 11.1% - - - - - - - - - - -
FHSP-DLA Graduates (Annual Rate)2017-18 81.5% 87.2% - - - - - - - - - - -2016-17 56.5% 22.2% - - - - - - - - - - -
RHSP/DAP/FHSP-E/FHSP-DLA Graduates (Annual Rate)2017-18 85.1% 87.9% - - - - - - - - - - -2016-17 84.0% 85.9% - - - - - - - - - - -
18-19 AAR Page 528

TEA | Governance and Accountability | Performance Reporting Page 187 December 2019
TEXAS EDUCATION AGENCYDistrict Name: WILLIS ISD Texas Academic Performance Report Total Students: 660
Campus Name: EDWARD B CANNAN EL 2018-19 Campus Graduation Profile Grade Span: KG - 05Campus Number: 170904106 School Type: Elementary
CampusCount
CampusPercent
DistrictCount
StateCount
Graduates (2017-18 Annual Graduates)Total Graduates - - 422 347,893
By Ethnicity:African American - - 31 43,502Hispanic - - 128 173,272White - - 247 107,052American Indian - - 3 1,226Asian - - 2 15,589Pacific Islander - - 2 528Two or More Races - - 9 6,724
By Graduation Type:Minimum H.S. Program - - 5 5,855Recommended H.S. Program/Distinguished Achievement Program - - 3 3,538Foundation H.S. Program (No Endorsement) - - 46 49,432Foundation H.S. Program (Endorsement) - - 7 16,542Foundation H.S. Program (DLA) - - 361 272,526
Special Education Graduates - - 27 25,962Economically Disadvantaged Graduates - - 181 166,956LEP Graduates - - 16 21,359At-Risk Graduates - - 137 144,805
18-19 AAR Page 529
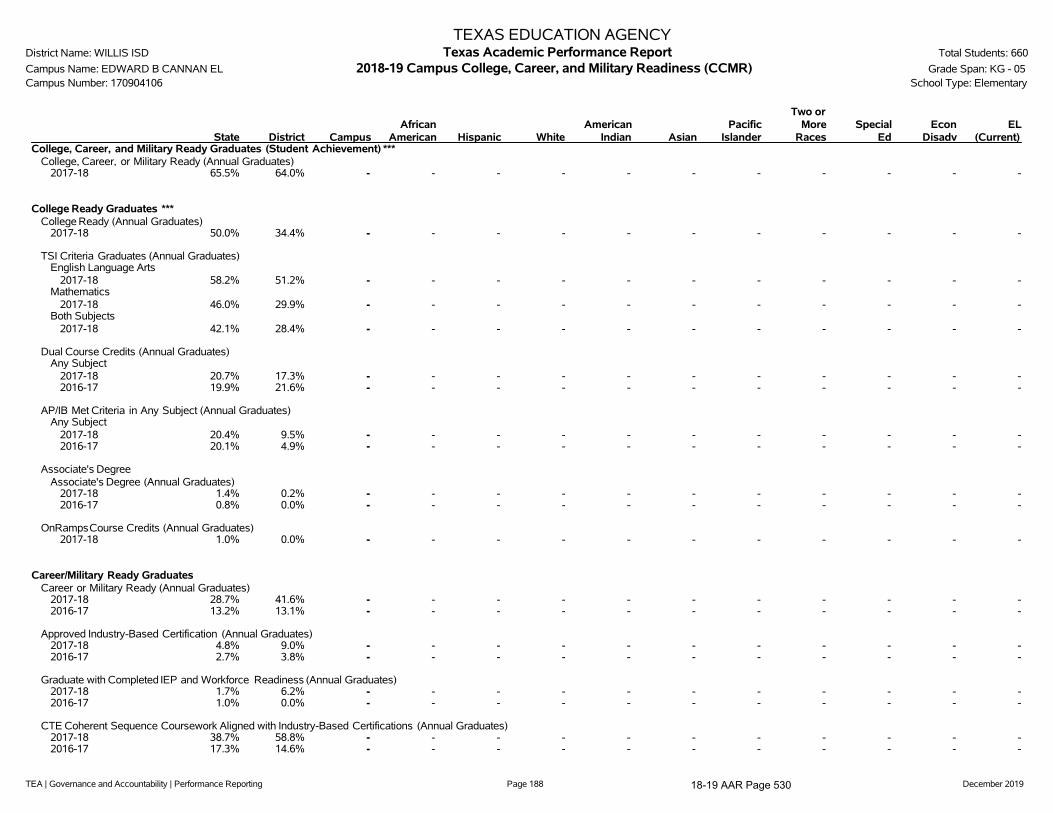
TEA | Governance and Accountability | Performance Reporting Page 188 December 2019
TEXAS EDUCATION AGENCYDistrict Name: WILLIS ISD Texas Academic Performance Report Total Students: 660
Campus Name: EDWARD B CANNAN EL 2018-19 Campus College, Career, and Military Readiness (CCMR) Grade Span: KG - 05Campus Number: 170904106 School Type: Elementary
State District CampusAfrican
American Hispanic WhiteAmerican
Indian AsianPacific
Islander
Two orMore
RacesSpecial
EdEcon
DisadvEL
(Current)College, Career, and Military Ready Graduates (Student Achievement) ***
College, Career, or Military Ready (Annual Graduates)2017-18 65.5% 64.0% - - - - - - - - - - -
College Ready Graduates ***College Ready (Annual Graduates)
2017-18 50.0% 34.4% - - - - - - - - - - -
TSI Criteria Graduates (Annual Graduates)English Language Arts
2017-18 58.2% 51.2% - - - - - - - - - - -Mathematics
2017-18 46.0% 29.9% - - - - - - - - - - -Both Subjects
2017-18 42.1% 28.4% - - - - - - - - - - -
Dual Course Credits (Annual Graduates)Any Subject
2017-18 20.7% 17.3% - - - - - - - - - - -2016-17 19.9% 21.6% - - - - - - - - - - -
AP/IB Met Criteria in Any Subject (Annual Graduates)Any Subject
2017-18 20.4% 9.5% - - - - - - - - - - -2016-17 20.1% 4.9% - - - - - - - - - - -
Associate's DegreeAssociate's Degree (Annual Graduates)
2017-18 1.4% 0.2% - - - - - - - - - - -2016-17 0.8% 0.0% - - - - - - - - - - -
OnRampsCourse Credits (Annual Graduates)2017-18 1.0% 0.0% - - - - - - - - - - -
Career/Military Ready GraduatesCareer or Military Ready (Annual Graduates)
2017-18 28.7% 41.6% - - - - - - - - - - -2016-17 13.2% 13.1% - - - - - - - - - - -
Approved Industry-Based Certification (Annual Graduates)2017-18 4.8% 9.0% - - - - - - - - - - -2016-17 2.7% 3.8% - - - - - - - - - - -
Graduate with Completed IEP and Workforce Readiness (Annual Graduates)2017-18 1.7% 6.2% - - - - - - - - - - -2016-17 1.0% 0.0% - - - - - - - - - - -
CTE Coherent Sequence Coursework Aligned with Industry-Based Certifications (Annual Graduates)2017-18 38.7% 58.8% - - - - - - - - - - -2016-17 17.3% 14.6% - - - - - - - - - - -
18-19 AAR Page 530
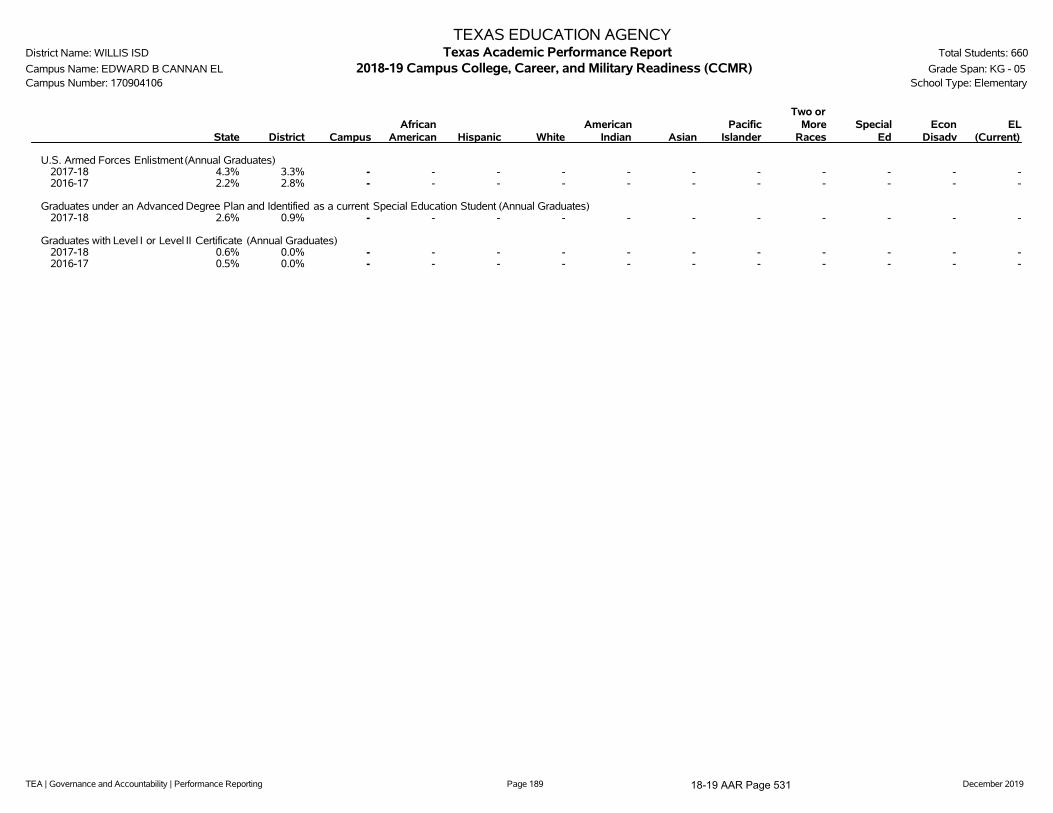
TEA | Governance and Accountability | Performance Reporting Page 189 December 2019
TEXAS EDUCATION AGENCYDistrict Name: WILLIS ISD Texas Academic Performance Report Total Students: 660
Campus Name: EDWARD B CANNAN EL 2018-19 Campus College, Career, and Military Readiness (CCMR) Grade Span: KG - 05Campus Number: 170904106 School Type: Elementary
State District CampusAfrican
American Hispanic WhiteAmerican
Indian AsianPacific
Islander
Two orMore
RacesSpecial
EdEcon
DisadvEL
(Current)
U.S. Armed Forces Enlistment (Annual Graduates)2017-18 4.3% 3.3% - - - - - - - - - - -2016-17 2.2% 2.8% - - - - - - - - - - -
Graduates under an Advanced Degree Plan and Identified as a current Special Education Student (Annual Graduates)2017-18 2.6% 0.9% - - - - - - - - - - -
Graduates with Level I or Level II Certificate (Annual Graduates)2017-18 0.6% 0.0% - - - - - - - - - - -2016-17 0.5% 0.0% - - - - - - - - - - -
18-19 AAR Page 531

TEA | Governance and Accountability | Performance Reporting Page 190 December 2019
TEXAS EDUCATION AGENCYDistrict Name: WILLIS ISD Texas Academic Performance Report Total Students: 660
Campus Name: EDWARD B CANNAN EL 2018-19 Campus CCMR-Related Indicators Grade Span: KG - 05Campus Number: 170904106 School Type: Elementary
State District CampusAfrican
American Hispanic WhiteAmerican
Indian AsianPacific
Islander
Two orMore
RacesSpecial
EdEcon
DisadvEL
(Current)TSIA Results (Graduates >= Criterion) (Annual Graduates)
Reading2017-18 32.1% 36.5% - - - - - - - - - - -2016-17 23.4% 11.3% - - - - - - - - - - -
Mathematics2017-18 23.7% 21.8% - - - - - - - - - - -2016-17 19.8% 11.3% - - - - - - - - - - -
Both Subjects2017-18 18.1% 17.8% - - - - - - - - - - -2016-17 12.9% 5.4% - - - - - - - - - - -
CTE Coherent Sequence (Annual Graduates)2017-18 58.4% 61.8% - - - - - - - - - - -2016-17 50.5% 30.1% - - - - - - - - - - -
Completed and Received Credit for College Prep Courses (Annual Graduates)English Language Arts
2017-18 2.0% 0.0% - - - - - - - - - - -2016-17 0.8% 0.0% - - - - - - - - - - -
Mathematics2017-18 3.9% 0.0% - - - - - - - - - - -2016-17 1.4% 0.0% - - - - - - - - - - -
Both Subjects2017-18 0.9% 0.0% - - - - - - - - - - -2016-17 0.2% 0.0% - - - - - - - - - - -
AP/IB Results (Participation) (Grades 11-12)All Subjects
2018 25.8% 10.3% - - - - - - - - n/a - n/a2017 26.2% 12.1% - - - - - - - - n/a - n/a
English Language Arts2018 15.3% 6.5% - - - - - - - - n/a - n/a2017 15.9% 5.8% - - - - - - - - n/a - n/a
Mathematics2018 7.3% 0.8% - - - - - - - - n/a - n/a2017 7.2% 0.8% - - - - - - - - n/a - n/a
Science2018 10.8% 4.4% - - - - - - - - n/a - n/a2017 10.9% 4.2% - - - - - - - - n/a - n/a
Social Studies2018 14.5% 4.9% - - - - - - - - n/a - n/a2017 15.0% 8.8% - - - - - - - - n/a - n/a
AP/IB Results (Examinees >= Criterion) (Grades 11-12)All Subjects
2018 50.7% 48.5% - - - - - - - - n/a - n/a2017 49.1% 39.3% - - - - - - - - n/a - n/a
English Language Arts2018 42.5% 33.9% - - - - - - - - n/a - n/a2017 41.3% 38.9% - - - - - - - - n/a - n/a
Mathematics2018 52.8% 12.5% - - - - - - - - n/a - n/a
18-19 AAR Page 532
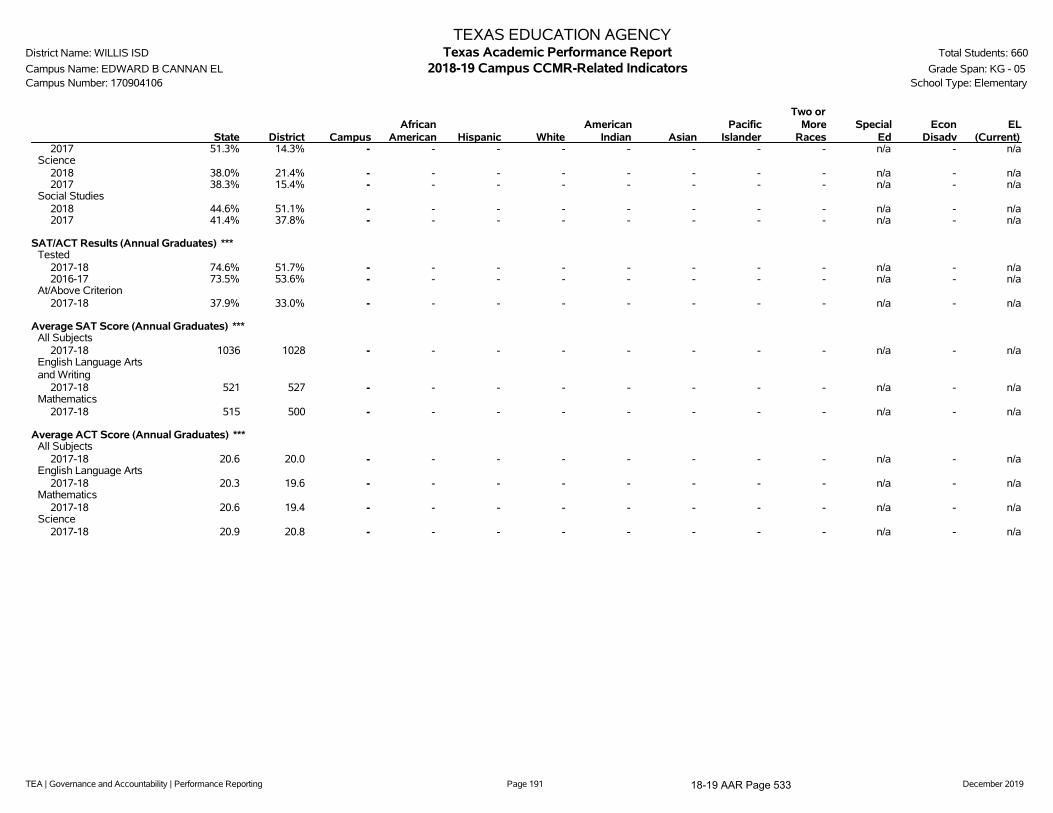
TEA | Governance and Accountability | Performance Reporting Page 191 December 2019
TEXAS EDUCATION AGENCYDistrict Name: WILLIS ISD Texas Academic Performance Report Total Students: 660
Campus Name: EDWARD B CANNAN EL 2018-19 Campus CCMR-Related Indicators Grade Span: KG - 05Campus Number: 170904106 School Type: Elementary
State District CampusAfrican
American Hispanic WhiteAmerican
Indian AsianPacific
Islander
Two orMore
RacesSpecial
EdEcon
DisadvEL
(Current)2017 51.3% 14.3% - - - - - - - - n/a - n/a
Science2018 38.0% 21.4% - - - - - - - - n/a - n/a2017 38.3% 15.4% - - - - - - - - n/a - n/a
Social Studies2018 44.6% 51.1% - - - - - - - - n/a - n/a2017 41.4% 37.8% - - - - - - - - n/a - n/a
SAT/ACT Results (Annual Graduates) ***Tested
2017-18 74.6% 51.7% - - - - - - - - n/a - n/a2016-17 73.5% 53.6% - - - - - - - - n/a - n/a
At/Above Criterion2017-18 37.9% 33.0% - - - - - - - - n/a - n/a
Average SAT Score (Annual Graduates) ***All Subjects
2017-18 1036 1028 - - - - - - - - n/a - n/aEnglish Language Artsand Writing
2017-18 521 527 - - - - - - - - n/a - n/aMathematics
2017-18 515 500 - - - - - - - - n/a - n/a
Average ACT Score (Annual Graduates) ***All Subjects
2017-18 20.6 20.0 - - - - - - - - n/a - n/aEnglish Language Arts
2017-18 20.3 19.6 - - - - - - - - n/a - n/aMathematics
2017-18 20.6 19.4 - - - - - - - - n/a - n/aScience
2017-18 20.9 20.8 - - - - - - - - n/a - n/a
18-19 AAR Page 533
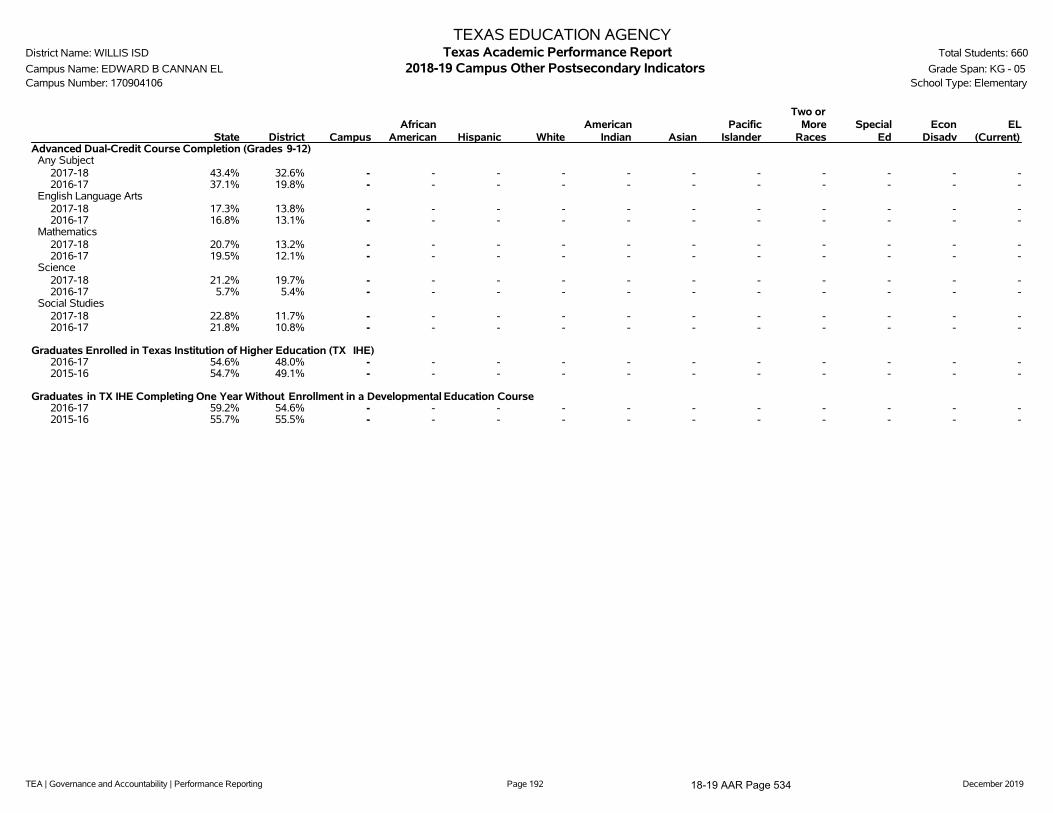
TEA | Governance and Accountability | Performance Reporting Page 192 December 2019
TEXAS EDUCATION AGENCYDistrict Name: WILLIS ISD Texas Academic Performance Report Total Students: 660
Campus Name: EDWARD B CANNAN EL 2018-19 Campus Other Postsecondary Indicators Grade Span: KG - 05Campus Number: 170904106 School Type: Elementary
State District CampusAfrican
American Hispanic WhiteAmerican
Indian AsianPacific
Islander
Two orMore
RacesSpecial
EdEcon
DisadvEL
(Current)Advanced Dual-Credit Course Completion (Grades 9-12)
Any Subject2017-18 43.4% 32.6% - - - - - - - - - - -2016-17 37.1% 19.8% - - - - - - - - - - -
English Language Arts2017-18 17.3% 13.8% - - - - - - - - - - -2016-17 16.8% 13.1% - - - - - - - - - - -
Mathematics2017-18 20.7% 13.2% - - - - - - - - - - -2016-17 19.5% 12.1% - - - - - - - - - - -
Science2017-18 21.2% 19.7% - - - - - - - - - - -2016-17 5.7% 5.4% - - - - - - - - - - -
Social Studies2017-18 22.8% 11.7% - - - - - - - - - - -2016-17 21.8% 10.8% - - - - - - - - - - -
Graduates Enrolled in Texas Institution of Higher Education (TX IHE)2016-17 54.6% 48.0% - - - - - - - - - - -2015-16 54.7% 49.1% - - - - - - - - - - -
Graduates in TX IHE Completing One Year Without Enrollment in a Developmental Education Course2016-17 59.2% 54.6% - - - - - - - - - - -2015-16 55.7% 55.5% - - - - - - - - - - -
18-19 AAR Page 534

TEA | Governance and Accountability | Performance Reporting Page 193 December 2019
TEXAS EDUCATION AGENCYDistrict Name: WILLIS ISD Texas Academic Performance Report Total Students: 660
Campus Name: EDWARD B CANNAN EL 2018-19 Campus Student Information Grade Span: KG - 05Campus Number: 170904106 School Type: Elementary
---------------- Campus ----------------Student Information Count Percent District State
Total Students 660 100.0% 7,469 5,416,400
Students by Grade:Early Childhood Education 0 0.0% 0.8% 0.3%Pre-Kindergarten 0 0.0% 2.3% 4.4%Kindergarten 91 13.8% 6.5% 6.9%Grade 1 115 17.4% 7.6% 7.1%Grade 2 97 14.7% 7.6% 7.2%Grade 3 125 18.9% 7.9% 7.3%Grade 4 127 19.2% 8.4% 7.6%Grade 5 105 15.9% 7.8% 7.7%Grade 6 0 0.0% 7.6% 7.7%Grade 7 0 0.0% 7.8% 7.5%Grade 8 0 0.0% 7.4% 7.5%Grade 9 0 0.0% 9.6% 8.1%Grade 10 0 0.0% 6.3% 7.4%Grade 11 0 0.0% 6.3% 6.9%Grade 12 0 0.0% 6.0% 6.5%
Ethnic Distribution:African American 22 3.3% 6.9% 12.6%Hispanic 316 47.9% 37.0% 52.6%White 301 45.6% 51.9% 27.4%American Indian 1 0.2% 0.4% 0.4%Asian 1 0.2% 0.6% 4.5%Pacific Islander 0 0.0% 0.1% 0.2%Two or More Races 19 2.9% 3.1% 2.4%
Economically Disadvantaged 476 72.1% 60.1% 60.6%Non-Educationally Disadvantaged 184 27.9% 39.9% 39.4%Section 504 Students 42 6.4% 6.1% 6.5%English Learners (EL) 238 36.1% 14.4% 19.5%Students w/ Disciplinary Placements (2017-18) 0 0.0% 1.8% 1.4%Students w/ Dyslexia 7 1.1% 2.6% 3.6%At-Risk 468 70.9% 50.8% 50.1%
Students with Disabilities by Type of Primary Disability:Total Students with Disabilities 61By Type of Primary Disability
Students with Intellectual Disabilities 19 31.1% 38.4% 42.4%Students with Physical Disabilities 25 41.0% 21.4% 21.9%Students with Autism 11 18.0% 19.0% 13.7%Students with Behavioral Disabilities ** ** 19.2% 20.6%Students with Non-Categorical Early Childhood * * 2.1% 1.4%
Mobility (2017-18):Total Mobile Students 87 14.2% 19.0% 15.4%
18-19 AAR Page 535

TEA | Governance and Accountability | Performance Reporting Page 194 December 2019
TEXAS EDUCATION AGENCYDistrict Name: WILLIS ISD Texas Academic Performance Report Total Students: 660
Campus Name: EDWARD B CANNAN EL 2018-19 Campus Student Information Grade Span: KG - 05Campus Number: 170904106 School Type: Elementary
---------------- Campus ----------------Student Information Count Percent District State
By Ethnicity:African American 7 1.1%Hispanic 32 5.2%White 47 7.7%American Indian 0 0.0%Asian 0 0.0%Pacific Islander 0 0.0%Two or More Races 1 0.2%
--------Non-Special Education Rates-------- --------Special Education Rates--------Student Information Campus District State Campus District State
Retention Rates by Grade:Kindergarten 0.0% 0.4% 1.7% 0.0% 3.8% 6.2%Grade 1 2.2% 2.0% 3.1% 10.0% 5.7% 5.5%Grade 2 1.8% 1.3% 1.8% 0.0% 2.2% 2.3%Grade 3 0.0% 1.2% 1.1% 0.0% 2.1% 0.9%Grade 4 0.0% 0.0% 0.5% 0.0% 0.0% 0.5%Grade 5 0.0% 0.2% 0.5% 0.0% 1.8% 0.6%Grade 6 - 0.4% 0.4% - 0.0% 0.5%Grade 7 - 1.0% 0.6% - 0.0% 0.6%Grade 8 - 0.0% 0.4% - 0.0% 0.7%Grade 9 - 17.2% 7.2% - 34.0% 12.7%
Class Size Information Campus District State
Class Size Averages by Grade and Subject(Derived from teacher responsibility records):
Elementary:Kindergarten 20.7 20.9 18.9Grade 1 19.3 19.8 18.8Grade 2 18.9 19.1 18.7Grade 3 20.3 20.1 18.9Grade 4 20.7 20.0 19.2Grade 5 20.5 23.0 21.2Grade 6 - 19.3 20.4
Secondary:English/Language Arts - 15.9 16.6Foreign Languages - 21.8 18.9Mathematics - 16.7 17.8Science - 18.4 18.9Social Studies - 18.1 19.3
18-19 AAR Page 536

TEA | Governance and Accountability | Performance Reporting Page 195 December 2019
TEXAS EDUCATION AGENCYDistrict Name: WILLIS ISD Texas Academic Performance Report Total Students: 660
Campus Name: EDWARD B CANNAN EL 2018-19 Campus Staff Information Grade Span: KG - 05Campus Number: 170904106 School Type: Elementary
---------------- Campus ----------------Staff Information Count/Average Percent District State
Total Staff 60.9 100.0% 100.0% 100.0%
Professional Staff: 46.0 75.6% 57.6% 64.1%Teachers 40.0 65.7% 44.8% 49.8%Professional Support 4.0 6.6% 9.2% 10.1%Campus Administration (School Leadership) 2.0 3.3% 2.9% 3.0%
Educational Aides: 14.9 24.4% 11.0% 10.3%
Librarians & Counselors (Headcount):Librarians
Full-time 0.0 n/a 0.0 4,414.0Part-time 0.0 n/a 0.0 572.0
CounselorsFull-time 1.0 n/a 12.0 12,433.0Part-time 0.0 n/a 2.0 1,097.0
Total Minority Staff: 23.0 37.8% 27.1% 50.4%
Teachers by Ethnicity and Sex:African American 0.0 0.0% 2.8% 10.6%Hispanic 15.0 37.5% 14.2% 27.7%White 25.0 62.5% 82.1% 58.4%American Indian 0.0 0.0% 0.2% 0.3%Asian 0.0 0.0% 0.2% 1.7%Pacific Islander 0.0 0.0% 0.0% 0.2%Two or More Races 0.0 0.0% 0.5% 1.1%
Males 3.0 7.5% 18.6% 23.8%Females 37.0 92.5% 81.4% 76.2%
Teachers by Highest Degree Held:No Degree 0.0 0.0% 0.5% 1.4%Bachelors 36.0 90.0% 81.7% 73.6%Masters 3.0 7.5% 17.4% 24.3%Doctorate 1.0 2.5% 0.5% 0.7%
Teachers by Years of Experience:Beginning Teachers 2.0 5.0% 8.0% 7.0%1-5 Years Experience 17.0 42.5% 31.7% 28.9%6-10 Years Experience 9.0 22.5% 17.5% 19.0%11-20 Years Experience 9.0 22.5% 24.9% 29.3%Over 20 Years Experience 3.0 7.5% 17.9% 15.7%
Number of Students per Teacher 16.5 n/a 17.2 15.1
18-19 AAR Page 537

TEA | Governance and Accountability | Performance Reporting Page 196 December 2019
TEXAS EDUCATION AGENCYDistrict Name: WILLIS ISD Texas Academic Performance Report Total Students: 660
Campus Name: EDWARD B CANNAN EL 2018-19 Campus Staff Information Grade Span: KG - 05Campus Number: 170904106 School Type: Elementary
Staff Information Campus District State
Experience of Campus Leadership:Average Years Experience of Principals 3.0 2.8 6.3Average Years Experience of Principals with District 3.0 2.8 5.4Average Years Experience of Assistant Principals 13.0 6.1 5.3Average Years Experience of Assistant Principals with District 7.0 4.2 4.7
Average Years Experience of Teachers: 8.2 10.7 11.1Average Years Experience of Teachers with District: 5.8 6.5 7.2
Average Teacher Salary by Years of Experience (regular duties only):Beginning Teachers $48,291 $45,854 $47,2181-5 Years Experience $49,540 $50,779 $50,4086-10 Years Experience $52,318 $52,839 $52,78611-20 Years Experience $56,516 $57,036 $56,041Over 20 Years Experience $65,220 $63,917 $62,039
Average Actual Salaries (regular duties only):Teachers $52,849 $54,658 $54,122Professional Support $61,542 $65,409 $64,069Campus Administration (School Leadership) $82,093 $78,467 $78,947
Instructional Staff Percent: n/a 60.4% 64.5%
Contracted Instructional Staff (not incl. above): 0.7 1.5 6,043.6
18-19 AAR Page 538

TEA | Governance and Accountability | Performance Reporting Page 197 December 2019
TEXAS EDUCATION AGENCYDistrict Name: WILLIS ISD Texas Academic Performance Report Total Students: 660
Campus Name: EDWARD B CANNAN EL 2018-19 Campus Staff Information Grade Span: KG - 05Campus Number: 170904106 School Type: Elementary
---------------- Campus ----------------Program Information Count Percent District State
Student Enrollment by Program:Bilingual/ESL Education 233 35.3% 13.6% 19.7%Career & Technical Education 0 0.0% 21.5% 26.3%Gifted & Talented Education 19 2.9% 5.4% 8.1%Special Education 61 9.2% 8.4% 9.6%
Teachers by Program (population served):Bilingual/ESL Education 4.0 10.0% 2.8% 6.4%Career & Technical Education 0.0 0.0% 4.5% 4.9%Compensatory Education 0.0 0.0% 0.0% 2.7%Gifted & Talented Education 0.0 0.0% 0.0% 2.0%Regular Education 33.0 82.5% 76.9% 71.4%Special Education 3.0 7.5% 8.5% 9.1%Other 0.0 0.0% 7.3% 3.6%
' '̂ Indicates that rates for reading and mathematics are based on the cumulative results from the first and second administrations of STAAR.'*' Indicates results are masked due to small numbers to protect student confidentiality.'**' When only one student disability group is masked, then the second smallest student disability group is masked regardless of size.'***' Due to changes in the evaluation of SAT/ACT results (for 2017-18 the best result was used, rather than the most recent), 2016-17 SAT/ACT results are not
comparable and, where applicable, are not shown.'-' Indicates there are no students in the group.'n/a' Indicates data reporting is not applicable for this group.'?' Indicates that the data for this item were statistically improbable or were reported outside a reasonable range.
Link to: PEIMS Financial Standard Reports 2017-18 Financial Actual Report
18-19 AAR Page 539
TEA | Governance and Accountability | Performance Reporting Page 198 December 2019
2018-19 Texas Academic Performance Report
District Name: WILLIS ISD
Campus Name: W LLOYD MEADOR EL
Campus Number: 170904107
2019 Accountability Rating: B
18-19 AAR Page 540

TEA | Governance and Accountability | Performance Reporting Page 199 December 2019
This page is intentionally blank.
18-19 AAR Page 541
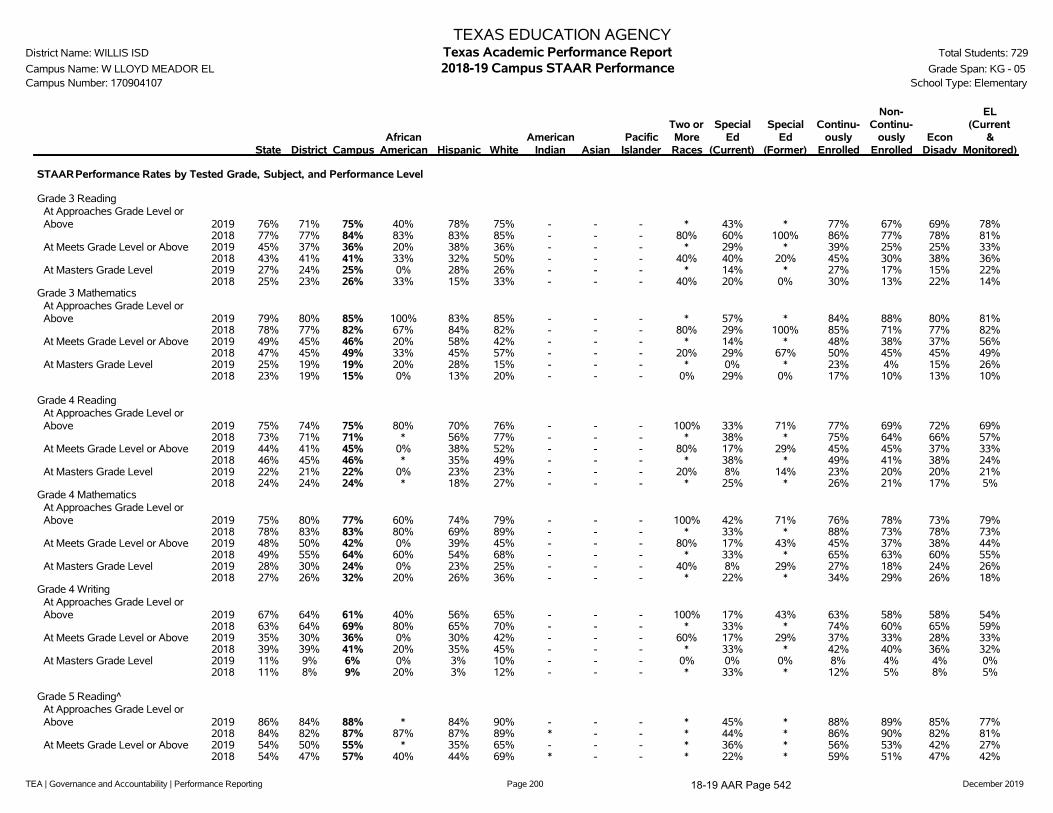
TEA | Governance and Accountability | Performance Reporting Page 200 December 2019
TEXAS EDUCATION AGENCYDistrict Name: WILLIS ISD Texas Academic Performance Report Total Students: 729
Campus Name: W LLOYD MEADOR EL 2018-19 Campus STAAR Performance Grade Span: KG - 05Campus Number: 170904107 School Type: Elementary
State District CampusAfrican
American Hispanic WhiteAmerican
Indian AsianPacific
Islander
Two orMoreRaces
SpecialEd
(Current)
SpecialEd
(Former)
Continu-ously
Enrolled
Non-Continu-
ouslyEnrolled
EconDisadv
EL(Current
&Monitored)
STAARPerformance Rates by Tested Grade, Subject, and Performance Level
Grade 3 ReadingAt Approaches Grade Level orAbove 2019 76% 71% 75% 40% 78% 75% - - - * 43% * 77% 67% 69% 78%
2018 77% 77% 84% 83% 83% 85% - - - 80% 60% 100% 86% 77% 78% 81%At Meets Grade Level or Above 2019 45% 37% 36% 20% 38% 36% - - - * 29% * 39% 25% 25% 33%
2018 43% 41% 41% 33% 32% 50% - - - 40% 40% 20% 45% 30% 38% 36%At Masters Grade Level 2019 27% 24% 25% 0% 28% 26% - - - * 14% * 27% 17% 15% 22%
2018 25% 23% 26% 33% 15% 33% - - - 40% 20% 0% 30% 13% 22% 14%Grade 3 Mathematics
At Approaches Grade Level orAbove 2019 79% 80% 85% 100% 83% 85% - - - * 57% * 84% 88% 80% 81%
2018 78% 77% 82% 67% 84% 82% - - - 80% 29% 100% 85% 71% 77% 82%At Meets Grade Level or Above 2019 49% 45% 46% 20% 58% 42% - - - * 14% * 48% 38% 37% 56%
2018 47% 45% 49% 33% 45% 57% - - - 20% 29% 67% 50% 45% 45% 49%At Masters Grade Level 2019 25% 19% 19% 20% 28% 15% - - - * 0% * 23% 4% 15% 26%
2018 23% 19% 15% 0% 13% 20% - - - 0% 29% 0% 17% 10% 13% 10%
Grade 4 ReadingAt Approaches Grade Level orAbove 2019 75% 74% 75% 80% 70% 76% - - - 100% 33% 71% 77% 69% 72% 69%
2018 73% 71% 71% * 56% 77% - - - * 38% * 75% 64% 66% 57%At Meets Grade Level or Above 2019 44% 41% 45% 0% 38% 52% - - - 80% 17% 29% 45% 45% 37% 33%
2018 46% 45% 46% * 35% 49% - - - * 38% * 49% 41% 38% 24%At Masters Grade Level 2019 22% 21% 22% 0% 23% 23% - - - 20% 8% 14% 23% 20% 20% 21%
2018 24% 24% 24% * 18% 27% - - - * 25% * 26% 21% 17% 5%Grade 4 Mathematics
At Approaches Grade Level orAbove 2019 75% 80% 77% 60% 74% 79% - - - 100% 42% 71% 76% 78% 73% 79%
2018 78% 83% 83% 80% 69% 89% - - - * 33% * 88% 73% 78% 73%At Meets Grade Level or Above 2019 48% 50% 42% 0% 39% 45% - - - 80% 17% 43% 45% 37% 38% 44%
2018 49% 55% 64% 60% 54% 68% - - - * 33% * 65% 63% 60% 55%At Masters Grade Level 2019 28% 30% 24% 0% 23% 25% - - - 40% 8% 29% 27% 18% 24% 26%
2018 27% 26% 32% 20% 26% 36% - - - * 22% * 34% 29% 26% 18%Grade 4 Writing
At Approaches Grade Level orAbove 2019 67% 64% 61% 40% 56% 65% - - - 100% 17% 43% 63% 58% 58% 54%
2018 63% 64% 69% 80% 65% 70% - - - * 33% * 74% 60% 65% 59%At Meets Grade Level or Above 2019 35% 30% 36% 0% 30% 42% - - - 60% 17% 29% 37% 33% 28% 33%
2018 39% 39% 41% 20% 35% 45% - - - * 33% * 42% 40% 36% 32%At Masters Grade Level 2019 11% 9% 6% 0% 3% 10% - - - 0% 0% 0% 8% 4% 4% 0%
2018 11% 8% 9% 20% 3% 12% - - - * 33% * 12% 5% 8% 5%
Grade 5 Reading^At Approaches Grade Level orAbove 2019 86% 84% 88% * 84% 90% - - - * 45% * 88% 89% 85% 77%
2018 84% 82% 87% 87% 87% 89% * - - * 44% * 86% 90% 82% 81%At Meets Grade Level or Above 2019 54% 50% 55% * 35% 65% - - - * 36% * 56% 53% 42% 27%
2018 54% 47% 57% 40% 44% 69% * - - * 22% * 59% 51% 47% 42%
18-19 AAR Page 542

TEA | Governance and Accountability | Performance Reporting Page 201 December 2019
TEXAS EDUCATION AGENCYDistrict Name: WILLIS ISD Texas Academic Performance Report Total Students: 729
Campus Name: W LLOYD MEADOR EL 2018-19 Campus STAAR Performance Grade Span: KG - 05Campus Number: 170904107 School Type: Elementary
State District CampusAfrican
American Hispanic WhiteAmerican
Indian AsianPacific
Islander
Two orMoreRaces
SpecialEd
(Current)
SpecialEd
(Former)
Continu-ously
Enrolled
Non-Continu-
ouslyEnrolled
EconDisadv
EL(Current
&Monitored)
At Masters Grade Level 2019 29% 25% 32% * 14% 40% - - - * 27% * 33% 31% 18% 0%2018 26% 20% 26% 7% 20% 36% * - - * 0% * 26% 27% 22% 16%
Grade 5 Mathematics^At Approaches Grade Level orAbove 2019 90% 93% 96% * 92% 98% - - - * 82% * 98% 93% 96% 91%
2018 91% 92% 96% 100% 95% 95% * - - * 83% * 99% 90% 94% 97%At Meets Grade Level or Above 2019 58% 66% 78% * 59% 84% - - - * 73% * 80% 73% 70% 59%
2018 58% 64% 74% 50% 80% 77% * - - * 33% * 78% 66% 69% 73%At Masters Grade Level 2019 36% 44% 54% * 38% 59% - - - * 45% * 54% 53% 47% 23%
2018 30% 32% 38% 14% 30% 49% * - - * 17% * 40% 34% 33% 30%Grade 5 Science
At Approaches Grade Level orAbove 2019 75% 72% 75% * 65% 80% - - - * 36% * 76% 73% 73% 59%
2018 76% 72% 75% 53% 66% 88% * - - * 60% * 76% 74% 65% 58%At Meets Grade Level or Above 2019 49% 43% 47% * 38% 51% - - - * 36% * 44% 52% 40% 32%
2018 41% 33% 37% 20% 20% 53% * - - * 30% * 41% 29% 24% 13%At Masters Grade Level 2019 24% 18% 19% * 19% 20% - - - * 27% * 20% 18% 15% 9%
2018 17% 12% 13% 7% 7% 20% * - - * 10% * 12% 17% 8% 3%
All Grades All SubjectsAt Approaches Grade Level orAbove 2019 78% 76% 79% 68% 74% 82% - - - 100% 43% 67% 79% 77% 76% 73%
2018 77% 75% 81% 79% 77% 84% 67% - - 83% 46% 76% 84% 75% 76% 75%At Meets Grade Level or Above 2019 50% 45% 48% 22% 41% 53% - - - 68% 30% 36% 49% 46% 40% 39%
2018 48% 45% 51% 39% 43% 58% 33% - - 44% 32% 40% 53% 46% 45% 41%At Masters Grade Level 2019 24% 19% 25% 16% 21% 28% - - - 23% 17% 15% 26% 22% 20% 16%
2018 22% 18% 23% 13% 16% 29% 17% - - 22% 19% 12% 24% 20% 19% 13%All Grades ELA/Reading
At Approaches Grade Level orAbove 2019 75% 72% 79% 64% 76% 81% - - - 100% 40% 67% 80% 76% 76% 74%
2018 74% 72% 81% 84% 77% 83% * - - 88% 45% 78% 83% 77% 76% 75%At Meets Grade Level or Above 2019 48% 43% 46% 14% 37% 52% - - - 75% 27% 33% 46% 44% 35% 32%
2018 46% 41% 48% 44% 37% 56% * - - 50% 32% 33% 51% 42% 41% 35%At Masters Grade Level 2019 21% 17% 26% 7% 22% 30% - - - 25% 17% 8% 27% 24% 18% 16%
2018 19% 16% 25% 16% 17% 32% * - - 38% 14% 11% 27% 21% 20% 13%All Grades Mathematics
At Approaches Grade Level orAbove 2019 82% 81% 85% 86% 81% 88% - - - 100% 60% 83% 85% 86% 83% 83%
2018 81% 81% 87% 88% 84% 89% * - - 88% 45% 91% 91% 79% 83% 85%At Meets Grade Level or Above 2019 52% 49% 55% 36% 50% 59% - - - 63% 37% 42% 57% 51% 48% 51%
2018 50% 49% 62% 48% 59% 68% * - - 38% 32% 64% 63% 59% 58% 58%At Masters Grade Level 2019 26% 23% 32% 29% 28% 35% - - - 38% 20% 25% 34% 29% 29% 25%
2018 24% 21% 28% 12% 21% 35% * - - 13% 23% 18% 29% 26% 24% 19%All Grades Writing
At Approaches Grade Level orAbove 2019 68% 64% 61% 40% 56% 65% - - - 100% 17% 43% 63% 58% 58% 54%
2018 66% 65% 69% 80% 65% 70% - - - * 33% * 74% 60% 65% 59%At Meets Grade Level or Above 2019 38% 31% 36% 0% 30% 42% - - - 60% 17% 29% 37% 33% 28% 33%
2018 41% 38% 41% 20% 35% 45% - - - * 33% * 42% 40% 36% 32%At Masters Grade Level 2019 14% 10% 6% 0% 3% 10% - - - 0% 0% 0% 8% 4% 4% 0%
2018 13% 8% 9% 20% 3% 12% - - - * 33% * 12% 5% 8% 5%
18-19 AAR Page 543

TEA | Governance and Accountability | Performance Reporting Page 202 December 2019
TEXAS EDUCATION AGENCYDistrict Name: WILLIS ISD Texas Academic Performance Report Total Students: 729
Campus Name: W LLOYD MEADOR EL 2018-19 Campus STAAR Performance Grade Span: KG - 05Campus Number: 170904107 School Type: Elementary
State District CampusAfrican
American Hispanic WhiteAmerican
Indian AsianPacific
Islander
Two orMoreRaces
SpecialEd
(Current)
SpecialEd
(Former)
Continu-ously
Enrolled
Non-Continu-
ouslyEnrolled
EconDisadv
EL(Current
&Monitored)
All Grades ScienceAt Approaches Grade Level orAbove 2019 81% 81% 75% * 65% 80% - - - * 36% * 76% 73% 73% 59%
2018 80% 77% 75% 53% 66% 88% * - - * 60% * 76% 74% 65% 58%At Meets Grade Level or Above 2019 54% 51% 47% * 38% 51% - - - * 36% * 44% 52% 40% 32%
2018 51% 46% 37% 20% 20% 53% * - - * 30% * 41% 29% 24% 13%At Masters Grade Level 2019 25% 20% 19% * 19% 20% - - - * 27% * 20% 18% 15% 9%
2018 23% 18% 13% 7% 7% 20% * - - * 10% * 12% 17% 8% 3%
18-19 AAR Page 544
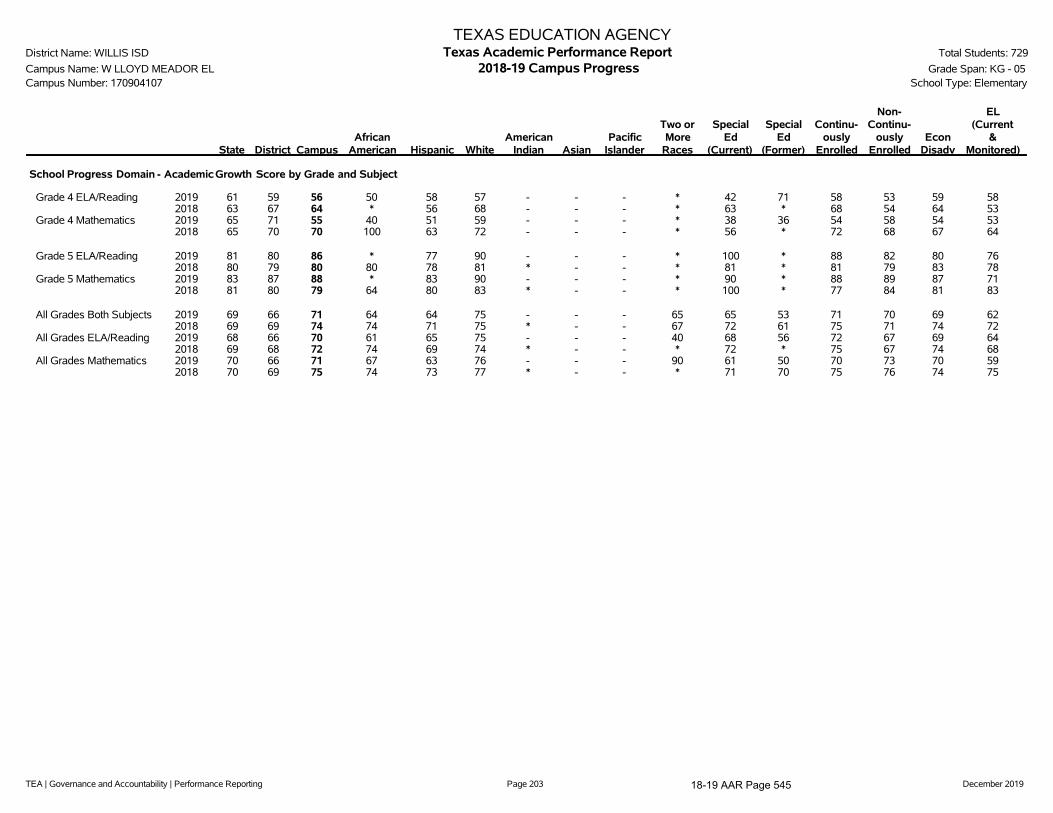
TEA | Governance and Accountability | Performance Reporting Page 203 December 2019
TEXAS EDUCATION AGENCYDistrict Name: WILLIS ISD Texas Academic Performance Report Total Students: 729
Campus Name: W LLOYD MEADOR EL 2018-19 Campus Progress Grade Span: KG - 05Campus Number: 170904107 School Type: Elementary
State District CampusAfrican
American Hispanic WhiteAmerican
Indian AsianPacific
Islander
Two orMore
Races
SpecialEd
(Current)
SpecialEd
(Former)
Continu-ously
Enrolled
Non-Continu-
ouslyEnrolled
EconDisadv
EL(Current
&Monitored)
School Progress Domain - Academic Growth Score by Grade and Subject
Grade 4 ELA/Reading 2019 61 59 56 50 58 57 - - - * 42 71 58 53 59 582018 63 67 64 * 56 68 - - - * 63 * 68 54 64 53
Grade 4 Mathematics 2019 65 71 55 40 51 59 - - - * 38 36 54 58 54 532018 65 70 70 100 63 72 - - - * 56 * 72 68 67 64
Grade 5 ELA/Reading 2019 81 80 86 * 77 90 - - - * 100 * 88 82 80 762018 80 79 80 80 78 81 * - - * 81 * 81 79 83 78
Grade 5 Mathematics 2019 83 87 88 * 83 90 - - - * 90 * 88 89 87 712018 81 80 79 64 80 83 * - - * 100 * 77 84 81 83
All Grades Both Subjects 2019 69 66 71 64 64 75 - - - 65 65 53 71 70 69 622018 69 69 74 74 71 75 * - - 67 72 61 75 71 74 72
All Grades ELA/Reading 2019 68 66 70 61 65 75 - - - 40 68 56 72 67 69 642018 69 68 72 74 69 74 * - - * 72 * 75 67 74 68
All Grades Mathematics 2019 70 66 71 67 63 76 - - - 90 61 50 70 73 70 592018 70 69 75 74 73 77 * - - * 71 70 75 76 74 75
18-19 AAR Page 545

TEA | Governance and Accountability | Performance Reporting Page 204 December 2019
TEXAS EDUCATION AGENCYDistrict Name: WILLIS ISD Texas Academic Performance Report Total Students: 729
Campus Name: W LLOYD MEADOR EL 2018-19 Campus Prior Year and Student Success Initiative Grade Span: KG - 05Campus Number: 170904107 School Type: Elementary
State District CampusAfrican
American Hispanic WhiteAmerican
Indian AsianPacific
Islander
Two orMore
RacesSpecial
EdEcon
DisadvEL
(Current)
Progress of Prior-Year Non-Proficient Students
Sum of Grades 4-8
Reading 2019 41% 39% 44% * 40% 48% - - - - 0% 40% 20%2018 38% 37% 46% * 45% 46% * - - - * 46% 41%
Mathematics 2019 45% 48% 56% * 63% 52% - - - - 43% 58% 73%2018 47% 48% 44% * 58% * - - - - * 50% 63%
Student Success Initiative
Grade 5 ReadingStudents Meeting Approaches Grade Level on First STAARAdministration
2019 78% 76% 81% * 78% 84% - - - * 13% 77% 45%Students Requiring Accelerated Instruction
2019 22% 24% 19% * 22% 16% - - - * 88% 23% 55%STAARCumulativeMet Standard
2019 86% 84% 88% * 84% 90% - - - * 25% 85% 58%STAARNon-Proficient Students Promoted by Grade Placement Committee
2018 97% 100% 100% * 100% 100% - - - - * 100% 100%
Grade 5 MathematicsStudents Meeting Approaches Grade Level on First STAARAdministration
2019 83% 87% 93% * 89% 96% - - - * 63% 91% 75%Students Requiring Accelerated Instruction
2019 17% 13% 7% * 11% 4% - - - * 38% 9% 25%STAARCumulativeMet Standard
2019 90% 93% 96% * 92% 98% - - - * 75% 96% 83%STAARNon-Proficient Students Promoted by Grade Placement Committee
2018 97% 100% 100% - * * - - - - * 100% *
18-19 AAR Page 546
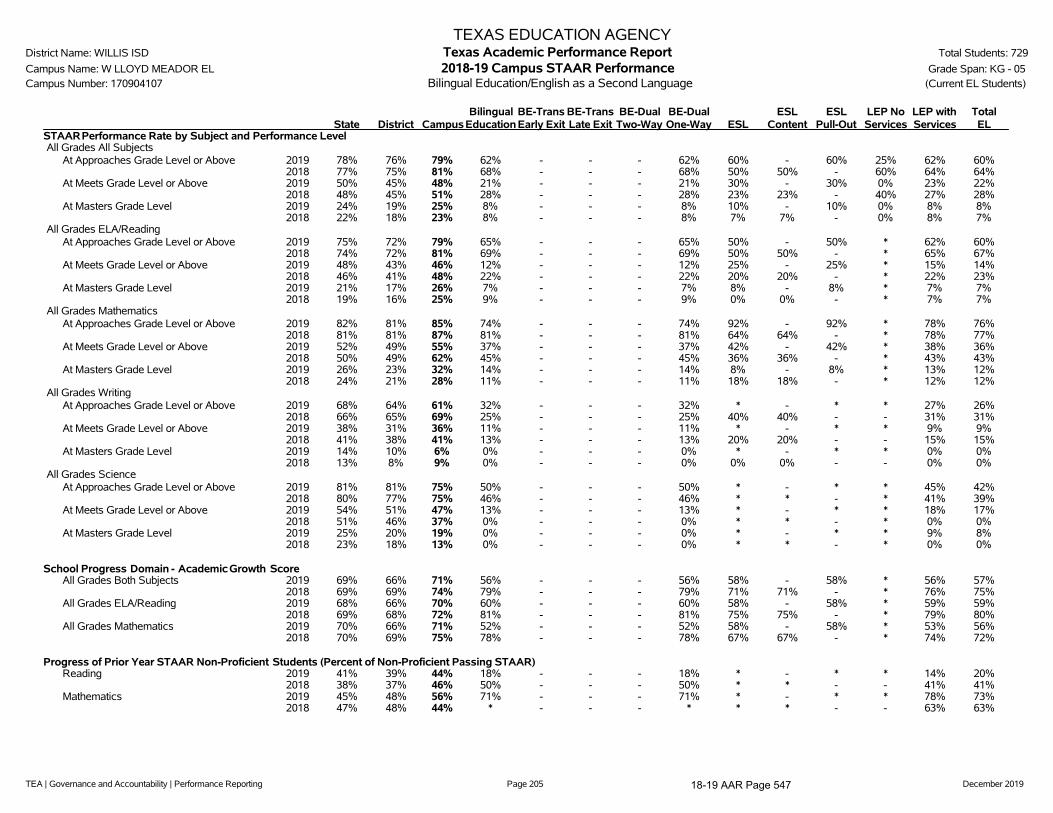
TEA | Governance and Accountability | Performance Reporting Page 205 December 2019
TEXAS EDUCATION AGENCYDistrict Name: WILLIS ISD Texas Academic Performance Report Total Students: 729
Campus Name: W LLOYD MEADOR EL 2018-19 Campus STAAR Performance Grade Span: KG - 05Campus Number: 170904107 Bilingual Education/English as a Second Language (Current EL Students)
State District CampusBilingual
EducationBE-TransEarly Exit
BE-TransLate Exit
BE-DualTwo-Way
BE-DualOne-Way ESL
ESLContent
ESLPull-Out
LEP NoServices
LEP withServices
TotalEL
STAARPerformance Rate by Subject and Performance LevelAll Grades All Subjects
At Approaches Grade Level or Above 2019 78% 76% 79% 62% - - - 62% 60% - 60% 25% 62% 60%2018 77% 75% 81% 68% - - - 68% 50% 50% - 60% 64% 64%
At Meets Grade Level or Above 2019 50% 45% 48% 21% - - - 21% 30% - 30% 0% 23% 22%2018 48% 45% 51% 28% - - - 28% 23% 23% - 40% 27% 28%
At Masters Grade Level 2019 24% 19% 25% 8% - - - 8% 10% - 10% 0% 8% 8%2018 22% 18% 23% 8% - - - 8% 7% 7% - 0% 8% 7%
All Grades ELA/ReadingAt Approaches Grade Level or Above 2019 75% 72% 79% 65% - - - 65% 50% - 50% * 62% 60%
2018 74% 72% 81% 69% - - - 69% 50% 50% - * 65% 67%At Meets Grade Level or Above 2019 48% 43% 46% 12% - - - 12% 25% - 25% * 15% 14%
2018 46% 41% 48% 22% - - - 22% 20% 20% - * 22% 23%At Masters Grade Level 2019 21% 17% 26% 7% - - - 7% 8% - 8% * 7% 7%
2018 19% 16% 25% 9% - - - 9% 0% 0% - * 7% 7%All Grades Mathematics
At Approaches Grade Level or Above 2019 82% 81% 85% 74% - - - 74% 92% - 92% * 78% 76%2018 81% 81% 87% 81% - - - 81% 64% 64% - * 78% 77%
At Meets Grade Level or Above 2019 52% 49% 55% 37% - - - 37% 42% - 42% * 38% 36%2018 50% 49% 62% 45% - - - 45% 36% 36% - * 43% 43%
At Masters Grade Level 2019 26% 23% 32% 14% - - - 14% 8% - 8% * 13% 12%2018 24% 21% 28% 11% - - - 11% 18% 18% - * 12% 12%
All Grades WritingAt Approaches Grade Level or Above 2019 68% 64% 61% 32% - - - 32% * - * * 27% 26%
2018 66% 65% 69% 25% - - - 25% 40% 40% - - 31% 31%At Meets Grade Level or Above 2019 38% 31% 36% 11% - - - 11% * - * * 9% 9%
2018 41% 38% 41% 13% - - - 13% 20% 20% - - 15% 15%At Masters Grade Level 2019 14% 10% 6% 0% - - - 0% * - * * 0% 0%
2018 13% 8% 9% 0% - - - 0% 0% 0% - - 0% 0%All Grades Science
At Approaches Grade Level or Above 2019 81% 81% 75% 50% - - - 50% * - * * 45% 42%2018 80% 77% 75% 46% - - - 46% * * - * 41% 39%
At Meets Grade Level or Above 2019 54% 51% 47% 13% - - - 13% * - * * 18% 17%2018 51% 46% 37% 0% - - - 0% * * - * 0% 0%
At Masters Grade Level 2019 25% 20% 19% 0% - - - 0% * - * * 9% 8%2018 23% 18% 13% 0% - - - 0% * * - * 0% 0%
School Progress Domain - Academic Growth ScoreAll Grades Both Subjects 2019 69% 66% 71% 56% - - - 56% 58% - 58% * 56% 57%
2018 69% 69% 74% 79% - - - 79% 71% 71% - * 76% 75%All Grades ELA/Reading 2019 68% 66% 70% 60% - - - 60% 58% - 58% * 59% 59%
2018 69% 68% 72% 81% - - - 81% 75% 75% - * 79% 80%All Grades Mathematics 2019 70% 66% 71% 52% - - - 52% 58% - 58% * 53% 56%
2018 70% 69% 75% 78% - - - 78% 67% 67% - * 74% 72%
Progress of Prior Year STAAR Non-Proficient Students (Percent of Non-Proficient Passing STAAR)Reading 2019 41% 39% 44% 18% - - - 18% * - * * 14% 20%
2018 38% 37% 46% 50% - - - 50% * * - - 41% 41%Mathematics 2019 45% 48% 56% 71% - - - 71% * - * * 78% 73%
2018 47% 48% 44% * - - - * * * - - 63% 63%
18-19 AAR Page 547

TEA | Governance and Accountability | Performance Reporting Page 206 December 2019
TEXAS EDUCATION AGENCYDistrict Name: WILLIS ISD Texas Academic Performance Report Total Students: 729
Campus Name: W LLOYD MEADOR EL 2018-19 Campus STAAR Participation Grade Span: KG - 05Campus Number: 170904107 School Type: Elementary
State District CampusAfrican
American Hispanic WhiteAmerican
Indian AsianPacific
Islander
Two orMore
RacesSpecial
EdEcon
DisadvEL
(Current)2019 STAARParticipation
(All Grades)
All TestsAssessment Participant 99% 100% 100% 100% 100% 100% - - - 100% 100% 100% 100%
Included in Accountability 94% 94% 96% 95% 97% 95% - - - 100% 90% 94% 100%Not Included in Accountability
Mobile 4% 5% 4% 5% 3% 5% - - - 0% 10% 6% 0%Other Exclusions 1% 1% 0% 0% 0% 0% - - - 0% 0% 0% 0%
Not Tested 1% 0% 0% 0% 0% 0% - - - 0% 0% 0% 0%Absent 1% 0% 0% 0% 0% 0% - - - 0% 0% 0% 0%Other 0% 0% 0% 0% 0% 0% - - - 0% 0% 0% 0%
2018 STAARParticipation(All Grades)
All TestsAssessment Participant 99% 100% 100% 100% 100% 100% 100% - - 95% 100% 100% 100%
Included in Accountability 94% 93% 93% 85% 97% 93% 67% - - 82% 97% 92% 99%Not Included in Accountability
Mobile 4% 6% 7% 15% 3% 7% 33% - - 14% 3% 7% 1%Other Exclusions 1% 0% 0% 0% 0% 0% 0% - - 0% 0% 0% 0%
Not Tested 1% 0% 0% 0% 0% 0% 0% - - 5% 0% 0% 0%Absent 1% 0% 0% 0% 0% 0% 0% - - 5% 0% 0% 0%Other 0% 0% 0% 0% 0% 0% 0% - - 0% 0% 0% 0%
18-19 AAR Page 548

TEA | Governance and Accountability | Performance Reporting Page 207 December 2019
TEXAS EDUCATION AGENCYDistrict Name: WILLIS ISD Texas Academic Performance Report Total Students: 729
Campus Name: W LLOYD MEADOR EL 2018-19 Campus Attendance, Graduation, and Dropout Rates Grade Span: KG - 05Campus Number: 170904107 School Type: Elementary
State District CampusAfrican
American Hispanic WhiteAmerican
Indian AsianPacific
Islander
Two orMore
RacesSpecial
EdEcon
DisadvEL
(Current)
Attendance Rate2017-18 95.4% 95.0% 96.2% 96.0% 96.5% 96.1% * * - 93.6% 95.8% 96.0% 96.9%2016-17 95.7% 95.2% 96.1% 97.4% 96.4% 95.8% * * - 94.9% 95.4% 95.8% 96.7%
Annual Dropout Rate (Gr 7-8)2017-18 0.4% 0.1% - - - - - - - - - - -2016-17 0.3% 0.2% - - - - - - - - - - -
Annual Dropout Rate (Gr 9-12)2017-18 1.9% 2.9% - - - - - - - - - - -2016-17 1.9% 1.5% - - - - - - - - - - -
4-Year Longitudinal Rate (Gr 9-12)Class of 2018
Graduated 90.0% 86.4% - - - - - - - - - - -Received TxCHSE 0.4% 0.4% - - - - - - - - - - -Continued HS 3.8% 4.0% - - - - - - - - - - -Dropped Out 5.7% 9.1% - - - - - - - - - - -Graduates and TxCHSE 90.4% 86.8% - - - - - - - - - - -Graduates, TxCHSE,and Continuers 94.3% 90.9% - - - - - - - - - - -
Class of 2017Graduated 89.7% 89.3% - - - - - - - - - - -Received TxCHSE 0.4% 1.1% - - - - - - - - - - -Continued HS 4.0% 4.6% - - - - - - - - - - -Dropped Out 5.9% 5.0% - - - - - - - - - - -Graduates and TxCHSE 90.1% 90.4% - - - - - - - - - - -Graduates, TxCHSE,and Continuers 94.1% 95.0% - - - - - - - - - - -
5-Year Extended Longitudinal Rate (Gr 9-12)Class of 2017
Graduated 92.0% 92.0% - - - - - - - - - - -Received TxCHSE 0.6% 1.3% - - - - - - - - - - -Continued HS 1.1% 0.2% - - - - - - - - - - -Dropped Out 6.3% 6.5% - - - - - - - - - - -Graduates and TxCHSE 92.6% 93.3% - - - - - - - - - - -Graduates, TxCHSE,and Continuers 93.7% 93.5% - - - - - - - - - - -
Class of 2016Graduated 91.6% 93.7% - - - - - - - - - - -Received TxCHSE 0.7% 1.1% - - - - - - - - - - -Continued HS 1.2% 0.0% - - - - - - - - - - -Dropped Out 6.6% 5.2% - - - - - - - - - - -Graduates and TxCHSE 92.2% 94.8% - - - - - - - - - - -Graduates, TxCHSE,and Continuers 93.4% 94.8% - - - - - - - - - - -
6-Year Extended Longitudinal Rate (Gr 9-12)Class of 2016
Graduated 92.1% 93.9% - - - - - - - - - - -
18-19 AAR Page 549

TEA | Governance and Accountability | Performance Reporting Page 208 December 2019
TEXAS EDUCATION AGENCYDistrict Name: WILLIS ISD Texas Academic Performance Report Total Students: 729
Campus Name: W LLOYD MEADOR EL 2018-19 Campus Attendance, Graduation, and Dropout Rates Grade Span: KG - 05Campus Number: 170904107 School Type: Elementary
State District CampusAfrican
American Hispanic WhiteAmerican
Indian AsianPacific
Islander
Two orMore
RacesSpecial
EdEcon
DisadvEL
(Current)Received TxCHSE 0.8% 1.1% - - - - - - - - - - -Continued HS 0.5% 0.0% - - - - - - - - - - -Dropped Out 6.6% 5.0% - - - - - - - - - - -Graduates and TxCHSE 92.9% 95.0% - - - - - - - - - - -Graduates, TxCHSE,and Continuers 93.4% 95.0% - - - - - - - - - - -
Class of 2015Graduated 91.8% 93.3% - - - - - - - - - - -Received TxCHSE 1.0% 1.4% - - - - - - - - - - -Continued HS 0.6% 0.2% - - - - - - - - - - -Dropped Out 6.7% 5.0% - - - - - - - - - - -Graduates and TxCHSE 92.8% 94.7% - - - - - - - - - - -Graduates, TxCHSE,and Continuers 93.3% 95.0% - - - - - - - - - - -
4-Year Federal Graduation Rate Without Exclusions (Gr 9-12)Class of 2018 90.0% 85.5% - - - - - - - - - - -Class of 2017 89.7% 88.6% - - - - - - - - - - -
RHSP/DAP Graduates (Longitudinal Rate)Class of 2018 68.5% * - - - - - - - - - - -Class of 2017 88.5% 89.1% - - - - - - - - - - -
FHSP-E Graduates (Longitudinal Rate)Class of 2018 5.0% 2.0% - - - - - - - - - - -Class of 2017 6.0% 0.0% - - - - - - - - - - -
FHSP-DLA Graduates (Longitudinal Rate)Class of 2018 82.0% 87.4% - - - - - - - - - - -Class of 2017 60.8% 14.3% - - - - - - - - - - -
RHSP/DAP/FHSP-E/FHSP-DLA Graduates (Longitudinal Rate)Class of 2018 86.8% 89.2% - - - - - - - - - - -Class of 2017 85.9% 87.8% - - - - - - - - - - -
RHSP/DAP Graduates (Annual Rate)2017-18 37.7% 37.5% - - - - - - - - - - -2016-17 87.2% 87.0% - - - - - - - - - - -
FHSP-E Graduates (Annual Rate)2017-18 4.9% 1.7% - - - - - - - - - - -2016-17 7.2% 11.1% - - - - - - - - - - -
FHSP-DLA Graduates (Annual Rate)2017-18 81.5% 87.2% - - - - - - - - - - -2016-17 56.5% 22.2% - - - - - - - - - - -
RHSP/DAP/FHSP-E/FHSP-DLA Graduates (Annual Rate)2017-18 85.1% 87.9% - - - - - - - - - - -2016-17 84.0% 85.9% - - - - - - - - - - -
18-19 AAR Page 550
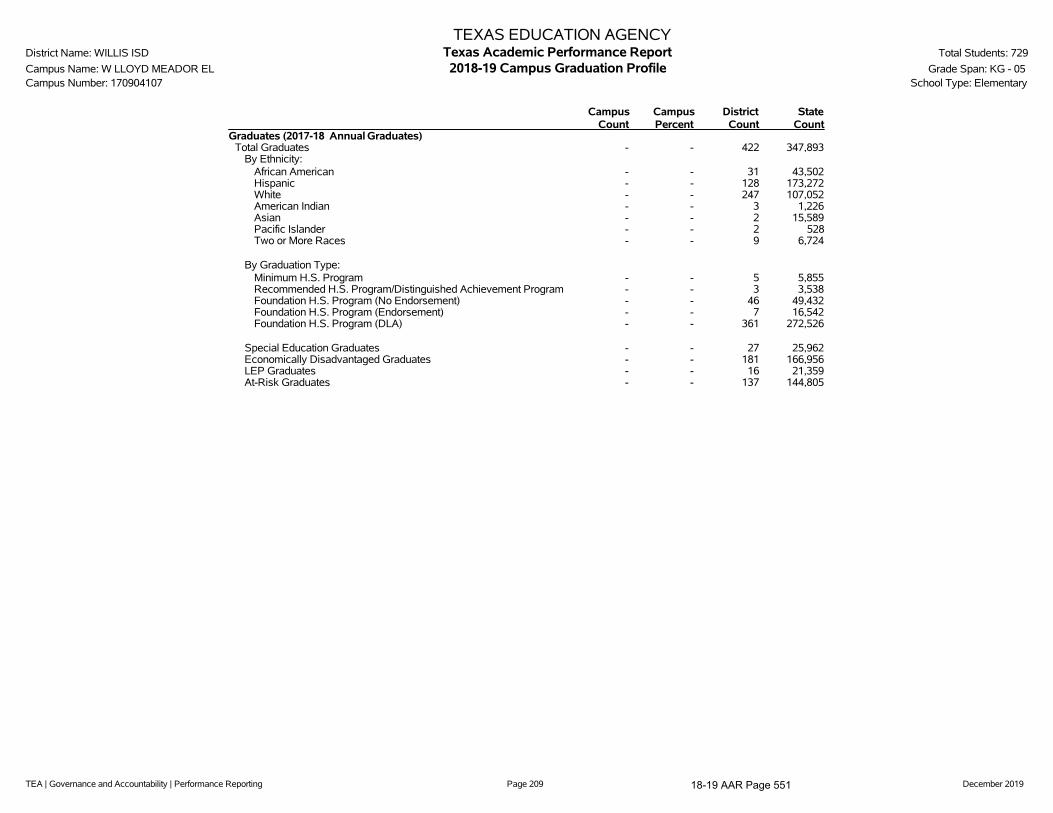
TEA | Governance and Accountability | Performance Reporting Page 209 December 2019
TEXAS EDUCATION AGENCYDistrict Name: WILLIS ISD Texas Academic Performance Report Total Students: 729
Campus Name: W LLOYD MEADOR EL 2018-19 Campus Graduation Profile Grade Span: KG - 05Campus Number: 170904107 School Type: Elementary
CampusCount
CampusPercent
DistrictCount
StateCount
Graduates (2017-18 Annual Graduates)Total Graduates - - 422 347,893
By Ethnicity:African American - - 31 43,502Hispanic - - 128 173,272White - - 247 107,052American Indian - - 3 1,226Asian - - 2 15,589Pacific Islander - - 2 528Two or More Races - - 9 6,724
By Graduation Type:Minimum H.S. Program - - 5 5,855Recommended H.S. Program/Distinguished Achievement Program - - 3 3,538Foundation H.S. Program (No Endorsement) - - 46 49,432Foundation H.S. Program (Endorsement) - - 7 16,542Foundation H.S. Program (DLA) - - 361 272,526
Special Education Graduates - - 27 25,962Economically Disadvantaged Graduates - - 181 166,956LEP Graduates - - 16 21,359At-Risk Graduates - - 137 144,805
18-19 AAR Page 551

TEA | Governance and Accountability | Performance Reporting Page 210 December 2019
TEXAS EDUCATION AGENCYDistrict Name: WILLIS ISD Texas Academic Performance Report Total Students: 729
Campus Name: W LLOYD MEADOR EL 2018-19 Campus College, Career, and Military Readiness (CCMR) Grade Span: KG - 05Campus Number: 170904107 School Type: Elementary
State District CampusAfrican
American Hispanic WhiteAmerican
Indian AsianPacific
Islander
Two orMore
RacesSpecial
EdEcon
DisadvEL
(Current)College, Career, and Military Ready Graduates (Student Achievement) ***
College, Career, or Military Ready (Annual Graduates)2017-18 65.5% 64.0% - - - - - - - - - - -
College Ready Graduates ***College Ready (Annual Graduates)
2017-18 50.0% 34.4% - - - - - - - - - - -
TSI Criteria Graduates (Annual Graduates)English Language Arts
2017-18 58.2% 51.2% - - - - - - - - - - -Mathematics
2017-18 46.0% 29.9% - - - - - - - - - - -Both Subjects
2017-18 42.1% 28.4% - - - - - - - - - - -
Dual Course Credits (Annual Graduates)Any Subject
2017-18 20.7% 17.3% - - - - - - - - - - -2016-17 19.9% 21.6% - - - - - - - - - - -
AP/IB Met Criteria in Any Subject (Annual Graduates)Any Subject
2017-18 20.4% 9.5% - - - - - - - - - - -2016-17 20.1% 4.9% - - - - - - - - - - -
Associate's DegreeAssociate's Degree (Annual Graduates)
2017-18 1.4% 0.2% - - - - - - - - - - -2016-17 0.8% 0.0% - - - - - - - - - - -
OnRampsCourse Credits (Annual Graduates)2017-18 1.0% 0.0% - - - - - - - - - - -
Career/Military Ready GraduatesCareer or Military Ready (Annual Graduates)
2017-18 28.7% 41.6% - - - - - - - - - - -2016-17 13.2% 13.1% - - - - - - - - - - -
Approved Industry-Based Certification (Annual Graduates)2017-18 4.8% 9.0% - - - - - - - - - - -2016-17 2.7% 3.8% - - - - - - - - - - -
Graduate with Completed IEP and Workforce Readiness (Annual Graduates)2017-18 1.7% 6.2% - - - - - - - - - - -2016-17 1.0% 0.0% - - - - - - - - - - -
CTE Coherent Sequence Coursework Aligned with Industry-Based Certifications (Annual Graduates)2017-18 38.7% 58.8% - - - - - - - - - - -2016-17 17.3% 14.6% - - - - - - - - - - -
18-19 AAR Page 552

TEA | Governance and Accountability | Performance Reporting Page 211 December 2019
TEXAS EDUCATION AGENCYDistrict Name: WILLIS ISD Texas Academic Performance Report Total Students: 729
Campus Name: W LLOYD MEADOR EL 2018-19 Campus College, Career, and Military Readiness (CCMR) Grade Span: KG - 05Campus Number: 170904107 School Type: Elementary
State District CampusAfrican
American Hispanic WhiteAmerican
Indian AsianPacific
Islander
Two orMore
RacesSpecial
EdEcon
DisadvEL
(Current)
U.S. Armed Forces Enlistment (Annual Graduates)2017-18 4.3% 3.3% - - - - - - - - - - -2016-17 2.2% 2.8% - - - - - - - - - - -
Graduates under an Advanced Degree Plan and Identified as a current Special Education Student (Annual Graduates)2017-18 2.6% 0.9% - - - - - - - - - - -
Graduates with Level I or Level II Certificate (Annual Graduates)2017-18 0.6% 0.0% - - - - - - - - - - -2016-17 0.5% 0.0% - - - - - - - - - - -
18-19 AAR Page 553

TEA | Governance and Accountability | Performance Reporting Page 212 December 2019
TEXAS EDUCATION AGENCYDistrict Name: WILLIS ISD Texas Academic Performance Report Total Students: 729
Campus Name: W LLOYD MEADOR EL 2018-19 Campus CCMR-Related Indicators Grade Span: KG - 05Campus Number: 170904107 School Type: Elementary
State District CampusAfrican
American Hispanic WhiteAmerican
Indian AsianPacific
Islander
Two orMore
RacesSpecial
EdEcon
DisadvEL
(Current)TSIA Results (Graduates >= Criterion) (Annual Graduates)
Reading2017-18 32.1% 36.5% - - - - - - - - - - -2016-17 23.4% 11.3% - - - - - - - - - - -
Mathematics2017-18 23.7% 21.8% - - - - - - - - - - -2016-17 19.8% 11.3% - - - - - - - - - - -
Both Subjects2017-18 18.1% 17.8% - - - - - - - - - - -2016-17 12.9% 5.4% - - - - - - - - - - -
CTE Coherent Sequence (Annual Graduates)2017-18 58.4% 61.8% - - - - - - - - - - -2016-17 50.5% 30.1% - - - - - - - - - - -
Completed and Received Credit for College Prep Courses (Annual Graduates)English Language Arts
2017-18 2.0% 0.0% - - - - - - - - - - -2016-17 0.8% 0.0% - - - - - - - - - - -
Mathematics2017-18 3.9% 0.0% - - - - - - - - - - -2016-17 1.4% 0.0% - - - - - - - - - - -
Both Subjects2017-18 0.9% 0.0% - - - - - - - - - - -2016-17 0.2% 0.0% - - - - - - - - - - -
AP/IB Results (Participation) (Grades 11-12)All Subjects
2018 25.8% 10.3% - - - - - - - - n/a - n/a2017 26.2% 12.1% - - - - - - - - n/a - n/a
English Language Arts2018 15.3% 6.5% - - - - - - - - n/a - n/a2017 15.9% 5.8% - - - - - - - - n/a - n/a
Mathematics2018 7.3% 0.8% - - - - - - - - n/a - n/a2017 7.2% 0.8% - - - - - - - - n/a - n/a
Science2018 10.8% 4.4% - - - - - - - - n/a - n/a2017 10.9% 4.2% - - - - - - - - n/a - n/a
Social Studies2018 14.5% 4.9% - - - - - - - - n/a - n/a2017 15.0% 8.8% - - - - - - - - n/a - n/a
AP/IB Results (Examinees >= Criterion) (Grades 11-12)All Subjects
2018 50.7% 48.5% - - - - - - - - n/a - n/a2017 49.1% 39.3% - - - - - - - - n/a - n/a
English Language Arts2018 42.5% 33.9% - - - - - - - - n/a - n/a2017 41.3% 38.9% - - - - - - - - n/a - n/a
Mathematics2018 52.8% 12.5% - - - - - - - - n/a - n/a
18-19 AAR Page 554

TEA | Governance and Accountability | Performance Reporting Page 213 December 2019
TEXAS EDUCATION AGENCYDistrict Name: WILLIS ISD Texas Academic Performance Report Total Students: 729
Campus Name: W LLOYD MEADOR EL 2018-19 Campus CCMR-Related Indicators Grade Span: KG - 05Campus Number: 170904107 School Type: Elementary
State District CampusAfrican
American Hispanic WhiteAmerican
Indian AsianPacific
Islander
Two orMore
RacesSpecial
EdEcon
DisadvEL
(Current)2017 51.3% 14.3% - - - - - - - - n/a - n/a
Science2018 38.0% 21.4% - - - - - - - - n/a - n/a2017 38.3% 15.4% - - - - - - - - n/a - n/a
Social Studies2018 44.6% 51.1% - - - - - - - - n/a - n/a2017 41.4% 37.8% - - - - - - - - n/a - n/a
SAT/ACT Results (Annual Graduates) ***Tested
2017-18 74.6% 51.7% - - - - - - - - n/a - n/a2016-17 73.5% 53.6% - - - - - - - - n/a - n/a
At/Above Criterion2017-18 37.9% 33.0% - - - - - - - - n/a - n/a
Average SAT Score (Annual Graduates) ***All Subjects
2017-18 1036 1028 - - - - - - - - n/a - n/aEnglish Language Artsand Writing
2017-18 521 527 - - - - - - - - n/a - n/aMathematics
2017-18 515 500 - - - - - - - - n/a - n/a
Average ACT Score (Annual Graduates) ***All Subjects
2017-18 20.6 20.0 - - - - - - - - n/a - n/aEnglish Language Arts
2017-18 20.3 19.6 - - - - - - - - n/a - n/aMathematics
2017-18 20.6 19.4 - - - - - - - - n/a - n/aScience
2017-18 20.9 20.8 - - - - - - - - n/a - n/a
18-19 AAR Page 555

TEA | Governance and Accountability | Performance Reporting Page 214 December 2019
TEXAS EDUCATION AGENCYDistrict Name: WILLIS ISD Texas Academic Performance Report Total Students: 729
Campus Name: W LLOYD MEADOR EL 2018-19 Campus Other Postsecondary Indicators Grade Span: KG - 05Campus Number: 170904107 School Type: Elementary
State District CampusAfrican
American Hispanic WhiteAmerican
Indian AsianPacific
Islander
Two orMore
RacesSpecial
EdEcon
DisadvEL
(Current)Advanced Dual-Credit Course Completion (Grades 9-12)
Any Subject2017-18 43.4% 32.6% - - - - - - - - - - -2016-17 37.1% 19.8% - - - - - - - - - - -
English Language Arts2017-18 17.3% 13.8% - - - - - - - - - - -2016-17 16.8% 13.1% - - - - - - - - - - -
Mathematics2017-18 20.7% 13.2% - - - - - - - - - - -2016-17 19.5% 12.1% - - - - - - - - - - -
Science2017-18 21.2% 19.7% - - - - - - - - - - -2016-17 5.7% 5.4% - - - - - - - - - - -
Social Studies2017-18 22.8% 11.7% - - - - - - - - - - -2016-17 21.8% 10.8% - - - - - - - - - - -
Graduates Enrolled in Texas Institution of Higher Education (TX IHE)2016-17 54.6% 48.0% - - - - - - - - - - -2015-16 54.7% 49.1% - - - - - - - - - - -
Graduates in TX IHE Completing One Year Without Enrollment in a Developmental Education Course2016-17 59.2% 54.6% - - - - - - - - - - -2015-16 55.7% 55.5% - - - - - - - - - - -
18-19 AAR Page 556

TEA | Governance and Accountability | Performance Reporting Page 215 December 2019
TEXAS EDUCATION AGENCYDistrict Name: WILLIS ISD Texas Academic Performance Report Total Students: 729
Campus Name: W LLOYD MEADOR EL 2018-19 Campus Student Information Grade Span: KG - 05Campus Number: 170904107 School Type: Elementary
---------------- Campus ----------------Student Information Count Percent District State
Total Students 729 100.0% 7,469 5,416,400
Students by Grade:Early Childhood Education 0 0.0% 0.8% 0.3%Pre-Kindergarten 0 0.0% 2.3% 4.4%Kindergarten 95 13.0% 6.5% 6.9%Grade 1 123 16.9% 7.6% 7.1%Grade 2 117 16.0% 7.6% 7.2%Grade 3 122 16.7% 7.9% 7.3%Grade 4 142 19.5% 8.4% 7.6%Grade 5 130 17.8% 7.8% 7.7%Grade 6 0 0.0% 7.6% 7.7%Grade 7 0 0.0% 7.8% 7.5%Grade 8 0 0.0% 7.4% 7.5%Grade 9 0 0.0% 9.6% 8.1%Grade 10 0 0.0% 6.3% 7.4%Grade 11 0 0.0% 6.3% 6.9%Grade 12 0 0.0% 6.0% 6.5%
Ethnic Distribution:African American 31 4.3% 6.9% 12.6%Hispanic 280 38.4% 37.0% 52.6%White 403 55.3% 51.9% 27.4%American Indian 0 0.0% 0.4% 0.4%Asian 0 0.0% 0.6% 4.5%Pacific Islander 1 0.1% 0.1% 0.2%Two or More Races 14 1.9% 3.1% 2.4%
Economically Disadvantaged 450 61.7% 60.1% 60.6%Non-Educationally Disadvantaged 279 38.3% 39.9% 39.4%Section 504 Students 42 5.8% 6.1% 6.5%English Learners (EL) 125 17.1% 14.4% 19.5%Students w/ Disciplinary Placements (2017-18) 0 0.0% 1.8% 1.4%Students w/ Dyslexia 14 1.9% 2.6% 3.6%At-Risk 364 49.9% 50.8% 50.1%
Students with Disabilities by Type of Primary Disability:Total Students with Disabilities 64By Type of Primary Disability
Students with Intellectual Disabilities 14 21.9% 38.4% 42.4%Students with Physical Disabilities 24 37.5% 21.4% 21.9%Students with Autism 19 29.7% 19.0% 13.7%Students with Behavioral Disabilities 7 10.9% 19.2% 20.6%Students with Non-Categorical Early Childhood 0 0.0% 2.1% 1.4%
Mobility (2017-18):Total Mobile Students 99 14.0% 19.0% 15.4%
18-19 AAR Page 557
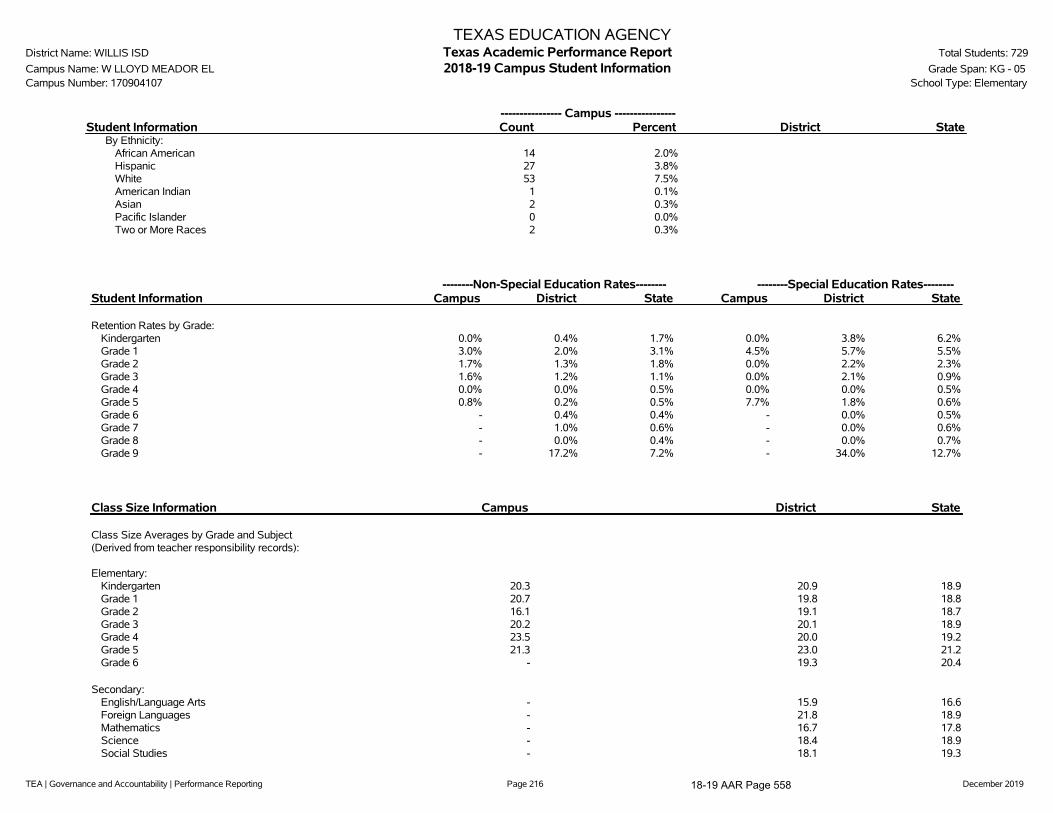
TEA | Governance and Accountability | Performance Reporting Page 216 December 2019
TEXAS EDUCATION AGENCYDistrict Name: WILLIS ISD Texas Academic Performance Report Total Students: 729
Campus Name: W LLOYD MEADOR EL 2018-19 Campus Student Information Grade Span: KG - 05Campus Number: 170904107 School Type: Elementary
---------------- Campus ----------------Student Information Count Percent District State
By Ethnicity:African American 14 2.0%Hispanic 27 3.8%White 53 7.5%American Indian 1 0.1%Asian 2 0.3%Pacific Islander 0 0.0%Two or More Races 2 0.3%
--------Non-Special Education Rates-------- --------Special Education Rates--------Student Information Campus District State Campus District State
Retention Rates by Grade:Kindergarten 0.0% 0.4% 1.7% 0.0% 3.8% 6.2%Grade 1 3.0% 2.0% 3.1% 4.5% 5.7% 5.5%Grade 2 1.7% 1.3% 1.8% 0.0% 2.2% 2.3%Grade 3 1.6% 1.2% 1.1% 0.0% 2.1% 0.9%Grade 4 0.0% 0.0% 0.5% 0.0% 0.0% 0.5%Grade 5 0.8% 0.2% 0.5% 7.7% 1.8% 0.6%Grade 6 - 0.4% 0.4% - 0.0% 0.5%Grade 7 - 1.0% 0.6% - 0.0% 0.6%Grade 8 - 0.0% 0.4% - 0.0% 0.7%Grade 9 - 17.2% 7.2% - 34.0% 12.7%
Class Size Information Campus District State
Class Size Averages by Grade and Subject(Derived from teacher responsibility records):
Elementary:Kindergarten 20.3 20.9 18.9Grade 1 20.7 19.8 18.8Grade 2 16.1 19.1 18.7Grade 3 20.2 20.1 18.9Grade 4 23.5 20.0 19.2Grade 5 21.3 23.0 21.2Grade 6 - 19.3 20.4
Secondary:English/Language Arts - 15.9 16.6Foreign Languages - 21.8 18.9Mathematics - 16.7 17.8Science - 18.4 18.9Social Studies - 18.1 19.3
18-19 AAR Page 558

TEA | Governance and Accountability | Performance Reporting Page 217 December 2019
TEXAS EDUCATION AGENCYDistrict Name: WILLIS ISD Texas Academic Performance Report Total Students: 729
Campus Name: W LLOYD MEADOR EL 2018-19 Campus Staff Information Grade Span: KG - 05Campus Number: 170904107 School Type: Elementary
---------------- Campus ----------------Staff Information Count/Average Percent District State
Total Staff 64.0 100.0% 100.0% 100.0%
Professional Staff: 51.0 79.7% 57.6% 64.1%Teachers 44.0 68.8% 44.8% 49.8%Professional Support 4.0 6.3% 9.2% 10.1%Campus Administration (School Leadership) 3.0 4.7% 2.9% 3.0%
Educational Aides: 13.0 20.3% 11.0% 10.3%
Librarians & Counselors (Headcount):Librarians
Full-time 0.0 n/a 0.0 4,414.0Part-time 0.0 n/a 0.0 572.0
CounselorsFull-time 1.0 n/a 12.0 12,433.0Part-time 0.0 n/a 2.0 1,097.0
Total Minority Staff: 15.0 23.4% 27.1% 50.4%
Teachers by Ethnicity and Sex:African American 0.0 0.0% 2.8% 10.6%Hispanic 9.0 20.5% 14.2% 27.7%White 34.0 77.3% 82.1% 58.4%American Indian 0.0 0.0% 0.2% 0.3%Asian 0.0 0.0% 0.2% 1.7%Pacific Islander 0.0 0.0% 0.0% 0.2%Two or More Races 1.0 2.3% 0.5% 1.1%
Males 2.0 4.5% 18.6% 23.8%Females 42.0 95.5% 81.4% 76.2%
Teachers by Highest Degree Held:No Degree 0.0 0.0% 0.5% 1.4%Bachelors 39.0 88.6% 81.7% 73.6%Masters 5.0 11.4% 17.4% 24.3%Doctorate 0.0 0.0% 0.5% 0.7%
Teachers by Years of Experience:Beginning Teachers 5.0 11.4% 8.0% 7.0%1-5 Years Experience 13.0 29.5% 31.7% 28.9%6-10 Years Experience 6.0 13.6% 17.5% 19.0%11-20 Years Experience 7.0 15.9% 24.9% 29.3%Over 20 Years Experience 13.0 29.5% 17.9% 15.7%
Number of Students per Teacher 16.6 n/a 17.2 15.1
18-19 AAR Page 559

TEA | Governance and Accountability | Performance Reporting Page 218 December 2019
TEXAS EDUCATION AGENCYDistrict Name: WILLIS ISD Texas Academic Performance Report Total Students: 729
Campus Name: W LLOYD MEADOR EL 2018-19 Campus Staff Information Grade Span: KG - 05Campus Number: 170904107 School Type: Elementary
Staff Information Campus District State
Experience of Campus Leadership:Average Years Experience of Principals 6.0 2.8 6.3Average Years Experience of Principals with District 6.0 2.8 5.4Average Years Experience of Assistant Principals 5.5 6.1 5.3Average Years Experience of Assistant Principals with District 3.0 4.2 4.7
Average Years Experience of Teachers: 11.6 10.7 11.1Average Years Experience of Teachers with District: 6.9 6.5 7.2
Average Teacher Salary by Years of Experience (regular duties only):Beginning Teachers $48,233 $45,854 $47,2181-5 Years Experience $50,454 $50,779 $50,4086-10 Years Experience $52,743 $52,839 $52,78611-20 Years Experience $55,540 $57,036 $56,041Over 20 Years Experience $63,188 $63,917 $62,039
Average Actual Salaries (regular duties only):Teachers $55,085 $54,658 $54,122Professional Support $60,109 $65,409 $64,069Campus Administration (School Leadership) $76,265 $78,467 $78,947
Instructional Staff Percent: n/a 60.4% 64.5%
Contracted Instructional Staff (not incl. above): 0.0 1.5 6,043.6
18-19 AAR Page 560

TEA | Governance and Accountability | Performance Reporting Page 219 December 2019
TEXAS EDUCATION AGENCYDistrict Name: WILLIS ISD Texas Academic Performance Report Total Students: 729
Campus Name: W LLOYD MEADOR EL 2018-19 Campus Staff Information Grade Span: KG - 05Campus Number: 170904107 School Type: Elementary
---------------- Campus ----------------Program Information Count Percent District State
Student Enrollment by Program:Bilingual/ESL Education 110 15.1% 13.6% 19.7%Career & Technical Education 0 0.0% 21.5% 26.3%Gifted & Talented Education 37 5.1% 5.4% 8.1%Special Education 64 8.8% 8.4% 9.6%
Teachers by Program (population served):Bilingual/ESL Education 1.9 4.3% 2.8% 6.4%Career & Technical Education 0.0 0.0% 4.5% 4.9%Compensatory Education 0.0 0.0% 0.0% 2.7%Gifted & Talented Education 0.0 0.0% 0.0% 2.0%Regular Education 39.4 89.6% 76.9% 71.4%Special Education 2.7 6.0% 8.5% 9.1%Other 0.0 0.0% 7.3% 3.6%
' '̂ Indicates that rates for reading and mathematics are based on the cumulative results from the first and second administrations of STAAR.'*' Indicates results are masked due to small numbers to protect student confidentiality.'**' When only one student disability group is masked, then the second smallest student disability group is masked regardless of size.'***' Due to changes in the evaluation of SAT/ACT results (for 2017-18 the best result was used, rather than the most recent), 2016-17 SAT/ACT results are not
comparable and, where applicable, are not shown.'-' Indicates there are no students in the group.'n/a' Indicates data reporting is not applicable for this group.'?' Indicates that the data for this item were statistically improbable or were reported outside a reasonable range.
Link to: PEIMS Financial Standard Reports 2017-18 Financial Actual Report
18-19 AAR Page 561
TEA | Governance and Accountability | Performance Reporting Page 220 December 2019
2018-19 Texas Academic Performance Report
District Name: WILLIS ISD
Campus Name: ROARK EARLY EDUCATION CENTER
Campus Number: 170904109
2019 Accountability Rating: B
18-19 AAR Page 562

TEA | Governance and Accountability | Performance Reporting Page 221 December 2019
This page is intentionally blank.
18-19 AAR Page 563

TEA | Governance and Accountability | Performance Reporting Page 222 December 2019
TEXAS EDUCATION AGENCYDistrict Name: WILLIS ISD Texas Academic Performance Report Total Students: 235
Campus Name: ROARK EARLY EDUCATION CENTER 2018-19 Campus STAAR Performance Grade Span: EE - PKCampus Number: 170904109 School Type: Elementary
There is no data for this campus.
18-19 AAR Page 564
TEA | Governance and Accountability | Performance Reporting Page 223 December 2019
TEXAS EDUCATION AGENCYDistrict Name: WILLIS ISD Texas Academic Performance Report Total Students: 235
Campus Name: ROARK EARLY EDUCATION CENTER 2018-19 Campus Progress Grade Span: EE - PKCampus Number: 170904109 School Type: Elementary
There is no data for this campus.
18-19 AAR Page 565

TEA | Governance and Accountability | Performance Reporting Page 224 December 2019
TEXAS EDUCATION AGENCYDistrict Name: WILLIS ISD Texas Academic Performance Report Total Students: 235
Campus Name: ROARK EARLY EDUCATION CENTER 2018-19 Campus Prior Year and Student Success Initiative Grade Span: EE - PKCampus Number: 170904109 School Type: Elementary
There is no data for this campus.
18-19 AAR Page 566

TEA | Governance and Accountability | Performance Reporting Page 225 December 2019
TEXAS EDUCATION AGENCYDistrict Name: WILLIS ISD Texas Academic Performance Report Total Students: 235
Campus Name: ROARK EARLY EDUCATION CENTER 2018-19 Campus STAAR Performance Grade Span: EE - PKCampus Number: 170904109 Bilingual Education/English as a Second Language (Current EL Students)
There is no data for this campus.
18-19 AAR Page 567
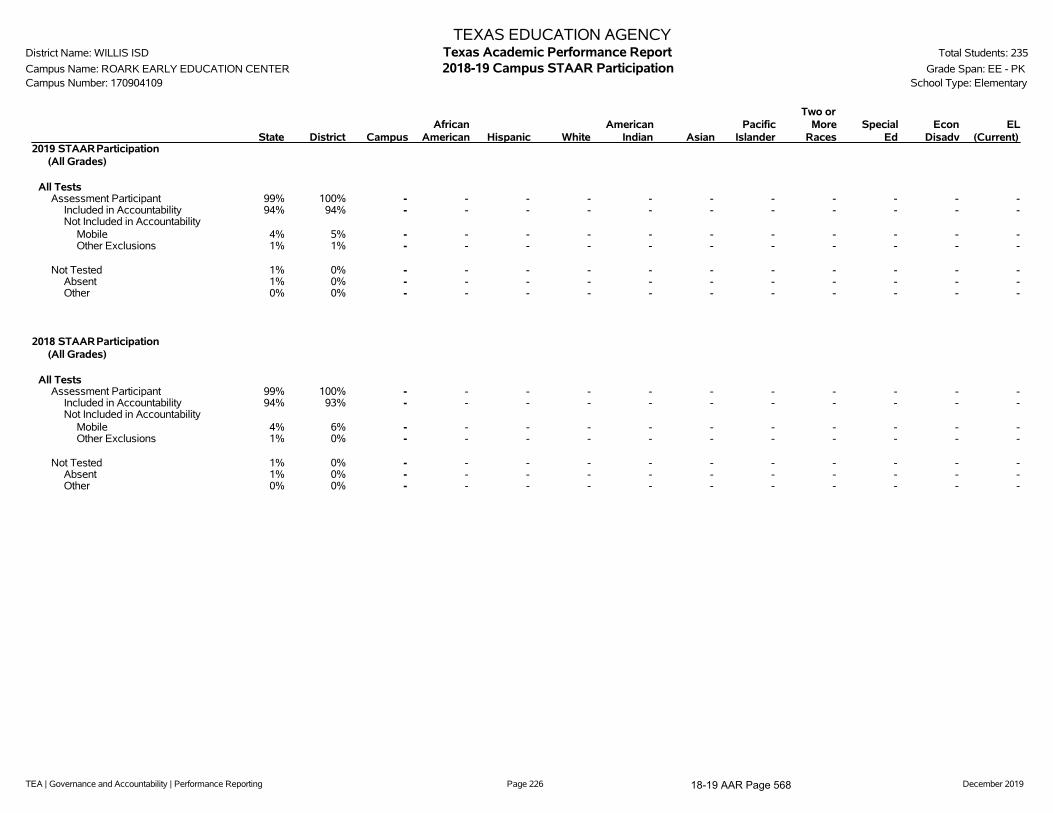
TEA | Governance and Accountability | Performance Reporting Page 226 December 2019
TEXAS EDUCATION AGENCYDistrict Name: WILLIS ISD Texas Academic Performance Report Total Students: 235
Campus Name: ROARK EARLY EDUCATION CENTER 2018-19 Campus STAAR Participation Grade Span: EE - PKCampus Number: 170904109 School Type: Elementary
State District CampusAfrican
American Hispanic WhiteAmerican
Indian AsianPacific
Islander
Two orMore
RacesSpecial
EdEcon
DisadvEL
(Current)2019 STAARParticipation
(All Grades)
All TestsAssessment Participant 99% 100% - - - - - - - - - - -
Included in Accountability 94% 94% - - - - - - - - - - -Not Included in Accountability
Mobile 4% 5% - - - - - - - - - - -Other Exclusions 1% 1% - - - - - - - - - - -
Not Tested 1% 0% - - - - - - - - - - -Absent 1% 0% - - - - - - - - - - -Other 0% 0% - - - - - - - - - - -
2018 STAARParticipation(All Grades)
All TestsAssessment Participant 99% 100% - - - - - - - - - - -
Included in Accountability 94% 93% - - - - - - - - - - -Not Included in Accountability
Mobile 4% 6% - - - - - - - - - - -Other Exclusions 1% 0% - - - - - - - - - - -
Not Tested 1% 0% - - - - - - - - - - -Absent 1% 0% - - - - - - - - - - -Other 0% 0% - - - - - - - - - - -
18-19 AAR Page 568

TEA | Governance and Accountability | Performance Reporting Page 227 December 2019
TEXAS EDUCATION AGENCYDistrict Name: WILLIS ISD Texas Academic Performance Report Total Students: 235
Campus Name: ROARK EARLY EDUCATION CENTER 2018-19 Campus Attendance, Graduation, and Dropout Rates Grade Span: EE - PKCampus Number: 170904109 School Type: Elementary
State District CampusAfrican
American Hispanic WhiteAmerican
Indian AsianPacific
Islander
Two orMore
RacesSpecial
EdEcon
DisadvEL
(Current)
Attendance Rate2017-18 95.4% 95.0% - - - - - - - - - - -2016-17 95.7% 95.2% - - - - - - - - - - -
Annual Dropout Rate (Gr 7-8)2017-18 0.4% 0.1% - - - - - - - - - - -2016-17 0.3% 0.2% - - - - - - - - - - -
Annual Dropout Rate (Gr 9-12)2017-18 1.9% 2.9% - - - - - - - - - - -2016-17 1.9% 1.5% - - - - - - - - - - -
4-Year Longitudinal Rate (Gr 9-12)Class of 2018
Graduated 90.0% 86.4% - - - - - - - - - - -Received TxCHSE 0.4% 0.4% - - - - - - - - - - -Continued HS 3.8% 4.0% - - - - - - - - - - -Dropped Out 5.7% 9.1% - - - - - - - - - - -Graduates and TxCHSE 90.4% 86.8% - - - - - - - - - - -Graduates, TxCHSE,and Continuers 94.3% 90.9% - - - - - - - - - - -
Class of 2017Graduated 89.7% 89.3% - - - - - - - - - - -Received TxCHSE 0.4% 1.1% - - - - - - - - - - -Continued HS 4.0% 4.6% - - - - - - - - - - -Dropped Out 5.9% 5.0% - - - - - - - - - - -Graduates and TxCHSE 90.1% 90.4% - - - - - - - - - - -Graduates, TxCHSE,and Continuers 94.1% 95.0% - - - - - - - - - - -
5-Year Extended Longitudinal Rate (Gr 9-12)Class of 2017
Graduated 92.0% 92.0% - - - - - - - - - - -Received TxCHSE 0.6% 1.3% - - - - - - - - - - -Continued HS 1.1% 0.2% - - - - - - - - - - -Dropped Out 6.3% 6.5% - - - - - - - - - - -Graduates and TxCHSE 92.6% 93.3% - - - - - - - - - - -Graduates, TxCHSE,and Continuers 93.7% 93.5% - - - - - - - - - - -
Class of 2016Graduated 91.6% 93.7% - - - - - - - - - - -Received TxCHSE 0.7% 1.1% - - - - - - - - - - -Continued HS 1.2% 0.0% - - - - - - - - - - -Dropped Out 6.6% 5.2% - - - - - - - - - - -Graduates and TxCHSE 92.2% 94.8% - - - - - - - - - - -Graduates, TxCHSE,and Continuers 93.4% 94.8% - - - - - - - - - - -
6-Year Extended Longitudinal Rate (Gr 9-12)Class of 2016
Graduated 92.1% 93.9% - - - - - - - - - - -
18-19 AAR Page 569

TEA | Governance and Accountability | Performance Reporting Page 228 December 2019
TEXAS EDUCATION AGENCYDistrict Name: WILLIS ISD Texas Academic Performance Report Total Students: 235
Campus Name: ROARK EARLY EDUCATION CENTER 2018-19 Campus Attendance, Graduation, and Dropout Rates Grade Span: EE - PKCampus Number: 170904109 School Type: Elementary
State District CampusAfrican
American Hispanic WhiteAmerican
Indian AsianPacific
Islander
Two orMore
RacesSpecial
EdEcon
DisadvEL
(Current)Received TxCHSE 0.8% 1.1% - - - - - - - - - - -Continued HS 0.5% 0.0% - - - - - - - - - - -Dropped Out 6.6% 5.0% - - - - - - - - - - -Graduates and TxCHSE 92.9% 95.0% - - - - - - - - - - -Graduates, TxCHSE,and Continuers 93.4% 95.0% - - - - - - - - - - -
Class of 2015Graduated 91.8% 93.3% - - - - - - - - - - -Received TxCHSE 1.0% 1.4% - - - - - - - - - - -Continued HS 0.6% 0.2% - - - - - - - - - - -Dropped Out 6.7% 5.0% - - - - - - - - - - -Graduates and TxCHSE 92.8% 94.7% - - - - - - - - - - -Graduates, TxCHSE,and Continuers 93.3% 95.0% - - - - - - - - - - -
4-Year Federal Graduation Rate Without Exclusions (Gr 9-12)Class of 2018 90.0% 85.5% - - - - - - - - - - -Class of 2017 89.7% 88.6% - - - - - - - - - - -
RHSP/DAP Graduates (Longitudinal Rate)Class of 2018 68.5% * - - - - - - - - - - -Class of 2017 88.5% 89.1% - - - - - - - - - - -
FHSP-E Graduates (Longitudinal Rate)Class of 2018 5.0% 2.0% - - - - - - - - - - -Class of 2017 6.0% 0.0% - - - - - - - - - - -
FHSP-DLA Graduates (Longitudinal Rate)Class of 2018 82.0% 87.4% - - - - - - - - - - -Class of 2017 60.8% 14.3% - - - - - - - - - - -
RHSP/DAP/FHSP-E/FHSP-DLA Graduates (Longitudinal Rate)Class of 2018 86.8% 89.2% - - - - - - - - - - -Class of 2017 85.9% 87.8% - - - - - - - - - - -
RHSP/DAP Graduates (Annual Rate)2017-18 37.7% 37.5% - - - - - - - - - - -2016-17 87.2% 87.0% - - - - - - - - - - -
FHSP-E Graduates (Annual Rate)2017-18 4.9% 1.7% - - - - - - - - - - -2016-17 7.2% 11.1% - - - - - - - - - - -
FHSP-DLA Graduates (Annual Rate)2017-18 81.5% 87.2% - - - - - - - - - - -2016-17 56.5% 22.2% - - - - - - - - - - -
RHSP/DAP/FHSP-E/FHSP-DLA Graduates (Annual Rate)2017-18 85.1% 87.9% - - - - - - - - - - -2016-17 84.0% 85.9% - - - - - - - - - - -
18-19 AAR Page 570

TEA | Governance and Accountability | Performance Reporting Page 229 December 2019
TEXAS EDUCATION AGENCYDistrict Name: WILLIS ISD Texas Academic Performance Report Total Students: 235
Campus Name: ROARK EARLY EDUCATION CENTER 2018-19 Campus Graduation Profile Grade Span: EE - PKCampus Number: 170904109 School Type: Elementary
CampusCount
CampusPercent
DistrictCount
StateCount
Graduates (2017-18 Annual Graduates)Total Graduates - - 422 347,893
By Ethnicity:African American - - 31 43,502Hispanic - - 128 173,272White - - 247 107,052American Indian - - 3 1,226Asian - - 2 15,589Pacific Islander - - 2 528Two or More Races - - 9 6,724
By Graduation Type:Minimum H.S. Program - - 5 5,855Recommended H.S. Program/Distinguished Achievement Program - - 3 3,538Foundation H.S. Program (No Endorsement) - - 46 49,432Foundation H.S. Program (Endorsement) - - 7 16,542Foundation H.S. Program (DLA) - - 361 272,526
Special Education Graduates - - 27 25,962Economically Disadvantaged Graduates - - 181 166,956LEP Graduates - - 16 21,359At-Risk Graduates - - 137 144,805
18-19 AAR Page 571

TEA | Governance and Accountability | Performance Reporting Page 230 December 2019
TEXAS EDUCATION AGENCYDistrict Name: WILLIS ISD Texas Academic Performance Report Total Students: 235
Campus Name: ROARK EARLY EDUCATION CENTER 2018-19 Campus College, Career, and Military Readiness (CCMR) Grade Span: EE - PKCampus Number: 170904109 School Type: Elementary
State District CampusAfrican
American Hispanic WhiteAmerican
Indian AsianPacific
Islander
Two orMore
RacesSpecial
EdEcon
DisadvEL
(Current)College, Career, and Military Ready Graduates (Student Achievement) ***
College, Career, or Military Ready (Annual Graduates)2017-18 65.5% 64.0% - - - - - - - - - - -
College Ready Graduates ***College Ready (Annual Graduates)
2017-18 50.0% 34.4% - - - - - - - - - - -
TSI Criteria Graduates (Annual Graduates)English Language Arts
2017-18 58.2% 51.2% - - - - - - - - - - -Mathematics
2017-18 46.0% 29.9% - - - - - - - - - - -Both Subjects
2017-18 42.1% 28.4% - - - - - - - - - - -
Dual Course Credits (Annual Graduates)Any Subject
2017-18 20.7% 17.3% - - - - - - - - - - -2016-17 19.9% 21.6% - - - - - - - - - - -
AP/IB Met Criteria in Any Subject (Annual Graduates)Any Subject
2017-18 20.4% 9.5% - - - - - - - - - - -2016-17 20.1% 4.9% - - - - - - - - - - -
Associate's DegreeAssociate's Degree (Annual Graduates)
2017-18 1.4% 0.2% - - - - - - - - - - -2016-17 0.8% 0.0% - - - - - - - - - - -
OnRampsCourse Credits (Annual Graduates)2017-18 1.0% 0.0% - - - - - - - - - - -
Career/Military Ready GraduatesCareer or Military Ready (Annual Graduates)
2017-18 28.7% 41.6% - - - - - - - - - - -2016-17 13.2% 13.1% - - - - - - - - - - -
Approved Industry-Based Certification (Annual Graduates)2017-18 4.8% 9.0% - - - - - - - - - - -2016-17 2.7% 3.8% - - - - - - - - - - -
Graduate with Completed IEP and Workforce Readiness (Annual Graduates)2017-18 1.7% 6.2% - - - - - - - - - - -2016-17 1.0% 0.0% - - - - - - - - - - -
CTE Coherent Sequence Coursework Aligned with Industry-Based Certifications (Annual Graduates)2017-18 38.7% 58.8% - - - - - - - - - - -2016-17 17.3% 14.6% - - - - - - - - - - -
18-19 AAR Page 572

TEA | Governance and Accountability | Performance Reporting Page 231 December 2019
TEXAS EDUCATION AGENCYDistrict Name: WILLIS ISD Texas Academic Performance Report Total Students: 235
Campus Name: ROARK EARLY EDUCATION CENTER 2018-19 Campus College, Career, and Military Readiness (CCMR) Grade Span: EE - PKCampus Number: 170904109 School Type: Elementary
State District CampusAfrican
American Hispanic WhiteAmerican
Indian AsianPacific
Islander
Two orMore
RacesSpecial
EdEcon
DisadvEL
(Current)
U.S. Armed Forces Enlistment (Annual Graduates)2017-18 4.3% 3.3% - - - - - - - - - - -2016-17 2.2% 2.8% - - - - - - - - - - -
Graduates under an Advanced Degree Plan and Identified as a current Special Education Student (Annual Graduates)2017-18 2.6% 0.9% - - - - - - - - - - -
Graduates with Level I or Level II Certificate (Annual Graduates)2017-18 0.6% 0.0% - - - - - - - - - - -2016-17 0.5% 0.0% - - - - - - - - - - -
18-19 AAR Page 573

TEA | Governance and Accountability | Performance Reporting Page 232 December 2019
TEXAS EDUCATION AGENCYDistrict Name: WILLIS ISD Texas Academic Performance Report Total Students: 235
Campus Name: ROARK EARLY EDUCATION CENTER 2018-19 Campus CCMR-Related Indicators Grade Span: EE - PKCampus Number: 170904109 School Type: Elementary
State District CampusAfrican
American Hispanic WhiteAmerican
Indian AsianPacific
Islander
Two orMore
RacesSpecial
EdEcon
DisadvEL
(Current)TSIA Results (Graduates >= Criterion) (Annual Graduates)
Reading2017-18 32.1% 36.5% - - - - - - - - - - -2016-17 23.4% 11.3% - - - - - - - - - - -
Mathematics2017-18 23.7% 21.8% - - - - - - - - - - -2016-17 19.8% 11.3% - - - - - - - - - - -
Both Subjects2017-18 18.1% 17.8% - - - - - - - - - - -2016-17 12.9% 5.4% - - - - - - - - - - -
CTE Coherent Sequence (Annual Graduates)2017-18 58.4% 61.8% - - - - - - - - - - -2016-17 50.5% 30.1% - - - - - - - - - - -
Completed and Received Credit for College Prep Courses (Annual Graduates)English Language Arts
2017-18 2.0% 0.0% - - - - - - - - - - -2016-17 0.8% 0.0% - - - - - - - - - - -
Mathematics2017-18 3.9% 0.0% - - - - - - - - - - -2016-17 1.4% 0.0% - - - - - - - - - - -
Both Subjects2017-18 0.9% 0.0% - - - - - - - - - - -2016-17 0.2% 0.0% - - - - - - - - - - -
AP/IB Results (Participation) (Grades 11-12)All Subjects
2018 25.8% 10.3% - - - - - - - - n/a - n/a2017 26.2% 12.1% - - - - - - - - n/a - n/a
English Language Arts2018 15.3% 6.5% - - - - - - - - n/a - n/a2017 15.9% 5.8% - - - - - - - - n/a - n/a
Mathematics2018 7.3% 0.8% - - - - - - - - n/a - n/a2017 7.2% 0.8% - - - - - - - - n/a - n/a
Science2018 10.8% 4.4% - - - - - - - - n/a - n/a2017 10.9% 4.2% - - - - - - - - n/a - n/a
Social Studies2018 14.5% 4.9% - - - - - - - - n/a - n/a2017 15.0% 8.8% - - - - - - - - n/a - n/a
AP/IB Results (Examinees >= Criterion) (Grades 11-12)All Subjects
2018 50.7% 48.5% - - - - - - - - n/a - n/a2017 49.1% 39.3% - - - - - - - - n/a - n/a
English Language Arts2018 42.5% 33.9% - - - - - - - - n/a - n/a2017 41.3% 38.9% - - - - - - - - n/a - n/a
Mathematics2018 52.8% 12.5% - - - - - - - - n/a - n/a
18-19 AAR Page 574

TEA | Governance and Accountability | Performance Reporting Page 233 December 2019
TEXAS EDUCATION AGENCYDistrict Name: WILLIS ISD Texas Academic Performance Report Total Students: 235
Campus Name: ROARK EARLY EDUCATION CENTER 2018-19 Campus CCMR-Related Indicators Grade Span: EE - PKCampus Number: 170904109 School Type: Elementary
State District CampusAfrican
American Hispanic WhiteAmerican
Indian AsianPacific
Islander
Two orMore
RacesSpecial
EdEcon
DisadvEL
(Current)2017 51.3% 14.3% - - - - - - - - n/a - n/a
Science2018 38.0% 21.4% - - - - - - - - n/a - n/a2017 38.3% 15.4% - - - - - - - - n/a - n/a
Social Studies2018 44.6% 51.1% - - - - - - - - n/a - n/a2017 41.4% 37.8% - - - - - - - - n/a - n/a
SAT/ACT Results (Annual Graduates) ***Tested
2017-18 74.6% 51.7% - - - - - - - - n/a - n/a2016-17 73.5% 53.6% - - - - - - - - n/a - n/a
At/Above Criterion2017-18 37.9% 33.0% - - - - - - - - n/a - n/a
Average SAT Score (Annual Graduates) ***All Subjects
2017-18 1036 1028 - - - - - - - - n/a - n/aEnglish Language Artsand Writing
2017-18 521 527 - - - - - - - - n/a - n/aMathematics
2017-18 515 500 - - - - - - - - n/a - n/a
Average ACT Score (Annual Graduates) ***All Subjects
2017-18 20.6 20.0 - - - - - - - - n/a - n/aEnglish Language Arts
2017-18 20.3 19.6 - - - - - - - - n/a - n/aMathematics
2017-18 20.6 19.4 - - - - - - - - n/a - n/aScience
2017-18 20.9 20.8 - - - - - - - - n/a - n/a
18-19 AAR Page 575

TEA | Governance and Accountability | Performance Reporting Page 234 December 2019
TEXAS EDUCATION AGENCYDistrict Name: WILLIS ISD Texas Academic Performance Report Total Students: 235
Campus Name: ROARK EARLY EDUCATION CENTER 2018-19 Campus Other Postsecondary Indicators Grade Span: EE - PKCampus Number: 170904109 School Type: Elementary
State District CampusAfrican
American Hispanic WhiteAmerican
Indian AsianPacific
Islander
Two orMore
RacesSpecial
EdEcon
DisadvEL
(Current)Advanced Dual-Credit Course Completion (Grades 9-12)
Any Subject2017-18 43.4% 32.6% - - - - - - - - - - -2016-17 37.1% 19.8% - - - - - - - - - - -
English Language Arts2017-18 17.3% 13.8% - - - - - - - - - - -2016-17 16.8% 13.1% - - - - - - - - - - -
Mathematics2017-18 20.7% 13.2% - - - - - - - - - - -2016-17 19.5% 12.1% - - - - - - - - - - -
Science2017-18 21.2% 19.7% - - - - - - - - - - -2016-17 5.7% 5.4% - - - - - - - - - - -
Social Studies2017-18 22.8% 11.7% - - - - - - - - - - -2016-17 21.8% 10.8% - - - - - - - - - - -
Graduates Enrolled in Texas Institution of Higher Education (TX IHE)2016-17 54.6% 48.0% - - - - - - - - - - -2015-16 54.7% 49.1% - - - - - - - - - - -
Graduates in TX IHE Completing One Year Without Enrollment in a Developmental Education Course2016-17 59.2% 54.6% - - - - - - - - - - -2015-16 55.7% 55.5% - - - - - - - - - - -
18-19 AAR Page 576

TEA | Governance and Accountability | Performance Reporting Page 235 December 2019
TEXAS EDUCATION AGENCYDistrict Name: WILLIS ISD Texas Academic Performance Report Total Students: 235
Campus Name: ROARK EARLY EDUCATION CENTER 2018-19 Campus Student Information Grade Span: EE - PKCampus Number: 170904109 School Type: Elementary
---------------- Campus ----------------Student Information Count Percent District State
Total Students 235 100.0% 7,469 5,416,400
Students by Grade:Early Childhood Education 63 26.8% 0.8% 0.3%Pre-Kindergarten 172 73.2% 2.3% 4.4%Kindergarten 0 0.0% 6.5% 6.9%Grade 1 0 0.0% 7.6% 7.1%Grade 2 0 0.0% 7.6% 7.2%Grade 3 0 0.0% 7.9% 7.3%Grade 4 0 0.0% 8.4% 7.6%Grade 5 0 0.0% 7.8% 7.7%Grade 6 0 0.0% 7.6% 7.7%Grade 7 0 0.0% 7.8% 7.5%Grade 8 0 0.0% 7.4% 7.5%Grade 9 0 0.0% 9.6% 8.1%Grade 10 0 0.0% 6.3% 7.4%Grade 11 0 0.0% 6.3% 6.9%Grade 12 0 0.0% 6.0% 6.5%
Ethnic Distribution:African American 16 6.8% 6.9% 12.6%Hispanic 105 44.7% 37.0% 52.6%White 105 44.7% 51.9% 27.4%American Indian 0 0.0% 0.4% 0.4%Asian 2 0.9% 0.6% 4.5%Pacific Islander 0 0.0% 0.1% 0.2%Two or More Races 7 3.0% 3.1% 2.4%
Economically Disadvantaged 149 63.4% 60.1% 60.6%Non-Educationally Disadvantaged 86 36.6% 39.9% 39.4%Section 504 Students 0 0.0% 6.1% 6.5%English Learners (EL) 44 18.7% 14.4% 19.5%Students w/ Disciplinary Placements (2017-18) 0 0.0% 1.8% 1.4%Students w/ Dyslexia 0 0.0% 2.6% 3.6%At-Risk 49 20.9% 50.8% 50.1%
Students with Disabilities by Type of Primary Disability:Total Students with Disabilities 33By Type of Primary Disability
Students with Intellectual Disabilities 0 0.0% 38.4% 42.4%Students with Physical Disabilities ** ** 21.4% 21.9%Students with Autism 12 36.4% 19.0% 13.7%Students with Behavioral Disabilities * * 19.2% 20.6%Students with Non-Categorical Early Childhood 10 30.3% 2.1% 1.4%
Mobility (2017-18):Total Mobile Students 0 0.0% 19.0% 15.4%
18-19 AAR Page 577

TEA | Governance and Accountability | Performance Reporting Page 236 December 2019
TEXAS EDUCATION AGENCYDistrict Name: WILLIS ISD Texas Academic Performance Report Total Students: 235
Campus Name: ROARK EARLY EDUCATION CENTER 2018-19 Campus Student Information Grade Span: EE - PKCampus Number: 170904109 School Type: Elementary
---------------- Campus ----------------Student Information Count Percent District State
By Ethnicity:African American 0 0.0%Hispanic 0 0.0%White 0 0.0%American Indian 0 0.0%Asian 0 0.0%Pacific Islander 0 0.0%Two or More Races 0 0.0%
Class Size Information Campus District State
Class Size Averages by Grade and Subject(Derived from teacher responsibility records):
Elementary:Kindergarten - 20.9 18.9Grade 1 - 19.8 18.8Grade 2 - 19.1 18.7Grade 3 - 20.1 18.9Grade 4 - 20.0 19.2Grade 5 - 23.0 21.2Grade 6 - 19.3 20.4
Secondary:English/Language Arts - 15.9 16.6Foreign Languages - 21.8 18.9Mathematics - 16.7 17.8Science - 18.4 18.9Social Studies - 18.1 19.3
18-19 AAR Page 578

TEA | Governance and Accountability | Performance Reporting Page 237 December 2019
TEXAS EDUCATION AGENCYDistrict Name: WILLIS ISD Texas Academic Performance Report Total Students: 235
Campus Name: ROARK EARLY EDUCATION CENTER 2018-19 Campus Staff Information Grade Span: EE - PKCampus Number: 170904109 School Type: Elementary
---------------- Campus ----------------Staff Information Count/Average Percent District State
Total Staff 15.6 100.0% 100.0% 100.0%
Professional Staff: 8.9 56.7% 57.6% 64.1%Teachers 7.9 50.3% 44.8% 49.8%Professional Support 1.0 6.4% 9.2% 10.1%Campus Administration (School Leadership) 0.0 0.0% 2.9% 3.0%
Educational Aides: 6.8 43.3% 11.0% 10.3%
Librarians & Counselors (Headcount):Librarians
Full-time 0.0 n/a 0.0 4,414.0Part-time 0.0 n/a 0.0 572.0
CounselorsFull-time 0.0 n/a 12.0 12,433.0Part-time 0.0 n/a 2.0 1,097.0
Total Minority Staff: 4.7 30.0% 27.1% 50.4%
Teachers by Ethnicity and Sex:African American 0.0 0.0% 2.8% 10.6%Hispanic 0.9 11.8% 14.2% 27.7%White 6.9 88.2% 82.1% 58.4%American Indian 0.0 0.0% 0.2% 0.3%Asian 0.0 0.0% 0.2% 1.7%Pacific Islander 0.0 0.0% 0.0% 0.2%Two or More Races 0.0 0.0% 0.5% 1.1%
Males 0.0 0.0% 18.6% 23.8%Females 7.9 100.0% 81.4% 76.2%
Teachers by Highest Degree Held:No Degree 0.0 0.0% 0.5% 1.4%Bachelors 6.9 87.3% 81.7% 73.6%Masters 1.0 12.7% 17.4% 24.3%Doctorate 0.0 0.0% 0.5% 0.7%
Teachers by Years of Experience:Beginning Teachers 1.0 12.7% 8.0% 7.0%1-5 Years Experience 1.0 12.7% 31.7% 28.9%6-10 Years Experience 0.0 0.0% 17.5% 19.0%11-20 Years Experience 2.9 37.3% 24.9% 29.3%Over 20 Years Experience 2.9 37.3% 17.9% 15.7%
Number of Students per Teacher 29.9 n/a 17.2 15.1
18-19 AAR Page 579

TEA | Governance and Accountability | Performance Reporting Page 238 December 2019
TEXAS EDUCATION AGENCYDistrict Name: WILLIS ISD Texas Academic Performance Report Total Students: 235
Campus Name: ROARK EARLY EDUCATION CENTER 2018-19 Campus Staff Information Grade Span: EE - PKCampus Number: 170904109 School Type: Elementary
Staff Information Campus District State
Experience of Campus Leadership:Average Years Experience of Principals 0.0 2.8 6.3Average Years Experience of Principals with District 0.0 2.8 5.4Average Years Experience of Assistant Principals 0.0 6.1 5.3Average Years Experience of Assistant Principals with District 0.0 4.2 4.7
Average Years Experience of Teachers: 17.1 10.7 11.1Average Years Experience of Teachers with District: 13.1 6.5 7.2
Average Teacher Salary by Years of Experience (regular duties only):Beginning Teachers $48,002 $45,854 $47,2181-5 Years Experience $56,120 $50,779 $50,4086-10 Years Experience - $52,839 $52,78611-20 Years Experience $55,367 $57,036 $56,041Over 20 Years Experience $65,031 $63,917 $62,039
Average Actual Salaries (regular duties only):Teachers $58,129 $54,658 $54,122Professional Support $44,868 $65,409 $64,069Campus Administration (School Leadership) - $78,467 $78,947
Instructional Staff Percent: n/a 60.4% 64.5%
Contracted Instructional Staff (not incl. above): 0.0 1.5 6,043.6
18-19 AAR Page 580
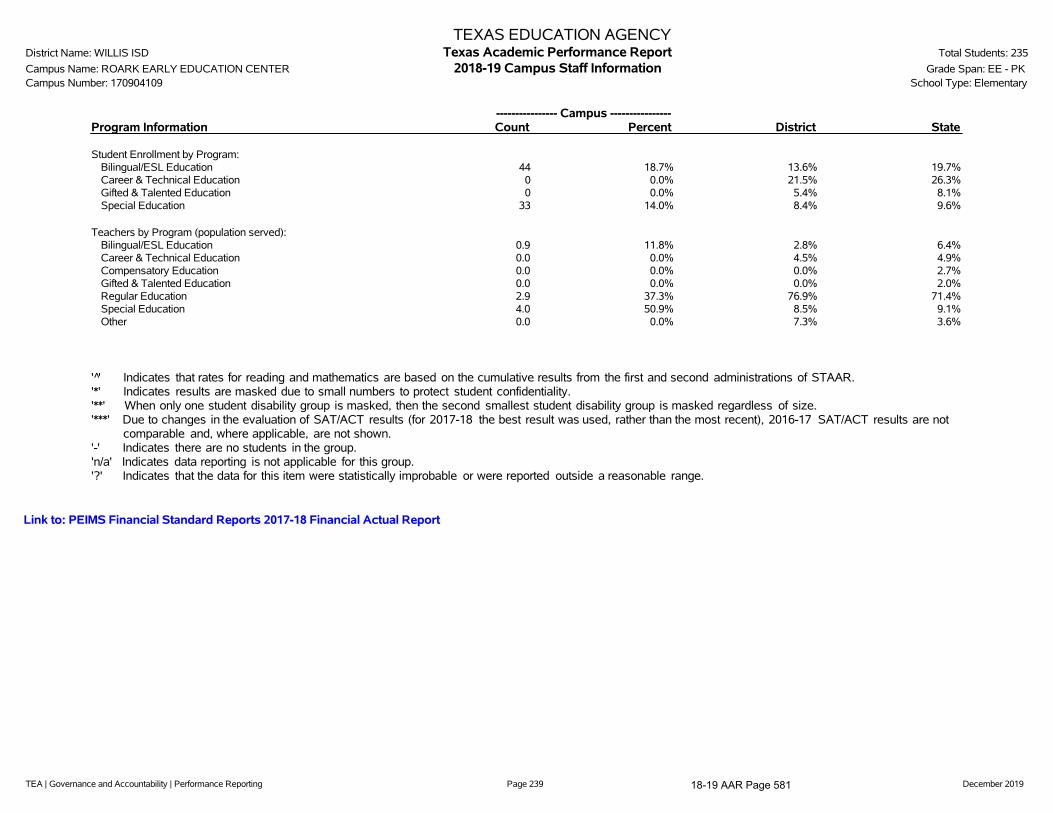
TEA | Governance and Accountability | Performance Reporting Page 239 December 2019
TEXAS EDUCATION AGENCYDistrict Name: WILLIS ISD Texas Academic Performance Report Total Students: 235
Campus Name: ROARK EARLY EDUCATION CENTER 2018-19 Campus Staff Information Grade Span: EE - PKCampus Number: 170904109 School Type: Elementary
---------------- Campus ----------------Program Information Count Percent District State
Student Enrollment by Program:Bilingual/ESL Education 44 18.7% 13.6% 19.7%Career & Technical Education 0 0.0% 21.5% 26.3%Gifted & Talented Education 0 0.0% 5.4% 8.1%Special Education 33 14.0% 8.4% 9.6%
Teachers by Program (population served):Bilingual/ESL Education 0.9 11.8% 2.8% 6.4%Career & Technical Education 0.0 0.0% 4.5% 4.9%Compensatory Education 0.0 0.0% 0.0% 2.7%Gifted & Talented Education 0.0 0.0% 0.0% 2.0%Regular Education 2.9 37.3% 76.9% 71.4%Special Education 4.0 50.9% 8.5% 9.1%Other 0.0 0.0% 7.3% 3.6%
' '̂ Indicates that rates for reading and mathematics are based on the cumulative results from the first and second administrations of STAAR.'*' Indicates results are masked due to small numbers to protect student confidentiality.'**' When only one student disability group is masked, then the second smallest student disability group is masked regardless of size.'***' Due to changes in the evaluation of SAT/ACT results (for 2017-18 the best result was used, rather than the most recent), 2016-17 SAT/ACT results are not
comparable and, where applicable, are not shown.'-' Indicates there are no students in the group.'n/a' Indicates data reporting is not applicable for this group.'?' Indicates that the data for this item were statistically improbable or were reported outside a reasonable range.
Link to: PEIMS Financial Standard Reports 2017-18 Financial Actual Report
18-19 AAR Page 581
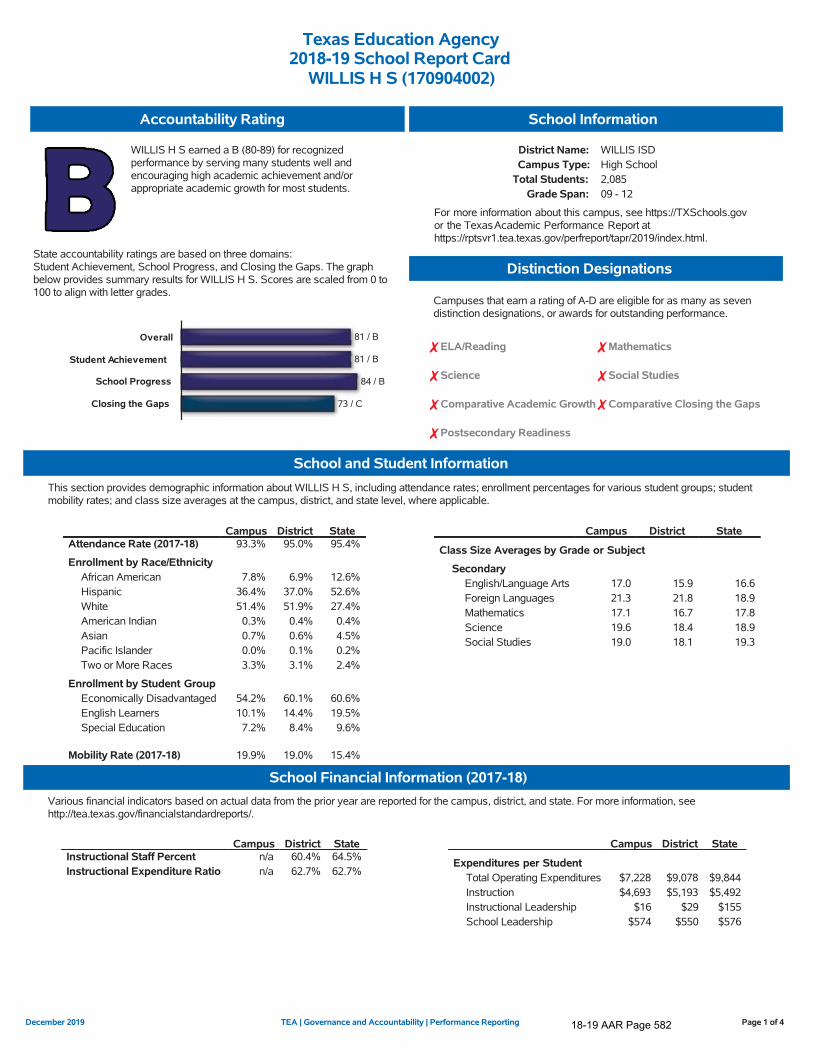
Texas Education Agency2018-19 School Report Card
WILLIS H S (170904002)
Accountability Rating
WILLIS H S earned a B (80-89) for recognizedperformance by serving many students well andencouraging high academic achievement and/orappropriate academic growth for most students.
State accountability ratings are based on three domains:Student Achievement, School Progress, and Closing the Gaps. The graphbelow provides summary results for WILLIS H S. Scores are scaled from 0 to100 to align with letter grades.
81 / B
81 / B
84 / B
73 / CClosing the Gaps
School Progress
Student Achievement
Overall
.
School Information
District Name: WILLIS ISDCampus Type: High School
Total Students: 2,085Grade Span: 09 - 12
For more information about this campus, see https://TXSchools.govor the TexasAcademic Performance Report athttps://rptsvr1.tea.texas.gov/perfreport/tapr/2019/index.html.
Distinction Designations
Campuses that earn a rating of A-D are eligible for as many as sevendistinction designations, or awards for outstanding performance.
ELA/Reading Mathematics
Science Social Studies
Comparative Academic Growth Comparative Closing the Gaps
Postsecondary Readiness
School and Student InformationThis section provides demographic information about WILLIS H S, including attendance rates; enrollment percentages for various student groups; studentmobility rates; and class size averages at the campus, district, and state level, where applicable.
Campus District StateAttendance Rate (2017-18) 93.3% 95.0% 95.4%
Enrollment by Race/EthnicityAfrican American 7.8% 6.9% 12.6%Hispanic 36.4% 37.0% 52.6%White 51.4% 51.9% 27.4%American Indian 0.3% 0.4% 0.4%Asian 0.7% 0.6% 4.5%Pacific Islander 0.0% 0.1% 0.2%Two or More Races 3.3% 3.1% 2.4%
Enrollment by Student GroupEconomically Disadvantaged 54.2% 60.1% 60.6%English Learners 10.1% 14.4% 19.5%Special Education 7.2% 8.4% 9.6%
Mobility Rate (2017-18) 19.9% 19.0% 15.4%
Campus District State
Class Size Averages by Grade or Subject
SecondaryEnglish/Language Arts 17.0 15.9 16.6Foreign Languages 21.3 21.8 18.9Mathematics 17.1 16.7 17.8Science 19.6 18.4 18.9Social Studies 19.0 18.1 19.3
School Financial Information (2017-18)Various financial indicators based on actual data from the prior year are reported for the campus, district, and state. For more information, seehttp://tea.texas.gov/financialstandardreports/.
Campus District StateInstructional Staff Percent n/a 60.4% 64.5%Instructional Expenditure Ratio n/a 62.7% 62.7%
Campus District State
Expenditures per StudentTotal Operating Expenditures $7,228 $9,078 $9,844Instruction $4,693 $5,193 $5,492Instructional Leadership $16 $29 $155School Leadership $574 $550 $576
Page 1 of 4TEA | Governance and Accountability | Performance ReportingDecember 2019
18-19 AAR Page 582

Texas Education Agency2018-19 School Report Card
WILLIS H S (170904002)
STAAR OutcomesThis section provides STAAR performance and Academic Growth outcomes. Academic Growth measures whether studentsare maintaining performance or improving from year to year.
State District CampusAfrican
American Hispanic WhiteAmerican
Indian AsianPacific
Islander
Two orMoreRaces
EconDisadv
STAARPerformance Rates at Approaches Grade Level or Above (All Grades Tested)All Subjects 2019 78% 76% 76% 67% 73% 80% 93% 100% * 75% 73%
2018 77% 75% 75% 71% 68% 80% 75% 92% * 82% 69%ELA/Reading 2019 75% 72% 66% 56% 59% 72% 100% * * 69% 62%
2018 74% 72% 65% 64% 57% 72% * * * 74% 60%Mathematics 2019 82% 81% 72% 63% 80% 68% * * - 63% 72%
2018 81% 81% 69% 65% 66% 73% * - - 80% 65%Science 2019 81% 81% 90% 84% 88% 92% * * - 88% 87%
2018 80% 77% 85% 80% 82% 88% * - * 95% 81%Social Studies 2019 81% 81% 93% 87% 88% 97% * * - 100% 89%
2018 78% 79% 92% 87% 85% 98% * 89% - 88% 88%
STAARPerformance Rates at Meets Grade Level or Above (All Grades Tested)All Subjects 2019 50% 45% 50% 37% 43% 58% 33% 55% * 45% 44%
2018 48% 45% 48% 39% 38% 58% 50% 92% * 48% 40%ELA/Reading 2019 48% 43% 45% 32% 37% 53% 50% * * 51% 39%
2018 46% 41% 42% 32% 30% 52% * * * 40% 33%Mathematics 2019 52% 49% 33% 26% 33% 35% * * - 19% 30%
2018 50% 49% 31% 29% 27% 35% * - - 33% 28%Science 2019 54% 51% 61% 47% 57% 67% * * - 44% 57%
2018 51% 46% 58% 48% 48% 67% * - * 55% 49%Social Studies 2019 55% 52% 70% 54% 58% 84% * * - 64% 62%
2018 53% 48% 69% 56% 60% 78% * 89% - 71% 62%
STAARPerformance Rates at Masters Grade Level (All Grades Tested)All Subjects 2019 24% 19% 15% 7% 12% 20% 13% 45% * 14% 11%
2018 22% 18% 14% 11% 11% 18% 13% 38% * 11% 10%ELA/Reading 2019 21% 17% 6% 4% 4% 9% 0% * * 2% 4%
2018 19% 16% 6% 8% 4% 8% * * * 4% 4%Mathematics 2019 26% 23% 12% 4% 12% 14% * * - 6% 9%
2018 24% 21% 10% 13% 9% 12% * - - 7% 8%Science 2019 25% 20% 20% 5% 13% 26% * * - 31% 14%
2018 23% 18% 18% 18% 14% 23% * - * 9% 13%Social Studies 2019 33% 27% 41% 21% 32% 52% * * - 45% 33%
2018 31% 24% 36% 13% 29% 44% * 56% - 35% 27%
AcademicGrowth Score (All Grades Tested)Both Subjects 2019 69 66 61 57 63 62 50 * * 61 61
2018 69 69 65 59 63 67 * * - 66 61ELA/Reading 2019 68 66 70 70 70 71 * - * 68 71
2018 69 68 70 62 67 73 * * - 70 65Mathematics 2019 70 66 52 45 56 51 * * - 50 51
2018 70 69 57 56 58 57 * - - 63 56
? Indicates that the data for this item were statistically improbable or were reported outside a reasonable range. - Indicates zero observations reported for this group. * Indicates results are masked due to small numbers to protect student confidentiality.n/a Indicates data reporting is not applicable for this group.
Page 2 of 4TEA | Governance and Accountability | Performance ReportingDecember 2019
18-19 AAR Page 583

Texas Education Agency2018-19 School Report Card
WILLIS H S (170904002)
Graduation and College, Career, and Military Readiness OutcomesThis section provides graduation, graduation plan, and College, Career, and Military Readiness rates.
State District CampusAfrican
American Hispanic WhiteAmerican
Indian AsianPacific
Islander
Two orMore
RacesEcon
Disadv
Annual Dropout Rate (Gr 9-12)2017-18 1.9% 2.9% 2.9% 2.8% 3.9% 2.3% 0.0% 0.0% * 2.8% 3.2%2016-17 1.9% 1.5% 1.5% 2.0% 2.0% 1.1% 0.0% 0.0% * 2.7% 2.3%
4-Year Longitudinal Rate (Gr 9-12)Class of 2018
Graduated 90.0% 86.4% 86.6% 83.3% 82.2% 89.3% * * * 81.8% 83.2%Graduates, TxCHSE, & Cont 94.3% 90.9% 90.8% 91.7% 88.4% 92.2% * * * 81.8% 88.2%
Class of 2017Graduated 89.7% 89.3% 89.3% 90.7% 81.8% 93.0% * 100.0% - 87.5% 85.7%Graduates, TxCHSE, & Cont 94.1% 95.0% 95.0% 93.0% 93.4% 96.1% * 100.0% - 93.8% 91.4%
5-Year Extended Longitudinal Rate (Gr 9-12)Class of 2017
Graduated 92.0% 92.0% 92.0% 93.0% 87.0% 94.5% * 100.0% - 87.5% 87.3%Graduates, TxCHSE, & Cont 93.7% 93.5% 93.5% 93.0% 89.9% 95.3% * 100.0% - 93.8% 89.4%
Class of 2016Graduated 91.6% 93.7% 93.7% 91.4% 92.2% 94.3% * * * 100.0% 89.2%Graduates, TxCHSE, & Cont 93.4% 94.8% 94.8% 91.4% 93.8% 95.5% * * * 100.0% 90.1%
6-Year Extended Longitudinal Rate (Gr 9-12)Class of 2016
Graduated 92.1% 93.9% 93.9% 91.4% 93.0% 94.3% * * * 100.0% 89.6%Graduates, TxCHSE, & Cont 93.4% 95.0% 95.0% 91.4% 94.5% 95.5% * * * 100.0% 90.6%
Class of 2015Graduated 91.8% 93.3% 93.3% 96.9% 92.4% 93.2% * 83.3% * 100.0% 90.3%Graduates, TxCHSE, & Cont 93.3% 95.0% 95.0% 96.9% 93.9% 94.9% * 100.0% * 100.0% 91.8%
4-Year Federal Graduation Rate Without Exclusions (Gr 9-12)Class of 2018 90.0% 85.5% 85.7% 81.1% 80.0% 89.3% * * * 81.8% 82.4%Class of 2017 89.7% 88.6% 88.6% 88.6% 81.2% 92.3% * 100.0% - 87.5% 85.0%
RHSP/DAP Graduates (Longitudinal Rate)Class of 2018 68.5% * * - - - - - - * *Class of 2017 88.5% 89.1% 89.1% 84.2% 92.8% 87.2% * 100.0% - 100.0% 85.1%
RHSP/DAP/FHSP-E/FHSP-DLA Graduates (Longitudinal Rate)Class of 2018 86.8% 89.2% 89.2% 93.3% 90.0% 88.8% * * * 77.8% 86.3%Class of 2017 85.9% 87.8% 87.8% 82.1% 92.0% 85.8% * 100.0% - 100.0% 82.8%
College, Career, and Military Ready (Annual Graduates)2017-18 65.5% 64.0% 64.0% 50.0% 56.6% 70.4% * * * 38.9% 58.3%
SAT/ACTResults (Annual Graduates)Tested
2017-18 74.6% 51.7% 51.7% 77.4% 40.6% 54.3% * * * 55.6% 45.0%2016-17 73.5% 53.6% 53.6% 71.4% 45.7% 53.5% 100.0% 100.0% - 46.7% 42.3%
Average SAT Score ***2017-18 1036 1028 1028 969 996 1051 * * * 974 998
Average ACT Score ***2017-18 20.6 20.0 20.0 15.7 18.7 21.5 * - - - 18.4
? Indicates that the data for this item were statistically improbable or were reported outside a reasonable range. - Indicates zero observations reported for this group. * Indicates results are masked due to small numbers to protect student confidentiality.n/a Indicates data reporting is not applicable for this group.*** Due to changes in the evaluation of SAT/ACT results (for 2017-18 the best result was used, rather than the most recent), 2016-17 SAT/ACT results are not comparable and, where applicable, are not shown.
Page 3 of 4TEA | Governance and Accountability | Performance ReportingDecember 2019
18-19 AAR Page 584
Texas Education Agency2018-19 School Report Card
WILLIS H S (170904002)
This page is intentionally blank.
Page 4 of 4TEA | Governance and Accountability | Performance ReportingDecember 2019
18-19 AAR Page 585

Texas Education Agency2018-19 School Report Card
STUBBLEFIELD ALTERNATIVE ACADEMY (170904003)
Accountability Rating
NotRated
STUBBLEFIELD ALTERNATIVE ACADEMY is Not Ratedbecause of certain, specific circumstances.
State accountability ratings are based on three domains:Student Achievement, School Progress, and Closing the Gaps. The graphbelow provides summary results for STUBBLEFIELD ALTERNATIVEACADEMY. Scores are scaled from 0 to 100 to align with letter grades.
RatingScaledScore
Overall Not Rated N/AStudent Achievement Not Rated N/ASchool Progress Not Rated N/AClosing the Gaps Not Rated N/A
School Information
District Name: WILLIS ISDCampus Type: Elementary/Secondary
Total Students: 26Grade Span: 04 - 12
For more information about this campus, see https://TXSchools.govor the TexasAcademic Performance Report athttps://rptsvr1.tea.texas.gov/perfreport/tapr/2019/index.html.
Distinction Designations
Campuses that earn a rating of A-D are eligible for as many as sevendistinction designations, or awards for outstanding performance.
School and Student InformationThis section provides demographic information about STUBBLEFIELD ALTERNATIVE ACADEMY, including attendance rates; enrollment percentages forvarious student groups; student mobility rates; and class size averages at the campus, district, and state level, where applicable.
Campus District StateAttendance Rate (2017-18) 87.9% 95.0% 95.4%
Enrollment by Race/EthnicityAfrican American 11.5% 6.9% 12.6%Hispanic 26.9% 37.0% 52.6%White 53.8% 51.9% 27.4%American Indian 3.8% 0.4% 0.4%Asian 0.0% 0.6% 4.5%Pacific Islander 0.0% 0.1% 0.2%Two or More Races 3.8% 3.1% 2.4%
Enrollment by Student GroupEconomically Disadvantaged 88.5% 60.1% 60.6%English Learners 15.4% 14.4% 19.5%Special Education 19.2% 8.4% 9.6%
Mobility Rate (2017-18) 100.0% 19.0% 15.4%
Campus District State
Class Size Averages by Grade or Subject
ElementaryGrade 4 1.0 20.0 19.2
SecondaryEnglish/Language Arts 2.2 15.9 16.6Mathematics 2.1 16.7 17.8Science 2.2 18.4 18.9Social Studies 2.4 18.1 19.3
School Financial Information (2017-18)Various financial indicators based on actual data from the prior year are reported for the campus, district, and state. For more information, seehttp://tea.texas.gov/financialstandardreports/.
Campus District StateInstructional Staff Percent n/a 60.4% 64.5%Instructional Expenditure Ratio n/a 62.7% 62.7%
Campus District State
Expenditures per StudentTotal Operating Expenditures $43,823 $9,078 $9,844Instruction $33,497 $5,193 $5,492Instructional Leadership $77 $29 $155School Leadership $6,449 $550 $576
Page 1 of 4TEA | Governance and Accountability | Performance ReportingDecember 2019
18-19 AAR Page 586
Texas Education Agency2018-19 School Report Card
STUBBLEFIELD ALTERNATIVE ACADEMY (170904003)
STAAR OutcomesThis section provides STAAR performance and Academic Growth outcomes. Academic Growth measures whether studentsare maintaining performance or improving from year to year.
There is no STAAR performance data for this campus.
Page 2 of 4TEA | Governance and Accountability | Performance ReportingDecember 2019
18-19 AAR Page 587

Texas Education Agency2018-19 School Report Card
STUBBLEFIELD ALTERNATIVE ACADEMY (170904003)
Graduation and College, Career, and Military Readiness OutcomesThis section provides graduation, graduation plan, and College, Career, and Military Readiness rates.
State District CampusAfrican
American Hispanic WhiteAmerican
Indian AsianPacific
Islander
Two orMore
RacesEcon
Disadv
Annual Dropout Rate (Gr 9-12)2017-18 1.9% 2.9% 0.0% 0.0% 0.0% 0.0% - - - * 0.0%2016-17 1.9% 1.5% - - - - - - - - -
4-Year Longitudinal Rate (Gr 9-12)Class of 2018
Graduated 90.0% 86.4% - - - - - - - - -Graduates, TxCHSE, & Cont 94.3% 90.9% - - - - - - - - -
Class of 2017Graduated 89.7% 89.3% - - - - - - - - -Graduates, TxCHSE, & Cont 94.1% 95.0% - - - - - - - - -
5-Year Extended Longitudinal Rate (Gr 9-12)Class of 2017
Graduated 92.0% 92.0% - - - - - - - - -Graduates, TxCHSE, & Cont 93.7% 93.5% - - - - - - - - -
Class of 2016Graduated 91.6% 93.7% - - - - - - - - -Graduates, TxCHSE, & Cont 93.4% 94.8% - - - - - - - - -
6-Year Extended Longitudinal Rate (Gr 9-12)Class of 2016
Graduated 92.1% 93.9% - - - - - - - - -Graduates, TxCHSE, & Cont 93.4% 95.0% - - - - - - - - -
Class of 2015Graduated 91.8% 93.3% - - - - - - - - -Graduates, TxCHSE, & Cont 93.3% 95.0% - - - - - - - - -
4-Year Federal Graduation Rate Without Exclusions (Gr 9-12)Class of 2018 90.0% 85.5% - - - - - - - - -Class of 2017 89.7% 88.6% - - - - - - - - -
RHSP/DAP Graduates (Longitudinal Rate)Class of 2018 68.5% * - - - - - - - - -Class of 2017 88.5% 89.1% - - - - - - - - -
RHSP/DAP/FHSP-E/FHSP-DLA Graduates (Longitudinal Rate)Class of 2018 86.8% 89.2% - - - - - - - - -Class of 2017 85.9% 87.8% - - - - - - - - -
College, Career, and Military Ready (Annual Graduates)2017-18 65.5% 64.0% - - - - - - - - -
SAT/ACTResults (Annual Graduates)Tested
2017-18 74.6% 51.7% - - - - - - - - -2016-17 73.5% 53.6% - - - - - - - - -
Average SAT Score ***2017-18 1036 1028 - - - - - - - - -
Average ACT Score ***2017-18 20.6 20.0 - - - - - - - - -
? Indicates that the data for this item were statistically improbable or were reported outside a reasonable range. - Indicates zero observations reported for this group. * Indicates results are masked due to small numbers to protect student confidentiality.n/a Indicates data reporting is not applicable for this group.*** Due to changes in the evaluation of SAT/ACT results (for 2017-18 the best result was used, rather than the most recent), 2016-17 SAT/ACT results are not comparable and, where applicable, are not shown.
Page 3 of 4TEA | Governance and Accountability | Performance ReportingDecember 2019
18-19 AAR Page 588

Texas Education Agency2018-19 School Report Card
STUBBLEFIELD ALTERNATIVE ACADEMY (170904003)
This page is intentionally blank.
Page 4 of 4TEA | Governance and Accountability | Performance ReportingDecember 2019
18-19 AAR Page 589

Texas Education Agency2018-19 School Report Card
LYNN LUCAS MIDDLE (170904042)
Accountability Rating
LYNN LUCAS MIDDLE earned a D (60-69) forperformance that needs improvement by serving too fewstudents well. Not enough students made adequateacademic progress for eventual success in college, acareer, or the military.
State accountability ratings are based on three domains:Student Achievement, School Progress, and Closing the Gaps. The graphbelow provides summary results for LYNN LUCAS MIDDLE. Scores are scaledfrom 0 to 100 to align with letter grades.
62 / D
69 / D
72 / C
39 / FClosing the Gaps
School Progress
Student Achievement
Overall
.
School Information
District Name: WILLIS ISDCampus Type: Middle School
Total Students: 810Grade Span: 06 - 08
For more information about this campus, see https://TXSchools.govor the TexasAcademic Performance Report athttps://rptsvr1.tea.texas.gov/perfreport/tapr/2019/index.html.
Distinction Designations
Campuses that earn a rating of A-D are eligible for as many as sevendistinction designations, or awards for outstanding performance.
ELA/Reading Mathematics
Science Social Studies
Comparative Academic Growth Comparative Closing the Gaps
Postsecondary Readiness
School and Student InformationThis section provides demographic information about LYNN LUCAS MIDDLE, including attendance rates; enrollment percentages for various studentgroups; student mobility rates; and class size averages at the campus, district, and state level, where applicable.
Campus District StateAttendance Rate (2017-18) 95.0% 95.0% 95.4%
Enrollment by Race/EthnicityAfrican American 7.4% 6.9% 12.6%Hispanic 41.1% 37.0% 52.6%White 46.5% 51.9% 27.4%American Indian 0.4% 0.4% 0.4%Asian 0.4% 0.6% 4.5%Pacific Islander 0.1% 0.1% 0.2%Two or More Races 4.1% 3.1% 2.4%
Enrollment by Student GroupEconomically Disadvantaged 70.5% 60.1% 60.6%English Learners 15.6% 14.4% 19.5%Special Education 8.9% 8.4% 9.6%
Mobility Rate (2017-18) 18.8% 19.0% 15.4%
Campus District State
Class Size Averages by Grade or Subject
ElementaryGrade 6 18.0 19.3 20.4
SecondaryEnglish/Language Arts 15.5 15.9 16.6Foreign Languages 20.0 21.8 18.9Mathematics 16.9 16.7 17.8Science 17.7 18.4 18.9Social Studies 17.1 18.1 19.3
School Financial Information (2017-18)Various financial indicators based on actual data from the prior year are reported for the campus, district, and state. For more information, seehttp://tea.texas.gov/financialstandardreports/.
Campus District StateInstructional Staff Percent n/a 60.4% 64.5%Instructional Expenditure Ratio n/a 62.7% 62.7%
Campus District State
Expenditures per StudentTotal Operating Expenditures $7,257 $9,078 $9,844Instruction $4,840 $5,193 $5,492Instructional Leadership $28 $29 $155School Leadership $591 $550 $576
Page 1 of 4TEA | Governance and Accountability | Performance ReportingDecember 2019
18-19 AAR Page 590
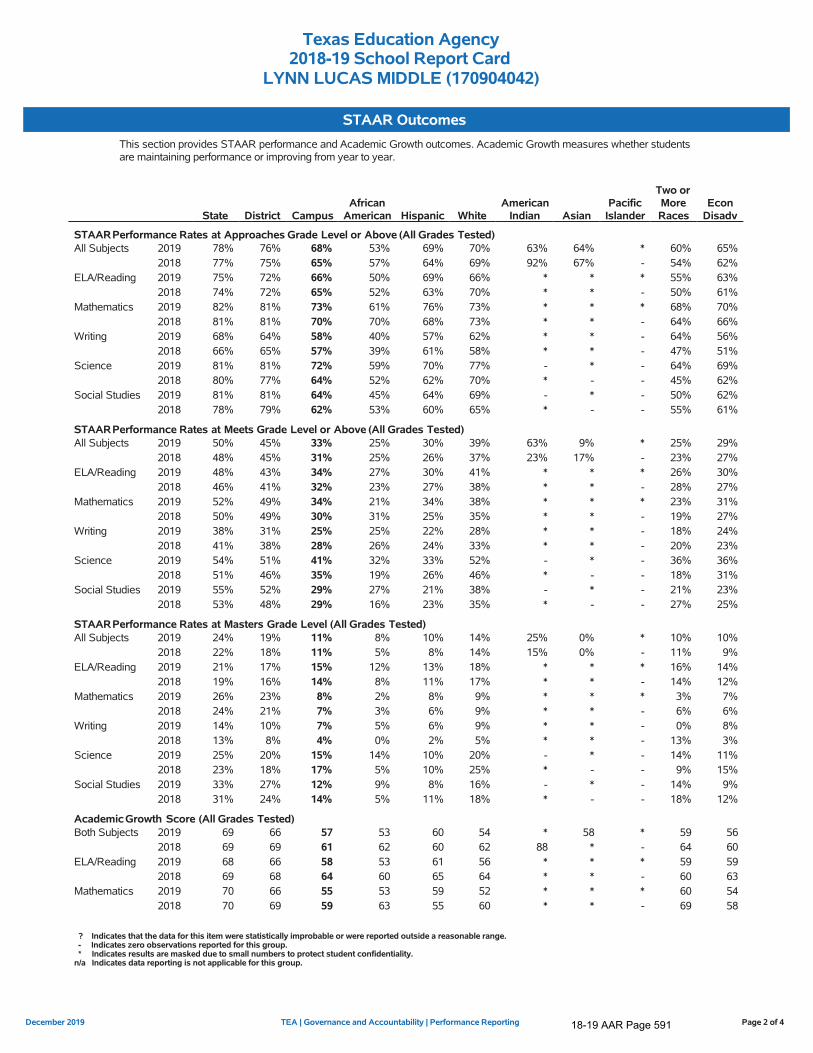
Texas Education Agency2018-19 School Report Card
LYNN LUCAS MIDDLE (170904042)
STAAR OutcomesThis section provides STAAR performance and Academic Growth outcomes. Academic Growth measures whether studentsare maintaining performance or improving from year to year.
State District CampusAfrican
American Hispanic WhiteAmerican
Indian AsianPacific
Islander
Two orMoreRaces
EconDisadv
STAARPerformance Rates at Approaches Grade Level or Above (All Grades Tested)All Subjects 2019 78% 76% 68% 53% 69% 70% 63% 64% * 60% 65%
2018 77% 75% 65% 57% 64% 69% 92% 67% - 54% 62%ELA/Reading 2019 75% 72% 66% 50% 69% 66% * * * 55% 63%
2018 74% 72% 65% 52% 63% 70% * * - 50% 61%Mathematics 2019 82% 81% 73% 61% 76% 73% * * * 68% 70%
2018 81% 81% 70% 70% 68% 73% * * - 64% 66%Writing 2019 68% 64% 58% 40% 57% 62% * * - 64% 56%
2018 66% 65% 57% 39% 61% 58% * * - 47% 51%Science 2019 81% 81% 72% 59% 70% 77% - * - 64% 69%
2018 80% 77% 64% 52% 62% 70% * - - 45% 62%Social Studies 2019 81% 81% 64% 45% 64% 69% - * - 50% 62%
2018 78% 79% 62% 53% 60% 65% * - - 55% 61%
STAARPerformance Rates at Meets Grade Level or Above (All Grades Tested)All Subjects 2019 50% 45% 33% 25% 30% 39% 63% 9% * 25% 29%
2018 48% 45% 31% 25% 26% 37% 23% 17% - 23% 27%ELA/Reading 2019 48% 43% 34% 27% 30% 41% * * * 26% 30%
2018 46% 41% 32% 23% 27% 38% * * - 28% 27%Mathematics 2019 52% 49% 34% 21% 34% 38% * * * 23% 31%
2018 50% 49% 30% 31% 25% 35% * * - 19% 27%Writing 2019 38% 31% 25% 25% 22% 28% * * - 18% 24%
2018 41% 38% 28% 26% 24% 33% * * - 20% 23%Science 2019 54% 51% 41% 32% 33% 52% - * - 36% 36%
2018 51% 46% 35% 19% 26% 46% * - - 18% 31%Social Studies 2019 55% 52% 29% 27% 21% 38% - * - 21% 23%
2018 53% 48% 29% 16% 23% 35% * - - 27% 25%
STAARPerformance Rates at Masters Grade Level (All Grades Tested)All Subjects 2019 24% 19% 11% 8% 10% 14% 25% 0% * 10% 10%
2018 22% 18% 11% 5% 8% 14% 15% 0% - 11% 9%ELA/Reading 2019 21% 17% 15% 12% 13% 18% * * * 16% 14%
2018 19% 16% 14% 8% 11% 17% * * - 14% 12%Mathematics 2019 26% 23% 8% 2% 8% 9% * * * 3% 7%
2018 24% 21% 7% 3% 6% 9% * * - 6% 6%Writing 2019 14% 10% 7% 5% 6% 9% * * - 0% 8%
2018 13% 8% 4% 0% 2% 5% * * - 13% 3%Science 2019 25% 20% 15% 14% 10% 20% - * - 14% 11%
2018 23% 18% 17% 5% 10% 25% * - - 9% 15%Social Studies 2019 33% 27% 12% 9% 8% 16% - * - 14% 9%
2018 31% 24% 14% 5% 11% 18% * - - 18% 12%
AcademicGrowth Score (All Grades Tested)Both Subjects 2019 69 66 57 53 60 54 * 58 * 59 56
2018 69 69 61 62 60 62 88 * - 64 60ELA/Reading 2019 68 66 58 53 61 56 * * * 59 59
2018 69 68 64 60 65 64 * * - 60 63Mathematics 2019 70 66 55 53 59 52 * * * 60 54
2018 70 69 59 63 55 60 * * - 69 58
? Indicates that the data for this item were statistically improbable or were reported outside a reasonable range. - Indicates zero observations reported for this group. * Indicates results are masked due to small numbers to protect student confidentiality.n/a Indicates data reporting is not applicable for this group.
Page 2 of 4TEA | Governance and Accountability | Performance ReportingDecember 2019
18-19 AAR Page 591

Texas Education Agency2018-19 School Report Card
LYNN LUCAS MIDDLE (170904042)
Prior-Year Non-Proficient and Student Success Initiative STAAR OutcomesProgress of Prior-Year Non-Proficient Students shows STAAR performance rates for students who did not performsatisfactorily in 2017-18 but did in 2018-19. Student Success Initiative shows rates related to the requirement for studentsto demonstrate proficiency on the reading and mathematics STAAR in grades 5 and 8.
State District CampusAfrican
American Hispanic WhiteAmerican
Indian AsianPacific
Islander
Two orMore
RacesEcon
Disadv
Progress of Prior-Year Non-Proficient Students
Sum of Grades 4-8
Reading2019 41% 39% 33% 26% 42% 26% - * - 29% 9%2018 38% 37% 29% 24% 31% 31% * - - * *
Mathematics2019 45% 48% 42% 25% 51% 36% - * - 44% 13%2018 47% 48% 36% 45% 33% 37% * * - * *
Students Success Initiative
Grade 8 Reading
Students Meeting Approaches Grade Level on First STAARAdministration2019 78% 76% 69% 45% 74% 72% - * - 54% 19%
Students Requiring Accelerated Instruction2019 22% 24% 31% 55% 26% 28% - * - 46% 81%
STAARCumulative Met Standard2019 85% 84% 81% 55% 90% 79% - * - 62% 31%
Grade 8 Mathematics
Students Meeting Approaches Grade Level on First STAARAdministration2019 82% 83% 73% 45% 78% 75% * * - 67% 47%
Students Requiring Accelerated Instruction2019 18% 17% 27% 55% 22% 25% * * - 33% 53%
STAARCumulative Met Standard2019 88% 88% 81% 45% 90% 83% * * - 67% 47%
? Indicates that the data for this item were statistically improbable or were reported outside a reasonable range. - Indicates zero observations reported for this group. * Indicates results are masked due to small numbers to protect student confidentiality.n/a Indicates data reporting is not applicable for this group.
Page 3 of 4TEA | Governance and Accountability | Performance ReportingDecember 2019
18-19 AAR Page 592

Texas Education Agency2018-19 School Report Card
LYNN LUCAS MIDDLE (170904042)
This page is intentionally blank.
Page 4 of 4TEA | Governance and Accountability | Performance ReportingDecember 2019
18-19 AAR Page 593
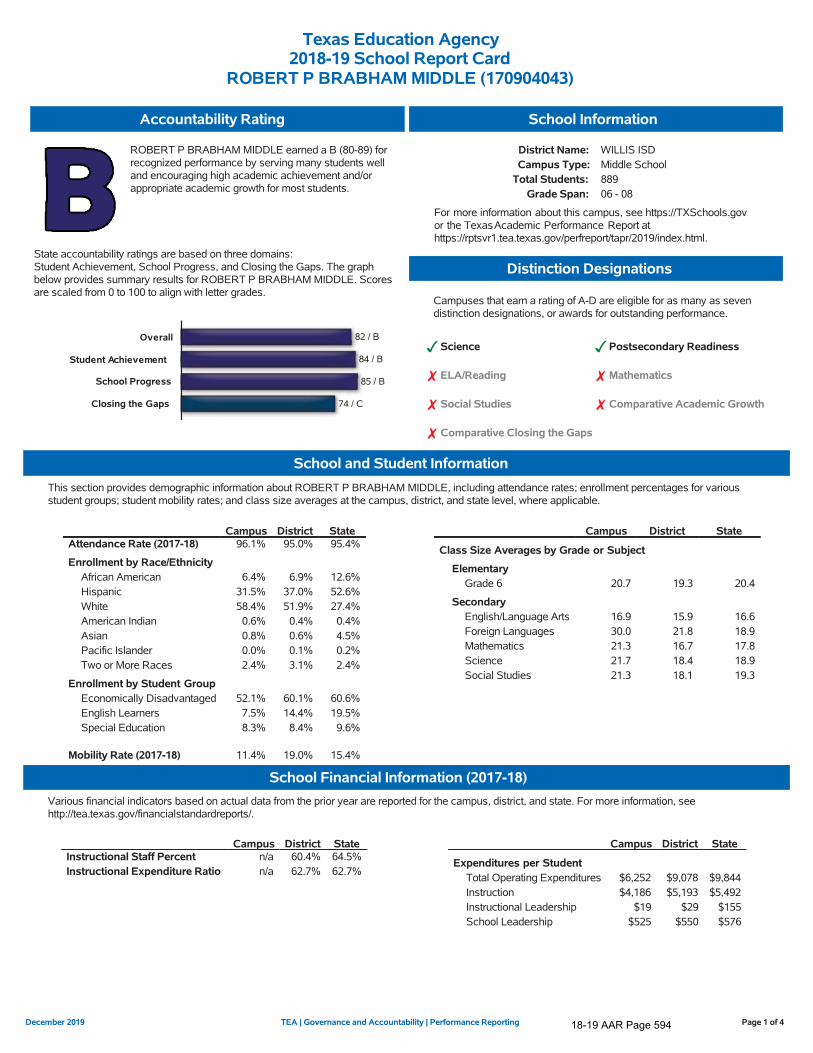
Texas Education Agency2018-19 School Report Card
ROBERT P BRABHAM MIDDLE (170904043)
Accountability Rating
ROBERT P BRABHAM MIDDLE earned a B (80-89) forrecognized performance by serving many students welland encouraging high academic achievement and/orappropriate academic growth for most students.
State accountability ratings are based on three domains:Student Achievement, School Progress, and Closing the Gaps. The graphbelow provides summary results for ROBERT P BRABHAM MIDDLE. Scoresare scaled from 0 to 100 to align with letter grades.
82 / B
84 / B
85 / B
74 / CClosing the Gaps
School Progress
Student Achievement
Overall
.
School Information
District Name: WILLIS ISDCampus Type: Middle School
Total Students: 889Grade Span: 06 - 08
For more information about this campus, see https://TXSchools.govor the TexasAcademic Performance Report athttps://rptsvr1.tea.texas.gov/perfreport/tapr/2019/index.html.
Distinction Designations
Campuses that earn a rating of A-D are eligible for as many as sevendistinction designations, or awards for outstanding performance.
Science Postsecondary Readiness
ELA/Reading Mathematics
Social Studies Comparative Academic Growth
Comparative Closing the Gaps
School and Student InformationThis section provides demographic information about ROBERT P BRABHAM MIDDLE, including attendance rates; enrollment percentages for variousstudent groups; student mobility rates; and class size averages at the campus, district, and state level, where applicable.
Campus District StateAttendance Rate (2017-18) 96.1% 95.0% 95.4%
Enrollment by Race/EthnicityAfrican American 6.4% 6.9% 12.6%Hispanic 31.5% 37.0% 52.6%White 58.4% 51.9% 27.4%American Indian 0.6% 0.4% 0.4%Asian 0.8% 0.6% 4.5%Pacific Islander 0.0% 0.1% 0.2%Two or More Races 2.4% 3.1% 2.4%
Enrollment by Student GroupEconomically Disadvantaged 52.1% 60.1% 60.6%English Learners 7.5% 14.4% 19.5%Special Education 8.3% 8.4% 9.6%
Mobility Rate (2017-18) 11.4% 19.0% 15.4%
Campus District State
Class Size Averages by Grade or Subject
ElementaryGrade 6 20.7 19.3 20.4
SecondaryEnglish/Language Arts 16.9 15.9 16.6Foreign Languages 30.0 21.8 18.9Mathematics 21.3 16.7 17.8Science 21.7 18.4 18.9Social Studies 21.3 18.1 19.3
School Financial Information (2017-18)Various financial indicators based on actual data from the prior year are reported for the campus, district, and state. For more information, seehttp://tea.texas.gov/financialstandardreports/.
Campus District StateInstructional Staff Percent n/a 60.4% 64.5%Instructional Expenditure Ratio n/a 62.7% 62.7%
Campus District State
Expenditures per StudentTotal Operating Expenditures $6,252 $9,078 $9,844Instruction $4,186 $5,193 $5,492Instructional Leadership $19 $29 $155School Leadership $525 $550 $576
Page 1 of 4TEA | Governance and Accountability | Performance ReportingDecember 2019
18-19 AAR Page 594
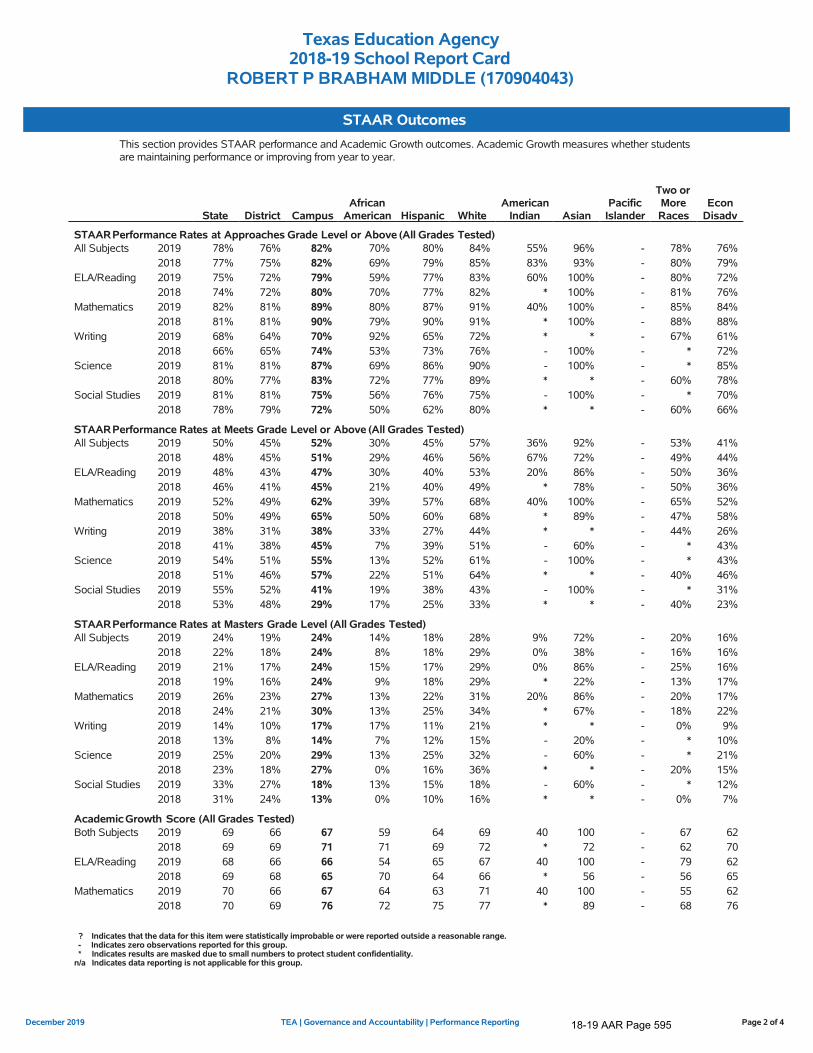
Texas Education Agency2018-19 School Report Card
ROBERT P BRABHAM MIDDLE (170904043)
STAAR OutcomesThis section provides STAAR performance and Academic Growth outcomes. Academic Growth measures whether studentsare maintaining performance or improving from year to year.
State District CampusAfrican
American Hispanic WhiteAmerican
Indian AsianPacific
Islander
Two orMoreRaces
EconDisadv
STAARPerformance Rates at Approaches Grade Level or Above (All Grades Tested)All Subjects 2019 78% 76% 82% 70% 80% 84% 55% 96% - 78% 76%
2018 77% 75% 82% 69% 79% 85% 83% 93% - 80% 79%ELA/Reading 2019 75% 72% 79% 59% 77% 83% 60% 100% - 80% 72%
2018 74% 72% 80% 70% 77% 82% * 100% - 81% 76%Mathematics 2019 82% 81% 89% 80% 87% 91% 40% 100% - 85% 84%
2018 81% 81% 90% 79% 90% 91% * 100% - 88% 88%Writing 2019 68% 64% 70% 92% 65% 72% * * - 67% 61%
2018 66% 65% 74% 53% 73% 76% - 100% - * 72%Science 2019 81% 81% 87% 69% 86% 90% - 100% - * 85%
2018 80% 77% 83% 72% 77% 89% * * - 60% 78%Social Studies 2019 81% 81% 75% 56% 76% 75% - 100% - * 70%
2018 78% 79% 72% 50% 62% 80% * * - 60% 66%
STAARPerformance Rates at Meets Grade Level or Above (All Grades Tested)All Subjects 2019 50% 45% 52% 30% 45% 57% 36% 92% - 53% 41%
2018 48% 45% 51% 29% 46% 56% 67% 72% - 49% 44%ELA/Reading 2019 48% 43% 47% 30% 40% 53% 20% 86% - 50% 36%
2018 46% 41% 45% 21% 40% 49% * 78% - 50% 36%Mathematics 2019 52% 49% 62% 39% 57% 68% 40% 100% - 65% 52%
2018 50% 49% 65% 50% 60% 68% * 89% - 47% 58%Writing 2019 38% 31% 38% 33% 27% 44% * * - 44% 26%
2018 41% 38% 45% 7% 39% 51% - 60% - * 43%Science 2019 54% 51% 55% 13% 52% 61% - 100% - * 43%
2018 51% 46% 57% 22% 51% 64% * * - 40% 46%Social Studies 2019 55% 52% 41% 19% 38% 43% - 100% - * 31%
2018 53% 48% 29% 17% 25% 33% * * - 40% 23%
STAARPerformance Rates at Masters Grade Level (All Grades Tested)All Subjects 2019 24% 19% 24% 14% 18% 28% 9% 72% - 20% 16%
2018 22% 18% 24% 8% 18% 29% 0% 38% - 16% 16%ELA/Reading 2019 21% 17% 24% 15% 17% 29% 0% 86% - 25% 16%
2018 19% 16% 24% 9% 18% 29% * 22% - 13% 17%Mathematics 2019 26% 23% 27% 13% 22% 31% 20% 86% - 20% 17%
2018 24% 21% 30% 13% 25% 34% * 67% - 18% 22%Writing 2019 14% 10% 17% 17% 11% 21% * * - 0% 9%
2018 13% 8% 14% 7% 12% 15% - 20% - * 10%Science 2019 25% 20% 29% 13% 25% 32% - 60% - * 21%
2018 23% 18% 27% 0% 16% 36% * * - 20% 15%Social Studies 2019 33% 27% 18% 13% 15% 18% - 60% - * 12%
2018 31% 24% 13% 0% 10% 16% * * - 0% 7%
AcademicGrowth Score (All Grades Tested)Both Subjects 2019 69 66 67 59 64 69 40 100 - 67 62
2018 69 69 71 71 69 72 * 72 - 62 70ELA/Reading 2019 68 66 66 54 65 67 40 100 - 79 62
2018 69 68 65 70 64 66 * 56 - 56 65Mathematics 2019 70 66 67 64 63 71 40 100 - 55 62
2018 70 69 76 72 75 77 * 89 - 68 76
? Indicates that the data for this item were statistically improbable or were reported outside a reasonable range. - Indicates zero observations reported for this group. * Indicates results are masked due to small numbers to protect student confidentiality.n/a Indicates data reporting is not applicable for this group.
Page 2 of 4TEA | Governance and Accountability | Performance ReportingDecember 2019
18-19 AAR Page 595
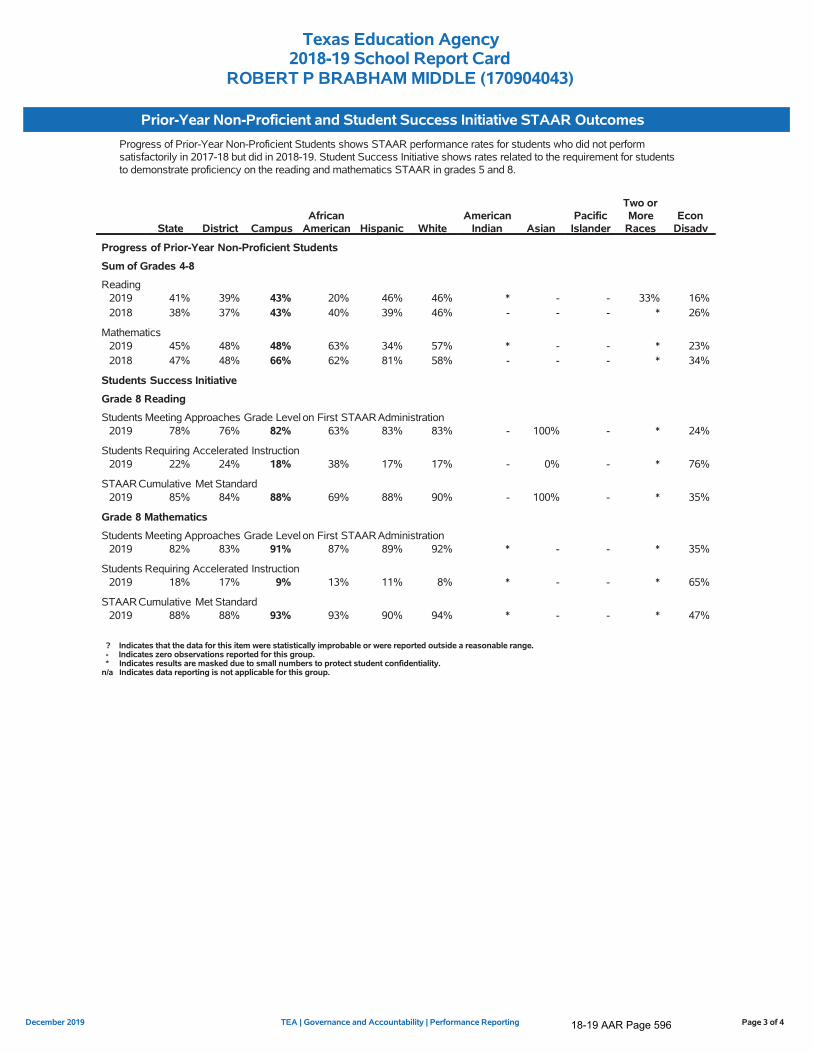
Texas Education Agency2018-19 School Report Card
ROBERT P BRABHAM MIDDLE (170904043)
Prior-Year Non-Proficient and Student Success Initiative STAAR OutcomesProgress of Prior-Year Non-Proficient Students shows STAAR performance rates for students who did not performsatisfactorily in 2017-18 but did in 2018-19. Student Success Initiative shows rates related to the requirement for studentsto demonstrate proficiency on the reading and mathematics STAAR in grades 5 and 8.
State District CampusAfrican
American Hispanic WhiteAmerican
Indian AsianPacific
Islander
Two orMore
RacesEcon
Disadv
Progress of Prior-Year Non-Proficient Students
Sum of Grades 4-8
Reading2019 41% 39% 43% 20% 46% 46% * - - 33% 16%2018 38% 37% 43% 40% 39% 46% - - - * 26%
Mathematics2019 45% 48% 48% 63% 34% 57% * - - * 23%2018 47% 48% 66% 62% 81% 58% - - - * 34%
Students Success Initiative
Grade 8 Reading
Students Meeting Approaches Grade Level on First STAARAdministration2019 78% 76% 82% 63% 83% 83% - 100% - * 24%
Students Requiring Accelerated Instruction2019 22% 24% 18% 38% 17% 17% - 0% - * 76%
STAARCumulative Met Standard2019 85% 84% 88% 69% 88% 90% - 100% - * 35%
Grade 8 Mathematics
Students Meeting Approaches Grade Level on First STAARAdministration2019 82% 83% 91% 87% 89% 92% * - - * 35%
Students Requiring Accelerated Instruction2019 18% 17% 9% 13% 11% 8% * - - * 65%
STAARCumulative Met Standard2019 88% 88% 93% 93% 90% 94% * - - * 47%
? Indicates that the data for this item were statistically improbable or were reported outside a reasonable range. - Indicates zero observations reported for this group. * Indicates results are masked due to small numbers to protect student confidentiality.n/a Indicates data reporting is not applicable for this group.
Page 3 of 4TEA | Governance and Accountability | Performance ReportingDecember 2019
18-19 AAR Page 596

Texas Education Agency2018-19 School Report Card
ROBERT P BRABHAM MIDDLE (170904043)
This page is intentionally blank.
Page 4 of 4TEA | Governance and Accountability | Performance ReportingDecember 2019
18-19 AAR Page 597
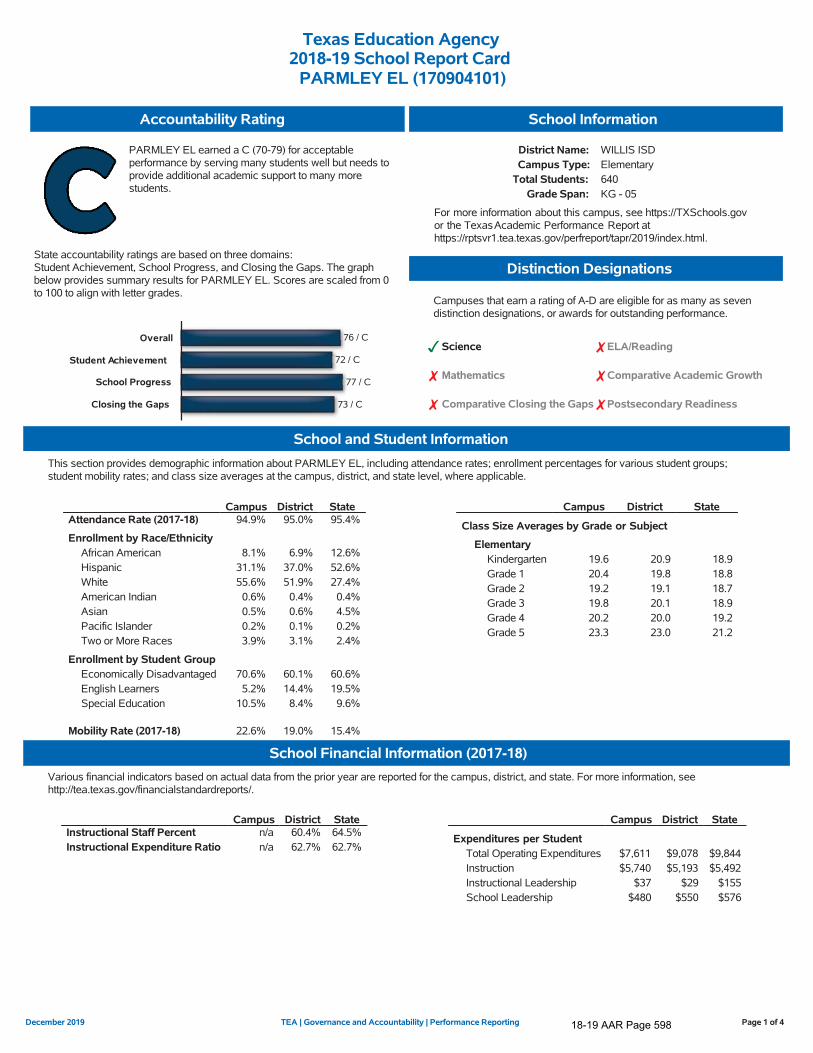
Texas Education Agency2018-19 School Report Card
PARMLEY EL (170904101)
Accountability Rating
PARMLEY EL earned a C (70-79) for acceptableperformance by serving many students well but needs toprovide additional academic support to many morestudents.
State accountability ratings are based on three domains:Student Achievement, School Progress, and Closing the Gaps. The graphbelow provides summary results for PARMLEY EL. Scores are scaled from 0to 100 to align with letter grades.
76 / C
72 / C
77 / C
73 / CClosing the Gaps
School Progress
Student Achievement
Overall
.
School Information
District Name: WILLIS ISDCampus Type: Elementary
Total Students: 640Grade Span: KG - 05
For more information about this campus, see https://TXSchools.govor the TexasAcademic Performance Report athttps://rptsvr1.tea.texas.gov/perfreport/tapr/2019/index.html.
Distinction Designations
Campuses that earn a rating of A-D are eligible for as many as sevendistinction designations, or awards for outstanding performance.
Science ELA/Reading
Mathematics Comparative Academic Growth
Comparative Closing the Gaps Postsecondary Readiness
School and Student InformationThis section provides demographic information about PARMLEY EL, including attendance rates; enrollment percentages for various student groups;student mobility rates; and class size averages at the campus, district, and state level, where applicable.
Campus District StateAttendance Rate (2017-18) 94.9% 95.0% 95.4%
Enrollment by Race/EthnicityAfrican American 8.1% 6.9% 12.6%Hispanic 31.1% 37.0% 52.6%White 55.6% 51.9% 27.4%American Indian 0.6% 0.4% 0.4%Asian 0.5% 0.6% 4.5%Pacific Islander 0.2% 0.1% 0.2%Two or More Races 3.9% 3.1% 2.4%
Enrollment by Student GroupEconomically Disadvantaged 70.6% 60.1% 60.6%English Learners 5.2% 14.4% 19.5%Special Education 10.5% 8.4% 9.6%
Mobility Rate (2017-18) 22.6% 19.0% 15.4%
Campus District State
Class Size Averages by Grade or Subject
ElementaryKindergarten 19.6 20.9 18.9Grade 1 20.4 19.8 18.8Grade 2 19.2 19.1 18.7Grade 3 19.8 20.1 18.9Grade 4 20.2 20.0 19.2Grade 5 23.3 23.0 21.2
School Financial Information (2017-18)Various financial indicators based on actual data from the prior year are reported for the campus, district, and state. For more information, seehttp://tea.texas.gov/financialstandardreports/.
Campus District StateInstructional Staff Percent n/a 60.4% 64.5%Instructional Expenditure Ratio n/a 62.7% 62.7%
Campus District State
Expenditures per StudentTotal Operating Expenditures $7,611 $9,078 $9,844Instruction $5,740 $5,193 $5,492Instructional Leadership $37 $29 $155School Leadership $480 $550 $576
Page 1 of 4TEA | Governance and Accountability | Performance ReportingDecember 2019
18-19 AAR Page 598
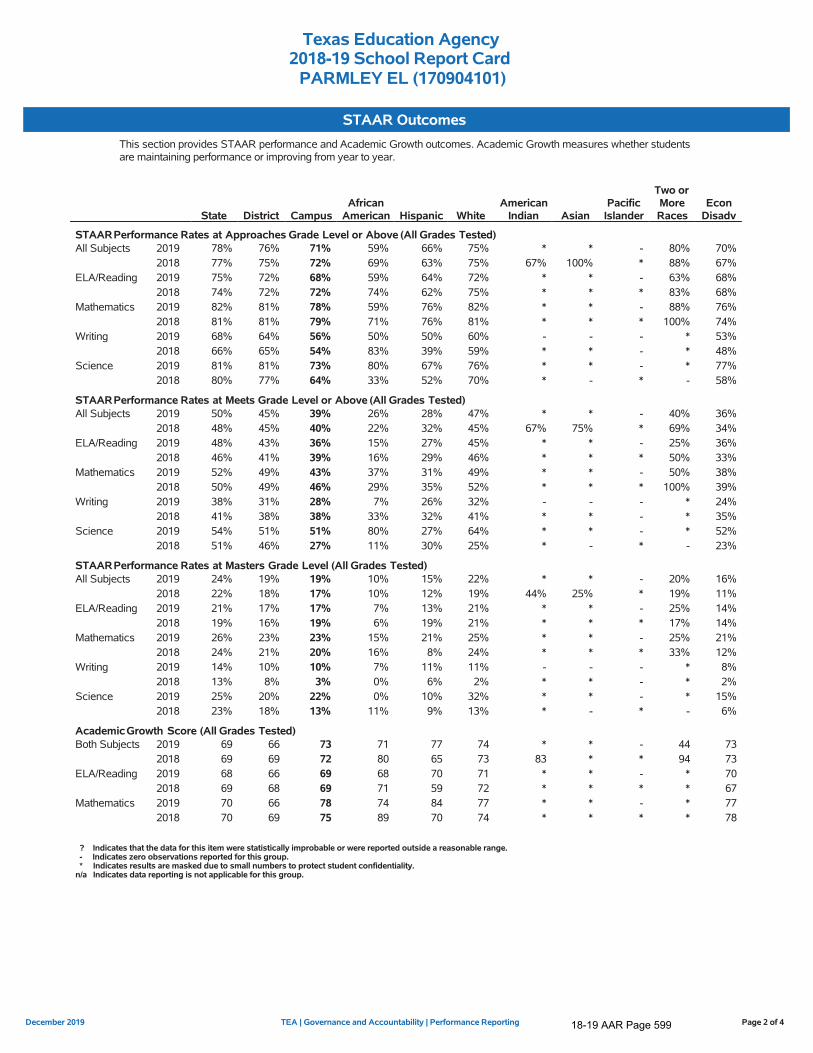
Texas Education Agency2018-19 School Report Card
PARMLEY EL (170904101)
STAAR OutcomesThis section provides STAAR performance and Academic Growth outcomes. Academic Growth measures whether studentsare maintaining performance or improving from year to year.
State District CampusAfrican
American Hispanic WhiteAmerican
Indian AsianPacific
Islander
Two orMoreRaces
EconDisadv
STAARPerformance Rates at Approaches Grade Level or Above (All Grades Tested)All Subjects 2019 78% 76% 71% 59% 66% 75% * * - 80% 70%
2018 77% 75% 72% 69% 63% 75% 67% 100% * 88% 67%ELA/Reading 2019 75% 72% 68% 59% 64% 72% * * - 63% 68%
2018 74% 72% 72% 74% 62% 75% * * * 83% 68%Mathematics 2019 82% 81% 78% 59% 76% 82% * * - 88% 76%
2018 81% 81% 79% 71% 76% 81% * * * 100% 74%Writing 2019 68% 64% 56% 50% 50% 60% - - - * 53%
2018 66% 65% 54% 83% 39% 59% * * - * 48%Science 2019 81% 81% 73% 80% 67% 76% * * - * 77%
2018 80% 77% 64% 33% 52% 70% * - * - 58%
STAARPerformance Rates at Meets Grade Level or Above (All Grades Tested)All Subjects 2019 50% 45% 39% 26% 28% 47% * * - 40% 36%
2018 48% 45% 40% 22% 32% 45% 67% 75% * 69% 34%ELA/Reading 2019 48% 43% 36% 15% 27% 45% * * - 25% 36%
2018 46% 41% 39% 16% 29% 46% * * * 50% 33%Mathematics 2019 52% 49% 43% 37% 31% 49% * * - 50% 38%
2018 50% 49% 46% 29% 35% 52% * * * 100% 39%Writing 2019 38% 31% 28% 7% 26% 32% - - - * 24%
2018 41% 38% 38% 33% 32% 41% * * - * 35%Science 2019 54% 51% 51% 80% 27% 64% * * - * 52%
2018 51% 46% 27% 11% 30% 25% * - * - 23%
STAARPerformance Rates at Masters Grade Level (All Grades Tested)All Subjects 2019 24% 19% 19% 10% 15% 22% * * - 20% 16%
2018 22% 18% 17% 10% 12% 19% 44% 25% * 19% 11%ELA/Reading 2019 21% 17% 17% 7% 13% 21% * * - 25% 14%
2018 19% 16% 19% 6% 19% 21% * * * 17% 14%Mathematics 2019 26% 23% 23% 15% 21% 25% * * - 25% 21%
2018 24% 21% 20% 16% 8% 24% * * * 33% 12%Writing 2019 14% 10% 10% 7% 11% 11% - - - * 8%
2018 13% 8% 3% 0% 6% 2% * * - * 2%Science 2019 25% 20% 22% 0% 10% 32% * * - * 15%
2018 23% 18% 13% 11% 9% 13% * - * - 6%
AcademicGrowth Score (All Grades Tested)Both Subjects 2019 69 66 73 71 77 74 * * - 44 73
2018 69 69 72 80 65 73 83 * * 94 73ELA/Reading 2019 68 66 69 68 70 71 * * - * 70
2018 69 68 69 71 59 72 * * * * 67Mathematics 2019 70 66 78 74 84 77 * * - * 77
2018 70 69 75 89 70 74 * * * * 78
? Indicates that the data for this item were statistically improbable or were reported outside a reasonable range. - Indicates zero observations reported for this group. * Indicates results are masked due to small numbers to protect student confidentiality.n/a Indicates data reporting is not applicable for this group.
Page 2 of 4TEA | Governance and Accountability | Performance ReportingDecember 2019
18-19 AAR Page 599
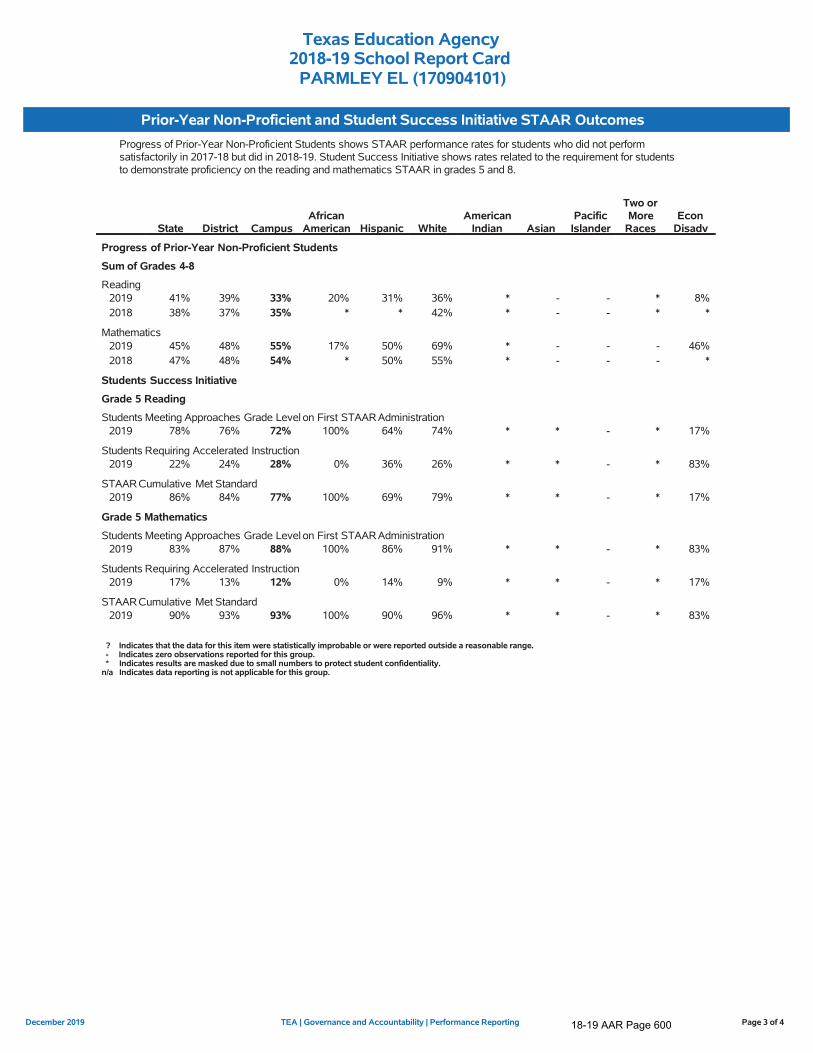
Texas Education Agency2018-19 School Report Card
PARMLEY EL (170904101)
Prior-Year Non-Proficient and Student Success Initiative STAAR OutcomesProgress of Prior-Year Non-Proficient Students shows STAAR performance rates for students who did not performsatisfactorily in 2017-18 but did in 2018-19. Student Success Initiative shows rates related to the requirement for studentsto demonstrate proficiency on the reading and mathematics STAAR in grades 5 and 8.
State District CampusAfrican
American Hispanic WhiteAmerican
Indian AsianPacific
Islander
Two orMore
RacesEcon
Disadv
Progress of Prior-Year Non-Proficient Students
Sum of Grades 4-8
Reading2019 41% 39% 33% 20% 31% 36% * - - * 8%2018 38% 37% 35% * * 42% * - - * *
Mathematics2019 45% 48% 55% 17% 50% 69% * - - - 46%2018 47% 48% 54% * 50% 55% * - - - *
Students Success Initiative
Grade 5 Reading
Students Meeting Approaches Grade Level on First STAARAdministration2019 78% 76% 72% 100% 64% 74% * * - * 17%
Students Requiring Accelerated Instruction2019 22% 24% 28% 0% 36% 26% * * - * 83%
STAARCumulative Met Standard2019 86% 84% 77% 100% 69% 79% * * - * 17%
Grade 5 Mathematics
Students Meeting Approaches Grade Level on First STAARAdministration2019 83% 87% 88% 100% 86% 91% * * - * 83%
Students Requiring Accelerated Instruction2019 17% 13% 12% 0% 14% 9% * * - * 17%
STAARCumulative Met Standard2019 90% 93% 93% 100% 90% 96% * * - * 83%
? Indicates that the data for this item were statistically improbable or were reported outside a reasonable range. - Indicates zero observations reported for this group. * Indicates results are masked due to small numbers to protect student confidentiality.n/a Indicates data reporting is not applicable for this group.
Page 3 of 4TEA | Governance and Accountability | Performance ReportingDecember 2019
18-19 AAR Page 600
Texas Education Agency2018-19 School Report Card
PARMLEY EL (170904101)
This page is intentionally blank.
Page 4 of 4TEA | Governance and Accountability | Performance ReportingDecember 2019
18-19 AAR Page 601

Texas Education Agency2018-19 School Report CardC C HARDY EL (170904103)
Accountability Rating
C C HARDY EL earned a C (70-79) for acceptableperformance by serving many students well but needs toprovide additional academic support to many morestudents.
State accountability ratings are based on three domains:Student Achievement, School Progress, and Closing the Gaps. The graphbelow provides summary results for C C HARDY EL. Scores are scaled from 0to 100 to align with letter grades.
74 / C
70 / C
75 / C
71 / CClosing the Gaps
School Progress
Student Achievement
Overall
.
School Information
District Name: WILLIS ISDCampus Type: Elementary
Total Students: 613Grade Span: KG - 05
For more information about this campus, see https://TXSchools.govor the TexasAcademic Performance Report athttps://rptsvr1.tea.texas.gov/perfreport/tapr/2019/index.html.
Distinction Designations
Campuses that earn a rating of A-D are eligible for as many as sevendistinction designations, or awards for outstanding performance.
ELA/Reading Mathematics
Science Comparative Academic Growth
Comparative Closing the Gaps Postsecondary Readiness
School and Student InformationThis section provides demographic information about C C HARDY EL, including attendance rates; enrollment percentages for various student groups;student mobility rates; and class size averages at the campus, district, and state level, where applicable.
Campus District StateAttendance Rate (2017-18) 95.9% 95.0% 95.4%
Enrollment by Race/EthnicityAfrican American 10.0% 6.9% 12.6%Hispanic 52.4% 37.0% 52.6%White 32.8% 51.9% 27.4%American Indian 0.2% 0.4% 0.4%Asian 0.2% 0.6% 4.5%Pacific Islander 0.0% 0.1% 0.2%Two or More Races 4.6% 3.1% 2.4%
Enrollment by Student GroupEconomically Disadvantaged 78.3% 60.1% 60.6%English Learners 32.3% 14.4% 19.5%Special Education 8.6% 8.4% 9.6%
Mobility Rate (2017-18) 19.5% 19.0% 15.4%
Campus District State
Class Size Averages by Grade or Subject
ElementaryKindergarten 21.7 20.9 18.9Grade 1 18.2 19.8 18.8Grade 2 20.6 19.1 18.7Grade 3 16.7 20.1 18.9Grade 4 18.8 20.0 19.2Grade 5 24.0 23.0 21.2
School Financial Information (2017-18)Various financial indicators based on actual data from the prior year are reported for the campus, district, and state. For more information, seehttp://tea.texas.gov/financialstandardreports/.
Campus District StateInstructional Staff Percent n/a 60.4% 64.5%Instructional Expenditure Ratio n/a 62.7% 62.7%
Campus District State
Expenditures per StudentTotal Operating Expenditures $7,611 $9,078 $9,844Instruction $5,599 $5,193 $5,492Instructional Leadership $23 $29 $155School Leadership $579 $550 $576
Page 1 of 4TEA | Governance and Accountability | Performance ReportingDecember 2019
18-19 AAR Page 602
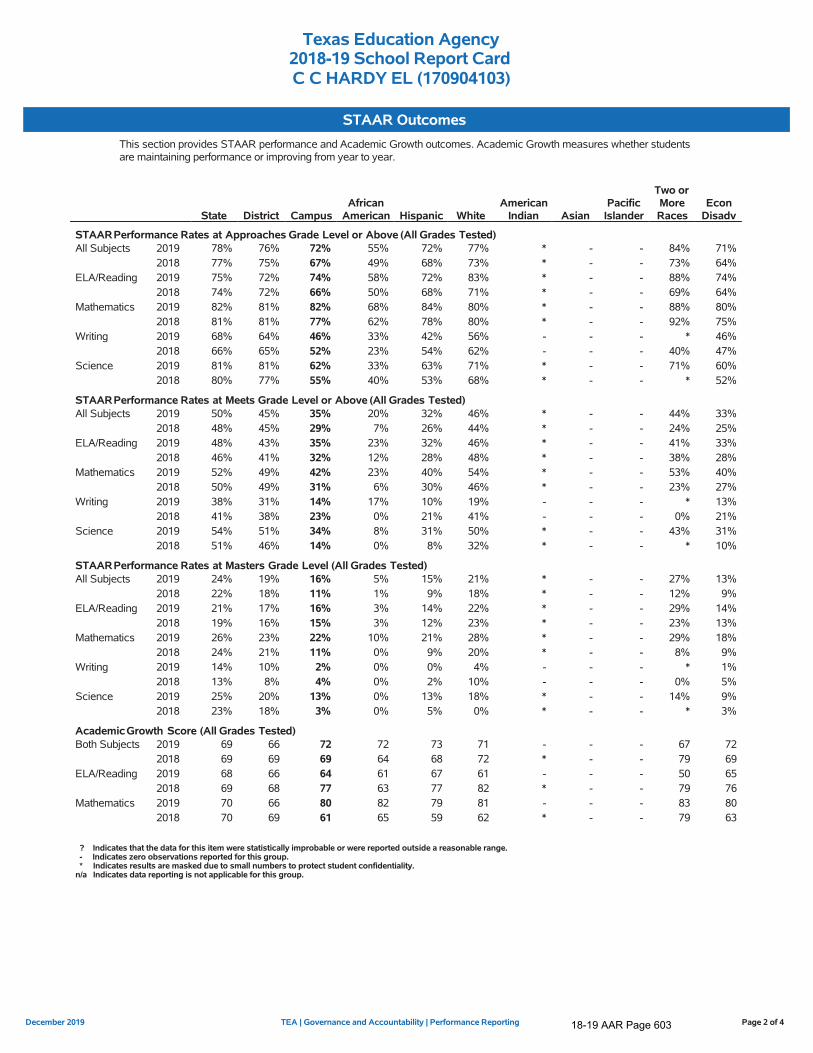
Texas Education Agency2018-19 School Report CardC C HARDY EL (170904103)
STAAR OutcomesThis section provides STAAR performance and Academic Growth outcomes. Academic Growth measures whether studentsare maintaining performance or improving from year to year.
State District CampusAfrican
American Hispanic WhiteAmerican
Indian AsianPacific
Islander
Two orMoreRaces
EconDisadv
STAARPerformance Rates at Approaches Grade Level or Above (All Grades Tested)All Subjects 2019 78% 76% 72% 55% 72% 77% * - - 84% 71%
2018 77% 75% 67% 49% 68% 73% * - - 73% 64%ELA/Reading 2019 75% 72% 74% 58% 72% 83% * - - 88% 74%
2018 74% 72% 66% 50% 68% 71% * - - 69% 64%Mathematics 2019 82% 81% 82% 68% 84% 80% * - - 88% 80%
2018 81% 81% 77% 62% 78% 80% * - - 92% 75%Writing 2019 68% 64% 46% 33% 42% 56% - - - * 46%
2018 66% 65% 52% 23% 54% 62% - - - 40% 47%Science 2019 81% 81% 62% 33% 63% 71% * - - 71% 60%
2018 80% 77% 55% 40% 53% 68% * - - * 52%
STAARPerformance Rates at Meets Grade Level or Above (All Grades Tested)All Subjects 2019 50% 45% 35% 20% 32% 46% * - - 44% 33%
2018 48% 45% 29% 7% 26% 44% * - - 24% 25%ELA/Reading 2019 48% 43% 35% 23% 32% 46% * - - 41% 33%
2018 46% 41% 32% 12% 28% 48% * - - 38% 28%Mathematics 2019 52% 49% 42% 23% 40% 54% * - - 53% 40%
2018 50% 49% 31% 6% 30% 46% * - - 23% 27%Writing 2019 38% 31% 14% 17% 10% 19% - - - * 13%
2018 41% 38% 23% 0% 21% 41% - - - 0% 21%Science 2019 54% 51% 34% 8% 31% 50% * - - 43% 31%
2018 51% 46% 14% 0% 8% 32% * - - * 10%
STAARPerformance Rates at Masters Grade Level (All Grades Tested)All Subjects 2019 24% 19% 16% 5% 15% 21% * - - 27% 13%
2018 22% 18% 11% 1% 9% 18% * - - 12% 9%ELA/Reading 2019 21% 17% 16% 3% 14% 22% * - - 29% 14%
2018 19% 16% 15% 3% 12% 23% * - - 23% 13%Mathematics 2019 26% 23% 22% 10% 21% 28% * - - 29% 18%
2018 24% 21% 11% 0% 9% 20% * - - 8% 9%Writing 2019 14% 10% 2% 0% 0% 4% - - - * 1%
2018 13% 8% 4% 0% 2% 10% - - - 0% 5%Science 2019 25% 20% 13% 0% 13% 18% * - - 14% 9%
2018 23% 18% 3% 0% 5% 0% * - - * 3%
AcademicGrowth Score (All Grades Tested)Both Subjects 2019 69 66 72 72 73 71 - - - 67 72
2018 69 69 69 64 68 72 * - - 79 69ELA/Reading 2019 68 66 64 61 67 61 - - - 50 65
2018 69 68 77 63 77 82 * - - 79 76Mathematics 2019 70 66 80 82 79 81 - - - 83 80
2018 70 69 61 65 59 62 * - - 79 63
? Indicates that the data for this item were statistically improbable or were reported outside a reasonable range. - Indicates zero observations reported for this group. * Indicates results are masked due to small numbers to protect student confidentiality.n/a Indicates data reporting is not applicable for this group.
Page 2 of 4TEA | Governance and Accountability | Performance ReportingDecember 2019
18-19 AAR Page 603

Texas Education Agency2018-19 School Report CardC C HARDY EL (170904103)
Prior-Year Non-Proficient and Student Success Initiative STAAR OutcomesProgress of Prior-Year Non-Proficient Students shows STAAR performance rates for students who did not performsatisfactorily in 2017-18 but did in 2018-19. Student Success Initiative shows rates related to the requirement for studentsto demonstrate proficiency on the reading and mathematics STAAR in grades 5 and 8.
State District CampusAfrican
American Hispanic WhiteAmerican
Indian AsianPacific
Islander
Two orMore
RacesEcon
Disadv
Progress of Prior-Year Non-Proficient Students
Sum of Grades 4-8
Reading2019 41% 39% 43% 38% 41% 47% - - - * 29%2018 38% 37% 31% * 39% * * - - * *
Mathematics2019 45% 48% 36% 25% 48% 20% - - - * 23%2018 47% 48% 40% * 35% 55% * - - * *
Students Success Initiative
Grade 5 Reading
Students Meeting Approaches Grade Level on First STAARAdministration2019 78% 76% 65% 42% 66% 71% * - - 71% 10%
Students Requiring Accelerated Instruction2019 22% 24% 35% 58% 34% 29% * - - 29% 90%
STAARCumulative Met Standard2019 86% 84% 76% 58% 76% 86% * - - 86% 40%
Grade 5 Mathematics
Students Meeting Approaches Grade Level on First STAARAdministration2019 83% 87% 69% 42% 68% 75% * - - 100% 30%
Students Requiring Accelerated Instruction2019 17% 13% 31% 58% 32% 25% * - - 0% 70%
STAARCumulative Met Standard2019 90% 93% 87% 67% 90% 86% * - - 100% 60%
? Indicates that the data for this item were statistically improbable or were reported outside a reasonable range. - Indicates zero observations reported for this group. * Indicates results are masked due to small numbers to protect student confidentiality.n/a Indicates data reporting is not applicable for this group.
Page 3 of 4TEA | Governance and Accountability | Performance ReportingDecember 2019
18-19 AAR Page 604

Texas Education Agency2018-19 School Report CardC C HARDY EL (170904103)
This page is intentionally blank.
Page 4 of 4TEA | Governance and Accountability | Performance ReportingDecember 2019
18-19 AAR Page 605

Texas Education Agency2018-19 School Report Card
TURNER EL (170904104)
Accountability Rating
TURNER EL earned an A (90-100) for exemplaryperformance by serving most students well, encouraginghigh academic achievement and/or appropriateacademic growth for almost all students, and preparingmost students for eventual success in college, a career,or the military.
State accountability ratings are based on three domains:Student Achievement, School Progress, and Closing the Gaps. The graphbelow provides summary results for TURNER EL. Scores are scaled from 0 to100 to align with letter grades.
94 / A
91 / A
85 / B
100 / AClosing the Gaps
School Progress
Student Achievement
Overall
.
School Information
District Name: WILLIS ISDCampus Type: Elementary
Total Students: 779Grade Span: KG - 05
For more information about this campus, see https://TXSchools.govor the TexasAcademic Performance Report athttps://rptsvr1.tea.texas.gov/perfreport/tapr/2019/index.html.
Distinction Designations
Campuses that earn a rating of A-D are eligible for as many as sevendistinction designations, or awards for outstanding performance.
Mathematics Comparative Academic Growth
Comparative Closing the Gaps Postsecondary Readiness
ELA/Reading Science
School and Student InformationThis section provides demographic information about TURNER EL, including attendance rates; enrollment percentages for various student groups; studentmobility rates; and class size averages at the campus, district, and state level, where applicable.
Campus District StateAttendance Rate (2017-18) 96.4% 95.0% 95.4%
Enrollment by Race/EthnicityAfrican American 6.4% 6.9% 12.6%Hispanic 21.4% 37.0% 52.6%White 67.4% 51.9% 27.4%American Indian 0.8% 0.4% 0.4%Asian 1.5% 0.6% 4.5%Pacific Islander 0.0% 0.1% 0.2%Two or More Races 2.4% 3.1% 2.4%
Enrollment by Student GroupEconomically Disadvantaged 37.0% 60.1% 60.6%English Learners 4.1% 14.4% 19.5%Special Education 6.4% 8.4% 9.6%
Mobility Rate (2017-18) 13.8% 19.0% 15.4%
Campus District State
Class Size Averages by Grade or Subject
ElementaryKindergarten 22.4 20.9 18.9Grade 1 19.8 19.8 18.8Grade 2 21.2 19.1 18.7Grade 3 23.5 20.1 18.9Grade 4 19.7 20.0 19.2Grade 5 26.4 23.0 21.2
School Financial Information (2017-18)Various financial indicators based on actual data from the prior year are reported for the campus, district, and state. For more information, seehttp://tea.texas.gov/financialstandardreports/.
Campus District StateInstructional Staff Percent n/a 60.4% 64.5%Instructional Expenditure Ratio n/a 62.7% 62.7%
Campus District State
Expenditures per StudentTotal Operating Expenditures $6,531 $9,078 $9,844Instruction $4,921 $5,193 $5,492Instructional Leadership $20 $29 $155School Leadership $401 $550 $576
Page 1 of 4TEA | Governance and Accountability | Performance ReportingDecember 2019
18-19 AAR Page 606

Texas Education Agency2018-19 School Report Card
TURNER EL (170904104)
STAAR OutcomesThis section provides STAAR performance and Academic Growth outcomes. Academic Growth measures whether studentsare maintaining performance or improving from year to year.
State District CampusAfrican
American Hispanic WhiteAmerican
Indian AsianPacific
Islander
Two orMoreRaces
EconDisadv
STAARPerformance Rates at Approaches Grade Level or Above (All Grades Tested)All Subjects 2019 78% 76% 91% 89% 85% 92% * 100% - 100% 87%
2018 77% 75% 89% 76% 79% 93% * 100% - 93% 84%ELA/Reading 2019 75% 72% 90% 88% 86% 91% * 100% - 100% 87%
2018 74% 72% 89% 79% 78% 93% * 100% - 92% 84%Mathematics 2019 82% 81% 95% 96% 95% 96% * 100% - 100% 92%
2018 81% 81% 95% 79% 91% 98% * 100% - 92% 91%Writing 2019 68% 64% 88% 100% 80% 88% - * - 100% 85%
2018 66% 65% 78% 83% 50% 82% - * - * 66%Science 2019 81% 81% 83% 63% 57% 91% - * - * 68%
2018 80% 77% 84% 40% 70% 93% * * - * 77%
STAARPerformance Rates at Meets Grade Level or Above (All Grades Tested)All Subjects 2019 50% 45% 61% 44% 53% 64% * 88% - 66% 49%
2018 48% 45% 63% 33% 55% 67% * 71% - 71% 53%ELA/Reading 2019 48% 43% 59% 33% 50% 62% * 83% - 77% 48%
2018 46% 41% 59% 16% 53% 64% * 50% - 67% 50%Mathematics 2019 52% 49% 72% 75% 66% 74% * 100% - 54% 59%
2018 50% 49% 75% 47% 73% 78% * 100% - 75% 67%Writing 2019 38% 31% 40% 30% 37% 40% - * - 75% 31%
2018 41% 38% 55% 67% 38% 59% - * - * 34%Science 2019 54% 51% 55% 0% 43% 63% - * - * 41%
2018 51% 46% 43% 0% 27% 50% * * - * 35%
STAARPerformance Rates at Masters Grade Level (All Grades Tested)All Subjects 2019 24% 19% 36% 14% 30% 40% * 75% - 26% 22%
2018 22% 18% 32% 18% 28% 35% * 41% - 32% 24%ELA/Reading 2019 21% 17% 36% 13% 26% 41% * 67% - 31% 23%
2018 19% 16% 34% 5% 27% 38% * 50% - 33% 23%Mathematics 2019 26% 23% 46% 25% 43% 49% * 83% - 31% 29%
2018 24% 21% 42% 42% 40% 43% * 67% - 42% 36%Writing 2019 14% 10% 14% 0% 10% 18% - * - 13% 8%
2018 13% 8% 14% 0% 6% 17% - * - * 3%Science 2019 25% 20% 27% 0% 24% 28% - * - * 12%
2018 23% 18% 13% 0% 9% 17% * * - * 10%
AcademicGrowth Score (All Grades Tested)Both Subjects 2019 69 66 78 75 77 79 - 94 - 56 73
2018 69 69 76 64 81 76 - 90 - 63 80ELA/Reading 2019 68 66 71 67 66 74 - * - 56 65
2018 69 68 74 73 77 74 - 80 - * 79Mathematics 2019 70 66 84 83 87 84 - * - 56 82
2018 70 69 79 55 85 77 - 100 - * 81
? Indicates that the data for this item were statistically improbable or were reported outside a reasonable range. - Indicates zero observations reported for this group. * Indicates results are masked due to small numbers to protect student confidentiality.n/a Indicates data reporting is not applicable for this group.
Page 2 of 4TEA | Governance and Accountability | Performance ReportingDecember 2019
18-19 AAR Page 607

Texas Education Agency2018-19 School Report Card
TURNER EL (170904104)
Prior-Year Non-Proficient and Student Success Initiative STAAR OutcomesProgress of Prior-Year Non-Proficient Students shows STAAR performance rates for students who did not performsatisfactorily in 2017-18 but did in 2018-19. Student Success Initiative shows rates related to the requirement for studentsto demonstrate proficiency on the reading and mathematics STAAR in grades 5 and 8.
State District CampusAfrican
American Hispanic WhiteAmerican
Indian AsianPacific
Islander
Two orMore
RacesEcon
Disadv
Progress of Prior-Year Non-Proficient Students
Sum of Grades 4-8
Reading2019 41% 39% 56% * 64% 55% - - - - *2018 38% 37% 46% * * 68% - - - - *
Mathematics2019 45% 48% 69% 100% 50% 60% - - - - 20%2018 47% 48% 79% * 67% 89% - - - - *
Students Success Initiative
Grade 5 Reading
Students Meeting Approaches Grade Level on First STAARAdministration2019 78% 76% 88% 63% 81% 92% - * - * 67%
Students Requiring Accelerated Instruction2019 22% 24% 12% 38% 19% 8% - * - * 33%
STAARCumulative Met Standard2019 86% 84% 94% 75% 90% 97% - * - * 67%
Grade 5 Mathematics
Students Meeting Approaches Grade Level on First STAARAdministration2019 83% 87% 98% 100% 90% 99% - * - * 67%
Students Requiring Accelerated Instruction2019 17% 13% 2% 0% 10% 1% - * - * 33%
STAARCumulative Met Standard2019 90% 93% 98% 100% 90% 100% - * - * 67%
? Indicates that the data for this item were statistically improbable or were reported outside a reasonable range. - Indicates zero observations reported for this group. * Indicates results are masked due to small numbers to protect student confidentiality.n/a Indicates data reporting is not applicable for this group.
Page 3 of 4TEA | Governance and Accountability | Performance ReportingDecember 2019
18-19 AAR Page 608

Texas Education Agency2018-19 School Report Card
TURNER EL (170904104)
This page is intentionally blank.
Page 4 of 4TEA | Governance and Accountability | Performance ReportingDecember 2019
18-19 AAR Page 609
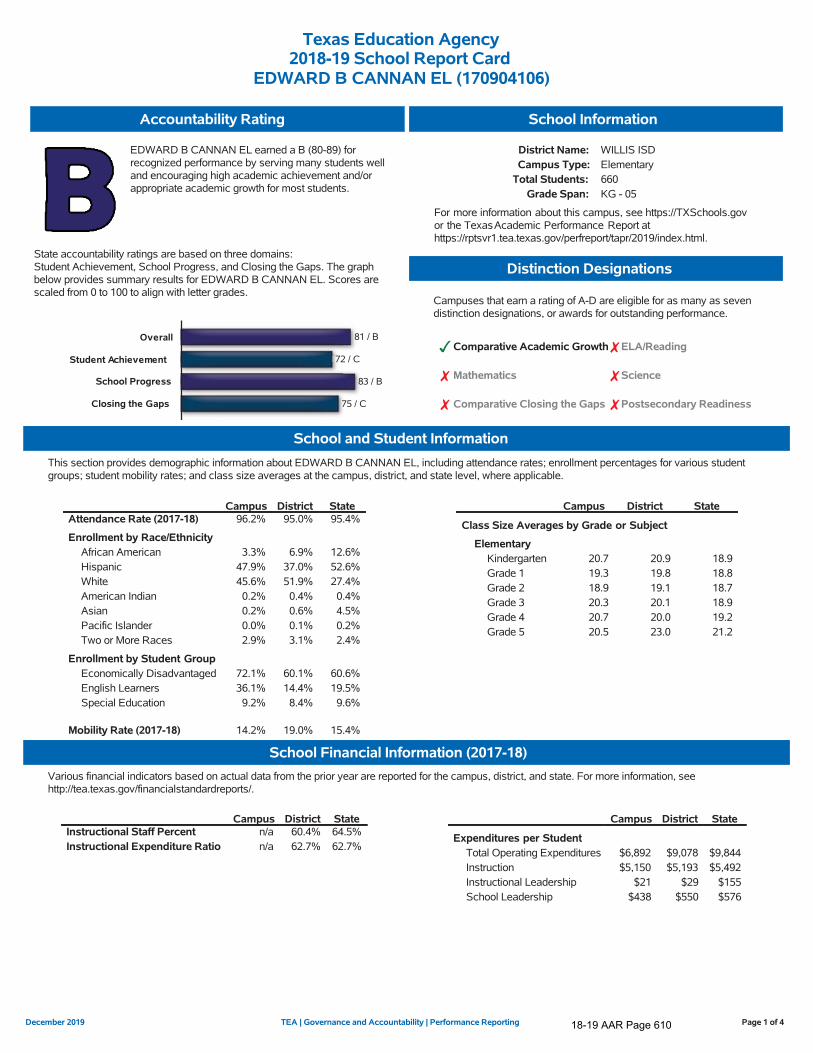
Texas Education Agency2018-19 School Report Card
EDWARD B CANNAN EL (170904106)
Accountability Rating
EDWARD B CANNAN EL earned a B (80-89) forrecognized performance by serving many students welland encouraging high academic achievement and/orappropriate academic growth for most students.
State accountability ratings are based on three domains:Student Achievement, School Progress, and Closing the Gaps. The graphbelow provides summary results for EDWARD B CANNAN EL. Scores arescaled from 0 to 100 to align with letter grades.
81 / B
72 / C
83 / B
75 / CClosing the Gaps
School Progress
Student Achievement
Overall
.
School Information
District Name: WILLIS ISDCampus Type: Elementary
Total Students: 660Grade Span: KG - 05
For more information about this campus, see https://TXSchools.govor the TexasAcademic Performance Report athttps://rptsvr1.tea.texas.gov/perfreport/tapr/2019/index.html.
Distinction Designations
Campuses that earn a rating of A-D are eligible for as many as sevendistinction designations, or awards for outstanding performance.
Comparative Academic Growth ELA/Reading
Mathematics Science
Comparative Closing the Gaps Postsecondary Readiness
School and Student InformationThis section provides demographic information about EDWARD B CANNAN EL, including attendance rates; enrollment percentages for various studentgroups; student mobility rates; and class size averages at the campus, district, and state level, where applicable.
Campus District StateAttendance Rate (2017-18) 96.2% 95.0% 95.4%
Enrollment by Race/EthnicityAfrican American 3.3% 6.9% 12.6%Hispanic 47.9% 37.0% 52.6%White 45.6% 51.9% 27.4%American Indian 0.2% 0.4% 0.4%Asian 0.2% 0.6% 4.5%Pacific Islander 0.0% 0.1% 0.2%Two or More Races 2.9% 3.1% 2.4%
Enrollment by Student GroupEconomically Disadvantaged 72.1% 60.1% 60.6%English Learners 36.1% 14.4% 19.5%Special Education 9.2% 8.4% 9.6%
Mobility Rate (2017-18) 14.2% 19.0% 15.4%
Campus District State
Class Size Averages by Grade or Subject
ElementaryKindergarten 20.7 20.9 18.9Grade 1 19.3 19.8 18.8Grade 2 18.9 19.1 18.7Grade 3 20.3 20.1 18.9Grade 4 20.7 20.0 19.2Grade 5 20.5 23.0 21.2
School Financial Information (2017-18)Various financial indicators based on actual data from the prior year are reported for the campus, district, and state. For more information, seehttp://tea.texas.gov/financialstandardreports/.
Campus District StateInstructional Staff Percent n/a 60.4% 64.5%Instructional Expenditure Ratio n/a 62.7% 62.7%
Campus District State
Expenditures per StudentTotal Operating Expenditures $6,892 $9,078 $9,844Instruction $5,150 $5,193 $5,492Instructional Leadership $21 $29 $155School Leadership $438 $550 $576
Page 1 of 4TEA | Governance and Accountability | Performance ReportingDecember 2019
18-19 AAR Page 610
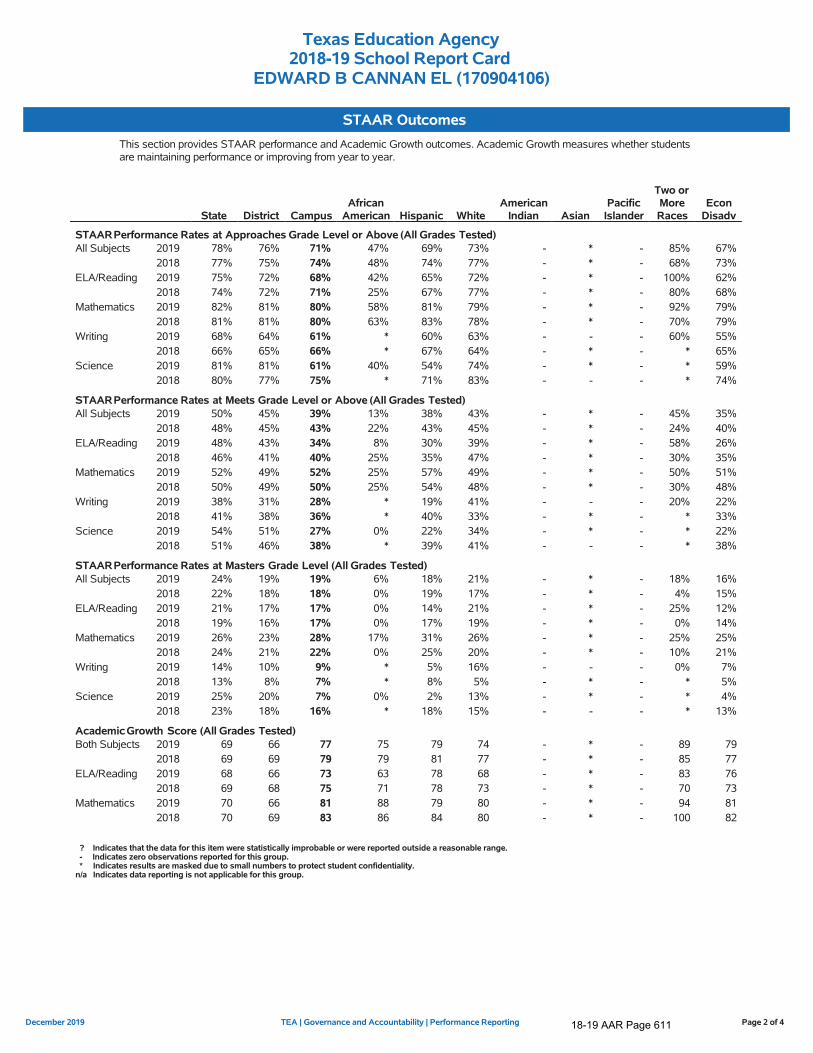
Texas Education Agency2018-19 School Report Card
EDWARD B CANNAN EL (170904106)
STAAR OutcomesThis section provides STAAR performance and Academic Growth outcomes. Academic Growth measures whether studentsare maintaining performance or improving from year to year.
State District CampusAfrican
American Hispanic WhiteAmerican
Indian AsianPacific
Islander
Two orMoreRaces
EconDisadv
STAARPerformance Rates at Approaches Grade Level or Above (All Grades Tested)All Subjects 2019 78% 76% 71% 47% 69% 73% - * - 85% 67%
2018 77% 75% 74% 48% 74% 77% - * - 68% 73%ELA/Reading 2019 75% 72% 68% 42% 65% 72% - * - 100% 62%
2018 74% 72% 71% 25% 67% 77% - * - 80% 68%Mathematics 2019 82% 81% 80% 58% 81% 79% - * - 92% 79%
2018 81% 81% 80% 63% 83% 78% - * - 70% 79%Writing 2019 68% 64% 61% * 60% 63% - - - 60% 55%
2018 66% 65% 66% * 67% 64% - * - * 65%Science 2019 81% 81% 61% 40% 54% 74% - * - * 59%
2018 80% 77% 75% * 71% 83% - - - * 74%
STAARPerformance Rates at Meets Grade Level or Above (All Grades Tested)All Subjects 2019 50% 45% 39% 13% 38% 43% - * - 45% 35%
2018 48% 45% 43% 22% 43% 45% - * - 24% 40%ELA/Reading 2019 48% 43% 34% 8% 30% 39% - * - 58% 26%
2018 46% 41% 40% 25% 35% 47% - * - 30% 35%Mathematics 2019 52% 49% 52% 25% 57% 49% - * - 50% 51%
2018 50% 49% 50% 25% 54% 48% - * - 30% 48%Writing 2019 38% 31% 28% * 19% 41% - - - 20% 22%
2018 41% 38% 36% * 40% 33% - * - * 33%Science 2019 54% 51% 27% 0% 22% 34% - * - * 22%
2018 51% 46% 38% * 39% 41% - - - * 38%
STAARPerformance Rates at Masters Grade Level (All Grades Tested)All Subjects 2019 24% 19% 19% 6% 18% 21% - * - 18% 16%
2018 22% 18% 18% 0% 19% 17% - * - 4% 15%ELA/Reading 2019 21% 17% 17% 0% 14% 21% - * - 25% 12%
2018 19% 16% 17% 0% 17% 19% - * - 0% 14%Mathematics 2019 26% 23% 28% 17% 31% 26% - * - 25% 25%
2018 24% 21% 22% 0% 25% 20% - * - 10% 21%Writing 2019 14% 10% 9% * 5% 16% - - - 0% 7%
2018 13% 8% 7% * 8% 5% - * - * 5%Science 2019 25% 20% 7% 0% 2% 13% - * - * 4%
2018 23% 18% 16% * 18% 15% - - - * 13%
AcademicGrowth Score (All Grades Tested)Both Subjects 2019 69 66 77 75 79 74 - * - 89 79
2018 69 69 79 79 81 77 - * - 85 77ELA/Reading 2019 68 66 73 63 78 68 - * - 83 76
2018 69 68 75 71 78 73 - * - 70 73Mathematics 2019 70 66 81 88 79 80 - * - 94 81
2018 70 69 83 86 84 80 - * - 100 82
? Indicates that the data for this item were statistically improbable or were reported outside a reasonable range. - Indicates zero observations reported for this group. * Indicates results are masked due to small numbers to protect student confidentiality.n/a Indicates data reporting is not applicable for this group.
Page 2 of 4TEA | Governance and Accountability | Performance ReportingDecember 2019
18-19 AAR Page 611
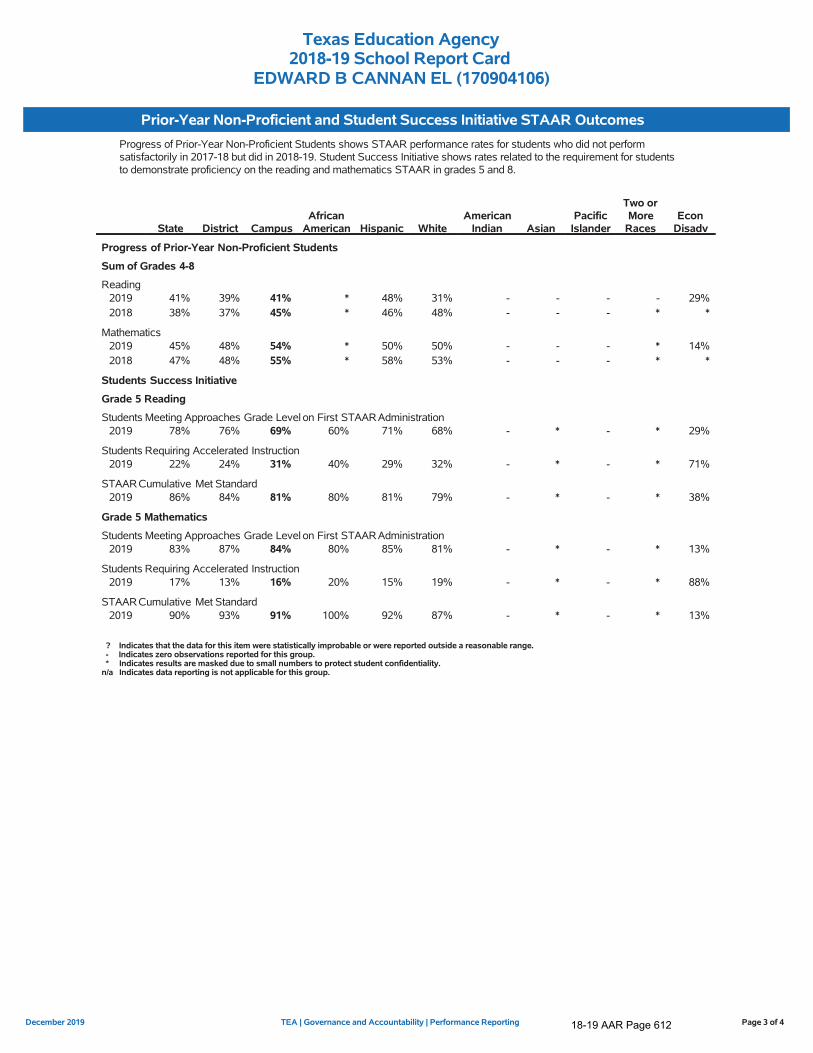
Texas Education Agency2018-19 School Report Card
EDWARD B CANNAN EL (170904106)
Prior-Year Non-Proficient and Student Success Initiative STAAR OutcomesProgress of Prior-Year Non-Proficient Students shows STAAR performance rates for students who did not performsatisfactorily in 2017-18 but did in 2018-19. Student Success Initiative shows rates related to the requirement for studentsto demonstrate proficiency on the reading and mathematics STAAR in grades 5 and 8.
State District CampusAfrican
American Hispanic WhiteAmerican
Indian AsianPacific
Islander
Two orMore
RacesEcon
Disadv
Progress of Prior-Year Non-Proficient Students
Sum of Grades 4-8
Reading2019 41% 39% 41% * 48% 31% - - - - 29%2018 38% 37% 45% * 46% 48% - - - * *
Mathematics2019 45% 48% 54% * 50% 50% - - - * 14%2018 47% 48% 55% * 58% 53% - - - * *
Students Success Initiative
Grade 5 Reading
Students Meeting Approaches Grade Level on First STAARAdministration2019 78% 76% 69% 60% 71% 68% - * - * 29%
Students Requiring Accelerated Instruction2019 22% 24% 31% 40% 29% 32% - * - * 71%
STAARCumulative Met Standard2019 86% 84% 81% 80% 81% 79% - * - * 38%
Grade 5 Mathematics
Students Meeting Approaches Grade Level on First STAARAdministration2019 83% 87% 84% 80% 85% 81% - * - * 13%
Students Requiring Accelerated Instruction2019 17% 13% 16% 20% 15% 19% - * - * 88%
STAARCumulative Met Standard2019 90% 93% 91% 100% 92% 87% - * - * 13%
? Indicates that the data for this item were statistically improbable or were reported outside a reasonable range. - Indicates zero observations reported for this group. * Indicates results are masked due to small numbers to protect student confidentiality.n/a Indicates data reporting is not applicable for this group.
Page 3 of 4TEA | Governance and Accountability | Performance ReportingDecember 2019
18-19 AAR Page 612
Texas Education Agency2018-19 School Report Card
EDWARD B CANNAN EL (170904106)
This page is intentionally blank.
Page 4 of 4TEA | Governance and Accountability | Performance ReportingDecember 2019
18-19 AAR Page 613

Texas Education Agency2018-19 School Report Card
W LLOYD MEADOR EL (170904107)
Accountability Rating
W LLOYD MEADOR EL earned a B (80-89) forrecognized performance by serving many students welland encouraging high academic achievement and/orappropriate academic growth for most students.
State accountability ratings are based on three domains:Student Achievement, School Progress, and Closing the Gaps. The graphbelow provides summary results for W LLOYD MEADOR EL. Scores arescaled from 0 to 100 to align with letter grades.
81 / B
78 / C
82 / B
80 / BClosing the Gaps
School Progress
Student Achievement
Overall
.
School Information
District Name: WILLIS ISDCampus Type: Elementary
Total Students: 729Grade Span: KG - 05
For more information about this campus, see https://TXSchools.govor the TexasAcademic Performance Report athttps://rptsvr1.tea.texas.gov/perfreport/tapr/2019/index.html.
Distinction Designations
Campuses that earn a rating of A-D are eligible for as many as sevendistinction designations, or awards for outstanding performance.
ELA/Reading Mathematics
Science Comparative Academic Growth
Comparative Closing the Gaps Postsecondary Readiness
School and Student InformationThis section provides demographic information about W LLOYD MEADOR EL, including attendance rates; enrollment percentages for various studentgroups; student mobility rates; and class size averages at the campus, district, and state level, where applicable.
Campus District StateAttendance Rate (2017-18) 96.2% 95.0% 95.4%
Enrollment by Race/EthnicityAfrican American 4.3% 6.9% 12.6%Hispanic 38.4% 37.0% 52.6%White 55.3% 51.9% 27.4%American Indian 0.0% 0.4% 0.4%Asian 0.0% 0.6% 4.5%Pacific Islander 0.1% 0.1% 0.2%Two or More Races 1.9% 3.1% 2.4%
Enrollment by Student GroupEconomically Disadvantaged 61.7% 60.1% 60.6%English Learners 17.1% 14.4% 19.5%Special Education 8.8% 8.4% 9.6%
Mobility Rate (2017-18) 14.0% 19.0% 15.4%
Campus District State
Class Size Averages by Grade or Subject
ElementaryKindergarten 20.3 20.9 18.9Grade 1 20.7 19.8 18.8Grade 2 16.1 19.1 18.7Grade 3 20.2 20.1 18.9Grade 4 23.5 20.0 19.2Grade 5 21.3 23.0 21.2
School Financial Information (2017-18)Various financial indicators based on actual data from the prior year are reported for the campus, district, and state. For more information, seehttp://tea.texas.gov/financialstandardreports/.
Campus District StateInstructional Staff Percent n/a 60.4% 64.5%Instructional Expenditure Ratio n/a 62.7% 62.7%
Campus District State
Expenditures per StudentTotal Operating Expenditures $7,311 $9,078 $9,844Instruction $5,491 $5,193 $5,492Instructional Leadership $24 $29 $155School Leadership $499 $550 $576
Page 1 of 4TEA | Governance and Accountability | Performance ReportingDecember 2019
18-19 AAR Page 614

Texas Education Agency2018-19 School Report Card
W LLOYD MEADOR EL (170904107)
STAAR OutcomesThis section provides STAAR performance and Academic Growth outcomes. Academic Growth measures whether studentsare maintaining performance or improving from year to year.
State District CampusAfrican
American Hispanic WhiteAmerican
Indian AsianPacific
Islander
Two orMoreRaces
EconDisadv
STAARPerformance Rates at Approaches Grade Level or Above (All Grades Tested)All Subjects 2019 78% 76% 79% 68% 74% 82% - - - 100% 76%
2018 77% 75% 81% 79% 77% 84% 67% - - 83% 76%ELA/Reading 2019 75% 72% 79% 64% 76% 81% - - - 100% 76%
2018 74% 72% 81% 84% 77% 83% * - - 88% 76%Mathematics 2019 82% 81% 85% 86% 81% 88% - - - 100% 83%
2018 81% 81% 87% 88% 84% 89% * - - 88% 83%Writing 2019 68% 64% 61% 40% 56% 65% - - - 100% 58%
2018 66% 65% 69% 80% 65% 70% - - - * 65%Science 2019 81% 81% 75% * 65% 80% - - - * 73%
2018 80% 77% 75% 53% 66% 88% * - - * 65%
STAARPerformance Rates at Meets Grade Level or Above (All Grades Tested)All Subjects 2019 50% 45% 48% 22% 41% 53% - - - 68% 40%
2018 48% 45% 51% 39% 43% 58% 33% - - 44% 45%ELA/Reading 2019 48% 43% 46% 14% 37% 52% - - - 75% 35%
2018 46% 41% 48% 44% 37% 56% * - - 50% 41%Mathematics 2019 52% 49% 55% 36% 50% 59% - - - 63% 48%
2018 50% 49% 62% 48% 59% 68% * - - 38% 58%Writing 2019 38% 31% 36% 0% 30% 42% - - - 60% 28%
2018 41% 38% 41% 20% 35% 45% - - - * 36%Science 2019 54% 51% 47% * 38% 51% - - - * 40%
2018 51% 46% 37% 20% 20% 53% * - - * 24%
STAARPerformance Rates at Masters Grade Level (All Grades Tested)All Subjects 2019 24% 19% 25% 16% 21% 28% - - - 23% 20%
2018 22% 18% 23% 13% 16% 29% 17% - - 22% 19%ELA/Reading 2019 21% 17% 26% 7% 22% 30% - - - 25% 18%
2018 19% 16% 25% 16% 17% 32% * - - 38% 20%Mathematics 2019 26% 23% 32% 29% 28% 35% - - - 38% 29%
2018 24% 21% 28% 12% 21% 35% * - - 13% 24%Writing 2019 14% 10% 6% 0% 3% 10% - - - 0% 4%
2018 13% 8% 9% 20% 3% 12% - - - * 8%Science 2019 25% 20% 19% * 19% 20% - - - * 15%
2018 23% 18% 13% 7% 7% 20% * - - * 8%
AcademicGrowth Score (All Grades Tested)Both Subjects 2019 69 66 71 64 64 75 - - - 65 69
2018 69 69 74 74 71 75 * - - 67 74ELA/Reading 2019 68 66 70 61 65 75 - - - 40 69
2018 69 68 72 74 69 74 * - - * 74Mathematics 2019 70 66 71 67 63 76 - - - 90 70
2018 70 69 75 74 73 77 * - - * 74
? Indicates that the data for this item were statistically improbable or were reported outside a reasonable range. - Indicates zero observations reported for this group. * Indicates results are masked due to small numbers to protect student confidentiality.n/a Indicates data reporting is not applicable for this group.
Page 2 of 4TEA | Governance and Accountability | Performance ReportingDecember 2019
18-19 AAR Page 615
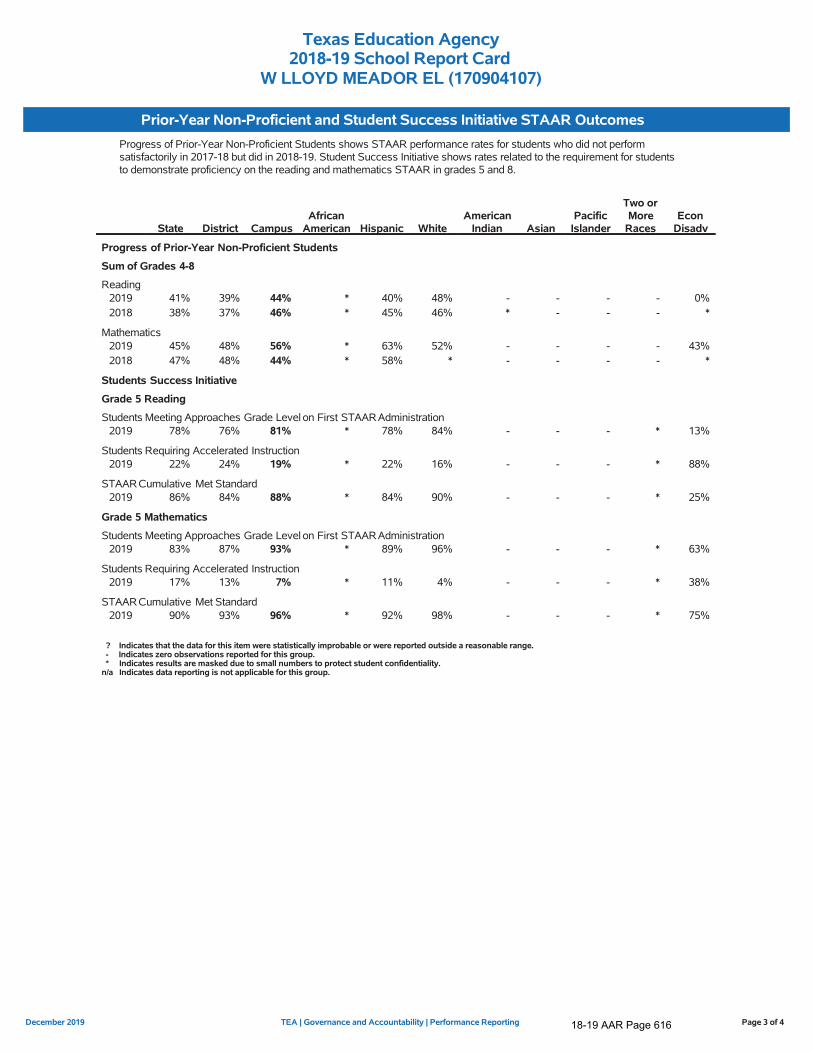
Texas Education Agency2018-19 School Report Card
W LLOYD MEADOR EL (170904107)
Prior-Year Non-Proficient and Student Success Initiative STAAR OutcomesProgress of Prior-Year Non-Proficient Students shows STAAR performance rates for students who did not performsatisfactorily in 2017-18 but did in 2018-19. Student Success Initiative shows rates related to the requirement for studentsto demonstrate proficiency on the reading and mathematics STAAR in grades 5 and 8.
State District CampusAfrican
American Hispanic WhiteAmerican
Indian AsianPacific
Islander
Two orMore
RacesEcon
Disadv
Progress of Prior-Year Non-Proficient Students
Sum of Grades 4-8
Reading2019 41% 39% 44% * 40% 48% - - - - 0%2018 38% 37% 46% * 45% 46% * - - - *
Mathematics2019 45% 48% 56% * 63% 52% - - - - 43%2018 47% 48% 44% * 58% * - - - - *
Students Success Initiative
Grade 5 Reading
Students Meeting Approaches Grade Level on First STAARAdministration2019 78% 76% 81% * 78% 84% - - - * 13%
Students Requiring Accelerated Instruction2019 22% 24% 19% * 22% 16% - - - * 88%
STAARCumulative Met Standard2019 86% 84% 88% * 84% 90% - - - * 25%
Grade 5 Mathematics
Students Meeting Approaches Grade Level on First STAARAdministration2019 83% 87% 93% * 89% 96% - - - * 63%
Students Requiring Accelerated Instruction2019 17% 13% 7% * 11% 4% - - - * 38%
STAARCumulative Met Standard2019 90% 93% 96% * 92% 98% - - - * 75%
? Indicates that the data for this item were statistically improbable or were reported outside a reasonable range. - Indicates zero observations reported for this group. * Indicates results are masked due to small numbers to protect student confidentiality.n/a Indicates data reporting is not applicable for this group.
Page 3 of 4TEA | Governance and Accountability | Performance ReportingDecember 2019
18-19 AAR Page 616

Texas Education Agency2018-19 School Report Card
W LLOYD MEADOR EL (170904107)
This page is intentionally blank.
Page 4 of 4TEA | Governance and Accountability | Performance ReportingDecember 2019
18-19 AAR Page 617

18-19 AAR Page 618

Report of 2016-2017 High School Graduates’ Enrollment and Academic Performance in Texas Public Higher Education in FY 2018
Texas statute requires every school district to include, with their performance report, information received under Texas Education Code §51.403(e). This information, provided to districts from the Texas Higher Education Coordinating Board (THECB), reports on student performance in postsecondary institutions during the first year enrolled after graduation from high school.
Student performance is measured by the Grade Point Average (GPA) earned by 2016-2017 high school graduates who attended public four-year and two-year higher education in FY 2018. The data is presented alphabetically for each county, school district and high school. The bookmarks can be used to select the first letter of a county. Then the user can scroll down to the desired county, school district and high school.
For each student, the grade points and college-level semester credit hours earned by a student in fall 2017, spring 2018, and summer 2018 are added together and averaged to determine the GPA. These GPAs are accumulated in a range of five categories from < 2.0 to > 3.5. If a GPA could not be calculated for some reason, that student is placed in the “Unknown” column. GPA data is only available for students attending public higher education institutions in Texas. If a high school has fewer than five students attending four-year or two-year public higher education institutions, the number of students is shown but no GPA breakout is given. If a student attended both a four-year and a two-year institution in FY 2018, the student’s GPA is shown in the type of institution where the most semester credit hours were earned.
The number of students located at Texas independent institutions is presented. Also shown are "not trackable" graduates, those with non-standard ID numbers that cannot be used to match student identifiers at Texas higher education institutions. "Not found" graduates have standard ID numbers but were not located in FY 2018 at Texas higher education institutions. They might have enrolled in higher education outside of Texas.
No data is given for high schools with 25 or fewer graduates.
Because the statute calls for data on the first year enrolled after graduation, the level of the institution attended by students in this report may not match that given in THECB’s high school to college report at http://www.txhighereddata.org/Interactive/HSCollLink. That report shows where students attended in the fall semester after their high school graduation year. This report attributes students to the level of institution where they earned the most semester credit hours during the whole academic year, not just the fall semester.
Please note: In May 2012 the 2006-2007, 2007-2008, and 2008-2009 versions of the Report of High School Graduates’ Enrollment and Academic Performance in Texas Public Higher Education were updated to reflect a minor correction in how the GPA data are distributed across ranges.
18-19 AAR Page 619

Texas High School Graduates from FY2017
Enrolled in Texas Public or Independent Higher Education in FY 2018
GPA for 1st Year in Public Higher Education in Texas
Total 2.0- 2.5- 3.0-
County District Graduates <2.0 2.49 2.99 3.49 >3.5 Unk
WILLIS ISD
170904002 WILLIS H S
Four-Year Public University 70 16 9 14 16 15 0
Two-Year Public Colleges 128 45 18 17 23 22 3
Independent Colleges & Universities 8
Not Trackable 12
Not Found 207
Total High School Graduates 425
Source: Texas Higher Education Coordinating Board and Texas Education Agency
"Not found" graduates have standard ID numbers that were not found in the specified year at Texas higher education institutions.
"Not trackable" graduates have non-standard ID numbers that will not find a match at Texas higher education institutions.
Includes high schools with more than 25 graduates. If enrolllment in public higher education less than 5, the GPA data is omitted.
18-19 AAR Page 620

Cannan ES Hardy ES Meador ES Parmley ES Turner ES Brabham MS Lucas MS Willis HS
# # # # # # # #
11 Used, exhibited, possessed firearm 0 0 0 0 0 0 0 0
12 Used, exhibited possessed illegal knife 0 0 0 0 0 0 0 0
13 Used, exhibited, possessed illegal club 0 0 0 0 0 0 0 0
14 Used, exhibited, possessed prohibited weapon 0 0 0 0 0 0 0 0
16 Arson 0 0 0 0 0 0 0 0
17 Murder, capital murder, criminal attempt to commit murder/capital murder 0 0 0 0 0 0 0 0
18 Indecency with a child 0 0 0 0 0 0 0 0
19 Aggravated kidnapping 0 0 0 0 0 0 0 0
29 Aggravated assault against school district employee/volunteer 0 0 0 0 0 0 0 0
30 Aggravated assault against non- employee/volunteer 0 0 0 0 0 0 0 0
31 Sexual assault/aggravated sexual assault against school district employee/volunteer 0 0 0 0 0 0 0 0
32 Sexual assault/aggravated sexual assault against non-employee/volunteer 0 0 0 0 0 0 0 0
36 Felony controlled substance violation 0 0 0 0 0 5 0 0
37 Felony alcohol violation 0 0 0 0 0 0 0 0
46 Aggravated robbery 0 0 0 0 0 0 0 0
47 Manslaughter 0 0 0 0 0 0 0 0
48 Criminally negligent homicide 0 0 0 0 0 0 0 0
0 0 0 0 0 5 0 0
715 668 800 722 832 977 886 2,321
0.00% 0.00% 0.00% 0.00% 0.00% 0.51% 0.00% 0.00%For information concerning school violence prevention and violence intervention policies that the district is using to protect students, please refer to the District's Student Code of Conduct and
School Board Policies (available at www.willisisd.org)
WISD Report on Violent or Criminal IncidentsStudent Disciplinary Action Incident Counts by Reason Code
2018-19 School Year
ReasonCode
Description
Total Incidents (TI)
Cumulative Student Enrollment (CSE)
Incident Rate (TI/CSE x 100)
18-19 AAR Page 621
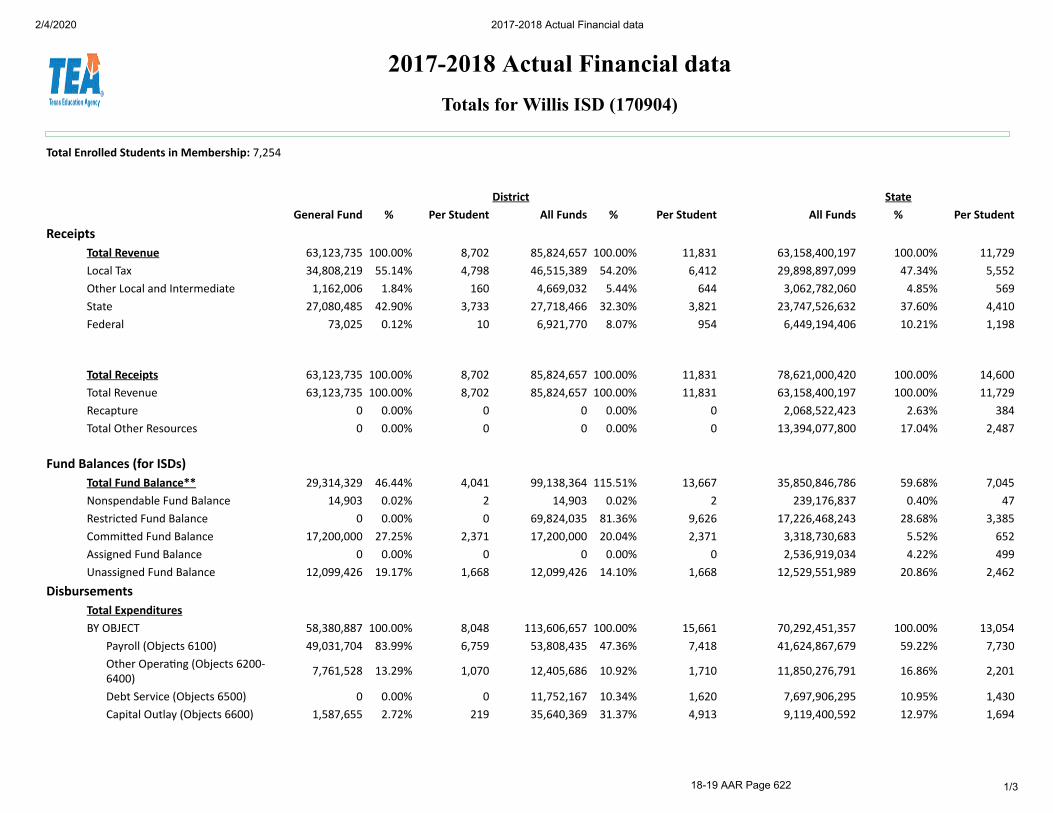
2/4/2020 2017-2018 Actual Financial data
1/3
2017-2018 Actual Financial dataTotals for Willis ISD (170904)
Total Enrolled Students in Membership: 7,254
District StateGeneral Fund % Per Student All Funds % Per Student All Funds % Per Student
ReceiptsTotal Revenue 63,123,735 100.00% 8,702 85,824,657 100.00% 11,831 63,158,400,197 100.00% 11,729Local Tax 34,808,219 55.14% 4,798 46,515,389 54.20% 6,412 29,898,897,099 47.34% 5,552Other Local and Intermediate 1,162,006 1.84% 160 4,669,032 5.44% 644 3,062,782,060 4.85% 569State 27,080,485 42.90% 3,733 27,718,466 32.30% 3,821 23,747,526,632 37.60% 4,410Federal 73,025 0.12% 10 6,921,770 8.07% 954 6,449,194,406 10.21% 1,198
Total Receipts 63,123,735 100.00% 8,702 85,824,657 100.00% 11,831 78,621,000,420 100.00% 14,600Total Revenue 63,123,735 100.00% 8,702 85,824,657 100.00% 11,831 63,158,400,197 100.00% 11,729Recapture 0 0.00% 0 0 0.00% 0 2,068,522,423 2.63% 384Total Other Resources 0 0.00% 0 0 0.00% 0 13,394,077,800 17.04% 2,487
Fund Balances (for ISDs)Total Fund Balance** 29,314,329 46.44% 4,041 99,138,364 115.51% 13,667 35,850,846,786 59.68% 7,045Nonspendable Fund Balance 14,903 0.02% 2 14,903 0.02% 2 239,176,837 0.40% 47Restricted Fund Balance 0 0.00% 0 69,824,035 81.36% 9,626 17,226,468,243 28.68% 3,385Commi�ed Fund Balance 17,200,000 27.25% 2,371 17,200,000 20.04% 2,371 3,318,730,683 5.52% 652Assigned Fund Balance 0 0.00% 0 0 0.00% 0 2,536,919,034 4.22% 499Unassigned Fund Balance 12,099,426 19.17% 1,668 12,099,426 14.10% 1,668 12,529,551,989 20.86% 2,462
DisbursementsTotal ExpendituresBY OBJECT 58,380,887 100.00% 8,048 113,606,657 100.00% 15,661 70,292,451,357 100.00% 13,054
Payroll (Objects 6100) 49,031,704 83.99% 6,759 53,808,435 47.36% 7,418 41,624,867,679 59.22% 7,730Other Opera�ng (Objects 6200-6400) 7,761,528 13.29% 1,070 12,405,686 10.92% 1,710 11,850,276,791 16.86% 2,201
Debt Service (Objects 6500) 0 0.00% 0 11,752,167 10.34% 1,620 7,697,906,295 10.95% 1,430Capital Outlay (Objects 6600) 1,587,655 2.72% 219 35,640,369 31.37% 4,913 9,119,400,592 12.97% 1,694
18-19 AAR Page 622
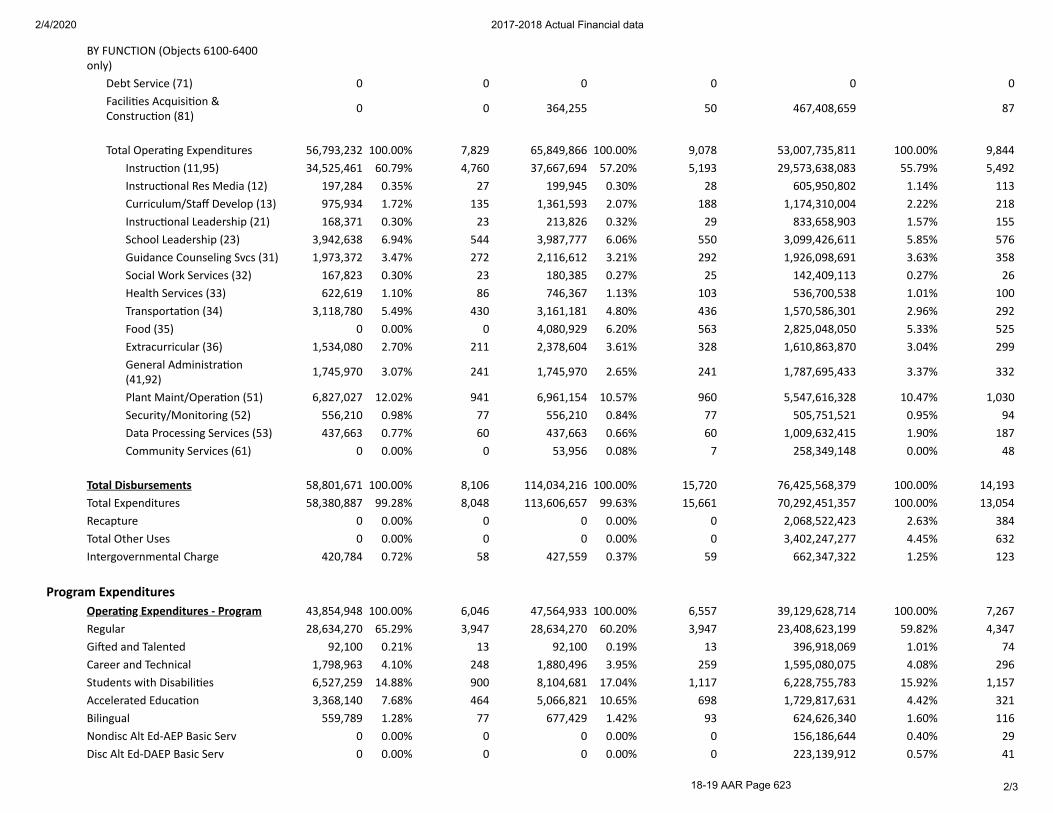
2/4/2020 2017-2018 Actual Financial data
2/3
BY FUNCTION (Objects 6100-6400only)
Debt Service (71) 0 0 0 0 0 0Facili�es Acquisi�on &Construc�on (81) 0 0 364,255 50 467,408,659 87
Total Opera�ng Expenditures 56,793,232 100.00% 7,829 65,849,866 100.00% 9,078 53,007,735,811 100.00% 9,844Instruc�on (11,95) 34,525,461 60.79% 4,760 37,667,694 57.20% 5,193 29,573,638,083 55.79% 5,492Instruc�onal Res Media (12) 197,284 0.35% 27 199,945 0.30% 28 605,950,802 1.14% 113Curriculum/Staff Develop (13) 975,934 1.72% 135 1,361,593 2.07% 188 1,174,310,004 2.22% 218Instruc�onal Leadership (21) 168,371 0.30% 23 213,826 0.32% 29 833,658,903 1.57% 155School Leadership (23) 3,942,638 6.94% 544 3,987,777 6.06% 550 3,099,426,611 5.85% 576Guidance Counseling Svcs (31) 1,973,372 3.47% 272 2,116,612 3.21% 292 1,926,098,691 3.63% 358Social Work Services (32) 167,823 0.30% 23 180,385 0.27% 25 142,409,113 0.27% 26Health Services (33) 622,619 1.10% 86 746,367 1.13% 103 536,700,538 1.01% 100Transporta�on (34) 3,118,780 5.49% 430 3,161,181 4.80% 436 1,570,586,301 2.96% 292Food (35) 0 0.00% 0 4,080,929 6.20% 563 2,825,048,050 5.33% 525Extracurricular (36) 1,534,080 2.70% 211 2,378,604 3.61% 328 1,610,863,870 3.04% 299General Administra�on(41,92) 1,745,970 3.07% 241 1,745,970 2.65% 241 1,787,695,433 3.37% 332
Plant Maint/Opera�on (51) 6,827,027 12.02% 941 6,961,154 10.57% 960 5,547,616,328 10.47% 1,030Security/Monitoring (52) 556,210 0.98% 77 556,210 0.84% 77 505,751,521 0.95% 94Data Processing Services (53) 437,663 0.77% 60 437,663 0.66% 60 1,009,632,415 1.90% 187Community Services (61) 0 0.00% 0 53,956 0.08% 7 258,349,148 0.00% 48
Total Disbursements 58,801,671 100.00% 8,106 114,034,216 100.00% 15,720 76,425,568,379 100.00% 14,193Total Expenditures 58,380,887 99.28% 8,048 113,606,657 99.63% 15,661 70,292,451,357 100.00% 13,054Recapture 0 0.00% 0 0 0.00% 0 2,068,522,423 2.63% 384Total Other Uses 0 0.00% 0 0 0.00% 0 3,402,247,277 4.45% 632Intergovernmental Charge 420,784 0.72% 58 427,559 0.37% 59 662,347,322 1.25% 123
Program ExpendituresOpera�ng Expenditures - Program 43,854,948 100.00% 6,046 47,564,933 100.00% 6,557 39,129,628,714 100.00% 7,267Regular 28,634,270 65.29% 3,947 28,634,270 60.20% 3,947 23,408,623,199 59.82% 4,347Gi�ed and Talented 92,100 0.21% 13 92,100 0.19% 13 396,918,069 1.01% 74Career and Technical 1,798,963 4.10% 248 1,880,496 3.95% 259 1,595,080,075 4.08% 296Students with Disabili�es 6,527,259 14.88% 900 8,104,681 17.04% 1,117 6,228,755,783 15.92% 1,157Accelerated Educa�on 3,368,140 7.68% 464 5,066,821 10.65% 698 1,729,817,631 4.42% 321Bilingual 559,789 1.28% 77 677,429 1.42% 93 624,626,340 1.60% 116Nondisc Alt Ed-AEP Basic Serv 0 0.00% 0 0 0.00% 0 156,186,644 0.40% 29Disc Alt Ed-DAEP Basic Serv 0 0.00% 0 0 0.00% 0 223,139,912 0.57% 41
18-19 AAR Page 623
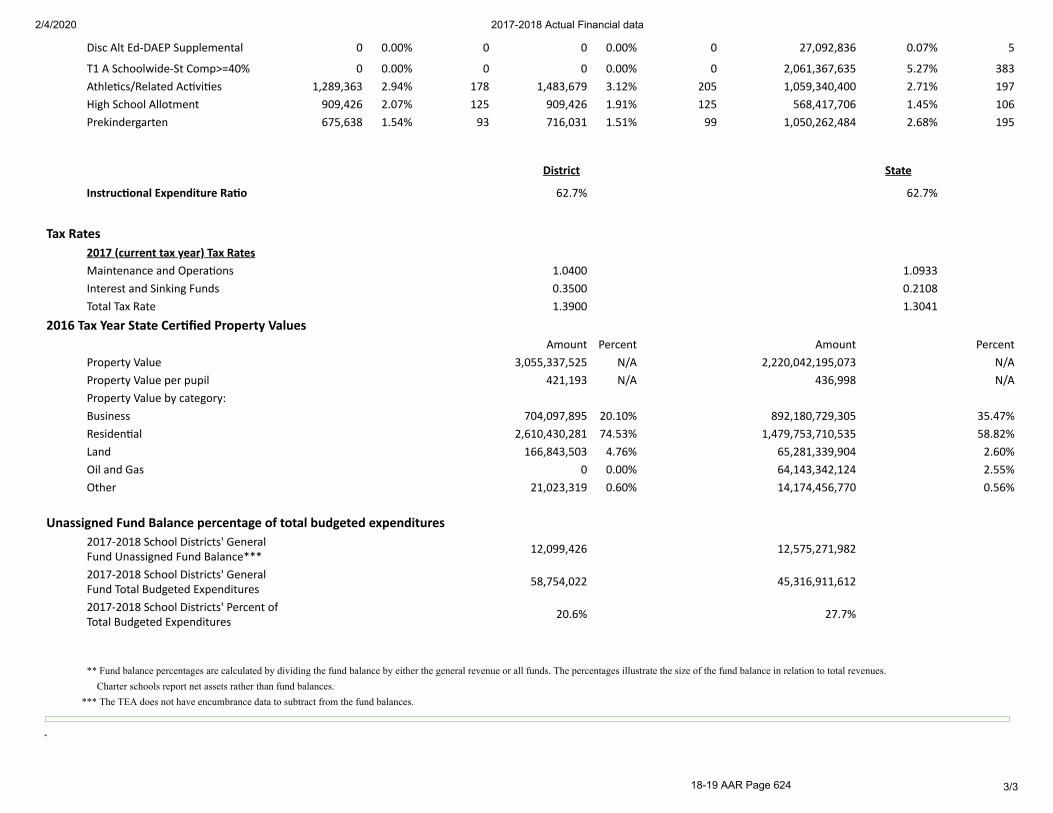
2/4/2020 2017-2018 Actual Financial data
3/3
Disc Alt Ed-DAEP Supplemental 0 0.00% 0 0 0.00% 0 27,092,836 0.07% 5
T1 A Schoolwide-St Comp>=40% 0 0.00% 0 0 0.00% 0 2,061,367,635 5.27% 383Athle�cs/Related Ac�vi�es 1,289,363 2.94% 178 1,483,679 3.12% 205 1,059,340,400 2.71% 197High School Allotment 909,426 2.07% 125 909,426 1.91% 125 568,417,706 1.45% 106Prekindergarten 675,638 1.54% 93 716,031 1.51% 99 1,050,262,484 2.68% 195
District State
Instruc�onal Expenditure Ra�o 62.7% 62.7%
Tax Rates2017 (current tax year) Tax RatesMaintenance and Opera�ons 1.0400 1.0933Interest and Sinking Funds 0.3500 0.2108Total Tax Rate 1.3900 1.3041
2016 Tax Year State Cer�fied Property ValuesAmount Percent Amount Percent
Property Value 3,055,337,525 N/A 2,220,042,195,073 N/AProperty Value per pupil 421,193 N/A 436,998 N/AProperty Value by category:Business 704,097,895 20.10% 892,180,729,305 35.47%Residen�al 2,610,430,281 74.53% 1,479,753,710,535 58.82%Land 166,843,503 4.76% 65,281,339,904 2.60%Oil and Gas 0 0.00% 64,143,342,124 2.55%Other 21,023,319 0.60% 14,174,456,770 0.56%
Unassigned Fund Balance percentage of total budgeted expenditures2017-2018 School Districts' GeneralFund Unassigned Fund Balance*** 12,099,426 12,575,271,982
2017-2018 School Districts' GeneralFund Total Budgeted Expenditures 58,754,022 45,316,911,612
2017-2018 School Districts' Percent ofTotal Budgeted Expenditures 20.6% 27.7%
** Fund balance percentages are calculated by dividing the fund balance by either the general revenue or all funds. The percentages illustrate the size of the fund balance in relation to total revenues. Charter schools report net assets rather than fund balances. *** The TEA does not have encumbrance data to subtract from the fund balances.
18-19 AAR Page 624
Texas Education Agency | Governance and Accountability | Performance Reporting 1 of 48
Comprehensive Glossary2018–19 Texas Academic Performance Report
Cover Page 2019 Accountability Rating: The overall rating earned by the district or campus for 2019.
2019 Special Education Determination Status (district TAPR only): This label represents an integrated determination status based on an evaluation of each district’s Results Driven Accountability (RDA) indicators (formerly Performance Based Monitoring Analysis indicators) in the special education program area; the State Performance Plan (SPP) compliance indicators 9, 10, 11, 12, and 13; data integrity; uncorrected noncompliance; and audit findings. Districts receive one of four special education determination statuses: Meets Requirements Needs Assistance Needs Intervention Needs Substantial Intervention For more information, see the special education intervention guidance and resources documents at the following link: https://tea.texas.gov/si/SPEDmonitoring/
Additional resources include the RDA Manual and the State Performance Plan at the following links: https://tea.texas.gov/academics/special-student-populations/review-and-support/results-driven-accountability-rda https://tea.texas.gov/Reports_and_Data/Data_Submission/State_Performance_Plan/State_Perform ance_Plan_and_Annual_Performance_Report_and_Requirements/
2019 Armed Services Vocational Aptitude Battery (ASVAB) Test (Career Exploration) (district TAPR only): Senate Bill 1843 requires that each school year, each school district and open-enrollment charter school provide students in grades 10–12 the opportunity to take the ASVAB and consult with a military recruiter. There are two types of ASVAB tests; only the ASVAB Career Exploration Program (CEP) was evaluated.
Not Given: The district completed the reporting requirement but did not offer the ASVAB CEP.
Alternate Test Given: The district completed the reporting requirement and did not offer the ASVAB CEP but did offer an alternate test.
Performance STAAR (State of Texas Assessments of Academic Readiness): A comprehensive testing program for public school students in grades 3–8 or high school courses with end-of-course (EOC) assessments. The STAAR program is designed to measure to what extent a student has learned, understood, and is able to apply the concepts and skills expected at each grade level or after completing each course for which an EOC assessment exists. Each STAAR assessment is linked directly to the Texas Essential Knowledge and Skills (TEKS). The TEKS are the state-mandated content standards that describe what a student should know and be able to do upon completion of a course. For more information on the TEKS, see the Texas Essential Knowledge and Skills website at http://tea.texas.gov/curriculum/teks/.
18-19 AAR Page 625

Comprehensive Glossary 2018–19 Texas Academic Performance Report
Texas Education Agency | Governance and Accountability | Performance Reporting 2 of 48
Other Important Information:
Substitute Assessments. Certain, specific assessments that students may take in place of an EOC assessment. For more information, see the Texas Administrative Code, §101.4002, at http://ritter.tea.state.tx.us/rules/tac/chapter101/ch101dd.html.
Special Education. STAAR (with and without accommodations) and STAAR Alternate 2 results are included.
Spanish STAAR. All STAAR assessments in grades 3, 4, and 5 are available in both English and Spanish. The TAPR performance includes performance on the Spanish STAAR.
Rounding of STAAR results. STAAR performance shown on the TAPR is rounded to whole numbers. For example, 49.877% is rounded to 50%; 49.4999% is rounded to 49%; and 59.5% is rounded to 60%.
Masking. STAAR performance rates are masked when necessary to comply with FERPA. For more information, see the Explanation of Masking at https://rptsvr1.tea.texas.gov/perfreport/account/2019/masking.html. STAAR Performance The STAAR Performance section of the TAPR displays performance results by grade, subject and performance level for students in the accountability subset, which are students enrolled in the same district/campus on both the snapshot date (TSDS PEIMS October snapshot) and the testing date. The STAAR Performance–All Students section of the TAPR displays STAAR performance by grade, subject, and performance level and includes all students tested, regardless of whether they were in the accountability subset.
STAAR:
Grade 3 – reading and mathematics
Grade 4 – reading, mathematics, and writing
Grade 5 – reading (first and second administration cumulative), mathematics (first and second administration cumulative), and science
Grade 6 – reading and mathematics
Grade 7 – reading, mathematics, and writing
Grade 8 – reading (first and second administration cumulative), mathematics (first and second administration cumulative), science, and social studies
End-of-Course (EOC):
English I
English II
Algebra I
Biology
U.S. History
STAAR Percentage at Approaches Grade Level or Above. The percentage of assessments that met or exceeded the Approaches Grade Level standard.
18-19 AAR Page 626
Comprehensive Glossary 2018–19 Texas Academic Performance Report
Texas Education Agency | Governance and Accountability | Performance Reporting 3 of 48
STAAR Percentage at Meets Grade Level or Above. The percentage of assessments that met or exceeded the Meets Grade Level standard.
STAAR Percentage at Masters Grade Level. The percentage of assessments that met the Masters Grade Level standard.
STAAR Performance Rate by Enrolled Grade at Meets Grade Level or Above on Both Reading and Mathematics. The percentage of students who took both the reading and mathematics STAAR and met or exceeded the Meets Grade Level standard on both assessments (excluding EOC assessments).
STAAR Performance Rate by Enrolled Grade at Meets Grade Level or Above on Both Reading and Mathematics Including EOC. The percentage of students who took both the reading and mathematics STAAR or EOC and met or exceeded the Meets Grade Level standard on both assessments.
STAAR Performance Rate by Enrolled Grade at Meets Grade Level or Above on Reading Including EOC. The percentage of students who took the reading STAAR or the English I or II EOC and met or exceeded the Meets Grade Level standard.
STAAR Performance Rate by Enrolled Grade at Meets Grade Level or Above on Mathematics Including EOC. The percentage of students who took the mathematics STAAR or the Algebra I EOC and met or exceeded the Meets Grade Level standard.
Progress (Academic Growth and STAAR Progress Measure) School Progress Domain—Academic Growth Score. Growth score awarded in School Progress, Part A:
Academic Growth for improving performance year over year as measured by STAAR progress measures and performance levels on STAAR.
STAAR Progress Measure Percent at Expected or Accelerated Growth. The percentage of assessments that met or exceeded the STAAR progress measure expectations. See Chapter 3 of the 2019 Accountability Manual for more information.
STAAR Progress Measure Percent at Accelerated Growth. The percentage of assessments that exceeded the STAAR progress measure expectations. See Chapter 3 of the 2019 Accountability Manual for more information.
Percent of Students Maintaining or Improving Compared to Prior Year Performance Level. The percentage of students that maintained or improved their STAAR performance levels this year in comparison with last year. Students are included in the performance level achieved in the prior year.
Prior Year and SSI Progress of Prior-Year Non-Proficient Students: The percentage of students in grades 4–8 who did not reach the satisfactory standard on STAAR (including STAAR Alternate 2) in the prior year but passed the corresponding assessment in the current year. For 2018–19, rates for ELA/reading and mathematics are calculated as follows:
number of matched grades 4–8 students who did not reach the satisfactory standard in 2018 but passed in 2019
number of matched grades 4–8 students who did not reach the satisfactory standard in 2018
18-19 AAR Page 627

Comprehensive Glossary 2018–19 Texas Academic Performance Report
Texas Education Agency | Governance and Accountability | Performance Reporting 4 of 48
For 2018–19, students in grades 4–8 included in these measures are those who
• took the spring 2018–19 STAAR (with or without accommodations) or STAAR Alternate 2 in ELA/reading and/or mathematics. This indicator does not include grade 3 assessment takers because that is the first STAAR assessment;
• are part of the 2018–19 accountability subset; • can be matched to the spring 2017–18 STAAR administration—anywhere in the
state—to find their prior year score for ELA/reading and/or mathematics; and • did not reach the satisfactory standard on the 2017–18 STAAR administration of
ELA/reading and/or mathematics.
Student Success Initiative (SSI): Grade-advancement requirements enacted by the 76th Legislature in 1999 that require students to demonstrate proficiency on the reading and mathematics assessments in grades 5 and 8.
For 2019, the TAPR shows the following for each SSI grade:
(1) Students Meeting Approaches Grade Level Standard on First STAAR Administration: The percentage of students who met the Approaches Grade Level standard during the first administration. It is calculated as follows: number of students who met the Approaches Grade Level standard
in the first administration
number of students who took the assessment in the first administration
(2) Students Requiring Accelerated Instruction: The percentage of students who did not pass the first administration of the STAAR. It is calculated as follows: number of students who did not meet the standard in the first
administration
number of students who took the assessment in the first administration
(3) STAAR Cumulative Met Standard: The cumulative (and unduplicated) percentage of students who took and passed the assessments in the first and second administrations combined. It is calculated as follows:
number of students who passed the assessment in either of the first two administrations
cumulative number of students who took the assessment in either of the first two administrations
18-19 AAR Page 628
Comprehensive Glossary 2018–19 Texas Academic Performance Report
Texas Education Agency | Governance and Accountability | Performance Reporting 5 of 48
(4) STAAR Non-Proficient Students Promoted by a Grade Placement Committee (GPC): The percentage of students who did not reach the satisfactory standard on STAAR but were promoted to the next grade level by a grade placement committee. It is calculated as follows:
number of students who did not pass the assessment in the first, second, or third administrations but were promoted to the next grade level
number of students who did not pass the assessment in the first, second, or third administrations
(5) STAAR Met Standard (Non-Proficient in Previous Year) Promoted and Retained: The percentage of students who met standard this year but did not meet the satisfactory standard on STAAR in the previous year, disaggregated by promoted or retained.
Promoted to Grade 6 or 9: The percentage of students who passed the STAAR in 2019 who were promoted to grade 6 or 9. Using grade 5 reading as an example, the calculation is as follows:
number of students promoted by their GPC who passed grade 6 reading STAAR in 2019
number of students who were promoted by their GPC and took grade 6 reading STAAR in 2019
Retained in Grade 5 or 8: The percentage of students who passed the STAAR in 2019 who were retained in grade 5 or 8. Using grade 5 reading as an example, the calculation is as follows:
number of students retained who passed grade 5 reading STAAR in 2019
number of students retained and took grade 5 reading STAAR in 2019
Bilingual Education/ESL Bilingual Education (BE): Dual-language program that enables English learners to become competent in listening, speaking, reading, and writing in English through the development of literacy and academic skills in both the primary language and English. This category includes the following:
BE-Trans Early Exit. Bilingual program model that serves students of limited English proficiency. The transitional bilingual/early exit model transfers a student to English-only instruction between two and five years after the student enrolls in school.
BE-Trans Late Exit. Bilingual program model that serves students of limited English proficiency. The transitional bilingual/late exit model transfers a student to English-only instruction between six and seven years after the student enrolls in school.
BE-Dual Two-Way. Biliteracy program model designed to develop fluency and literacy in English and another language. The dual language immersion/two-way model integrates students of limited English proficiency with students proficient in English and transfers a student of limited English proficiency to English-only instruction between six and seven years after the student enrolls in school.
18-19 AAR Page 629

Comprehensive Glossary 2018–19 Texas Academic Performance Report
Texas Education Agency | Governance and Accountability | Performance Reporting 6 of 48
BE-Dual One-Way. Biliteracy program model designed to develop fluency and literacy in English. The dual language immersion/one-way model serves only students of limited English proficiency and transfers a student to English-only instruction between six and seven years after the student enrolls in school.
English as a Second Language (ESL): An intensive program designed to develop proficiency in listening, speaking, reading, and writing in the English language. This category includes the following:
ESL Content. An English program that serves students of limited English proficiency. The English as a second language/content-based model provides a full-time teacher that gives supplementary instruction for all content areas.
ESL Pull-Out. An English program that serves students of limited English proficiency. The English as a second language/pull-out model provides a part-time teacher to give instruction in English language arts only. A student in an ESL Pull-Out program remains in mainstream instructional arrangements for all other content areas.
Limited English Proficient (LEP): The count and percentage of students whose primary language is other than English and who are in the process of acquiring English. The terms “English language learner,” “English learner,” and “Limited English Proficient” (LEP) are used interchangeably. This category includes:
LEP No Services. A student identified as limited English proficient who does not receive any bilingual education or English as a second language services.
LEP with Services. A student identified as limited English proficient who receives bilingual education services or English as a second language services.
School Progress Domain—Academic Growth Score: Points earned for results that either maintained performance or earned Expected/Accelerated on the STAAR progress measure. Only includes assessments eligible for a STAAR progress measure.
STAAR Progress Measure Percent at Expected or Accelerated Growth: The percentage of assessments that met or exceeded the STAAR progress measure expectations. See Chapter 3 of the 2019 Accountability Manual for more information.
Participation STAAR Participation The percentage of students who were administered a STAAR assessment, STAAR Alternate 2, Texas English Language Proficiency Assessment System (TELPAS), and/or TELPAS Alternate. The details on the participation categories are as follows:
Assessment Participant: 1) number of answer documents with a score code of S, 2) number of STAAR Alternate 2 testers with a score code of N, 3) number of substitute assessments, 4) number of A or O reading answer documents with a scored TELPAS or TELPAS Alternate assessment, and 5) number of A or O mathematics answer documents with a scored TELPAS or TELPAS alternate assessment for year 1–5 asylee/refugees and students with interrupted formal education (SIFEs)
Included in Accountability: scored answer documents used in determining the district or campus accountability rating, including substitute assessments with a score code of O
18-19 AAR Page 630

Comprehensive Glossary 2018–19 Texas Academic Performance Report
Texas Education Agency | Governance and Accountability | Performance Reporting 7 of 48
Not included in Accountability: answer documents counted as participants but not used in determining the district or campus accountability rating
♦ Mobile: answer documents were excluded because the students enrolled in the district or campus after the fall TSDS PEIMS submission dates (October 26, 2018, or October 27, 2017, for summer 2018 EOCs)
♦ Other Exclusions. The following answer documents were excluded from the rating determination:
Answer documents for students who were tested only on the TELPAS/TELPAS Alternate or TELPAS/TELPAS Alternate plus STAAR assessments with score codes of A or O.
Answer documents of students who are either an English learner who has been in school in the U.S. for one year or an unschooled asylee, unschooled refugee, or SIFE student who has been in school in the U.S. for less than six years.
Answer documents of STAAR Alternate 2 testers with a score code of N.
Not Tested: answer documents with score codes A or O
Absent: answer documents with score code A
Other: answer documents with score code O, except for substitute assessments.
The denominator for participation is the sum of these five categories: Included in Accountability, Mobile, Other Exclusions, and Not Tested (Absent and Other). STAAR Participation Rate is rounded to a whole number. For example, 94.49% is rounded to 94%. Small values may show as zero: 0.4% is rounded to 0%, and 0.6% is rounded to 1%. (Data source: STAAR and TELPAS File)
Attendance and Graduation Attendance, Graduation, and Dropout Rates Attendance Rate: The percentage of days that students were present in 2017–18 based on student attendance for the entire school year. Only students in grades 1–12 are included in the calculation. Attendance is calculated as follows:
total number of days that students in grades 1–12 were present in 2017–18
total number of days that students in grades 1–12 were in membership in 2017–18
This indicator was used in awarding distinction designations in 2019. For a detailed explanation of distinction designations, see Chapter 6 of the 2019 Accountability Manual. (Data source: TSDS PEIMS 42400)
Annual Dropout Rate: The percentage of students who drop out of school during a school year. Annual dropout rates are shown for districts and campuses that serve grades 7–8 and/or 9–12. State law prohibits including a student who meets any of the following criteria from campus and district annual dropout rate calculations:
• Is ordered by a court to attend a high school equivalency certificate program but has not earned a high school equivalency certificate
• Was previously reported to the state as a dropout
18-19 AAR Page 631
Comprehensive Glossary 2018–19 Texas Academic Performance Report
Texas Education Agency | Governance and Accountability | Performance Reporting 8 of 48
• Was in attendance but not in membership for purposes of average daily attendance (i.e., students for whom school districts are not receiving state Foundation School Program [FSP] funds)
• Was initially enrolled in a school in the United States in any grade 7 through 12 as an unschooled refugee or asylee as defined by TEC §39.027(a-1)
• Attends a district exclusively as a function of having been detained at a county detention facility and is not otherwise a student of the district in which the facility is located or is being provided services by an open-enrollment charter school exclusively as the result of having been detained at the facility
• Is incarcerated in a state jail or federal penitentiary as an adult or as a person certified to stand trial as an adult
• Is a student in a Texas Juvenile Justice Department facility or residential treatment facility served by a Texas public school district
• Is at least 18 years of age as of September 1 and has satisfied the credit requirements for high school graduation; has not completed his or her individualized education program (IEP); and is enrolled and receiving IEP services
Annual Dropout Rate (Gr 7–8). This includes only grades 7 and 8. It is calculated as follows:
number of dropouts in grades 7 and 8 during the 2017–18 school year
number of students in grades 7 and 8 in attendance at any time during the 2017–18 school year
Annual Dropout Rate (Gr 9–12). This includes grades 9 through 12. It is calculated as follows:
number of dropouts in grades 9–12 during the 2017–18 school year
number of students in grades 9–12 in attendance at any time during the 2017–18 school year
Both annual dropout rates appear on campus, district, region, and state TAPRs. The state and region annual dropout rates that are reported on district and campus TAPRs, however, are calculated without the exclusions required for campus and district calculations.
Note that with all annual dropout rate calculations, a cumulative count of students is used in the denominator. This method for calculating the dropout rate neutralizes the effect of mobility by including in the denominator every student ever reported in attendance at the district or campus throughout the school year, regardless of length of enrollment. For a more complete description of dropout rates and exclusions, see the Secondary School Completion and Dropouts in Texas Public Schools, 2017–18 reports, available on the TEA website at http://tea.texas.gov/acctres/dropcomp_index.html.
For detailed information on data sources, see Appendix H in the 2019 Accountability Manual (Data source: TSDS PEIMS 40203, 40110, 42400, and 42500)
Longitudinal Rates: The status of a group (cohort) of students after four years in high school (4-Year Longitudinal Rate), after five years in high school (5-Year Extended Longitudinal Rate), or after six years in high school (6-Year Extended Longitudinal Rate).
18-19 AAR Page 632

Comprehensive Glossary 2018–19 Texas Academic Performance Report
Texas Education Agency | Governance and Accountability | Performance Reporting 9 of 48
For the 4-Year Longitudinal Rate, the cohort consists of students who first attended ninth grade in 2014–15. They are followed through their expected graduation with the Class of 2018.
For the 5-Year Extended Longitudinal Rate, the cohort consists of students who first attended ninth grade in 2013–14. They are followed for five years and included if they graduated within a year after their expected graduation with the Class of 2017.
For the 6-Year Extended Longitudinal Rate, the cohort consists of students who first attended ninth grade in 2012–13. They are followed for six years and included if they graduated within two years after their expected graduation with the Class of 2016.
Additional Information on Cohorts:
A student transfers into a campus, district, or state cohort when he or she moves into the cohort from another high school in Texas, from another district in Texas, or from out of state.
A student transfers out of a campus or district cohort when he or she moves to another public high school in Texas or moves to another district in Texas. Note that these students are transferred into the cohort of the high school or district to which they moved. There are also students who move out of state or out of the country and students who transfer to private schools or who are home-schooled. These types of transfer students cannot be tracked and are not included in longitudinal rate calculations.
A student does not change cohorts if he or she repeats or skips a grade. A student who begins with the 2014–15 ninth-grade cohort remains with that cohort. A student who started the ninth grade in 2014–15 but takes 5 years to graduate (i.e., graduates in May 2019) is still part of the 2018 cohort; he or she is not switched to the 2019 cohort. This student would be considered a continuing student and counted as part of the Continued HS number for the Class of 2018. This is also true for the five-year and six-year extended longitudinal cohorts.
There are four student outcomes used in computing each longitudinal rate:
4-Year Longitudinal Rate
(1) Graduated: The percentage who received their high school diploma in four years or fewer by August 31, 2018 for the 2018 cohort.
number of students from the cohort who received a high school diploma by
August 31, 2018
number of students in the 2018 cohort*
(2) Received TxCHSE: For the 2018 cohort, the percentage who received a Texas high school equivalency certificate by August 31, 2018. It is calculated as follows:
number of students from the cohort who received a TxCHSE by August 31, 2018
number of students in the 2018 cohort*
18-19 AAR Page 633
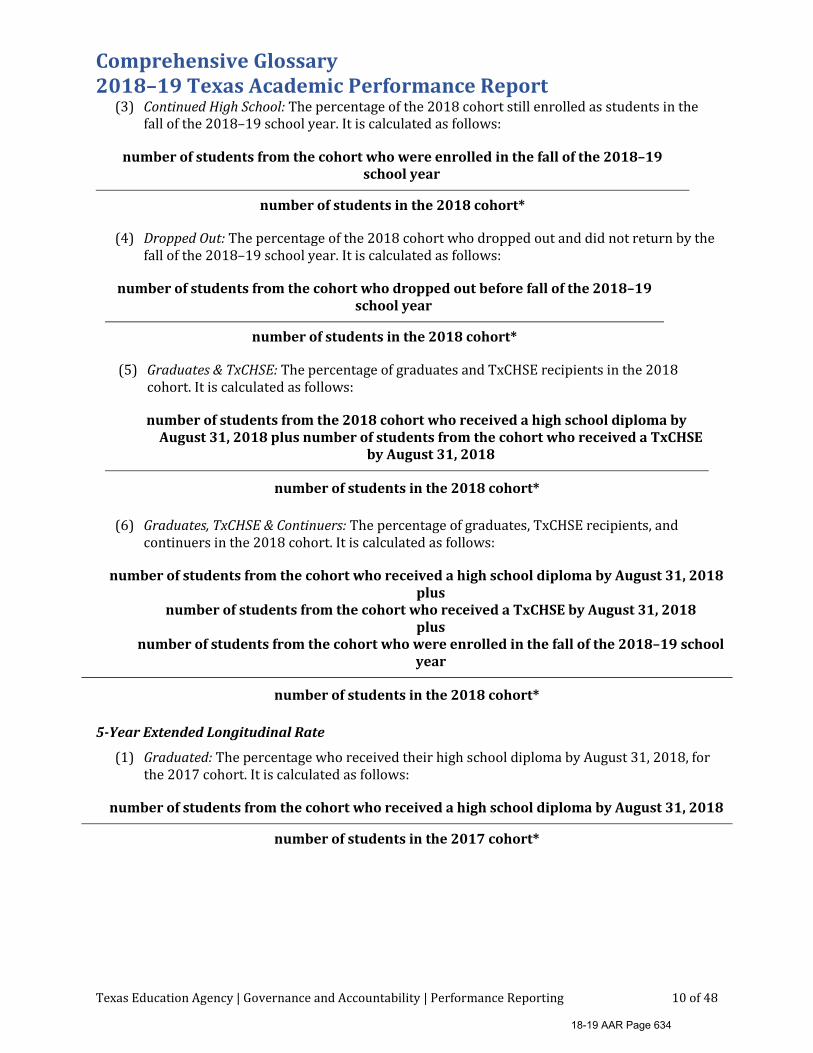
Comprehensive Glossary 2018–19 Texas Academic Performance Report
Texas Education Agency | Governance and Accountability | Performance Reporting 10 of 48
(3) Continued High School: The percentage of the 2018 cohort still enrolled as students in the fall of the 2018–19 school year. It is calculated as follows:
number of students from the cohort who were enrolled in the fall of the 2018–19 school year
number of students in the 2018 cohort*
(4) Dropped Out: The percentage of the 2018 cohort who dropped out and did not return by the fall of the 2018–19 school year. It is calculated as follows:
number of students from the cohort who dropped out before fall of the 2018–19 school year
number of students in the 2018 cohort*
(5) Graduates & TxCHSE: The percentage of graduates and TxCHSE recipients in the 2018 cohort. It is calculated as follows:
number of students from the 2018 cohort who received a high school diploma by August 31, 2018 plus number of students from the cohort who received a TxCHSE
by August 31, 2018
number of students in the 2018 cohort*
(6) Graduates, TxCHSE & Continuers: The percentage of graduates, TxCHSE recipients, and continuers in the 2018 cohort. It is calculated as follows:
number of students from the cohort who received a high school diploma by August 31, 2018 plus
number of students from the cohort who received a TxCHSE by August 31, 2018 plus
number of students from the cohort who were enrolled in the fall of the 2018–19 school year
number of students in the 2018 cohort*
5-Year Extended Longitudinal Rate
(1) Graduated: The percentage who received their high school diploma by August 31, 2018, for the 2017 cohort. It is calculated as follows:
number of students from the cohort who received a high school diploma by August 31, 2018
number of students in the 2017 cohort*
18-19 AAR Page 634

Comprehensive Glossary 2018–19 Texas Academic Performance Report
Texas Education Agency | Governance and Accountability | Performance Reporting 11 of 48
(2) Received TxCHSE: For the 2017 cohort, the percentage who received a TxCHSE certificate by August 31, 2018. It is calculated as follows:
number of students from the cohort who received a TxCHSE by August 31, 2018
number of students in the 2017 cohort*
(3) Continued High School: The percentage of the 2017 cohort still enrolled as students in the fall of the 2018–19 school year. It is calculated as follows:
number of students from the cohort who were enrolled in the fall of the 2018–19 school year
number of students in the 2017 cohort*
(4) Dropped Out: The percentage of the 2017 cohort who dropped out and did not return by the fall of the 2018–19 school year. It is calculated as follows:
number of students from the cohort who dropped out before fall of the 2018–19 school year
number of students in the 2017 cohort*
(5) Graduates & TxCHSE: The percentage of graduates and TxCHSE recipients in the 2017 cohort. It is calculated as follows:
number of students from the cohort who received a high school diploma by August 31, 2018 plus
number of students from the cohort who received a TxCHSE by August 31, 2018
number of students in the 2017 cohort*
(6) Graduates, TxCHSE & Continuers: The percentage of graduates, TxCHSE recipients, and continuers in the 2017 cohort. It is calculated as follows:
number of students from the cohort who received a high school diploma by August 31, 2018 plus
number of students from the cohort who received a TxCHSE by August 31, 2018 plus
number of students from the cohort who were enrolled in the fall of the 2018–19 school year
number of students in the 2017 cohort*
6-year Extended Longitudinal Rate
(1) Graduated: The percentage who received their high school diploma by August 31, 2018, for the 2016 cohort. It is calculated as follows:
18-19 AAR Page 635
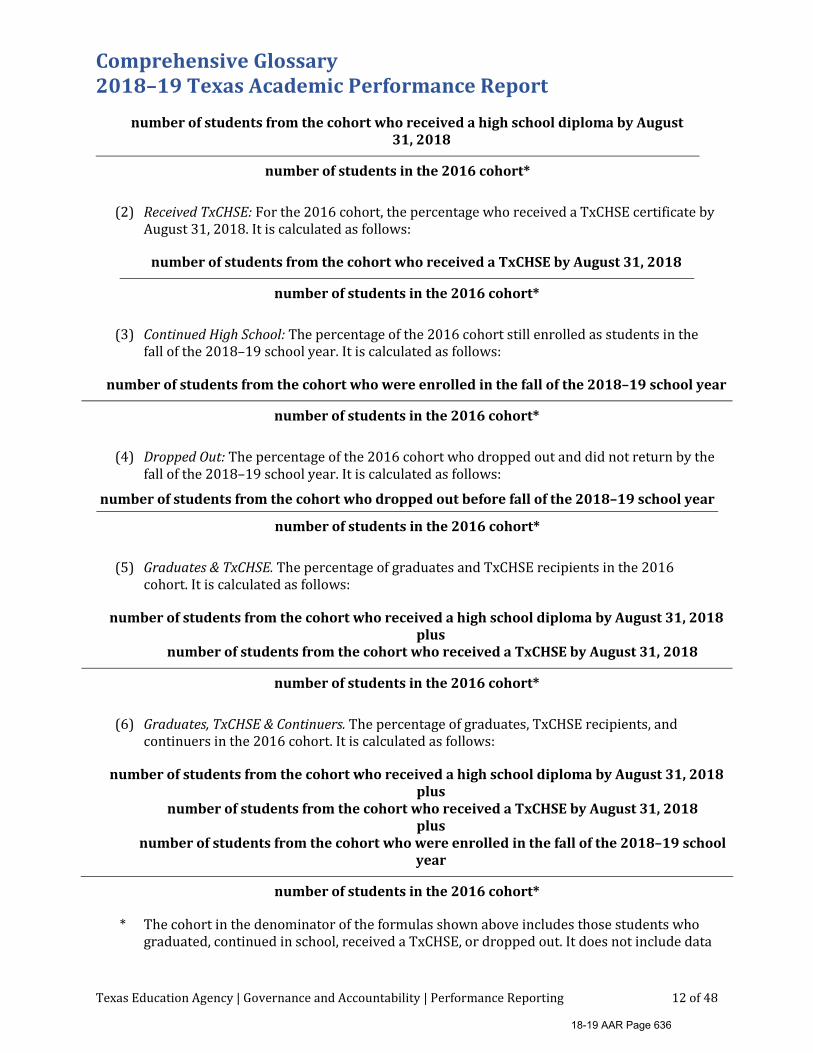
Comprehensive Glossary 2018–19 Texas Academic Performance Report
Texas Education Agency | Governance and Accountability | Performance Reporting 12 of 48
number of students from the cohort who received a high school diploma by August 31, 2018
number of students in the 2016 cohort*
(2) Received TxCHSE: For the 2016 cohort, the percentage who received a TxCHSE certificate by August 31, 2018. It is calculated as follows:
number of students from the cohort who received a TxCHSE by August 31, 2018
number of students in the 2016 cohort*
(3) Continued High School: The percentage of the 2016 cohort still enrolled as students in the fall of the 2018–19 school year. It is calculated as follows:
number of students from the cohort who were enrolled in the fall of the 2018–19 school year
number of students in the 2016 cohort*
(4) Dropped Out: The percentage of the 2016 cohort who dropped out and did not return by the fall of the 2018–19 school year. It is calculated as follows:
number of students from the cohort who dropped out before fall of the 2018–19 school year
number of students in the 2016 cohort*
(5) Graduates & TxCHSE. The percentage of graduates and TxCHSE recipients in the 2016 cohort. It is calculated as follows:
number of students from the cohort who received a high school diploma by August 31, 2018 plus
number of students from the cohort who received a TxCHSE by August 31, 2018
number of students in the 2016 cohort*
(6) Graduates, TxCHSE & Continuers. The percentage of graduates, TxCHSE recipients, and continuers in the 2016 cohort. It is calculated as follows:
number of students from the cohort who received a high school diploma by August 31, 2018 plus
number of students from the cohort who received a TxCHSE by August 31, 2018 plus
number of students from the cohort who were enrolled in the fall of the 2018–19 school year
number of students in the 2016 cohort*
* The cohort in the denominator of the formulas shown above includes those students who graduated, continued in school, received a TxCHSE, or dropped out. It does not include data
18-19 AAR Page 636

Comprehensive Glossary 2018–19 Texas Academic Performance Report
Texas Education Agency | Governance and Accountability | Performance Reporting 13 of 48
errors or leavers with the leaver reason codes 03, 16, 24, 60, 66, 78, 81, 82, 83, 85, 86, 87, 88, 89 or 90. See Annual Dropout Rate for a list of all the exclusions mandated by state statute for districts and campuses.
The graduation, continuation, TxCHSE recipient, and dropout rates sum to 100% (some totals may not equal exactly 100% due to rounding). Students served through special education who graduate with an individualized education program (IEP) are included as graduates.
Additional Information about Federal Graduation Rates
In addition to the detailed breakdown of the four-, five- and six-year longitudinal rates, the district and campus TAPRs show federal graduation rates for the following:
(1) 4-Year Federal Graduation Rate. Cohort of students who first attended ninth grade in 2014–15. They are followed through their expected graduation with the Class of 2018. It is calculated as follows:
number of students from the cohort who received a high school diploma by August 31, 2018
number of students in the 2018 cohort **
(2) 5-Year Extended Federal Graduation Rate. Cohort of students who first attended ninth grade in 2013–14. They are followed for five years to see if they graduated within a year after their expected graduation with the Class of 2017. It is calculated as follows:
number of students from the cohort who received a high school diploma by August 31, 2018
number of students in the 2017 cohort**
(3) 6-Year Extended Federal Graduation Rate. Cohort of students who first attended ninth grade in 2012–13. They are followed for six years to see if they graduated within two years after their expected graduation with the Class of 2016. It is calculated as follows:
number of students from the cohort who received a high school diploma by August 31, 2018
number of students in the 2016 cohort**
** The cohort in the denominator above includes those students who graduated, continued in school, received a TxCHSE, or dropped out. It does not include data errors or leavers with leaver reason codes 03, 16, 24, 60, 66, 78, 81, 82, 83, 85, 86, 87, or 90. Students with leaver codes 88 and 89 are included in the federal rates.
A student in a Texas Juvenile Justice Department facility or residential treatment facility served by a Texas public school district is excluded from district and campus graduation rates calculated for federal accountability purposes. Students served by special education who graduate with an individualized education program (IEP) are included as graduates.
For further information on these rates, see the report Secondary School Completion and Dropouts in Texas Public Schools, 2017–18. (Data source: TSDS PEIMS 40203 and Texas Certificate of High School Equivalency Information File)
Graduation Program: The percentage of students who graduated under one of the following programs:
18-19 AAR Page 637

Comprehensive Glossary 2018–19 Texas Academic Performance Report
Texas Education Agency | Governance and Accountability | Performance Reporting 14 of 48
RHSP/DAP Graduates (Longitudinal Rate) (Class of 2018) The percentage of graduates who, after four years, satisfied the course requirements for the Recommended High School Program or Distinguished Achievement Program.
number of graduates in the Class of 2018 who complete a 4-year RHSP or DAP
number of graduates in the Class of 2018 with reported graduation plans
(excludes graduates with FHSP degree plans)
FHSP-E Graduates (Longitudinal Rate) (Class of 2018) The percentage of graduates who, after four years, satisfied the course requirements for the Foundation High School Program with an endorsement.
number of graduates in the Class of 2018 who complete a 4-year FHSP-E
number of graduates in the Class of 2018 with reported FHSP graduation plans
FHSP-DLA Graduates (Longitudinal Rate) (Class of 2018) The percentage of graduates who, after four years, satisfied the course requirements for the Foundation High School Program at the distinguished level of achievement.
number of graduates in the Class of 2018 who complete a 4-year FHSP-DLA
number of graduates in the Class of 2018 with reported FHSP graduation plans
RHSP/DAP/FHSP-E/FHSP-DLA Graduates (Longitudinal Rate) (Class of 2018) The percentage of graduates who, after four years, satisfied the course requirements for the Recommended High School Program, Distinguished Achievement Program, or the Foundation High School Program with an endorsement or at the distinguished level of achievement.
number of graduates from the Class of 2018 who complete a 4-year RHSP or DAP or FHSP-E or FHSP-DLA
number of graduates in the Class of 2018 with reported graduation plans
RHSP/DAP Graduates (Annual Rate) (2017–18) The percentage of graduates in 2018 who satisfied the course requirements for the Recommended High School Program or Distinguished Achievement Program.
number of graduates in SY 2017–18 reported with graduation codes for RHSP or DAP
number of graduates in SY 2017–18 with reported graduation plans (excludes graduates with FHSP degree plans)
FHSP-E Graduates (Annual Rate) (2017–18) The percentage of graduates in 2018 who satisfied the course requirements for the Foundation High School Program with an endorsement.
number of graduates in SY 2017–18 who earn an FHSP-E
18-19 AAR Page 638
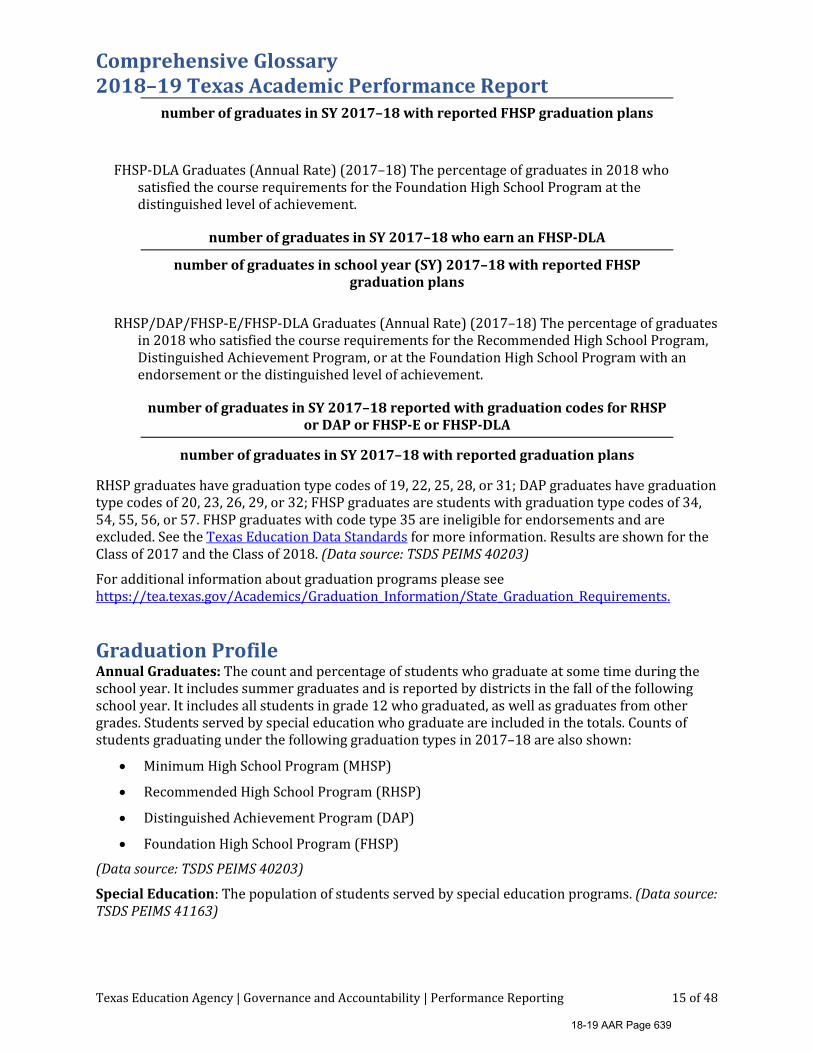
Comprehensive Glossary 2018–19 Texas Academic Performance Report
Texas Education Agency | Governance and Accountability | Performance Reporting 15 of 48
number of graduates in SY 2017–18 with reported FHSP graduation plans
FHSP-DLA Graduates (Annual Rate) (2017–18) The percentage of graduates in 2018 who satisfied the course requirements for the Foundation High School Program at the distinguished level of achievement.
number of graduates in SY 2017–18 who earn an FHSP-DLA
number of graduates in school year (SY) 2017–18 with reported FHSP graduation plans
RHSP/DAP/FHSP-E/FHSP-DLA Graduates (Annual Rate) (2017–18) The percentage of graduates in 2018 who satisfied the course requirements for the Recommended High School Program, Distinguished Achievement Program, or at the Foundation High School Program with an endorsement or the distinguished level of achievement.
number of graduates in SY 2017–18 reported with graduation codes for RHSP or DAP or FHSP-E or FHSP-DLA
number of graduates in SY 2017–18 with reported graduation plans
RHSP graduates have graduation type codes of 19, 22, 25, 28, or 31; DAP graduates have graduation type codes of 20, 23, 26, 29, or 32; FHSP graduates are students with graduation type codes of 34, 54, 55, 56, or 57. FHSP graduates with code type 35 are ineligible for endorsements and are excluded. See the Texas Education Data Standards for more information. Results are shown for the Class of 2017 and the Class of 2018. (Data source: TSDS PEIMS 40203)
For additional information about graduation programs please see https://tea.texas.gov/Academics/Graduation_Information/State_Graduation_Requirements.
Graduation Profile Annual Graduates: The count and percentage of students who graduate at some time during the school year. It includes summer graduates and is reported by districts in the fall of the following school year. It includes all students in grade 12 who graduated, as well as graduates from other grades. Students served by special education who graduate are included in the totals. Counts of students graduating under the following graduation types in 2017–18 are also shown:
• Minimum High School Program (MHSP)
• Recommended High School Program (RHSP)
• Distinguished Achievement Program (DAP)
• Foundation High School Program (FHSP)
(Data source: TSDS PEIMS 40203)
Special Education: The population of students served by special education programs. (Data source: TSDS PEIMS 41163)
18-19 AAR Page 639
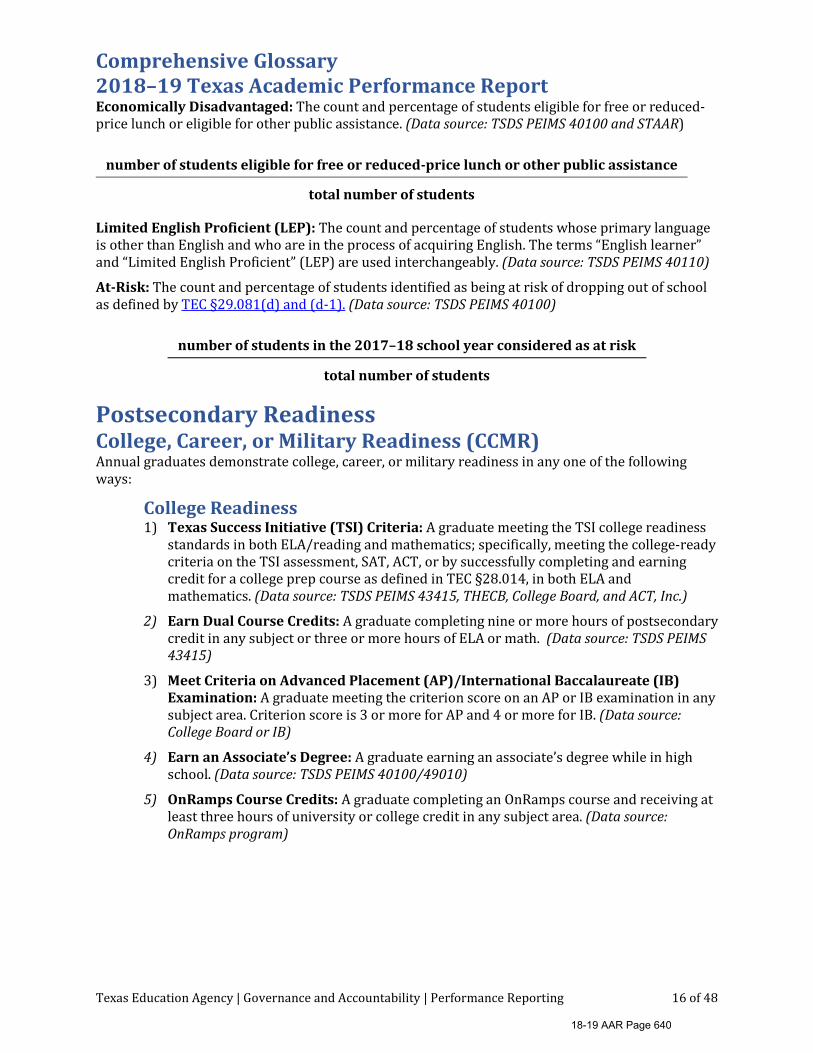
Comprehensive Glossary 2018–19 Texas Academic Performance Report
Texas Education Agency | Governance and Accountability | Performance Reporting 16 of 48
Economically Disadvantaged: The count and percentage of students eligible for free or reduced-price lunch or eligible for other public assistance. (Data source: TSDS PEIMS 40100 and STAAR)
number of students eligible for free or reduced-price lunch or other public assistance
total number of students
Limited English Proficient (LEP): The count and percentage of students whose primary language is other than English and who are in the process of acquiring English. The terms “English learner” and “Limited English Proficient” (LEP) are used interchangeably. (Data source: TSDS PEIMS 40110)
At-Risk: The count and percentage of students identified as being at risk of dropping out of school as defined by TEC §29.081(d) and (d-1). (Data source: TSDS PEIMS 40100)
number of students in the 2017–18 school year considered as at risk
total number of students
Postsecondary Readiness
College, Career, or Military Readiness (CCMR) Annual graduates demonstrate college, career, or military readiness in any one of the following ways:
College Readiness 1) Texas Success Initiative (TSI) Criteria: A graduate meeting the TSI college readiness
standards in both ELA/reading and mathematics; specifically, meeting the college-ready criteria on the TSI assessment, SAT, ACT, or by successfully completing and earning credit for a college prep course as defined in TEC §28.014, in both ELA and mathematics. (Data source: TSDS PEIMS 43415, THECB, College Board, and ACT, Inc.)
2) Earn Dual Course Credits: A graduate completing nine or more hours of postsecondary credit in any subject or three or more hours of ELA or math. (Data source: TSDS PEIMS 43415)
3) Meet Criteria on Advanced Placement (AP)/International Baccalaureate (IB) Examination: A graduate meeting the criterion score on an AP or IB examination in any subject area. Criterion score is 3 or more for AP and 4 or more for IB. (Data source: College Board or IB)
4) Earn an Associate’s Degree: A graduate earning an associate’s degree while in high school. (Data source: TSDS PEIMS 40100/49010)
5) OnRamps Course Credits: A graduate completing an OnRamps course and receiving at least three hours of university or college credit in any subject area. (Data source: OnRamps program)
18-19 AAR Page 640
Comprehensive Glossary 2018–19 Texas Academic Performance Report
Texas Education Agency | Governance and Accountability | Performance Reporting 17 of 48
Career/Military Readiness 6) Earn an Industry-Based Certification: A graduate earning an industry-based
certification under 19 TAC §74.1003. (Data source: TSDS PEIMS 48011)
7) Graduate with Completed IEP and Workforce Readiness: A graduate receiving a graduation type code of 04, 05, 54, or 55 which indicates the student has completed his/her IEP and has either demonstrated self-employment with self-help skills to maintain employment or has demonstrated mastery of specific employability and self-help skills that do not require public school services. (Data source: TSDS PEIMS 40203)
8) CTE Coherent Sequence Coursework Aligned with Industry-Based Certifications: A CTE coherent sequence graduate who has completed and received credit for at least one CTE course aligned with an industry-based certification. This indicator awards one-half point only for graduates who have met no other CCMR indicator. These graduates receive one-half point credit for coursework completed toward an industry-based certification. The list of CTE courses aligned with industry-based certifications is provided in Chapter 2 of the 2019 Accountability Manual. (Data source: TSDS PEIMS 43415 and 40110 [summer])
9) Enlist in the Armed Forces: A graduate enlisting in the U.S. Army, Navy, Air Force, Coast Guard, or Marines. (Data source: TSDS PEIMS 40203)
10) Current Special Education Students with Advanced Degree Plans: A graduate who graduates under an advanced degree plan and is identified as a current special education student (Data source: TSDS PEIMS 40203 and 40110)
11) Graduate with Level I or Level II Certificate: A graduate earning a Level I or Level II certificate in any workforce education area. (Data source: THECB)
College, Career, or Military Ready Graduates College, Career, or Military Ready (Student Achievement): The percentage of annual graduates who demonstrated college, career, or military readiness by meeting at least one of the eleven criteria described in College, Career, or Military Readiness.
Only College Ready: The percentage of annual graduates who demonstrated only college readiness by meeting college ready criteria 1, 2, 3, 4, or 5 but did not meet any of the career and military ready criteria 6, 7, 8, 9, 10, or 11 described in College, Career, or Military Readiness.
Only Career/Military Ready: The percentage of annual graduates who demonstrated only career or military readiness by meeting career or military ready criteria 6, 7, 8, 9, 10, or 11 but did not meet any of the college ready criteria 1, 2, 3, 4, and 5 described in College, Career, or Military Readiness.
College Ready and Career/Military Ready: The percentage of annual graduates who demonstrated college and career/military readiness by meeting college ready criteria 1, 2, 3, 4, or 5 and career or military ready criteria 6, 7, 8, 9, 10, or 11 described in College, Career, or Military Readiness.
College Ready Graduates College Ready: The percentage of annual graduates who demonstrated college readiness by meeting criteria 1, 2, 3, 4, or 5 described in College, Career, or Military Readiness. This percentage includes graduates who may have met career or military ready criteria 6, 7, 8, 9, 10, or 11. (Data source: TSDS PEIMS 43415, THECB, College Board, ACT, IB, and TSDS PEIMS 49010)
18-19 AAR Page 641

Comprehensive Glossary 2018–19 Texas Academic Performance Report
Texas Education Agency | Governance and Accountability | Performance Reporting 18 of 48
TSI Criteria Graduates: The percentage of annual graduates who met or exceeded the college-ready criteria on the Texas Success Initiative Assessment (TSIA), the SAT, ACT, or by successfully completing and earning credit for a college prep course as defined in TEC §28.014, in both ELA and mathematics. The criteria for each are as follows:
TSI Criteria
TSIA SAT* ACT College Prep Course
>= 351 on Reading or
>=480 on the Evidence-Based
Reading and Writing (EBRW)
or
>=19 on English and
>= 23 Composite
or Complete and earn
credit for ELA college prep course
>= 350 on Mathematics or >=530 on
Mathematics or
>=19 on Mathematics
and >=23 Composite
or
Complete and earn credit for
mathematics college prep course
* For the small percentage of students who took the SAT examination prior to March 2016, their scores were converted to corresponding scores on the redesigned SAT using College Board’s concordance tables.
The percentages are calculated as follows:
English Language Arts. number of graduates who met or exceeded the college-ready criteria on the TSIA, SAT, ACT, or by successfully
completing and earning credit for a college prep course in ELA in 2017–18
number of 2017–18 annual graduates
Mathematics. number of graduates who met or exceeded the college-ready criteria on the TSIA, SAT, ACT, or by successfully completing and earning credit for a college prep course in mathematics in 2017–18
number of 2017–18 annual graduates
Both Subjects. number of graduates who met or exceeded the college-ready criteria on the TSIA, SAT, ACT, or by
successfully completing and earning credit for a college prep course in both ELA and mathematics in 2017–18
number of 2017–18 annual graduates
Either Subject. number of graduates who met or exceeded the college-ready criteria on the TSIA, SAT, ACT, or by
successfully completing and earning credit for a college prep course in ELA or mathematics in 2017–18
number of 2017–18 annual graduates
Dual Course Credits: The percentage of annual graduates who completed and earned credit for nine or more hours of dual credit in any subject or three or more hours in ELA or mathematics (Data source: TSDS PEIMS 43415)
18-19 AAR Page 642

Comprehensive Glossary 2018–19 Texas Academic Performance Report
Texas Education Agency | Governance and Accountability | Performance Reporting 19 of 48
number of 2017–18 annual graduates who completed and earned credit for nine or more hours of dual credit in any subject or three or more hours in ELA or mathematics
number of 2017–18 annual graduates
AP/IB Criteria Met in Any Subject: The percentage of annual graduates who earned a 3 or more on an AP examination or a 4 or more on an IB examination. (Data source: College Board and IB)
number of 2017–18 annual graduates who earned a 3 or more on an AP examination or a 4 or more on an IB examination
number of 2017–18 annual graduates
Associate’s Degree: The percentage of annual graduates who earned an associate’s degree before graduation. (Data source: TSDS PEIMS 40100)
number of 2017–18 annual graduates who earned an associate’s degree before graduation
number of 2017–18 annual graduates
Associate’s Degree but not Career/Military Ready: The percentage of annual graduates who met associate’s degree criteria 4, but did not meet career or military ready criteria 6, 7, 8, 9, 10, or 11 described in College, Career, or Military Readiness.
Associate’s Degree and Career/Military Ready: The percentage of annual graduates who met associate’s degree criteria 4 and career or military ready criteria 6, 7, 8, 9, 10, or 11 described in College, Career, or Military Readiness.
OnRamps Course Credits: The percentage of annual graduates who completed an OnRamps course and qualified for three hours of university or college credit (Data source: OnRamps program)
number of 2017–18 annual graduates who completed an OnRamps course and qualified for three hours of college credit before graduation
number of 2017–18 annual graduates
Career/Military Ready Graduates Career or Military Ready Graduates: The percentage of annual graduates who demonstrated career or military readiness by meeting criteria 6, 7, 8, 9, 10, or 11 described in College, Career, or Military Readiness. This percentage includes graduates who may have met college ready criteria 1, 2, 3, 4, or 5.
Approved Industry-Based Certification: The percentage of annual graduates who earned an approved industry-based certification. For additional information, see Chapter 2 of the 2019 Accountability Manual. (Data source: TSDS PEIMS 48011)
number of 2017–18 annual graduates who earned an approved industry-based certification
number of 2017–18 annual graduates
18-19 AAR Page 643
Comprehensive Glossary 2018–19 Texas Academic Performance Report
Texas Education Agency | Governance and Accountability | Performance Reporting 20 of 48
Graduate with Completed IEP and Workforce Readiness: The percentage of annual graduates who received a graduation type code of 04, 05, 54, or 55. For additional information, see Chapter 2 of the 2019 Accountability Manual. (Data source: TSDS PEIMS 40203)
number of 2017–18 annual graduates who received a graduation type code of 04, 05, 54, or 55
number of 2017–18 annual graduates
CTE Coherent Sequence Coursework Aligned with Industry-Based Certifications: The percentage of annual graduates who were enrolled in a coherent sequence of CTE courses and completed and earned credit for coursework aligned with approved industry-based certifications. This indicator is different from the accountability College, Career, or Military Readiness (CCMR) indicator; all graduates are included regardless of whether they met other CCMR indicators. (Data source: TSDS PEIMS 43415 and 40110)
number of 2017–18 annual graduates who were enrolled in a coherent sequence of CTE courses and completed and earned credit for coursework aligned with approved industry-based certifications
number of 2017–18 annual graduates
U.S. Armed Forces Enlistment: The percentage of annual graduates who were reported as intending to enlist in or enlisting in the U.S. Armed Forces. (Data source: TSDS PEIMS 40203)
number of 2017–18 annual graduates who were reported as intending to enlist in or enlisting in the U.S. Armed Forces
number of 2017–18 annual graduates
Current Special Education Students with Advanced Degree Plans: The percentage of annual graduates under an advanced degree plan and identified as a current special education student (Data source: TSDS PEIMS 40203 and 40110)
number of 2017–18 annual graduates who graduated under an advanced degree plan and were identified as a current special education student
number of 2017–18 annual graduates
Graduate with Level I or Level II Certificate: The percentage of annual graduates who earned a Level I or Level II certificate (Data source: THECB)
number of 2017–18 annual graduates who earned a Level I or Level II certificate
number of 2017–18 annual graduates
18-19 AAR Page 644
Comprehensive Glossary 2018–19 Texas Academic Performance Report
Texas Education Agency | Governance and Accountability | Performance Reporting 21 of 48
CCMR-related Indicators Texas Success Initiative Assessment (TSIA): Participation (Annual Graduates): The percentage of annual graduates who took the College Board’s TSIA at any point since June 2011. (Data source: THECB)
number of 2017–18 annual graduates who took the TSIA number of 2017–18 annual graduates
TSIA Average Score (Annual Graduates): The average score of annual graduates on the TSIA. The maximum score for reading is 390, and the maximum score for mathematics is 390.
Reading
sum of total reading scores of all annual graduates who took the TSIA
number of annual graduates who took the reading portion of the TSIA
Mathematics
sum of total mathematics scores of all annual graduates who took the TSIA
number of annual graduates who took the mathematics portion of the TSIA
TSIA Results (Graduates >= Criterion) (Annual Graduates): The percentage of annual graduates who met the TSI criteria on the TSIA (Data source: THECB and TSDS PEIMS 40203)
Percentages are calculated and shown for reading and mathematics together and separately.
number of 2017–18 annual graduates who met the TSI criteria on the TSIA
number of 2017–18 annual graduates
CTE Coherent Sequence (Annual Graduates): The percentage of annual graduates enrolled in a coherent sequence of career and technical education (CTE) courses as part of a four-year plan of study. (Data source: TSDS PEIMS 40100, 40203, and 42400) number of 2017–18 annual graduates who were enrolled in a CTE-coherent sequence of courses as part of a four-
year plan of study to take two or more CTE courses for three or more credits
number of 2017–18 annual graduates
Completed and Received Credit for College Prep Courses (Annual Graduates): The percentage of annual graduates who completed and earned credit for a college prep course as defined in TEC §28.014 in either ELA or mathematics or both. (Data source: TSDS PEIMS 43415)
English Language Arts.
number of 2017–18 annual graduates who completed and earned credit for a college prep course as defined in TEC §28.014 in ELA
number of 2017–18 annual graduates
18-19 AAR Page 645
Comprehensive Glossary 2018–19 Texas Academic Performance Report
Texas Education Agency | Governance and Accountability | Performance Reporting 22 of 48
Mathematics.
number of 2017–18 annual graduates who completed and earned credit for a college prep course as defined in TEC §28.014 in mathematics
number of 2017–18 annual graduates
Both Subjects. number of 2017–18 annual graduates who completed and earned credit for a college prep course as defined
in TEC §28.014 in ELA and mathematics
number of 2017–18 annual graduates
AP/IB Course Completion (Annual Graduates): The percentage of annual graduates who completed and earned credit for at least one Advanced Placement (AP) course or International Baccalaureate (IB) course in the 2014–15 to 2017–18 school years. (Data source:TSDS PIEMS 43415)
number of 2017–18 annual graduates who completed and earned credit for at least one AP or IB course in the 2014–15 to 2017–18 school years
number of 2017–18 annual graduates
AP/IB Results (Participation) (Grades 11–12): The percentage of students in grades 11 and 12 who took the College Board’s Advanced Placement (AP) examinations or the International Baccalaureate’s (IB) Diploma Program examinations. (Data source: College Board and IB)
All Subjects Number of students in grades 11 & 12 in the 2017–18 school year who took at least one AP or IB examination
total students enrolled in grades 11 & 12
English Language Arts number of students in grades 11 & 12 in the 2017–18 school year who took at least one AP or IB examination in
ELA
total students enrolled in grades 11 & 12
Mathematics number of students in grade 11 & 12 in the 2017–18 school year who took at least one AP or IB examination in
mathematics
total students enrolled in grades 11 & 12
Science number of students in grade 11 & 12 in the 2017–18 school year who took at least one AP or IB examination in
science
total students enrolled in grades 11 & 12
18-19 AAR Page 646
Comprehensive Glossary 2018–19 Texas Academic Performance Report
Texas Education Agency | Governance and Accountability | Performance Reporting 23 of 48
Social Studies Number of students in grade 11 & 12 in the 2017–18 school year who took at least one AP or IB examination in
social studies
total students enrolled in grades 11 & 12
These indicators were used in determining the 2019 distinction designations for campuses and districts. For a detailed explanation of distinction designations, see Chapter 6 of the 2019 Accountability Manual. (Data source: College Board, IB, and TSDS PEIMS 40110)
AP/IB Results (Examinees >= Criterion) (Grades 11–12): The percentage of students with at least one AP or IB examination in grades 11 and 12 at or above the criterion score. High school students may take one or more of these examinations, ideally upon completion of AP or IB courses, and may receive advanced placement or credit, or both, upon entering college. Generally, colleges will award credit or advanced placement for scores of 3, 4, or 5 on AP examinations and scores of 4, 5, 6, or 7 on IB examinations. Requirements vary by college and by subject tested. (Data source: College Board and IB)
All Subjects number of 11th and 12th graders in 2017–18 with at least one AP or IB score at or above criterion
number of 11th and 12th graders with at least one AP or IB examination
English Language Arts number of 11th and 12th graders in 2017–18 with at least one AP or IB score at or above criterion in ELA
number of 11th and 12th graders with at least one AP or IB examination in ELA
Mathematics number of 11th and 12th graders in 2017–18 with at least one AP or IB score at or above criterion in
mathematics
number of 11th and 12th graders with at least one AP or IB examination in mathematics
Science number of 11th and 12th graders in 2017–18 with at least one AP or IB score at or above criterion in
science
number of 11th and 12th graders with at least one AP or IB examination in science
Social Studies number of 11th and 12th graders in 2017–18 with at least one AP or IB score at or above criterion in social
studies
number of 11th and 12th graders with at least one AP or IB examination in social studies
These indicators were used in determining the 2019 distinction designations for campuses. For a detailed explanation of distinction designations, see Chapter 6 of the 2019 Accountability Manual. (Data source: The College Board, The International Baccalaureate Organization, and TSDS PEIMS 40110)
AP/IB Results (11th & 12th Graders >= Criterion): The percentage of students enrolled in grades 11 and 12 with at least one AP or IB score at or above the criterion score. This denominator includes students enrolled in grades 11 and 12 who did not take AP or IB examination. High school
18-19 AAR Page 647
Comprehensive Glossary 2018–19 Texas Academic Performance Report
Texas Education Agency | Governance and Accountability | Performance Reporting 24 of 48
students may take one or more of these examinations, ideally upon completion of AP or IB courses, and may receive advanced placement or credit, or both, upon entering college. Generally, colleges will award credit or advanced placement for scores of 3, 4, or 5 on AP examinations and scores of 4, 5, 6, or 7 on IB examinations. Requirements vary by college and by subject tested. (Data source: College Board and IB)
All Subjects number of 11th and 12th graders in 2017–18 with at least one AP or IB score at or above criterion
total students enrolled in 11th and 12th grades
SAT/ACT Results (Annual Graduates): Participation and performance of annual graduates from all Texas public schools on the College Board’s SAT and ACT, Inc.’s ACT assessment. ACT and SAT scores are based on each student’s highest section scores across all exams taken, and the SAT total and ACT composite scores are calculated using the highest section scores. For the class of 2017 and previous years, the scores were based on each student’s most recent examination. Because of the change to using highest score, only the class of 2018 is shown.
(1) Tested: The percentage of graduates who took either college admissions assessment: number of 2017–18 graduates who took either the SAT or the ACT
number of 2017–18 graduates reported
(2) At/Above Criterion: The percentage of examinees who scored at or above the criterion score of 480 on the SAT evidence-based reading and writing or 19 on ACT English section and 23 composite and 530 on SAT mathematics or 19 on ACT Mathematics section and 23 on the ACT composite:
number of 2017–18 graduating examinees who scored at or above the criterion score on either the SAT or the ACT
number of 2017–18 graduating examinees taking either the SAT or the ACT
(3) At/Above Criterion for All Graduates: The percentage of graduates who scored at or above the criterion score of 480 on the SAT evidence-based reading and writing or 19 on ACT English section and 23 composite and 530 on SAT mathematics or 19 on ACT Mathematics section and 23 on the ACT composite:
number of 2017–18 graduating examinees who scored at or above the criterion score on either the SAT or the ACT
number of 2017–18 graduates reported
Note: For the small percentage of students who took the SAT examination prior to March 2016, their scores were converted to corresponding scores on the redesigned SAT using College Board’s concordance tables. (Data source: College Board and TSDS PEIMS 40203)
18-19 AAR Page 648
Comprehensive Glossary 2018–19 Texas Academic Performance Report
Texas Education Agency | Governance and Accountability | Performance Reporting 25 of 48
Average SAT Score (Annual Graduates): Performance of annual graduates from all Texas public schools on the College Board’s SAT assessment. If a student takes the SAT more than once, the best result by subject area is selected, and the SAT total is calculated as the sum of the highest section scores.
(1) Average SAT Score (All Subjects): The average score for the SAT evidence-based reading and writing and mathematics combined. The maximum score is 1600.
sum of SAT total scores (evidence-based reading and writing + mathematics) of all 2017–18 graduates who took the SAT
number of 2017–18 graduates who took the SAT
(2) Average SAT Score (English Language Arts and Writing): The average score for the SAT evidence-based reading and writing. The maximum score is 800.
sum of SAT evidence-based reading and writing scores of all 2017–18 graduates who took the SAT
number of 2017–18 graduates who took the SAT
(3) Average SAT Score (Mathematics): The average score for the SAT mathematics. The maximum score is 800.
sum of SAT mathematics scores of all 2017–18 graduates who took the SAT
number of 2017–18 graduates who took the SAT
Note: For the small percentage of students who took the SAT examination prior to March 2016, their scores were converted to corresponding scores on the redesigned SAT using College Board’s concordance tables. (Data source: College Board and TSDS PEIMS 40203)
Average ACT Score (Annual Graduates): Performance of annual graduates from all Texas public schools on the ACT Inc.’s ACT assessment. If a student takes the ACT more than once, the best result by subject area is selected, and the ACT composite scores is calculated as the average of the highest section scores.
(1) Average ACT Score (All Subjects): The average score for the ACT composite. The maximum
score is 36. sum of ACT composite scores of all 2017–18 graduates who took the ACT
number of 2017–18 graduates who took the ACT
(2) Average ACT Score (English Language Arts): The average score for the ACT English and Reading combined. The maximum score is 36.
sum of ACT English and Reading combined scores of all 2017–18 graduates who took the ACT
number of 2017–18 graduates who took the ACT
(3) Average ACT Score (Mathematics): The average score for the mathematics ACT. The maximum score is 36.
sum of ACT mathematics scores of all 2017–18 graduates who took the ACT
number of 2017–18 graduates who took the ACT
18-19 AAR Page 649

Comprehensive Glossary 2018–19 Texas Academic Performance Report
Texas Education Agency | Governance and Accountability | Performance Reporting 26 of 48
(4) Average ACT Score (Science): The average score for the science ACT. The maximum score is 36.
sum of ACT science scores of all 2017-18 graduates who took the ACT
number of 2017-18 graduaates who took the ACT
OnRamps Course Credits: The percentage of annual graduates who completed an OnRamps course and earned three hours of college credit (Data source: OnRamps program)
number of 2017–18 annual graduates who completed an OnRamps course and earned three hours of college credit before graduation
number of 2017–18 annual graduates
Current Special Education Students with Advanced Degree Plans: The percentage of annual graduates who graduated under an advanced degree plan and were identified as a current special education student (Data source: TSDS PEIMS 40203 and 40110)
number of 2017–18 annual graduates who graduated under an advanced degree plan and were identified as a current special education student
number of 2017–18 annual graduates
Other Postsecondary Indicators Advanced/Dual-Credit Course Completion (Grades 11–12): The percentage of students who completed and received credit for at least one advanced or dual-credit course. Decisions about awarding high school credit for college courses are described in Texas Administrative Code §74.25.
Appendix B lists all courses identified as advanced courses. Courses for which a student can earn dual credit are not listed because they vary from campus to campus.
Course completion information is reported by districts through the Texas Student Data System/Public Education Information Management System (TSDS PEIMS) after the close of the school year. For example, the values, expressed as percentages for grades 11–12, are calculated as follows: (Data source: TSDS PEIMS 43415)
Any Subject number of students in grades 11–12 in 2017–18 who received credit for at least
one advanced/dual-credit course
number of students in grades 11–12 who received credit for at least one course in 2017–18
English Language Arts
number of students in grades 11–12 in 2017–18 who received credit for at least one ELA advanced/dual-credit course
number of students in grades 11–12 who received credit for at least one ELA course in 2017–18
Mathematics
number of students in grades 11–12 in 2017–18 who received credit for at least one mathematics advanced/dual-credit course
18-19 AAR Page 650

Comprehensive Glossary 2018–19 Texas Academic Performance Report
Texas Education Agency | Governance and Accountability | Performance Reporting 27 of 48
number of students in grades 11–12 who received credit for at least one mathematics course in 2017–18
Science
number of students in grades 11–12 in 2017–18 who received credit for at least one science advanced/dual-credit course
number of students in grades 11–12 who received credit for at least one science course in 2017–18
Social Studies
number of students in grades 11–12 in 2017–18 who received credit for at least one social studies advanced/dual-credit course
number of students in grades 11–12 who received credit for at least one social studies course in 2017–18
This indicator was used in awarding distinction designations to high schools in 2019. For a detailed explanation of distinction designations, see Chapter 6 of the 2019 Accountability Manual. (Data source: TSDS PEIMS 43415)
Advanced/Dual-Credit Course Completion (Grades 9–12): The percentage of students who completed and received credit for at least one advanced or dual-credit course. Decisions about awarding high school credit for college courses are described in Texas Administrative Code §74.25.
Appendix B lists all courses identified as advanced courses. Courses for which a student can earn dual credit are not listed because they vary from campus to campus.
Course completion information is reported by districts through the Texas Student Data System/Public Education Information Management System (TSDS PEIMS) after the close of the school year. For example, the values, expressed as percentages for grades 9–12, are calculated as follows: (Data source: TSDS PEIMS 43415)
Any Subject
number of students in grades 9–12 in 2017–18 who received credit for at least one advanced/dual-credit course
number of students in grades 9–12 who received credit for at least one course in 2017–18
English Language Arts
number of students in grades 9–12 in 2017–18 who received credit for at least one ELA advanced/dual-credit course
number of students in grades 9–12 who received credit for at least one ELA course in 2017–18
Mathematics
number of students in grades 9–12 in 2017–18 who received credit for at least one mathematics advanced/dual-credit course
number of students in grades 9–12 who received credit for at least one mathematics course in 2017–18
Science
18-19 AAR Page 651

Comprehensive Glossary 2018–19 Texas Academic Performance Report
Texas Education Agency | Governance and Accountability | Performance Reporting 28 of 48
number of students in grades 9–12 in 2017–18 who received credit for at least one science advanced/dual-credit course
number of students in grades 9–12 who received credit for at least one science course in 2017–18
Social Studies
number of students in grades 9–12 in 2017–18 who received credit for at least one social studies advanced/dual-credit course
number of students in grades 9–12 who received credit for at least one social studies course in 2017–18
This indicator w used in awarding distinction designations to high schools in 2019. For a detailed explanation of distinction designations, see Chapter 6 of the 2019 Accountability Manual. (Data source: TSDS PEIMS 43415)
Graduates Enrolled in Texas Institution of Higher Education (TX IHE): The percentage of students who enrolled and began instruction at an institution of higher education in Texas for the school year following high school graduation.
number of graduates during the 2016–17 school year who attended a public or independent college or university in Texas in the 2017–18 academic year
number of graduates during the 2016–17 school year
Students who enrolled in out-of-state colleges or universities or any non-public career school are not included. Students who attend public community colleges in Texas are included. (Data source: THECB)
Graduates in TX IHE Completing One Year Without Enrollment in a Developmental Education Course: The percentage of students who enrolled and began instruction at an institution of higher education in Texas for the school year following high school graduation and did not require a developmental education course.
number of graduates during the 2016–17 school year who enrolled in a public college or university in Texas for the school year following the year they graduated
and met the Texas Success Initiative requirement in all subject areas (reading, writing, and mathematics)
number of graduates during the 2016–17 school year who enrolled in a public college or university in Texas for the school year following the year they graduated
Students who attended Texas public two- or four-year institutions of higher education are included. Students who enrolled in independent colleges or universities in Texas, out-of-state colleges or universities, or any non-public career school are not included.
Additional reports showing students enrolled in Texas public colleges and universities are available on the Texas Higher Education Coordinating Board (THECB) site at http://www.txhighereddata.org/generatelinks.cfm?Section=HS2Col.
For more information on the data used in this indicator, contact the Texas Higher Education Coordinating Board at (512) 427-6153. (Data source: THECB)
18-19 AAR Page 652
Comprehensive Glossary 2018–19 Texas Academic Performance Report
Texas Education Agency | Governance and Accountability | Performance Reporting 29 of 48
Profile Student Information Total Students: The total number of public school students who were reported in membership on October 26, 2018, at any grade from early childhood education through grade 12. Membership differs from enrollment as it does not include those students who are served in the district for less than two hours per day. For example, the count of Total Students excludes students who attend a non-public school but receive some services, such as speech therapy—for less than two hours per day—from their local school district. (Data source: TSDS PEIMS 40110)
Students by Grade: The count of students in each grade divided by the total number of students. (Data source: TSDS PEIMS 40110)
Ethnic Distribution: The number and percentage of students and staff who are identified as belonging to one of the following groups: African American, Hispanic, white, American Indian, Asian, Pacific Islander, and two or more races. (Data source: TSDS PEIMS 40100, 30040, 30050, 30090)
Economically Disadvantaged: The count and percentage of students eligible for free or reduced-price lunch or eligible for other public assistance.
number of students eligible for free or reduced-price lunch or other public assistance
total number of students
(Data source: TSDS PEIMS 40100 and TEA Student Assessment Division)
Non-Educationally Disadvantaged: Those students not eligible to participate in free or reduced-price lunch or to receive any other public assistance. This is the complementary count and percentage to Economically Disadvantaged.
Section 504 Students: The count and percentage of students identified as receiving section 504 services.
English Learners (ELs): The count and percentage of students whose primary language is other than English and who are in the process of acquiring English. The terms “English Learner” and “Limited English Proficient” (LEP) are used interchangeably.
Inclusion and exclusion of EL performance varies by indicator:
o EL performance of students who are in year one in U.S. schools is excluded from all STAAR indicators. Exclusion of other EL performance varies, depending on the indicator. For detailed information on the inclusion and exclusion of EL performance, see the 2019 Accountability Manual.
o EL performance is included in all other non-STAAR indicators, regardless of years in U.S. schools.
In the Profile section of the reports, the percentage of ELs is calculated by dividing the number of ELs by the total number of students in the district or campus. Not all students identified as ELs receive bilingual or English as a second language instruction. (Data source: TELPAS file)
18-19 AAR Page 653
Comprehensive Glossary 2018–19 Texas Academic Performance Report
Texas Education Agency | Governance and Accountability | Performance Reporting 30 of 48
Students with Disciplinary Placements: The count and percentage of students placed in alternative education programs under Chapter 37 of the Texas Education Code (Discipline; Law and Order). Districts report the disciplinary actions taken toward students who are removed from the classroom for at least one day. Although students can have multiple removals throughout the year, this measure counts students only once and includes only those whose removal results in a placement in a disciplinary alternative education program or juvenile justice alternative education program. It is calculated as follows:
number of students with one or more disciplinary placements
number of students who were in attendance at any time during the school year
For 2018–19, the following 19 disciplinary action codes are included as disciplinary placements: 02, 03, 04, 07, 08, 10, 12, 13, 14, 15, 51, 52, 53, 54, 55, 57, 59, 60, and 61. (Data source: TSDS PEIMS 44425) Students with Dyslexia: The count and percentage of students identified with Dyslexia. At-Risk: The count and percentage of students identified as being at risk of dropping out of school as defined by TEC §29.081(d) and (d-1).
number of students in the 2018–19 school year considered as at risk
total number of students
(Data source: TSDS PEIMS 40110)
Students with Disabilities by Type of Primary Disability: The count of students disaggregated by primary disability. The TAPR uses five categories of primary disability: Students with Intellectual Disabilities, Students with Physical Disabilities, Students with Autism, Students with Behavioral Disabilities, and Students with Non-Categorical Early Childhood. Additional information is provided below.
Students with Intellectual Disabilities (TSDS PEIMS disability codes 06, 08, 12, 13)
• 06—Intellectual Disability (ID)
• 08—Learning Disability (LD)
• 12—Developmental Delay (DD)
• 13—Traumatic Brain Injury (TBI)
Students with Physical Disabilities (TSDS PEIMS disability codes 01, 03, 04, 05, 09)
• 01—Orthopedic Impairment (OI)
• 03—Auditory Impairment (AI)
• 04—Visual Impairment (VI)
• 05—Deaf-Blind (DB)
• 09—Speech Impairment Students with Autism (TSDS PEIMS disability code 10)
18-19 AAR Page 654
Comprehensive Glossary 2018–19 Texas Academic Performance Report
Texas Education Agency | Governance and Accountability | Performance Reporting 31 of 48
• 10—Autism (AU)
Students with Behavioral Disabilities (TSDS PEIMS disability codes 02 and 07)
• 02—Other Health Impairment (OHI)
• 07—Emotional Disturbance (ED)
Students with Non-Categorical Early Childhood (TSDS PEIMS disability code 14)
• 14—Noncategorical Early Childhood (NCES)
(Data source: TSDS PEIMS 41163)
Mobility (campus profile only): The count and percentage of students who have been in membership at a campus for less than 83 percent of the school year (i.e., missed six or more weeks).
number of mobile students in 2017–18
number of students who were in membership at any time during the
2017–18 school year
This rate is calculated at the campus level and disaggregated by race/ethnicity. The mobility rate shown in the “district” column is based on the count of mobile students identified at the campus level. The district mobility rate reflects school-to-school mobility within the same district or from outside the district. (Data source: TSDS PEIMS 42400)
Retention Rates by Grade (not on campus profile): The percentage of students in Texas public schools who enrolled in fall 2018 in the same grade in which they were reported for the last six-week period of the prior school year (2017–18).
the number of students enrolled in the same grade from one school year to the next
the number of students enrolled from one school year who return the next year or who graduate
Special education retention rates are calculated and reported separately because local retention practices differ for students served by special education.
The TAPR shows retention rates only for grades K–9. Retention rates for all grades can be found in Grade-Level Retention in Texas Public Schools, 2017–18, available from TEA. (Data source: TSDS PEIMS 40110)
Data Quality (not on campus profile): The percentage of errors made by district in the TSDS PEIMS Student Leaver Data.
Percent of Underreported Students. Underreported students are 7th–12th graders who were enrolled at any time during the prior year, who are not accounted for through district records or TEA processing in the current year, and for whom the district did not submit a leaver record. A district is required to submit a leaver record for any student served in grades 7–12 the previous year unless the student received a Texas high school equivalency certificate (TxCHSE) certificate by August 31, is a previous Texas public school graduate, moved to and enrolled in another Texas public school district, or returned to the district by
18-19 AAR Page 655
Comprehensive Glossary 2018–19 Texas Academic Performance Report
Texas Education Agency | Governance and Accountability | Performance Reporting 32 of 48
the end of the school start window. (For 2017–18 the end of the school-start window was September 28, 2018.)
number of underreported students
number of students in grades 7–12 who were served in the district in the 2017–18 school year
(Data source: Texas High School Equivalency Certificate Information File; TSDS PEIMS 40100, 40110, 42400, and 42500)
Class Size Averages by Grade and Subject: The average class size by grade (elementary) or selected subjects (secondary classes).
For secondary classes, averages are determined by totaling the number of students served (in a subject at the campus) and dividing that sum by the count of classes for that subject.
For elementary classes, how the average is determined depends on the instructional model. If an elementary teacher teaches all subjects to the same group of fourth graders all day, the class size average is simply the number of fourth grade students served by that teacher. If an elementary teacher teaches a single subject to five different sections of fourth graders each day, however, the average is calculated the same way as for secondary subjects. For example, one fourth grade science teacher teaches five science classes each day with 18, 20, 19, 21, and 22 students in each class. The total of 100 students divided by the five classes produces an average class size of 20 students for that teacher.
The following rules apply to the average class sizes:
• Classes identified as serving regular, compensatory/remedial, gifted and talented, career and technical, and honors students are included in the calculation.
• Subjects in the areas of English language arts (ELA), mathematics, science, social studies, languages other than English, computer science, and career and technical education are included in the calculation, as are self-contained classrooms.
• Classes where the number of students served is reported as zero are not included.
• Service codes with the “SR” prefix are not included.
• Teacher roles coded as “teacher” and/or “substitute teacher” are included.
• Only class settings coded as “regular class” are included.
• Missing partial FTE counts are not included.
• Elementary classes in which the number of students exceeds 100 are not included.
• Mixed grade-level class averages are not included.
(Data source: TSDS PEIMS 30090)
Staff Information Total Staff: The total count of staff which includes professional staff (teachers, professional support, administrators), educational aides, and (on the district profile) auxiliary staff. (Data source: TSDS PEIMS 30040, 30050, and 30090)
18-19 AAR Page 656
Comprehensive Glossary 2018–19 Texas Academic Performance Report
Texas Education Agency | Governance and Accountability | Performance Reporting 33 of 48
Professional Staff: The full-time equivalent (FTE) count of teachers, professional support staff, campus administrators, and on the district profile, central office administrators. Staff are grouped according to roles as reported in TSDS PEIMS. Each type of professional staff is shown as a percentage of the total staff FTE. See Appendix A for all TSDS PEIMS Role IDs. (Data source: TSDS PEIMS 30040, 30050, and 30090)
Educational Aides: The count and percentage of paraprofessional staff who are reported with a role of 033 (Educational Aide) or 036 (Certified Interpreter). The FTE counts of educational aides are expressed as a percentage of the total staff FTEs. See Appendix A for all TSDS PEIMS Role IDs. (Data source: TSDS PEIMS 30090)
Auxiliary Staff (not on campus profile): The count of full-time equivalent (FTE) staff reported in TSDS PEIMS employment and payroll records who are not reported in the TSDS PEIMS 30090 Staff – Responsibilities record. The auxiliary staff (and educational aide who performs routine classroom tasks under the general supervision of a certified teacher or teaching team) are expressed as a percentage of total staff. For auxiliary staff, the FTE is the value of the percentage of day worked. (Data source: TSDS PEIMS 30060 and 30090)
Librarians and Counselors (Headcount): The headcount of librarians and counselors is based on full-time equivalent (FTE) for full-time and part-time headcounts. Librarians and counselors are considered part-time when the FTE count is less than or equal to .85 (For example, FTE count less than or equal to .85, the part-time headcount is equal to 1).
Librarians and counselors are headcount not sums of FTEs. The district headcount is not a sum of the campus headcount. For example, a counselor spends 50 percent of their time at the elementary (0.50 FTE) and 50 percent of their time at the high school (0.50 FTE). On each of the campus reports, this counselor will be reflected as 1.0 Part-time Counselor. On the district report the counselor will be reflected as 1.0 full-time counselor since the FTE count is greater than .85 (0.50 FTE plus 0.50 FTE=1.0 FTE). See Appendix A for TSDS PEIMS Role IDs (Professional Support Staff). (Data source: TSDS PEIMS 30040, 30050, and 30090)
Total Minority Staff: The total count of minority staff is the sum of the FTE counts for all non-white staff groups (African American, Hispanic, American Indian, Asian, Pacific Islander, and Two or More Races). The minority staff FTE count is expressed as a percentage of the total staff FTE. (Data source: TSDS PEIMS 30040, 30050, and 30090)
Teachers by Ethnicity and Sex: The counts of teacher FTEs by ethnic group and by sex. Counts are also expressed as a percentage of the total teacher FTEs. (Data source: TSDS PEIMS 30040, 30050, and 30090)
Teachers by Highest Degree Held: The distribution of degrees held by teachers. The FTE counts of teachers with no degree, a bachelor’s degree, a master’s degree, or a doctorate are expressed as a percentage of the total teacher FTEs. (Data source: TSDS PEIMS 30040, 30050, and 30090)
Teachers by Years of Experience: The FTE count of teachers by total years of experience for the individual, not necessarily years of experience in the reporting district or campus. Teacher counts within each range of experience are expressed as a percentage of total teacher FTEs. Teachers are reported with zero years of experience (first year teacher), 1–5 years, 6–10 years, 11–20 years, and over 20 years. (Data source: TSDS PEIMS 30040, 30050, and 30090)
18-19 AAR Page 657
Comprehensive Glossary 2018–19 Texas Academic Performance Report
Texas Education Agency | Governance and Accountability | Performance Reporting 34 of 48
Number of Students per Teacher: The total number of students divided by the total teacher FTE count. (Data source: TSDS PEIMS 30040, 30050, and 30090)
Experience of Campus Leadership: The average years of experience for principals and assistant principals.
Average Years as Principal: The number of completed years of experience as a principal, regardless of district or interruption in service. These amounts are added together and divided by the number of all principals reported for the campus.
Average Years as Principal with District: The number of years a principal is employed in the district regardless of any interruption in service. The amounts are added together and divided by the number of principals reported for the district.
Average Years as Assistant Principal: The number of completed years of experience as assistant principal, regardless of district or interruption of service. The amounts are added together and divided by the number of assistant principals reported for the campus.
Average Years as Assistant Principal with District: The number of years employed as assistant principal in the district regardless of any interruption in service. These amounts are added together and divided by the number of assistant principals reported for the district.
(Data source: TSDS PEIMS 30050)
Average Years Experience of Teachers: The average number of completed years of professional experience, regardless of district. Weighted averages are calculated by multiplying each teacher’s FTE coefficient (1 for a full-time teacher, .75 for a three-quarter-time teacher, and .5 for a half-time teacher, for example) by his or her years of experience. These amounts are added together and divided by the sum of all teachers’ FTE coefficients. (Data source: TSDS PEIMS 30040, 30050, and 30090)
Average Years Experience of Teachers with District: The average number of years employed in the district regardless of any interruption in service. Weighted averages are calculated by multiplying each teacher’s FTE coefficient by his or her years of experience in the district. These amounts are added together and divided by the sum of all teacher’s coefficients. (Data source: TSDS PEIMS 30050)
Average Teacher Salary by Years of Experience (regular duties only): Total pay for all teachers in each category divided by the total teacher FTE count in that category. For the purpose of this calculation, the total actual salary amount is pay for regular duties only and does not include supplemental pay. For teachers who also have non-teaching roles, only the portion of time and pay dedicated to classroom responsibilities is factored into the average teacher salary calculation. Teachers are reported with zero years of experience (first year teacher), 1–5 years, 6–10 years, 11–20 years, and over 20 years. (Data source: TSDS PEIMS 30060)
18-19 AAR Page 658
Comprehensive Glossary 2018–19 Texas Academic Performance Report
Texas Education Agency | Governance and Accountability | Performance Reporting 35 of 48
Average Actual Salaries (regular duties only): For each category, the total salary for that category divided by the total FTE count for that category. Only payment for regular duties is included in the total salary; supplemental payments for extra duties (e.g., coaching, band and orchestra assignments, club sponsorships) are not included. See Appendix A for lists of the TSDS PEIMS role IDs included in each category.
Teachers. Teachers, special duty teachers, and substitute teachers. Substitute teachers are either temporarily hired to replace a teacher or hired permanently on an as-needed basis. The District Teacher Salary Report and Graph also uses this definition in creating counts for various salary ranges.
Professional Support. Therapists, nurses, librarians, counselors, and other campus professional personnel.
Campus Administration (School Leadership). Principals, assistant principals, and other administrators reported with a specific school ID.
Central Administration. (not on campus profile) Superintendents, presidents, chief executive officers, chief administrative officers, business managers, athletic directors, and other administrators reported with a central office ID and not a specific school ID.
Instructional Staff Percent (district profile only): The percentage of the district's FTEs whose job function was to provide classroom instruction directly to students during the 2017–18 school year. The instructional staff percent is a district-level measure and is calculated as follows:
total number of hours for district staff who were reported under expenditure
object codes 6112, 6119, and 6129, and function codes 11, 12, 13, and 31
total number of hours worked by all district employees
Contact the Division of Financial Compliance at (512) 463-9095 for further details about this measure. (Data source: TSDS PEIMS 30040, 30050, and 30090)
Turnover Rate for Teachers (not on campus profile): The percentage of teachers from the fall of 2017–18 who were not employed in the district in the fall of 2018–19. It is calculated as the total FTE count of teachers from the fall of 2017–18 who were not employed in the district in the fall of 2018–19, divided by the total teacher FTE count for the fall of 2017–18. Staff who remained employed in the district but not as teachers also count toward teacher turnover. (Data source: TSDS PEIMS 30050 and 30090)
Staff Exclusions (not on campus profile): The counts of individuals who serve public school students but are not included in the FTE totals for any of the other employee statistics. There are two types of these entries: individuals participating in a shared services arrangement and individuals on contract with the district to provide instructional services. Shared Services Arrangement (SSA) Staff are staff who work in schools located in districts other than their employing district or whose assigned organization (in TSDS PEIMS) shows a code of 751, indicating that they are employed by the fiscal agent of an SSA. Only the portion of a person’s total FTE amount associated with the school in another district (or with the 751 organization code) is counted as SSA. SSA staff are grouped into three categories: Professional Staff (which includes teachers, administrators, and professional support); Educational Aides; and Auxiliary Staff. Note
18-19 AAR Page 659
Comprehensive Glossary 2018–19 Texas Academic Performance Report
Texas Education Agency | Governance and Accountability | Performance Reporting 36 of 48
that SSA Auxiliary Staff are identified by the type of fund from which they are paid. Contracted Instructional Staff (District and Campus Profiles) refers to counts of instructors for whom the district has entered into a contractual agreement with some outside organization. Through the contract, the outside organization has committed to supplying instructional staff for the district. They are never employees of the reporting school district. (Data source: TSDS PEIMS 30055 and 30060)
Contracted Instructional Staff: The count of individuals who are not regular classroom teachers who have signed a contract with a district, nor are they shared services arrangement employees. Rather, these are instructors for whom the district has entered into a contractual agreement with an outside organization. Through the contract the outside organization has committed to supplying instructional staff for the district. They include, but are not limited to, speech therapists, occupational therapists, and any other professional contracted staff working in a classroom on a dedicated basis.
Student Enrollment by Program: The count and percentage of students served in programs and/or courses for special education, career and technical education, bilingual/ESL education, or gifted and talented education. The percentages do not total to 100 because students may participate in more than one of these programs. (Data source: TSDS PEIMS 40110, 41163 and 41169)
Teachers by Program (population served): The FTE count of teachers categorized by the type of student populations served: regular, special, compensatory, career and technical, bilingual/ESL, gifted and talented education students, and other populations. Teacher FTE values are allocated across population types for teachers who serve multiple population types. Percentages are expressed as a percentage of total teacher FTEs. (Data source: TSDS PEIMS 30040, 30050 and 30090)
Kindergarten Readiness Kindergarten (KG) Ready: Assessed kindergarten students who met or exceeded the cut-off score for a particular assessment on the Commissioner’s List of Reading Instruments. Kindergarten readiness for each assessment is assessed differently across multiple assessment domains with varying benchmarks/cut-off scores of readiness. A student must pass all required assessment domains to be considered kindergarten ready. For school years 2013–14 through 2018–19, readiness is based on the literacy assessment only and does not provide comprehensive information on student readiness across important developmental domains.
Assessed Students in KG: Kindergarten students enrolled in the Texas public school system as of the Fall Snapshot date (the last Friday in October of each year) who were administered, at the beginning of year (BOY) administration, an assessment on the Commissioner’s List of Reading Instruments. Students may take multiple assessments.
Eligible Students: Kindergarten students who met at least one of the public prekindergarten (PK) eligibility criteria during the kindergarten year—economically disadvantaged, English learner (EL), homeless, is or ever has been in foster care, is the child of an active duty member of the armed forces of the United States, or is the child of a member of the armed forces who was injured or killed while on active duty—not the actual eligibility as of the PK year. PK eligibility is based on a student’s status as of his/her kindergarten year as there are no comprehensive data concerning PK eligibility for children who did not attend public PK.
Eligible Students Who Attended PK: Kindergarten students determined to be kindergarten ready based on assessment results, who were eligible to attend PK and did attend public PK the prior school year.
18-19 AAR Page 660

Comprehensive Glossary 2018–19 Texas Academic Performance Report
Texas Education Agency | Governance and Accountability | Performance Reporting 37 of 48
Eligible Students Who Did Not Attend PK: Kindergarten students who were eligible to attend public PK but did not attend public PK the prior school year.
Students Who Were Not Eligible for PK: Kindergarten students who were assessed for kindergarten readiness and were not eligible for public PK.
Students Ready for KG: Count of all assessed kindergarten students who were determined to be kindergarten ready based on assessment results.
Student Assessed in KG: Count of all kindergarten students who were assessed for kindergarten readiness.
Percent Ready: Percentage of all assessed kindergarten students who were determined to be kindergarten ready based on assessment results.
number of kindergarten ready students
all kindergarten students who were assessed for kindergarten readiness
18-19 AAR Page 661
Comprehensive Glossary 2018–19 Texas Academic Performance Report
Texas Education Agency | Governance and Accountability | Performance Reporting 38 of 48
Who to Call Information about the calculation of all Texas Academic Performance Report (TAPR) data elements is provided in this Glossary. If, after reading the Glossary you have questions about the calculation of TAPR indicators, contact Performance Reporting at (512) 463-9704.
Questions related to programs and policies for the following subjects should be directed to the contacts listed below.
Subject Contact Number Accountability Ratings Performance Reporting .............................................. (512) 463-9704 Advanced Courses Curriculum ...................................................................... (512) 463-9581 Charter Schools Charter Schools ............................................................. (512) 463-9575 College Admissions Tests: SAT College Board ................................................................. (512) 721-1800 ACT ACT ..................................................................................... (319) 337-1270 Copies of TAPR reports https://rptsvr1.tea.texas.gov/perfreport/tapr/index.html DAEP (Disciplinary Alternative Education Program) Discipline, Law, and Order ........................................ (512) 463-9286 Distinguished Achievement Program Curriculum ...................................................................... (512) 463-9581 Distinction Designations Performance Reporting .............................................. (512) 463-9704 Dropouts Accountability Research ............................................ (512) 475-3523 English Learners Testing Issues Student Assessment .................................................... (512) 463-9536 Other Issues Special Populations ...................................................... (512) 463-9414 Financial Standard Reports State Funding ................................................................. (512) 463-9238 General Inquiry General Inquiries .......................................................... (512) 463-9290 Graduates Accountability Research ............................................ (512) 475-3523 Graduates Enrolled in Texas IHE Texas Higher Education Coordinating Board ... (512) 427-6101 JJAEP (Juvenile Justice Alternative Education Program) Discipline, Law, and Order ........................................ (512) 463-9286 Federal Accountability Federal and State Education Policy ....................... (512) 463-9414 RDA Special Education Monitoring Results Status Results Driven Accountability ................................. (512) 463-9704 PEIMS (TSDS PEIMS) PEIMS HelpLine ............................................................. (512) 463-9229 Recommended High School Program Curriculum ...................................................................... (512) 463-9581 Retention Policy Curriculum ...................................................................... (512) 463-9581 School Finance State Funding ................................................................. (512) 463-9238 School Governance School Governance ....................................................... (512) 463-9623 School Report Card Performance Reporting .............................................. (512) 463-9704 Special Education Testing Issues Student Assessment .................................................... (512) 463-9536 Other Issues Special Populations ...................................................... (512) 463-9414 STAAR (all assessments) Student Assessment .................................................... (512) 463-9536 STAAR Testing Contractor ETS ..................................................................................... (855) 333-7770 Pearson ............................................................................. (800) 328-5999 Austin Operational Center ........................................ (512) 989-5300 Statutory (Legal) Issues Legal Services ................................................................. (512) 463-9720 Effective Schools Framework School Improvement ................................................... (512) 463-5226 TELPAS Student Assessment .................................................... (512) 463-9536
18-19 AAR Page 662
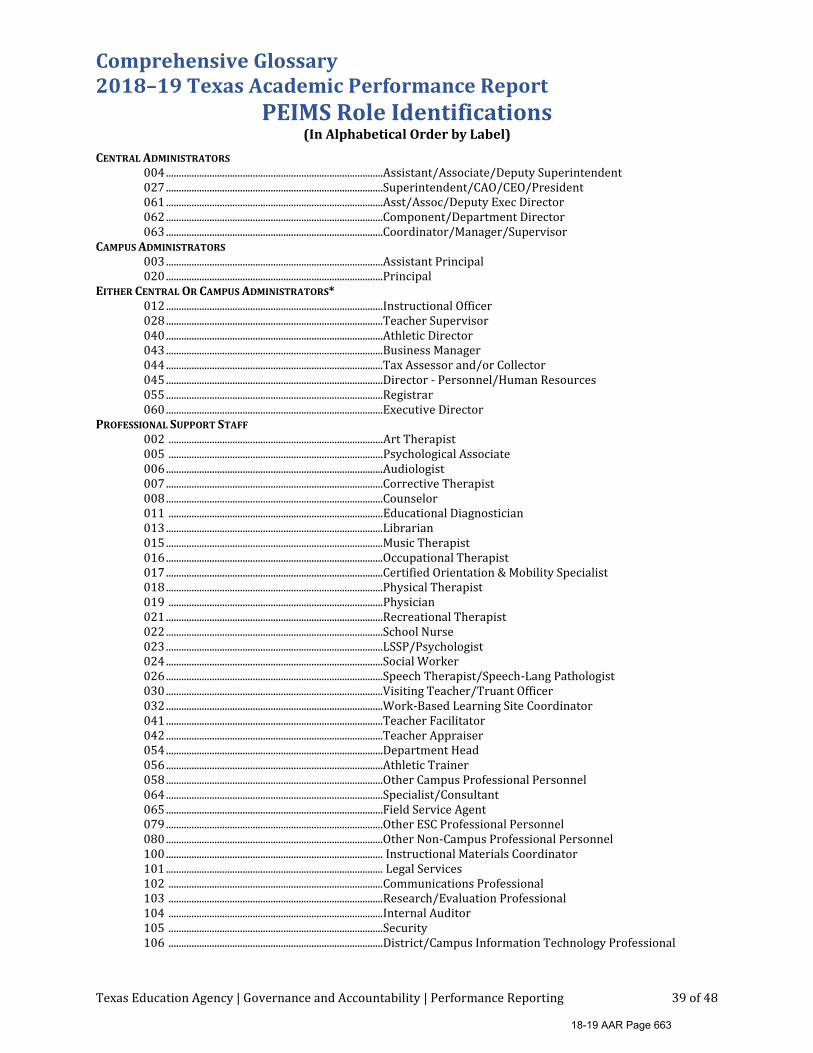
Comprehensive Glossary 2018–19 Texas Academic Performance Report
Texas Education Agency | Governance and Accountability | Performance Reporting 39 of 48
PEIMS Role Identifications (In Alphabetical Order by Label)
CENTRAL ADMINISTRATORS 004 .....................................................................................Assistant/Associate/Deputy Superintendent 027 .....................................................................................Superintendent/CAO/CEO/President 061 .....................................................................................Asst/Assoc/Deputy Exec Director 062 .....................................................................................Component/Department Director 063 .....................................................................................Coordinator/Manager/Supervisor CAMPUS ADMINISTRATORS 003 .....................................................................................Assistant Principal 020 .....................................................................................Principal EITHER CENTRAL OR CAMPUS ADMINISTRATORS* 012 .....................................................................................Instructional Officer 028 .....................................................................................Teacher Supervisor 040 .....................................................................................Athletic Director 043 .....................................................................................Business Manager 044 .....................................................................................Tax Assessor and/or Collector 045 .....................................................................................Director - Personnel/Human Resources 055 .....................................................................................Registrar 060 .....................................................................................Executive Director PROFESSIONAL SUPPORT STAFF 002 ....................................................................................Art Therapist 005 ....................................................................................Psychological Associate 006 .....................................................................................Audiologist 007 .....................................................................................Corrective Therapist 008 .....................................................................................Counselor 011 ....................................................................................Educational Diagnostician 013 .....................................................................................Librarian 015 .....................................................................................Music Therapist 016 .....................................................................................Occupational Therapist 017 .....................................................................................Certified Orientation & Mobility Specialist 018 .....................................................................................Physical Therapist 019 ....................................................................................Physician 021 .....................................................................................Recreational Therapist 022 .....................................................................................School Nurse 023 .....................................................................................LSSP/Psychologist 024 .....................................................................................Social Worker 026 .....................................................................................Speech Therapist/Speech-Lang Pathologist 030 .....................................................................................Visiting Teacher/Truant Officer 032 .....................................................................................Work-Based Learning Site Coordinator 041 .....................................................................................Teacher Facilitator 042 .....................................................................................Teacher Appraiser 054 .....................................................................................Department Head 056 .....................................................................................Athletic Trainer 058 .....................................................................................Other Campus Professional Personnel 064 .....................................................................................Specialist/Consultant 065 .....................................................................................Field Service Agent 079 .....................................................................................Other ESC Professional Personnel 080 .....................................................................................Other Non-Campus Professional Personnel 100 ..................................................................................... Instructional Materials Coordinator 101 ..................................................................................... Legal Services 102 ....................................................................................Communications Professional 103 ....................................................................................Research/Evaluation Professional 104 ....................................................................................Internal Auditor 105 ....................................................................................Security 106 ....................................................................................District/Campus Information Technology Professional
18-19 AAR Page 663
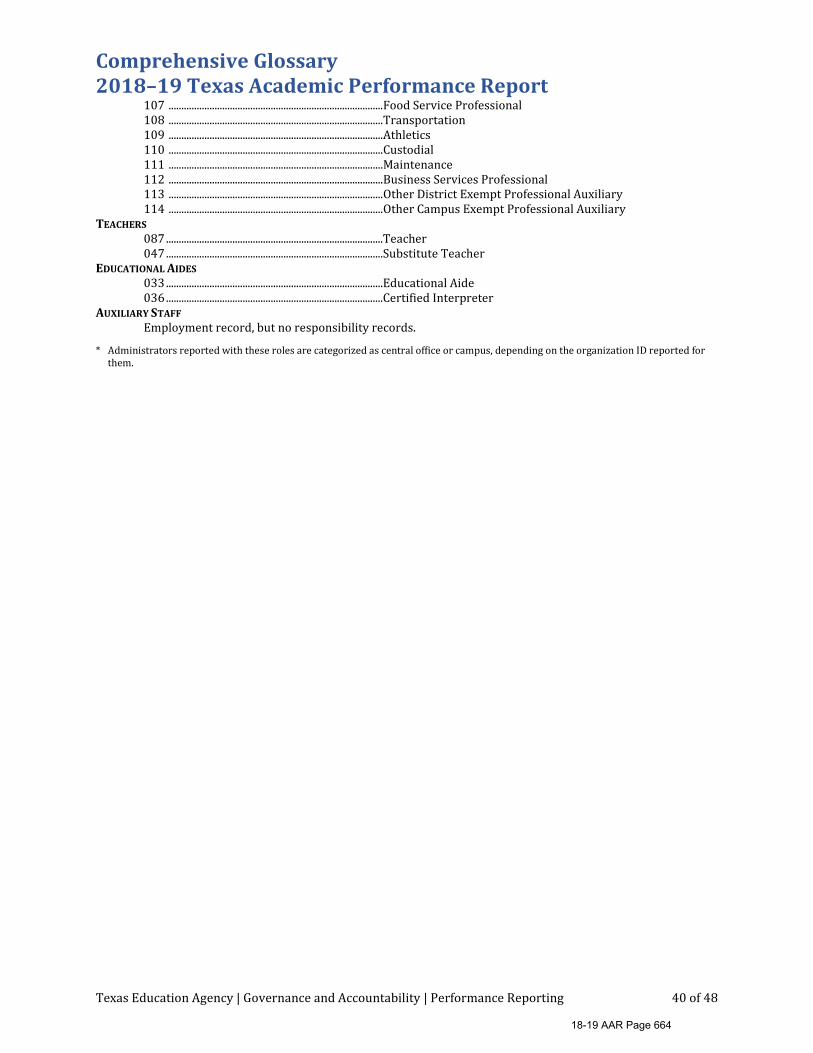
Comprehensive Glossary 2018–19 Texas Academic Performance Report
Texas Education Agency | Governance and Accountability | Performance Reporting 40 of 48
107 ....................................................................................Food Service Professional 108 ....................................................................................Transportation 109 ....................................................................................Athletics 110 ....................................................................................Custodial 111 ....................................................................................Maintenance 112 ....................................................................................Business Services Professional 113 ....................................................................................Other District Exempt Professional Auxiliary 114 ....................................................................................Other Campus Exempt Professional Auxiliary TEACHERS 087 .....................................................................................Teacher 047 .....................................................................................Substitute Teacher EDUCATIONAL AIDES 033 .....................................................................................Educational Aide 036 .....................................................................................Certified Interpreter AUXILIARY STAFF Employment record, but no responsibility records. * Administrators reported with these roles are categorized as central office or campus, depending on the organization ID reported for
them.
18-19 AAR Page 664

Comprehensive Glossary 2018–19 Texas Academic Performance Report
Texas Education Agency | Governance and Accountability | Performance Reporting 41 of 48
Advanced Academic Courses 2018–19 Texas Academic Performance Report
• All courses shown were for the 2018–19 school year.
• An “A” prefix indicates a College Board Advanced Placement course.
• An “I” prefix indicates an International Baccalaureate course.
• Dual-credit courses are not specifically shown on this list.
English Language Arts 03221100 Research/Technical Writing 03221200 Creative Writing 03221500 Literary Genres 03221600 Humanities (First Time Taken) 03221800 Independent Study In English (First Time Taken) 03231000 Independent Study In Journalism (First Time Taken) 03231902 Advanced Broadcast Journalism III 03240400 Oral Interpretation III 03240800 Debate III 03241100 Public Speaking III 03241200 Independent Study In Speech (First Time Taken) A3220100 AP English Language and Composition A3220200 AP English Literature and Composition I3220300 IB English III I3220400 IB English IV
Mathematics 03101100 Pre Calculus 03102500 Independent Study In Mathematics (First Time Taken) 03102501 Independent Study In Mathematics (Second Time Taken) 03580370 Discrete Math for Computer Science 03580395 Robotics Programming and Design 12701410 Applied Math for Tech Professionals 13001000 Math Appl in Ag/Food and Nat/Resources 13016700 Accounting II 13016900 Statistical and Business Decision Making 13018000 Financial Mathematics 13020970 Math for Medical Professionals 13032950 Manufacturing Engineering Technology II 13036700 Engineering Mathematics 13037050 Robotics II 13037600 Digital Electronics A3100101 AP Calculus AB
18-19 AAR Page 665
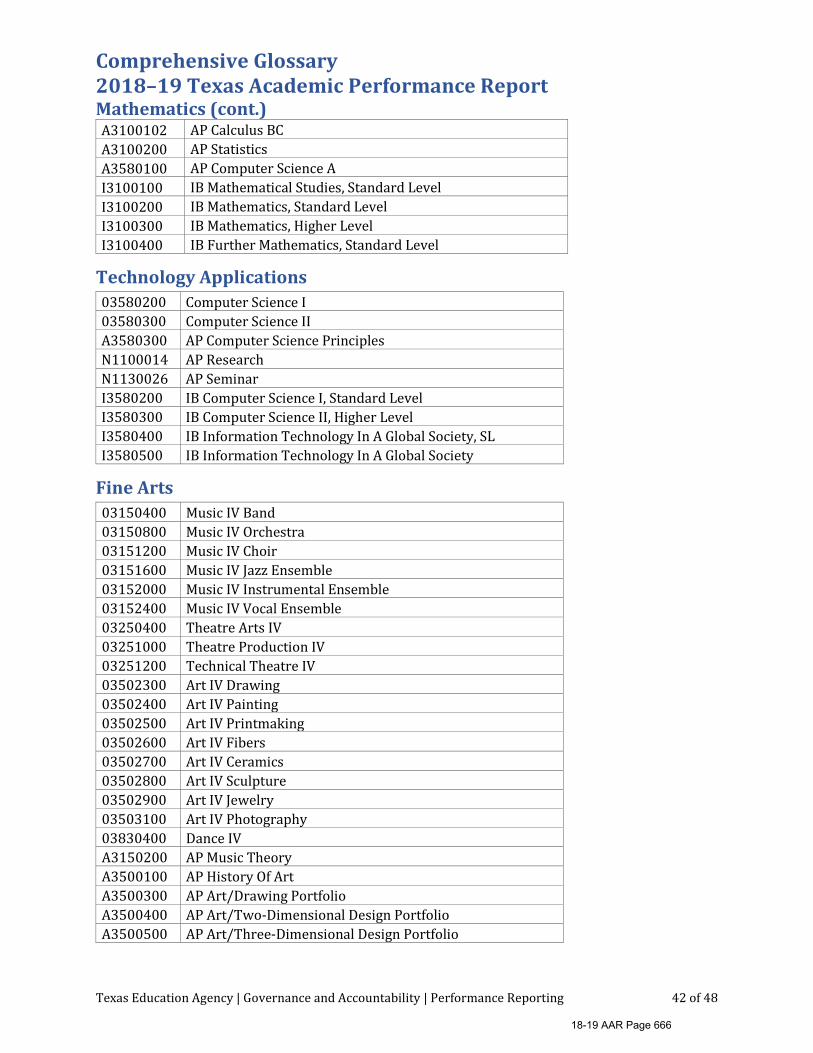
Comprehensive Glossary 2018–19 Texas Academic Performance Report
Texas Education Agency | Governance and Accountability | Performance Reporting 42 of 48
Mathematics (cont.) A3100102 AP Calculus BC
A3100200 AP Statistics A3580100 AP Computer Science A I3100100 IB Mathematical Studies, Standard Level I3100200 IB Mathematics, Standard Level I3100300 IB Mathematics, Higher Level I3100400 IB Further Mathematics, Standard Level
Technology Applications 03580200 Computer Science I 03580300 Computer Science II A3580300 AP Computer Science Principles N1100014 AP Research N1130026 AP Seminar I3580200 IB Computer Science I, Standard Level I3580300 IB Computer Science II, Higher Level I3580400 IB Information Technology In A Global Society, SL I3580500 IB Information Technology In A Global Society
Fine Arts 03150400 Music IV Band 03150800 Music IV Orchestra 03151200 Music IV Choir 03151600 Music IV Jazz Ensemble 03152000 Music IV Instrumental Ensemble 03152400 Music IV Vocal Ensemble 03250400 Theatre Arts IV 03251000 Theatre Production IV 03251200 Technical Theatre IV 03502300 Art IV Drawing 03502400 Art IV Painting 03502500 Art IV Printmaking 03502600 Art IV Fibers 03502700 Art IV Ceramics 03502800 Art IV Sculpture 03502900 Art IV Jewelry 03503100 Art IV Photography 03830400 Dance IV A3150200 AP Music Theory A3500100 AP History Of Art A3500300 AP Art/Drawing Portfolio A3500400 AP Art/Two-Dimensional Design Portfolio A3500500 AP Art/Three-Dimensional Design Portfolio
18-19 AAR Page 666

Comprehensive Glossary 2018–19 Texas Academic Performance Report
Texas Education Agency | Governance and Accountability | Performance Reporting 43 of 48
Fine Arts (cont.) I3250200 IB Music, Standard Level I3250300 IB Music, Higher Level I3600100 IB Visual Art/Design, Higher Level I3600200 IB Visual Art/Design, Standard Level-A I3750200 IB Theatre Arts, Standard Level I3750300 IB Theatre Arts, Higher Level I3830100 IB Dance, Standard Level I3830200 IB Dance, Higher Level
Science A3010200 AP Biology A3020000 AP Environmental Science A3040000 AP Chemistry A3050003 AP Physics I: Algebra Based A3050004 AP Physics II: Algebra Based A3050005 AP Physics C: Electricity and Magnetism A3050006 AP Physics C: Mechanics I3010201 IB Biology, Standard Level I3010202 IB Biology, Higher Level I3020000 IB Environmental Systems and Societies I3030001 IB Design Technology, Standard Level I3030002 IB Design Technology, Higher Level I3040002 IB Chemistry, Standard Level I3040003 IB Chemistry, Higher Level I3050002 IB Physics, Standard Level I3050003 IB Physics, Higher Level 13000700 Advanced Animal Science 13002100 Advanced Plant and Soil Science 13020600 Anatomy and Physiology 13020700 Medical Microbiology 13020800 Pathophysiology 13023000 Food Science 13029500 Forensic Science 13036400 Biotechnology I 13036450 Biotechnology II 13037100 Principles of Technology 13037200 Scientific Research and Design 13037210 Scientific Research and Design II 13037220 Scientific Research and Design III 13037300 Engineering Design and Problem Solving 13037500 Engineering Science
18-19 AAR Page 667

Comprehensive Glossary 2018–19 Texas Academic Performance Report
Texas Education Agency | Governance and Accountability | Performance Reporting 44 of 48
Social Studies/History A3310100 AP Microeconomics A3310200 AP Macroeconomics A3330100 AP United States Government and Politics A3330200 AP Comparative Government and Politics A3340100 AP United States History A3340200 AP European History A3350100 AP Psychology A3360100 AP Human Geography A3360200 AP Human Geography (Elective) A3370100 AP World History I3301100 IB History, Standard Level I3301200 IB History: Africa, Higher Level I3301300 IB History: Americas, Higher Level I3301400 IB History: East and Southeast Asia, Higher Level I3301500 IB History: Europe, Higher Level I3302100 IB Geography, Standard Level I3302200 IB Geography, Higher Level I3303100 IB Economics, Standard Level I3303200 IB Economics, Higher Level I3303300 IB Business and Management I I3303400 IB Business and Management II I3304100 IB Psychology, Standard Level I3304200 IB Psychology, Higher Level I3366010 IB Philosophy
03310301 Economics Advanced Studies (First Time Taken) 03380001 Social Studies Advanced Studies (First Time Taken)
Advanced Languages (Modern or Classical)
03110400 Arabic IV 03110500 Arabic V 03110600 Arabic VI 03110700 Arabic VII 03110910 Adv, 1st Time, Arabic 03110920 Adv, 2nd Time, Arabic 03110930 Adv, 3rd Time, Arabic 03120400 Japanese IV 03120500 Japanese V 03120600 Japanese VI 03120700 Japanese VII 03120910 Adv, 1st Time, Japanese
18-19 AAR Page 668
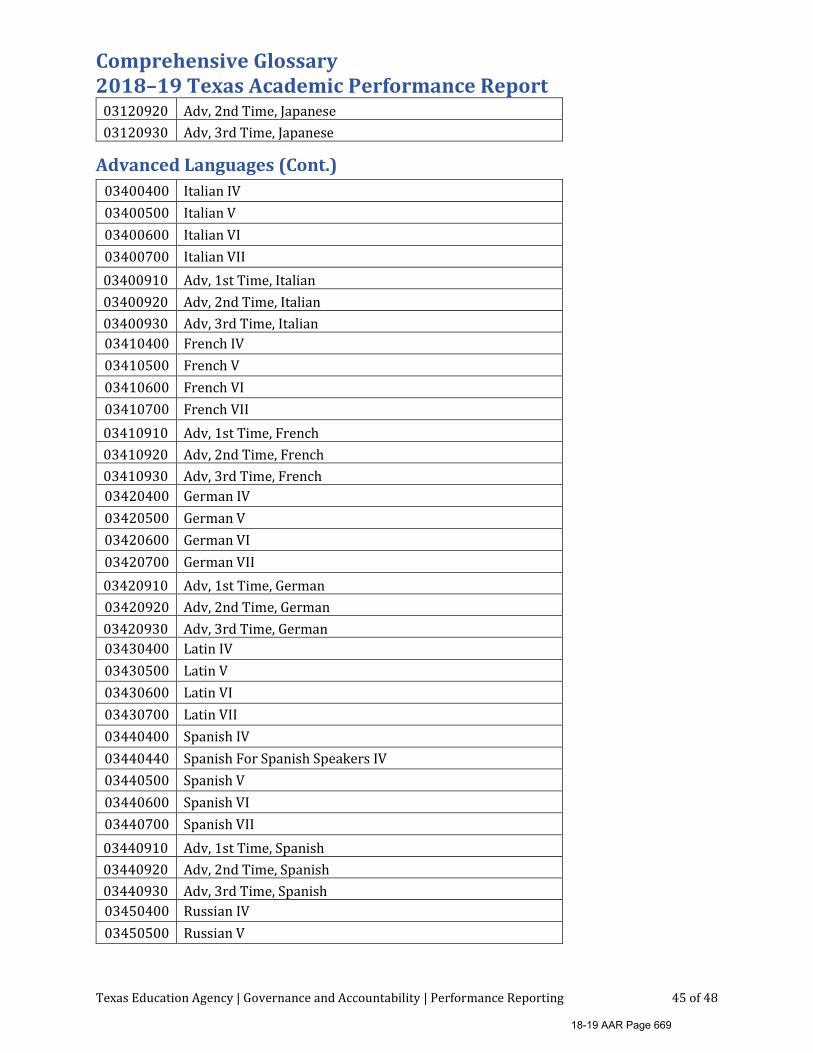
Comprehensive Glossary 2018–19 Texas Academic Performance Report
Texas Education Agency | Governance and Accountability | Performance Reporting 45 of 48
03120920 Adv, 2nd Time, Japanese 03120930 Adv, 3rd Time, Japanese
Advanced Languages (Cont.) 03400400 Italian IV 03400500 Italian V 03400600 Italian VI 03400700 Italian VII 03400910 Adv, 1st Time, Italian 03400920 Adv, 2nd Time, Italian 03400930 Adv, 3rd Time, Italian 03410400 French IV 03410500 French V 03410600 French VI 03410700 French VII 03410910 Adv, 1st Time, French 03410920 Adv, 2nd Time, French 03410930 Adv, 3rd Time, French 03420400 German IV 03420500 German V 03420600 German VI 03420700 German VII 03420910 Adv, 1st Time, German 03420920 Adv, 2nd Time, German 03420930 Adv, 3rd Time, German 03430400 Latin IV 03430500 Latin V 03430600 Latin VI 03430700 Latin VII 03440400 Spanish IV 03440440 Spanish For Spanish Speakers IV 03440500 Spanish V 03440600 Spanish VI 03440700 Spanish VII 03440910 Adv, 1st Time, Spanish 03440920 Adv, 2nd Time, Spanish 03440930 Adv, 3rd Time, Spanish 03450400 Russian IV 03450500 Russian V
18-19 AAR Page 669
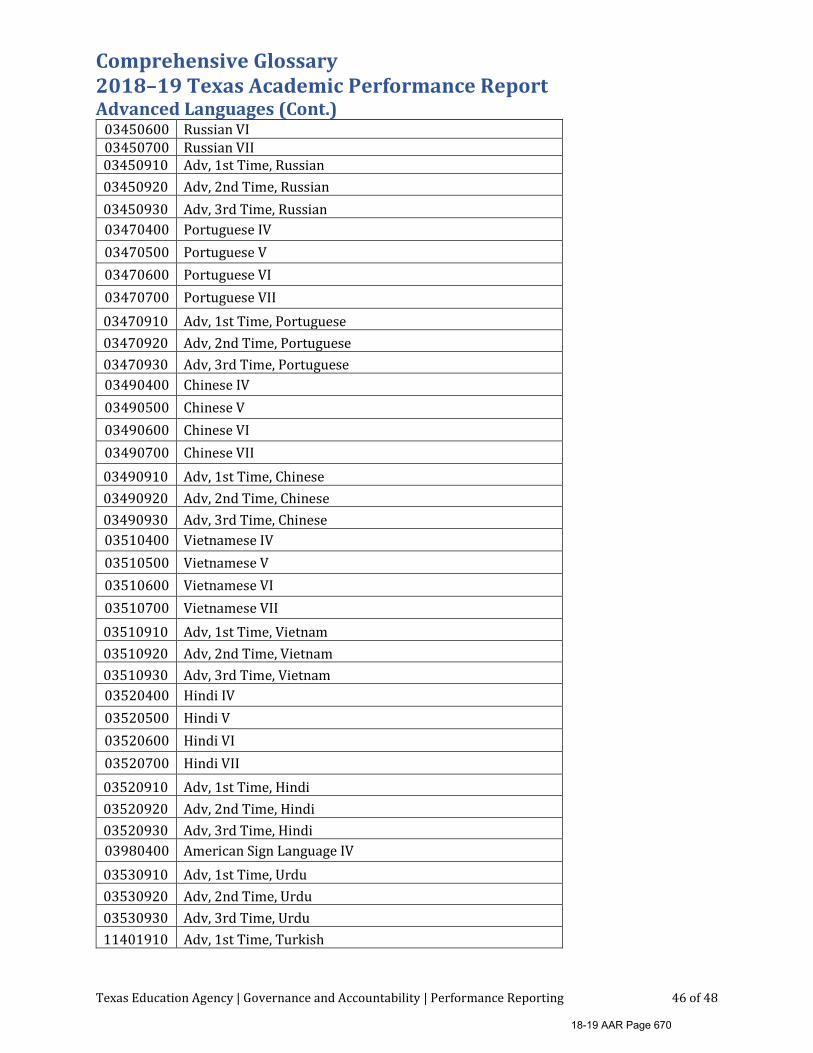
Comprehensive Glossary 2018–19 Texas Academic Performance Report
Texas Education Agency | Governance and Accountability | Performance Reporting 46 of 48
Advanced Languages (Cont.) 03450600 Russian VI 03450700 Russian VII 03450910 Adv, 1st Time, Russian 03450920 Adv, 2nd Time, Russian 03450930 Adv, 3rd Time, Russian 03470400 Portuguese IV 03470500 Portuguese V 03470600 Portuguese VI 03470700 Portuguese VII 03470910 Adv, 1st Time, Portuguese 03470920 Adv, 2nd Time, Portuguese 03470930 Adv, 3rd Time, Portuguese 03490400 Chinese IV 03490500 Chinese V 03490600 Chinese VI 03490700 Chinese VII 03490910 Adv, 1st Time, Chinese 03490920 Adv, 2nd Time, Chinese 03490930 Adv, 3rd Time, Chinese 03510400 Vietnamese IV 03510500 Vietnamese V 03510600 Vietnamese VI 03510700 Vietnamese VII 03510910 Adv, 1st Time, Vietnam 03510920 Adv, 2nd Time, Vietnam 03510930 Adv, 3rd Time, Vietnam 03520400 Hindi IV 03520500 Hindi V 03520600 Hindi VI 03520700 Hindi VII 03520910 Adv, 1st Time, Hindi 03520920 Adv, 2nd Time, Hindi 03520930 Adv, 3rd Time, Hindi 03980400 American Sign Language IV 03530910 Adv, 1st Time, Urdu 03530920 Adv, 2nd Time, Urdu 03530930 Adv, 3rd Time, Urdu 11401910 Adv, 1st Time, Turkish
18-19 AAR Page 670

Comprehensive Glossary 2018–19 Texas Academic Performance Report
Texas Education Agency | Governance and Accountability | Performance Reporting 47 of 48
Advanced Languages (Cont.) 11401920 Adv, 2nd Time, Turkish 11401930 Adv, 3rd Time, Turkish 11403610 Adv, 1st Time, Korean 11403620 Adv, 2nd Time, Korean 11403630 Adv, 3rd Time, Korean 03996000 Other Foreign Languages Level IV 03996100 Other Foreign Languages Level V 03996200 Other Foreign Languages Level VI 03996300 Other Foreign Languages Level VII A3120400 AP Japanese IV A3400400 AP Italian IV A3410100 AP French IV A3420100 AP German IV A3430100 AP Latin IV A3440100 AP Spanish IV A3440200 AP Spanish V A3490400 AP Chinese IV I3110400 IB Arabic IV I3110500 IB Arabic V I3120400 IB Japanese IV I3120500 IB Japanese V I3410400 IB French IV I3410500 IB French V I3420400 IB German IV I3420500 IB German V I3430400 IB Latin IV I3430500 IB Latin V I3440400 IB Spanish IV I3440500 IB Spanish V I3440600 IB Spanish VI I3440700 IB Spanish VII I3450400 IB Russian IV I3450500 IB Russian V I3480400 IB Hebrew IV I3480500 IB Hebrew V I3490400 IB Chinese IV
18-19 AAR Page 671
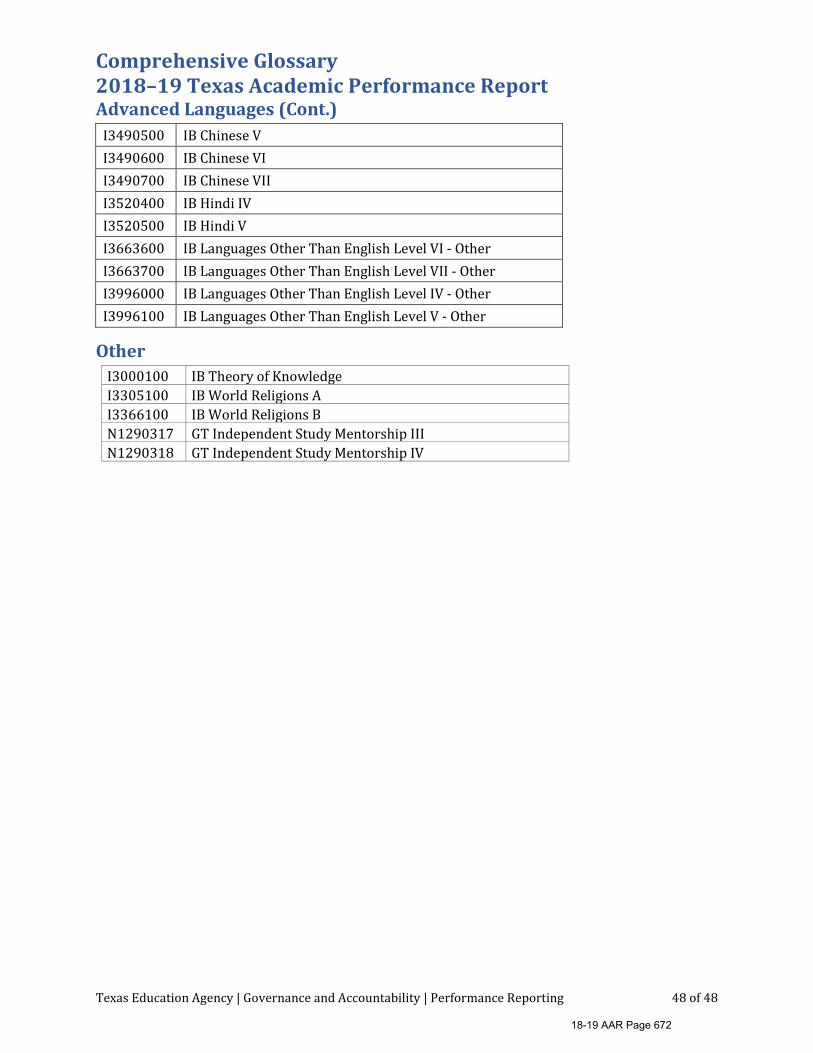
Comprehensive Glossary 2018–19 Texas Academic Performance Report
Texas Education Agency | Governance and Accountability | Performance Reporting 48 of 48
Advanced Languages (Cont.) I3490500 IB Chinese V I3490600 IB Chinese VI I3490700 IB Chinese VII I3520400 IB Hindi IV I3520500 IB Hindi V I3663600 IB Languages Other Than English Level VI - Other I3663700 IB Languages Other Than English Level VII - Other I3996000 IB Languages Other Than English Level IV - Other I3996100 IB Languages Other Than English Level V - Other
Other I3000100 IB Theory of Knowledge I3305100 IB World Religions A I3366100 IB World Religions B N1290317 GT Independent Study Mentorship III N1290318 GT Independent Study Mentorship IV
18-19 AAR Page 672