Embed Size (px)
Citation preview

WILLIAMSBURG-JAMES CITY COUNTY PUBLIC SCHOOLS
WILLIAMSBURG-JAMES CITY COUNTY PUBLIC SCHOOLS
BOUNDARY OPTIONS PRESENTATION
1/16/2018

WILLIAMSBURG-JAMES CITY COUNTY PUBLIC SCHOOLS 1
2 N D M I D D L E S C H O O L S U RV E Y
• On November 30th and December 5th, Community Dialogues were held to collect feedback from communitymembers regarding redistricting options at both the middle and high school levels. In total, 19 community membersattended the middle school sessions and 106 community members attended the high school sessions. 751 responseswere collected for middle school options and 1,681 responses were collected for high school options. The surveywas available for two weeks.
• The School Board reviewed the results of the initial survey, and requested that an option be created to betterbalance the socioeconomics of the Division. Three additional options were presented. After review, the Boarddecided to move forward with Option #2 and Option #4.
• The results to the survey regarding Option #2 and #4 are on the following pages. The survey was available for 10days. In total, 249 community members provided input.

WILLIAMSBURG-JAMES CITY COUNTY PUBLIC SCHOOLS 2
Option 2Strongly Support 64Support 54Neutral 47Oppose 44Strongly Oppose 37
Option 4Strongly Support 58Support 48Neutral 36Oppose 27Strongly Oppose 49
64 54 47 44 37
58 48 36 27 49
0% 10% 20% 30% 40% 50% 60% 70% 80% 90% 100%
Option 2
Option 4
Strongly Support Support Neutral Oppose Strongly Oppose
Question #1 & #3Please share your level of support for Middle School Option 2 and 4.

WILLIAMSBURG-JAMES CITY COUNTY PUBLIC SCHOOLS 3
Question #5Which is your preferred option?
Preferred Option
Option 2 96
Option 4 101
96
3
101
0 20 80 100 120
Option 2
Option 4
Preferred Option40 60

WILLIAMSBURG-JAMES CITY COUNTY PUBLIC SCHOOLS 4
D E M O G R A P H I C Q U E S T I O N S
Are you a resident of Williamsburg and/or James City County?
Yes 207
No 4
How many years have you lived in the county and/or city?
Less than 2 17
2-5 47
6-10 41
11-15 45
16 - 20 26
More than 20 30
Not Applicable 6
Parental/Guardian/Student Status
Do not have children in theDivision 21
Parent/guardian of a child less than 5 28
Parent/guardian of a K-4th grade student 81
Parent/guardian of a 5th grade student 3 7
Parent/guardian of a 6th-7th grade student 75
Parent/guardian of a 8th grade student 3 4
Parent/guardian of a 9th-11th grade student 4 0
Parent/guardian of a 12th grade student 14
Parent/guardian of a private/parochial student 2
Parent/guardian of a former student or graduate of the Division 27
Grandparent of a current student or graduate 8
Current student 7
Did you respond to the first Middle School Redistricting Survey?
Yes 151
No 61

WILLIAMSBURG-JAMES CITY COUNTY PUBLIC SCHOOLS 5
D E M O G R A P H I C Q U E S T I O N S
Other (please specify):• Covenant Christian• Covenant Christian School• Hampton Roads Academy• My two sons attended the old James Blair Middle School• private school• Should not matter• students have attended: Blair (last year open), Hornsby,
Toano, Norge, Matoaka, & Warhill...adult worked for Norge and Hornsby
• What does it matter• Will be JBB next school year• Williamsburg Montessori School, Providence Classical School
School Affiliation
Stonehouse ES 8
Norge ES 16
Blayton ES 22
D.J. Montague ES 24
Clara Byrd Baker ES 22
Matoaka ES 23
Matthew Whaley ES 20
Rawls Byrd ES 11
James River ES 5
Berkeley MS 45
Hornsby MS 66
Toano MS 26
Jamestown HS 39
Lafayette HS 37
Warhill HS 22
Other (please specify) 10

WILLIAMSBURG-JAMES CITY COUNTY PUBLIC SCHOOLS
MIDDLE SCHOOLOPTIONS

WILLIAMSBURG-JAMES CITY COUNTY PUBLIC SCHOOLS 7
C U R R E N T M I D D L E S C H O O L B O U N D A R I E S
CURRENT 2018-19 CURRENT 2018-19 CURRENT 2018-19Middle SchoolsBerkeley 779 870 902 112% 116% 51% 53%BlairHornsby 952 922 880 97% 92% 20% 22%Toano 790 841 818 106% 104% 31% 34%Total 2,521 2,633 2,600 104% 103% 34% 36%
SES - GradeEnrollment UtilizationCurrent Capacity
*18-19 School Year is determined by grade-advancing current students (i.e. studentscurrently in grades 5th, 6th, and 7th make up the 2018-19 school year enrollment count.
Criteria Alignment• Utilization is imbalanced across schools
• 5.3% of students will not attend their first or second closest school in the
2018-19 school year if boundaries remain the same
• Socioeconomic status is imbalanced across schools

WILLIAMSBURG-JAMES CITY COUNTY PUBLIC SCHOOLS 8
M I D D L E S C H O O L O P T I O N 2
Criteria Alignment• Utilization is balanced across schools
• An additional 13.3% more students will not attend their first or second
closest school in the 2018-19 school year
• Socioeconomic status by school ranges from 28% to 43%
• No additional neighborhood splits
Students ImpactedMiddle School Berkeley Blair Hornsby Toano
Berkeley 160 0 0BlairHornsby 0 169 0Toano 0 0 132
Receiving School
From
CURRENT 2018-19 CURRENT 2018-19 CURRENT 2018-19Middle SchoolsBerkeley 779 870 652 112% 84% 51% 43%Blair 608 - 511 - 84% - 39%Hornsby 952 922 815 97% 86% 20% 32%Toano 790 841 622 106% 79% 31% 28%Total 3,129 2,633 2,600 104% 83% 34% 36%
Option 2 Capacity Enrollment Utilization SES - Grade

WILLIAMSBURG-JAMES CITY COUNTY PUBLIC SCHOOLS 9
M I D D L E S C H O O L O P T I O N 2

WILLIAMSBURG-JAMES CITY COUNTY PUBLIC SCHOOLS 10
M I D D L E S C H O O L O P T I O N 4
Criteria Alignment• Utilization is balanced across schools
• An additional 14.7% more students will not attend their first or second
closest school in the 2018-19 school year
• Socioeconomic status by school ranges from 32% to 42%
• No additional neighborhood splits
CURRENT 2018-19 CURRENT 2018-19 CURRENT 2018-19Middle SchoolsBerkeley 779 870 625 112% 80% 51% 41%Blair 608 - 528 - 87% - 42%Hornsby 952 922 763 97% 80% 20% 32%Toano 790 841 684 106% 87% 31% 32%Total 3,129 2,633 2,600 104% 83% 34% 36%
Option 4 Capacity Enrollment Utilization SES - Grade
Students ImpactedMiddle School Berkeley Blair Hornsby Toano
Berkeley 151 31 0BlairHornsby 1 184 0Toano 0 0 87
Receiving School
From

WILLIAMSBURG-JAMES CITY COUNTY PUBLIC SCHOOLS 11
M I D D L E S C H O O L O P T I O N 4
WILLIAMSBURG-JAMES CITY COUNTY PUBLIC SCHOOLS 12
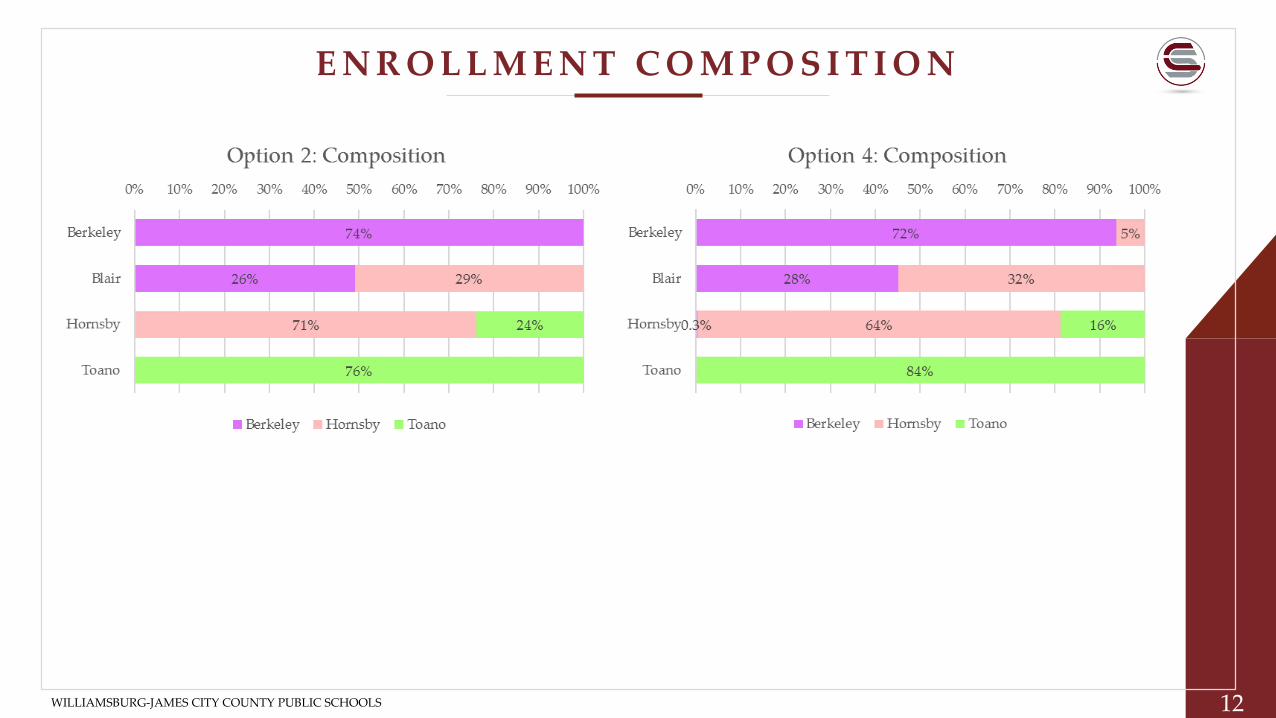
E N R O L L M E N T C O M P O S I T I O N

WILLIAMSBURG-JAMES CITY COUNTY PUBLIC SCHOOLS 13
C R I T E R I A C O M PA R I S O N
Middle Schools
UtilizationHigh - Low Difference
(Lower is more balanced)
LongevityProximity* Percentage(Higher means more students are closer)
New Neighborhood Splits
Socioeconomics PercentageHigh - Low Difference
(Lower is more balanced)Current (for comparison) 15% Poor 95% N/A 31%
Option 1 6% Good 79% None 18%Option 2 7% Good 81% None 15%Option 3 6% Good 75% None 29%
Option 4 7% Fair 80% None 10%Option 5 7% Fair 79% Yes 9%Option 6 16% Poor 79% None 10%

WILLIAMSBURG-JAMES CITY COUNTY PUBLIC SCHOOLS
WILLIAMSBURG-JAMES CITY COUNTY PUBLIC SCHOOLS
BOUNDARY OPTIONS PRESENTATION
1/16/2018