Embed Size (px)
Citation preview
William Wrigley Jr. Company: Capital
Structure, Valuation, and Cost of Capital
Allison Behuniak, Taylor Jordan, Bettina Lopes, and Thomas Testa
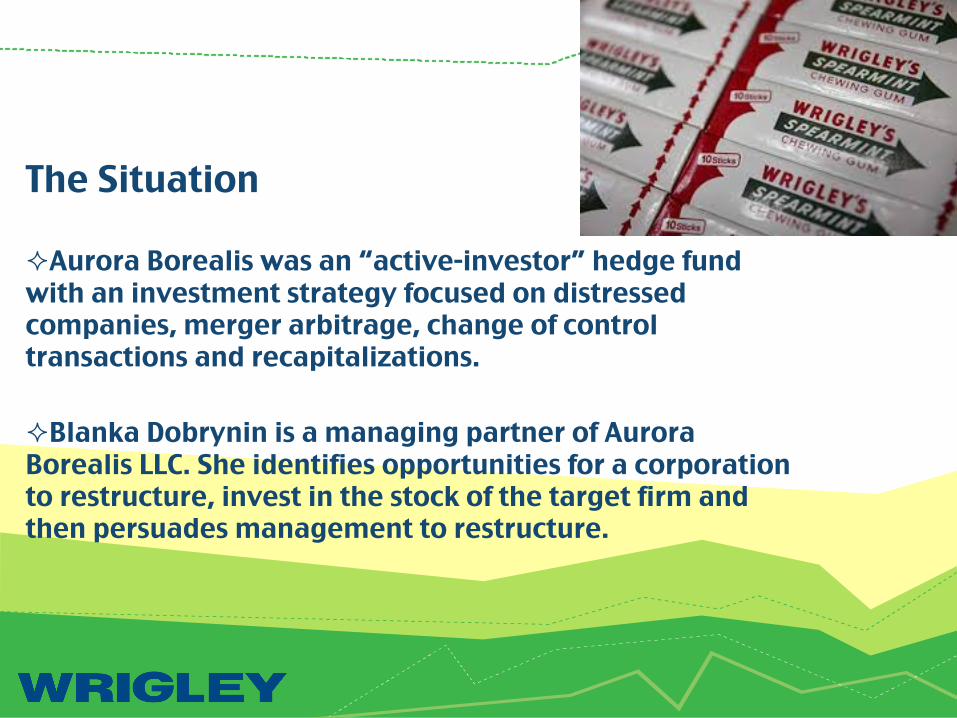
The Situation ² Aurora Borealis was an “active-investor” hedge fund with an investment strategy focused on distressed companies, merger arbitrage, change of control transactions and recapitalizations.
² Blanka Dobrynin is a managing partner of Aurora Borealis LLC. She identifies opportunities for a corporation to restructure, invest in the stock of the target firm and then persuades management to restructure.
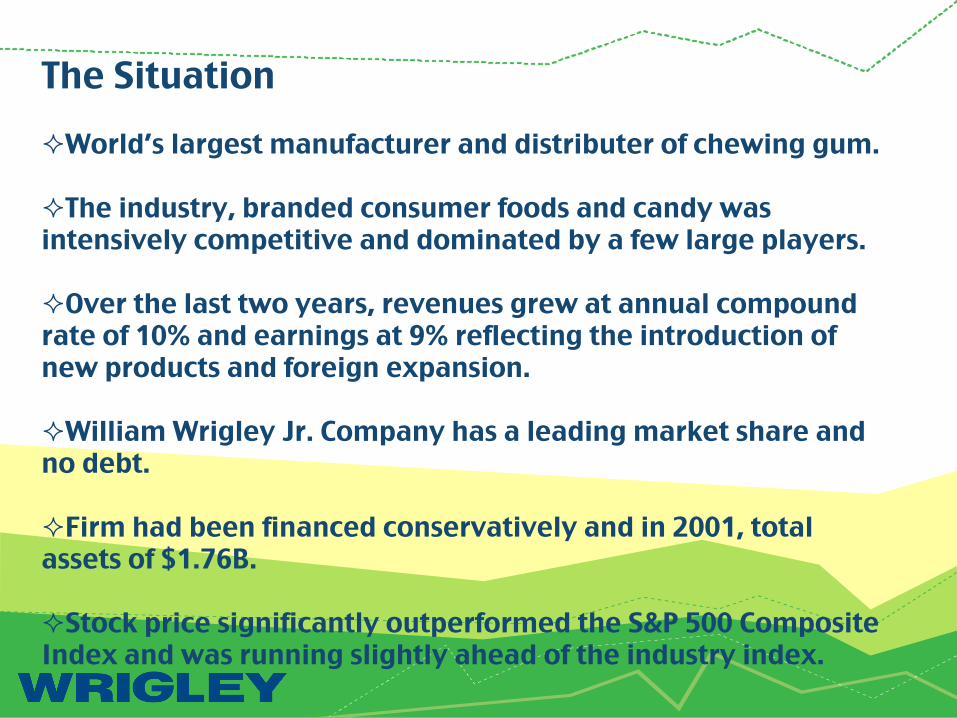
The Situation ² World’s largest manufacturer and distributer of chewing gum.
² The industry, branded consumer foods and candy was intensively competitive and dominated by a few large players.
² Over the last two years, revenues grew at annual compound rate of 10% and earnings at 9% reflecting the introduction of new products and foreign expansion. ² William Wrigley Jr. Company has a leading market share and no debt. ² Firm had been financed conservatively and in 2001, total assets of $1.76B.
² Stock price significantly outperformed the S&P 500 Composite Index and was running slightly ahead of the industry index.
Question 1: What other issues are involved with a company being underleveraged?
Answer: The company will have insufficient debt in its capital structure. Because bond interest is deductible for tax purposes and is generally a fixed amount for a long period of time, some use of debt can often result in greater share price for stockholders. Companies are missing opportunities to create value for the shareholders.
Issue Dividends or Repurchase Stocks? ² Due to the low interest rates, Auro Borealis LLC. is suggesting Wrigley take on $3B in debt and use it to pay equivalent dividend or to repurchase an equivalent value of shares.
² We are going to examine the effect of both on the firms share value, cost of capital, debt coverage, EPS, voting rights and financial distress of the company.
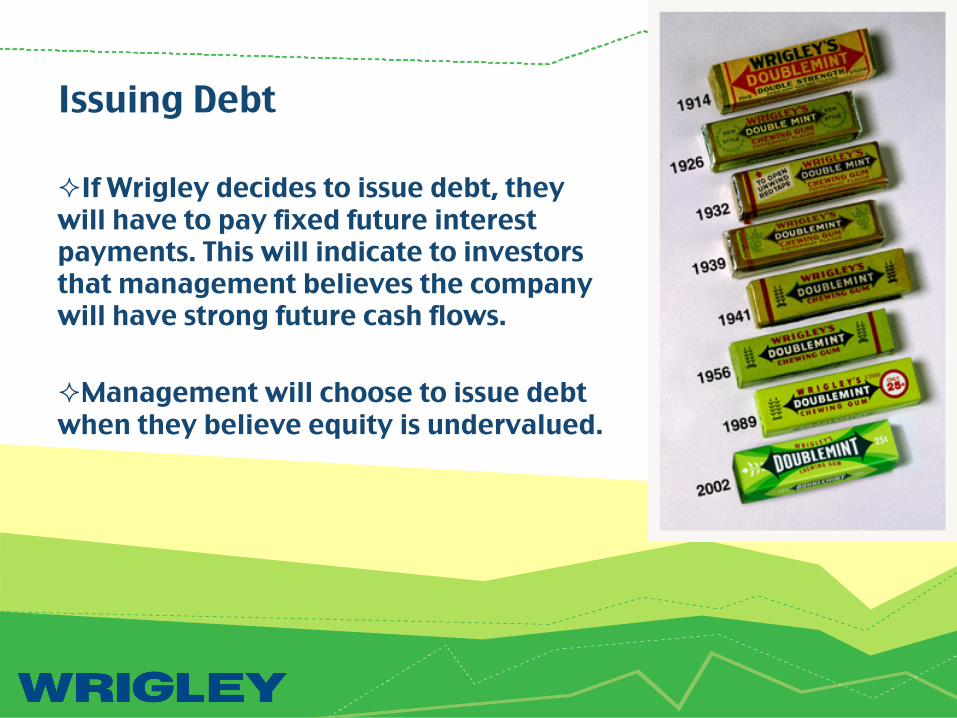
Issuing Debt
² If Wrigley decides to issue debt, they will have to pay fixed future interest payments. This will indicate to investors that management believes the company will have strong future cash flows.
² Management will choose to issue debt when they believe equity is undervalued.
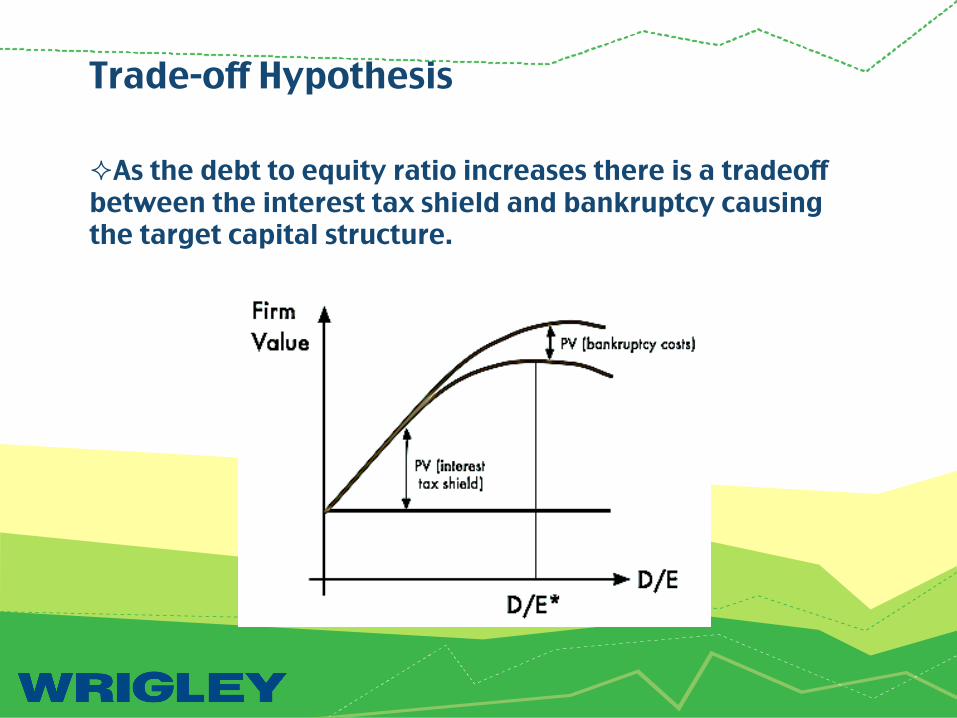
Trade-off Hypothesis ² As the debt to equity ratio increases there is a tradeoff between the interest tax shield and bankruptcy causing the target capital structure.
Capital Structure
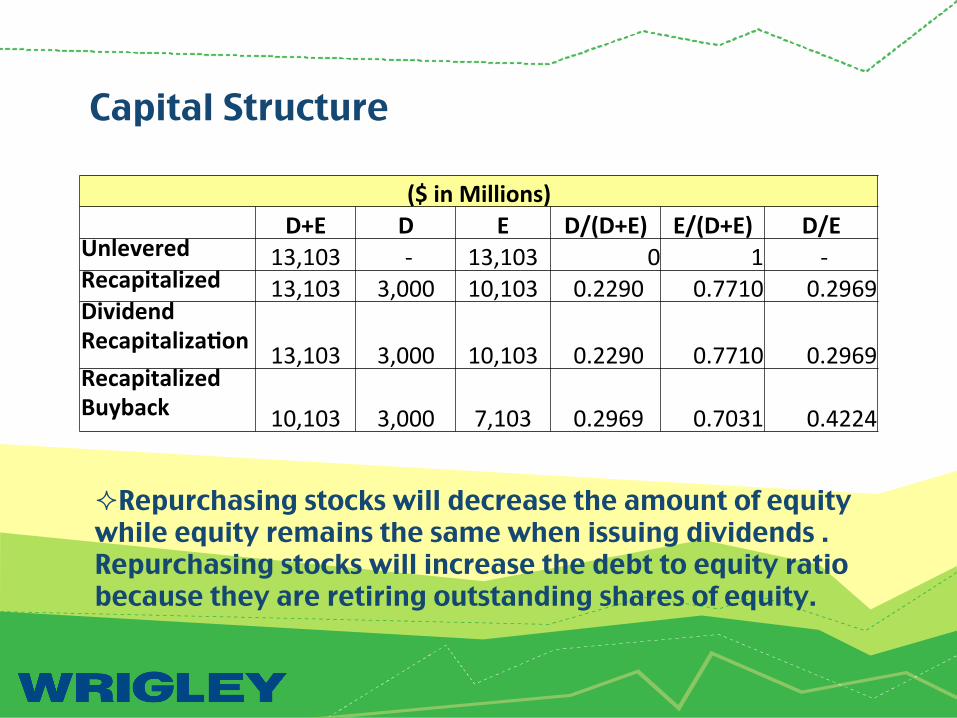
($ in Millions) D+E D E D/(D+E) E/(D+E) D/E Unlevered 13,103 -‐ 13,103 0 1 -‐ Recapitalized 13,103 3,000 10,103 0.2290 0.7710 0.2969 Dividend Recapitaliza:on 13,103 3,000 10,103 0.2290 0.7710 0.2969 Recapitalized Buyback 10,103 3,000 7,103 0.2969 0.7031 0.4224
² Repurchasing stocks will decrease the amount of equity while equity remains the same when issuing dividends . Repurchasing stocks will increase the debt to equity ratio because they are retiring outstanding shares of equity.
Impact on Share Value
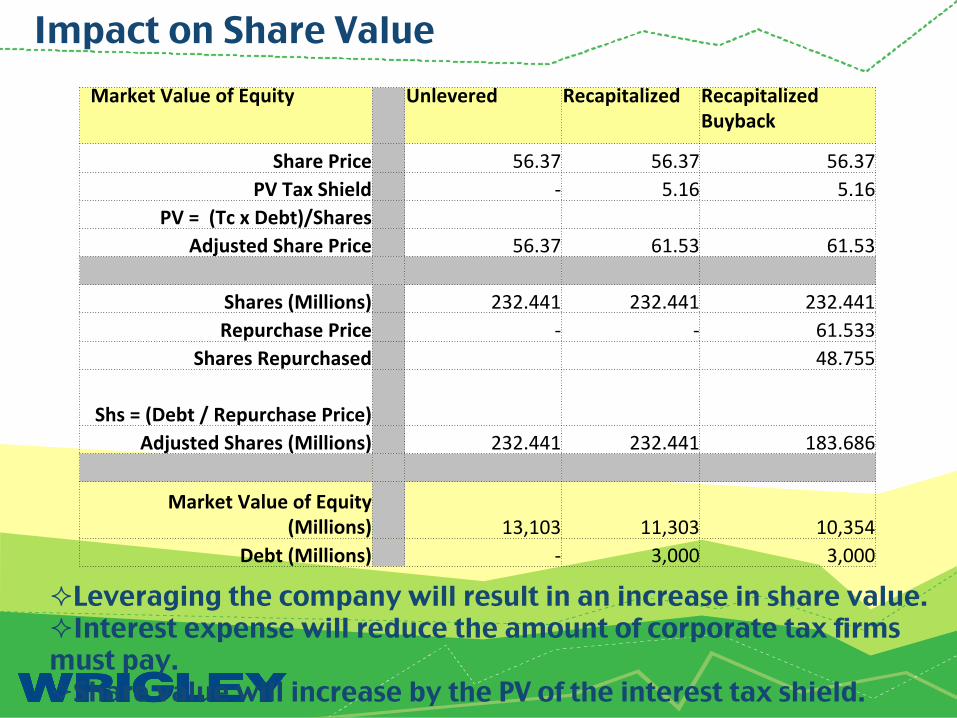
² Leveraging the company will result in an increase in share value. ² Interest expense will reduce the amount of corporate tax firms must pay. ² Share value will increase by the PV of the interest tax shield.
Market Value of Equity Unlevered Recapitalized Recapitalized Buyback
Share Price 56.37 56.37 56.37 PV Tax Shield -‐ 5.16 5.16
PV = (Tc x Debt)/Shares Adjusted Share Price 56.37 61.53 61.53
Shares (Millions) 232.441 232.441 232.441 Repurchase Price -‐ -‐ 61.533
Shares Repurchased 48.755
Shs = (Debt / Repurchase Price) Adjusted Shares (Millions) 232.441 232.441 183.686
Market Value of Equity
(Millions) 13,103 11,303 10,354 Debt (Millions) -‐ 3,000 3,000
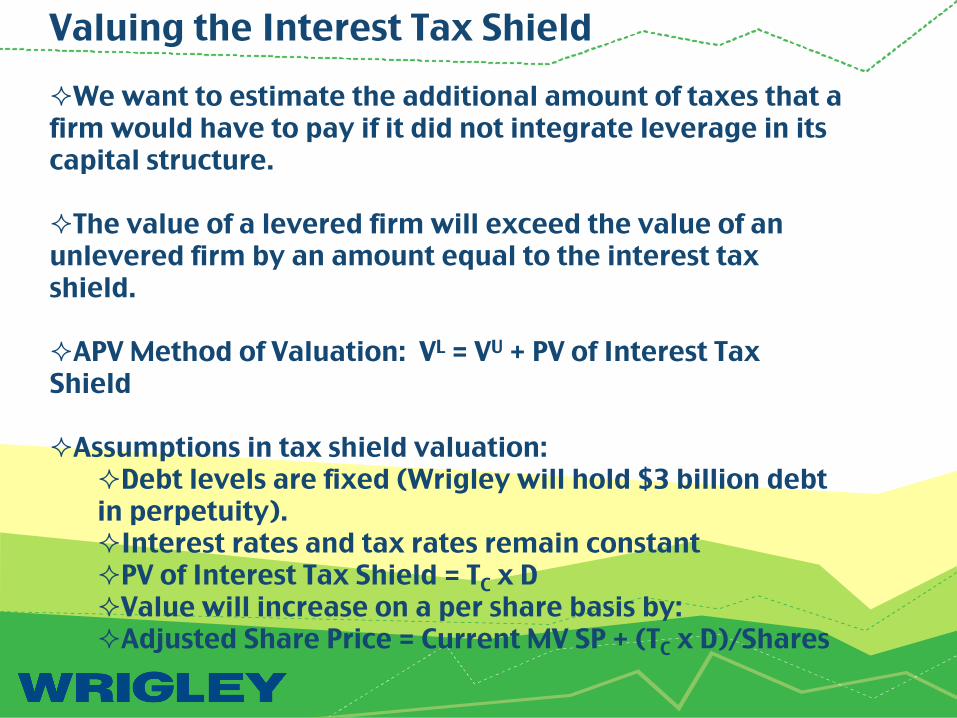
Valuing the Interest Tax Shield ² We want to estimate the additional amount of taxes that a firm would have to pay if it did not integrate leverage in its capital structure.
² The value of a levered firm will exceed the value of an unlevered firm by an amount equal to the interest tax shield.
² APV Method of Valuation: VL = VU + PV of Interest Tax Shield ² Assumptions in tax shield valuation:
² Debt levels are fixed (Wrigley will hold $3 billion debt in perpetuity). ² Interest rates and tax rates remain constant ² PV of Interest Tax Shield = TC x D ² Value will increase on a per share basis by: ² Adjusted Share Price = Current MV SP + (TC x D)/Shares
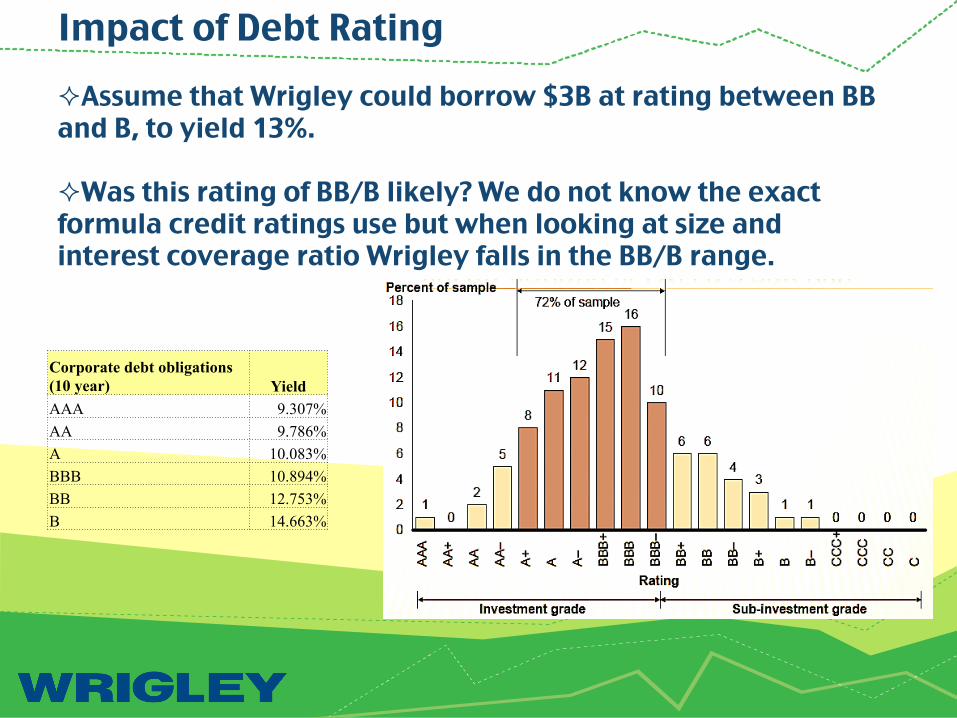
Impact of Debt Rating ² Assume that Wrigley could borrow $3B at rating between BB and B, to yield 13%.
² Was this rating of BB/B likely? We do not know the exact formula credit ratings use but when looking at size and interest coverage ratio Wrigley falls in the BB/B range.
Corporate debt obligations (10 year) Yield AAA 9.307% AA 9.786% A 10.083% BBB 10.894% BB 12.753% B 14.663%
Impact of Debt Rating
² If Wrigley took on 3B in Debt, credit rating would drop to BB. The cost of debt would increase and this would have a negative impact on share price.
² If you drop below a BBB, insurance companies will not invest in those bonds. When insurance companies do not invest, it will lower the demand and the yield to maturity will increase. The increase in the YTM, will increase Wrigley’s cost of debt.
² The debt securities would be considered “junk bonds” and the market will perceive the company’s equity securities as a riskier investment.
Impact of Debt Rating
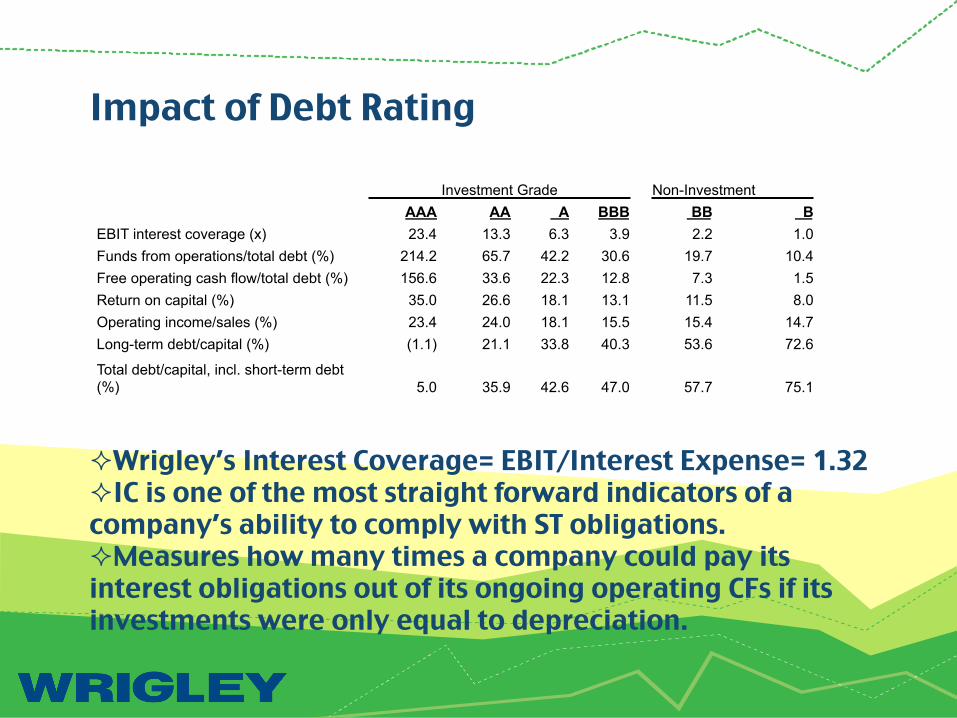
Investment Grade Non-Investment AAA AA A BBB BB B
EBIT interest coverage (x) 23.4 13.3 6.3 3.9 2.2 1.0 Funds from operations/total debt (%) 214.2 65.7 42.2 30.6 19.7 10.4 Free operating cash flow/total debt (%) 156.6 33.6 22.3 12.8 7.3 1.5 Return on capital (%) 35.0 26.6 18.1 13.1 11.5 8.0 Operating income/sales (%) 23.4 24.0 18.1 15.5 15.4 14.7 Long-term debt/capital (%) (1.1) 21.1 33.8 40.3 53.6 72.6
Total debt/capital, incl. short-term debt (%) 5.0 35.9 42.6 47.0 57.7 75.1
² Wrigley’s Interest Coverage= EBIT/Interest Expense= 1.32 ² IC is one of the most straight forward indicators of a company’s ability to comply with ST obligations. ² Measures how many times a company could pay its interest obligations out of its ongoing operating CFs if its investments were only equal to depreciation.
Beta Calculations
Re-‐Levering Beta
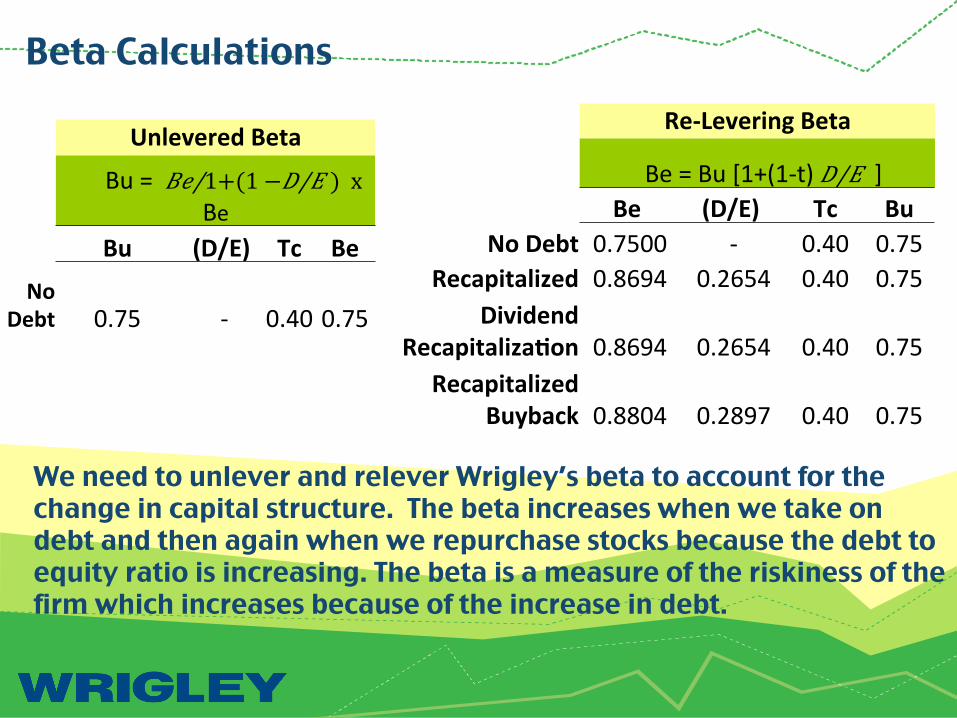
Be = Bu [1+(1-‐t) 𝐷/𝐸 ] Be (D/E) Tc Bu
No Debt 0.7500 -‐ 0.40 0.75 Recapitalized 0.8694 0.2654 0.40 0.75
Dividend Recapitaliza:on 0.8694 0.2654 0.40 0.75
Recapitalized Buyback 0.8804 0.2897 0.40 0.75
Unlevered Beta
Bu = 𝐵𝑒/1+(1 − 𝐷/𝐸 ) x Be
Bu (D/E) Tc Be
No Debt 0.75 -‐ 0.40 0.75
We need to unlever and relever Wrigley’s beta to account for the change in capital structure. The beta increases when we take on debt and then again when we repurchase stocks because the debt to equity ratio is increasing. The beta is a measure of the riskiness of the firm which increases because of the increase in debt.
Impact on Cost of Capital
WACC
Wd Kd (1-‐Tm) We Ke WACC
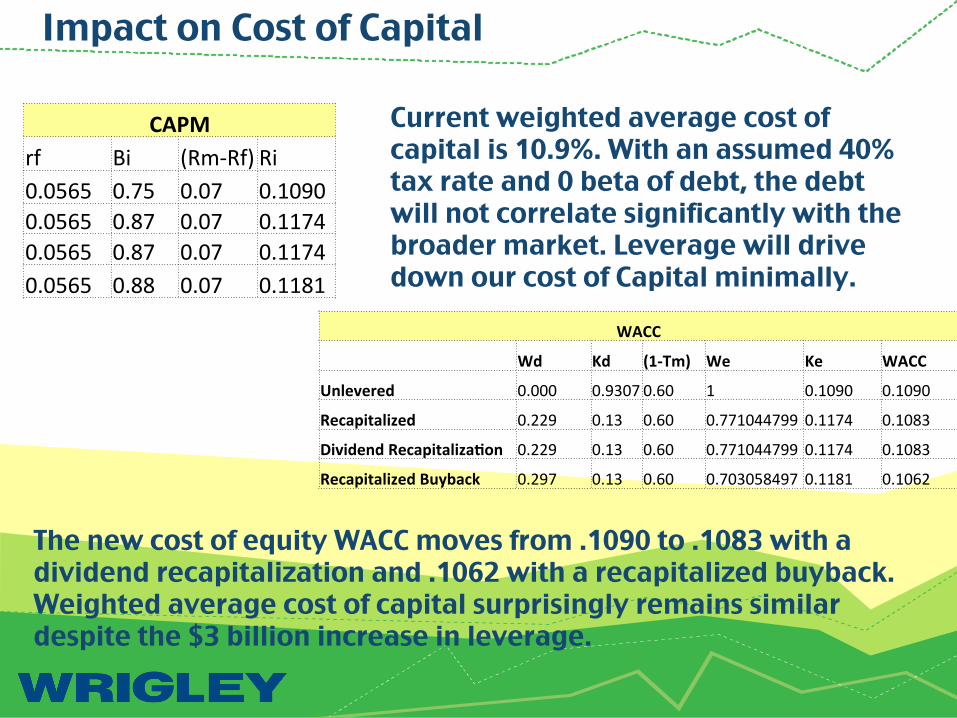
Unlevered 0.000 0.9307 0.60 1 0.1090 0.1090
Recapitalized 0.229 0.13 0.60 0.771044799 0.1174 0.1083
Dividend Recapitaliza:on 0.229 0.13 0.60 0.771044799 0.1174 0.1083
Recapitalized Buyback 0.297 0.13 0.60 0.703058497 0.1181 0.1062
CAPM rf Bi (Rm-‐Rf) Ri 0.0565 0.75 0.07 0.1090 0.0565 0.87 0.07 0.1174 0.0565 0.87 0.07 0.1174 0.0565 0.88 0.07 0.1181
Current weighted average cost of capital is 10.9%. With an assumed 40% tax rate and 0 beta of debt, the debt will not correlate significantly with the broader market. Leverage will drive down our cost of Capital minimally.
The new cost of equity WACC moves from .1090 to .1083 with a dividend recapitalization and .1062 with a recapitalized buyback. Weighted average cost of capital surprisingly remains similar despite the $3 billion increase in leverage.
Question 3: Why does WACC not substantially decrease? Answer: The tax benefit of using more debt is offset by the higher cost of equity. The estimate of the levered beta post recap fails to reflect costs of financial distress. The lower cost of debt in the weighted cost of capital is largely offset of the cost of equity (risk adjusted for leverage).
EPS v. EBIT Analysis
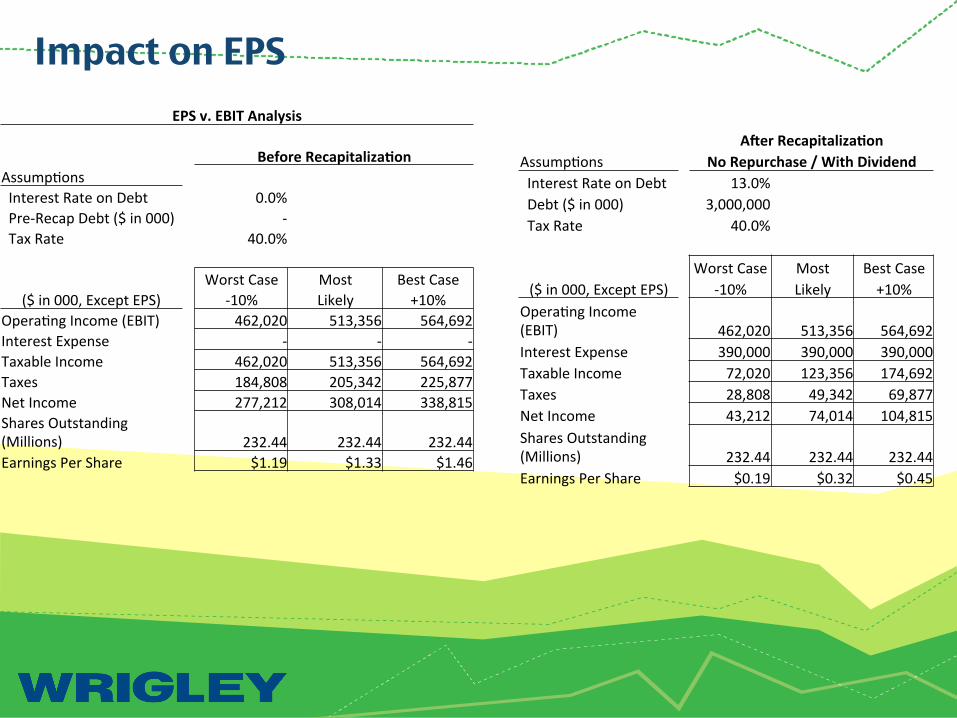
Before Recapitaliza:on AssumpAons Interest Rate on Debt 0.0% Pre-‐Recap Debt ($ in 000) -‐ Tax Rate 40.0%
Worst Case Most Best Case ($ in 000, Except EPS) -‐10% Likely +10%
OperaAng Income (EBIT) 462,020 513,356 564,692 Interest Expense -‐ -‐ -‐ Taxable Income 462,020 513,356 564,692 Taxes 184,808 205,342 225,877 Net Income 277,212 308,014 338,815 Shares Outstanding (Millions) 232.44 232.44 232.44 Earnings Per Share $1.19 $1.33 $1.46
Impact on EPS
AVer Recapitaliza:on AssumpAons No Repurchase / With Dividend Interest Rate on Debt 13.0% Debt ($ in 000) 3,000,000 Tax Rate 40.0%
Worst Case Most Best Case ($ in 000, Except EPS) -‐10% Likely +10%
OperaAng Income (EBIT) 462,020 513,356 564,692 Interest Expense 390,000 390,000 390,000 Taxable Income 72,020 123,356 174,692 Taxes 28,808 49,342 69,877 Net Income 43,212 74,014 104,815 Shares Outstanding (Millions) 232.44 232.44 232.44 Earnings Per Share $0.19 $0.32 $0.45
Impact on EPS
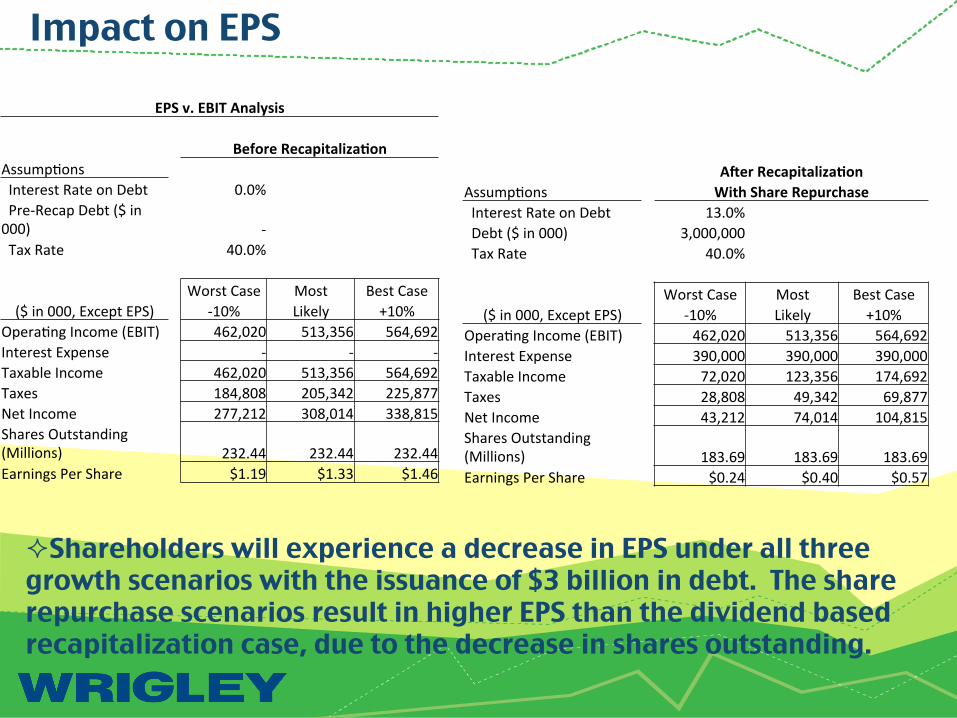
AVer Recapitaliza:on AssumpAons With Share Repurchase Interest Rate on Debt 13.0% Debt ($ in 000) 3,000,000 Tax Rate 40.0%
Worst Case Most Best Case ($ in 000, Except EPS) -‐10% Likely +10%
OperaAng Income (EBIT) 462,020 513,356 564,692 Interest Expense 390,000 390,000 390,000 Taxable Income 72,020 123,356 174,692 Taxes 28,808 49,342 69,877 Net Income 43,212 74,014 104,815 Shares Outstanding (Millions) 183.69 183.69 183.69 Earnings Per Share $0.24 $0.40 $0.57
EPS v. EBIT Analysis
Before Recapitaliza:on AssumpAons Interest Rate on Debt 0.0% Pre-‐Recap Debt ($ in 000) -‐ Tax Rate 40.0%
Worst Case Most Best Case ($ in 000, Except EPS) -‐10% Likely +10%
OperaAng Income (EBIT) 462,020 513,356 564,692 Interest Expense -‐ -‐ -‐ Taxable Income 462,020 513,356 564,692 Taxes 184,808 205,342 225,877 Net Income 277,212 308,014 338,815 Shares Outstanding (Millions) 232.44 232.44 232.44 Earnings Per Share $1.19 $1.33 $1.46
² Shareholders will experience a decrease in EPS under all three growth scenarios with the issuance of $3 billion in debt. The share repurchase scenarios result in higher EPS than the dividend based recapitalization case, due to the decrease in shares outstanding.
Question 4: Does a decrease in EPS matter?
Answer: It has been suggested that shareholders focus less on reported EPS and more on cash flow when evaluating investment opportunities.
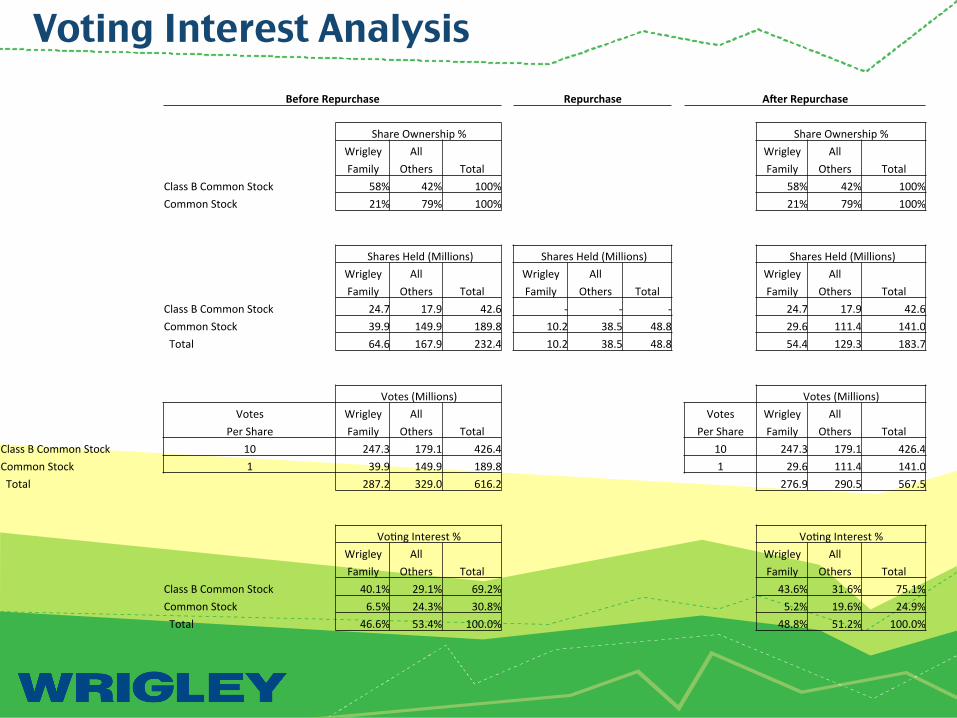
Voting Interest Analysis
Before Repurchase Repurchase AVer Repurchase
Share Ownership % Share Ownership % Wrigley All Wrigley All Family Others Total Family Others Total
Class B Common Stock 58% 42% 100% 58% 42% 100% Common Stock 21% 79% 100% 21% 79% 100%
Shares Held (Millions) Shares Held (Millions) Shares Held (Millions) Wrigley All Wrigley All Wrigley All Family Others Total Family Others Total Family Others Total
Class B Common Stock 24.7 17.9 42.6 -‐ -‐ -‐ 24.7 17.9 42.6 Common Stock 39.9 149.9 189.8 10.2 38.5 48.8 29.6 111.4 141.0 Total 64.6 167.9 232.4 10.2 38.5 48.8 54.4 129.3 183.7
Votes (Millions) Votes (Millions) Votes Wrigley All Votes Wrigley All
Per Share Family Others Total Per Share Family Others Total Class B Common Stock 10 247.3 179.1 426.4 10 247.3 179.1 426.4 Common Stock 1 39.9 149.9 189.8 1 29.6 111.4 141.0 Total 287.2 329.0 616.2 276.9 290.5 567.5
VoAng Interest % VoAng Interest % Wrigley All Wrigley All Family Others Total Family Others Total
Class B Common Stock 40.1% 29.1% 69.2% 43.6% 31.6% 75.1% Common Stock 6.5% 24.3% 30.8% 5.2% 19.6% 24.9% Total 46.6% 53.4% 100.0% 48.8% 51.2% 100.0%
Voting Control Position
² The Wrigley family did not sell any shares. After the repurchase the Wrigley Family's voting control position improves from 46.6% to 48.8%, due to the family's large holding of Class B stock (which carries 10 votes per share compared to 1 vote per share for common stock).
² The actual voting control composition changes very little as controlling levels of ownership remain consist with levels prior to the recapitalization.
² Because the Wrigley family still holds under 50%, there will not be a significant change in the family’s voting control position in the company.
Financial Distress ² Leads to decrease in customers, decrease in skilled employees and a reduction in R&D. ² The threat of financial distress will cause managers to purse certain strategies.
² Agency costs are much higher when the firm is close to bankruptcy.
² There is an incentive to take large risks (asset substitution), under invest and cash out.
Signaling ² Capital Structure decisions are complicated due to signaling.
² Wrigley’s managers have more information about the firms business and finances and can try to manipulate signals.
² Decisions are watched carefully because they carrying significant signaling value . However, these signals have little value in the long run.
² Increasing leverage and returning cash to investors will signal a positive market reaction.
Dividend Signaling ² Asymmetric information
² Stock’s price will generally increase when the firm announces an increase in dividends.
² Thus, increased dividends cause the stockholders to increase their expectations of future earnings and cash flows.
² Wrigley should repurchase it’s stocks because it will create more value for shareholders.
² By leveraging, Wrigley will have a more efficient capital structure and will benefit from the tax shield.
Question 5: How will Wrigley benefit by opting to repurchase over a dividend?
² More flexibility ² Offset to dilution ² Repurchase as investment ² Tax advantage ² Executive compensation
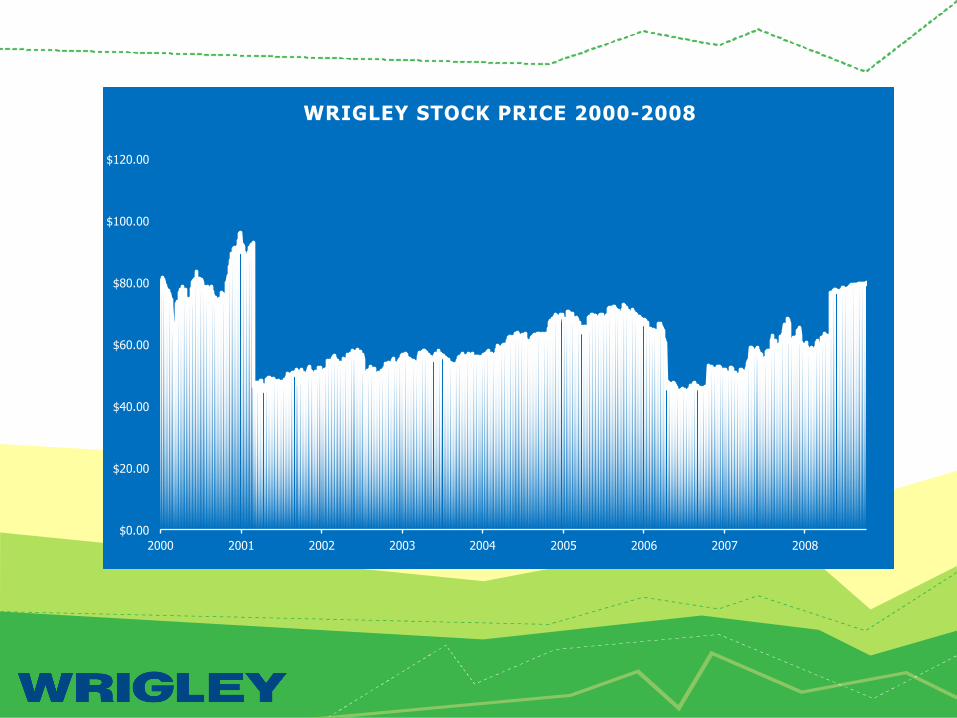
$0.00
$20.00
$40.00
$60.00
$80.00
$100.00
$120.00
2000 2001 2002 2003 2004 2005 2006 2007 2008
WRIGLEY STOCK PRICE 2000-2008
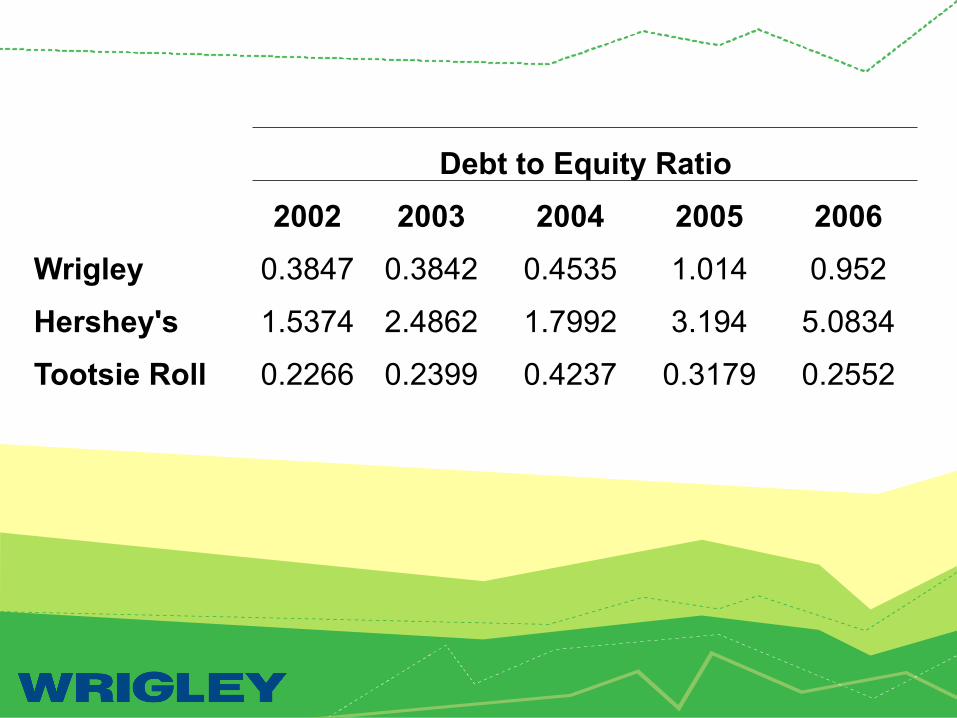
Debt to Equity Ratio 2002 2003 2004 2005 2006
Wrigley 0.3847 0.3842 0.4535 1.014 0.952
Hershey's 1.5374 2.4862 1.7992 3.194 5.0834
Tootsie Roll 0.2266 0.2399 0.4237 0.3179 0.2552
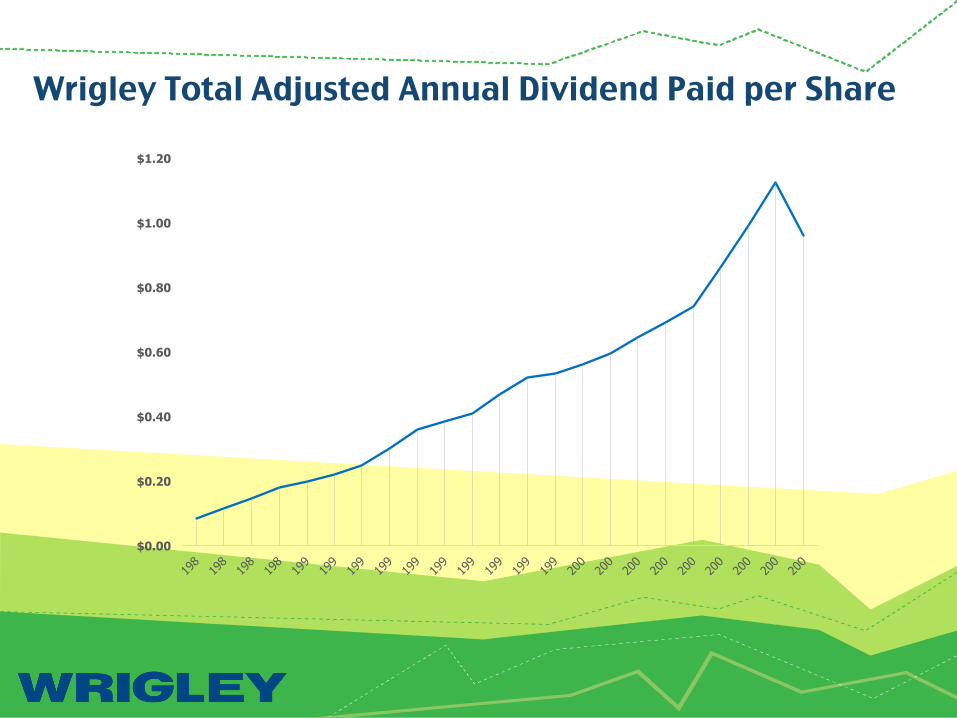
Wrigley Total Adjusted Annual Dividend Paid per Share
$0.00
$0.20
$0.40
$0.60
$0.80
$1.00
$1.20

Thanks for listening!
Questions?