Embed Size (px)
Citation preview

William B. Hakes, Ph.D.-V 101304
1
Cluster Analysis & Hybrid ModelsBusiness Application & Conceptual
Issues
March 3, 2005

William B. Hakes, Ph.D.-V 101304
2
• Introduction to Clustering
• Applied Problem- Dissertation– Conceptual/Practical Issues– Research Ideas– Good Clusters/Bad Clusters & Interpretation
• Applied Problem II/Binary Clustering
• Applied Problem III- Interpretation- Clustering from a Survey
• Trees (RI)- Intro
• Dissertation RI
• For Further Research
Today’s Outline

William B. Hakes, Ph.D.-V 101304
3
1. A financial analyst of an investment firm is interested in identifying groups of mutual funds that are look alike in a “true” context, not simply based on the way Morningstar rates them.
2. A marketing manager is interested in identifying similar cities (across multiple dimensions) that can be used for a test marketing campaign in which a new product might be introduced.
3. The Director of Marketing at a telecom firm wants to understand the types of people that he already knows are candidates for the firm’s new internet data service
4. A Golf Club General Manager wants to understand the “natural” segments of his members so that he can better utilize his clubs assets and understand how he might ideally want the club to look in the future.
Introduction

William B. Hakes, Ph.D.-V 101304
4
1. Cluster Analysis- its easy when:
a. You have a relatively small sample
b. You have nice, neat data
c. Your variables are continuous
2. Cluster Analysis- The Real World
a. Sometimes sample are small, but in business they’re large
b. We’d like our data to be free from error, containing no outliers, but that is rarely the case.
c. Variables are often a mix of continuous and categorical data
Cluster Overview

William B. Hakes, Ph.D.-V 101304
5
A) Cluster entire customer base (General Purpose Clusters)
• Build predictive models across products
• See how your “targeted” customers fall into the clusters, if they provide separability
-or-
B) Build predictive models on base
• Determine the “targets” for a specific campaign
• Cluster those “targets” based only on actionable information (Specific Purpose Clusters)
-or-
C) Cluster Analysis as a primary end-analysis
Correct option depends on how you’ll use it!
Clustering- Some Competing Macro Views

William B. Hakes, Ph.D.-V 101304
6
Applied Problem I• Credit Data: real-world data from financial services (auto loans)
– Predictive Model differentiating “goods” vs. “bads”• Given that we think you’re “good”, what else is there? •Cross selling opportunities
– You’re a good risk, but certainly there is more to offer you – Consider GE Capital
• Purchasing Data: real-world motor-home data from overseas company
– Predictive Model differentiating buyers vs. non-buyers• Given that we think you’re a “buyer”, what else is
there? •Compelling qualitative messages
– You’re likely a buyer, but certainly all buyers are not the same – Consider XYZ Telecom
Dissertation Research

William B. Hakes, Ph.D.-V 101304
7
Guiding Research Question
After a predictive model is built, how can variables best be pre-processed for cluster analysis so that rule induction on the resulting clusters provides maximum perspicuity while minimizing the art involved??
…. perhaps a hybrid model so as to minimize the “art” involved while maximizing perspicuity and applicability.

William B. Hakes, Ph.D.-V 101304
8
Quantitative Problem Domain
• Why Cluster Analysis?
– Commonly Applied:• Targeted Army recruitment- Faulds and Gohmann (2001)
• Identify “natural” segments of Euro tourists- Yuksel and Yuksel (2002)
• Uncover “natural” groups of common business goals across 15 countries- Hofstede et al. (2002)
• Prostate cancer treatment on various types of cells- Li & Sarkar (2002)
• Cluster analysis…
– Identifies subgroups within a larger group
– Makes each object (customer, product etc.)within each group as similar as possible while making the subgroups as different as possible from one another.
Cluster Analysis

William B. Hakes, Ph.D.-V 101304
9
Quantitative Problem Domain• How Does Cluster Analysis Work?
– Variable Selection• Generally must be on similar/identical scales (standardized)• Metric- Ordinal/Interval/Ratio• Non-metric data• Correlation & outliers distort results• Principle Components & Factor Analysis as Inputs
• Construct similarity/proximity matrix to view relationship between all observations across all variables:– Euclidean Distance (most commonly used) – Other distances measures include Euclidean, Squared
Euclidean, City Block, Mahalonobis – Correlation- but consider (1, 2, 1, 2) and (9, 10, 9, 10) vs.
(1, 2, 1, 2) and (1, 1, 2, 2)– Association (Jaccard coefficient for binary variables)
Cluster Analysis cont’d

William B. Hakes, Ph.D.-V 101304
10
Quantitative Problem Domain
• How Does Cluster Analysis Work?– Choose clustering algorithm
• Hierarchical- n clusters of size 1 until one cluster remains– Choose algorithm to determine how distance is to be
computed between clusters.– Ward’s Method*, single Linkage, centroid, etc.
• Non-Hierarchical (K-Means)- assign objects to clusters based on pre-specified number of clusters
– Choose seeds for n clusters (often pre-determined)– Clusters are formed, new centroids computed, new
clusters formed• A Dual approach is recommended (Hartigan,1975 ; Milligan,
1980 ; Punj & Stewart, 1983)– Use hierarchical clustering to compute estimated cluster
centroids– Use centroids as the Cluster seeds for a K-Means analysis
Cluster Analysis cont’d

William B. Hakes, Ph.D.-V 101304
11
Quantitative Problem Domain• Number of Clusters
•Hierarchical- n clusters are formed (use dendogram)
•K-Means– Form pre-specified k number based on theory (Milligan,
1980; Hair et al., 1998)
– Form pre-specified k number based on application (Me, Everyday, (3 for Credit & 4 for Motor))
– Consult the “Pseudo-F” in either case to assess solution (Lattin, et al., 2003; Punj & Stewart, 1983)
• Interpretation of Clusters– Which variables are important? How important?
• Univariate F-Tests on Cluster Centroids• Perspicuity via “art” in initial steps•Perspicuity via a different technique (a hybrid)
Cluster Analysis cont’d

Logistic Regression
1- Original Vars
2- Stdized Version of 1
4- Principal Component Scores
3- X1 B1 – XnBn
(from Logit)
Rule Induction
(CART)
Expert Panel Review
Each of 4 RI Solutions tested for Usefulness/Perspicuity
using ANOVA/Tukey’s HSD)
K-means Cluster Analysis
(refined solutions)
Hierarchical Cluster Analysis
(seeds developed)
Determine “Target “Group
Original Vars
Std Vars Logit Vars PCA Vars
Orig Var RI Solution
Std Var RI Solution
Logit Var RI Solution
PCA Var RI Solution
Variable pre-processing as inputs
Extract the pre-specified number of clusters as seeds for next stage
Generate a pre-specified number of clusters using seeds from prior CA
Input each cluster solution into RI program and create RI solutions
Transform rules into text descriptions and submit to Expert Panel for review
Extracted Group of Targeted Customers
Original Vars
Std Vars Logit Vars PCA Vars
Hybrid Test

William B. Hakes, Ph.D.-V 101304
13
Take the following example: You are a firm trying to generate clusters about the Atlanta area with the objective of understanding zip codes to which you want to “mass”market your products.
a. Many different races exist. How do you cluster them? Typically, its:
• 1) White
• 2) African American
• 3) Asian
• 4) Hispanic
• 5) Native American
• 6) Non-white other
b. What will clustering do with this variable as it groups people?
Clustering- A Problematic Example

William B. Hakes, Ph.D.-V 101304
14
A Problematic Example cont’d
1. Can you cluster this simple example?
2. How will you interpret it (e.g., what’s a common way to look at the “answer” to see if you agree with the differentiation)?
Person Zip Race101 30066 1102 30068 2103 30066 3104 30062 4105 30066 6106 30067 2107 30068 5108 30062 4109 30067 3110 30068 4111 30062 2112 30062 1113 30066 1114 30066 2115 30068 3116 30062 5117 30067 6118 30068 1119 30062 2120 30066 6

William B. Hakes, Ph.D.-V 101304
15
1. Cluster Means- What do they tell us?
2. Assume we have three clusters, and along the “race” dimension, they are as follows:
• Cluster 1- Mean=2
• Cluster 2- Mean=4
• Cluster 3- Mean=1
How do you:
Use this data to assign people into clusters?
Interpret means?
A Problematic Example cont’dPerson Zip Race
101 30066 1102 30068 2103 30066 3104 30062 4105 30066 6106 30067 2107 30068 5108 30062 4109 30067 3110 30068 4111 30062 2112 30062 1113 30066 1114 30066 2115 30068 3116 30062 5117 30067 6118 30068 1119 30062 2120 30066 6

William B. Hakes, Ph.D.-V 101304
16
Binary Variables- One Possible Solution?
Person Zip Race Race1 Race2 Race3 Race4 Race5 Race6101 30066 1 1 0 0 0 0 0102 30068 2 0 1 0 0 0 0103 30066 NA 0 0 0 0 0 0104 30062 4 0 0 0 1 0 0105 30066 6 0 0 0 0 0 1106 30067 2 0 1 0 0 0 0107 30068 5 0 0 0 0 1 0108 30062 4 0 0 0 1 0 0109 30067 3 0 0 1 0 0 0110 30068 4 0 0 0 1 0 0111 30062 2 0 1 0 0 0 0112 30062 1 1 0 0 0 0 0113 30066 1 1 0 0 0 0 0114 30066 2 0 1 0 0 0 0115 30068 3 0 0 1 0 0 0116 30062 5 0 0 0 0 1 0117 30067 6 0 0 0 0 0 1118 30068 1 1 0 0 0 0 0119 30062 NA 0 0 0 0 0 0120 30066 6 0 0 0 0 0 1

William B. Hakes, Ph.D.-V 101304
17
Binary Variables- A Closer Look
Person Zip Race Race1 Race2 Race3 Race4 Race5 Race6101 30066 1 1 0 0 0 0 0102 30068 2 0 1 0 0 0 0103 30066 NA 0 0 0 0 0 0
1. How will these cases cluster?
2. What can we do about it?
How similar are persons 101, 102 & 103 to one another….are they more alike or more different?

William B. Hakes, Ph.D.-V 101304
18
Applied Problem II
1. A Golf Club General Manager wants to understand the “natural” segments of his members so that he can better utilize his clubs assets and understand how he might ideally want the club to look in the future.
2. How can cluster analysis help?
3. We took a look at the following
• Demographic Information
• Usage Information
• Cost Information
• Some data was measured and some was survey data
Note that in clustering you may use N dummy variables (rather than N-1 in dependent techniques like regression)

William B. Hakes, Ph.D.-V 101304
19
Application of Binary Clustering
Golf Use: Never .5/mo 1/mo 4/mo 10/mo 15+/mo
Cluster AClub01 AClub02 AClub03 AClub04 AClub05 AClub06 SUM N =
1 2% 23% 36% 33% 6% 0% 100% 10002 2% 29% 31% 22% 15% 1% 100% 5003 10% 27% 21% 19% 23% 1% 100% 3804 0% 35% 30% 26% 9% 0% 100% 2205 6% 21% 23% 33% 17% 0% 100% 1700
Total N 161 926 1046 1127 534 6
Cluster BClub01 BClub02 BClub03 BClub04 BClub05 BClub06 SUM N =
1 1% 7% 29% 40% 23% 0% 100% 10002 1% 15% 38% 28% 18% 0% 100% 5003 9% 20% 31% 20% 19% 0% 100% 3804 2% 13% 48% 31% 4% 2% 100% 2205 4% 16% 31% 30% 16% 3% 100% 1700
Total N 128 517 1236 1199 662 58
Cluster Means
- Above data taken from one question off of 30Q customer survey. 5 Clusters were formed.
- Note that a dummy separated n ways will sum to 100% only if there are no missing responses.

William B. Hakes, Ph.D.-V 101304
20
Many different uses , but its works great for clustering (see SPSS)
Jaccard Coefficient
a___ Sj = a + b + cwhere a is the sum of agreement (+ +) and b, c represent the sums of absent/present combinations (i.e. + - , and - +, respectively). The table below shows this convention of lettering for counts when calculating the similarity between two objects. Values of d are not considered because they represent complete disagreement.
OBJECT 1
+ -
OBJECT2
+ a(1,1)
b(1,0)
- c(0,1)
d(0,0)
Var --> a b c d e f g h
Person 1 1 0 0 1 0 0 1 0Person 2 1 0 0 0 0 0 1 0Person 3 0 0 1 0 1 0 1 0
Matrix Person 1 Person 2 Person 3Person 1 1Person 2 67% 1Person 3 20% 25% 1
i.e. Person 1 vs. Person 2 = (2 / (2+1))
Jaccard Process Sample

William B. Hakes, Ph.D.-V 101304
21
Summary of Binary Clustering1. Assists when we want to understand the “natural” segments
2. How can binary cluster analysis help (using Jaccard or otherwise)?
• Allows us to use categorical data.
• Gives us unique summary insight into the true percentages of each cluster along various dimensions.
• Not tricked by the zero problem- if zero’s are “true” zero’s, then clustering can be VERY interpretable
• No program as of yet that integrates Jaccard algorithm with traditional algorithms.
• Cluster different sets of variables and then cluster the clusters using Jaccard (dummy the cluster membership)
• Invent your own technique!!!! (i.e. K-Modes)
3. All clustering should be “checked” with domain experts for validation.

William B. Hakes, Ph.D.-V 101304
22
Age By Years of Membership
0
5
10
15
20
25
30
35
40
30 40 50 60 70 80
Age
Ye
ars
Me
mb
erS
hip
Applied Problem III- F&B Survey AnalysisApplied Problem III- F&B Survey Analysis
For Illustration Purposes Only

William B. Hakes, Ph.D.-V 101304
23
Can Clustering Help……Can Clustering Help……
For Illustration Purposes Only
Age By Years of Membershipwith Cluster Means
0
5
10
15
20
25
30
35
40
30 40 50 60 70 80Age
Yea
rs M
emb
erS
hip
36%
32%
21%
11%

William B. Hakes, Ph.D.-V 101304
24
F&B Survey Analysis – Clusters vs. Member InfoF&B Survey Analysis – Clusters vs. Member Info
Can we look at member information we know to be true in order to measure the accuracy of member responses & therefore the clusters?
Survey Average Age Actual Member Average Age
Cluster 1 52.95 52.86
Cluster 2 47.23 47.77
Cluster 3 69.25 70.5
Cluster 4 56.06 56.11
Cluster 5 52.5 53.04

William B. Hakes, Ph.D.-V 101304
25
F&B Survey Analysis – Clustering OverviewF&B Survey Analysis – Clustering Overview
What are the primary Clusters that exist at the Club?
Big Spenders (8% of Member Base)Age = 53 1 Child Golf/Tennis/Fitness = 4x per month
Opportunity Knocks w/Kids (58% of Member Base)Age = 47 1.5 Children, under 14 Golf=2x/mo SwimPool=8x/mo
Seniors (15% of Member Base)Age = 69 No Children Golf /Tennis= 3x/mo
Opportunity Knocks no Kids (17% of Member Base)Age = 56 If Kids, most are 18+ Heaviest Fitness 3x/mo Golf 6x/mo Pool
Heavy All-Around Users (4% of Member Base)Age = 52 1 Child, Age 11+ Golf/Swim/Fitness = 15x per month
William B. Hakes, Ph.D.-V 101304
26
Q4 and Q5 plotted together…What is the relationship between the factors that members find important when selecting a restaurant and their level of satisfaction?
Sati
sfa
cti
on
Importance3 5
5
Quality of Food
Quality of Wine Menu Variety
ServiceAtmospherePrice
Speed
F&B Survey Analysis – Results by Question F&B Survey Analysis – Results by Question
4
High Importance +High Satisfaction = Increased Loyalty
High Importance +High Satisfaction = Increased Loyalty
4
Q4- What factors are important to you in selecting a restaurant?Q5- How satisfied are you with the same factors at the Club?

William B. Hakes, Ph.D.-V 101304
27
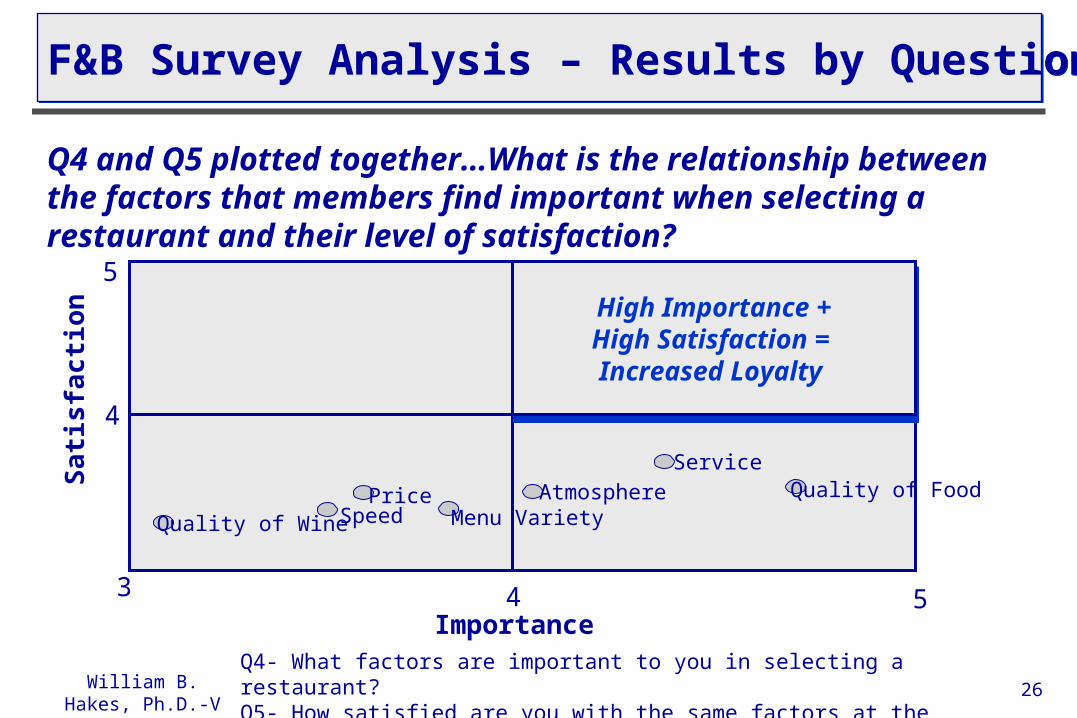
F&B Survey Analysis – Importance vs. SatisfactionF&B Survey Analysis – Importance vs. Satisfaction
Note that the actual scale begins at “1” but there were no responses measured below “3”
Cluster 1
3.003.203.403.603.804.004.204.404.604.805.00
3.00 3.50 4.00 4.50 5.00
Importance
Sati
sfa
cti
on
Variety
SpeedQuality Food
Quality Wine
Price
Service
Atmosphere
“Big Spenders”

William B. Hakes, Ph.D.-V 101304
28
F&B Survey Analysis – Importance vs. SatisfactionF&B Survey Analysis – Importance vs. Satisfaction
Cluster 2
3.003.203.403.603.804.004.204.404.604.805.00
3.00 3.50 4.00 4.50 5.00
Importance
Sati
sfa
cti
on
VarietySpeed
Quality FoodQuality Wine
Price ServiceAtmosphere
Note that the actual scale begins at “1” but there were no responses measured below “3”
“Opp Knocks/kids”
William B. Hakes, Ph.D.-V 101304
29
F&B Survey Analysis – Importance vs. SatisfactionF&B Survey Analysis – Importance vs. Satisfaction
Cluster 3
3.003.203.403.603.804.004.204.404.604.805.00
3.00 3.50 4.00 4.50 5.00
Importance
Sati
sfa
cti
on
Variety
Speed
Quality Food
Quality Wine below 3
PriceService
Atmosphere
Note that the actual scale begins at “1” but there were no responses measured below “3”
“Seniors”

William B. Hakes, Ph.D.-V 101304
30
F&B Survey Analysis – Importance vs. SatisfactionF&B Survey Analysis – Importance vs. Satisfaction
Cluster 4
3.003.203.403.603.804.004.204.404.604.805.00
3.00 3.50 4.00 4.50 5.00
Importance
Sati
sfa
cti
on
Variety
SpeedQuality Food
Quality Wine
Price ServiceAtmosphere
Note that the actual scale begins at “1” but there were no responses measured below “3”
“Opp Knocks no kids”

William B. Hakes, Ph.D.-V 101304
31
F&B Survey Analysis – Importance vs. SatisfactionF&B Survey Analysis – Importance vs. Satisfaction
Cluster 5
3.003.203.403.603.804.004.204.404.604.805.00
3.00 3.50 4.00 4.50 5.00
Importance
Sati
sfa
cti
on
Variety
Speed
Quality Food
Quality Wine
Price
Service
Atmosphere
Note that the actual scale begins at “1” but there were no responses measured below “3”
“Heavy Users”

William B. Hakes, Ph.D.-V 101304
32
Points to Ponder- Clustering
Pros-
1) Good for exploratory analysis
2) Helps discover previous unsuspected relationships
3) One of very few techniques that focuses on the groups it creates, not the variate that creates them
Cons-
1) Difficult to interpret/often not actionable
2) Deemed as too “soft” by some statisticians and businesses
3) Out of sample customer assignment is very tough
Solution- (Almost) Always use a Hybrid Model, at least as a check

Logistic Regression
1- Original Vars
2- Stdized Version of 1
4- Principal Component Scores
3- X1 B1 – XnBn
(from Logit)
Rule Induction
(CART)
Expert Panel Review
Each of 4 RI Solutions tested for Usefulness/Perspicuity
using ANOVA/Tukey’s HSD)
K-means Cluster Analysis
(refined solutions)
Hierarchical Cluster Analysis
(seeds developed)
Determine “Target “Group
Original Vars
Std Vars Logit Vars PCA Vars
Orig Var RI Solution
Std Var RI Solution
Logit Var RI Solution
PCA Var RI Solution
Variable pre-processing as inputs
Extract the pre-specified number of clusters as seeds for next stage
Generate a pre-specified number of clusters using seeds from prior CA
Input each cluster solution into RI program and create RI solutions
Transform rules into text descriptions and submit to Expert Panel for review
Extracted Group of Targeted Customers
Original Vars
Std Vars Logit Vars PCA Vars
Hybrid Test

William B. Hakes, Ph.D.-V 101304
RI- Rules are induced based upon a set of inputs and a criterion (dependent) variable
Although many different techniques exist such as CART, ID3, CHAID, and many others, they all tend to utilize the following procedures, even though they each have different splitting rules (Whalen & Gim, 1999):
1) Identify a dependent variable of interest along with a set of independent (predictor) variables.
2) Compare all cutpoints of predictor variables to find the one that best predicts the dependent variable (using some statistical rule, though these rules differ among methods).
3) Identify the next best rule (a predictor variable along a certain cutpoint) in each of the sub-samples already defined by (2).
4) Continue to split until all remaining subsamples are homogenous with respect to the dependent variable.
5) The set of if-then rules from the analysis are applied to a validation set to determine performance.
Overview of Decision Trees/Rule Induction

William B. Hakes, Ph.D.-V 101304
• Classification and Regression Trees
• Origins in research conducted at Berkeley & Stanford
– Leo Breiman, University of California, Berkeley
– Jerry Friedman, Stanford University
– Charles J. Stone, University of California, Berkeley
– Richard Olshen, Stanford University
• Solved a number of problems plaguing other decision tree methods (CHAID, ID3)
• Very well known in biomedical and engineering arenas
• Only recently becoming known in IT, DM, and AI circles
Overview of CART

William B. Hakes, Ph.D.-V 101304
PATIENTS = 215
SURVIVE 178 82.8%DEAD 37 17.2%
Is BP<=91?
Terminal Node A
SURVIVE 6 30.0%DEAD 14 70.0%
NODE = DEAD
Terminal Node B
SURVIVE 102 98.1%DEAD 2 1.9%
NODE = SURVIVE
PATIENTS = 195
SURVIVE 172 88.2%DEAD 23 11.8%
Is AGE<=62.5?
Terminal Node C
SURVIVE 14 50.0%DEAD 14 50.0%
NODE = DEAD
PATIENTS = 91
SURVIVE 70 76.9%DEAD 21 23.1%
Is SINUS<=.5?
Terminal Node D
SURVIVE 56 88.9%DEAD 7 11.1%
NODE = SURVIVE
<= 91 > 91
<= 62.5 > 62.5
>.5<=.5
Trees (Binary) Are Fundamentally Simple

William B. Hakes, Ph.D.-V 101304
• A binary splitting procedure can always reproduce a multi-way split
• A binary splitting procedure will only partially partition on a database field if another sequence is better
FYI-• CART (and trees in general) handle missing data very
well• Tests show that when data are missing at random even
25% missing rates have minimal effect on CART accuracy
• Costs of misclassification: allow for certain errors to be more serious than others
• Fundamentally detects non-linear relationships• Rules can be automatically detected, or modified by user
Why CART Works Well

William B. Hakes, Ph.D.-V 101304
If the multi-way split is best, binary split method will find itIf it is not best, binary method will move to another variable
No
No
Yes No
Age <= 65
Age > 65Age <= 45
45 < Age <= 65Age <= 25
Age < 25 Age <= 55
Binary Split Detects MultiWay Splits

William B. Hakes, Ph.D.-V 101304
• Split made all at once could be too hasty• Even if age group isis different, other variables might be even
more valuable after the Age > 65, Age < 65 split• The database is fragmented rapidly• Even with 500,000 records, 5 consecutive 4-way splits leave
about 2,000 records per partition• Binary splits are more patient, giving a better chance to
find important structure
Age
< 25 25 - 45 45 - 65 > 65
MultiWay Splits

William B. Hakes, Ph.D.-V 101304
40
Credit:
Hierarchical
K-Means
Input Set Cluster 1 Cluster 2 Cluster 3 Total
Original Variables 1780 424 980 3184
55.90% 13.32% 30.78% 100.00%
Standardized Variables
1868 290 1026 3184
58.67% 9.11% 32.22% 100.00%
Logistic Variables 2463 482 239 3184
77.36% 15.14% 7.51% 100.00%
PCA Variables 2635 292 257 3184
82.76% 9.17% 8.07% 100.00%
Input Set Cluster 1 Cluster 2 Cluster 3 Total
Original Variables 1980 328 876 3184
62.19% 10.30% 27.51% 100.00%
Standardized Variables 1511 295 1378 3184
47.46% 9.27% 43.28% 100.00%
Logistic Variables 2463 482 239 3184
77.36% 15.14% 7.51% 100.00%
PCA Variables 1583 295 1306 3184
49.72% 9.27% 41.02% 100.00%
Credit Cluster Size Comparison

William B. Hakes, Ph.D.-V 101304
41
Motor:
Hierarchical
K-Means
Input Set Cluster 1 Cluster 2 Cluster 3 Cluster 4 Total
Original Variables 282 506 351 317 1456
19.37% 34.75% 24.11% 21.77% 100.00%
Standardized Variables
514 240 694 8 1456
35.30% 16.48% 47.66% 0.55% 100.00%
Logistic Variables 185 592 342 337 1456
12.71% 40.66% 23.49% 23.15% 100.00%
PCA Variables 369 696 227 164 1456
25.34% 47.80% 15.59% 11.26% 100.00%
Input Set Cluster 1 Cluster 2 Cluster 3 Cluster 4 Total
Original Variables 350 360 307 439 1456
24.04% 24.73% 21.09% 30.15% 100.00%
Standardized Variables 577 211 660 8 1456
39.63% 14.49% 45.33% 0.55% 100.00%
Logistic Variables 185 439 390 442 1456
12.71% 30.15% 26.79% 30.36% 100.00%
PCA Variables 184 675 220 377 1456
12.64% 46.36% 15.11% 25.89% 100.00%
Motor Cluster Size Comparison

Category % n1 49.05 7973 41.48 6742 9.48 154Total (100.00) 1625
Node 0
Category % n1 22.97 1643 77.03 5502 0.00 0Total (43.94) 714
Node 2
Category % n1 11.74 663 88.26 4962 0.00 0Total (34.58) 562
Node 6Category % n1 64.47 983 35.53 542 0.00 0Total (9.35) 152
Node 5
Category % n1 69.48 6333 13.61 1242 16.90 154Total (56.06) 911
Node 1
Category % n1 83.62 6333 16.38 1242 0.00 0Total (46.58) 757
Node 4
Category % n1 33.33 323 66.67 642 0.00 0Total (5.91) 96
Node 8Category % n1 90.92 6013 9.08 602 0.00 0Total (40.68) 661
Node 7
Category % n1 0.00 03 0.00 02 100.00 154Total (9.48) 154
Node 3
PCCLUS10 (Training Sample)
T2924XImprovement=0.3963
>1.5
TOTBALImprovement=0.0819
>3836.5<=3836.5
<=1.5
AGEAVGImprovement=0.3150
>-1.5
RVTRDSImprovement=0.0684
>5.5<=5.5
<=-1.5
Variable Definitions:
T2924X= <=1 Trd 30dpd in 24 mo
AGEAVG = Age Avg Open Trd
TOTBAL = TotBal of all trades
RVTRDS = # Rev Trades
2a 1b
3a
3b
1a
Appendix 6a Credit RI Tree: PCA Vars
back
William B. Hakes, Ph.D.-V 101304
43
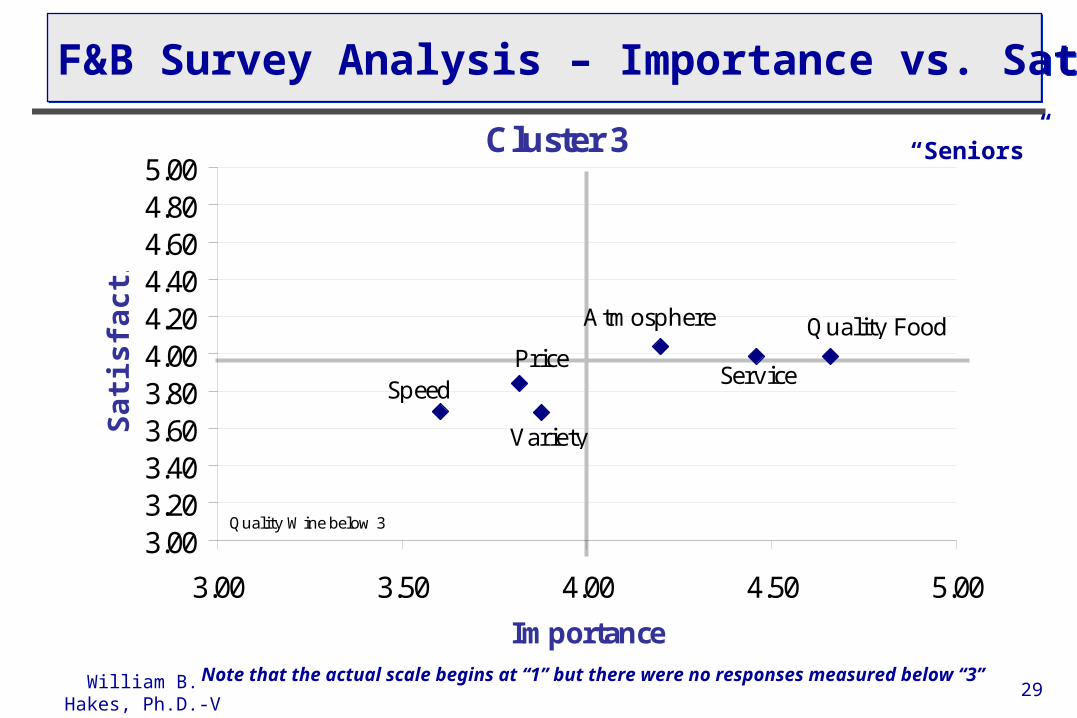
Appendix 6b- Credit RI Translation• Credit RI Tree PCA Vars- Translated Rules:
Cluster 1- (51% of Customers)- (1a) 81% of the customers in this cluster have:
• Over the last 24 months, 1 or less trades rated 30 days past due.• Some information available regarding the average age of their open trades.• 5 or less “revolving” accounts.
- (1b) The other 19% of the customers in this cluster have:• Over the last 24 months, 2 or more trades rated 30 days past due.• A total balance of all trades less than $3837.00.
Cluster 2- (9% of Customers)- (2) Over the last 24 months, these customers have 1 or less trades rated 30 days past due.- (2) These customers have either no record of the age of their current accounts, or they only
have “inquiries” into their credit history.Cluster 3- (40% of Customers)- (3a) 15% of the customers in this cluster have:
• Over the last 24 months, 1 or less trades rated 30 days past due.• Some information available regarding the average age of their open accounts.• 6 or more “revolving” trades.
- (3b) 85% of the customers in this cluster have:• Over the last 24 months, 2 or more trades rated 30 days past due.• A total balance of all trades is greater than or equal to $3837.00.
back

William B. Hakes, Ph.D.-V 101304
44
Issues for Further Research
1. Predictive Models differentiate one group from another, but what about types of groups within a target group?…How Many?
2. Cluster Analysis
a. Which variables are important in clustering?
b. What about out-of-sample assignment?
3. Clustering followed by 2nd Order Rule Induction (a.k.a. Decision Trees)
a. Develop clusters (2-stage)
b. Use as inputs into algorithm (“Best”Algorithm??)
c. Take simple rules and use to assess cases across a database
4. Cluster Analysis vs. Unsupervised NN’s

William B. Hakes, Ph.D.-V 101304
45
Some Parting Thoughts….Q- How much time should you spend properly defining the
quantitative issue and designing the test??
A- A lot more than you think (up to 3x more than the actual “analysis”)
Q- Are there opportunities for Analytics in the marketplace??
A- Yes- tremendous opportunities for people who can do more than Pivot Tables and Regression in Excel.
Q- How do I “get my foot in the door” of analytics?
A- Continue formal education
Continue “informal” education as well
Make “networking” part of your daily/weekly to-do list
Join a firm that has years of experience in applied problem-solving