Embed Size (px)
Citation preview
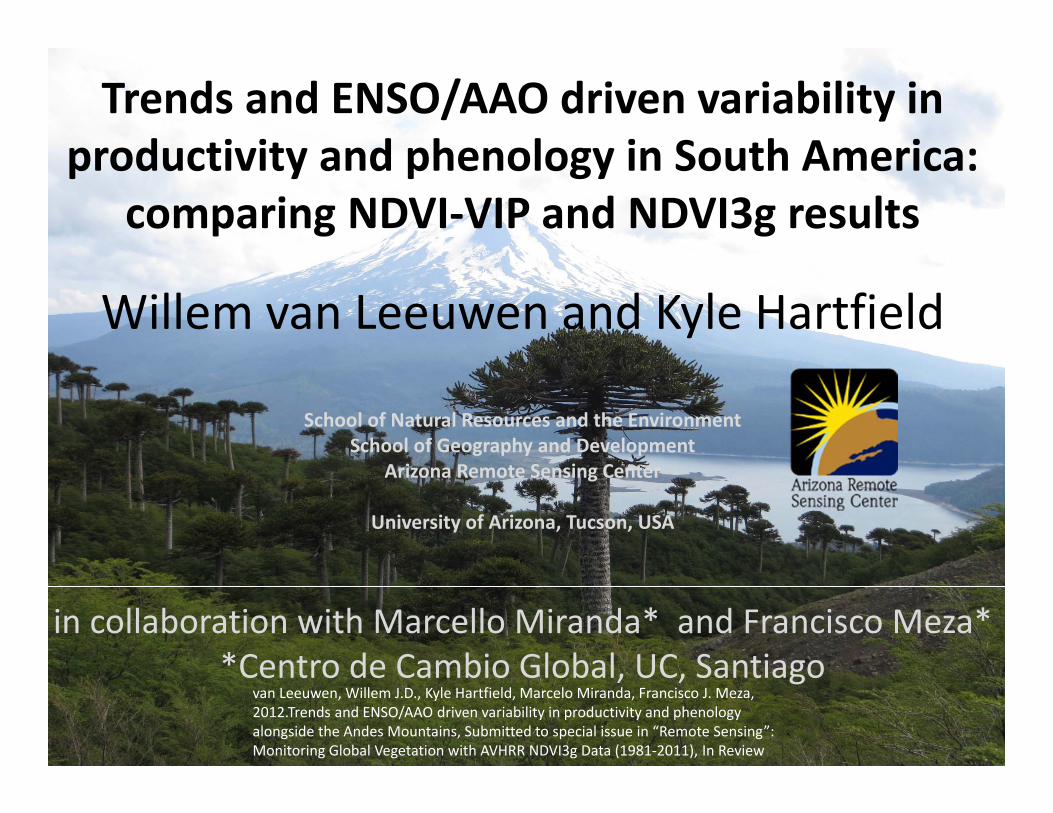
Trends and ENSO/AAO driven variability in productivity and phenology in South America:
comparing NDVI‐VIP and NDVI3g results
Willem van Leeuwen and Kyle Hartfield
School of Natural Resources and the Environment School of Geography and Development
Arizona Remote Sensing Center
University of Arizona, Tucson, USA
in collaboration with Marcello Miranda* and Francisco Meza* *Centro de Cambio Global, UC, Santiago
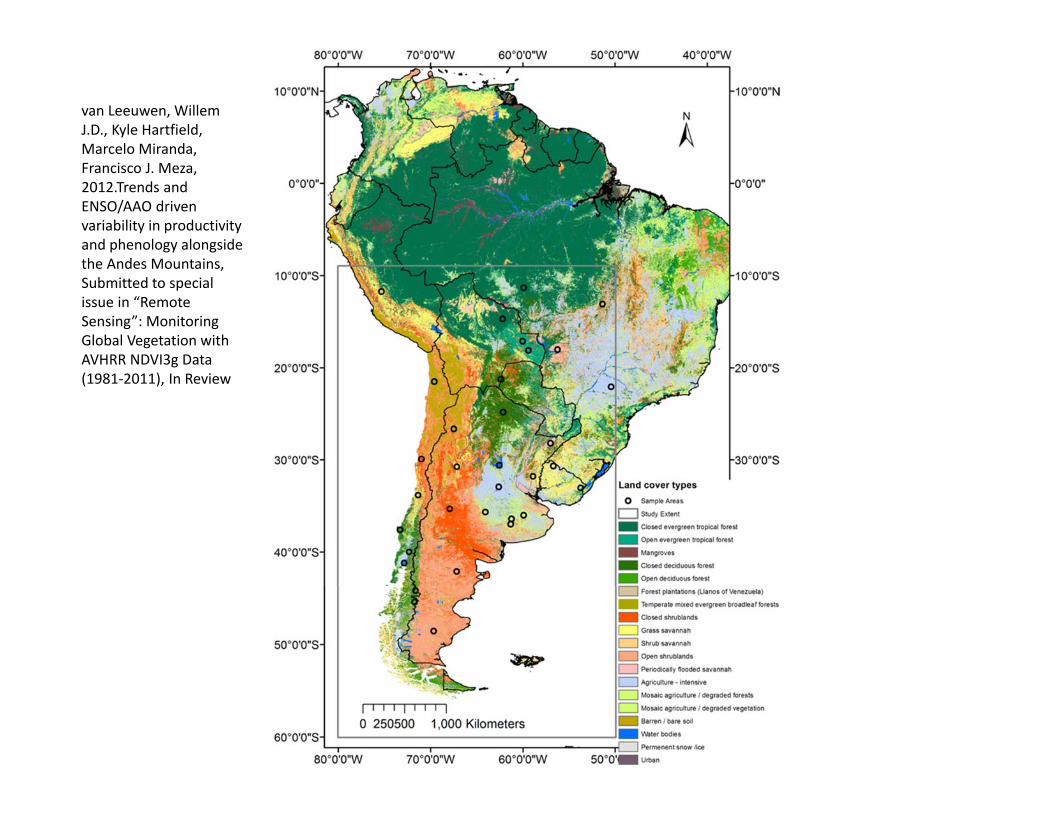
van Leeuwen, Willem J.D., Kyle Hartfield, Marcelo Miranda, Francisco J. Meza, 2012.Trends and ENSO/AAO driven variability in productivity and phenology alongside the Andes Mountains, Submitted to special issue in “Remote Sensing”: Monitoring Global Vegetation with AVHRR NDVI3g Data (1981‐2011), In Review
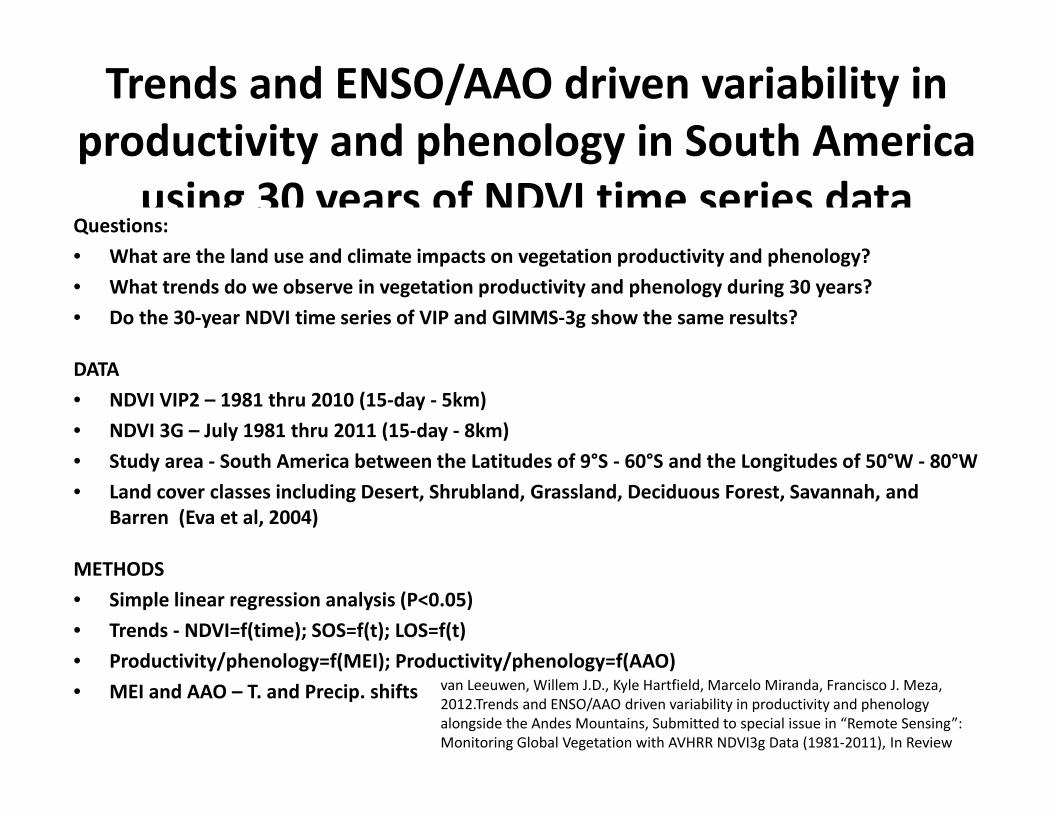
Trends and ENSO/AAO driven variability in productivity and phenology in South America
using 30 years of NDVI time series dataQuestions:• What are the land use and climate impacts on vegetation productivity and phenology?• What trends do we observe in vegetation productivity and phenology during 30 years?• Do the 30‐year NDVI time series of VIP and GIMMS‐3g show the same results?
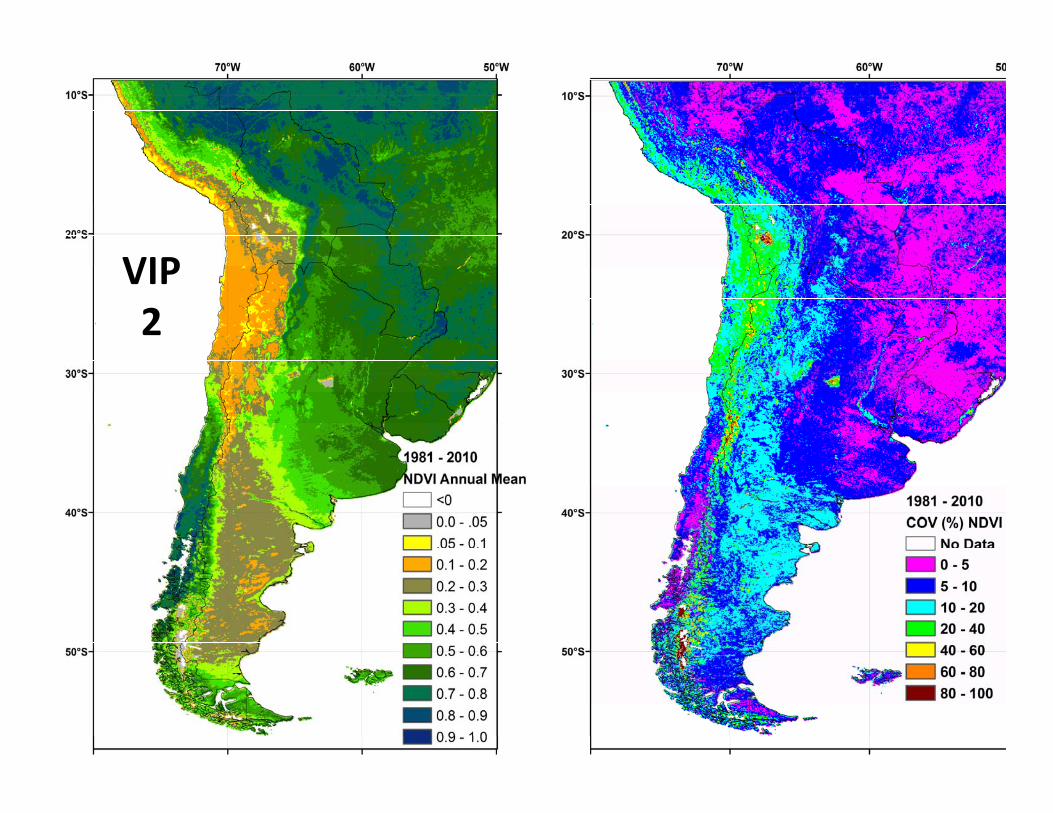
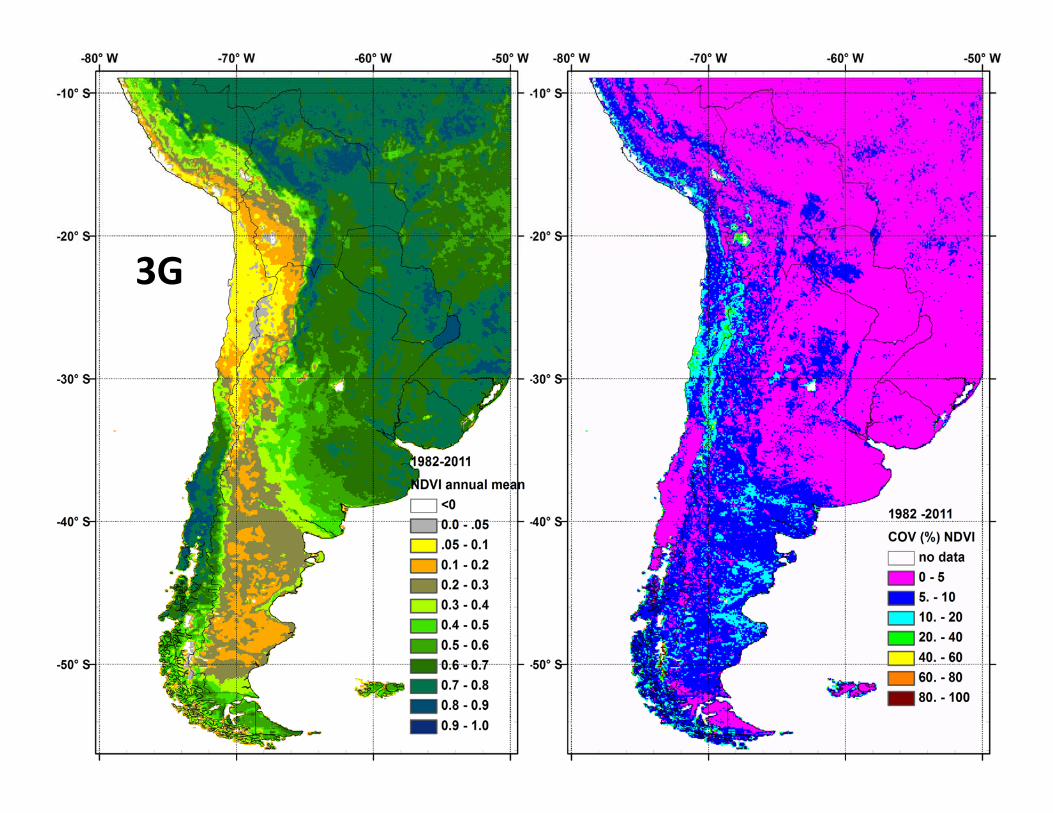
DATA • NDVI VIP2 – 1981 thru 2010 (15‐day ‐ 5km)• NDVI 3G – July 1981 thru 2011 (15‐day ‐ 8km)• Study area ‐ South America between the Latitudes of 9°S ‐ 60°S and the Longitudes of 50°W ‐ 80°W• Land cover classes including Desert, Shrubland, Grassland, Deciduous Forest, Savannah, and
Barren (Eva et al, 2004)
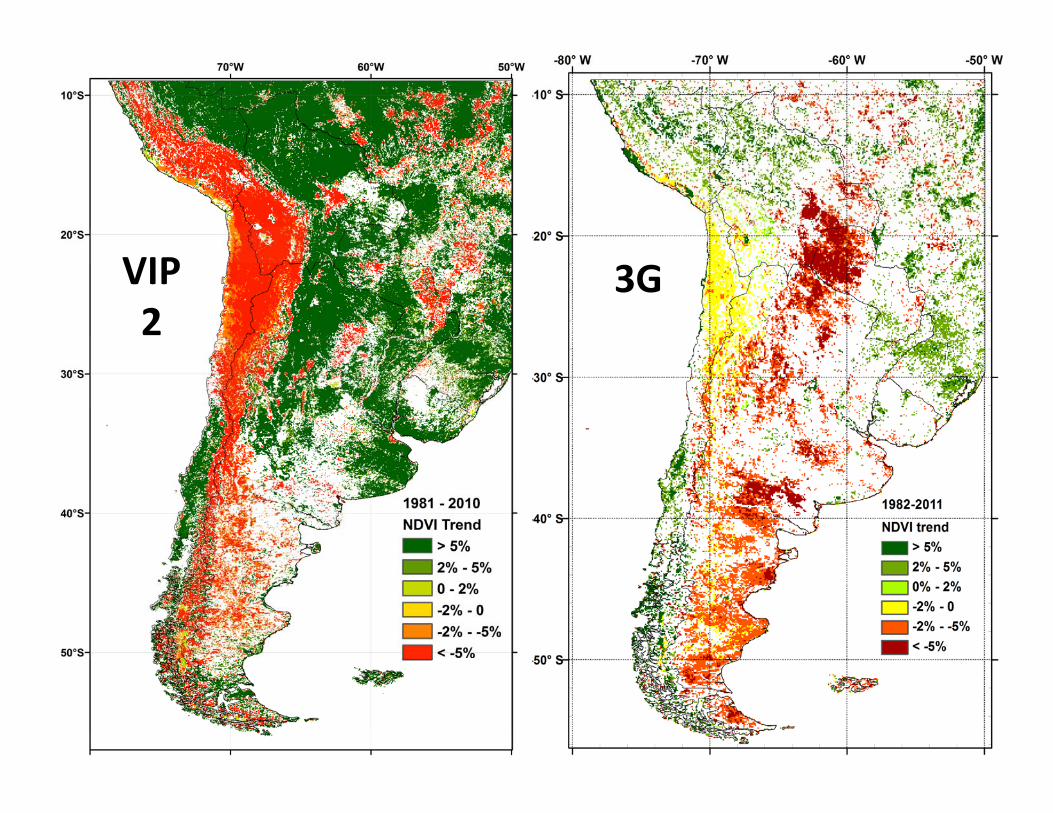
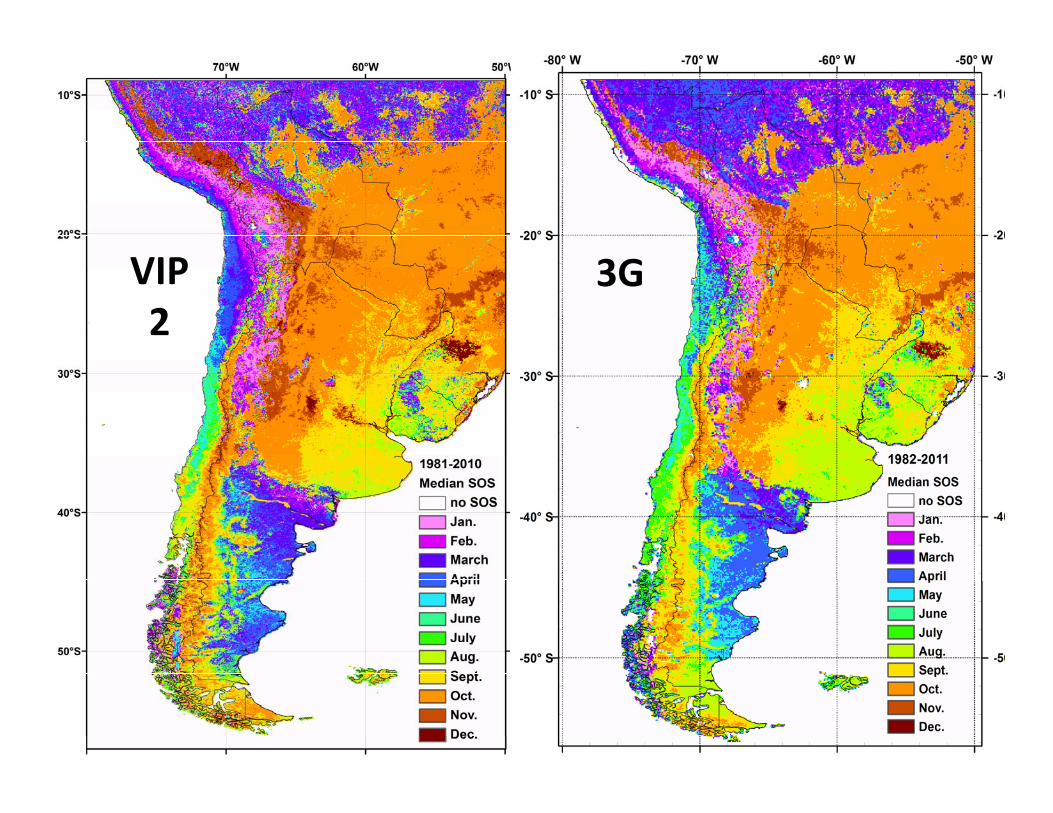
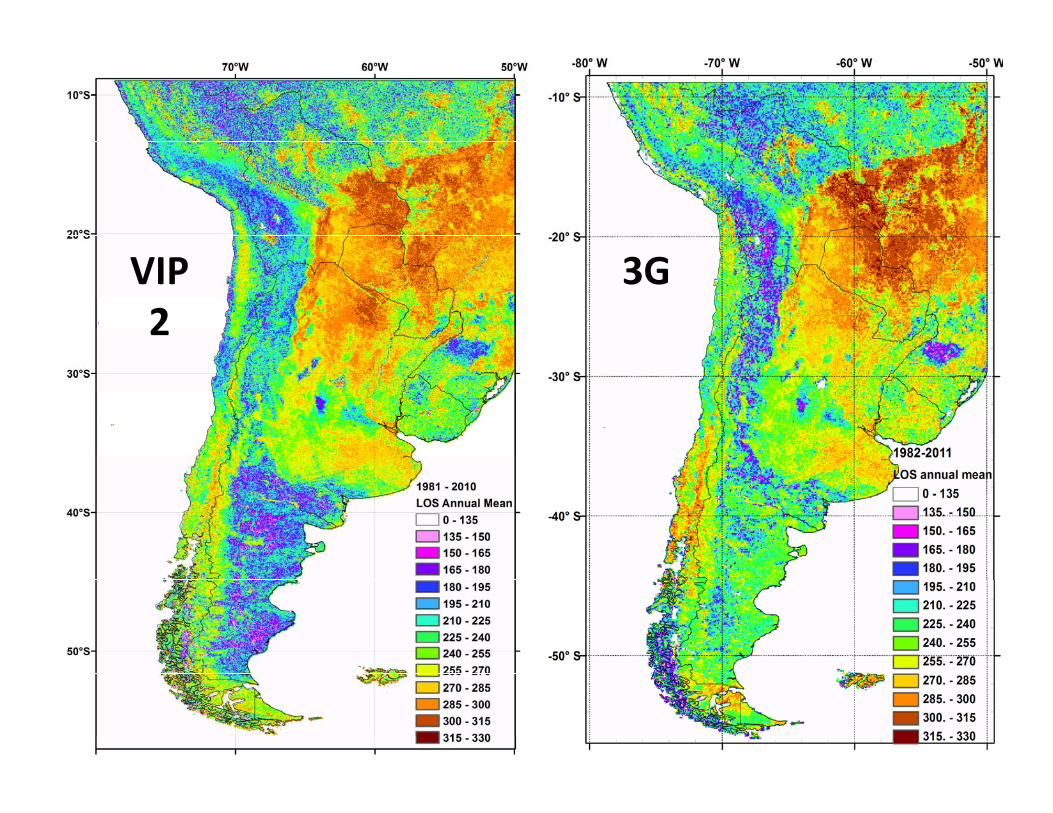
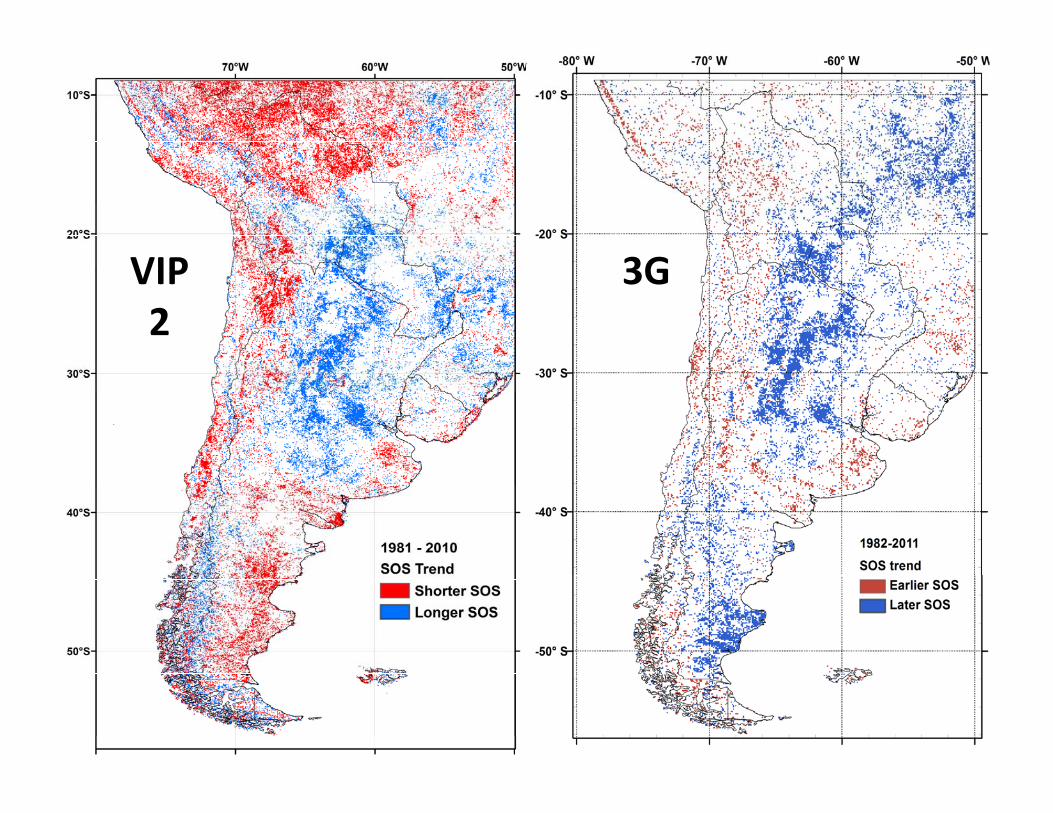
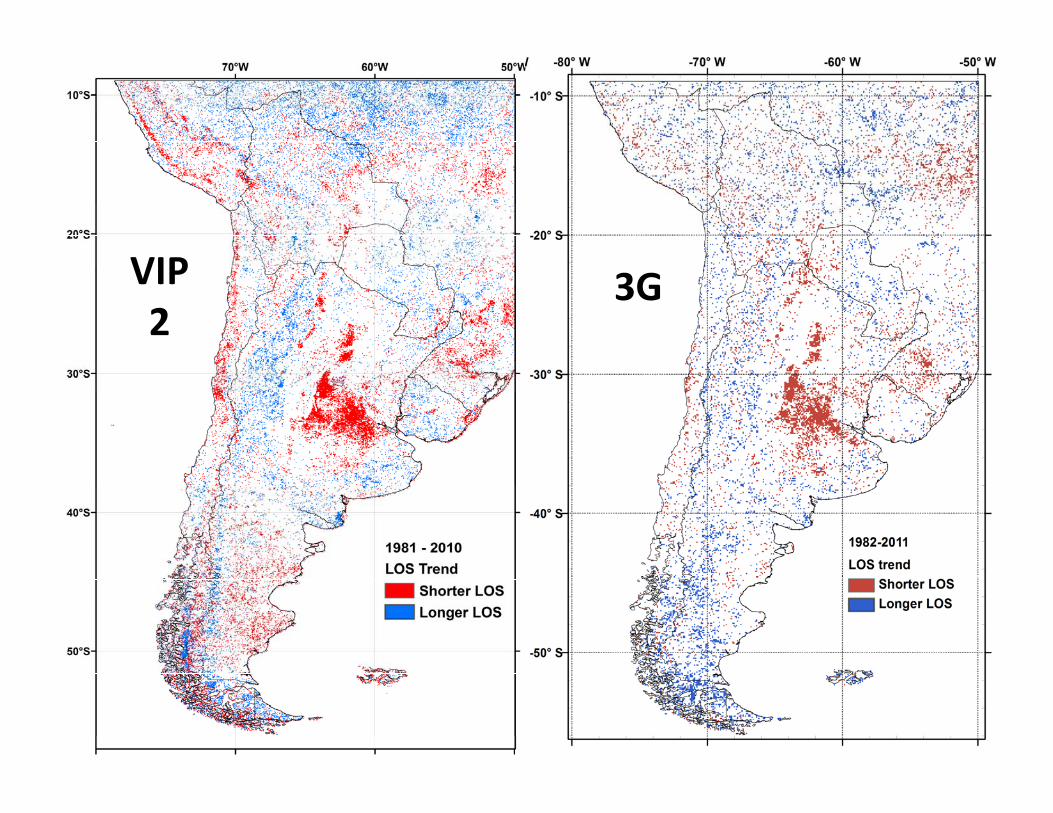
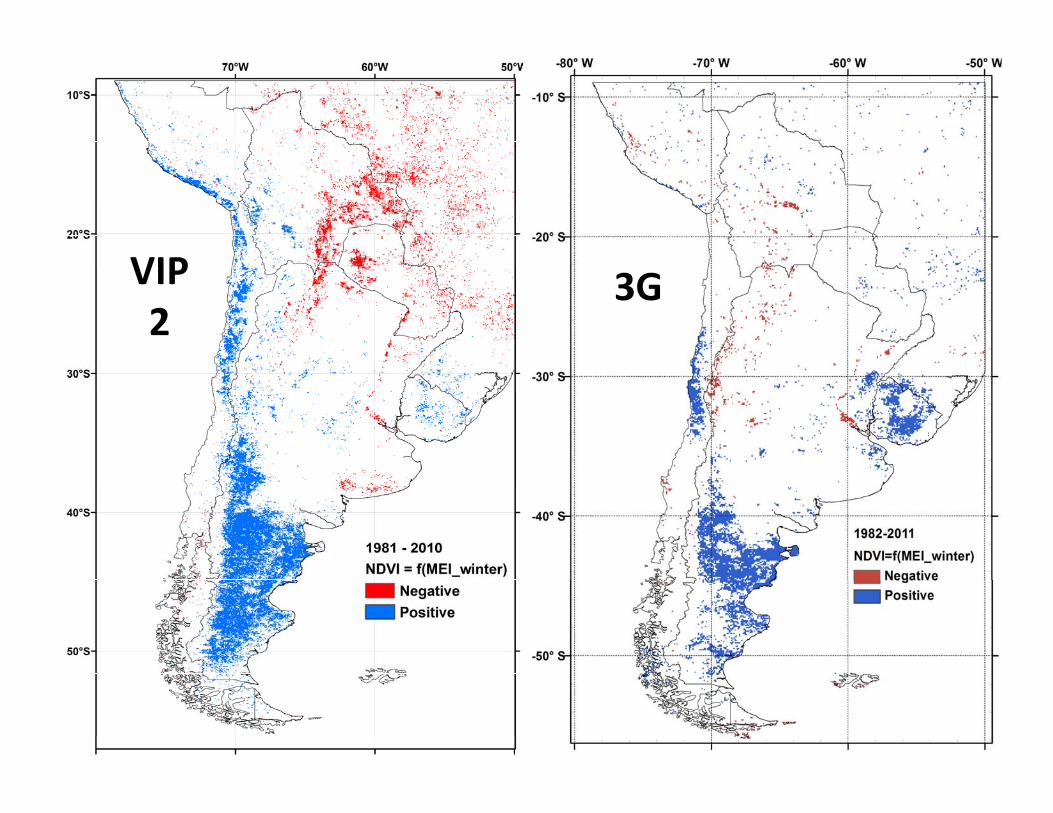
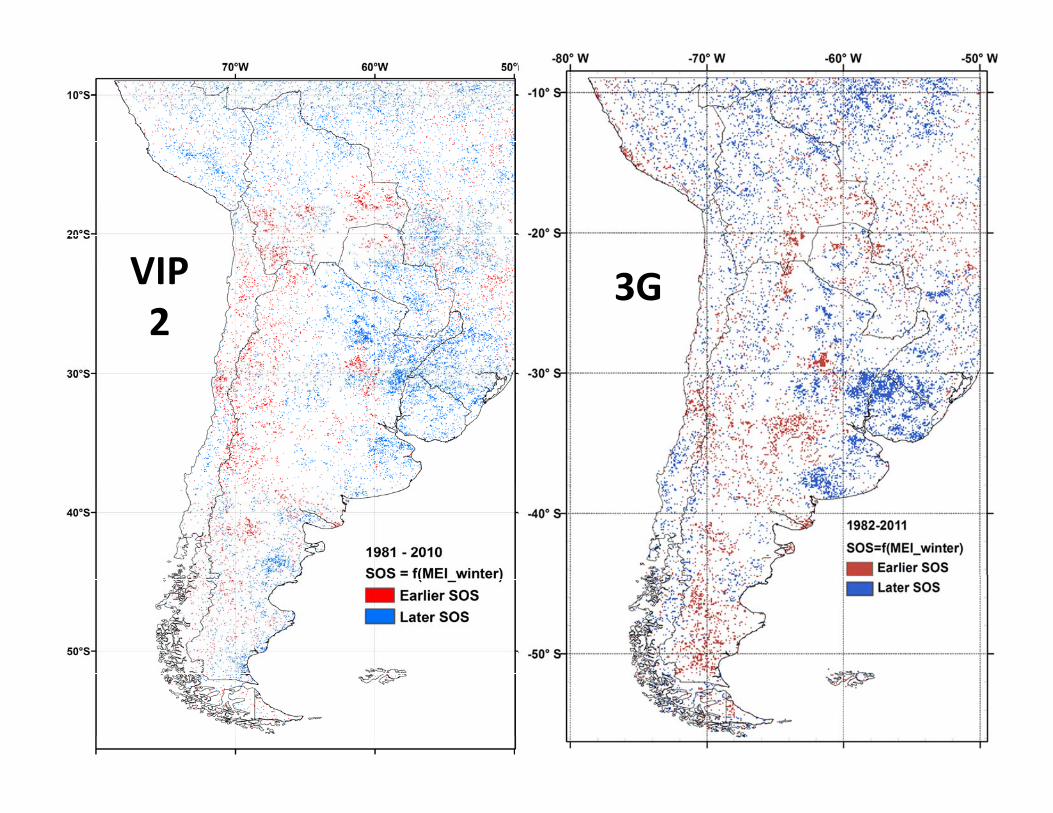
METHODS• Simple linear regression analysis (P<0.05) • Trends ‐ NDVI=f(time); SOS=f(t); LOS=f(t)• Productivity/phenology=f(MEI); Productivity/phenology=f(AAO)• MEI and AAO – T. and Precip. shifts van Leeuwen, Willem J.D., Kyle Hartfield, Marcelo Miranda, Francisco J. Meza,
2012.Trends and ENSO/AAO driven variability in productivity and phenology alongside the Andes Mountains, Submitted to special issue in “Remote Sensing”: Monitoring Global Vegetation with AVHRR NDVI3g Data (1981‐2011), In Review
van Leeuwen, Willem J.D., Kyle Hartfield, Marcelo Miranda, Francisco J. Meza, 2012.Trends and ENSO/AAO driven variability in productivity and phenology alongside the Andes Mountains, Submitted to special issue in “Remote Sensing”: Monitoring Global Vegetation with AVHRR NDVI3g Data (1981‐2011), In Review
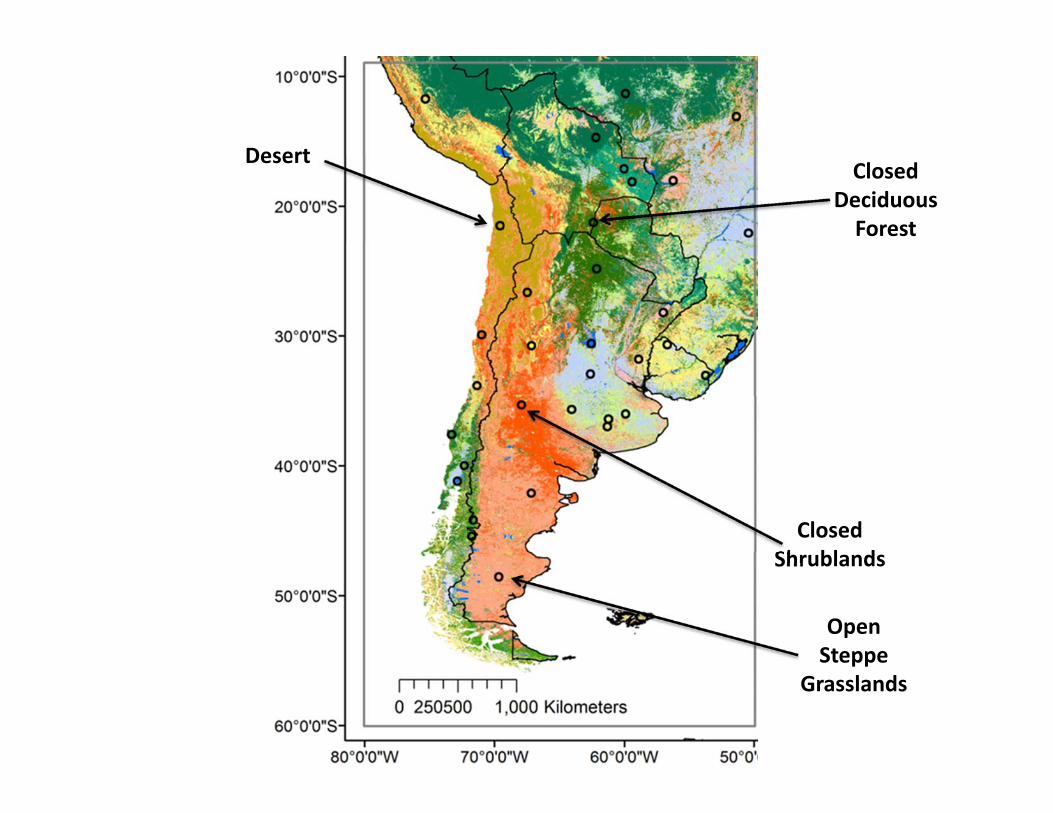
DesertClosed
Deciduous Forest
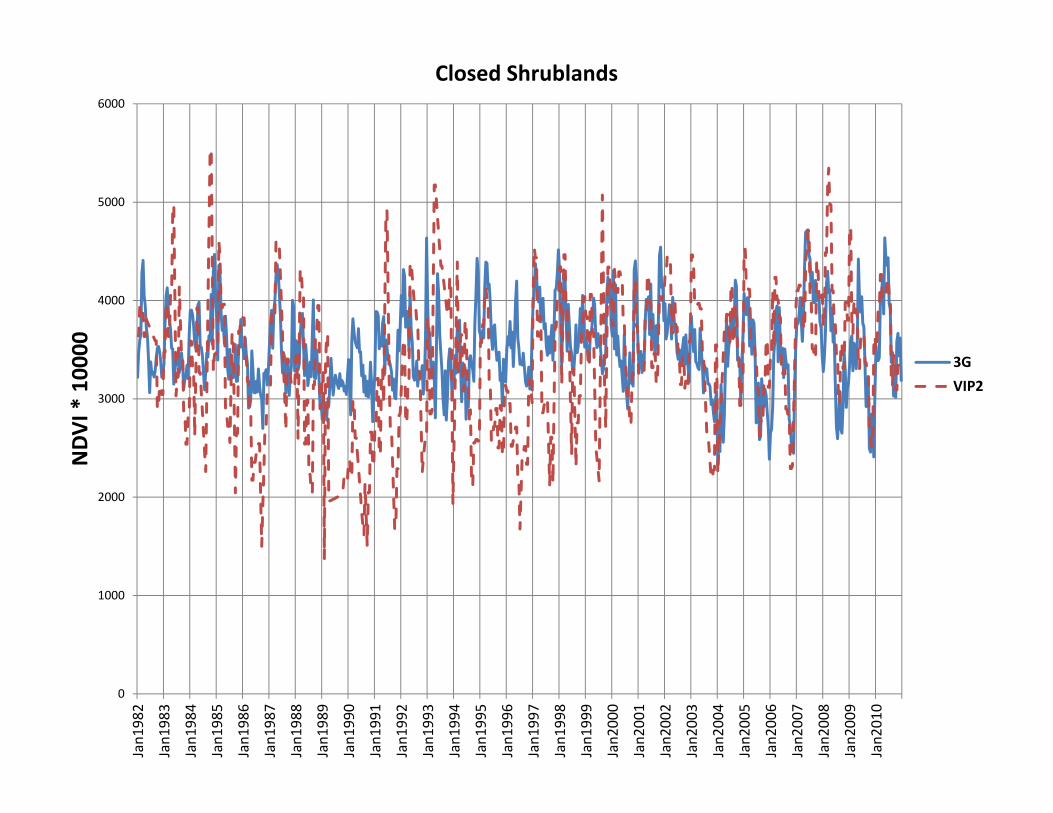
Closed Shrublands
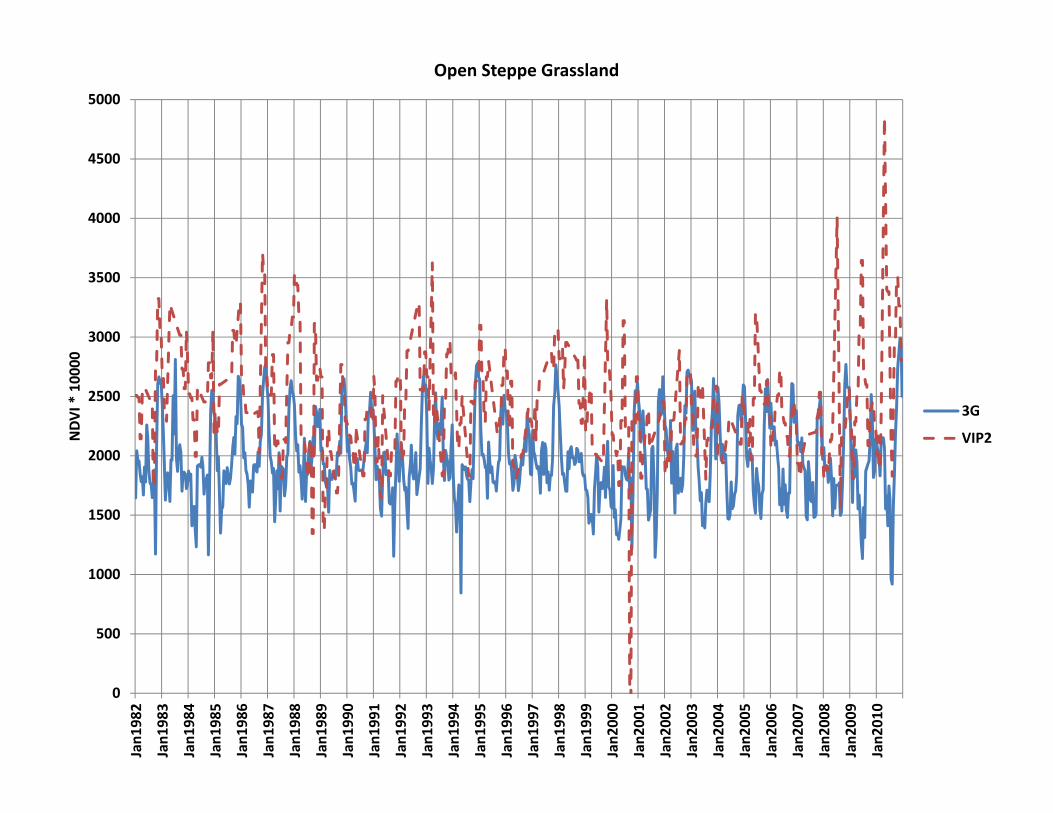
Open Steppe
Grasslands
0
1000
2000
3000
4000
5000
6000
Jan1
982
Jan1
983
Jan1
984
Jan1
985
Jan1
986
Jan1
987
Jan1
988
Jan1
989
Jan1
990
Jan1
991
Jan1
992
Jan1
993
Jan1
994
Jan1
995
Jan1
996
Jan1
997
Jan1
998
Jan1
999
Jan2
000
Jan2
001
Jan2
002
Jan2
003
Jan2
004
Jan2
005
Jan2
006
Jan2
007
Jan2
008
Jan2
009
Jan2
010
NDV
I * 10000
Closed Shrublands
3GVIP2
0
500
1000
1500
2000
2500
3000
3500
4000
4500
5000
Jan1
982
Jan1
983
Jan1
984
Jan1
985
Jan1
986
Jan1
987
Jan1
988
Jan1
989
Jan1
990
Jan1
991
Jan1
992
Jan1
993
Jan1
994
Jan1
995
Jan1
996
Jan1
997
Jan1
998
Jan1
999
Jan2
000
Jan2
001
Jan2
002
Jan2
003
Jan2
004
Jan2
005
Jan2
006
Jan2
007
Jan2
008
Jan2
009
Jan2
010
NDV
I * 10000
Open Steppe Grassland
3G
VIP2
0
1000
2000
3000
4000
5000
6000
7000
8000
9000
10000
Jan1
982
Jan1
983
Jan1
984
Jan1
985
Jan1
986
Jan1
987
Jan1
988
Jan1
989
Jan1
990
Jan1
991
Jan1
992
Jan1
993
Jan1
994
Jan1
995
Jan1
996
Jan1
997
Jan1
998
Jan1
999
Jan2
000
Jan2
001
Jan2
002
Jan2
003
Jan2
004
Jan2
005
Jan2
006
Jan2
007
Jan2
008
Jan2
009
Jan2
010
NDV
I * 10000
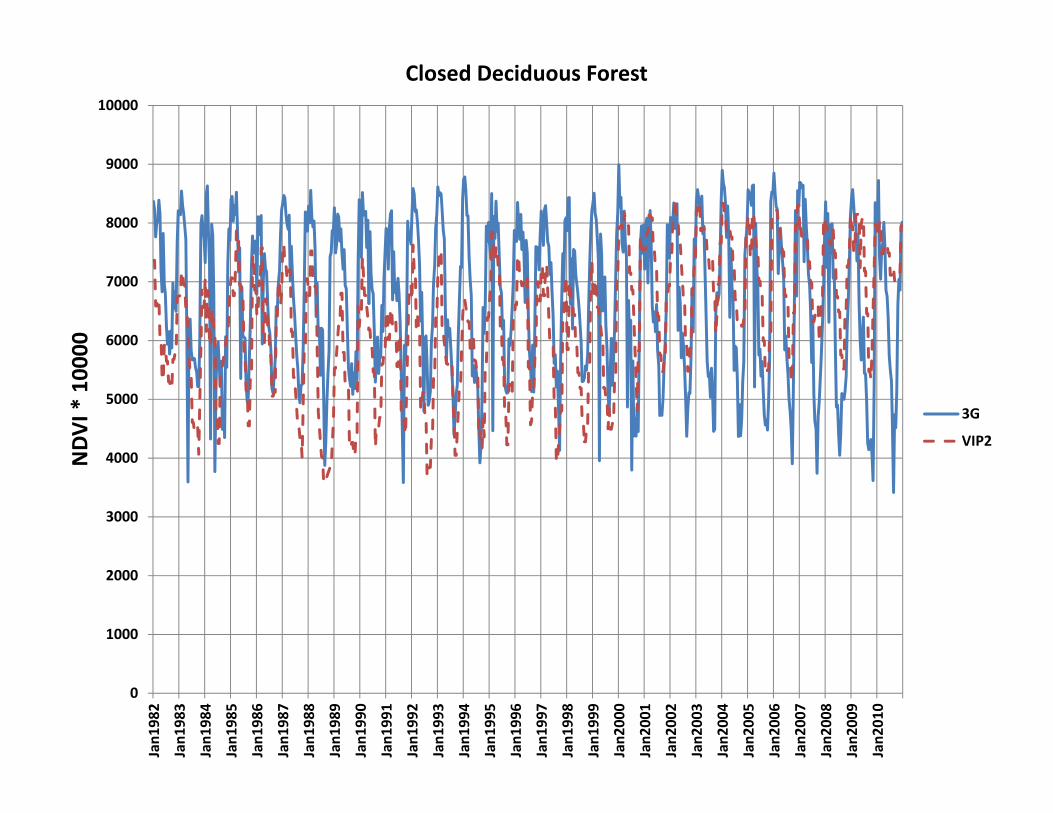
Closed Deciduous Forest
3G
VIP2
0
500
1000
1500
2000
2500
3000
3500
4000
Jan1
982
Jan1
983
Jan1
984
Jan1
985
Jan1
986
Jan1
987
Jan1
988
Jan1
989
Jan1
990
Jan1
991
Jan1
992
Jan1
993
Jan1
994
Jan1
995
Jan1
996
Jan1
997
Jan1
998
Jan1
999
Jan2
000
Jan2
001
Jan2
002
Jan2
003
Jan2
004
Jan2
005
Jan2
006
Jan2
007
Jan2
008
Jan2
009
Jan2
010
NDV
I * 10000
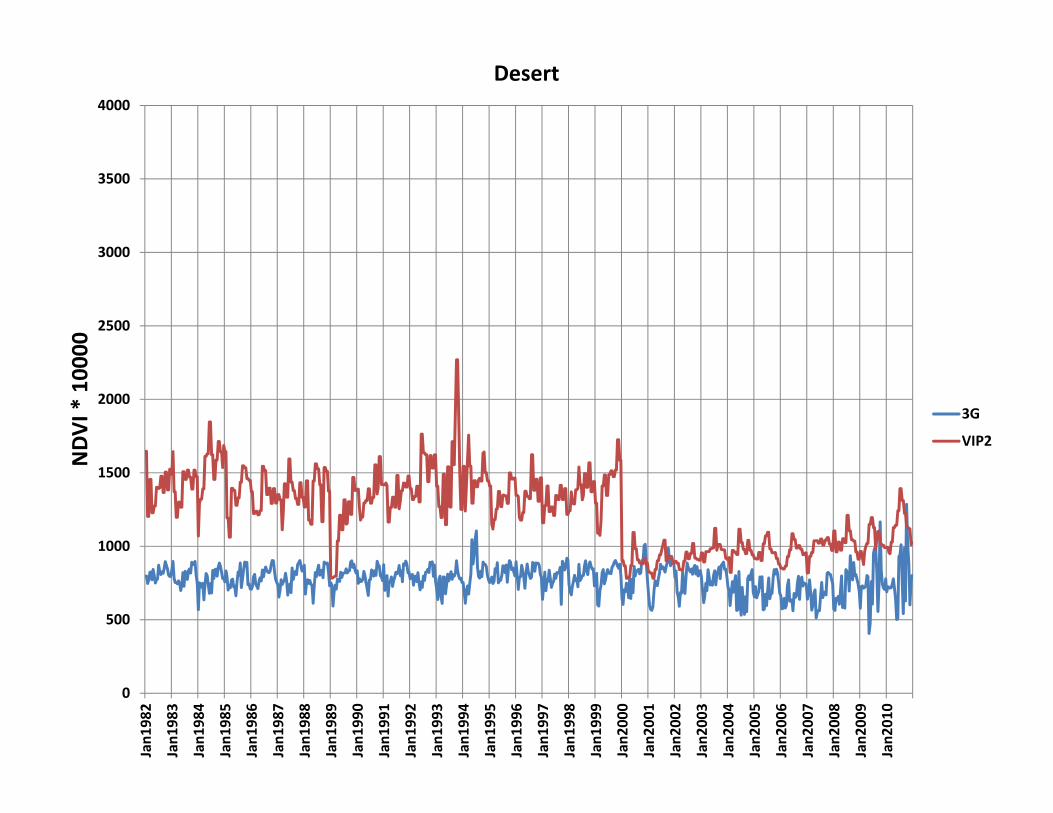
Desert
3G
VIP2
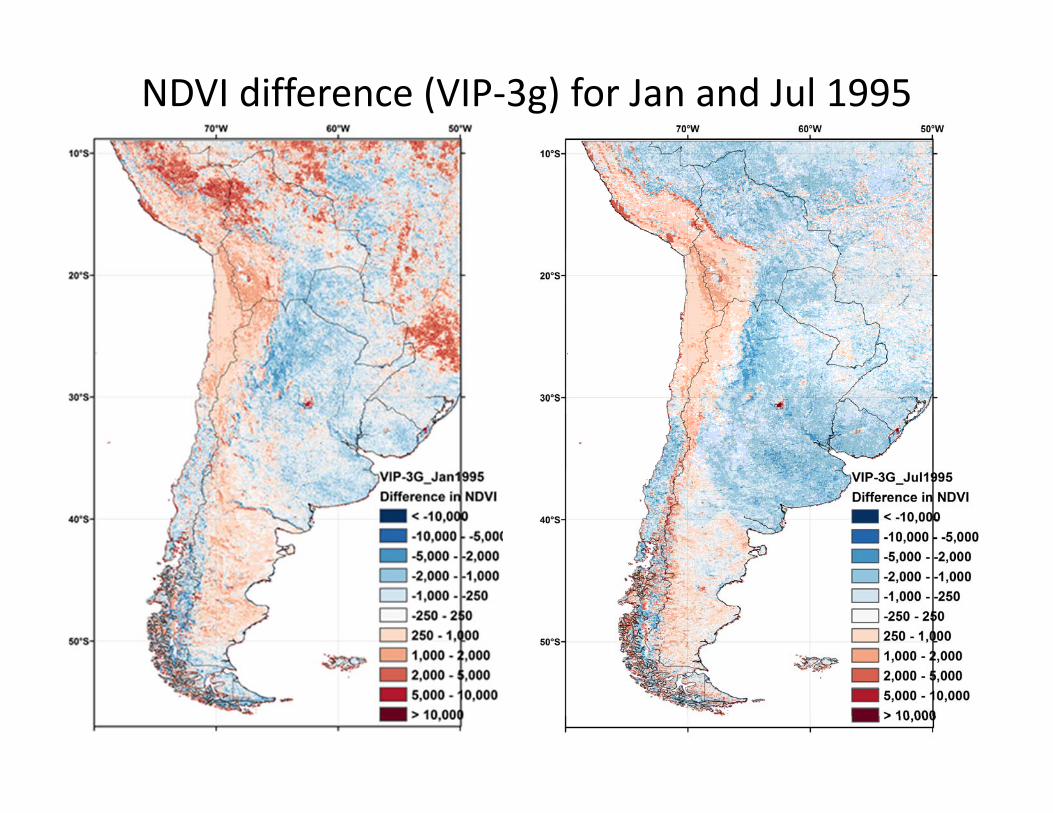
NDVI difference (VIP‐3g) for Jan and Jul 1995
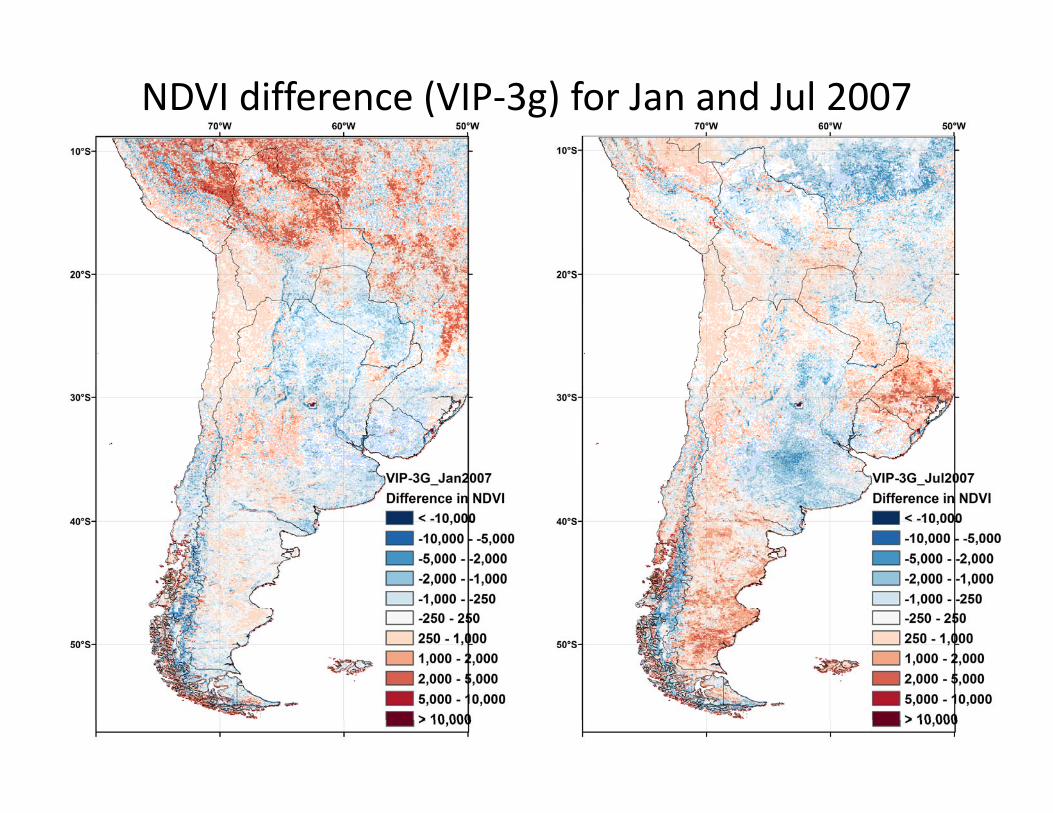
NDVI difference (VIP‐3g) for Jan and Jul 2007
VIP2
3G
VIP2
3G
VIP2
3G
VIP2
3G
VIP2
3G
3GVIP2
VIP2
3G
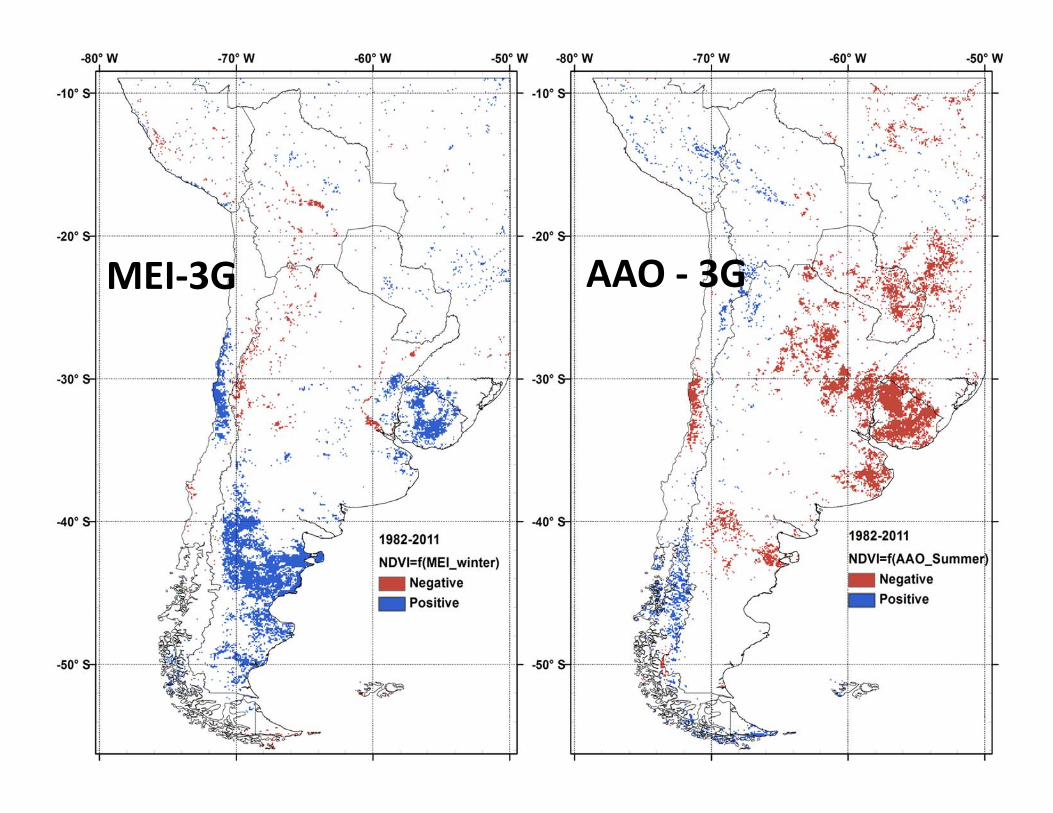
MEI‐3G AAO ‐ 3G
VIP2
3G
Preliminary Conclusions
• Large NDVI differences between VIP and 3g• SOS and LOS patterns from VIP and 3g more similar
• Phenology and productivity trends are very different between VIP and 3g
• MEI and AAO impacts on productivity and phenology show different patterns between VIP and 3g