Embed Size (px)
Citation preview

217 217 217
200 200 200
255 255 255
0 0 0
163 163 163
131 132 122
239 65 53
110 135 120
112 92 56
62 102 130
102 56 48
130 120 111
237 237 237
80 119 27
252 174 .59
83 36
118
1
Angela M. Duren, P.E., P.H. USACE Portland District Senior Hydrologist 2017 Oregon Dam Safety and Reservoir Resilience Conference 28 February 2017
WILLAMETTE BASIN DAM SAFETY HYDROLOGIC STUDIES
Pasayten Wildnerness, WA Photo by Jeff Kish

OUTLINE
Dam Safety in the Corps Willamette Goals Hydrologic Assessment Approach for Dam
Safety in the Corps Brief Basin Background Site-Specific PMP Technical Approach Site-Specific PMF Technical Approach Hydrologic Loading Technical Approach Other Basin Hydrologic Studies

USACE DAM SAFETY RISK ASSESSMENT PROGRAM
USACE has over 700 Dams 2005 ASCE Infrastructure Report Card = F USACE Response = Risk Management
Center (Official in 2009) USBR Risk Assessment Approach to Assess Dam Risk
and Prioritizing Dam Remediation
As of 2015, Over 350 Dams have Undergone at Least 1 Round of Risk Assessment (Many have Undergone Multiple Rounds)
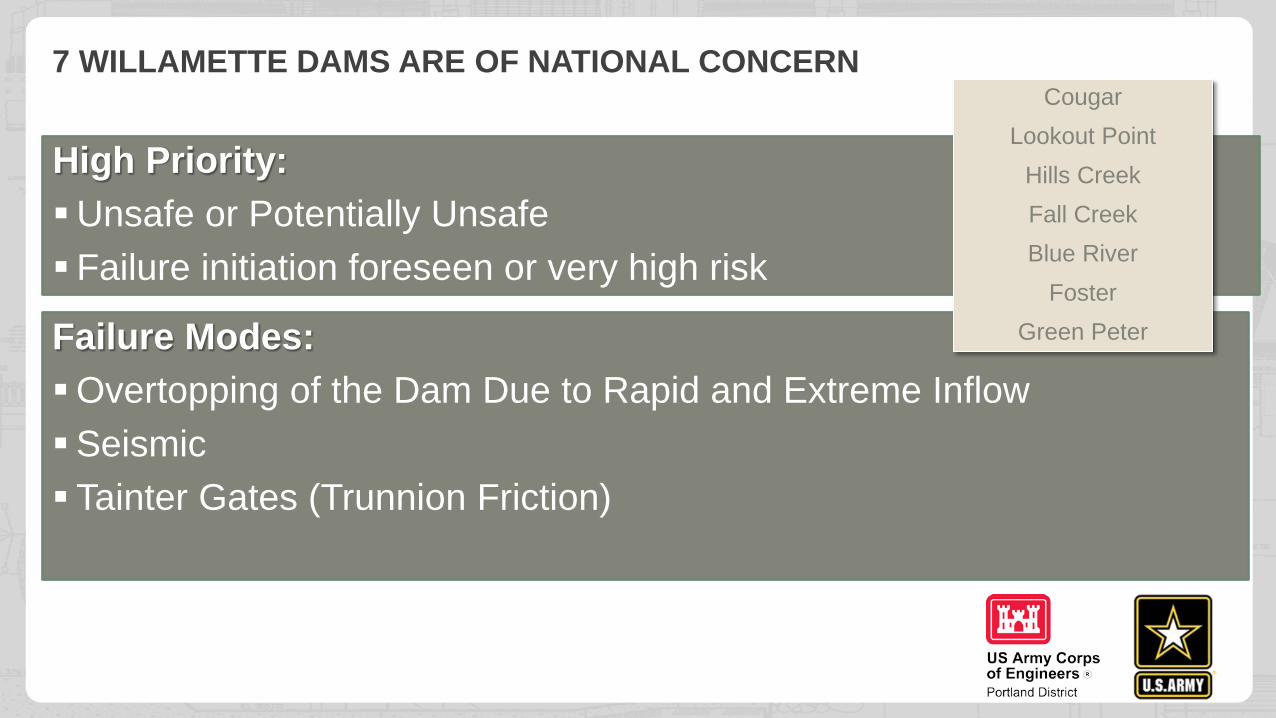
High Priority: Unsafe or Potentially Unsafe Failure initiation foreseen or very high risk
Failure Modes: Overtopping of the Dam Due to Rapid and Extreme Inflow Seismic Tainter Gates (Trunnion Friction)
Cougar Lookout Point
Hills Creek Fall Creek Blue River
Foster Green Peter
7 WILLAMETTE DAMS ARE OF NATIONAL CONCERN
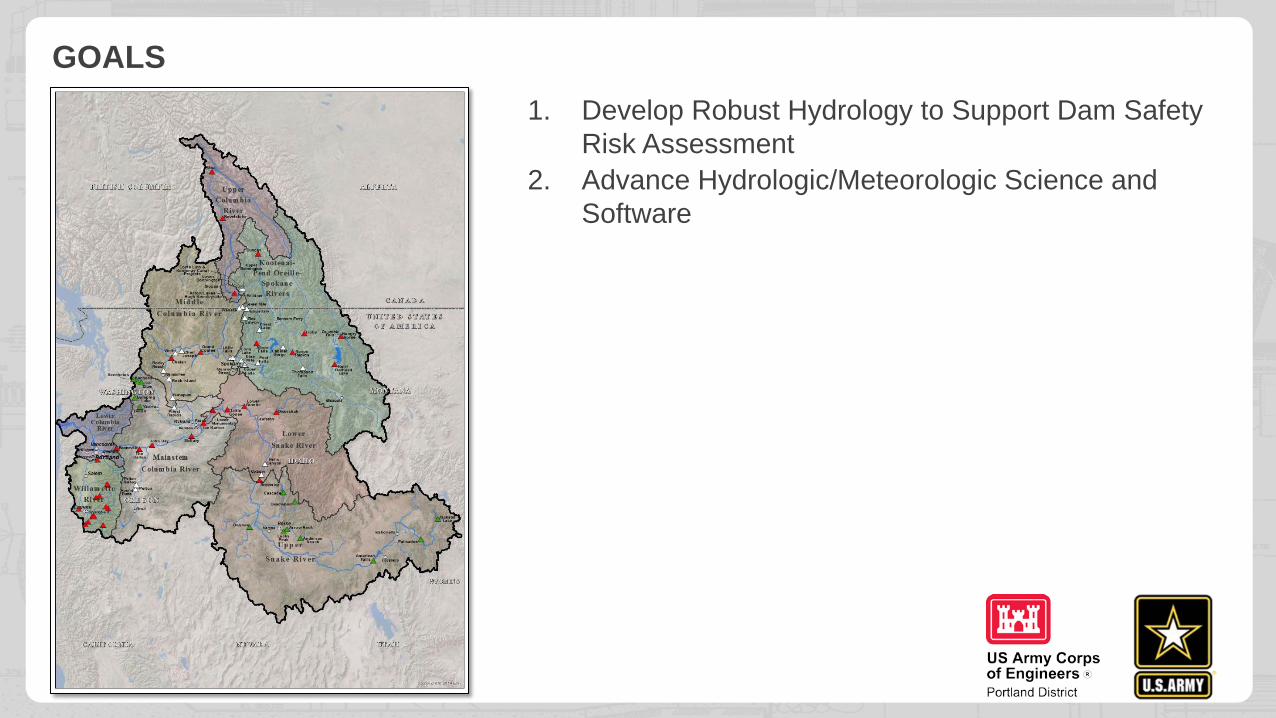
GOALS 1. Develop Robust Hydrology to Support Dam Safety
Risk Assessment 2. Advance Hydrologic/Meteorologic Science and
Software
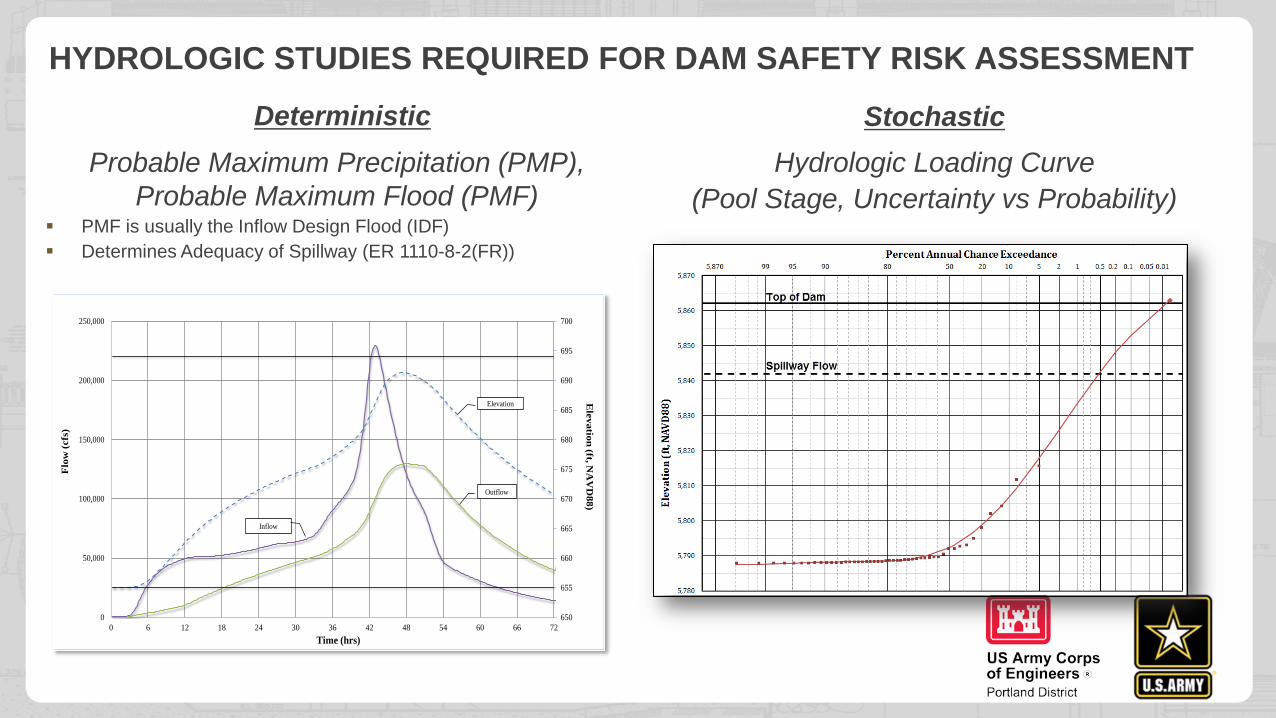
HYDROLOGIC STUDIES REQUIRED FOR DAM SAFETY RISK ASSESSMENT
Probable Maximum Precipitation (PMP), Probable Maximum Flood (PMF)
PMF is usually the Inflow Design Flood (IDF) Determines Adequacy of Spillway (ER 1110-8-2(FR))
Hydrologic Loading Curve (Pool Stage, Uncertainty vs Probability)
650
655
660
665
670
675
680
685
690
695
700
0
50,000
100,000
150,000
200,000
250,000
0 6 12 18 24 30 36 42 48 54 60 66 72
Elevation (ft, N
AV
D88)
Flo
w (c
fs)
Time (hrs)
Inflow
Outflow
Elevation
Stochastic
Deterministic
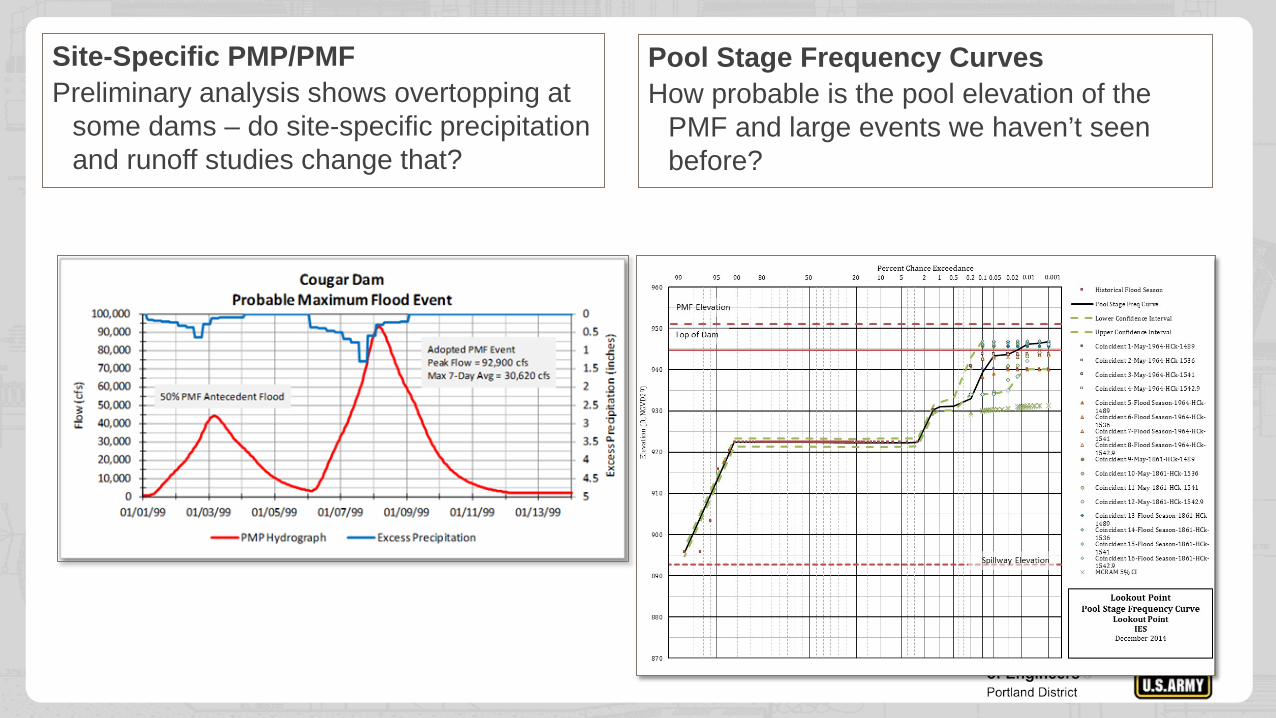
Site-Specific PMP/PMF Preliminary analysis shows overtopping at
some dams – do site-specific precipitation and runoff studies change that?
Pool Stage Frequency Curves How probable is the pool elevation of the
PMF and large events we haven’t seen before?
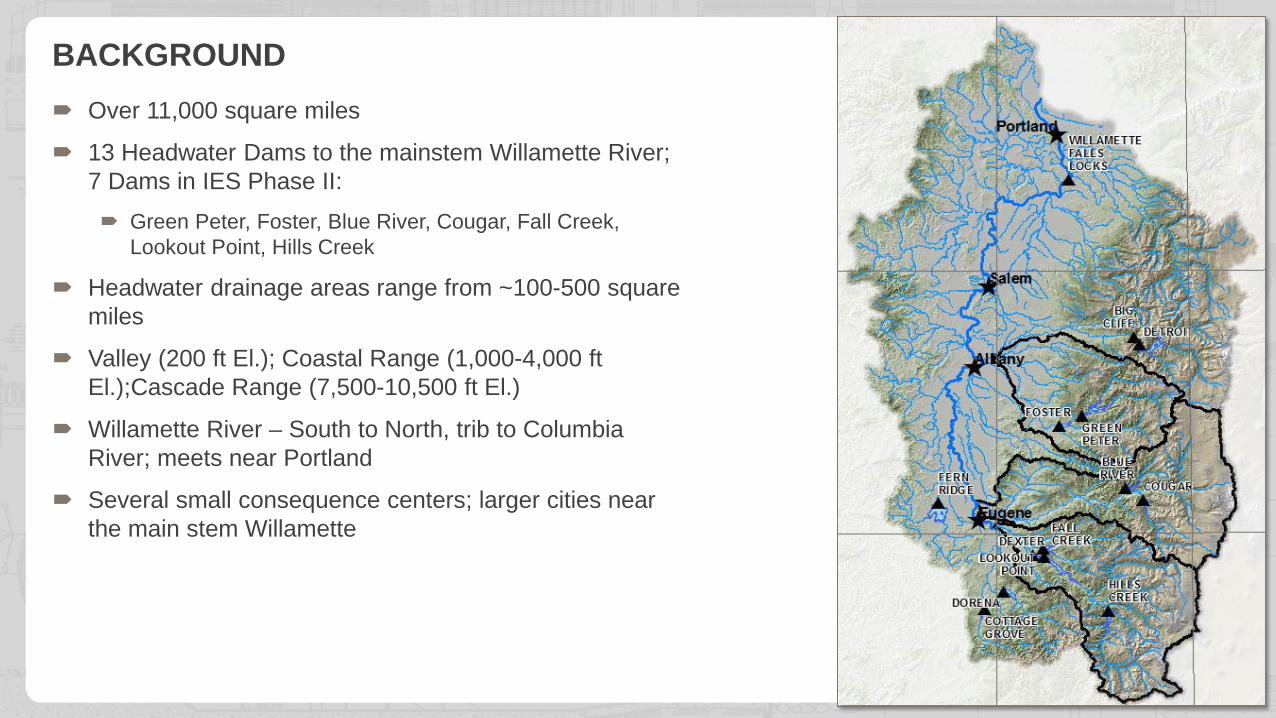
BACKGROUND Over 11,000 square miles
13 Headwater Dams to the mainstem Willamette River; 7 Dams in IES Phase II: Green Peter, Foster, Blue River, Cougar, Fall Creek,
Lookout Point, Hills Creek
Headwater drainage areas range from ~100-500 square miles
Valley (200 ft El.); Coastal Range (1,000-4,000 ft El.);Cascade Range (7,500-10,500 ft El.)
Willamette River – South to North, trib to Columbia River; meets near Portland
Several small consequence centers; larger cities near the main stem Willamette
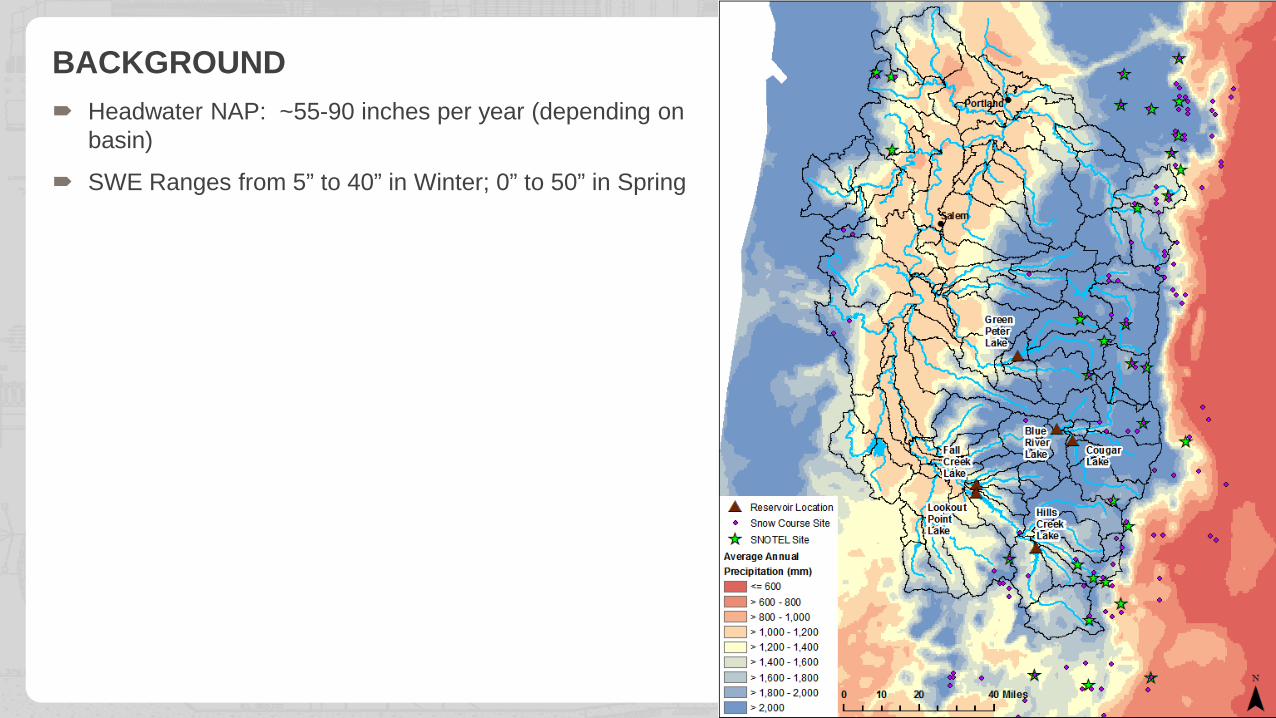
BACKGROUND Headwater NAP: ~55-90 inches per year (depending on
basin)
SWE Ranges from 5” to 40” in Winter; 0” to 50” in Spring
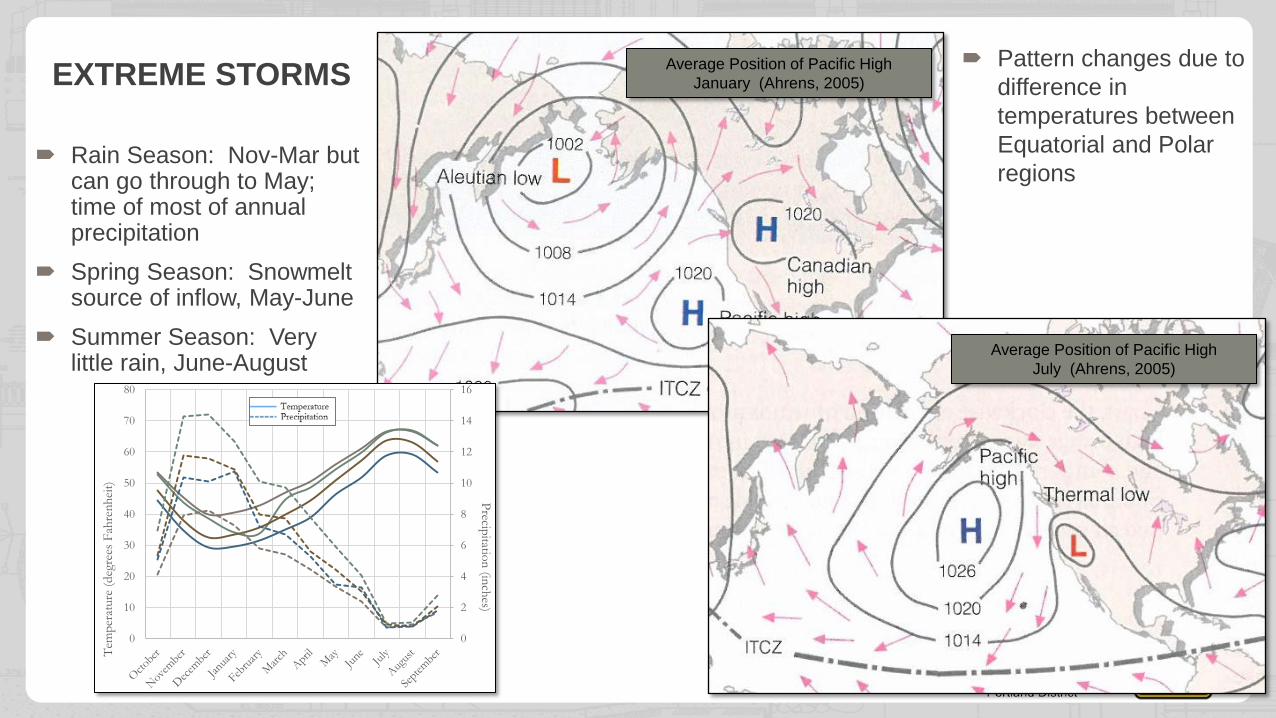
EXTREME STORMS Pattern changes due to difference in temperatures between Equatorial and Polar regions
Average Position of Pacific High January (Ahrens, 2005)
Average Position of Pacific High July (Ahrens, 2005)
Rain Season: Nov-Mar but can go through to May; time of most of annual precipitation
Spring Season: Snowmelt source of inflow, May-June
Summer Season: Very little rain, June-August
0
2
4
6
8
10
12
14
16
0
10
20
30
40
50
60
70
80
Precipitation (inches)
Tem
pera
ture
(deg
rees
Fah
renh
eit)
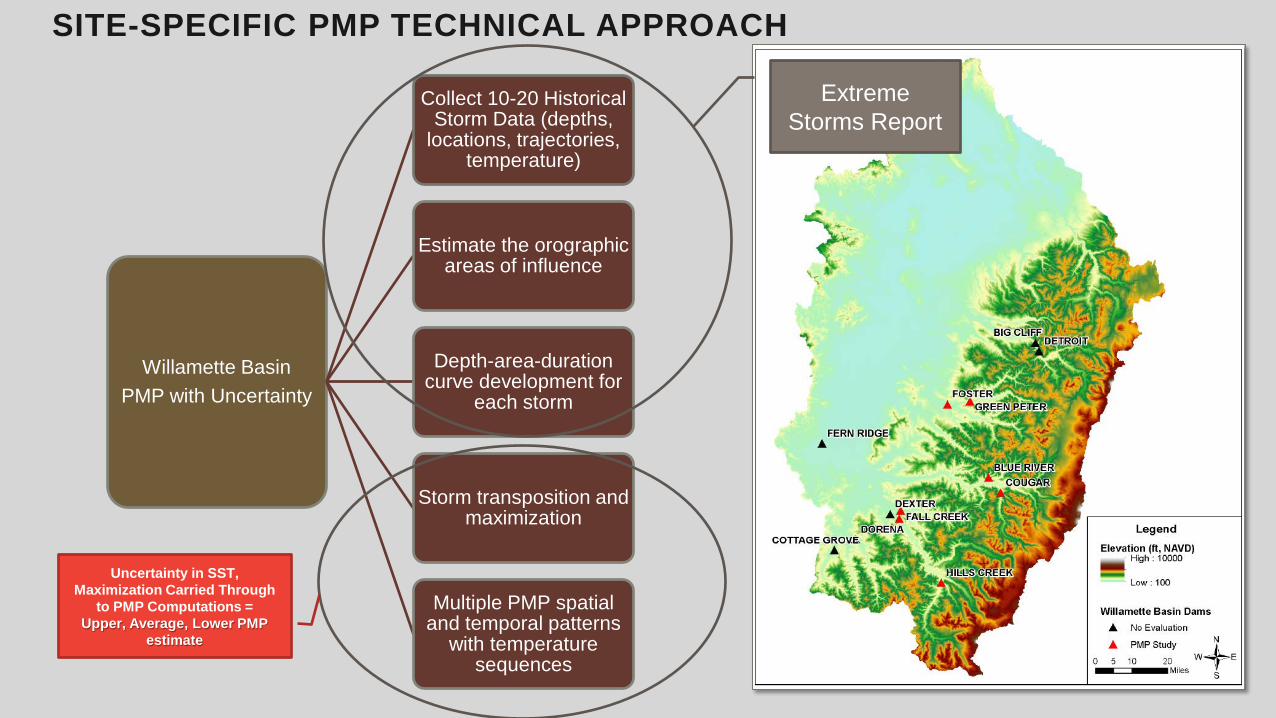
Willamette Basin PMP with Uncertainty
Collect 10-20 Historical Storm Data (depths,
locations, trajectories, temperature)
Estimate the orographic areas of influence
Depth-area-duration curve development for
each storm
Storm transposition and maximization
Multiple PMP spatial and temporal patterns
with temperature sequences
SITE-SPECIFIC PMP TECHNICAL APPROACH
Extreme Storms Report
Uncertainty in SST, Maximization Carried Through
to PMP Computations = Upper, Average, Lower PMP
estimate
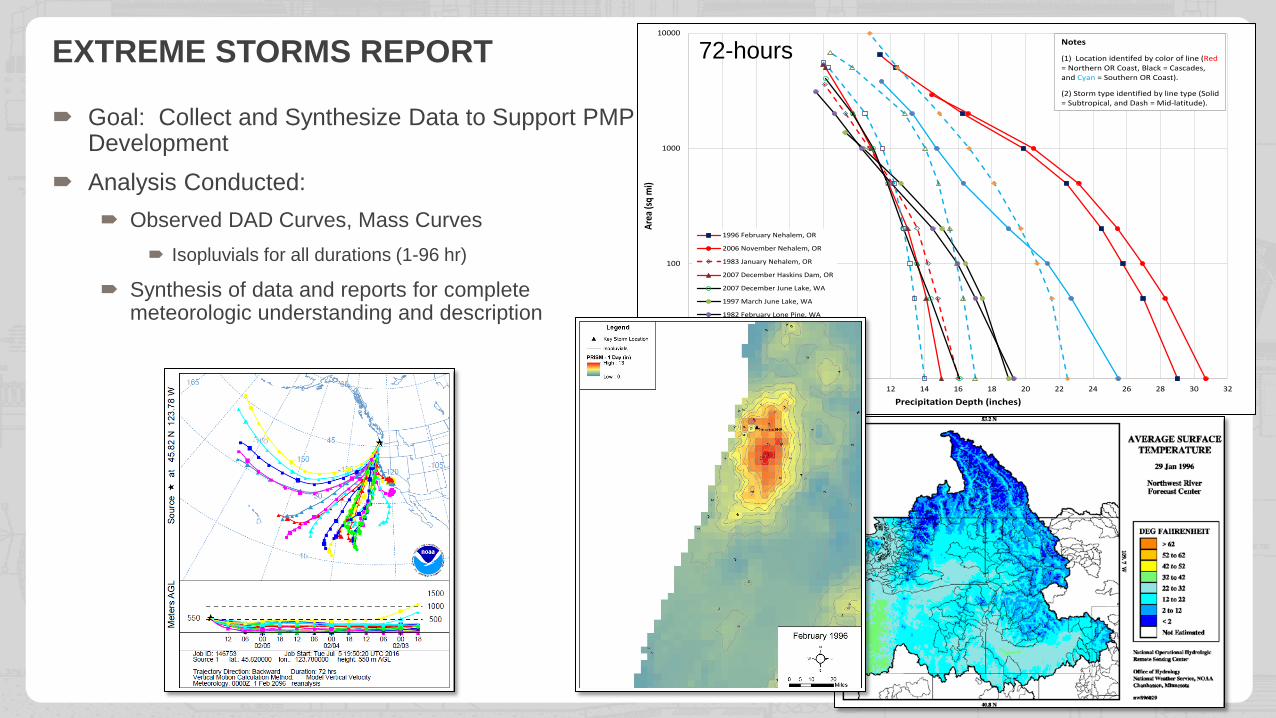
EXTREME STORMS REPORT
10
100
1000
10000
0 2 4 6 8 10 12 14 16 18 20 22 24 26 28 30 32
Area
(sq
mi)
Precipitation Depth (inches)
1996 February Nehalem, OR
2006 November Nehalem, OR
1983 January Nehalem, OR
2007 December Haskins Dam, OR
2007 December June Lake, WA
1997 March June Lake, WA
1982 February Lone Pine, WA
2012 January Port Orford, OR
1996 November Port Orford, OR
2008 December Brookings, OR
2014 December Brookings, OR
Notes
(1) Location identifed by color of line (Red= Northern OR Coast, Black = Cascades, and Cyan = Southern OR Coast).
(2) Storm type identified by line type (Solid = Subtropical, and Dash = Mid-latitude).
72-hours
Goal: Collect and Synthesize Data to Support PMP Development
Analysis Conducted: Observed DAD Curves, Mass Curves
Isopluvials for all durations (1-96 hr)
Synthesis of data and reports for complete meteorologic understanding and description
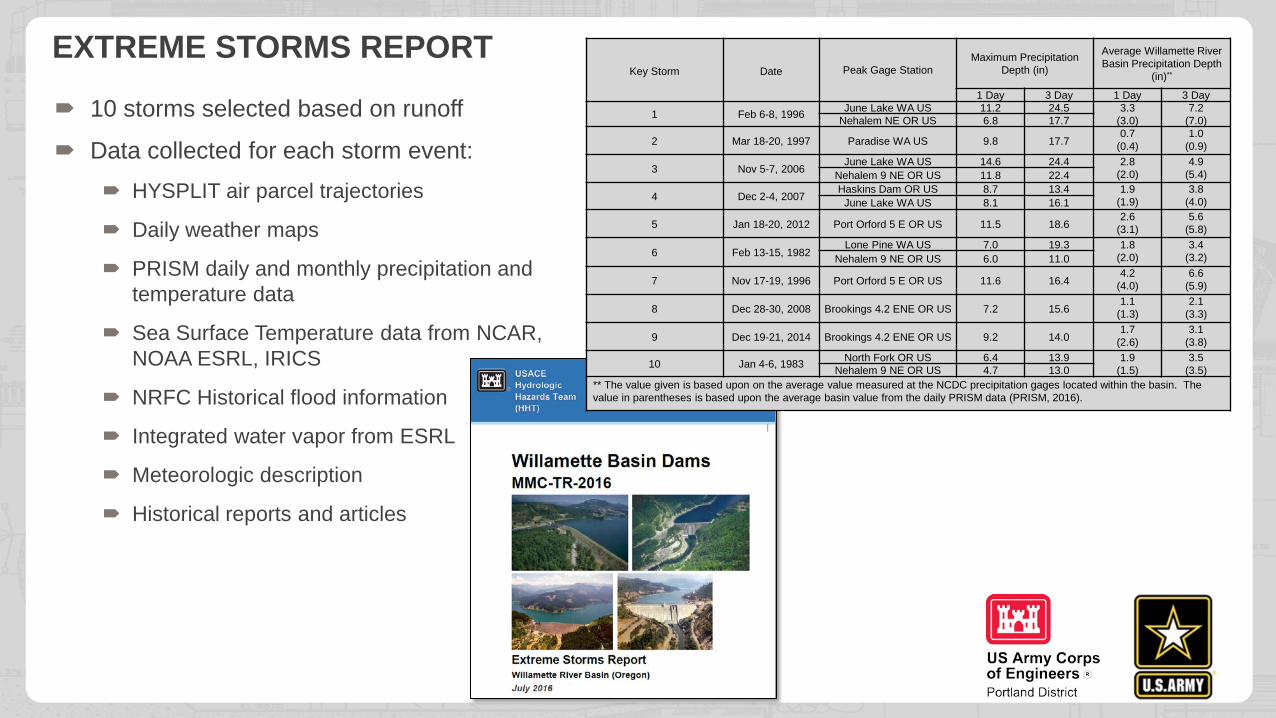
EXTREME STORMS REPORT Key Storm Date Peak Gage Station
Maximum Precipitation Depth (in)
Average Willamette River Basin Precipitation Depth
(in)**
1 Day 3 Day 1 Day 3 Day
1 Feb 6-8, 1996 June Lake WA US 11.2 24.5 3.3 (3.0)
7.2 (7.0) Nehalem NE OR US 6.8 17.7
2 Mar 18-20, 1997 Paradise WA US 9.8 17.7 0.7
(0.4) 1.0
(0.9)
3 Nov 5-7, 2006 June Lake WA US 14.6 24.4 2.8
(2.0) 4.9
(5.4) Nehalem 9 NE OR US 11.8 22.4
4 Dec 2-4, 2007 Haskins Dam OR US 8.7 13.4 1.9
(1.9) 3.8
(4.0) June Lake WA US 8.1 16.1
5 Jan 18-20, 2012 Port Orford 5 E OR US 11.5 18.6 2.6
(3.1) 5.6
(5.8)
6 Feb 13-15, 1982 Lone Pine WA US 7.0 19.3 1.8
(2.0) 3.4
(3.2) Nehalem 9 NE OR US 6.0 11.0
7 Nov 17-19, 1996 Port Orford 5 E OR US 11.6 16.4 4.2
(4.0) 6.6
(5.9)
8 Dec 28-30, 2008 Brookings 4.2 ENE OR US 7.2 15.6 1.1
(1.3) 2.1
(3.3)
9 Dec 19-21, 2014 Brookings 4.2 ENE OR US 9.2 14.0 1.7
(2.6) 3.1
(3.8)
10 Jan 4-6, 1983 North Fork OR US 6.4 13.9 1.9 (1.5)
3.5 (3.5) Nehalem 9 NE OR US 4.7 13.0
** The value given is based upon on the average value measured at the NCDC precipitation gages located within the basin. The value in parentheses is based upon the average basin value from the daily PRISM data (PRISM, 2016).
10 storms selected based on runoff
Data collected for each storm event: HYSPLIT air parcel trajectories
Daily weather maps
PRISM daily and monthly precipitation and temperature data
Sea Surface Temperature data from NCAR, NOAA ESRL, IRICS
NRFC Historical flood information
Integrated water vapor from ESRL
Meteorologic description
Historical reports and articles
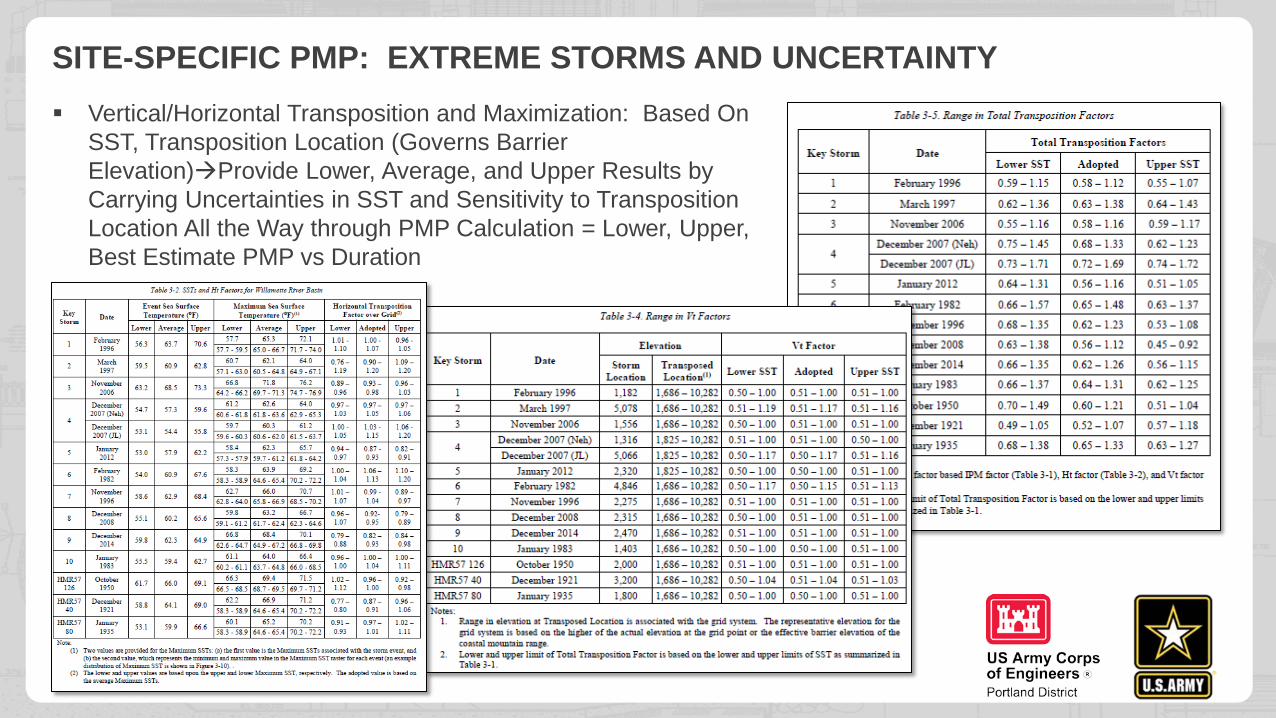
Vertical/Horizontal Transposition and Maximization: Based On SST, Transposition Location (Governs Barrier Elevation)Provide Lower, Average, and Upper Results by Carrying Uncertainties in SST and Sensitivity to Transposition Location All the Way through PMP Calculation = Lower, Upper, Best Estimate PMP vs Duration
SITE-SPECIFIC PMP: EXTREME STORMS AND UNCERTAINTY
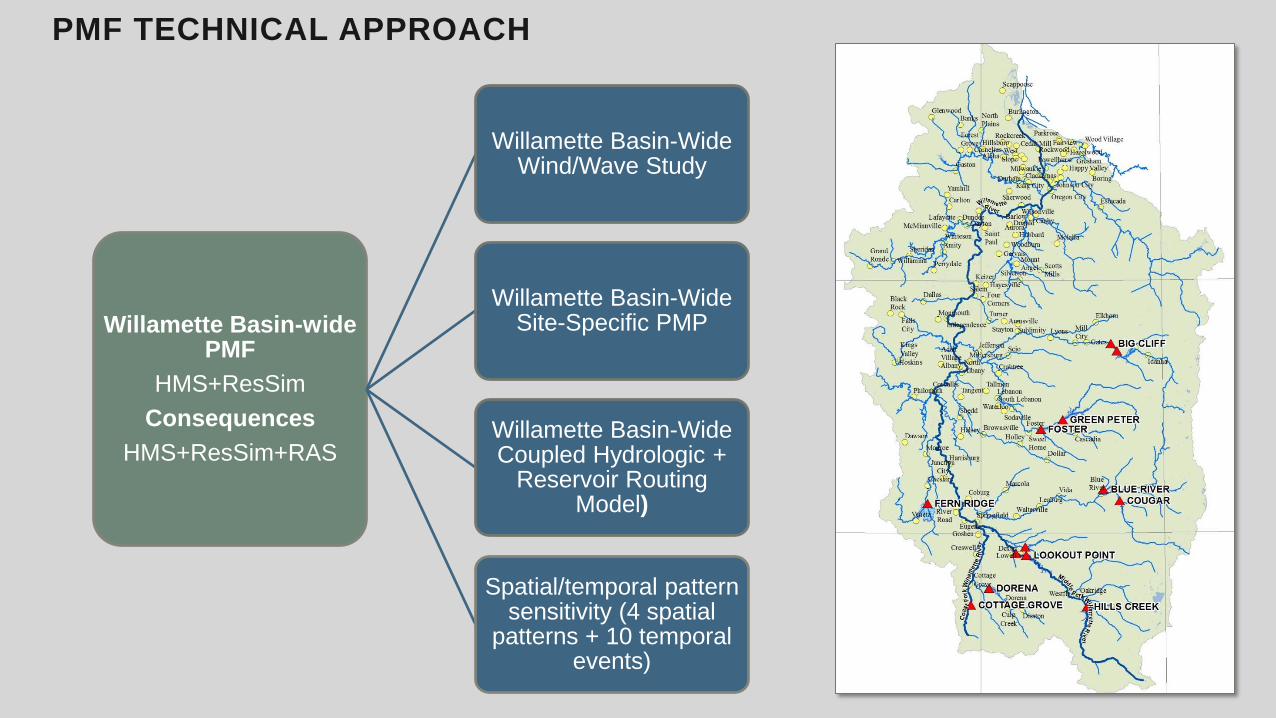
Willamette Basin-wide PMF
HMS+ResSim Consequences
HMS+ResSim+RAS
Willamette Basin-Wide Wind/Wave Study
Willamette Basin-Wide Site-Specific PMP
Willamette Basin-Wide Coupled Hydrologic +
Reservoir Routing Model)
Spatial/temporal pattern sensitivity (4 spatial
patterns + 10 temporal events)
PMF TECHNICAL APPROACH
CALIBRATION AND VALIDATION
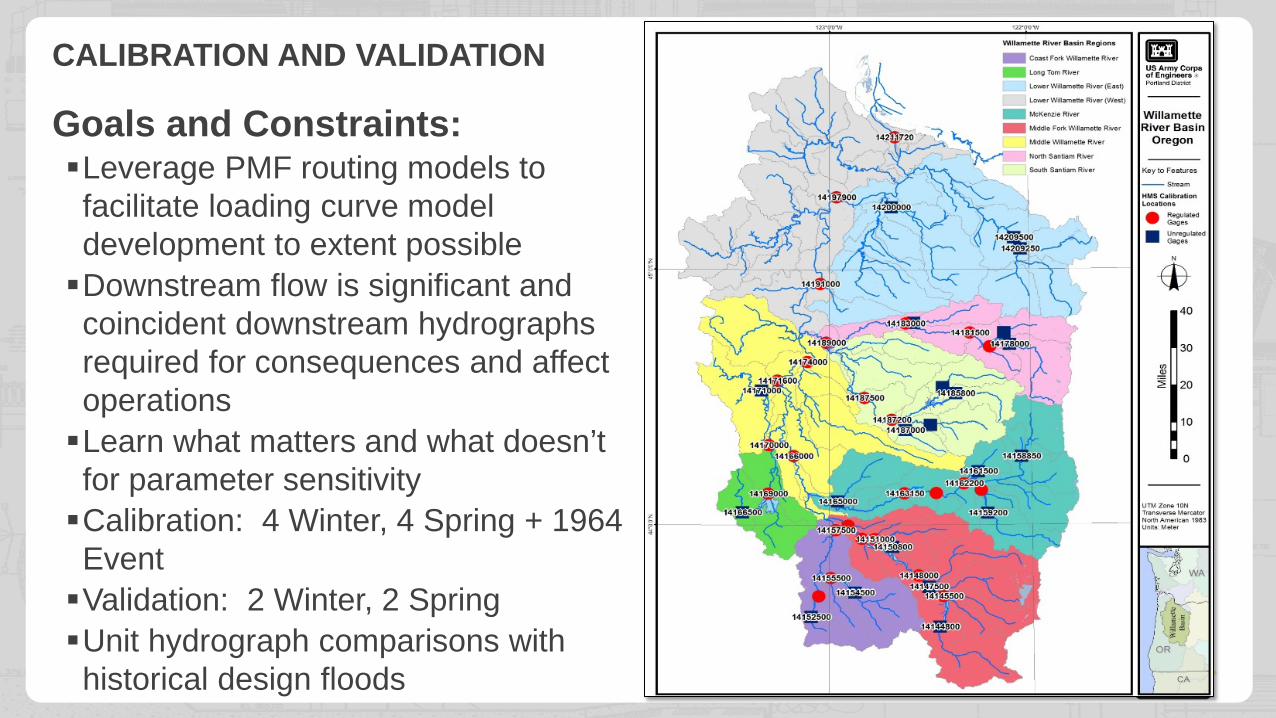
Goals and Constraints: Leverage PMF routing models to facilitate loading curve model development to extent possible Downstream flow is significant and coincident downstream hydrographs required for consequences and affect operations Learn what matters and what doesn’t for parameter sensitivity Calibration: 4 Winter, 4 Spring + 1964 Event Validation: 2 Winter, 2 Spring Unit hydrograph comparisons with historical design floods
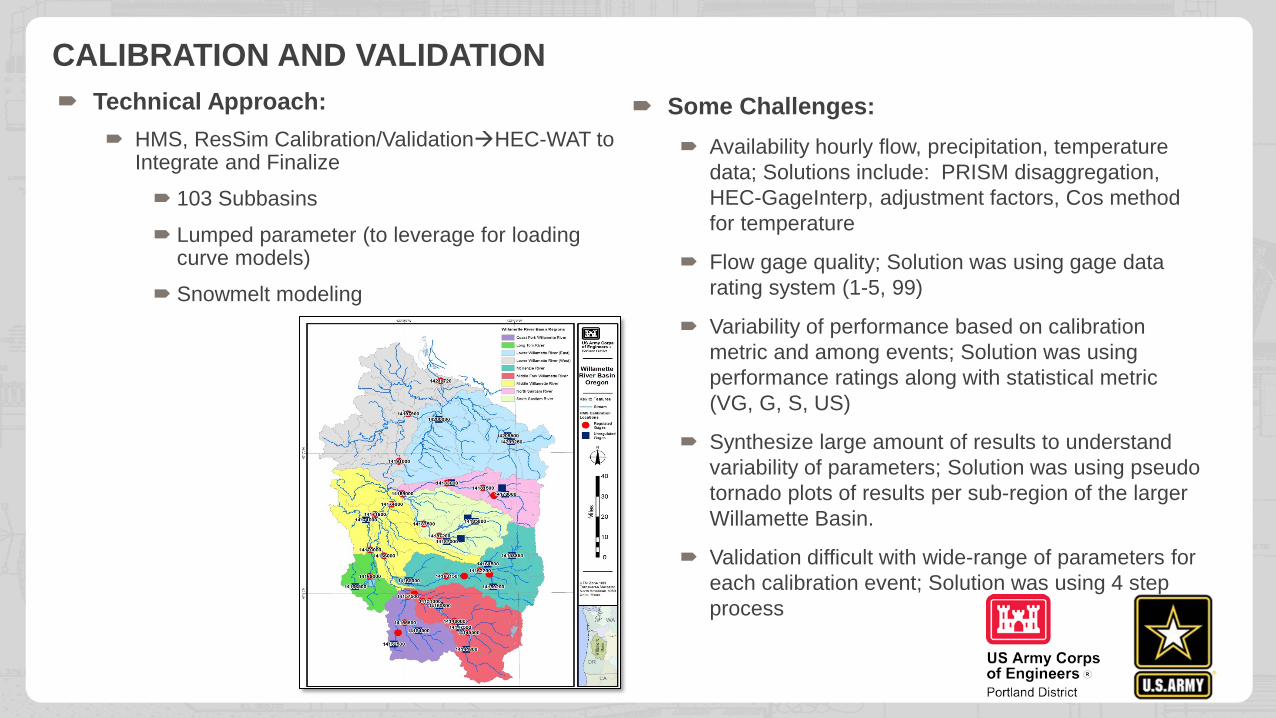
CALIBRATION AND VALIDATION Some Challenges:
Availability hourly flow, precipitation, temperature data; Solutions include: PRISM disaggregation, HEC-GageInterp, adjustment factors, Cos method for temperature
Flow gage quality; Solution was using gage data rating system (1-5, 99)
Variability of performance based on calibration metric and among events; Solution was using performance ratings along with statistical metric (VG, G, S, US)
Synthesize large amount of results to understand variability of parameters; Solution was using pseudo tornado plots of results per sub-region of the larger Willamette Basin.
Validation difficult with wide-range of parameters for each calibration event; Solution was using 4 step process
Technical Approach: HMS, ResSim Calibration/ValidationHEC-WAT to
Integrate and Finalize
103 Subbasins
Lumped parameter (to leverage for loading curve models)
Snowmelt modeling
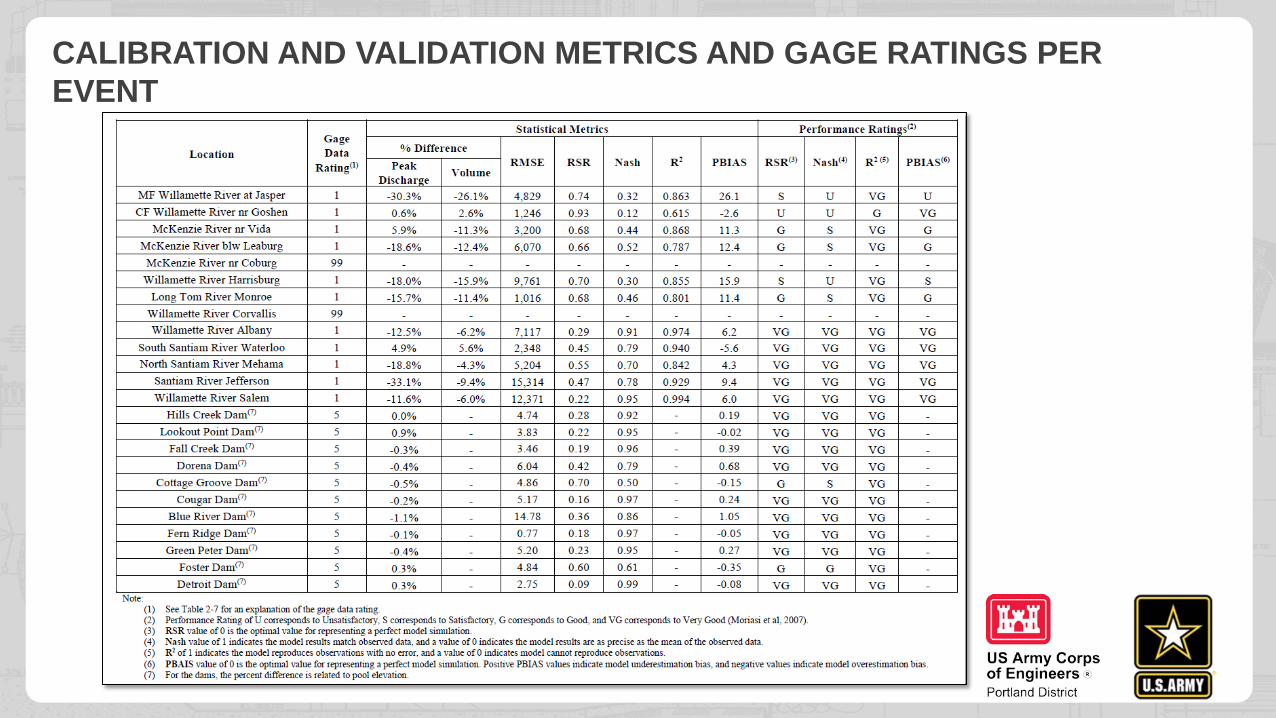
CALIBRATION AND VALIDATION METRICS AND GAGE RATINGS PER EVENT
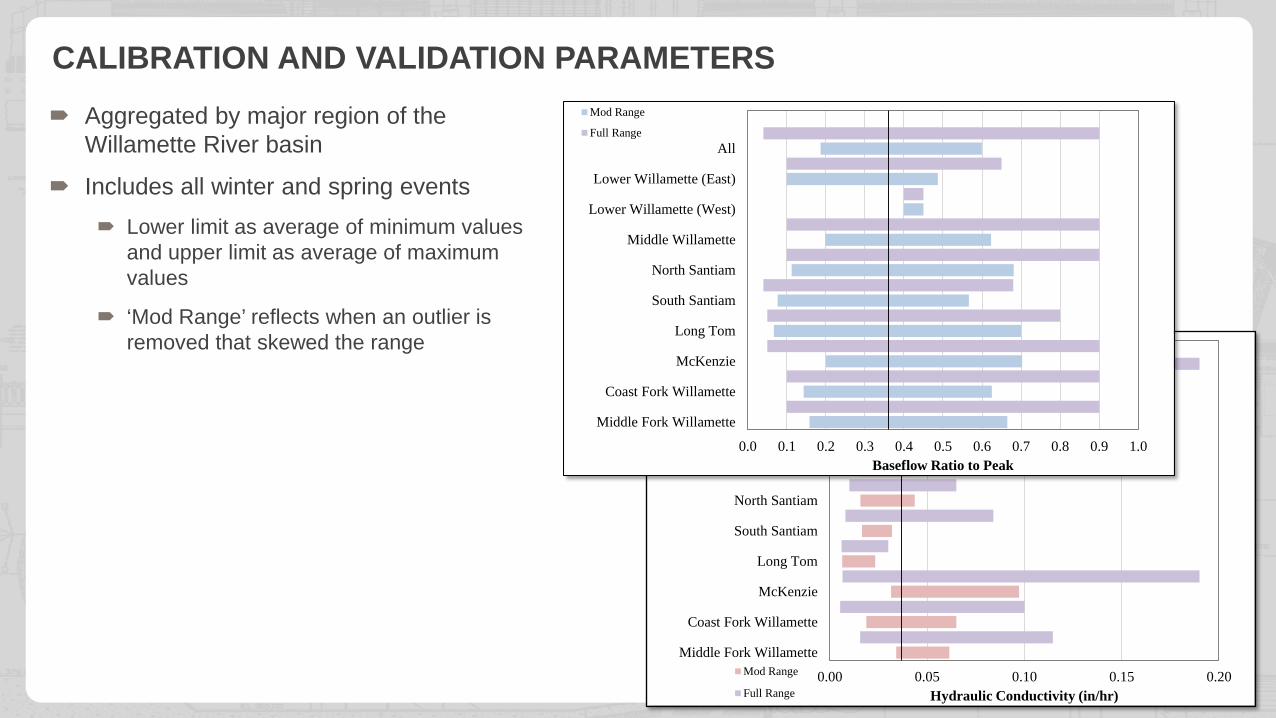
Aggregated by major region of the Willamette River basin
Includes all winter and spring events Lower limit as average of minimum values
and upper limit as average of maximum values
‘Mod Range’ reflects when an outlier is removed that skewed the range
0.00 0.05 0.10 0.15 0.20
Middle Fork Willamette
Coast Fork Willamette
McKenzie
Long Tom
South Santiam
North Santiam
Middle Willamette
Lower Willamette (West)
Lower Willamette (East)
All
Hydraulic Conductivity (in/hr)
Mod Range
Full Range
0.0 0.1 0.2 0.3 0.4 0.5 0.6 0.7 0.8 0.9 1.0
Middle Fork Willamette
Coast Fork Willamette
McKenzie
Long Tom
South Santiam
North Santiam
Middle Willamette
Lower Willamette (West)
Lower Willamette (East)
All
Baseflow Ratio to Peak
Mod Range
Full Range
CALIBRATION AND VALIDATION PARAMETERS
Dam Year Built
Unit Hydrograph
Source Duration (hrs) Flood Event Basis
Peaking Factor
Hill Creek 1961 DM1 6 1942-43 150% Lookout Point 1954 WCM 6 1942-43 150%
Fall Creek 1966 WCM 6 1964 150% Dorena 1949 n.a. n.a. n.a. n.a.
Cottage Groove 1942 Excel File Unknown 1942-43 Unknown Fern Ridge 1941 n.a. n.a. n.a. n.a.
Cougar 1964 DM2 6 1942-43 150% Blue River 1964 DM2 3 1964 150%
Green Peter 1968 DM2 6 1964 150% Foster 1968 DM2 6 1964 150% Detroit 1953 DM1 6 1942-43 150%
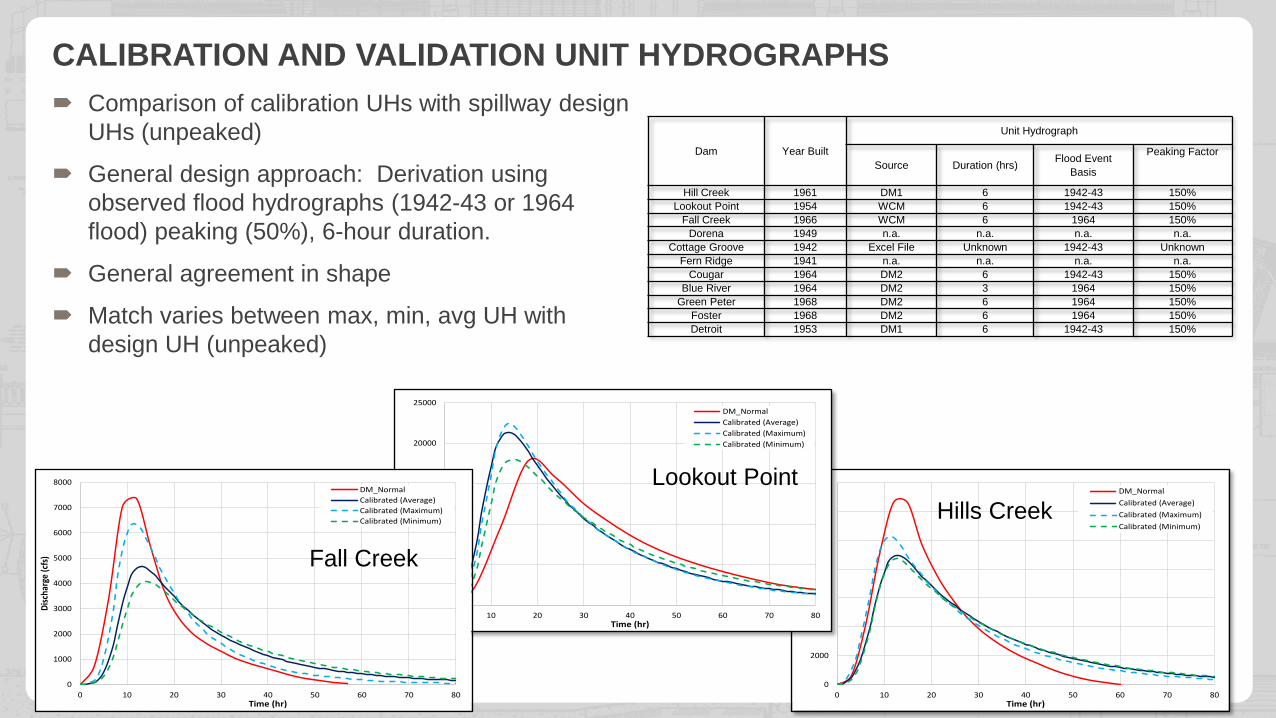
Comparison of calibration UHs with spillway design UHs (unpeaked)
General design approach: Derivation using observed flood hydrographs (1942-43 or 1964 flood) peaking (50%), 6-hour duration.
General agreement in shape
Match varies between max, min, avg UH with design UH (unpeaked)
0
2000
4000
6000
8000
10000
12000
14000
0 10 20 30 40 50 60 70 80
Disc
harg
e (c
fs)
Time (hr)
DM_NormalCalibrated (Average)Calibrated (Maximum)Calibrated (Minimum)
0
5000
10000
15000
20000
25000
0 10 20 30 40 50 60 70 80
Disc
harg
e (c
fs)
Time (hr)
DM_NormalCalibrated (Average)Calibrated (Maximum)Calibrated (Minimum)
0
1000
2000
3000
4000
5000
6000
7000
8000
0 10 20 30 40 50 60 70 80
Disc
harg
e (c
fs)
Time (hr)
DM_NormalCalibrated (Average)Calibrated (Maximum)Calibrated (Minimum)
Fall Creek
Lookout Point Hills Creek
CALIBRATION AND VALIDATION UNIT HYDROGRAPHS
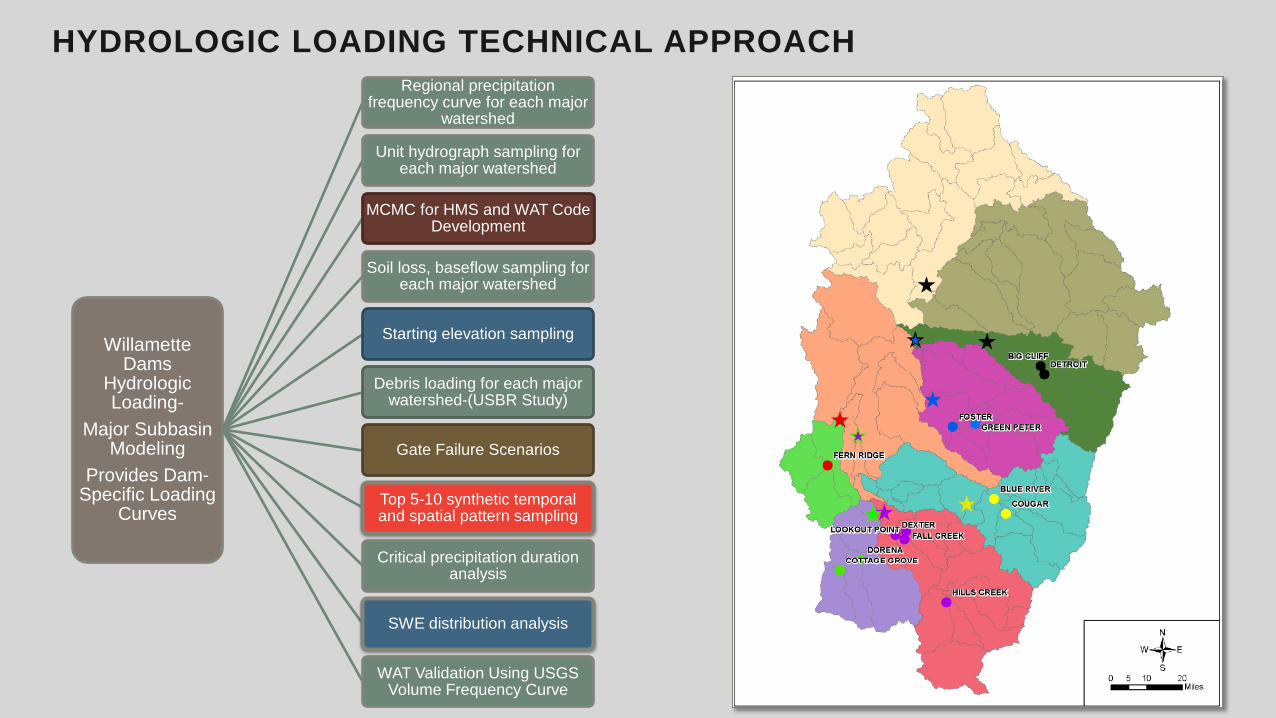
Willamette Dams
Hydrologic Loading-
Major Subbasin Modeling
Provides Dam-Specific Loading
Curves
Regional precipitation frequency curve for each major
watershed
Unit hydrograph sampling for each major watershed
MCMC for HMS and WAT Code Development
Soil loss, baseflow sampling for each major watershed
Starting elevation sampling
Debris loading for each major watershed-(USBR Study)
Gate Failure Scenarios
Top 5-10 synthetic temporal and spatial pattern sampling
Critical precipitation duration analysis
SWE distribution analysis
WAT Validation Using USGS Volume Frequency Curve
HYDROLOGIC LOADING TECHNICAL APPROACH
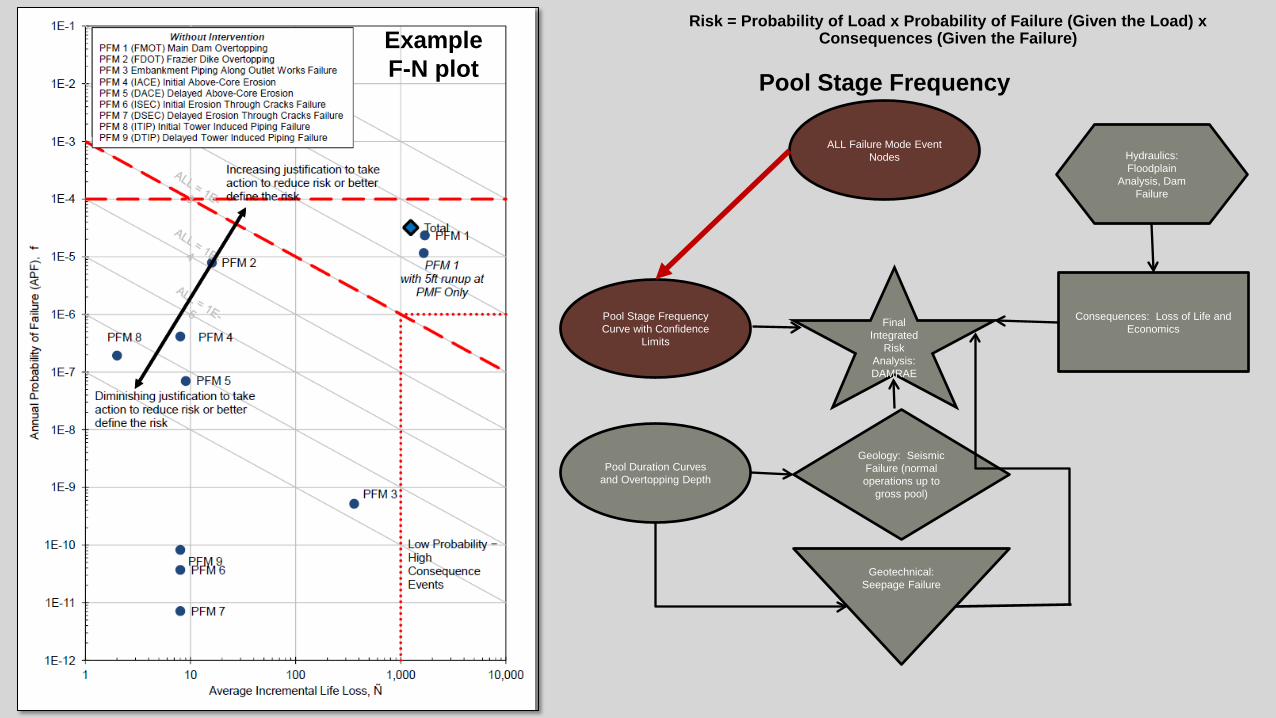
Pool Stage Frequency Curve with Confidence
Limits
Hydraulics: Floodplain
Analysis, Dam Failure
Consequences: Loss of Life and Economics
Geotechnical: Seepage Failure
Geology: Seismic Failure (normal operations up to
gross pool)
Pool Duration Curves and Overtopping Depth
Final Integrated
Risk Analysis: DAMRAE
ALL Failure Mode Event Nodes
Risk = Probability of Load x Probability of Failure (Given the Load) x Consequences (Given the Failure)
Pool Stage Frequency
Example F-N plot
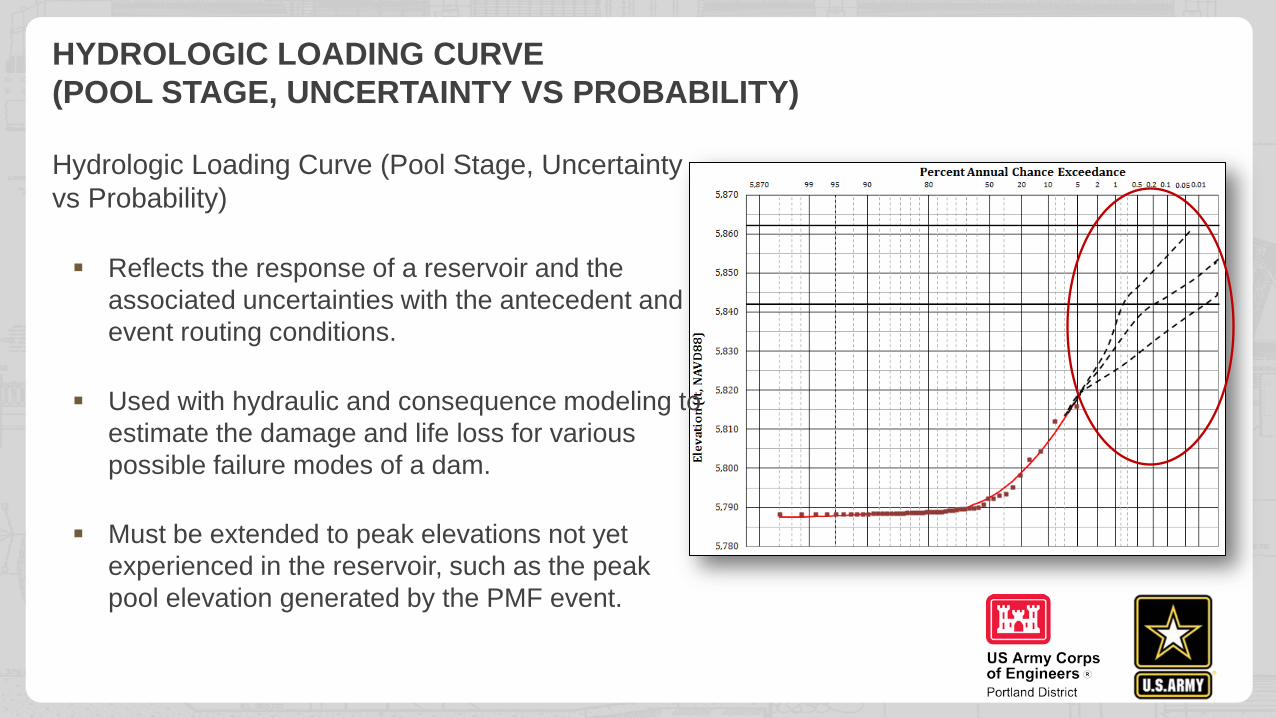
Hydrologic Loading Curve (Pool Stage, Uncertainty vs Probability) Reflects the response of a reservoir and the
associated uncertainties with the antecedent and event routing conditions.
Used with hydraulic and consequence modeling to estimate the damage and life loss for various possible failure modes of a dam.
Must be extended to peak elevations not yet experienced in the reservoir, such as the peak pool elevation generated by the PMF event.
HYDROLOGIC LOADING CURVE (POOL STAGE, UNCERTAINTY VS PROBABILITY)
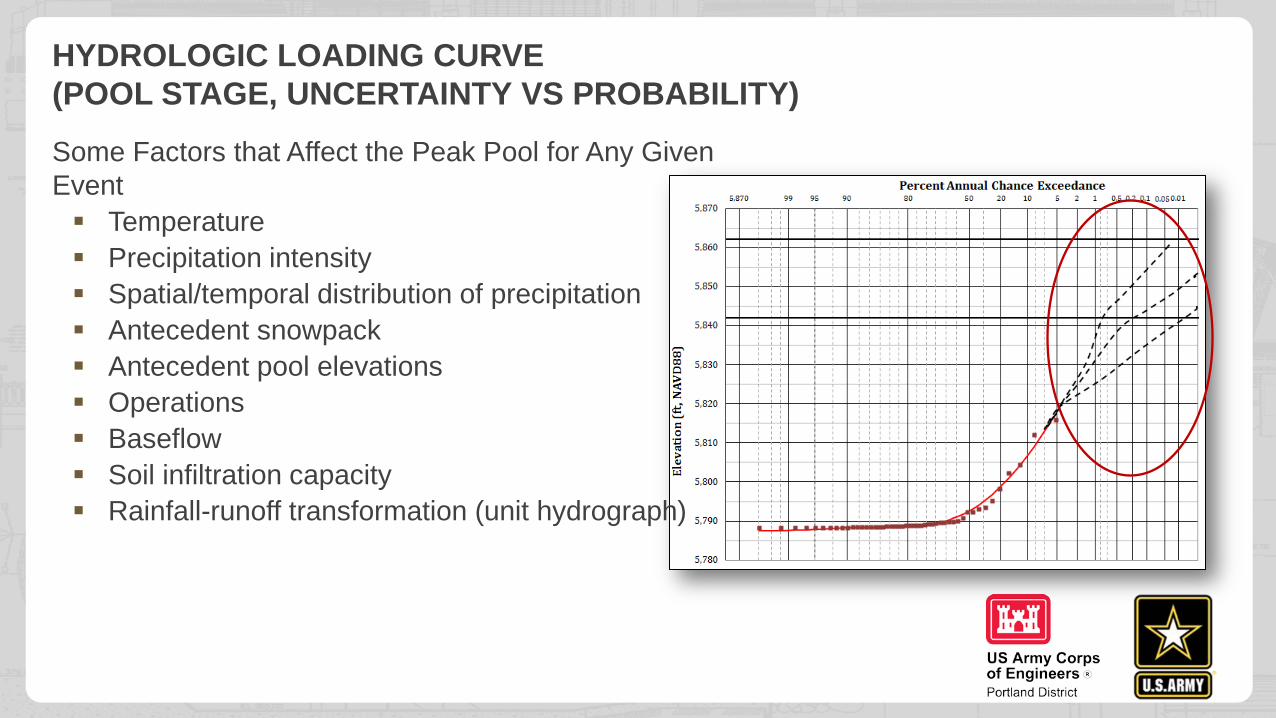
Some Factors that Affect the Peak Pool for Any Given Event Temperature Precipitation intensity Spatial/temporal distribution of precipitation Antecedent snowpack Antecedent pool elevations Operations Baseflow Soil infiltration capacity Rainfall-runoff transformation (unit hydrograph)
HYDROLOGIC LOADING CURVE (POOL STAGE, UNCERTAINTY VS PROBABILITY)
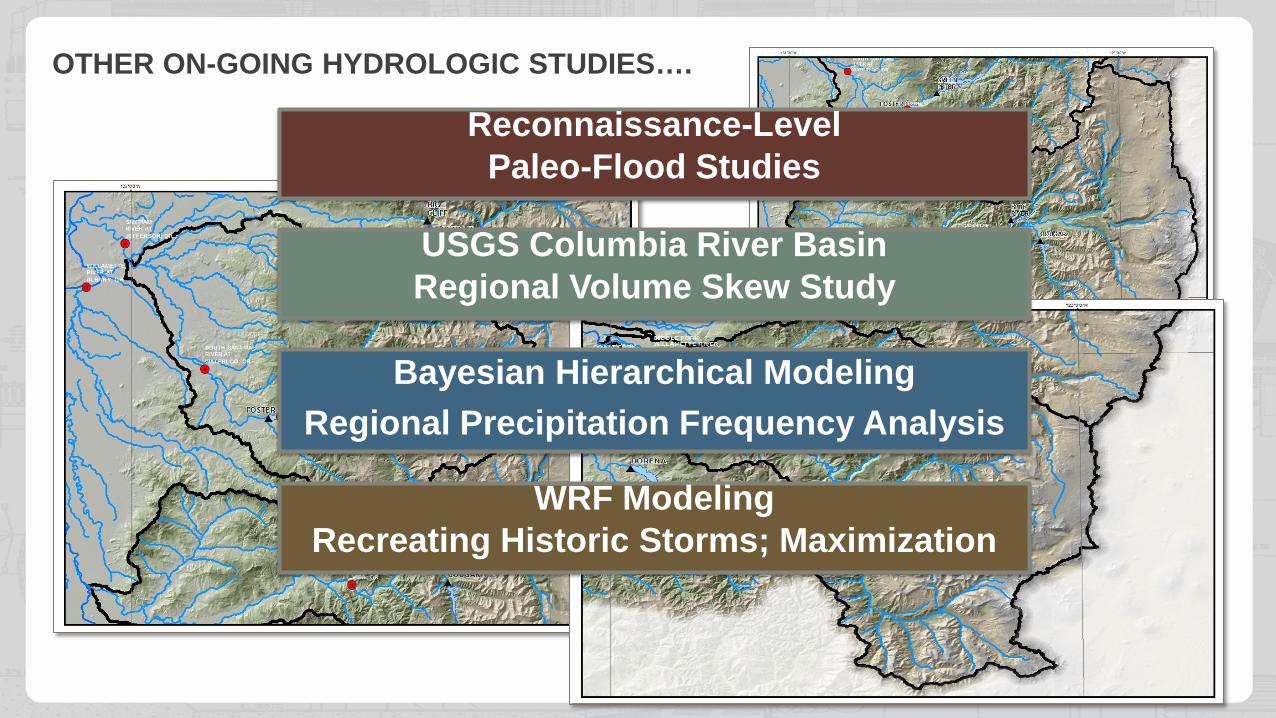
OTHER ON-GOING HYDROLOGIC STUDIES….
Bayesian Hierarchical Modeling Regional Precipitation Frequency Analysis
Reconnaissance-Level Paleo-Flood Studies
USGS Columbia River Basin Regional Volume Skew Study
WRF Modeling Recreating Historic Storms; Maximization
INTERAGENCY PARTNERS USGS University of California at Davis USACE Engineering and Research Development Center (ERDC) USACE Hydrologic Engineering Center (HEC USACE Risk Management Center (RMC) West Consultants
ADVANCING METHODS AND DATA Incorporation of Bayesian Statistics in Risk Assessment Framework – Markov Chain
Monte Carlo (MCMC) Atmospheric Modeling; Dynamical Downscaling Improvements in Stochastic Sampling Processes, Computation Time, Storage, Post-
Processing Snowmelt Modeling Body of Knowledge and Methodology Empirical Database of Hydrologic Parameters in the Willamette Basin
LARGER COMMUNITY USGS Regional Volume Skew Study Storm Reanalysis Data Optimality of Historical Storms Critical Reexamination of HMR PMP Assumptions Empirical Hydrologic Parameter Distributions
Publicly Available, Free Software (HEC) Data Reviewed, POR flow data at critical locations in the watershed Hourly precipitation and temperature grids over entire Willamette Regional skew relationships Ability to develop empirical distributions of parameters such as soil loss, baseflow, unit hydrographs
HEC-WAT Ability to quantify uncertainty: Precipitation (depth, spatial/temporal), temperature, SWE, reservoir pool elevation,
unit hydrograph Tc, R, baseflow, soil loss HEC-HMS Ability to quantify uncertainty and incorporate into uncertainty analyses Multi-parameter optimization: Matrix of correlated parameters
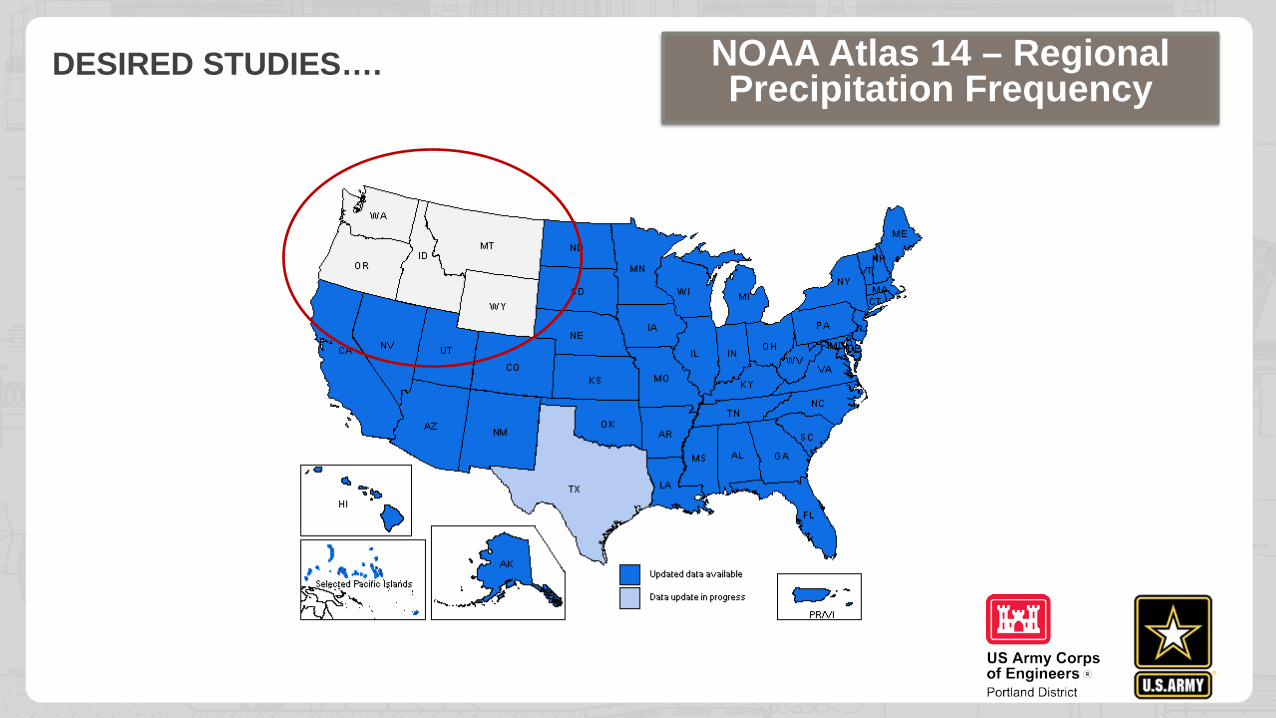
DESIRED STUDIES…. NOAA Atlas 14 – Regional Precipitation Frequency