Embed Size (px)
Citation preview

Will the U.S. Bank Recapitalization Succeed? Lessons from Japan
Anil Kashyap (University of Chicago) and
Takeo Hoshi (University of California San Diego) Paper presented at the Macroeconomic and Policy Challenges Following Financial Meltdowns Conference Hosted by the International Monetary Fund Washington, DC─April 3, 2009
The views expressed in this paper are those of the author(s) only, and the presence of them, or of links to them, on the IMF website does not imply that the IMF, its Executive Board, or its management endorses or shares the views expressed in the paper.
MACROECONOMIC AND POLICY CHALLENGES FOLLOWING FINANCIAL MELTDOWNS
Friday, April 3, 2009

WILL THE U.S. BANK RECAPITALIZATION SUCCEED? LESSONS FROM JAPAN *
Takeo Hoshi
Anil K Kashyap
December 2008
* Hoshi is affiliated with the University of California San Diego, School of International Relations and Pacific Studies, National Bureau of Economic Research, and Tokyo Center for Economic Research. Kashyap is affiliated with the University of Chicago Booth School of Business, Federal Reserve Bank of Chicago and National Bureau of Economic Research. Kashyap thanks the Initiative on Global Markets at the University of Chicago Booth School of Business for research support. An earlier draft of this paper circulated under the title “Will the TARP Succeed? Lessons from Japan.” We thank Kanako Hotta, Yian Liu and Ashish Shenoy for excellent research assistance and Peggy Eppink for help preparing the document. We thank Mitsuhiro Fukao and seminar participants at the Bank of Japan, the European Bank for Reconstruction and Development, and Princeton University for useful comments. The views in this paper are those of the authors alone and not the institutions with which we are affiliated, all mistakes are our own.

1
Will the U.S. Bank Recapitalization Succeed? Lessons from Japan Takeo Hoshi and Anil K Kashyap NBER Working Paper No. 14401 Revised December 2008 JEL No. G18, G28, G38
ABSTRACT
The U.S. government is using a variety of tools to try to rehabilitate the U.S. banking industry. The two principal policy levers discussed so far are employing asset managers to buy toxic real estate securities and making bank equity purchases. Japan used both of these strategies to combat its banking problems. There are also a surprising number of other similarities between the current U.S. crisis and the recent Japanese crisis, The Japanese policies were only partially successful in recapitalizing the banks. We explain why that was the case and then compare the current U.S. plans with those pursued in Japan. While the U.S. plans are still in flux, it appears that U.S. is at risk for running into some of the same problems that hobbled the Japanese policies. Takeo Hoshi School of International Relations and Pacific Studies University of California, San Diego 9500 Gilman Dr. La Jolla, CA 92093-0519 and NBER and TCER [email protected] Anil K Kashyap Booth School of Business University of Chicago 5807 S. Woodlawn Ave. Chicago, IL 60637 and NBER and Federal Reserve Bank of Chicago [email protected]

2
1. Introduction
The U.S. government has taken a schizophrenic policy approach to the ongoing credit crisis. In the
Treasury’s deliberations with Congress, it stressed idea of purchasing troubled assets to stabilize the
financial system. Thus, the Troubled Assets Relief Program (TARP) became the central part of the
Emergency Economic Stabilization Act (EESA). But within a week of passing the legislation, attention
shifted to buying equity in financial institutions. Subsequently the Capital Purchase Program (CPP)
within the TARP is using $250 billion of public funds to acquire stakes in banks in the form of preferred
shares and warrants, with $145 billion already allocated to nine major banks. It appears possible that
asset purchases may even be abandoned altogether.
The focus on the capital shortage is good news since economists widely agree that the lack of
capital is the fundamental problem plaguing the banks (Baldwin and Eichengren (2008)). But, the try
everything approach without careful regard for implications also bears an eerie resemblance to Japan’s
decade-long response to its financial crisis. The big difference thus far is that the U.S. is moving much
more quickly than Japan did.1 Hence it is instructive to look back at Japan’s experience to see what did
and did not work.
We begin with a review of the macroeconomic environment that prevailed in Japan and the U.S.
during these episodes. While it is widely known that the banking problems in both countries began after a
sharp increase in land prices, the events in Japan from late 1997 to early 1999 closely track developments
in the U.S. in 2008. One important similarity is the bank credit crunch that prevailed in both instances.
More importantly, the Japanese banks emerged from the acute phase of its crisis with seriously
undercapitalized banks.
We next describe the string of Japanese asset purchase plans and capital injection programs that
were pursued to combat the banking problems. There were four main problems with these strategies.
First, the asset purchase plans were too narrow. The scope of assets to be purchased and the set of
financial institutions included were limited, thus precluding a comprehensive plan. Second, the loan
purchases that did take place, especially in the 1990s, involved little restructuring of the borrowers. This
resulted in many of the companies operating with few changes while typically receiving more loans that
subsequently went bad. Third, the capital purchase plans ran into trouble in getting the banks to accept
1 Udell (2008) points out further similarities in the evolution of the governments’ responses in Japan and the U.S. He summarizes by saying “More generally, as new events unfolded in Japan, regulators … had to use a combination of existing tools, new tools that stretched the regulatory limits of existing institutions, and go to the legislature for new authority and funding. We witnessed the same combination in the evolution of the response of U.S. authorities.”

3
funding. Fourth and most importantly, the overall amount of government money committed was too
small to recapitalize the banks. Hence, the banks only really returned to being adequately capitalized in
2006 and 2007, when macroeconomic conditions improved and after supervision policy had changed.
We close by drawing on the Japanese experience to evaluate the troubled asset purchase program
and the CPP. In broad terms, the two programs mimic many elements of the Japanese plans. We present
data comparing the largest U.S. banks, particularly in terms of the risks that they face from continued
deterioration in the economy. Based on publicly available data it is hard to make confident assessments
about the solvency of the banks. The lesson from Japan is that the details of the potential recapitalization
program will be critical in determining whether any injections will increase the banks’ capital levels and
hence their lending capacity. There are too many open issues about how the TARP will proceed to tell
whether it can avoid the mistakes made in Japan.
2. Macroeconomic Conditions in the U.S. and Japan
The initial source of the banking losses in both countries stemmed from the dramatic real estate
price increases and subsequent declines. Figure 1 shows price indices for land in both countries.2 For the
U.S. we show the Case-Shiller index for major cities which peaked in the second quarter of 2006. The
index for Japan covers residential land prices in six major cities, which peaked in the third quarter of 1990.
In the figure, we have shifted dates to align the peaks. Prices rose more in Japan than in the U.S. and then,
ominously, fell for roughly 15 years – this basic pattern holds in all the major land price indices for Japan.
During these fifteen years, the period from late 1997 to early 1999 is generally recognized as the acute
phase of Japan’s banking problems (see Hoshi and Kashyap (2001) Chapter 8). We start with a summary
of the events from that period because they are remarkably similar to developments in the U.S. in 2008.
2.1 The Acute Phase of Japan’s Crisis
The episode began when a mid-sized securities firm, Sanyo Securities, declared bankruptcy in
early November 1997.3 This resulted in Japan’s first interbank loan default. Two weeks later a major
bank, Hokkaido Tokushoku, lost the ability to borrow in the interbank market and was forced to declare
2 We thank Takatoshi Ito for suggesting this way of displaying the data.
3 Contemporaneous descriptions and analysis of the Japanese banking crisis can be found in Cargill, Hutchison, and Ito (2001), Hoshi and Kashyap (2001, Chapter 8), and Nakaso (2001).

4
bankruptcy. This was the first major bank failure in postwar Japan. A week later one of the four major
securities dealers, Yamaichi Securities, failed after rumors, subsequently shown to be true, that it had
accumulated massive off balance sheet losses through an illegal tobashi scheme.4 Finally, before the
month ended, Tokuyo City Bank, a regional bank, also failed.
Figure 2 shows the Japan premium calculated as the difference between 3-month Eurodollar
Tokyo Interbank Borrowing Rate (TIBOR) and the 3-month Eurodollar London Interbank Borrowing
Rate (LIBOR).5 Relative borrowing costs for both banks jumped immediately on the news of Sanyo’s
demise (11/3/1997).
The stress was evident in the domestic interbank loan market (call market) as well. Figure 3
shows the difference between the maximum and the minimum of the overnight call rate (uncollateralized)
for each day from November 1997 to April 1999.6 As Fukuda (2008) points out, the difference reflects
not only the range of intraday fluctuations of the call rate but also the difference between the rates for the
most creditworthy bank and the least creditworthy bank. The figure shows that the spread jumped in
November 1997 and stayed high for the next 16 months, suggesting some banks had extreme trouble
borrowing for even overnight.
Before the end of 1997, the government decided that they could not avoid using public funds to
deal with the financial crisis and announced that they planned to earmark ¥10 trillion to put into the
banking sector. While the discussion of how to use the public funds was underway, the government
approved a pair of accounting changes that were designed to allow the banks to make their public
financial statements look better than was truly warranted. These rules allowed the banks to choose to use
4 In a tobashi scheme, a security company hides capital losses of one corporate customer by selling a part of the portfolio at an inflated price to another customer (whose accounting period is different from the first customer’s so that they did not have to disclose the losses at the same time). When the second customer’s accounting year end arrives, the portfolio is sold to another customer (who may be the same as the first) to hide losses again. Barring a reversal of market prices, the cycle cannot continue forever and the securities company ends up shouldering the losses eventually.
5 We thank Kimie Harada and Takatoshi Ito for providing the data for the figure. Eurodollar TIBOR is calculated by a financial information company QUICK as the average interbank rate of the middle 9 of 13 reference banks (the highest two and the lowest two banks are excluded). The 13 banks include two non-Japanese banks, but their rates were almost always excluded as the two lowest rate, making TIBOR effectively the average rate for Japanese banks. Eurodollar LIBOR is calculated by the British Bankers Association as the average interbank rate of the middle 8 of 16 reference banks. Three Japanese banks are included in the 16 reference banks, but their rates were almost always excluded as three of the four highest rates, making LIBOR effectively the average rate for non-Japanese banks. See Ito and Harada (2005).
6 We thank Shin-ichi Fukuda for providing the data for the figure.

5
either market or book values for the banks’ holdings of stocks in other firms and for the banks’ real estate
holdings.
Virtually all the banks’ real estate assets were on their books at the historical acquisition prices
(typically decades old), so even though land prices were well below peak values, a switch to market
values instantly raised the value of the banks’ assets. Conversely, the banks were harvesting capital gains
on their stock holdings in order to report positive earnings. By early 1998 the banks had about ¥24
trillion of stockholdings on their books. Typically upon selling the shares to collect the capital gains the
banks would quickly buy back the shares to retain the relationships with their clients. By 1998, the
market price for many of the shares that had been sold and re-purchased was below the book value for
these shares. Hence, the banks could further inflate the value of the assets by recording value of the
shareholdings at book value.
On February 16, 1998, the Diet passed the Financial Function Stabilization Act, which allowed
the government to use ¥30 trillion of public funds (¥17 trillion for protecting depositors of failed banks
and ¥13 trillion for bank recapitalization). As we describe below, the government used ¥1.8 trillion out
of the ¥13 trillion to recapitalize major banks in March of 1998, but it was unsuccessful in stabilizing the
situation. Public dissatisfaction with the government’s response continued to build through the spring and
in June, the Liberal Democratic Party, the dominant partner in the ruling government coalition, lost 17 of
its 61 seats in the Upper House election. The Hashimoto government resigned and a new government led
by Keizo Obuchi assumed power.
The new government immediately began formulating further plans for dealing with the banking
problems. By October, another major bank, Long-Term Credit Bank of Japan (LTCB), was on the brink
of failure. The legislature at that point reached agreement on two pieces of compromise legislation
(between the government and the leading opposition party) to deal with both insolvent institutions, which
was the focus of the opposition, and to help solvent, but under-capitalized banks, which the LDP’s
concern.7 In October, LTCB was nationalized using the new framework. In December, Nippon Credit
Bank, NCB, was nationalized. From 1996 onward an unlimited deposit guarantee had been in place in
Japan (that was scheduled to end in 2001, but ultimately was extended). In November of 1997, following
the default of Sanyo Securities, the BOJ informed market participants that interbank loans were also
protected (Kin’yu Business, February 1998, p.7). For both LTCB and NCB, all the creditors (including
7 The Financial Revitalization Act set up the framework to restructure failing systemically important banks through nationalization, and the Prompt Recapitalization Act allowed the government to inject capital into healthy banks. See Fuako (2000) for more details on these laws.

6
subordinated debt holders) of the banks were fully paid, although the existing equity holders saw their
stakes eliminated.
The second major recapitalization of the banks using mostly preferred share purchases by the
government was undertaken in March 1999. From Figure 2, we can see that the Japan premium declined
after this injection. At that time some observers thought this would prove to be a turning point in the
Japanese crisis.
One noteworthy aspect of this entire period was the divergence between the government’s
characterization of the condition of the banking industry and that of outsiders. For example, in the
August 1998 IMF Article 4 consultation, the IMF’s Executive Directors were very frank in calling for
much more aggressive action by the government:
Rigorous enforcement of the self-assessment framework is needed so that banks recognize and provision against the full extent of bad loans. Several Directors suggested that these results be published for individual banks to increase transparency.
In contrast, on February 2, 1999 as the second capital injection was being debated, Eisuke Sakikabara, the
Vice Minister of Finance, declared that the banking crisis would be over within 2 weeks. By the end of
the month the U.S. Deputy Treasury Secretary, Lawrence Summers, gave a speech asserting that even
with the capital infusion anticipated by Sakakibara, the Japanese banks remained significantly
undercapitalized. Kashyap (2002) reports estimates from six private-sector bank analysts on the health of
the banking system showing that each analyst estimated that the system was insolvent as of August 2002.
2.2 The 1998 Credit Crunch in Japan
Despite the disagreements over the degree of capital adequacy, there seems to be general agreement that there was a tightening of bank credit terms that contributed to mediocre growth during this period. For instance, the Bank of Japan minutes from January 1998 state:
Members noted that the current phase of the economy featured (1) a substantial decline in private consumption, which had remained relatively stable in past economic recessions; (2) a significant deterioration of confidence in the economic outlook not only in the household sector but also the corporate and financial sectors, leading to amplified concern about the economy; and (3) a vicious circle created by interaction between the real economy and financial activity whereby an increasingly stagnant economy brought about a decline in stock prices, which led to more cautious financial institution behavior, which in turn negatively influenced corporate activity and sentiment.” The minutes go on to report that “the prospects for a more restrictive lending attitude of financial institutions and its possible effects were discussed in detail.” (emphasis in the original).

7
There are three types of evidence typically cited to support these concerns. One indicator comes
from the TANKAN survey conducted quarterly by the Bank of Japan on business expectations. The
survey includes one question that asks firms whether they perceive financial institutions’ lending
standards to be tight or accommodative. The replies are reported as a diffusion index that shows the
difference in the percentage experiencing easy access to credit minus those experiencing difficult access.
Hence, a decrease in the index represents a perception of tough access to credit. Figure 4 shows this index
over the last 25 years. While the interpretation of this type of evidence can be questioned, the figure does
show a very rapid shift in business perceptions about credit availability during 1998. Motonishi and
Yoshikawa (1999) add this series to a standard investment regression and find that the deterioration in
credit terms was an important driver of corporate investment during this period.
A second bit of suggestive evidence can be seen by the contrast in corporate financing patterns
during this period. Kashyap, Stein and Wilcox (1993) show that in the U.S. a comparison of commercial
paper issuance and bank lending helps identify periods of tight bank credit.8 Throughout most of long
stagnation of the Japanese economy commercial paper issuance and bank lending generally moved
together, suggesting that lack of bank credit was not an acute problem. The notable exception is during
1998 when loan volumes were plummeting and commercial paper issuance by businesses soared.
A third indicator comes from Woo (1999). He correlates lending patterns at individual banks
with the capital position of banks for each year from 1991 through 1997. In the early part of the decade
the better capitalized banks were less prone to increase lending. That pattern flips and in 1997 the better
capitalized banks are much more likely to lend. He interprets this as evidence of a capital shortage of the
banks. As with the other facts we have pointed to, this finding is subject to multiple interpretations, but
they are all consistent with the conventional view that there was a credit crunch during this period in
Japan.
2.3 The Parallels to the U.S. in 2008
We see an eerie parallel between these events and those that have transpired in the U.S. in the
latter part of 2008. In particular, in September 2008, the U.S. had multiple failures or near failures that
required government support of large institutions (Fannie Mae and Freddie Mac, Lehman Brothers and
AIG.) Debt guarantees were broadly extended. Interbank loan rates spiked. Preferred share purchases
were made in all the largest banks at the same terms. The incumbent government lost an election and was 8 This test presumes that the commercial paper market is functioning normally so it would not be a helpful indicator for an extreme situation such as current U.S. case.

8
replaced. A credit crunch seems to be unfolding. The October 2008 FOMC minutes describe the situation
almost identically to the Bank of Japan description above:
[FOMC] Participants were concerned that the negative spiral in which financial strains lead to weaker spending, which in turn leads to higher loan losses and a further deterioration in financial conditions, could persist for a while longer.
By November the U.S. government had made a second capital injection into Citibank where the preferred
share purchase was about equal to the market capitalization of the bank the day before the deal was
announced. In light of all these similarities we turn now to a detailed investigation of how the Japanese
policy responses fared.
3. Japanese Asset Management Companies and Recapitalization Programs
Assessing the asset purchase plans is complicated because this was done in a piecemeal fashion
over the course of more than a decade. The full list of entities that were involved is shown in Table 1.
3.1 The History of Asset Management Companies in Japan
The first asset management company (AMC) in Japan was the Cooperative Credit Purchasing
Company (CCPC) established in December 1992. The CCPC, described best by Packer (2000), was a
private entity. The government was not involved because of the vigorous public resistance to proposals to
use of taxpayer funds to rescue banks. Failing to get direct government help, the private sector banks then
created the CCPC, presumably with encouragement from the government.
The CCPC used funds loaned by the founding banks to buy bad loans. The loan sales to the
CCPC generated tax benefits for the banks because once the loans resided with the CCPC the selling
banks could recognize losses immediately that reduced their taxes. The CCPC was also supposed to
collect on or sell the purchased loans, but this process was extremely slow. In the first five years, the
CCPC sold only a third of the loans it bought. Its loan disposal became somewhat faster after1998. The
CCPC was liquidated in 2004. Over the 12 years of its existence, the CCPC bought the bad loans of only
¥15.4 trillion (about $147 billion) in face value and ¥5.8 trillion (about $55 billion) in appraisal value.
A second asset management company, Tokyo Kyodo Bank was set up in January 1995 using a
combination of government and private funds. The Bank of Japan financed more than 90% of its capital.
The rest of the capital came from private-sector banks. Tokyo Kyodo was originally formed to manage
the assets held by two failed credit unions in Tokyo, Tokyo Kyowa Credit Union and Anzen Credit Union.
9
Later Tokyo Kyodo absorbed assets of other failed credit unions and was renamed the Resolution and
Collection Bank (RCB).
A third asset management company, the Housing Loan and Administration Corporation (HLAC),
was established in 1996 to manage loans of failed jusen, troubled housing loan companies that were taken
over by the government and wound down in 1996. The HLAC was financed by both private banks and
public funds. Both the RCB and HLAC dealt with assets of failed institutions and did not buy loans from
supposedly solvent banks. Because the regulators were not able to put banks into receivership until the
passage of the Financial Revitalization Act in 1998, the scope and effectiveness of these entities was
necessarily limited.
The RCB and the HLAC were merged to create the Resolution and Collection Corporation (RCC)
in 1999, and this new institution was allowed to buy bad loans from solvent banks (though they were not
compelled to sell any) in addition to manage assets of failed financial institutions. From 1999 to June
2005 (when RCC stopped buying assets), the RCC spent a mere ¥353 billion to purchase 858 loans with a
face value of ¥4.0 trillion from solvent banks. Starting 2001, the RCC also started to reorganize the
borrowers behind the non-performing loans. From 2001 to 2008, the RCC restructured 127 borrowers.
The RCC also participated in the reorganization of 450 borrowers in its role as a major creditor. In total
(for these 577 borrowers), ¥6.2 trillion of debt was restructured.
The RCC also started selling and collecting the loans aggressively. From March 2001 to March
2008, the amount of loans on the RCC balance sheet declined by ¥4.7 trillion (from ¥5.8 trillion to ¥1.1
trillion).9 Most of those loans were sold at prices above the RCC acquisition prices: from 2001 to 2008,
the total revenue from disposing of these loans amounted to ¥6.2 trillion.
The final AMC, the Industrial Revitalization Corporation of Japan (IRCJ), was established in
2003 with the purpose of restructuring the bad loans they purchased and turning around the borrowers.
The IRCJ was set up as a joint stock company almost exclusively owned by the Deposit Insurance
Corporation and its debt was guaranteed by the government. The IRCJ had two years to buy non-
performing loans and an additional three years to finish restructuring them. IRCJ bought and successfully
restructured non-performing loans for 41 borrowers of the total face value of ¥4.0 trillion, which included
several notable companies like Daiei and Kanebo, and finished all the restructuring by April 2007, one
year earlier than the initial deadline.
3.2 Lessons Regarding the Asset Management Companies
9 The accounting figures are from the RCC web site: http://www.kaisyukikou.co.jp.

10
Overall, Japan’s experience with asset management companies was mixed at best. There were a
number of design problems that limited their effectiveness. First, some of the AMCs were only able to
contract with specific type of financial institutions (for example HLAC). A systemic solution requires the
ability to buy assets from all impaired institutions, solvent or not.
Second, the scale of the operations was often small. Table 2 shows the history of loan losses in
Japan. Cumulatively over the years between 1992 and 2005, Japanese banks wrote off about ¥96 trillion,
roughly 19% of GDP.10 So the size of the problem required considerably more resources than most of the
AMCs were given.
Third, especially in early years, they were slow in selling off the loans they purchased and just
functioned as warehouses of bad loans. Land prices were still falling and they presumably did not want to
realize capital losses. Not until the early 2000s, did they begin attempting to restructure the loans and
rehabilitate the underlying borrowers thus addressing the source of the bad loan problem.
Finally, and most importantly, the Japanese experience also suggests that the purchase of non-
performing loans did not solve the capital shortage problem; it is possible that a much bigger,
comprehensive program might have eliminated the uncertainty of the value of assets that remained on
banks’ balance sheets and allowed them to find willing investors to contribute new capital. But, because
none of the Japanese AMCs were designed to overpay for the bad loans, just removing some of the assets
did not rebuild capital.
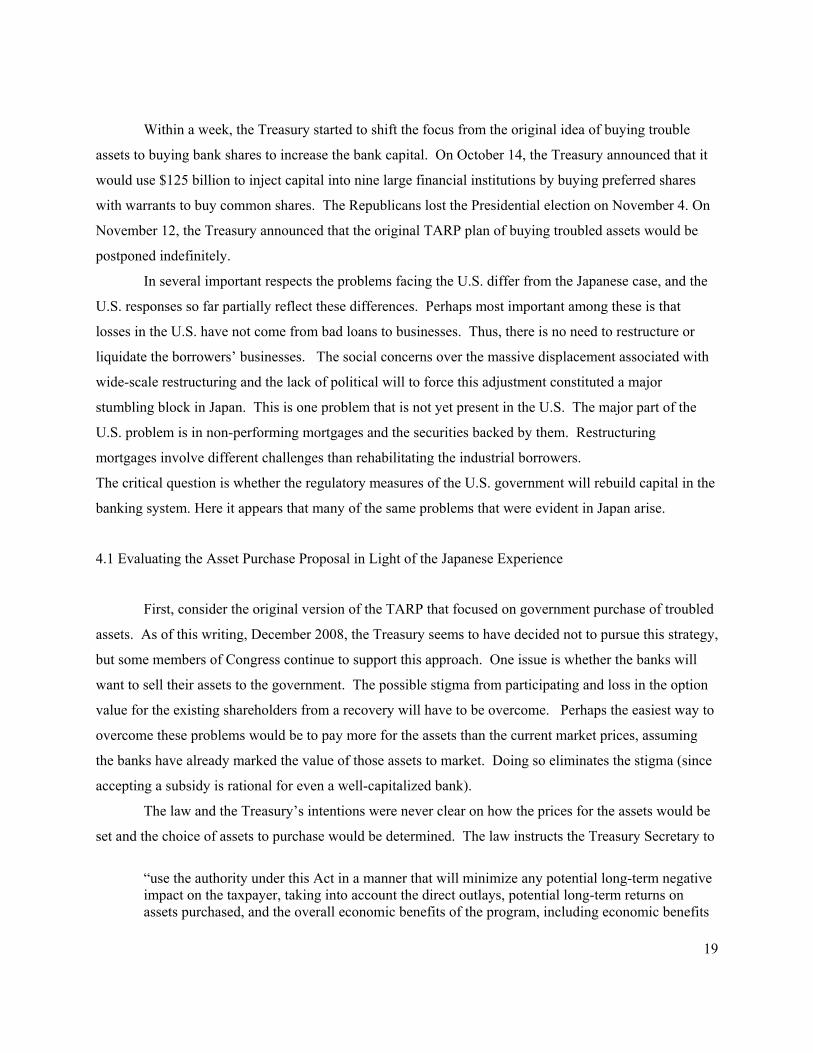
3.3 Bank Capital Injections in Japan
Given these problems, the Japanese government eventually resorted to measures besides AMCs.
To attack the undercapitalization, the Japanese government opted for a series of public re-capitalization
programs. A list of the programs is shown in Table 3.
As mentioned previously, the Financial Function Stabilization Act made ¥13 trillion (about $124
billion) of government money available to buy subordinated debt (or preferred shares in a few cases) in
undercapitalized but supposedly solvent banks. Subordinated debt can be counted as a part of regulatory
capital (as long as it does not exceed Tier I capital) and would give the purchasing bank a buffer to absorb
losses without having to default on promises to depositors.
This program was initially shunned by the banks. There are two reasons why the banks might not
have wanted the assistance. One explanation is that the banks feared applying for the funds would be
10 The figures are from the web site of the Financial Services Agency: http://www.fsa.go.jp.

11
admitting to large future losses than had been previously disclosed (or that their ability to raise funds
elsewhere would be missing). This negative signal would push down the value of existing equity.
A second logical possibility is that the banks balked because new securities would be senior to the
existing equity claims. Were the banks to recover, the existing owners would not be able to reap the
benefits until after the government’s claims were paid. Either interpretation suggests that accounting for
the incentives of the existing equity holders could be important in designing recapitalization schemes.
After some cajoling by the government, each of the major banks applied for almost an identical
amount of public funds. Table 4a, complied from the data on the Deposit Insurance Corporation web site
(http://www.dic.go.jp/english/e_katsudou/e_katsudou3-2.pdf) shows the amount and type of public funds
each bank received. Eight of nine received ¥100 billion (less than $1 billion) in the form of subordinated
debt or loans, although the interest rate on subordinated debt was different, presumably reflecting
perceived health of the institution. The other one (Dai-ichi Kangyo) received almost the same amount
(¥99 billion) in return for preferred shares which included an option to convert them into common shares.
The focal amount of ¥100 billion was set at the level that the healthiest bank, Bank of Tokyo Mitsubishi,
was willing to ask for, so for most of the banks, the amount was far less than they needed to restore their
capital. In total, only ¥1.8 trillion (about $17 billion) was distributed to 21 banks in the spring of 1998.
Nippon Credit Bank (NCB) and Long-Term Credit Bank of Japan (LTCB), the two banks that
would fail later in the year, each received funding under this program in the form of preferred shares. For
both banks, the government also acquired the option to convert the preferred shares into common shares
starting on October 1, 1998. The conversion period was 9.5 years for the LTCB and 19.5 years for the
NCB. Thus, the NCB, which was considered to be weaker of the two, was subject to a longer threat of
(partial) government takeover. NCB also applied for a ¥230 billion subordinated loan, but the loan was
not approved (Kin’yu Business, May 1998, p.8). Ultimately the preferred shares of these two banks were
converted into common shares when each was nationalized (October 28, 1998 for LTCB and December
17, 1998 for NCB).
The second recapitalization, briefly mentioned earlier, took place on the heels of these failures in
the Spring of 1999. The size of the second program was larger, with ¥25 trillion (about $238 billion)
available for recapitalization.11 All the major banks except for the most healthy one (Bank of Tokyo
Mitsubishi) applied. This time, the government (Financial Reconstruction Commission: FRC) evaluated
the applications using the inspection information provided by the FSA and the BOJ. Perhaps most
importantly, the FRC checked whether the amount of capital each bank requested would be sufficient to 11 The government also set aside ¥18 trillion for nationalization of failed banks. Combined with the ¥17 trillion for depositor protection (mentioned earlier), the total size of the financial stabilization package was ¥60 trillion.

12
cover the under-reserving for non-performing loans once they applied reasonable provision rates (70% for
doubtful loans and 15% for loans requiring special attention, for example). The FRC evaluated and
approved revitalization plans that banks submitted. Although the FRC did not turn down any applications,
this time, the capital injections after bank inspections were better conceived than the ones in 1998. The
government ultimately put ¥7.5 trillion (about $71 billion) into the 15 banks in the form of preferred
shares and subordinated debt with various terms and conversion options into common shares. Nakaso
(2001) argues that this amount was sufficient to cover the under-reserving and unrealized capital losses of
shareholdings at these 15 banks.
Table 4b, created from the data published by the Deposit Insurance Corporation
(http://www.dic.go.jp/english/e_katsudou/e_katsudou3-1.pdf) shows the deals for each bank. Most banks
sold multiple instruments to the government. As with the previous year’s plan, most of the preferred
shares gave the government an option to convert them into common equity during a certain interval. If
the government still held any preferred shares at the end of the interval the government was required to
convert all of these shares into common shares. This requirement implies that the government would
suffer a capital loss if the conversion option is out of the money at the end of the interval.
It would have been possible to design these securities so that weak banks would face the threat of
conversion and dilution of existing shareholders sooner than healthy financial institutions, but this is not
what happened. If anything, the tables show a tendency for healthier financial institutions to have earlier
initial conversion dates. Stronger banks would favor earlier conversion so that they could lower the
dividend rate on preferred shares.
The government did not seem to optimally exercise the conversion option. For instance, Omura,
Mizukami, and Yamazaki (2002) give an example where the fair value of the convertible preferred shares
exceeded what the government had paid early in the conversion period, but the government failed to
exercise the option before the bank stock declined. Had the government acted, it could have recovered
twice as much as was possible in 2002. They suspect that the government never intended to exercise the
options. Instead this instrument could rationalize low dividend rates that were intended to provide a
subsidy to the banks. The use of multiple securities with various terms also obscured the cost of the
bailout.
The 1999 recapitalization had calming effects on the financial market. As seen in Figure 2, the
higher interbank loan rate that Japanese banks were required to pay compared with the U.S. and European
banks, disappeared soon after the recapitalization. In this sense, the 1999 recapitalization, together with
the introduction of a scheme for orderly closure of systemically important banks through nationalization
in 1998, ended the acute phase of the banking crisis.

13
The Prompt Recapitalization Act expired on March 2001, but capital shortages continued to be a
problem and so the government put together a couple of more small scale recapitalization programs. First,
the revision of the Deposit Insurance Act allowed the government to provide public capital to banks.
Specifically, Section 102-1 of the revised Deposit Insurance Act justified the use of public funds to help
troubled (but not failed) systemically important banks. This was used to prop up Resona Bank in June of
2003. The government bought ¥0.33 trillion of common shares and ¥1.66 trillion of preferred shares of
Resona.
Second, the Act of Strengthening Financial Functions (ASFF) was passed in June 2004. The law
allowed the government to inject public capital into banks without justifying their systemic importance.
From its inception to expiration at the end of October 2008, ¥40.5 billion was injected into two regional
banks (both in 2006). In late 2008 the Japanese government proposed a revision of the ASFF, so that it
could continue to inject capital into the banking sector when it is necessary.
3.4 The Chronic Capital Shortage Problems
Despite all these programs, the banks’ capital shortage persisted. Table 5 shows data from Fukao
(2008) on the condition of capital in the banks. As late as March of 2002, for example, Japanese banks
collectively had ¥29.3 trillion of core capital (equity capital and capital reserves) to buffer the risks
associated with assets of ¥744.8 trillion and loans of ¥440.6 trillion; so stated capital was equal to 3.9% of
the assets and 6.7% of the loans. However, ¥10.7 trillion of core capital was in the form of deferred tax
assets, which are tax deductions the banks would be able to claim in the future for the past loan losses if
they become profitable. If the banks do not regain their profitability, the tax deferred assets disappear.
Moreover, many banks still did not have sufficient level of loan loss reserves.
Fukao (2003) estimated the amount of under-reserving, which should be really written off from
the current capital. This deficit represents a failure to set aside “adequate” reserves. To calculate
adequate reserves, the amount of classified bad loans is multiplied by one minus the expected recovery
rate for each class of loans, which is estimated using the data from the 1990s. This leads to two potential
biases. On the one hand, because the recovery rate from bad loans improved after the late 1990s this
procedure is likely to overestimate the level of adequate reserves (and hence under-reserving) during the
2000s. On the other hand, because many outside observers believed that the banks were consistently
overstating the quality of their loans the estimates for the level of adequate reserves would have been too
low. As of March 2002, Fuako concludes that banks reserves were ¥6.9 trillion too low.

14
To give a rough sense of the capital deficit we subtract the deferred tax assets and under-reserving
from the official capital to arrive at what we call “modified capital.” As of March 2002 modified capital
was just ¥11.7 trillion, of which ¥7.2 trillion had been contributed by the government, so the Japanese
banking sector had hardly any private capital.
As a point of reference we can compare the modified capital to the capital that the banks would
have if they had equity equal to three percent of assets, as is required in the U.S. We call the difference
between modified capital and this lower bound the capital gap. As shown in the last column of Table 5
shows that this gap was consistently positive between 1997 and 2005.
3.5 Lessons from the Capital Injections
There were several reasons why the capital deficit continued despite the recapitalization programs.
First, the sizes of the programs were too small. Even the most comprehensive of the programs, the
recapitalization under the Prompt Recapitalization Act, injected only 8.7 trillion yen, which was about 1
percent of total bank assets (and less than 2% of total loans). Second, even after nationalizing two major
banks, the Japanese regulators did not force other major banks to clean up their non-performing loans.
Instead they were allowed to operate even with huge amounts of non-performing loans on their books.
The amount of non-performing loans (disclosed by banks) actually increased from 29.6 trillion yen
(March 1999) to 42.0 trillion yen (March 2002).
Finally, related to the second problem, the recapitalization programs emphasized loan volumes
rather than restoration of bank capital. The distinction was important because the Japanese banking sector
had begun the 1990s having rapidly expanded lending during the boom years of the late 1980s, even
though loan demand by large firms was falling due to financial deregulation that made bond financing
easier for them.12 Thus, the Japanese banks had more loans on their books than would be desired by their
customers over the medium term. Hoshi and Kashyap (2005) argue that consolidation was therefore
inevitable and that the government could have exploited this inevitability to lower the costs to the
taxpayer by concentrating the capital injections on the better capitalized banks. Doing so would have
avoided putting capital into failing institutions and would have rewarded better run banks. To the extent
that reorganizations were needed they could be led by the private sector rather than the government. The
recapitalization programs, however, did not realize the problem of overbanking.
12 Hoshi and Kashyap (2000) show that the financial deregulation opened up the option of nonbank financing for large customers and the banks responded by increasing their lending to real estate developers and small and medium firms.

15
Instead, the only objective that was pursued forcefully as part of the recapitalization was that
banks were required to increase their lending, especially to small and medium firms. The recapitalized
banks were required to report the amount of loans to small and medium firms every six months. The FSA
periodically requested the recapitalized banks to increase lending to small and medium firms.13 When
some banks substantially cut back the lending to small and medium firms, the FSA started to issue
business improvement orders. From 2001 to 2004, five banks received business improvement orders
because they reduced lending to small and medium firms (Shinsei Bank in 2001, UFJ Holdings and Asahi
Bank in 2002, Mizuho Holdings in 2003, and UFJ Holdings again in 2004). These orders required the
banks to increase lending or be subject to fines.
This preference for directed lending created some high profile conflicts. Tett (2003) provides
many examples regarding the experience of Shinsei Bank, the successor to LTCB. When LTCB emerged
from nationalization and was up for sale, the government insisted that all bidders promise to accept all the
loans on the books that a government committee deemed to be performing. The winning bidder, an
American-led consortium, determined that many of their existing customers were not profitable and
should not objectively receive credit. The government contested this assessment and pressed the bank to
maintain lending.14
The main problem with the Japanese approach was that the banks were kept in business for far
too long with insufficient capital. This limited the banks willingness to recognize losses and they took
extraordinary steps to cover up their condition and in doing so retarded growth in Japan (Caballero, Hoshi
and Kashyap (2008) and Peek and Rosengren (2005)).15 The U.S. policymakers seem to appreciate that
this was extremely costly and appear to be trying to avoid it. For instance, Treasury Secretary Paulson
explicitly said that some banks will fail even with the TARP.16
3.6 The Role of the Takenaka Plan and Macroeconomic Recovery in Rebuilding Bank Capital
Given that the capital injections do not seem to be responsible for the elimination of the capital
gap, what was? One important ingredient were the changes initiated in late 2002 and early 2003 at the
13 FSA (2006, pp.693-699) lists the public announcements that the FSA made to the recapitalized banks to increase small and medium firms loans. The counts on business improvement orders also come from this report. 14 This case was complicated because as part of the sale Shinsei had the right to return loans to the government if they could shown to be non-performing. Hence Shinsei had an incentive to take this position. 15 See Peek (2008) for a survey of the evidence on the behavior of the banks in the 1980s and 1990s. He also presents new analysis showing that bank assistance to distressed firms during the 1990s was different (and less effective) than the aid in the 1980s. 16 “Paulson Says U.S. to Use All ‘Authorities’ in the Crisis,” Bloomberg.com, October 8, 2008.

16
behest of Heizo Takenaka, who was newly appointed to head the government’s financial reform efforts.
Within a month of his appointment, Takenaka announced the Financial Revival Program (Kin’yū Saisei
Program) that called for (1) more rigorous evaluation of bank assets, (2) increasing bank capital, and (3)
strengthening governance for recapitalized banks (Omura, Mizukami, and Kawaguchi, 2006, p.4).
Takenaka, in his memoirs, explains that he attempted to use six measures to end the non-
performing loans problem at major Japanese banks. Specifically he sought (1) to have banks make more
rigorous evaluation of assets using discounted expected cash flows or market prices of non-performing
loans, (2) to check cross-bank consistency in classifying loans to large debtors, (3) to publicize the
discrepancy between the banks’ self evaluations and the FSA's evaluations, (4) to be prepared to inject
public funds if necessary, (5) to prohibit banks from declaring unrealistically large deferred tax assets,
and (6) to impose business improvement orders for banks that substantially underachieved the
revitalization plans. He concludes he was successful in implementing all of these six with possible
exception of (5) (which in the end he had to leave to the discretion of banks and their accountants).17
The FSA followed the “Takenaka Plan” and became tougher in its audits of the banks. In the
early part of 2003, this pressure led many of the largest banks to issue shares (typically through private
placements) to improve their capital ratios. Resona Bank’s capital ratio for March 2003 fell below 4%
after it was not allowed to count five years worth of tax deferred assets as capital. The FSA used the
Deposit Insurance Act section 102-1 and injected capital into Resona Bank.
In August 2003, the FSA also issued business improvement orders to fifteen recapitalized banks
and financial groups, including five major ones (Mizuho, UFJ, Mitsui Sumitomo, Mitsui Trust, and
Sumitomo Trust) for failing to meet their profit goals for March 2003. They were required to file
business improvement plans and report their progress each quarter to the FSA.
UFJ Holdings was found to have failed to comply with its revised plan in March 2004 and
received another business improvement order. The CEOs of UFJ Holdings, UFJ Bank, and UFJ Trust
were forced to resign, and the salaries for the new top management were suspended. The dividend
payments (including those on preferred shares) were stopped. Salaries for the other directors were cut by
17 Some of these measures were implemented actually before Takenaka became the Minister. For example, the FSA conducted special inspections of major banks from October 2001 to March 2002 and publicized the result in April 2002 (http://www.fsa.go.jp/news/newse/e20020412-1.html). The use of the discounted cash flow method in an attempt to achieve consistent evaluation of non-performing loans to large debtors, however, was new, and introduced in the special inspection for March 2003 period under Minister Takenaka.

17
50%, their bonus had already been suspended, and the retirement contributions for the management were
also suspended. The number of regular employees was reduced and their bonuses were cut by 80%.18
Finally there was a shift in the workout policies pursued by the IRCJ and the RCC. From the
middle of 2003 onwards much more emphasis was put on reorganizing troubled borrowers led. Figure 4
shows that the origination of new Non-Performing Loans (shown in the top half of the graph) began to
slow from 2003 onwards. Likewise, from 2003 to 2005, a substantial number of bad loans were removed
from the banks’ balance sheets.
Table 6 offers a closer look at the evolution of capital between 2003 and 2007. Over this period
the banks’ official capital grew by ¥15 trillion. There were two big sources of gains. The first was
improved operating performance that led to higher retained earnings. This is consistent with the
improved loan loss performance indicated in Figure 4. The second major contributor was capital gains on
the stock portfolio.
Table 7 gives some annual figures on the nature of the gains. We see two important patterns in
this table. First, the operating performance improves sharply in 2006 and 2007. The profitability in the
prior two years is unremarkable. This is particularly interesting because GDP growth was respectable
from 2003 onwards. So there was a lag between the macroeconomic improvements and the performance
of the banks. Looking more closely at the income and expense data shows that 2006 was time when the
banks were able to substantially raise revenue and cut costs.
The second, hardly surprising, observation is that the capital gains tracked the movements in
aggregate stock prices. As shown in the bottom of the table, the Nikkei 225 average showed two big
jumps during this period, one between March 2003 and March 2004 and then a second between March
2005 and March 2006. Combining these two observations suggests that in the Japanese case the
performance of the aggregate economy was paramount in the recovery of bank capital.
4. The U.S. Crisis and Responses
Before diving into our evaluation it is helpful to review the key developments in the U.S. The
problems for the U.S. financial system started with increased defaults of subprime and other
nontraditional mortgage loans as the housing boom came to an end. During the housing boom of the
2000s, risky mortgage loans were securitized, structured into various types of financial products, and
distributed to investors all around the world. But the risk diversification was far from complete and many 18 UFJ Holdings, 2004, Keiei no Kenzenka no tame no Keikaku no Gaiyo (Management Revitalization Plan: Abstract). (http://www.fsa.go.jp/kenzenka/k_h160924/ufj_a.pdf)

18
financial institutions increased their ownership of real estate related assets. For example, Udell (2008)
points out that large U.S. commercial banks increased the proportion of real estate loans in their portfolio
from 44% in 2003 to 53% by 2007. As the underlying mortgages become non-performing, the values of
their derivative securities declined, and the financial institutions that held the securities started to suffer
losses. Given the leverage in the financial system these losses were significant relative to the equity of
these firms (Greenlaw et al. (2008)).
By early 2008, the financial problem started to jeopardize the viability of large financial
institutions. In March 2008, the Bear Stearns nearly failed and was rescued by JP Morgan with financial
assistance from the Federal Reserve System.
By September, more financial institutions encountered serious funding problems and asked for
government assistance. First, Fannie Mae and Freddie Mac, the two government sponsored mortgage
giants, were rescued by the government. Shortly afterwards, Lehman Brothers, a major investment bank,
also sought help. The government was reluctant to provide financial assistance to Lehman and
encouraged other financial institutions to rescue it. No financial institutions were willing to step up
without government help. Running out of alternatives, Lehman filed for bankruptcy on September 15.
Financial market conditions shifted notably in the week that followed. The cost of insuring the
debt of many other financial institutions jumped noticeably. Stock markets around the world dropped
sharply. A money market mutual fund informed investors that it would not be able to redeem claims at
par value. Press reports described credit markets as frozen. One example being that financial firms’
ability to issue commercial paper for more than a week seems to have disappeared: the average maturity
of newly issued commercial paper dropped from over one month to less than 5 days. Another troubled
investment bank, Merrill Lynch, was acquired by Bank of America. The U.S. government rescued the
largest U.S. insurance company, AIG Insurance.
Toward the end of that week, the regulators announced several measures aimed at calming the
markets. The Federal Reserve Bank decided to insure the money market funds. The Treasury announced
the idea of setting up a facility to buy non-performing assets from financial institutions. The Securities
Exchange Commission imposed a temporary ban on short sales of financial stocks.
The Treasury’s idea was developed into the Troubled Asset Relief Program (TARP) and was included in
the bill for the Emergency Economic Stabilization Act (EESA). Many politicians worried about
committing $700 billion on the program that would be run by the Treasury without much oversight, and
the bill was initially voted down by the Congress. The government quickly revised the bill, adding some
additional measures to stimulate the economy, and the revised bill passed the Congress on October 3.
The TARP, the central part of the bill, did not change very much in the revision.
19
Within a week, the Treasury started to shift the focus from the original idea of buying trouble
assets to buying bank shares to increase the bank capital. On October 14, the Treasury announced that it
would use $125 billion to inject capital into nine large financial institutions by buying preferred shares
with warrants to buy common shares. The Republicans lost the Presidential election on November 4. On
November 12, the Treasury announced that the original TARP plan of buying troubled assets would be
postponed indefinitely.
In several important respects the problems facing the U.S. differ from the Japanese case, and the
U.S. responses so far partially reflect these differences. Perhaps most important among these is that
losses in the U.S. have not come from bad loans to businesses. Thus, there is no need to restructure or
liquidate the borrowers’ businesses. The social concerns over the massive displacement associated with
wide-scale restructuring and the lack of political will to force this adjustment constituted a major
stumbling block in Japan. This is one problem that is not yet present in the U.S. The major part of the
U.S. problem is in non-performing mortgages and the securities backed by them. Restructuring
mortgages involve different challenges than rehabilitating the industrial borrowers.
The critical question is whether the regulatory measures of the U.S. government will rebuild capital in the
banking system. Here it appears that many of the same problems that were evident in Japan arise.
4.1 Evaluating the Asset Purchase Proposal in Light of the Japanese Experience
First, consider the original version of the TARP that focused on government purchase of troubled
assets. As of this writing, December 2008, the Treasury seems to have decided not to pursue this strategy,
but some members of Congress continue to support this approach. One issue is whether the banks will
want to sell their assets to the government. The possible stigma from participating and loss in the option
value for the existing shareholders from a recovery will have to be overcome. Perhaps the easiest way to
overcome these problems would be to pay more for the assets than the current market prices, assuming
the banks have already marked the value of those assets to market. Doing so eliminates the stigma (since
accepting a subsidy is rational for even a well-capitalized bank).
The law and the Treasury’s intentions were never clear on how the prices for the assets would be
set and the choice of assets to purchase would be determined. The law instructs the Treasury Secretary to
“use the authority under this Act in a manner that will minimize any potential long-term negative impact on the taxpayer, taking into account the direct outlays, potential long-term returns on assets purchased, and the overall economic benefits of the program, including economic benefits

20
due to improvements in economic activity and the availability of credit, the impact on the savings and pensions of individuals, and reductions in losses to the Federal Government.”
In acquiring assets the Treasury was to “make such purchases at the lowest price that the Secretary
determines to be consistent with the purposes of this Act.”
If the current market prices of the distressed assets are below their fundamental values, as many
market participants and government officials have suggested, this may create room for the government to
pay substantially more than the market prices. But nobody knows how far the market prices are from the
fundamental values and the Treasury sent mixed messages about whether it preferred to pay above
prevailing market prices.19
Other regulatory measures that accompany the TARP would have also discouraged financial
institutions from selling the assets to the Treasury. For example, the restrictions on the executive pay (if
they were to have any teeth) may have stopped some banks from coming forward. Moreover, the ESSA
mandated that the Securities and Exchange Commission study the impact of mark-to-market accounting
on financial institutions and bank failures. If mark-to-market were suspended many banks may prefer not
to sell their troubled assets since they might be able to carry those assets on their balance sheets at what
they claim to be the fair value.
For the original TARP to recapitalize the banks successfully, the scale of the program would also
be extremely important. There was little discussion of how the size of the program was determined. To
judge the adequacy of $700 billion program, it is important to recall that just in 2006 and 2007, over $1.4
trillion of non-traditional mortgages were originated. With the U.S. economy in recession and contracting
substantially at the end of 2008, there are bound to be many other impaired assets residing on bank
balance sheets. So, if the original TARP was successful in getting participation, its size would have
become the constraint.
Yet another impediment to using the original TARP to recapitalize would be the structure of most
banks’ liabilities. Suppose that the troubled assets purchased by the Treasury does raise the value of the
troubled assets and hence the value of bank assets. This would also lead to an increase in the market
value of the banks’ liabilities. But banks have both debt and equity. For many of the largest banks their
debt is trading below the face value. The debt is senior to the equity, hence for firms with debt this is not
valued at par the increase in the value of the debt will limit the increases in the value of the equity. This
logic suggests that for the original TARP to create capital the asset purchases would need to be targeted at
firms whose debt was not impaired or had been restructured. 19 For instance, there was considerable discussion over how the Treasury might design a reverse auction to minimize the cost to the Treasury of acquiring assets.

21
The final challenge that the original TARP would have faced is planning an orderly way to
dispose of the assets. The law gives the Treasury Secretary full discretion over the timing of any sales,
taking into consideration the goal of maximizing overall returns on the portfolio. Japanese AMCs, at least
in their early years, just held on to the acquired assets. This approach is counter-productive, because
people worried that these assets could be dumped at any time and the overhang can keep prices depressed.
On the other hand, immediately dumping all the assets does not work, either. The prices would
presumably move back to about their current levels, and reduce the prices of similar assets that the banks
still own.
4.2 Evaluating the CPP in Light of the Japanese Experience
Turning to the CPP, which seems to be the central part of the TARP as of this writing, some
different issues arise. Most important will be making sure that the banks do want to participate. The U.S.
government was successful coercing the participation of major banks for a first round of equity purchases.
But the cooperation came with some risky compromises. One similarity to the Japanese program was the
offer of capital to all the largest banks without auditing to determine their health. The U.S. banks are also
permitted to continue to pay dividends, which will redirect some of the money spent by the government.
Finally, the banks that sold shares to the government were also allowed to rollover expiring debt between
October 2008 and June 2009 with a government guarantee. We review the risks associated with each of
these compromises in turn.
The implications of the lack of auditing are already apparent in the handling of the Citibank.
According to the Wall Street Journal:20
In late September, the company reached an agreement for a government-financed acquisition of Wachovia Corp. Under that planned deal, Citigroup and the government were going to divvy up the losses on $312 billion of assets, with Citigroup absorbing the first $30 billion in losses and the government shouldering the remainder. Citigroup described that arrangement as intended to insulate it from Wachovia's risky mortgage assets. But Citigroup also would have been able to unload some of its own assets, according to people familiar with the matter.
Thus it was apparent that government was aware that Citigroup was in trouble in September. Nonetheless,
in October Citigroup was able to participate in the first round of the CPP with the same terms as the other
20 “U.S. agrees to rescue struggling Citigroup”, page A1, November 24, 2008.

22
banks. A month later Citigroup required a second capital injection. The Wall Street Journal described the
deliberations over the second round of assistance as21:
Inside the government it was far from clear that action was needed. Citigroup's stock price was tumbling, but there was no sense the company was in danger of failing. But over the weekend, as they pored through Citigroup's books, it became clear to top officials that the company needed government help.
If these reports are correct, then through November, the government was still making rescue decisions
with limited information on the condition of the banks. The same news article quoted Stuart Plesser, an
equity analyst at the credit rating agency Standard and Poor’s, as saying "we are concerned that losses
may eventually exceed the government's backstop."
In Japan the recovery started with the toughening of the regulatory audits. In the U.S. the analogy
might involve using a common set of prices to evaluate the banks’ portfolios. This would be imperfect
since the banks continue to hold many illiquid assets, but doing so would establish the relative health of
the banks, so that if further capital injections are needed the money could be concentrated on the best ones.
The Japanese banks were also allowed to pay dividends even after the 1999 recapitalization, but
the Japanese banks that received capital were required to file Revitalization Plans and had to show that
dividend payments were consistent with a path to recovery. Under the injections made in the first tranche
of the CPP, banks were allowed to continue paying dividends on common stock, provided they made the
payments to preferred shares, at the same rate they had been paying. Scharfstein and Stein (2008)
estimated that this meant that in principle the nine TARP banks could have paid out just over $25 billion
of the $125 billion in the first year —although with the second Citibank deal, Citi must seek government
approval to pay any dividends, so the total maximum payout for the remaining banks would be just over
$22 billion.
Veronesi and Zingales (2008) attempt to quantify the size of the windfalls for debt holders as a
result of the capital purchase program. Their core calculation presumes that by virtue of the debt
guarantees that accompanied the capital purchases, the banks effectively can rollover their expiring debt
at the same cost as the government faces. They approximate the savings as being equal to the change in
the price of default insurance on the debt that occurred over the weekend when the CPP was announced.
As they note, this calculation is confounded by the general equilibrium gains for the entire economy that
might have been created by virtue of program. For instance, General Electric Capital (GE Capital), a
financial services company that did not receive any funding in the first round of injections saw the cost of
21 “Citgroup faces pressure to slim down”, page A1, November 25, 2008

23
insuring its debt drop substantially. Veronesi and Zingales use the drop of the insurance premium for GE
Capital as a benchmark and then compute any additional savings for the TARP nine banks. They find the
debtholders at the TARP-9 saw their claims rise by about $100 billion (over and above what would have
been expected based on the change at GE Capital). While the GE Capital control is imperfect, their
calculations suggest that the transfers to the debtholders may have been quite large.
Each of these concerns goes in the direction of suggesting that the money spent as part of the CPP
may not increase the value of the equity and hence increase the risk bearing capacity of the banks. This is
the purpose of the program and if the banking system emerges with too little capital, the program will
likely be judged to have failed.
4.3 Risks for U.S. Looking Ahead
To gauge the amount of the funding required Table 8 reports selected data for the nine institutions
that received capital under the October 14 agreement. The table shows the condition of the firms prior to
these injections and includes the mergers that were completed through September.22 The second and third
columns of the table show the total assets and the off-balance sheet commitments to lend that were in
place. We include commitment data because draw downs on commitments are largely outside the control
of the banks. Once the Merrill Lynch and Bank of America merger is complete, the U.S. banking system
will feature four giants firms that each have assets over $1.8 trillion and have combined levels of
commitments and assets of between $3 and 4 trillion each.
The next four columns in the table present information intended to give hints about the exposure
of the banks to further deterioration in the real estate market and the broader economy. These measures
are all ratios where the denominators are the sum of total assets plus total commitments. The lending
column ratio takes loans plus commitments to be the numerator of the ratio. The four giants have very
different business models from the other banks, and in particular have a much higher risk of suffering
substantial loan losses.
The next three measures disaggregate the banks’ assets into those related to real estate, credit
cards and other consumer exposures. The numerators are respectively, real estate loans and real estate
22 More specifically, the data for Wells Fargo includes Wachovia, the JP Morgan Chase data include Washington Mutual and Bear Sterns, the Bank of America includes Countrywide but not Merrill Lynch. In the next draft of the paper we will be able to update the data through December using the common regulatory filings required for bank holding companies.

24
related securities plus real estate related commitments; credit card loans to individuals plus credit card
related securities and credit card commitments; and all other consumer loans and securities.
We draw two main conclusions from these indicators. First, the two biggest risks going forward
relate to potential credit card losses and further real estate related losses. Second, there is remarkable
heterogeneity across the banks in exposures to these two factors. Wells Fargo and the other smaller
institutions have little credit card risk. In contrast, Wells, in part due to its acquisition of Wachovia, has
by far the most real estate risk. On these figures, Citigroup looks somewhat insulated from real estate, but
based on subsequent data that came to light around the time of the second capital injection, Citigroup had
some legally separate real estate entities that it has taken back onto its balance sheet. Hence data through
December will show Citigroup as having a larger real estate exposure. Without knowing the details of the
loan provisioning at the bank level, we cannot be sure of the exact risks that each institution face, but it
seems very likely that the exposures are heterogeneous.
The following column shows the ratio of total bank equity to total assets. Prior to the capital
injections the banks also differed substantially on this dimension. Citigroup’s need for extra capital is not
surprising. One could also see why Wells Fargo would have been much less interested in taking on
additional capital than the other institutions. These data may help to explain why some of the firms
would have fought hard to preserve their right to pay dividends.
The final column shows the dividend payouts for the upcoming year that were permissible as of
the first capital injection.23 These numbers are based on the payout rates through the second quarter of the
year. Besides being large in aggregate, the dividend payment patterns are consistent with the capital
ratios. The three better capitalized giants were already paying substantially more than Citigroup.
Finally, in the period after the Lehman Brothers failure, it appears that a credit crunch has taken
hold in the U.S. Data from surveys of bank loan officers has shown a progressive tightening of lending
standards from the middle of 2007 onwards. Better evidence on this is provided by Ivashina and
Scharfstein (2008). They focus on new lending to large borrowers and show that this type of bank
lending dropped precipitously between August and October of 2008.
To demonstrate that this was not simply a change in loan demand associated with the
deteriorating economy they present two pieces of evidence. First, they show that many companies drew
down lines of credit even though they had no immediate need for cash. These pre-emptive draw downs
were typically explained by the borrower’s concern about credit availability given the disruptions in credit
markets (see their Exhibit 2). 23 We thank David Scharfstein for supply these figures. Note that Citigroup is restricted following its second capital injection.

25
From Table 8 we can see that the proportion of unused loan commitments relative to existing
assets varies substantially for the large banks. Ivashina and Scharfstein exploit this type of variation to
see whether banks with relatively larger amounts of existing unused commitments (and hence potential
future lending that they cannot control) are cutting back more current lending. They find part of the
commitment differences are explained by the differences in deposits, as predicted by Kashyap, Rajan and
Stein (2002), and controlling for deposits, the banks with more unused commitments have reduced
lending more.
Based on Table 8 the $145 billion that has been injected into these major banks looks small. It is
less than 1% of total assets and commitments, and less than 5% of banks’ exposure to the real estate or
credit cards. Although this very crude comparison ignores the existent provisioning, it shows that the risk
capital injections through the CPP turn out to be insufficient to solve the capital shortage and credit
crunch.
5. Conclusions
The U.S. financial system is in very fragile shape. As in the recent Japanese financial crisis, the
shortage of capital is the fundamental problem that must be fixed. The U.S. bailout plan was originally
very similar to the Japanese approach before the late 1990s in that it does not clearly identify the capital
problem as critical and instead proposed using AMCs to remove distressed assets from bank balance
sheets. When Japan used AMCs, their effectiveness was limited in part because they did not purchase
enough assets. AMCs did not help recapitalization, either, and Japan had to come up with different
mechanisms to use public funds for recapitalization. Both these risks are also present for the U.S. plan.
Subsequent to the Congressional debate over the TARP and the testimony over its purpose, the
Treasury has shifted the focus to the capital purchase program. Japan teaches us that challenges related
to capital injections differ somewhat from the challenges related to asset purchases. Inducing banks to
participate is one factor. It is also critical to make sure that enough money is spent so that banks actually
emerge adequately capitalized. Finally, care should be taken not to waste money propping up financial
institutions that will ultimately fail. To deal with these issues, the details of the recapitalization program
are important. Without careful thinking of the details, even a well-intentioned program could go awry.
Finally, the U.S. response to the crisis has been much faster and more aggressive than in Japan.
Compressing so many policy changes, including several policy reversals, into such a short period has
created a very fluid environment. Japan’s prolonged response meant that its various policies were
expiring at different times. For the U.S., many temporary programs will need to be renewed or

26
terminated in 2009. This suggests that discussions regarding an exit strategy for many of these
interventions will have to be compressed as well.

27
References
Baldwin, Richard and Barry Eichengreen, 2008, Rescuing our Jobs and Savings: What G7/8 Leaders Can Do To Solve the Global Credit Crisis, VoxEU.org, London.
Caballero, Ricardo J., Hoshi, Takeo and Anil K Kashyap, 2008, “Zombie Lending and Depressed
Restructuring in Japan”, American Economic Review, forthcoming. Cargill, Thomas, Michael Hutchison, and Takatoshi Ito, 2001, Financial Policy and Central Banking in
Japan, Cambridge, MA: MIT Press. Fukao, Mistushiro, 2000, “Recapitalizing Japan’s Banks: The functions and problems of Financial
Revitalization Act and Bank Recapitalization Act”, Keio Business Review, 38, pp. 1-16. Fukao, Mitsuhiro, 2003, “Financial sector profitability and double gearing,” in Structural
Impediments to Growth in Japan, Magnus Blomstrom, Jenny Corbett, Fumio Hayashi, and Anil Kashyap (eds.), Chicago: University of Chicago Press, pp. 9-35.
Fukao, Mitsuhiro, 2008, “Beikoku-hatsu Kin’yu Kiki to Nihon no Kin’yu System (Global Financial Crisis
and Japanese Financial System)”, Japan Center for Economic Research, Financial Study No. 19, October 2008.
Fukuda, Shin-ichi, 2008, “The Role of Monetary Policy under Financial Turbulence: What Role did the
Quantitative Easing Policy Play in Japan?” CIRJE Discussion Paper, J-205. Greenlaw, David, Hatzius, Jan, Kashyap, Anil K, and Hyun Song Shin, 2008, “Leveraged Losses:
Lessons from the Mortgage Market Meltdown”, Proceedings of the U.S. Monetary Policy Forum No. 2, Rosenberg Institute, Brandeis International Business School and Initiative on Global Markets, University of Chicago Booth School of Business.
Hoshi, Takeo, and Anil K Kashyap, 2000, “The Japanese Banking Crisis: Where did it come from and
how will it end?” NBER Macroeconomics Annual 1999, pp.129-201. Hoshi, Takeo and Anil K Kashyap, 2001, Corporate Financing and Governance in Japan: The Road to
the Future, MIT Press, Cambridge: MA. Hoshi, Takeo and Anil K Kashyap, 2005, “Solutions to Japan’s Banking Problems: What might work and
what definitely will fail” in Takatoshi Ito, Hugh Patrick, and David Weinstein eds., Reviving Japan's Economy: Problems and Prescriptions, MIT Press, pp. 147-195.
Ito, Takatoshi, and Kimie Harada, 2005, “Japan Premium and Stock Prices: Two Mirrors of Japanese Banking Crises,” International Journal of Finance and Economics, 10, 195-211.
Ivashina, Victoria and David Scharfstein, 2008, "Bank Lending During the Financial Crisis of 2008", mimeo, Harvard Business School.
Kashyap, Anil K, 2002, “Sorting out the Japan’s Financial Crisis”, Economic Perspectives, Federal
Reserve Bank of Chicago, 2002/Q4, pp. 42-256.

28
Kashyap, Anil K, Stein, Jeremy C., and David W. Wilcox, 1993, “Monetary Policy and Credit
Conditions: Evidence from the Composition of External Finance”, American Economic Review, vol. 83(1), pp. 78-98.
Kashyap, Anil K, Rajan, Raghuram G. and Jeremy C. Stein, “Banks as Liquidity Providers: An
Explanation for the Co-Existence of Lending and Deposit-Taking,” Journal of Finance, 2002, LVII(1), pp. 33-74.
Motonishi, Taizo and Hiroshi Yoshikawa, 1999, “Causes of the Long Stagnation of Japan during the 1990s: Financial or Real?”, Journal of the Japanese and International Economies, 13, pp. 181–200.
Nakaso, Hiroshi, 2001, “The Financial Crisis in Japan during the 1990s: How the Bank of Japan
Responded and the Lessons Learned,” BIS Papers No.6. Omura, Keiichi, Shinji Mizukami, and Yoichi Yamazaki (2002). “Kōteki Shikin ni yoru Shihon Chūnyū
Hōshiki ni tuite (On the Method of Capital Injection using Public Funds),” Director General for Economic Assessment and Policy Analysis, Cabinet Office, Discussion Paper 02-1.
Omura, Keiichi, Shinji Muzukami, and Ken-ichi Kawaguchi, 2006, “Kin’yū System Antei-ka Seisaku no
Kenshō (Evaluation of the Financial System Stabilization Policy),” Waseda University Institute of Finance, Working Paper 06-005.
Packer, Frank, 2000, “The Disposal of Bad Loans in Japan: The Case of CCPC,” in Crisis and
Change in the Japanese Financial System. Takeo Hoshi and Hugh Patrick, eds. Boston, Mass.: Kluwer Academic Publishers, pp. 137–57.
Peek, J., and E. Rosengren (2001), “Determinants of the Japan Premium: Actions Speak Louder than
Words,” Journal of International Economics, Vol. 53, No. 2, pp. 283-305. Peek, Joe and Eric S. Rosengren, 2005, “Unnatural Selection: Perverse Incentives and the Misallocation
of Credit in Japan”, American Economic Review, 95(4), pp. 1144-1166.
Peek, Joe, 2008, “The Contribution of Bank Lending to the Long-Term Stagnation in Japan”, mimeo,
University of Kentucky. Scharfstein, David S. and Jeremy C. Stein, 2008, “The Bailout Doesn’t Pay Dividends”, New York Times,
October 20, 2008. Takenaka, Heizo, 2006, Kōzō Kaikaku no Shinjitsu: Takenaka Heizo Daijin Nisshi (True Story on
Structural Reform: Diary of Minister Heizo Takenaka. Tokyo, Japan: Nihon Keizai Shimbun Shuppan.
Tett, Gillian, 2003, Saving the Sun: A Wall Street Gamble to Rescue Japan from its Trillion-Dollar
Meltdown, Harper-Collins: New York, NY. Udell, Gregory F., 2008, “Wall Street, Main Street and a Credit Crunch: Some Thoughts on the Current
Financial Crisis,” Business Horizons, forthcoming.

29
Veronesi, Pietro and Luigi Zingales, 2008, “Paulson’s Gift”, mimeo, University of Chicago Booth School
of Business.

Table 1: Asset Management Companies in Japan
(¥ Trillion)
Name Dates (purchases)
Target Purchases Actual Amount Spent [book value]
Amount Collected
Comments
Cooperative Credit Purchasing Co. (CCPC)
12/1992-3/2001
Non-performing loans with land collateral of contributing banks
5.8 [15.4]
NA Bank financed, created tax benefits by buying loans Liquidated in 3/2004
Tokyo Kyodo Bank 1/1995-4/1999
Initially assets of failed credit unions, later assets of any failed banks
4.718 [NA]
5.362 Reorganized as Resolution and Collection Bank (RCB) in 9/1996
Housing Loan and Administration Corp. (HLAC)
7/1996-4/1999
Loans of failed jusen (specialty housing loan companies)
4.656 [NA]
3.233 Financed with mix of public and private money
Resolution and Collection Corp.
4/1999-6/2005
Combined RCB and HLAC, mandate extended to allow purchases of assets from solvent banks
0.356 [4.046]
0.649 Starting in 2001 also reorganized loans, ultimately involved in restructuring 577 borrowers
Industrial Revitalization Corp. of Japan
5/2003- 3/2005
Buy non-performing loans through 2005, restructure them within 3 years
0.53 [0.97]
NA [0.094 surplus as of 5/2007]
Restructured 41 borrowers with 4 trillion total debt Closed in 5/2007

Table 2: Loan Losses in Japan
(¥ Trillion)
Date Loan
Losses Cumulative Loan Losses since 4/1992Number of
Major Banks3/1994 3.872 5.512 21 3/1995 5.232 10.744 21 3/1996 13.369 24.113 20 3/1997 7.763 31.877 20 3/1998 13.258 45.135 20 3/1999 13.631 58.766 17 3/2000 6.944 65.710 18 3/2001 6.108 71.818 18 3/2002 9.722 81.540 15 3/2003 6.658 88.198 13 3/2004 5.374 93.572 13 3/2005 2.848 96.420 13 3/2006 0.363 96.783 11 3/2007 1.046 97.829 11 3/2008 1.124 98.953 11
Table 3: Capital Injection Programs in Japan
(¥ Trillion)
Legislation Date Securities Used
Number of financial institutions (# with nonzero
outstanding balance) Amount Injected
Amount Sold or Collected to date (as of
September 2008) Financial Function Stabilization Act
3/1998 Preferred shares, subordinated debt
21 (2) 1.816 1.653
[1.626 (book)] Prompt Recapitalization Act
3/1999 - 3/2002
Preferred shares, subordinated debt
32 (10) 8.605 8.820
[7.556 (book)] Financial Reorganization Promotion Act
9/2003 Subordinated debt 1
(0) 0.006 0.006 [0.006 (book)]
Deposit Insurance Act (Article 102-1)
6/2003 Common shares, preferred shares
1 (1) 1.960 0.611
[0.017 (book)] Act for Strengthening Financial Functions
11/2006-12/2006 Preferred shares 2
(2) 0.041 0.000
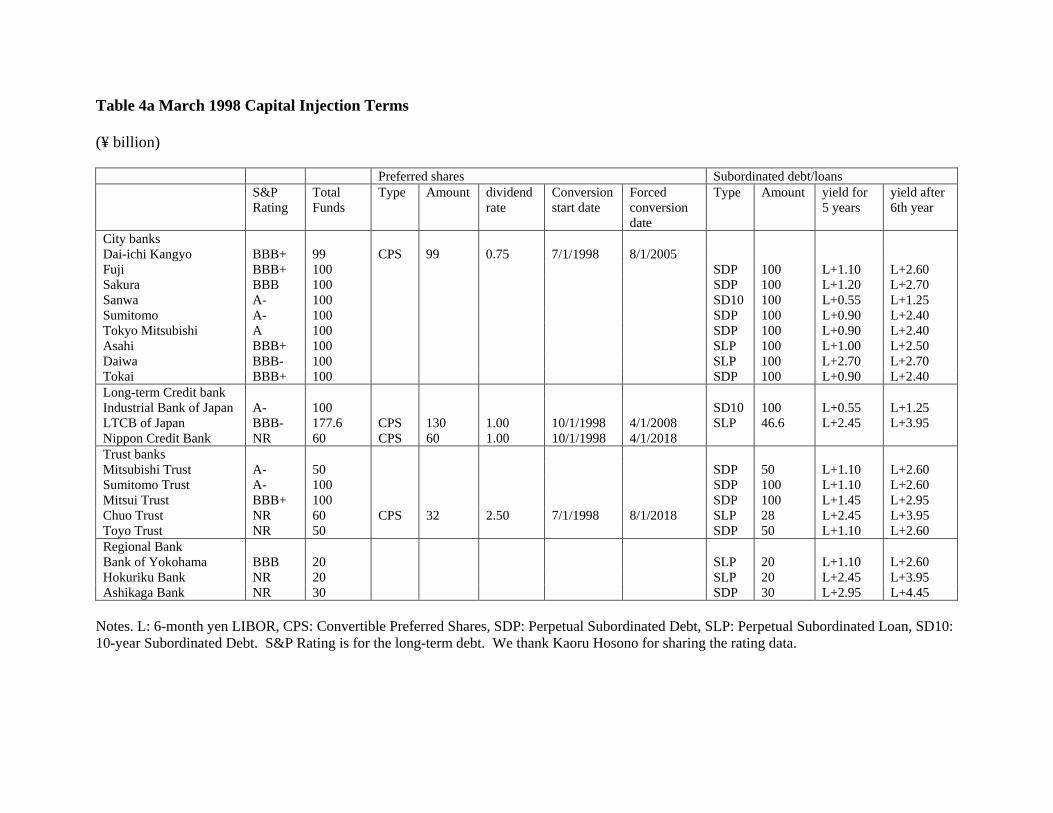
Table 4a March 1998 Capital Injection Terms (¥ billion)
Preferred shares Subordinated debt/loans S&P
Rating Total Funds
Type Amount dividend rate
Conversion start date
Forced conversion date
Type Amount yield for 5 years
yield after 6th year
City banks Dai-ichi Kangyo BBB+ 99 CPS 99 0.75 7/1/1998 8/1/2005 Fuji BBB+ 100 SDP 100 L+1.10 L+2.60 Sakura BBB 100 SDP 100 L+1.20 L+2.70 Sanwa A- 100 SD10 100 L+0.55 L+1.25 Sumitomo A- 100 SDP 100 L+0.90 L+2.40 Tokyo Mitsubishi A 100 SDP 100 L+0.90 L+2.40 Asahi BBB+ 100 SLP 100 L+1.00 L+2.50 Daiwa BBB- 100 SLP 100 L+2.70 L+2.70 Tokai BBB+ 100 SDP 100 L+0.90 L+2.40 Long-term Credit bank Industrial Bank of Japan A- 100 SD10 100 L+0.55 L+1.25 LTCB of Japan BBB- 177.6 CPS 130 1.00 10/1/1998 4/1/2008 SLP 46.6 L+2.45 L+3.95 Nippon Credit Bank NR 60 CPS 60 1.00 10/1/1998 4/1/2018 Trust banks Mitsubishi Trust A- 50 SDP 50 L+1.10 L+2.60 Sumitomo Trust A- 100 SDP 100 L+1.10 L+2.60 Mitsui Trust BBB+ 100 SDP 100 L+1.45 L+2.95 Chuo Trust NR 60 CPS 32 2.50 7/1/1998 8/1/2018 SLP 28 L+2.45 L+3.95 Toyo Trust NR 50 SDP 50 L+1.10 L+2.60 Regional Bank Bank of Yokohama BBB 20 SLP 20 L+1.10 L+2.60 Hokuriku Bank NR 20 SLP 20 L+2.45 L+3.95 Ashikaga Bank NR 30 SDP 30 L+2.95 L+4.45
Notes. L: 6-month yen LIBOR, CPS: Convertible Preferred Shares, SDP: Perpetual Subordinated Debt, SLP: Perpetual Subordinated Loan, SD10: 10-year Subordinated Debt. S&P Rating is for the long-term debt. We thank Kaoru Hosono for sharing the rating data.

Table 4b March 1999 Capital Injection Terms (¥ billion) Preferred shares Subordinated debt/loans S&P
Rating Total Funds
Type Amount dividend rate
Conversion start date
Forced conversion date
Type Amount yield yield after step-up
step-up date
City banks Dai-ichi Kangyo BBB 900 CPS 200 0.41 8/1/2004 8/1/2006 SD10 100 L+0.75 L+1.25 4/1/2004 CPS 200 0.70 8/1/2005 8/1/2008 SD11 100 L+0.75 L+1.25 4/1/2005 NCPS 300 2.38 Fuji BBB+ 1,000 CPS 250 0.40 10/1/2004 2/1/2009 SDP 200 L+0.65 L+1.35
L+2.15 4/1/2004 4/1/2009
CPS 250 0.55 10/1/2006 2/1/2011 NCPS 300 2.10 Sakura BBB 800 CPS 800 1.37 10/1/2002 10/1/2009 Sanwa BBB+ 700 CPS 600 0.53 7/1/2001 8/1/2008 SDP 100 L+0.34 L+1.34 10/1/2004 Sumitomo BBB+ 501 CPS 201 0.35 5/1/2002 2/27/2009 CPS 300 0.95 8/1/2005 2/27/2009 Asahi BBB+ 500 CPS 300 1.15 7/1/2002 12/1/2009 SLP 100 L+1.04 L+2.54 4/1/2009 CPS 100 1.48 7/1/2003 12/1/2014 Daiwa BB+ 408 CPS 408 1.06 6/30/1999 4/1/2009 Tokai BBB- 600 CPS 300 0.93 7/1/2002 3/31/2009 CPS 300 0.97 7/1/2003 3/31/2009 Long-Term Credit Industrial Bank of Japan BBB+ 600 CPS 175 0.43 7/1/2003 9/1/2009 SDP 250 L+0.98 L+1.48 4/1/2004
CPS 175 1.40 9/1/2003 9/1/2009 Trust banks Mitsubishi Trust BBB 300 CPS 200 0.81 7/31/2003 8/1/2008 SDP 100 L+1.75 L+2.25 4/1/2004 Sumitomo Trust BBB 200 CPS 100 0.76 4/1/2001 3/31/2009 SD12 100 L+1.53 L+2.03 4/1/2006 Mitsui Trust BBB- 400 CPS 250.3 1.25 7/1/1999 8/1/2009 SLP 150 L+1.49 L+1.99 3/31/2004 Chuo Trust NR 150 CPS 150 0.90 7/1/1999 8/1/2009 Toyo Trust NR 200 CPS 200 1.15 7/1/1999 8/1/2009 Regional Bank Bank of Yokohama BBB 200 CPS 70 1.13 8/1/2001 7/31/2009 SDP 50 L+1.65 L+2.15 4/1/2004 CPS 30 1.89 8/1/2004 7/31/2009 SL10 50 L+1.07 L+1.57 4/1/2004
Notes. L: 6-month yen LIBOR, CPS: Convertible Preferred Shares, SDP: Perpetual Subordinated Debt, SLP: Perpetual Subordinated Loan, SDn: n-year Subordinated Debt. S&P Rating is for the long-term debt. We thank Kaoru Hosono for sharing the rating data.

Table 5: Capital in the Japanese Banking System (¥ Trillion)
Date
Official Core capital
Deferred Tax Assets
Estimated Under-reserving
Modified Capital
Capital held by the
government
Bank Assets
Capital Gap
A B C D=A-B-C E F G=0.03*F-DMar-96 27.9 0.0 NA 27.9 0.0 846.5 -2.5 Mar-97 28.5 0.0 15.0 13.5 0.0 856.0 12.2 Mar-98 24.3 0.0 4.9 19.4 0.3 848.0 6.0 Mar-99 33.7 8.4 4.0 21.3 6.3 759.7 1.5 Mar-00 35.6 8.2 5.8 21.6 6.9 737.2 0.5 Mar-01 37.6 7.1 7.5 23.0 7.1 804.3 1.1 Mar-02 30.2 10.6 6.8 12.8 7.2 756.1 9.9 Mar-03 24.8 10.6 5.4 8.8 7.3 746.3 13.6 Mar-04 29.0 7.2 5.7 16.1 8.9 746.7 6.3 Mar-05 31.4 5.7 6.9 18.8 8.1 745.9 3.6 Mar-06 37.3 2.3 8.3 26.7 5.2 766.9 -3.7 Mar-07 40.0 1.3 9.4 29.4 3.5 761.1 -6.5 Mar-08 34.8 3.6 10.2 21.0 3.1 780.7 2.4 Source:: Assets and core capital are from the Bank of Japan for all domestically licensed banks. Deferred tax and under-reserving estimates are from Fukao (2008) based on "Analysis of Bank Financial Statements," various issues and securities reports for individual banks. Note: Core capital, sometimes referred to as Tier I capital, includes equity capital and capital reserves. Fukao also estimates that prior to 2001 there were substantial unrealized portfolio gains that could have been available as capital. The after tax amounts he reports from 1996 to 2000 are 12.8, 6.7, 3.1, 2.6 and 6.1 trillion yen respectively.

Table 6: Capital Evolution for Japanese Banks 2003-2007
(¥Trillion and percent)
March-07 March-03 Change Percent contribution
to change
Official Capital 40.0 24.8 15.2 100.00%
Common stock 9.3 10.2 -0.9 -6.13%
Capital surplus 8.7 8.6 0.1 0.39%
Retained earnings 13.4 4.4 9.0 59.07%
Net unrealized gains on stocks and others 8.2 0.1 8.1 53.25%
Revaluation reserve for land 1.0 1.5 -0.6 -3.70%
Net deferred gains on hedging instruments -0.3 0 -0.3 -2.07%
Note: Some small components have been omitted and because of this and rounding columns may not sum to totals.

Table 7: Profit Decomposition for Japanese Banks 2004-2007
(¥ Trillion, except Nikkei and GDP growth)
Cumulative
(3/04-7/03)March-07 March-06 March-05 March-04 March-03
Difference
(3/07-3/04)
Net income 8.1 3.4 4.2 1.3 -0.8 4.2
Operating profits 11.5 4.3 4.8 1.9 0.5
Extraordinary profits - Extraordinary losses 2.8 0.4 1.2 0.7 0.5
Operating income 19.2 18.0 16.9 17.6 1.6
Operating expenses 14.9 13.3 15.0 17.0 -2.2
Unrealized capital gains 8.2 6.8 3.7 3.1
Nikkei 225 17,287 17,059 11,688 11,715 7,973
GDP growth (percent change from one year earlier) 1.7 2.5 2.4 2.0 2.1

Table 8: Selected Data on Major Institutions Participating in the TARP
($Billion, and percent) Data as of September 2008 (except Morgan Stanley and Goldman Sachs as August)
Exposure to
Name Total AssetsTotal
CommitmentsLendingReal
Estate Credit Card
Other Consumer
Equity/ Assets
Max Dividend Payout
JPMORGAN CHASE 2,251.5 1,223.6 57.8% 19.2% 25.3% 1.8% 6.5% 5.67
BANK OF AMERICA 1,836.5 1,423.1 73.3% 29.4% 28.8% 3.0% 8.8% 5.84
MERRILL LYNCH 875.8 123.7 20.0% 8.8% 0.0% 0.5% 4.4% 2.22
STATE STREET CORP 286.7 50.9 20.3% 7.4% 1.1% 2.7% 4.6% 0.41
CITIGROUP 2,050.1 1,560.0 65.0% 12.4% 32.9% 4.3% 6.1% 3.49
BANK OF NY MELLON 267.6 45.5 33.4% 9.9% 0.2% 0.4% 10.3% 1.10
WELLS FARGO (includes Wachovia) 1,382.9 476.9 75.5% 45.7% 6.2% 5.2% 7.0% 4.52
MORGAN STANLEY 987.4 162.0 15.8% 21.9% 0.0% 0.0% 3.6% 1.20
GOLDMAN SACHS 1,081.8 78.5 9.3% 8.3% 0.0% 0.0% 4.2% 0.55
TOTAL 11,020.3 5,144.3 54.5% 21.1% 19.3% 2.6% 6.3% 25.0
Note: Combined Merrill Lynch and Bank of America 2,712.2 1,546.8 60.8% 24.5% 22.0% 2.4% 7.4% 8.1

Figure 1: Land Prices in Japan and the U.S.

Figure 2: Japan Premium: 3-month Euro-dollar TIBOR minus 3-month Euro-dollar LIBOR

Figure 3: Difference Between the Daily Maximum and Minimum Overnight Call Rate

Figure 4: Survey Data on Lending Attitude of Japanese Banks
(Difference Between the Percent of Respondents Reporting Looser and Reporting Tighter)

Figure 5: Changes in Non Performing Loans
(¥ Trillion)