Embed Size (px)
Citation preview

This is a conference draft; Rev. May 2 +5+12, 2005 3PM CST mdc+ 4pm jf Jschel+Sue+fn42 +5/6+fn12+marefs:tsu be-math
Will the Euro Eventually Surpass the Dollar as Leading International Reserve Currency?
MENZIE CHINN, University of Wisconsin and NBER
JEFFREY FRANKEL, Harvard University and NBER
For NBER conference on
G7 Current Account Imbalances: Sustainability and Adjustment
Newport, RI, June 1-2, 2005 Richard Clarida, Organizer
Abstract
Might the dollar eventually follow the precedent of the pound and cede its status as leading international reserve currency? Unlike ten years ago, there now exists a credible competitor: the euro. This paper econometrically estimates determinants of the shares of major currencies in the reserve holdings of the world’s central banks. Significant factors include: size of the home country, inflation rate (or lagged depreciation trend), exchange rate variability, and size of the relevant home financial center (as measured by the turnover in its foreign exchange market). We have not found that net international debt position is an important determinant. Network externality theories would predict a tipping phenomenon. Indeed we find that the relationship between currency shares and their determinants is nonlinear (which we try to capture with a logistic function, or else with a dummy “leader” variable for the largest country). But changes are felt only with a long lag (we estimate a weight on the preceding year’s currency share around .9). The advent of the euro interrupts the continuity of the historical data set. So we estimate parameters on pre-1999 data, and then use them to forecast the EMU era. The equation correctly predicts a (small) narrowing in the gap between the dollar and euro over the period 1999-2004. Whether the euro might in the future rival or surpass the dollar as the world’s leading international reserve currency appears to depend on two things: (1) do the United Kingdom and enough other EU members join euroland so that it becomes larger than the US economy, and (2) does US macroeconomic policy eventually undermine confidence in the value of the dollar, in the form of inflation and depreciation. What we learn about functional form and parameter values helps us forecast, contingent on these two developments, how quickly the euro might rise to challenge the dollar. Under two important scenarios – the remaining EU members, including the UK, join EMU by 2020 or else the recent depreciation trend of the dollar persists into the future – the euro may surpass the dollar as leading international reserve currency by 2022. The authors would like to thank Jaewoo Lee for helpful comments.

2
Will the Euro Eventually Surpass the Dollar as Leading International Reserve Currency?
MENZIE CHINN, University of Wisconsin and NBER JEFFREY FRANKEL, Harvard University and NBER
Might the dollar lose its status as unrivaled international reserve currency? Could it be "going the way of sterling, the guilder, the ducat and the bezant." 1 Some authors argued as much ten years ago.2 The international use of the yen and mark had risen rapidly in the 1970s and 1980s, reducing the share of the dollar. (See Table A or Figure 7.) Some in the early 1990s suggested that the yen or mark might eventually overtake the dollar as the lead international currency.
By the turn of the millennium, that idea had come to sound far-fetched. In the meantime, both Japan and Germany had undergone a decade of remarkably low economic growth, the yen had declined, and the mark had disappeared altogether. Fears that the international currency status of the dollar was under challenge were premature, as should have been obvious at the time. Indeed, the international role of the dollar, at least as measured by its share of central banks international reserves, had stopped declining in 1990 and had begun to reverse in the early 1990s. (Again, refer to Table A or the graph.) Meanwhile, dollarization was increasing in Latin America and elsewhere. These developments were overshadowed by exchange rate movements: the continuation of the dollar’s post-1985 trend of depreciation, which lasted until 1995. Perhaps people have trouble distinguishing the question whether a currency like the dollar is declining in international reserve currency status from the question whether its foreign exchange value is falling. It seems that the question of whether the dollar might lose its privileged status as lead international currency comes up each time the dollar experiences a few years of depreciation (late 1970s, early 1990s). The dollar underwent a new depreciation in 2002-04. On the basis of this fact alone, one could have predicted that international economists might be once again called upon to try to answer questions regarding the international currency rankings. Indeed, in 2005 the financial press has been full of stories of central banks diversifying out of dollars.3
1 Kindleberger (1995, p.6) 2 Others who “cried wolf,” besides Kindleberger, include Kunz (1995). The February 25, 1995, issue of The Economist included an article and leader arguing that "the dollar's dominance is waning," at the expense of the DM in particular. Or Ramon Moreno, “Will the Yen Replace the Dollar?,” Federal Reserve Bank of San Francisco Economic Letter, no. 96-30, Oct. 18, 1996. 3 E.g., Economist 12/04/04, 2/26/05; FT 1/24/05, 3/8/05, 3/11/05, 3/19/05; NYT 3/11/05; and many others.

3
This time may be different than the earlier scares in the late 1970s and early 1990s. The difference is that the euro now exists as a plausible rival.4 Notwithstanding the bumps in the road of European monetary integration and the doubts of many American economists, EMU became a reality in 1999, and the euro appeared in physical form four years later. The new currency passed the most fundamental tests: the transition was relatively smooth, 12 countries today use the euro (and only the euro), and the new currency has entered into international use as well.
In the first few years of its life, the euro did not receive much respect. This was largely related to its substantial weakness against the dollar. Certainly anyone who had predicted that on January 1, 1999, there would be a worldwide shift out of dollar reserves into the new alternative, and that the increased demand for euros might cause a large appreciation, was initially disappointed.5 But subsequently this depreciation was fully reversed, and then some, in the strong appreciation of 2002-04. Thus there now exists a potential serious rival to the dollar, where ten years ago there was none. Indeed, as the rise of the dollar/euro exchange rate reached its third year in late 2004, the newspapers began to report that central banks were on the verge of large-scale diversification out of dollars.6 This paper will seek to ascertain the determinants of international reserve currency status, and to make some predictions as to whether the euro might under some conditions eventually overtake the dollar, and if so when.
4 One of the present authors in the mid-1990s took what felt at the time like a minority position regarding the prospects for the dollar (e.g., in Frankel (1995).): “It is unlikely that some other currency will supplant the dollar as the world’s premier currency...There is no plausible alternative for the number one position” (Eichengreen and Frankel (1996, p.363). But those papers also acknowledged “the possibility of a single currency coming into use throughout Europe, which would indeed pose a challenge to the supremacy of the dollar if it was to happen...” (p. 366). “And as the euro becomes more important as a vehicle currency, it is likely to gain use as an intervention currency and to become an increasingly popular form in which other counties hold their reserves. Ultimately, the creation of the euro would mean a new and increasingly powerful rival for the dollar as the international monetary system’s leading reserve currency.” (p.372). 5 “There will probably be a portfolio diversification of $500 billion to $1 trillion into euros. Most of this shift will come out of the dollar. This in turn will have a significant impact on exchange rates during a long transition period. The euro will move higher than will be comfortable for many Europeans…The euro will probably be strong from its inception.” -- Bergsten (1997, p. 84-85). Portes and Rey (1998), also writing at a time of dollar strength, suggested that American policymakers had been overly pessimistic about the euro’s prospects. These authors were exceptional in their counter-cyclical faith in the euro. 6 As was predictable, from the three years of depreciation: “Sometime soon, newspaper stories will begin reporting that central banks in Asia and elsewhere are diversifying out of dollars into euros, and that the dollar is in danger of eventually losing its status as premier international currency.” -- Frankel (2004).

4
Table A Share of National Currencies in Total Identified Official Holdings of Foreign Exchange, End of Year (in percent) 1965 1973 1977 1982 1987 1992 1997 2003 All countries U.S. dollar 56.1 64.5 79.2 57.9 53.9 48.9 59.1 63.8 Japanese yen 0.0 0.1 2.2 4.1 6.8 7.4 5.1 4.8 Pound sterling 20.0 4.2 1.6 1.8 1.9 2.6 3.3 4.4 Swiss franc 0.0 1.1 1.9 2.3 1.7 0.8 0.5 0.4 Euro 0.0 0.0 0.0 -- -- -- -- 19.7 Deutsche mark 0.1 5.5 9.3 11.6 13.8 14 13.7 -- French franc 0.9 0.7 1.1 1 0.9 2.6 1.5 -- Netherlands guilder 0.0 0.5 0.7 1 1.2 0.7 0.5 -- ECUs 0.0 0.0 0.0 13.8 13.6 9.7 5 -- Unspecified currencies 22.9 23.6 4.1 6.5 6.4 13.3 11.3 6.8
Notes: Shares of total currency holdings by central banks. Source: IMF data--updated version of statistics contained in the IMF Annual Report. 1997 and 2002 figures from 2004 Annual Report. 1. International Currency Rankings First some definitions. An international currency is one that is used outside its home country. Reserve currency status is the main subject of this paper, but it is just one of a number of possible measures of international use. The others can be neatly summarized by means of a simple 2x3 table originally introduced by Peter Kenen. (See Table B.) The classic three functions of money domestically -- store of value, medium of exchange and unit of account – can be transferred to the level of international money. Under each function, there are important examples of how government authorities and private actors sometimes choose to use a major international currency that is not their own. The subject of this paper appears in the first cell, the decision of central banks to hold their reserves in the form of particular currencies. But other possible criteria of an international currency also appear in the table: currency substitution (e.g., the circulation of dollar currency in Latin America and elsewhere), denominating or invoicing foreign trade, denominating or invoicing international financial flows, pegs for smaller countries' currencies, and foreign exchange trading. Table B: Roles of an International Currency Function of money: Governments Private actors
Store of value International reserves Currency substitution
(private dollarization) Medium of exchange Vehicle currency for foreign
exchange intervention Invoicing trade and financial transactions
9 e.g., Dooley, Folkerts-Landau and Garber (2003); Goldstein (2004).

5
Unit of account Anchor for pegging local currency
Denominating trade and financial transactions
Should we care about international currency rankings? Is this question important? International currency status might seem to have fewer direct implications for the real economy than does the currency’s exchange rate. But it is important nevertheless. To begin with, the exchange rate question and the international currency question have always been causally inter-related [notwithstanding some periods such as the early 1990s when they have moved in opposite directions]. But the topic has become newly urgent in light of the question whether the US current account deficit is sustainable. How long can it continue? The historical experiences of other countries with current account thresholds and reversals are not particularly relevant, in that the argument for sanguinity relies on the special role of the dollar in the world financial system. This paper was written for a conference on the sustainability of the G-7 current account imbalances, following two years when the major source of financing of the deficit was purchases of dollar assets by foreign central banks, especially in Asia. Unless foreign private investors resume willingness to accumulate ever-greater quantities of US assets, the sustainability of the US current account deficit depends on the willingness of foreign central banks to do so. That, in turn, depends on two factors: (1) the desire of foreign central banks to continue intervening in foreign exchange markets to try to dampen or prevent the appreciation of their currencies against the dollar, and (2) the willingness of central banks to continue to hold the lion’s share of their reserves in the form of dollars as opposed to some rival currency, i.e., the euro. While the former question received a fair amount of attention in 2003-04,9 the latter question did not until 2005.10
ADVANTAGES OF HAVING AN INTERNATIONAL CURRENCY One can think of four advantages to a country of having its currency play a large role in the world. (1) Convenience for the country's residents. It is certainly more convenient for a country's exporters, importers, borrowers and lenders to be able to deal in its own currency than foreign currencies. The global use of the dollar, as with the global use of the English language, is a natural advantage that American businessmen tend to take for granted. (2) More business for the country's banks and other financial institutions. There need be no firm connection between the currency in which banking is conducted and the nationality of the banks (nor between the nationalities of the savers and borrowers and the nationality of the intermediating bank). Nevertheless, it stands to reason that U.S. banks have a comparative advantage at dealing in dollars, British banks at dealing in pounds, etc. (3) Seignorage. This is perhaps the most important advantage of having other countries hold one's currency. They must give up real goods and services, or ownership of the real capital stock, in order to add to the currency balances that they use. Seignorage is not necessarily large if defined narrowly, as the low-interest loan accruing to the US when
10 Perhaps the question whether the currency preferences of central banks will continue to assign a special role to the dollar is not as important as the analogous question for private investors. But this is still a matter of the dollar’s place as premier international currency, of which the reserve holdings is the most easily quanitified aspect.

6
foreign central banks hold their reserves as dollars. But it is much more important if defined broadly as America’s “exorbitant privilege” of being able to borrow abroad large amounts in its own currency, especially while simultaneously earning much higher returns on FDI and other investments in other countries. This was the basis of European resentment against the U.S. basic balance deficit in the 1960s, and against the dollar standard to the extent that the European need to acquire dollars was the fundamental origin of the deficit, as will be seen below. The willingness of Asians and others to continue financing the US current account deficit in the future is certainly related to the dollar’s continued role as premier international reserve currency. We are not necessarily talking about seignorage narrowly defined (foreign holdings of US currency, which doesn’t pay interest). More important is the US ability to run up huge debts denominated in its own currency at low interest rates. The US has consistently earned more on it investments overseas than it has had to pay on its debts, a differential of about 1.2 per cent per annum (e.g., Cline, p. 45), Possibly this American role of the world's banker (taking short-term liquid deposits, and lending long term in riskier higher-return assets) would survive the loss of the dollar as leading international currency. But it seems most likely that the loss of one would lead to the loss of the other. (4) Political power and prestige. Britain's gradual loss of key currency status was simultaneous with its gradual loss of political and military pre-eminence. As with most of the other benefits and conditions mentioned above, causality here flows in both directions. We shall come back to this issue at the end. DISADVANTAGES OF HAVING AN INTERNATIONAL CURRENCY One can think of two disadvantages from the viewpoint of a key-currency country. They explain why Japan and Germany were in the past reluctant to have their currencies held and used widely, and why China worries about the implications of beginning to internationalize its currency. (1) Larger fluctuations in demand for the currency. It is not automatically clear that having one's currency held by a wide variety of people around the world will result in greater variability of demand. Such instability is probably more likely to follow from an increase in the degree of capital mobility, than from key currency status per se. Nevertheless, the two are related. Central banks are particularly concerned that internationalization will make it more difficult to control the money stock. This problem need not arise if they do not intervene in the foreign exchange market. But the central bank may view letting fluctuations in demand for the currency be reflected in the exchange rate as being just as undesirable as letting them be reflected in the money supply. (2) An increase in the average demand for the currency. This is the other side of seignorage. In the 1960s and 1970s, the Japanese and German governments were particularly worried about the possibility that if assets were made available to foreign residents, an inflow of capital would cause the currency to appreciate and render exporters uncompetitive on world markets. (Again, this is also China’s problem today.) While Japan became much more confident about its ability to export in the 1980s, talk of further substantial appreciation is not always welcome.

7
2. The Approach of the Paper The paper seeks econometrically to ascertain the determinants of international reserve currency shares over the period 1973-98, before the advent of the euro. The exercise is largely parameter estimation and calibration, without a lot of hypothesis-testing. In other words we intentionally impose a lot of apriori information. The literature on what determines reserve currency status is fairly well-established, if often lacking in quantification. Three key points. (1) Determinants. There is a list of determining factors, which appears in subsequent section 5 below. The most important is the size of the country or region in which the currency is indigenously used, but there are others as well. (2) Network externalities or economies of scale and scope are important. Each country is more likely to use whatever currency is used by others. Thus international currency use is not linear in the determinants. Rather, there may be a tipping phenomenon11: if one currency were to draw even and surpass another, the derivative of reserve currency use with respect to its determining variables would be higher in that range than in the vicinity of zero or in the range when the leading currency is unchallenged. In that sense the switch happens rapidly. (3) In the chronological sense, however, the switch happens slowly. Whatever currency has been used in the past will continue to be used in the future. Thus inertia is great. We thus have three tasks: (1) ascertain the most important determinants and their relative weights, (2) confirm that the function is non-linear and settle on an appropriate functional form, and (3) estimate the extent of inertia, which we will represent by means of a lagged endogenous variable. Our data come from reserve currency holdings of central banks over the period 1973-1998. One cannot be confident that any given data set will contain enough information to answer the questions of interest. Unfortunately the available data do not extend anywhere near far back enough in history to observe the fall of the pound from its number one position of a century ago. But the beginning of our data set does capture the mark passing the pound for the number two slot, which may be a useful data point for addressing the tipping phenomenon, item (2). We hope that there is enough variation among the other currencies and across the other years to obtain useful estimates of parameters of interest under categories (1) and (3). The disappearance of the mark, franc and guilder in 1999, and their replacement by the euro, constitute an irreparable break in the data series. But we hope to turn this obstacle to advantage. We obtain a check on the meaningfulness of the equation that was estimated on pre-1999 data by seeing whether it successfully predicts the direction of movement over the period 1999-2003. Then we plan to use the equation to forecast the path of the currency shares of the dollar, euro, and other international currencies into the future, as a function of several different possible scenarios regarding, for example, whether the United Kingdom eventually joins EMU. While we don’t expect to predict that the euro could overtake the
11 Tipping arises in many contexts. Schelling (1978),) and Gladwell (2000).

8
dollar anytime soon, we enter this exercise with a completely open mind regarding whether the euro might overtake the dollar in the longer term. 3. Brief History There is of course an important historical precedent.12 The pound sterling was the premier international currency of the gold standard period. Historians estimate, for example that 60 to 90 per cent of the world’s trade was invoiced in sterling in the 19th century.13 In 1899 the share of pound in known foreign exchange holdings of official institutions was more than twice the total of the next nearest competitors, the franc and the mark, and much greater than the dollar.14
Figure 1 - US and UK exports 1900-1957
Value of Exports (in millions of dollars)
0.E+00
5.E+03
1.E+04
2.E+04
2.E+04
3.E+04
1900
1903
1906
1909
1912
1915
1918
1921
1924
1927
1930
1933
1936
1939
1947
1950
1953
1956
USA UK
Data Sources UK Export Data: Department of Trade and Industry, UK; UK exchange rate (1946-1970): Global Financial Data; US Export Data: Historical Statistics of the United States, Colonial Times To 1970; Published by U.S. Census Bureau The US economy in the late 19th century surpassed the British economy in size (187215). US exports did not pull ahead of UK exports until World War I, and did not do so on a permanent and substantial basis until World War II. (See Figure 1.) The development
12 Alogoskoufis and Portes (1992) noted early on the precedent for the possible dethroning of the dollar. 13 Lawrence Broz; Hale (1999). 14 $105.1 million in pounds, $27.2m in francs, $24.2m in marks, and $9.4 in other currencies. In 1913, the ranking was the same: $425.4 million in pounds, $275.1m in francs, $136.9m in marks, and $55.3 in other currencies. Lindert (1969, p.16-22) 15 in real terms --1990 International Gheary-Kamis dollars.

9
of the financial system lagged behind; one reflection is that the United States did not establish a central bank until 1913. During the years following 1914, the US passed from net debtor to net creditor while the UK moved in the opposite direction. This had much to do with British borrowing from the United States so as to fight World War I, and more of the same to fight World War II. There was a lag before the dollar surpassed the pound as the leading international currency, which it had done by 1944. WHEN THE DOLLAR OVERTOOK THE POUND
The dollar originally emerged as a major international currency at the end of World War I. The United States had for the first time become a net international creditor during the war, and the dollar was the only currency to remain convertible into gold at a fixed price into the 1920s.16 Its use in international trade and finance widened increasingly. The pound retained its dominant position as key currency in the interwar period, in large part due to the inertia in such arrangements that was noted above. As late as 1940, the level of foreign-owned liquid sterling assets was still double the level of foreign-owned liquid dollar assets. By 1945, however, the position of the dollar and pound, as measured by this statistic, had precisely reversed.17 World War II had completed the dollar's rise to ascendancy. The decline in the pound was clearly part of a larger pattern whereby the United Kingdom lost its economic pre-eminence, colonies, military power, and other trappings of international hegemony. As some of us wonder whether the United States might now have embarked on a path of “imperial over-reach,” following the British Empire down a road of widening federal budget deficits and overly ambitious military adventures in the Muslim world, the fate of the pound is perhaps a useful caution. The Suez crisis of 1956 is frequently recalled as the occasion on which Britain was forced under US pressure to abandon its remaining imperial designs; the important role played by a simultaneous run on the pound is often forgotten.18 Paul Kennedy (1989)’s suggestion of the imperial overreach hypothesis and its application to US hegemony may have been essentially correct but ten years premature, much like those in the early 1990s who warned prematurely over the dollar’s imminent demise. THE DOLLAR IN THE BRETTON WOODS ERA Though gold was the official international reserve asset of the monetary system that was established in 1944 at Bretton Woods, New Hampshire, the dollar was the true reserve asset of the postwar system. During the initial period of "dollar shortage," the European and other currencies were not convertible into gold, and so were not prized as the dollar was (Kindleberger, 1950). The Europeans and others measured their economic recovery from the wartime destruction by their progressively greater ability to earn dollars through improving trade balances. By 1958 the balance of payments of the major European countries had improved sufficiently that they were able to restore convertibility (McKinnon, 1979, p.5). No sooner had the system of fixed-rate convertible currencies come into operation, than it was threatened with gradual rot. In 1958, the United States began to run large
16 E.g., Nurkse (1944), Bergsten ( 1975, p.53), and Eichengreen (1992). 17 Aliber (1966, p.19-20). 18 E.g., Boughton (2001) and “From Suez to Baghdad,” Charlemagne, The Economist, March 22, 2003, p. 47.

10
balance of payments deficits. Although these deficits were nothing other than the counterpart of the European surpluses, they presaged trouble, as Robert Triffin (1960) pointed out. The world's demand for international reserves increases gradually in proportion to international income and trade. As the supply of gold was more or less fixed, the dollar would be increasingly used as a supplementary reserve asset by other countries' central banks under the Bretton Woods regime. But there was only one way that other countries could earn dollars: by running balance of payments surpluses with the United States. This led directly to what came to be known as the Triffin dilemma. Either the United States would take measures to limit its balance of payments deficit, or it would allow other countries to continue to accumulate claims against it. In the former case, the world would be deprived of its necessary reserves. In the latter case, the ratio of outstanding dollar liabilities to gold held in Fort Knox would rise without limit, provoking at some point a crisis in which private speculators (and Charles de Gaulle) would lose confidence and present the American authorities with more claims for payment than could be met.19 In the 1960s, the U.S. government adopted the stop-gap measure of putting controls on capital outflows. Meanwhile economists debated three possible general solutions to the dilemma: raising the price of gold so as to increase the effective supply of reserves, creating a sort of "paper gold" as a new reserve asset, or moving to floating exchange rates so as to reduce countries' demand for international reserves.20 But the day of reckoning was in any case accelerated substantially by the expansionary U.S. fiscal and monetary policies of the Viet Nam War era, and the resulting widening of the balance of payments deficit. In August 1971 the United States unilaterally devalued the dollar against gold, thereby ending the Bretton Woods era. The attempt to patch up the fixed exchange rate system in the Smithsonian Agreement lasted only a short time. By March 1973, all the major industrialized countries had given up the effort to keep their currencies pegged to the dollar. THE DOLLAR IN THE FLOATING-RATE ERA One might have expected in the post-1973 period a sharp downward shift in the demand for reserves by the major industrialized countries that moved to floating rates. There is indeed some evidence of a downward shift. But the demand for reserves nonetheless remained surprisingly high.21 Even though the central banks are willing to tolerate a far higher degree of variability in their exchange rates than before 1973, it takes a much greater amount of intervention to achieve any given effect than in the period when international financial markets were less developed. This may explain the still-high demand to hold reserves. The fraction of reserves held specifically in the form of dollars began to decline in the late 1970s. While it is important not to confuse a change in the use of a currency with a change in its exchange value against foreign currencies, the downward trend of the dollar 19 Kenen (1960) argued that central banks would be reluctant to hold reserves in the form of a currency like the dollar that was expected to lose value. 20 McKinnon (1969) predicted, accurately as it turned out, that a move to floating rates, while it would reduce the official demand from central banks for the dollar as a key currency, would not reduce the private demand for an international currency. He also predicted that the dollar would remain the currency best-suited to such a role. 21 E.g., Heller and Khan (1978). From similar evidence, Frenkel (1980, p.183) drew the observation that "economic behavior seems to be more stable than legal arrangements."

11
was in fact partly a reflection of a decline in its value. The depreciation of the dollar was concentrated particularly in three major episodes, one per decade: 1977-78, 1985-86, and 1993-95. (2002-04 looks to be the latest in the series.) In each episode the dollar exchange rate became an issue of conflict between the United States and its trading partners, Europe in particular. American Treasury Secretaries were periodically faulted for a policy of "benign neglect" of the dollar's value. Benign neglect was also the policy in the period of dollar appreciation from 1980 to February 1985. A strong dollar has advantages for other countries -- improved prospects for their firms that export to the United States or that compete with imports -- as well as disadvantages -- an adverse shift in their terms of trade, higher prices for imported inputs like oil that (in the short run) have their prices set in dollars, upward pressure on wages. A weak dollar has the corresponding disadvantages and advantages. It is evident that the point of view in Europe that disparages both upswings and downswings must have as its objective a stable dollar. Beyond the usual costs that are claimed from a volatile exchange rate, variability in the dollar as the world's key currency was also blamed for: a ratcheting up of the level of protectionist barriers (as the United States erects import barriers when the dollar is strong, and trading partners do the same when it is weak), variability in the world price level (as countries intervene to stabilize the exchange rate and suffer consequent movements in their money supplies), and an inflationary bias (the result of the absence of a world nominal anchor to take the place of gold, the pound or the dollar). The United States was accused, especially in the 1970s, of having neglected its social responsibility to supply the world with the "public good" of a stable international money. Such complaints pointed up the conflict inherent in the dual role of the dollar as America's currency and the world's currency. The charge also, in part, provided a rationale for the birth of the ECU in 1979 as a rival currency, which eventually in 1999 became the euro. 4. International Use of the Euro So Far
There are a variety of indicators of international currency use. The sort that is available on the timeliest basis is the currency of denomination in cross-border financial transactions. The euro soon after its debut came into wide use to denominate bonds. Within Europe there was a tremendous increase in issues of corporate bonds, denominated in euros, together with a rapid integration of money markets, government bond markets, equity markets, and banking. While the frenetic activity seemed to be related to the debut of the euro, it does not meet the definition of “international currency use,” because it is taking place inside the currency’s home region.22
Outside Europe, the euro has been a success as well.23 [Detken and Hartmann (2000) studied the data from the euro’s first year in operation, doing a careful job of netting out intra-euro-area holdings in order to be able to trace back a measure of euro-
22 Gaspar and Hartmann (2005), and Rey (2005). 23 Even based on just 1999 data, “…the euro has become the second most important currency in virtually all segments of international capital markets right from the start of stage 3” (Detkens and Hartmann, 2000). Euro issues continued as strong ininto the first quarter of 2000 as in 1999, andnew decade: “…regular emerging market issuers now seem to regard the euro market as a genuine alternative to dollar markets” (Bishop, 2000).

12
precursor currencies for five years before 1999 that is comparable with post-1999 numbers. They found more of an increase in the supply of euro-denominated assets outside of Europe than an increase in demand.24 ] The stock of international debt denominated in euros increased from about 20 percent on the eve of EMU, to 30 percent in 2003 (Rey, 2005, p. 114).
The last column of Table A reports the euro’s share in central banks’ foreign
exchange reserves – 19.7% in 2003.25 Early estimates for 2002 equaled approximately the sum of the shares of the mark, French franc and guilder just before EMU, but is less than what one would get by adding in the share of ECUs. This is to be expected: before 1999, the twelve central banks had to hold foreign exchange reserves, including of each others’ currencies; these disappeared at the stroke of a pen on January 1, 1999. One cannot simply compare pre- and post-1999 figures to learn if the advent of the euro has hurt the attractiveness of the dollar as international reserve currency.
International use of the euro has continued to grow during the first five years of
its life.27 About half of euroland trade with non-euro area residents is invoiced in the new currency.28 The euro’s share in international debt securities has risen to above 30% (versus below 20% for the pre-1999 legacy currencies). The comprehensive triennial survey of foreign exchange trading volume put together by the BIS showed the dollar still easily in first place in 2001, at 85% of all spot trades (out of 200%), followed by the euro at 43% and the yen at 26%.29 The euro’s share of foreign exchange transactions in 2003 reached one quarter (out of 100%) in Continuous Linked Settlement data. The most recent triennial BIS survey, covering April 2004, showed the dollar still at 85% of all
24 To be sure, unless these excess-supplied euros are piling up as dealer inventories, then arithmetically they must be matched by an increase in demand from European residents. A depreciation of the euro does not automatically follow. It depends which came first, the increase in supply of euro-denominated assets from non-residents or the increase in demand from residents. Nevertheless the finding is suggestive. At a minimum, it illustrates well the point that an increase in international use of a currency need not mean an increase in net demand for that currency or an appreciation. 25 There have been substantial revisions in the estimated euro shares. For instance, in November 2003 the IMF revised the 2002 estimate from 14.6% to 18.7 %. (IMF, 2003; ECB, 2003.); in the 2004 Annual Report, the 2002 share is 19.3. The results reported here use the revised data, spliced together with the old data before 1980 [whereas results reported in the July 2004 pre-conference used the pre-revised data.]. 27 The most recent annual report from the European Central Bank (2003) ,), from which these statistics come, cites data through mid-2003. 28 Hartmann (1998) predicted that the share of the euro in trade invoicing would gradually increase, though starting out a distant second place to the dollar globally. 29 To compare foreign exchange trading volume in the euro with volume in its predecessor currencies, one must allow for the disappearance of intra-euro12 trading, as in the Detken and Hartmann’s (2002, p. 558-559) “simple arithmetic of EMU.” They find that the observed decline is almost fully accounted for in this way. 31 Bank for International Settlements (2005).

13
spot trades and euro at 44%. Including also forwards and swaps, the dollar was involved in 89% of all transactions, and the euro in 37%.31 In short, the euro is the number two international currency, ahead of the yen, and has rapidly gained acceptance, but is still far behind the dollar, which appears comfortably in the number one slot. We now turn to a consideration of the determinants of international currency status. 5. Factors that Suit a Currency for International Currency Status The literature on international currencies has identified a number of determining variables. (1) Patterns of output and trade. The currency of a country that has a large share in international output, trade and finance has a big natural advantage. The U.S. economy is still the world's largest in terms of output and trade. By such measures, Japan should be number 2, ahead of Germany. Alarmist fears of the early 1990s, notwithstanding, it was never very likely that Japan, a country with half the population and far less land area or natural resources, would surpass the United States in sheer economic size. But the euro is now the home currency to 12 countries. Their combined economic weight is much greater than Germany alone, or Japan. It is not quite as large as the United States, as Table C shows. But it may be in the future. If the other three long-time EU members, United Kingdom, Sweden, and Denmark, were to join today, euroland would equal the United States in economic size, as Table C shows. If the 10 countries that acceded to the EU in May 2004 (most of them in Central Europe) were also to join EMU, the new monetary region would be larger than the US economy. If any of these countries do join, it will be at least some years into the future. Thus the question of relative size also depends on the growth rates of the US and European economies. As an alternative to GDP, we could also look at countries’ trading volume as another indication of their relative weights in the world economy. Table C: Size of US vs. Europe 2003 2004 US 11.0 trillion 11.5 trillion Euro-zone (12 countries)
8.8 tr. 9.0 tr.
EU pre-5/1/04 (15 countries)
11.3 tr. 11.5 tr.
EU post-5/1/4 (25 countries) 11.8 tr. 12.1 tr.

14
[For some measures of international currency use – how often a vehicle currency is used in the invoicing and financing of international trade -- other aspects of the pattern of trade may also be relevant. The fact that much of Japan's imports are oil and other raw materials and that much of its exports go to the Western Hemisphere, for example, helps explain why a disproportionately small share of trade is invoiced in yen as opposed to dollars. Raw materials still tend heavily to be priced in dollars. Whenever the dollar depreciates for more than a few years, OPEC starts discussing switching to another currency of denomination. It hasn’t happened yet. But it could, if the dollar’s primacy in other international roles were seriously challenged.] (2) The country's financial markets. To attain international currency status, capital and money markets in the home country must be not only open and free of controls, but also deep and well-developed. The large financial marketplaces of New York and London clearly benefit the dollar and pound relative to the euro and its predecessor the deutschemark, as Frankfurt is still less well-developed. Tokyo and Frankfurt financial markets have changed a lot over the last two decades. But they still lag far behind New York and London as a financial centers. Meanwhile, Singapore and Hong Kong have gained. It has also been argued that a strong central bank, and large financial sector to counterbalance the political influence of the trade sector, are important. The point is to get support from “Wall Street,” to be able to resist political pressure from “Main Street” in favor of depreciating the currency to help sell goods.32 It is surprisingly difficult to come up with a proxy for size, depth, or development that is available for all the financial centers. We have opted to use as our primary measure data on foreign exchange turnover in the respective financial centers: New York, London, Frankfurt, Tokyo, Zurich, etc. This measure differs from turnover of the currencies (dollar, pound, euro, etc.), a variable that would be much more simultaneous with the international currency status that we are trying to explain. It captures, for example, the pre-eminence of London, which continues despite the small role of the pound. This measure has the virtue of reflecting to some extent all kinds of international financial transactions (both long-term and short-term, banking and securities, bonds and equities). Moreover it is possible to patch together a data set covering the desired countries and years -- though but just barely, and with increasing difficulty as one goes back through the 1970s. We have also tried an alternative proxy for the size of financial centers – the size of the countries’ stock markets. (3) Confidence in the value of the currency. Even if a key currency were used only as a unit of account, a necessary qualification would be that its value not fluctuate erratically. As it is, a key currency is also used as a form in which to hold assets (firms hold working balances of the currencies in which they invoice, investors hold bonds issued internationally, and central banks hold currency reserves). Here confidence that the value of the currency will be stable, and particularly that it will not be inflated away in the future, is critical. The monetary authorities in Japan, Germany and Switzerland, in the 1970s established a better track record of low inflation than did the United States, which helped their bids for international currency status. As recently as the 1980s, the mean and variance of the inflation rate in the United States were both higher than in those three hard-currency 32 For example, Hale (1995) and Frieden (2000).

15
countries, though lower than in the United Kingdom, France, Italy, and many other countries.33 Given the good U.S. inflation performance in the 1990s, this is no longer such a concern as it was formerly. A more important negative for the dollar is the fact that the United States is now a large-scale debtor country.34 Even if the Federal Reserve never succumbs to the temptations or pressures to inflate away the U.S. debt, the continuing U.S. current account deficit is always a possible source of downward pressure on the dollar. Such fears work to make dollars unattractive. (4) Network externalities An international money, like domestic money, derives its value because others are using it. It is a classic instance of network externalities. In this sense, the intrinsic characteristics of a currency are of less importance than the path-dependent historical equilibrium. There is a strong inertial bias in favor of using whatever currency has been the international currency in the past. One can make an analogy with language. If one sat down to design an ideal language, it would not be English. (Presumably it would be Esperanto.) Nobody would claim that the English language is particularly well-suited to be the world's lingua franca by virtue of its intrinsic beauty, simplicity, or utility. It is neither as elegant and euphonious as French, for example, nor as simple and logical in spelling and grammar as Spanish or Italian. Yet it is certainly the language in which citizens of different countries most often converse and do business, and increasingly so. One chooses to use a lingua franca, as one chooses a currency, in the belief that it is the one that others are most likely to use. Krugman (1984) showed how there can be multiple equilibria in use of an international currency, developing some informal ideas of earlier authors such as Kindleberger (1981), McKinnon (1979), and Swoboda (1969). Matsuyama, Kiyotaki and Matsui (1993) went to the next level of abstraction analyzing this problem with the theory of random matching games. The implication is that small changes in the determinants will not produce corresponding changes in the reserve currency numbers, at least not in the short run. At a minimum, changes will show up only with a long lag. As noted, the pound remained an important international currency even after the United Kingdom lost its position as an economic superpower early in the century. In the present context, the inertial bias favors the continued central role of the dollar. Also, as already noted, economies of scale suggest that, even in the long run, measures of international currency use may not be linear in the determinants. There may be a tipping phenomenon when one currency passes another. Another aspect of the network externalities is economies of scope. An individual (exporter, importer, borrower, lender, or currency trader) is more likely to use a given currency in his or her transactions if everyone else is doing so. If a currency is widely used to invoice trade, it is more likely to be used to invoice financial transactions as well. If it is
33 E.g., Tavlas and Ozeki (1991). 34 The US statistics on both net international investment position and net investment income have shown “false alarms” in the past. The numbers have repeatedly been revised to postpone the date at which, first the stock position, and then the income balance, turn negative. But there is no doubt that the US has large since become the world’s largest net debtor.

16
more widely used in financial transactions, it is more likely to be a vehicle currency in foreign exchange trading. If it is used as a vehicle currency, it is more likely to used as a currency to which smaller countries peg. And so forth. In this paper we content ourselves with trying to predict reserve currency holdings. But this will depend on some of the other measures of international currency use.35 6. Estimation
The data are illustrated in scatter plots: the currency shares against GDP at market rates, or GDP in PPP terms, in Figures 1-2, respectively. (Subsequent plots show the share against the inflation differential, exchange rate volatility, turnover, and proportion of pegged exchange rates, in Figures 3-6, respectively). They suggest two preliminary propositions. First, it does not seem that the difference between GDP measured at market rates or in PPP terms is essential for our purposes. Second it is apparent from Figures 1 and 2 that the relationship between currency shares and GDP shares is nonlinear. The data points representing the non-dollar currencies seem to suggest a rather flat dependence on size; but the existence of the data points representing the dollar indicates that the curve must turn sharply upward somewhere in the middle. Functional Form
Indeed, the functional form cannot literally be linear, because the currency shares are bounded between 0 and 1, and not all the right hand side variables are similarly constrained. One common way of taking into account such a constraint is to use a logistic transformation of the shares variable.36 The standard logistic transformation is symmetric, and has a maximal slope at share equal 0.50. Figures 1a and 2a plot the logistic of the currency share against the size variables. The straight line now seems to fit the data much more comfortably, indicating that the logistic may be a good guess. Basic estimation results, 1973-1998
A simple linear relationship is useful as a starting point, even though it cannot literally be correct. Table 1 reports results of regressions of currency shares against the
35 In some of our regression tests we tried adding to our list of determinants a measure of the popularity of the major currencies for smaller currencies to peg to. An Asian country that is pegged to the dollar, for example, is likely to hold a larger share of its reserves in the form of the dollar. We recognize that the pegging decision may be endogenous, determined simultaneously with the reserve holding decision and the various other measures of international currency use. We did not find a significant positive effect. Perhaps this is just as well, in saves us the trouble of trying to deal with the endogeneity of the pegging decision. [One possibility would be to use an instrumental variable for pegging choices, such as past colonial status.] In what follows we emphasize regressions without the pegging-anchor variable included. 36 Logistic = log(share/(1-share)). 39 Seemingly unrelated regression (SUR) panel estimation yields qualitatively similar results. There is an obvious reason to expect a correlation of the error term across currencies: since the shares must sum to one, upward disturbances in one currency should be associated with negative disturbances on average across the others. (“Other currencies” and ecus are not included in the

17
variables we have discussed.39 In all instances a lagged endogenous variable is included, to account for partial adjustment, which seems to be an important factor empirically.
Column [1] reports the outcome of a simple regression specification. The results indicate that income share enters positively and significantly, while inflation (expressed as the differential vis-à-vis average industrial country inflation) enters negatively, as does exchange rate volatility. When forex turnover is included, in the specification of column [2], the inflation and volatility effects are significant and in the directions anticipated. Augmenting the specification to include an indicator variable for the leader country (columns [3] and [4]) yields a statistically significant and positive coefficient estimate; but since the US is the leader during the entire sample period, this variable reduces to a fixed effect for the US.
Next, the results in columns [5] and [6] report specifications where the inflation variable is replaced by a long depreciation trend, estimated as 20-year average rate of change of the value of the currency against the SDR. In neither case is this variable statistically significant, and indeed, very few variables appear significant in these cases.
One point of interest is that the coefficients on the lagged endogenous variable suggest a very slow adjustment rate. Only about 4% to 10% of the adjustment to the long run is estimated to occur in a single year. The half-life is on the order of 17 years for this slower rate of adjustment.
Now consider the logistic transformation, which reflects the inherent nonlinearity of the problem. Immediately it is clear that, judged by the number of statistically significant coefficients, this is a more successful functional form. Columns [1]-[7] in Table 2 are analogous to those in Table 1. Most of the qualitative results are unchanged. The adjustment rate is now somewhat more rapid, about 12% per year. Columns [5] and [6] report the logistic specification substituting a 20 year depreciation trend for the inflation differential. The estimates are not significant save for income and the lagged endogenous variable. A little investigation reveals that the results are particularly sensitive to the inclusion of the Japanese yen (which had a strong trend appreciation over the sample period, without ever attaining as big an international role as predicted by many). Excluding data for Japan yields the results in column [7], which indicates a significant role for long depreciation. Post sample test, 1999-2004
regressions, so the correlation is not perfect.) Since the results do not differ very much, we report the simple panel estimates.

18
We chose one specification to evaluate the reliability of the models out of sample. The post sample period is quite short, comprising only 5 years worth of data. Hence, we cannot undertake formal out-of-sample tests for parameter stability. Furthermore, given the disappearance of the mark, franc, and other European currencies, we cannot make a prediction as to the currency shares of the euro and its rivals for the date of its debut. Given these constraints, we adopt a limited test. We conduct an ex post static simulation of the data, to see if our parameter estimates can predict correctly the direction of movement of the currency shares looking forward from 1999. We use the coefficient estimates reported in column [2] of table [2], which has statistically significant and correctly signed coefficients in all cases save the forex turnover variable. The results are presented in Figures 9 and 10. They indicate that the models fit quite well. A good deal of work is being done by the lagged endogenous variable. But the important and reassuring point is that our equation correctly predicts the direction of movement after 1999 of the currency share: downward, for the dollar and yen, and upward for the euro and pound. We also checked the out-of-sample predictions produced from the specification in column [5], which used long-term trend depreciation rates as the rate of return variable, in place of inflation rates. The results for the currency shares are similar to those presented in these graphs. Sensitivity tests There is substantial latitude for deciding upon the best variables to include in the empirical specifications. We extended the investigation to include alternative variables. These results are reported in Appendix Table 1. (We are not calling these robustness checks, because we do not have the luxury of sufficient data to expect robust results, or even to dispense with a priori judgments in our basic specification.) First, we tried a different measure of economic size, trade, in place of GDP. The results of replacing the relative income variable with a relative exports variable are reported in column [1]. While the coefficient on exports exhibits approximately the same level of statistical significance, the other variables do not. GDP is a more standard criterion for size in the literature on international currencies, so we see no reason to prefer the alternative scaling variable. Another question pertains to network externalities or economies of scope. Does reserve currency use depend upon another instance of international currency status -- how many currencies are pegged to that key currency? Smaller countries are more likely to hold their reserves in a given major currency if they are pegged to that currency. We added a variable defined as the share of the world’s currencies pegged to a particular base currency, as a proportion of all pegged currencies.40 (At the same time, we omitted our forex turnover variable.) This new variable, capturing the “peg anchor” role, was not statistically 40 Eichengreen and Mathieson tried this peg anchor variable.

19
significant. Surprisingly it actually showed a negative sign, probably because the French franc ranks so high by this criterion, and yet is not an important reserve currency. We also wished to investigate the thesis that the use of a reserve currency could be negatively affected by a country’s net debtor position. We did not have good data for these countries’ net foreign asset position that was available for the entire sample. We used the cumulative current account balances reported by Lane and Milesi-Ferretti. These results indicate a statistically insignificant relationship between net foreign assets and reserve currency use. Again, the coefficient is of a surprisingly negative sign, probably because the dollar’s share continued strong in the 1990s even as the United States underwent its big swing from creditor to debtor. As mentioned, one of the key determinants is the liquidity of a candidate’s financial center, which we measured by turnover in the foreign exchange market. We investigated using alternative measures of financial market liquidity and depth. We considered three stock market measures: capitalization and total value traded, both of them defined as a share of GDP, and also stock market turnover. In no case did these variables enter with statistical significance. In two cases, value traded and turnover, they entered with the unexpected sign. We also considered a measure of the depth of countries’ bond markets, but found no support for its role as a determinant of a reserve currency’s use; data availability limited us to the 1990-98 period, an admittedly short sample. 7. Extrapolation to the future The goal of the project is to use the estimated parameters to forecast the shares of the dollar, euro, and other currencies in the coming decades. Under any plausible scenario, the dollar will remain far ahead of the euro and other potential challengers for many years. But we want to know if there are plausible scenarios that give a different answer for 20 or 30 years into the future and, if so, what are the variables that are most important to this outcome. First, two caveats – these are simulations incorporating fairly mechanical variations. There are no interactions between, say, exchange rate depreciation and exchange rate volatility. We do not even attempt to predict the future course of these variables. Secondly, the simulations are of course only as good as the parameters that we estimated from the historical data, which are neither precise nor entirely stable. Posited Scenarios If none of the explanatory variables were to change in the future from its current values, then the long run shares of the currencies could be estimated with no further inputs.41 This will almost certainly show the dollar retaining the lead even in the long run. We regard this scenario as quite possible, but not the only one.
41 As the reciprocal of one minus the speed of adjustment, times the value fitted from the rest of the variables and parameter estimates.

20
A high-euro scenario would have many European countries joining EMU by the end of this decade. Most eager to join are the ten countries that joined the EU in May 2004 (8 of which are in Central Europe). It is also possible that the three remaining long-standing EU members, Denmark, Sweden, and the United Kingdom might join. All these countries together would make it likely that euroland exceeds the United States in income and trade. In that case, it becomes a real possibility that the euro would gradually gain on the dollar, and eventually challenge it for the number one position. The key question is whether the United Kingdom joins, not just because it is the largest of them, but also because it would bring with it the London financial markets. As of mid-decade, it does not look very likely that Britain will join in the coming decade, and we are certainly not predicting that it will. We could also experiment with different assumptions regarding the other explanatory variables. Real growth has been slower in Europe than in the United States for some years, largely due to lower population growth; if this trend were to continue, it would retard the trend. US monetary policy has recently been looser than ECB monetary policy. Is it possible that the Fed will eventually come under pressure to monetize the growing US national debt? Or that the exchange rate will become more volatile, in response to current account deficits or troubles in the Mideast? It may be worth exploring a few different scenarios. Results of the Simulations In order to focus on the dynamics between the two key reserve currencies, at this point we pare down the analysis to the dollar and the euro. We use a two-currency specification informed by what we have learned from our seven-currency regressions. In particular, we continue to transform the shares variable using the logistic function. Focusing on a two currency specification is helpful as (1) it is difficult to model the other reserve currencies with shares less than 10%, and (2) it allows us to easily to impose up the adding constraint. The results are reported in Table 3, for specifications involving inflation differentials and depreciation. Columns [1] and [3] report stripped down specifications involving only income and the inflation and depreciation variables. Columns [2] and [4] report the more comprehensive specifications including exchange rate variability and turnover. In these pared down specifications, income and exchange rate variability are the most significant variables, although income is not always statistically significant even when the coefficient is fairly large. The rise in standard errors in the two currency estimation suggests that there was variation across currencies contributed substantial power to the seven-currency results. In these specifications, depreciation shows up as borderline (20%) significant in column [4]. We use this specification in the simulations that follow. 44 We are being conservative as regards the new EU 10. Current plans are for the euro area to be expanded to 15 members in 2006 and 18 in 2007.

21
We consider four scenarios, defined by alternative assumptions regarding the relative size of the euro area and the United States. In case 1, the ten countries that joined the EU in 2004 join EMU in 2010, and the US grows slightly relative to world income, increasing its share by two percentage points over 30 years. In case 2, the US only holds steady its proportion of world income, while the euro area grows by the ten accession countries.44 In case 3, the accession countries join in 2010, and Sweden and Denmark in 2015. Finally, case 4 incorporates UK entry in 2020. For each of these cases, we consider four possibilities for exchange rate depreciation: Scenario A involves the currencies depreciating (against the SDR) at the same trend rate that they did over the 1990-2004 period; this turns out to be virtually zero depreciation. Scenario B assumes the exchange rates stay at the end-2004 levels. Scenario C considers the possibility of the currencies continuing to depreciate at the 20-year trend rates realized at the end of 2004. Finally, Scenario D contemplates the persistence of the trends observed over the 2001-2004 period, when the dollar depreciated at a 3.6% rate per annum, and the euro appreciated at a 4.6% rate. Table 4 summarizes the outcome of the simulations. Some scenarios lead to erosion of the dollar’s position as the world’s premier international reserve currency. Briefly put, if the UK joins EMU (Case 4), the euro becomes the dominant currency. The only UK-in scenario in which it does not is when 20-year trend depreciation is assumed to drop to zero, which is unlikely in that it requires an immediate jump in the dollar’s value in 2005. If currency trends of the recent past persist (Scenario D), the euro not only gains dominance, but does so rapidly – by 2019. In the other combinations, the dollar retains the lead, although the degree of dominance depends upon the assumptions underlying the scenario and rate of currency depreciation. When the US dollar retains its lead, it typically does so by about 30 to 35 percentage points. When the euro gains the lead, the lead can range from 10 percentage points (the scenario with no entry of UK, Sweden or Denmark, strong US growth, and rapid dollar depreciation combined with euro appreciation) to 65 percentage points (UK entry and rapid dollar depreciation and euro appreciation). Figures 11-14 display the simulated dynamics of the USD and EUR holdings (here expressed as shares of the sum of USD and EUR reserve holdings). Figure 11 illustrates that when the euro area is composed of the current Euro-12 and the accession countries (as of 2010), and the exchange rates remain at their end-2004 levels, the dollar retains its dominance. Figure 12 represents the scenario where Sweden and Denmark join the euro area in 2015 as well, and the currencies continue to depreciate or appreciate at the 20 year trends that held at the end of 2004. The dollar also retains its dominance here, but by a very slightly smaller amount. Euro dominance occurs (by 2023) if the currencies continue the trends experienced over the 2001-04 period (3.6% depreciation for the dollar, 4.6% appreciation for the euro, both on an annualized basis). The euro gains overwhelming dominance in the instance where the UK joins the euro area and rapid depreciation persists indefinitely. In this combination, the switchover

22
occurs in 2020 and eventually the euro accounts for more than 80% of combined USD and EUR holdings. Summary Conclusions The major pay-off of the paper is predictions about scenarios under which the euro might in the future rival or surpass the dollar as the world’s leading international reserve currency. That question appears to depend most importantly on two things: (1) whether enough other EU members join euroland so that it becomes larger than the US economy and, in particular, whether the UK comes in, with its large financial markets; and (2) whether US macroeconomic policies eventually undermine confidence in the value of the dollar through inflation and depreciation. Whatever value this exercise has probably consists of estimating, contingent on those two things happening, how quickly the euro might rise to challenge the dollar. We find that if all 13 EU members who are not currently in EMU join it by 2020, including the United Kingdom, then the euro overtakes the dollar a few years later. We also find that even if some of these countries do not join, a continuation of the recent trend depreciation of the dollar, were it to occur for whatever reason, could bring about the tipping point even sooner. References Alquist, Ron and Menzie Chinn, 2002, “The Euro and the Productivity Puzzle: An Alternative Interpretation,” NBER Working Paper No. 8824 (March). Aliber, Robert, 1966, The Future of the Dollar as an International Currency, Frederick Praeger, Publishers, New York. Alogoskoufis, George and Richard Portes, 1992, "European Monetary Union and International Currencies in a Tripolar World," in Matthew Canzoneri, Vittorio Grilli and Paul Masson (eds), Establishing a Central Bank: Issues in Europe and Lessons from the U.S., Cambridge: Cambridge University Press, pp.273-302. Bank of England, 1992, "The Foreign Exchange Market in London," in Quarterly Bulletin 32, no.4, Nov., 408-417. Bank for International Settlements, 1995, Central Bank Survey of Foreign Exchange Market Activity in April 1995: Preliminary Global Findings, Monetary and Economic Department, Basle, October. Bank for International Settlements, 2001, Triennial Central Bank Survey of Foreign Exchange and Derivatives Market Activity in 2001. Bank for International Settlements, 2005, Triennial Central Bank Survey of Foreign Exchange and Derivatives Market Activity in 2004 , March. Beck, Thorsten, Asli Demirgüc-Kunt, and Ross Levine (2000), “A new database on financial development and structure,” Policy Research Paper No. 2147 (Washington, D.C.: World Bank). Bergsten, C.Fred, 1975, The Dilemmas of the Dollar, New York Univ. Press, New York. Bergsten, C.F., 1997, “The Dollar and the Euro,” Foreign Affairs, July/August, 83-95.

23
Bishop, Graham, 2000, “1Q 2000: The Maturing Euro Bond Market,” Salomon Smith Barney, 14 April. Black, Stanley, 1985, "International Money and International Monetary Arrangements," Chapter 22 in Handbook of International Economics, edited by Ron Jones and Peter Kenen, Elsevier Science Publishers. Black, Stanley, 1989, "Transactions Costs and Vehicle Currencies," Journal of International Money and Finance 10 (4), December: 512-526. Boughton, James, 2001, "Northwest of Suez: The 1956 Crisis and the IMF," IMF Staff Papers 48, no. 3, 425 Chinn, Menzie, 1999, "Memo on the Determinants of Central Bank Euro Holdings," http://www2.ucsc.edu/people/chinn/EUROMEM3a_rev.pdf.
Detken, Carsten, and Philippe Hartmann, 2000, “The Euro and International Capital Markets,” Working Paper No. 19, European Central Bank, April. International Finance 3, no. 1, 53-94. Detken, Carsten, and Philippe Hartmann, 2002, “Features of the Euro’s Role in International Financial Markets,” Economic Policy 35, Fall, 555-597. Dooley, Michael, David Folkerts-Landau, and Peter Garber, 2003, “An Essay on the Revived Bretton Woods System,” NBER Working Paper No. 9971. Dooley, Michael, J. Saul Lizondo, and Donald Mathieson, 1989, "The Currency Composition of Foreign Exchange Reserves," IMF Staff Papers 36, no.2, June, 385-434. Dornbusch, Rudiger, 1989, "The Dollar in the 1990s: Competitiveness and the Challenge of New Economic Blocs," in Monetary Policy Issues in the 1990s, Federal Reserve Bank of Kansas City, 245-273. Eichengreen, Barry, 1992, Golden Fetters: The Gold Standard and the Great Depression 1919-39, Oxford University Press, New York. Eichengreen, Barry, and Jeffrey Frankel, 1996, "The SDR, Reserve Currencies, and the Future of the International Monetary System" in The Future of the SDR in Light of Changes in the International Financial System, edited by Michael Mussa, James Boughton, and Peter Isard, International Monetary Fund, 1996. Eichengreen, Barry, and Donald Mathieson, 2000, “The Currency Composition of Foreign Exchange Reserves: Retrospect and Prospect,” IMF Working Paper wp/00/131, Washington DC. Revised version in The Impact of EMU on Europe and the Developing Countries, edited by Charles Wyplosz, Oxford University Press, 2001. European Central Bank, 2003, Review of the International Role of the Euro, December. Frankel, Jeffrey, 1992. "On the Dollar," In The New Palgrave Dictionary of Money and Finance, MacMillan Press Reference Books, London. Frankel, Jeffrey, 1993. "Is Japan Creating a Yen Bloc in East Asia and the Pacific?" in Regionalism and Rivalry: Japan and the U.S. in Pacific Asia, edited by Jeffrey Frankel and Miles Kahler, University of Chicago Press, Chicago, 53-85. Frankel, Jeffrey, 1995. "Still the Lingua Franca: The Exaggerated Death of the Dollar," Foreign Affairs, 74, no. 4, July/August, 9-16.

24
Frankel, Jeffrey, 2004, “How the US Government Flubbed Its Opportunity to Exercise Global Economic Leadership,” in The International Economy, XVIII, no. 2, Spring. Frankel, Jeffrey, and Shang-Jin Wei, 1994. "Yen Bloc or Dollar Bloc? Exchange Rate Policies of the East Asian Economies," in Macroeconomic Linkages: Savings, Exchange Rates, and Capital Flows, NBER - East Asia Seminar on Economics, Volume 3, Takatoshi Ito and Anne Krueger, editors, University of Chicago Press. Frenkel, Jacob, 1980, "The Demand for International Reserves under Pegged and Flexible Exchange Rate Regimes and Aspects of the Economics of Managed Float," in D.Bigman and T.Taya, eds. The Functioning of Floating Exchange Rates: Theory, Evidence and Policy Implications, Ballinger, Cambridge, 169-195. Frieden, Jeffry, "The Political Economy of The Euro as an International Currency." In The Euro as a Stabilizer in the International Economic System, edited by Robert Mundell and Armand Clesse. Boston: Kluwer Academic Publishers, 2000. Gaspar, Vitor, and Philipp Hartmann, 2005, “The Euro and Money Markets: Lessons for European Financial Integration” In The Euro at Five: Ready for a Global Role? edited by Adam Posen (Institute for International Economics: Washington). Gladwell, Malcolm, 2000, The Tipping Point: How Little Things Can Make a Big Difference, Little, Brown: Boston. Goldstein, Morris, 2004, “Adjusting China’s Exchange Rate Policies,” paper presented at the International Monetary Fund's seminar on China's Foreign Exchange System, Dalian, China, May 26–27, 2004; Wp 04-1, Institute for International Economics. Hale, David, 1995, "A Yen for Change: Why the Yen as a Reserve Currency is Not Far-fetched," The International Economy, May/June. Hale, David, 1999, “Will Europe’s New Currency Threaten the US Dollar and Marginalize Japan’s Yen?” Zurch Group, January. Hartmann, Philipp, 1998, “The Currency Denomination of World Trade after European Monetary Union,” Journal of the Japanese and International Economies, 12, 424-454. Heller, H.Robert and Mohsin Khan, 1978, "The Demand for Reserves under Fixed and Floating Exchange Rates," IMF Staff Papers 25, 623-649. International Monetary Fund, 2003, “Revised IMF Annual Report, data on official foreign exchange reserves,” press release no. 03/196, Washington DC. Kenen, Peter, 1960, "International Liquidity and the Balance of Payments of a Reserve Currency Country," Quarterly Journal of Economics 74, 572-86. Kenen, Peter, 1983, The Role of the Dollar as an International Currency, Occasional Papers No. 13, Group of Thirty, New York. Kennedy, Paul, 1989, Rise and Fall of the Great Powers: Economic Change and Military Conflict from 1500 to 2000 Kindleberger, Charles, 1950, The Dollar Shortage. Kindleberger, Charles P., 1981, International Money, George Allen & Unwin, London. Kindleberger, Charles, 1995, "Dollar Darkness," The International Economy, May/June 1995.

25
Krugman, Paul, "The International Role of the Dollar: Theory and Prospect," in Exchange Rate Theory and Practice, edited by John Bilson and Richard Marston, Chicago: University of Chicago Press, 1984, 261-78. Kunz, Diane, 1995, “The Fall of the Dollar Order: The World the United States is Losing,” Foreign Affairs 74, no. 4, July/August, pp. 22-25. Lindert, Peter, 1969, Key Currencies and Gold: 1900-1913, Princeton Studies in International Finance, No. 24, August. Matsuyama, Kiminori; Nobuhiro Kiyotaki and Akihiko Matsui. 1993. “Toward A Theory of International Currency,” Review of Economic Studies 60, April: 283-307. McKinnon, Ronald, 1969, Private and Official International Money: The Case for the Dollar, Essays in International Finance, No. 74, Princeton University, April. McKinnon, Ronald, 1979, Money in International Exchange, Oxford University Press, New York. Nurkse, Ragnar, 1944, International Currency Experience, Geneva: League of Nations. Portes, Richard, and Helene Rey, 1998, “The Emergence of the Euro as an International Currency,” NBER Working Paper No. 6424, February. Rey, Helene, 2005, “The Impact of a Five Year Old Euro on Financial Markets,” in The Euro at Five: Ready for a Global Role? edited by Adam Posen (Institute for International Economics: Washington). pp.111-116. Schelling, Thomas, 1978. Micromotives and Macrobehavior, W.W. Norton. Swoboda, Alexander, 1969, "Vehicle Currencies in the Foreign Exchange Market: The Case of the Dollar," in R.Aliber, ed., The International Market for Foreign Exchange, Praeger, New York. Tavlas, George, 1993, "The Deutsche Mark as an International Currency," in Dilip Das, ed., International Finance: Contemporary Issues, Routledge, London, 566-579. Tavlas, George, and Yuzuru Ozeki, 1992. The Internationalization of Currencies: An Appraisal of the Japanese Yen, IMF Occasional Paper No. 90. International Monetary Fund: Washington, D.C. Triffin, Robert, 1960, Gold and the Dollar Crisis, Yale University Press, New Haven. Table 1 Panel Regression Pre-euro (1973-98) Dependent variable: share
[1] [2] [3] [4] [5] [6]

26
GDPratio (y) 0.098 0.123 0.086 0.115 0.096 0.085 [0.044] [0.049] [0.044] [0.049] [0.046] [0.047]
Inflationdiff (�) -0.071 -0.107 -0.097 -0.143 [0.052] [0.060] [0.054] [0.063]
Depreciation ( �s) -0.051 -0.094 [0.070] [0.074]
Exratevar (�) -0.028 -0.057 -0.020 -0.055 -0.033 -0.030 [0.020] [0.032] [0.020] [0.032] [0.029] [0.030]
Fxturnoverratio (to) 0.019 0.023 0.011 0.016 [0.016] [0.016] [0.016] [0.017]
GDPleader (leader) 0.023 0.026 0.023 [0.013] [0.014] [0.014]
lagshare (sh t-1) 0.956 0.944 0.922 0.904 0.956 0.923 [0.017] [0.020] [0.026] [.029] [.018] [.027]
N 182 182 182 182 182 182 sample 73-98 73-98 73-98 73-98 73-98 73-98 Adj R2 0.99 0.99 0.99 0.99 0.99 0.99
Notes: Dependent variable is sh. Estimated using OLS, no constant. All variables are in decimal form. GDP at market terms. Figures in bold face are significant at the 10% level.

27
Table 2 Panel Regression Pre-euro (1973-98) Dependent variable: logit
[1] [2] [3] [4] [5] [6] [7] Constant -0.506 -0.648 -0.497 -0.674 -0.488 -0.487 -0.117
[0.123] [0.154] 0.124 [0.154] [0.138] [0.138] [0.061] GDPratio (y) 2.285 2.768 2.735 3.690 2.215 2.775 1.040
[0.564] [0.643] [0.781] [0.923] [0.616] [0.854] [0.288] Inflationdiff (�) -1.565 -2.639 -1.512 -2.860
[0.927] [1.156] [0.930] [1.164] Depreciation ( �s) -1.079 -0.920 -1.095
[1.294] [1.306] [0.594] Exratevar (�) -0.445 -0.981 -0.594 -1.395 -0.583 -0.798 -1.251
[0.457] [0.573] [0.491] [0.644] [0.581] [0.624] [0.341] Fxturnoverratio (to) 0.446 0.576 0.208 0.252 0.427
[0.289] [0.303] [0.302] [0.305] [0.145] GDPleader (leader) -0.125 -0.217 -0.150
[0.150] [0.156] 0.159 laglog(sh t-1/1- sh t-1) 0.879 0.851 0.882 0.846 0.881 0.882 0.957
[0.025] [0.031] [0.025] [.031] [.029] [.029] [.014] N 182 182 182 182 182 182 156
sample 73-98 73-98 73-98 73-98 73-98 73-98 73-98 Adj R2 0.97 0.97 0.97 0.97 0.97 0.97 0.99
Notes: Dependent variable log(sh/(1-sh)) Estimated using OLS. All variables are in decimal form. GDP at market terms. Figures in bold face are significant at the 10% level. Column [7] omits Japanese yen, and estimated using cross-section weighted standard errors.

28
Table 3 Two-Currency System Pre-euro (1973-98) Dependent variable: logit
[1] [2] [3] [4] b Constant -0.392 -0.465 -0.470 -0.532
[0.132] [0.167] [0.159] [0.165] GDPratio (y) 0.762 1.015 0.904 0.974 a/
[0.247] [0.773] [0.294] [0.688] Inflationdiff (�) -0.554 -0.844
[1.247] [1.259] Depreciation ( �s) -3.497 -4.524 a/
[3.642] [3.337] Exratevar (�) -2.375 -2.381
[1.213] [1.121] Fxturnoverratio (to) 0.489 0.652 a/
[0.487] [0.454] laglog(sh t-1/1- sh t-1) 0.829 0.775 0.830 0.795
[0.043] [0.085] [0.043] [.076] N 26 26 26 52
sample 73-98 73-98 73-98 73-98
Adj R2 0.86, 086
0.85, 0.87
0.86, 0.87
0.86, 0.87
Notes: Dependent variable log(sh/(1-sh)) Estimated using OLS. All variables are in decimal form. GDP at market terms. Figures in bold face are significant at the 10% level. a/ Significant at 20% msl. b Weighted least squares.

29
Table 4 Summary of Simulation Results Rate of long
depreciation equals 1990-2004 rate (0%) (Scenario A)
Level of exchange rate stays at end-2004 levels (Scenario B)
Rate of long depreciation remains at 2004 rates (Scenario C)
Rate of depreciation over 2001-04 period continues (Scenario D)
UK, Swe., Den. stay out, US grows rel. to Euro Area (Case 1)
USD retains dominance
USD retains dominance
USD retains dominance
EUR exceeds USD in 2024
UK, Swe., Den. stay out of EMU (Case 2)
USD retains dominance
USD retains dominance
USD retains dominance
EUR exceeds USD in 2023
UK, stays out of EMU (Case 3)
USD retains dominance
USD retains dominance
USD retains dominance
EUR exceeds USD in 2022
UK joins EMU in 2020 (Case 4)
USD retains dominance
EUR exceeds USD in 2022
EUR exceeds USD in 2022
EUR exceeds USD in 2019
Notes: Summary of outcomes for combinations of Cases and Scenarios. Case 1: Accession countries join EMU in 2010, US share of world income rises by 2 percentage points over 30 years. Case 2: Accession countries join EMU in 2010, US retains share of world income. Case 3: Accession countries join EMU in 2010, Sweden and Denmark joins in 2015, US retains share of world income. Case 4: Accession countries join EMU in 2010, Sweden and Denmark joins in 2015, UK joins in 2020, US retains share of world income. Scenario A: 20-year rate of depreciation stays at past rate (0%), requiring an appreciation after 2004. Scenario B: Exchange rates remain at end-2004 levels. Scenario C: The 20 year rate of depreciation at end-2004 persists. Scenario D: The rate of depreciation/appreciation experienced over 2001-04 continues after 2004.

30
Appendix 1 Data Description and Sources
Share is the proportion of currency holdings. GDPratio is the share of world GDP (evaluated at market exchange rates); Inflationdiff is the difference between a 5 year moving average of CPI inflation and industrialized country inflation; Exratevar is the trade weighted exchange rate volatility (monthly), measured as a 5 year moving average; Fxturnovertatio is turnover is daily turnover divided by total 5 center turnover; peg anchor variable is the proportion of pegged exchange rates linked to a particular currency. All variables are described in greater detail in the data appendix. Reserve currency holdings. Official reserve holdings of member central banks, at end of year. IMF internal database, in format corresponding to Table I.2 in the IMF Annual Report. Aggregate, industrial country and developing country. Current version, spliced version of Updated 2003 data obtained July 1, 2004 (for 1980 onward) to spreadsheet for 1965-2001. NA observations set to 0 except for the euro legacy currencies. In logistic transformations, 0 entries set to 0.000001 (0.0001%). Source: IMF Annual Reports, IMF databases. Ratio of GDP to total World GDP. Ratio of GDP in USD (converted at official exchange rates) to GDP of world aggregate. Sources: IMF, International Financial Statistics. Euro area, world GDP data from IMF, World Economic Outlook. Inflation. Calculated as log difference of monthly CPI, averaged. Five year moving average is centered. Source: IMF, International Financial Statistics; Euro area inflation for 1980-1998 is ECB data from Alquist and Chinn (2002). Exchange rate volatility. Calculated as the standard deviation of the log first difference of the SDR exchange rate. Source: IMF, International Financial Statistics. Forex Turnover. 1989, 1992, 1995, 1998, and 2001 from BIS Triannual Surveys. Billions of dollars of daily turnover, in April. Data from 1977-88 from G-30, NY Fed surveys, central bank surveys. Observations in-between survey years log-linearly interpolated. For 1973-1979, interpolation using 1977-79 relationship. Net international investment position is cumulated current account. These net investment positions are normalized by World GDP (converted at official exchange rates). Source: Lane and Milesi-Ferretti (2002). Linked currency counts. For 1973-2000, tabulation based on data from Shambaugh (2004). Source: Personal communication from Jay Shambaugh. The variable used in the regression is the proportion of currencies linked to a particular base currency (USD, DEM, etc.) as a proportion of all pegged rates tabulated. Stock market capitalization to GDP ratio, Stock market total value traded to GDP ratio, Stock market turn over ratio, Private bond market capitalization to GDP ratio, Public bond market capitalization to GDP ratio. Source: Beck et al. (2000).

31
Appendix 2 Sensitivity Checks
Appendix Table 1 Additional Panel Regression Results Pre-euro (1973-98) Dependent variable: logit
[1] ]2] [3] [4] [5] [6] [7]
Export scale variable
Pegged
Net foreign assets
Stock Market Capitalization
Total stock value traded
Stock market
turnover
Bond mrket
capitalization
Constant -0.883 -0.451 -0.504 -0.186 -0.606 -0.170 -0.045 [0.174] [0.133] [0.124] [.087] [0.138] [0.096] [0.126]
GDPratio (y) 5.869 2.789 2.233 0.744 2.766 0.680 2.181 [1.145] [0.719] [0.582] [0.407] [0.643] [0.431] [0.985]
Inflationdiff (�) -1.456 -1.352 -1.613 -1.268 -1.563 -1.241 2.784 [1.002] [0.945] [0.938] [0.613] [0.975] [0.616] [1.760]
Depreciation ( �s)
Exratevar (�) 0.230 -0.788 -0.412 -0.171 -0.483 -0.147 -0.662 [0.453] [.548] [0.466] [0.296] [0.483] [0.293] [0.466]
Liquidity (liq) 0.327 0.006 -0.057 -0.005 -0.262 [0.265] [0.039] [.057] [0.027] [0.160]
Peg base -0.517 [0.457]
Net Foreign Assets -0.391 [1.031]
Lag logit 0.867 0.884 0.879 0.962 0.851 0.963 0.955 [0.024] [0.026] [0.025] [0.019] [.029] [.020] [.031]
N 182 182 182 161 162 155 63 sample 73-98 73-98 73-98 76-98 75-98 76-98 90-98 Adj R2 0.98 0.97 0.97 0.99 0.97 0.99 0.99
Notes: Dependent variable log(sh/(1-sh)) Estimated using OLS. All variables are in decimal form. GDP at market terms. Figures in bold face are significant at the 10% level. Liquidity is alternative measures of depth of financial market. Peg base is the proportion of pegged currencie associated with each reserve currency. Net Foreign Assets is the cumulated current accounts as a share of world GDP. Column [7] omits Japanese yen.

32
-.1
.0
.1
.2
.3
.4
.5
.6
.7
.8
.0 .1 .2 .3 .4 .5
RATIOY1
SHARE
SHARE vs. RATIOY1
(GDP in PPP terms)
Figure 1: Currency share vs. GDP (mkt. rates) Figure 2: Currency share vs. GDP (PPP)
Figure 3: Currency Share vs. Inflation Diff. Figure 4: Currency share vs. exch.volatility
.0
.1
.2
.3
.4
.5
.6
.7
.8
.00 .05 .10 .15 .20 .25 .30
VNEER
SHARE
SHARE vs. VNEER
.0
.1
.2
.3
.4
.5
.6
.7
.8
-.12 -.08 -.04 .00 .04 .08
PIDIF
SHARE
SHARE vs. PIDIF
-.1
.0
.1
.2
.3
.4
.5
.6
.7
.8
.0 .1 .2 .3 .4 .5 .6
RATIOY
SHARE
SHARE vs. RATIOY
(GDP using market rates)
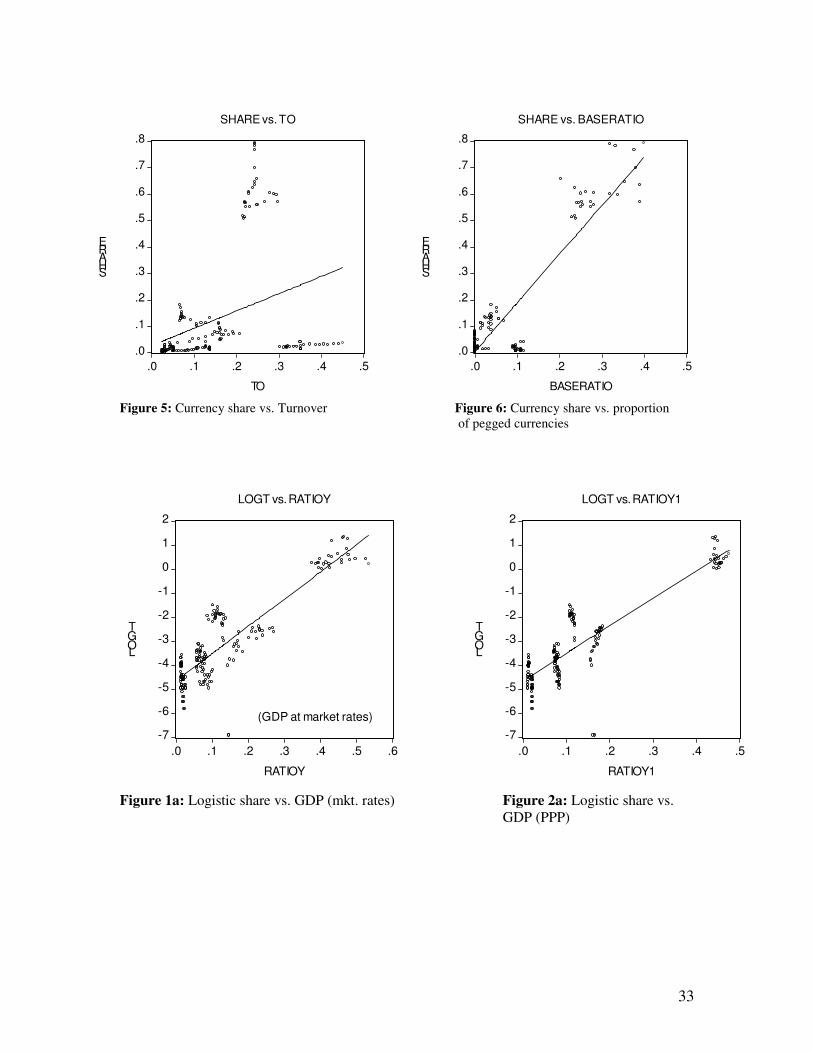
33
Figure 5: Currency share vs. Turnover Figure 6: Currency share vs. proportion of pegged currencies
Figure 1a: Logistic share vs. GDP (mkt. rates) Figure 2a: Logistic share vs. GDP (PPP)
.0
.1
.2
.3
.4
.5
.6
.7
.8
.0 .1 .2 .3 .4 .5
TO
SHARE
SHARE vs. TO
.0
.1
.2
.3
.4
.5
.6
.7
.8
.0 .1 .2 .3 .4 .5
BASERATIO
SHARE
SHARE vs. BASERATIO
-7
-6
-5
-4
-3
-2
-1
0
1
2
.0 .1 .2 .3 .4 .5 .6
RATIOY
LOGT
LOGT vs. RATIOY
(GDP at market rates)-7
-6
-5
-4
-3
-2
-1
0
1
2
.0 .1 .2 .3 .4 .5
RATIOY1
LOGT
LOGT vs. RATIOY1

34
Figure 7: Reserves held by central banks as shares of total – major currencies (revised IMF data spliced into old data after 1979) 5/2/05
.0
.1
.2
.3
.4
.5
.6
.7
.8
1965 1970 1975 1980 1985 1990 1995 2000
USD
DEM
JPY
EUR

35
Figure 8 – Reserves held by central banks as shares of total – smaller currencies (revised IMF data spliced into old data after 1979)
.000
.005
.010
.015
.020
.025
.030
1965 1970 1975 1980 1985 1990 1995 2000
SFR
FFR
NLG
.00
.05
.10
.15
.20
.25
.30
1965 1970 1975 1980 1985 1990 1995 2000
Other
ECU

36
.1
.2
.3
.4
.5
.6
.7
.8
1975 1980 1985 1990 1995 2000
USD
EUR
Pred.
Pred.
Figure 9: Out-of-sample prediction of USD and EUR using logit w/o leader variable
.00
.01
.02
.03
.04
.05
.06
.07
.08
.09
1975 1980 1985 1990 1995 2000
JPY
SFR
Pred.
Pred.GBP
Pred.
Figure 10: Out-of-sample prediction of GBP, JPY and SFR using logit w/o leader variable

37
0.0
0.2
0.4
0.6
0.8
1.0
75 80 85 90 95 00 05 10 15 20 25 30 35 40
USD
DEM
EUR
Figure 11: Case 2, Scenario B, Simulation of “No UK, Swe, Den”, and no further depreciation of the level of the exchange rate after 2004.
0.0
0.2
0.4
0.6
0.8
1.0
75 80 85 90 95 00 05 10 15 20 25 30 35 40
USD
DEM
EUR
Figure 12: Case 3, Scenario C. Simulation of “No UK”, and depreciation at 2004 20 year trend rate

38
0.0
0.2
0.4
0.6
0.8
1.0
75 80 85 90 95 00 05 10 15 20 25 30 35 40
USD
DEM
EUR
Figure 13: Case 2, Scenario D, Simulation of “No UK, Swe., Den.” And continued depreciation of the exchange rate at the 2001-04 rate.
0.0
0.2
0.4
0.6
0.8
1.0
75 80 85 90 95 00 05 10 15 20 25 30 35 40
USD
DEM
EUR
Figure 14: Case 4, Scenario D, Simulation of “UK entry” and continued depreciation of the exchange rate at the 2001-04 rate.


![Group 8 surpass presentation[1]](https://img.pdfslide.us/doc/110x75/55896ac1d8b42a8e268b4729/group-8-surpass-presentation1.jpg)


![Breakthrougher I [Surpass Your Aspirations]](https://img.pdfslide.us/doc/110x75/577cd3591a28ab9e78970b36/breakthrougher-i-surpass-your-aspirations.jpg)