Embed Size (px)
Citation preview

Will the Circle Be Unbroken: A History of the U.S.National Ambient Air Quality Standards
John BachmannVision Air Consulting, Chapel Hill, NC; and Formerly Associate Director forScience/Policy and New Programs, Office of Air Quality Planning andStandards, U.S. Environmental Protection Agency, Research Triangle Park, NC
ABSTRACTIn celebration of the 100th anniversary of the Air & WasteManagement Association, this review examines the historyof air quality management (AQM) in the United States overthe last century, with an emphasis on the ambient standardsprograms established by the landmark 1970 Clean Air Act(CAA) Amendments. The current CAA system is a hybrid ofseveral distinct air pollution control philosophies, includingthe recursive or circular system driven by ambient stan-dards. Although this evolving system has resulted in tre-mendous improvements in air quality, it has been far fromperfect in terms of timeliness and effectiveness. The paperlooks at several periods in the history of the U.S. program,including: (1) 1900–1970, spanning the early smoke abate-ment and smog control programs, the first federal involve-ment, and the development of a hybrid AQM approach inthe 1970 CAA; (2) 1971–1976, when the first National Am-bient Air Quality Standards (NAAQS) were set and imple-mented; (3) 1977–1993, a period of the first revisions to thestandards, new CAA Amendments, delays in implementa-tion and decision-making, and key science/policy/legislativedevelopments that would alter both the focus and scale ofair pollution programs and how they are implemented; and(4) 1993–2006, the second and third wave of NAAQS revi-sions and their implementation in the context of the 1990CAA. This discussion examines where NAAQS have helpeddrive implementation programs and how improvements inboth effects and air quality/control sciences influenced pol-icy and legislation to enhance the effectiveness of the sys-tem over time. The review concludes with a look toward thefuture of AQM, emphasizing challenges and ways to meetthem. The most significant of these is the need to makemore efficient progress toward air quality goals, while ad-justing the system to address the growing intersections be-tween air quality management and climate change.
INTRODUCTIONThe celebration of the 100th anniversary of the Air &Waste Management Association occurs at an importantjuncture for U.S. air pollution programs. The year 2006marked the 35th anniversary of the National Ambient AirQuality Standards (NAAQS).1 The year before that was the35th anniversary of the formation of the U.S. Environ-mental Protection Agency (EPA)2 and the passage of thelandmark 1970 Clean Air Act (CAA) Amendments.3 Thislaw established the air quality management (AQM) frame-work that is in use today. Although much has changed
since then, the fundamental approach of the 1970 CAAwas to formalize the broad outlines that define the respec-tive roles and responsibilities of the major participants.The process was designed to result in continuing improve-ments over time, and it has: in terms of the pollutants the1970 CAA addressed, U.S. air quality over the years isdemonstrably and markedly improved (e.g., Figure 1). Onthe other hand, the process has been far from perfect intimeliness and effectiveness, and a number of importantair quality related challenges remain.4 Furthermore, EPArecently announced changes to the approach used overthe last 25 yr to review and revise the NAAQS5 and anAgency advisory panel has just completed work on a seriesof recommendations for improving AQM.6,7 This is agood time to look at the history of U.S. AQM.
SCOPE OF THIS REVIEWThis review examines the evolution of AQM in the UnitedStates, with particular emphasis on the NAAQS. Althoughthis excludes a number of important topics in U.S. air pol-lution law and practice, it is broader than most topics thathave been addressed in prior reviews. The review summa-rizes the antecedents and practice of AQM across severalhistorical periods, including (1) 1900–1970, spanning theearly smoke abatement and photochemical smog controlprograms led by cities and states, the first federal involve-ment, and the development of the AQM approach embod-ied in the CAA Amendments of 1970 (2) 1971–1975, thebeginning of the modern era, in which the first NAAQS wereset and implemented; (3) 1976–1992, a period of the firstrevisions to the standards as well as substantial science/policy/legislative developments that would alter the focusand scale of air pollution programs and their implementa-tion; and (4) 1993–2006, the second and third wave ofNAAQS revisions and implementation measures respondingto the 1990 CAA Amendments. The review concludes withlessons learned from the U.S. experience to date, discussessome of the key issues and challenges for future AQM, andoutlines some improvements and alternative approachesthat might be considered.
AQM, American Style: Is This the OnlyApproach?
AQM is one of several overarching strategies that can beemployed in an organized program to reduce air pollu-tion.8 Sometimes referred to as “air resource manage-ment,”9,10 the essence of AQM is shown in Figure 2.4,6
2007 CRITICAL REVIEW ISSN:1047-3289 J. Air & Waste Manage. Assoc. 57:652–697DOI:10.3155/1047-3289.57.6.652Copyright 2007 Air & Waste Management Association
652 Journal of the Air & Waste Management Association Volume 57 June 2007

This approach has a conceptual appeal for scientists andengineers. In practice, however, it can be daunting toexecute, owing to the extraordinary level of technical andscientific information needed to establish effects-basedambient targets, measure key pollutants, inventorysources and emissions, develop and estimate costs foralternative control scenarios, and forecast and assess re-sults. Each of these technical steps in the process is subjectto large uncertainties. Additional skills are needed to de-velop necessary regulations and incentives, get them ap-proved through state and Federal processes, and imple-ment and enforce the plans on a sometimes litigious andunwilling set of emitters, including the general popula-tion (e.g., car inspections). From the 1960s to the present,those involved in or reviewing the process have repeat-edly called for improved information and tools for all ofthe technical aspects, and have frequently sought re-sources, and technical, regulatory, and legislative assis-tance. The effectiveness of AQM depends on the natureand scale of the air pollutant problem as well as the levelof understanding, skill, and commitment in multipledisciplines.
What sets AQM apart from other systems is its reli-ance on ambient air quality standards based on evidenceof undesirable effects. These standards govern whether,and to what extent, a particular jurisdiction needs toreduce emissions. Such standards require some under-standing of the health and environmental effects of pol-lution and some judgment by policymakers. As such, it
falls into the category of “risk-based” environmental pro-grams.11,12 A major alternative strategy relies on emis-sions standards that require controls on various sourcecategories based on best available technology (BAT), con-sidering feasibility and costs. The BAT emissions stan-dards approach is also an example of “command andcontrol.”
The concept of adopting national emission stan-dards, alone or in combination with an ambient AQMstrategy, was the subject of considerable Congressionaldebate in the 1960s. The “risk versus technology” debatehas continued among scholars for all environmental me-dia. Many take issue with the whole notion of establish-ing “safe” levels of pollutants as being inconsistent withscience and time consuming11,13–16; some have champi-oned BAT as more effective.11,17 Those who favor BATnote that it avoids many inherent difficulties in establish-ing and implementing risk-based targets and can there-fore be implemented more quickly.9,11 It also provides areadily enforceable and equitable solution with some cer-tainty for affected sources. A major argument of thosefavoring the risk or standards approach is that, withoutsome normative goal, BAT would over-control in someareas and under-control in others.
National emissions and ambient standards are, ofcourse, not mutually exclusive. Emission limits areneeded to attain NAAQS, but required reductions may belower than those achievable by BAT. In fact, the schemesestablished by CAAs of 1970, 1977, and 1990 adapted
Figure 1. Progress in NAAQS pollution emissions continues while societal “drivers” grow.241 Since 1970, emissions of regulated pollutantshave steadily declined despite continued growth in population, energy consumption, traffic, and the economy. The benefits to society of the CAAcan be estimated against 1970, as can what “might have been” without such efforts. A peer-reviewed EPA retrospective analysis estimated therange of cumulative benefits for 1970–1990 of about $6 trillion to about $50 trillion as compared with compliance costs of $520 billion. Althoughsuch estimates are highly uncertain, it is reasonable to conclude that the benefits of all CAA programs combined substantially exceed thecosts.242
Bachmann
Volume 57 June 2007 Journal of the Air & Waste Management Association 653

elements of both approaches, making it a philosophical“hybrid.” Although these CAA Amendments did establishand retain an ambient standards-based AQM system, theysupplemented this approach with a growing number ofnational and area-specific emissions requirements.
By 1976, Stern’s classic compendium recognized atleast two additional strategies for reducing air pollu-tion.8,18 One approach was classified as “financial incen-tives,” such as taxes on fuels, tax deductions for controls,fines, fees, effluent charges, and subsidies. Another ap-proach “seeks to maximize cost effectiveness” but wascalled the “cost-benefit” strategy. Today, we would clas-sify the “financial” approach as a subset of “market-based” strategies. The successful market-based “cap-and-trade” programs to address acid rain and ozone (O3)attainment19 have incorporated elements of both thesecategories.
An overview of U.S. AQM would not be completewithout mention of the key participants. EPA has a majorrole in developing scientific criteria and establishingNAAQS as well as providing support to state and localprograms through grants, guidance and rules, nationalemissions standards for stationary and mobile sources,and enforcement. As part of the executive branch, EPAcoordinates and submits major rules for review by federalagencies, including the Office of Management and Budget
(OMB) and the Council on Environmental Quality (CEQ).EPA and many of these agencies sponsor research to ad-vance the process. Congress provides budget and over-sight for EPA’s activities as well as passing legislation. Thejudiciary resolves issues regarding NAAQS, implementa-tion rules, national emissions standards, and enforce-ment. The states have the primary responsibility for im-plementing the NAAQS, beyond those federal controlsmandated under the CAA, including monitoring, devel-oping control programs, and formalizing State Implemen-tation Plan (SIP) regulations. Some states conduct andsponsor scientific research related to effects and imple-mentation. Under the CAA, states may also impose theirown air quality standards that are stricter than federalNAAQS (e.g., www.arb.ca.gov/homepage.htm).
Public and private stakeholders, scientists and engi-neers, news media, and the public at large also play im-portant roles in multiple stages of AQM. Major industrysectors such as transportation, petroleum, power genera-tion, metals, mining, chemicals, and large-scale agribusi-ness take steps to meet various state and federal require-ments, and also develop new approaches to reduceemissions. Some industries and coalitions sponsor re-search and analyze relevance to aspects of the process(e.g., Electric Power Research Institute [EPRI; my.epri.com/portal/]; and the joint Agency-Industry funded
Figure 2. A conceptual model of AQM theory. This version is often referred to as the AQM “wheel” or “circle” and serves as the central focusand metaphor for this review. Under the 1970 CAA Amendments, the system is driven by NAAQS established by EPA. Congress gave most ofthe responsibility for the AQM process to the states, supported by federal rules for some sources and by federal grants. Each state mustdetermine its air quality relative to each of the NAAQS in all cities and areas and determine emissions reductions needed to attain and maintainthe standards. States evaluate a collection of national and state based emissions reductions and must submit a detailed, comprehensive, andlegally binding SIP to meet the NAAQS by a future date. Controls and measures must be implemented and checked by compliance andenforcement oversight. Finally, monitoring of the air or emissions is used to see if the plan worked. If not, or if the standards are strengthened,the process must be repeated. In practice, AQM in the United States does not fully conform to this theoretical model, and is better understoodas a hybrid system. Over time, the system itself has evolved through legislation and policy to address problems in achieving results, advancesin scientific and technical understanding, and changing socioeconomic and political conditions.
Bachmann
654 Journal of the Air & Waste Management Association Volume 57 June 2007

Health Effects Institute [HEI; www.healtheffects.org/index.html]). Some stakeholders are advocates in the re-view and revision of the NAAQS, implementation policy,standard setting, and guidance. This may involve meetingwith Agency policymakers, lobbying the Congress, peti-tions, and lawsuits. Examples of stakeholder organiza-tions include state and local air agencies (e.g., the Na-tional Association of Clean Air Agencies, Western StatesAir Resources Council), industry associations (e.g., Amer-ican Petroleum Institute [API], Edison Electric Institute,Motor Vehicle Manufacturers Association, American Ironand Steel Institute [AISI], National Mining Association),and environmental and public health groups (e.g., Envi-ronmental Defense, Natural Resources Defense Council[NRDC], American Lung Association). Scientists and en-gineers not only conduct research, but also play impor-tant roles in developing science assessments and review-ing Agency assessments and policies, recommendingadditional research and, in some cases, policy approaches(e.g., National Research Council [NRC]/National Acad-emy of Sciences [NAS] panels, the Clean Air ScientificAdvisory Committee [CASAC], NARSTO).
Even a cursory look at the history of the NAAQS andair pollution shows that developments are subject to whatis sometimes called big “P” (i.e., partisan) and little “p”(e.g., interagency or office) politics and all of the changingsocietal, economic, cultural, and other influences relatedto a particular time and place. Although the state of sci-entific and technical developments of a given era shapethe nature and effectiveness of societal responses to airpollution, such developments depend on the relative pri-ority society places on the issue. Although air pollution isthe focus of our profession and this review, it is infre-quently at the center of national or local attention; itcompetes with many other issues in the modern world.
20TH CENTURY AIR POLLUTION BEFORE THE1970 CAA AMENDMENTS
Part I: Up in Smoke (1900–1950)
“One of these days when the mischief is fullydone, when our once pellucid and crystallineatmosphere is transformed into Chicago reek,and Pittsburgh smoke and London fog, menwill begin to realize what they have lost, andwill hold conventions, and pass resolutions,and enact laws, and spend great sums ofmoney for the undoing of the mischief and therestoration of our atmosphere to its originalstate.” Editorial, New York Tribune, May11, 189920
By the turn of the nineteenth century, the industrialrevolution had transformed much of American life, cre-ating new “industrial cities” such as Pittsburgh, Cleve-land, and Milwaukee, and changing the character ofmany older cities built on commerce, such as New York,Boston, and Philadelphia, which acquired major industriesas well.21 The rapid growth (urban population doubled be-tween 1880 and 1900) and vast economic prosperity of the
nineteenth century cities came at the price of “. . . over-crowded tenements, congested traffic, critical health prob-lems, smoky skies, mounds of putrefying wastes, pollutedwaterways, and unbearable noise levels. . . . ”21 Inevitably,these conditions led to an increasing environmental aware-ness for urban and suburban dwellers. Individuals andgroups, largely drawn from the middle and upper classesthat benefited most from the economic advantages of urbanlife, began to protest, sue, and press local governments forremedies to specific pollution-related “nuisances,” usuallyon a local level.21 These early environmental reformers gen-erally shared the outlook of the larger Progressive move-ment (1890–1920s). They did not seek a return to nature,but to preserve the economic benefits of the industrial sys-tem while working toward a better urban environment.20
Despite repeated protests that were often led by localwomen’s clubs, nuisance lawsuits, and city ordinances,thick clouds of black smoke from the combustion of highvolatility bituminous coal remained a persistent feature ofthe industrial urban landscape. Indeed, the story of U.S.air pollution in the first half of the twentieth century waslargely driven by the growing amount, character, andgeographical distribution of coal use (Figure 3). Pitts-burgh, Chicago, Cleveland, Cincinnati, Milwaukee, andSt. Louis relied on nearby supplies of the more plentifulbituminous coal to fuel factories and dwellings, whereasnotably cleaner New York, Boston, and Philadelphia usu-ally had access to the less plentiful high-solid anthracitefrom eastern Pennsylvania. San Francisco relied on natu-ral gas.22 At the time, the most effective smoke mitigationoptions—switching to anthracite or natural gas—werelimited by local availability and cost. Other useful, butless effective, options such as improved firing technolo-gies, taller stacks, attention to operation, and mechanicalcollection, were not in wide use, partially because of costand lack of information.
Smoky days in these cities were characterized by acombination of coarse soot and dust fall with fine carbo-naceous and acidic particles and gases from industrial anddomestic sources. Limited data suggest ambient particle
Figure 3. Trends of fuel consumption in the United States.33
Between 1900 and 1950, coal was the dominant source of energy.The dip in consumption marks the Great Depression, and the follow-ing peaks mark the economic recovery leading into World War II,followed by increased coal use for electric power generation.
Bachmann
Volume 57 June 2007 Journal of the Air & Waste Management Association 655

levels in Chicago, Cleveland, and Pittsburgh in the 1910swere on the order of 1000–10,000 �g/m3, with dust falllevels in Pittsburgh of 1000 t/mi2.23 Episodes would fre-quently blot out the sun, requiring gaslights at midday inPittsburgh, which contemporaries noted was “a smokydismal city at her best.”24 But smoke’s effects were notlimited to obscuring the sun.
Coal soot, for example, was particularly invid-ious, for it not only coated everything in the citywith black dust, it also had an oily quality,which helped it cling to clothing, curtains, fur-niture, and other items. . . Soot could stick toexposed skin, collect in nostrils, lungs, eyes,and stomachs. . . Soot found its way into cup-boards and clothes, attics and cellars, and itcolored the cheeks of the city’s children as theyplayed in the dusty streets.20
Although most agreed that smoke was a nuisance,questions persisted in the popular culture about how se-rious a health menace it presented. An increasing scien-tific and medical consensus was that smoke was harmful,but the evidence was thin.20,22,24 A mid-19th century sug-gestion that smoke had at least some beneficial properties,for example as a germicide, persisted.11,24 Still, reformerssuch as the Pittsburgh’s Ladies Health Protective Associa-tion and the St. Louis Wednesday Club argued that smokeabatement was a public health necessity, in addition totheir position that cleanliness was a moral value and anattractive environment was an economic good.20,22,24 Thecounter argument was that a smoky atmosphere was theindex of prosperity, that economically viable alternativesdid not exist, and that smoke was not harmful tohealth.11,20,22,24 Tolerating this esthetic nuisance was justa necessary evil for the good of the community.
The early 1900s saw a number of protests, failed at-tempts at municipal regulation, and interventions againstregulations by the courts. A controversial transition fromprosecution to a technical and cooperative approach tosmoke management emerged with the introduction of theRingelmann Chart and the smoke inspector.22 The found-ing of the International Association for the Prevention ofSmoke (forerunner of A&WMA) in 1907 was emblematic,as was the growing number of municipal smoke regula-tion authorities and statutes (Table 1). Most ordinancesprohibited smoke emissions of greater than no. 3 on theRingelmann chart (60% opacity) from larger sources, butexempted most domestic combustion.25 Programs beganusing trained engineers to check violations and to educatebusiness and industry on improved firing methods andalternative equipment. Engineers and reformers createdwhat Stradling20 termed a “conservationist movement” toincrease efficiency and economy by decreasing the wasteassociated with unburned fuel (smoke and carbon mon-oxide [CO]) going up the stack.
Also emblematic of the era was a proliferation ofspecial studies on control approaches and surveys ofsmoke related pollution in St. Louis, Chicago, and otherareas. The most far reaching of these was the nine-volumeMellon Institute Study in Pittsburgh (1912–1914),26
which addressed air pollution levels, effects, economic
damages, and controls. Pittsburgh adopted Ordinance No.257 based on recommendations in this report in 1914. Onthe other hand, the 1915 Chicago Association of Com-merce study27 of the costs and benefits of railroad electri-fication took 5 yr to complete and delayed implementa-tion in Chicago by well over a decade.20 Inspired by NewYork’s early regulations, Chicago women’s groups hadadvocated rail electrification there as early as 1908.20
Between 1906 and the U.S. entry into World War I in1917, smoke programs appeared to progress in severalcities at the same time that coal utilization increased.Milwaukee limited the number of smoky days.22 A 1912report claimed Chicago reduced smoke by 75% in thecentral city.28 Improvements were also noted in Philadel-phia and Rochester, NY.20 By 1915, Pittsburgh smoke wasnoticeably improved despite coal use having more thandoubled (Figure 4).23 Although smoke abatement effortswere halted during the increased industrial productionstimulated by the war, Figure 4 indicates that smoke levelsin Pittsburgh did not return to their former peaks. In thepostwar era, advocates and inspectors in smoky citiesagain worked to improve the problem. The combustionstrategies they employed reduced soot as measured byopacity, but increased cinder and fly ash emissions. By the1930s, municipal regulations began to add requirementsfor total particle mass emissions.25
The dearth of ambient measurements does not per-mit verification of the extent to which the air improved,worsened, or stayed the same in most cities betweenWorld War I and World War II, though accounts suggestthat due to strikes and supply problems with anthracitecoal, New Yorkers had more problems with smoky coal inthe 1920s than in 1899.20 By April 1928, the New YorkTimes proclaimed that a new study had surveyed citiesfrom the Atlantic Seaboard to St. Louis and found “Moresoot here than in Pittsburgh.”29 Figure 3 indicates thatU.S. total coal use peaked in the 1920s and declined afterthe start of the Great Depression (1929), only to ramp upagain with the economy as the United States prepared forwar (1939–1941). Figure 4 shows that the occurrence ofheavy smoke in Pittsburgh followed this pattern, with
Table 1. Development of principal American municipal smoke abatementlegislation before 1930.25
Decade Cities
1880–1890 Chicago, IL; Cincinnati, OH1890–1900 St. Paul, MN; Cleveland, OH; Pittsburgh, PA1900–1910 Los Angeles, CA; Minneapolis, MN; St. Louis, MO;
Milwaukee, WI; Indianapolis, IN; Dayton, OH; Detroit, MI;Akron, OH; Buffalo, NY; Rochester, NY; Syracuse, NY;Washington, DC; Baltimore, MD; Philadelphia, PA;Newark, NJ; Springfield, MA; New York, NY; Boston, MA
1910–1920 Portland, OR; Denver, CO; Kansas City, MO; Des Moines,IA; Duluth, MN; Nashville, TN; Birmingham, AL;Louisville, KY; Flint, MI; Toledo, OH; Atlanta, GA;Columbus, OH; Richmond, VA; Albany County, NY;Jersey City, NJ; Hartford, CT; Providence, RI; Lowell, MA
1920–1930 San Francisco, CA; Seattle, WA; Salt Lake City, UT; SiouxCity, IA; Omaha, NE; Cedar Rapids, IA; Grand Rapids,MI; Lansing, MI; East Cleveland, OH; Wheeling, WV; ErieCounty, NY; Harrisburg, PA
Bachmann
656 Journal of the Air & Waste Management Association Volume 57 June 2007

conditions in the 1920s and 1930s apparently improvedover peaks observed in 1900 and 1912–1914.
In the 1930s, the New York Times periodically re-ported smoke data in tons per cubic mile from an Owensautomated smoke sampler in Central Park. Between 1930and 1931, the annual average at the site fell by more than50%, from 3.97 to 1.84 t/mi3 (860 �g/m3 to 400 �g/m3).30
The meteorologist taking the measurements attributedthe drop to greatly reduced economic activity (evidencedby lower amounts of bituminous coal mined), actions byhealth groups to control smoke, and differences inweather. By the last full year reported (1936), annuallevels had fallen to 290 �g/m3.30 The highest of twomonths reported in 1939 was 170 �g/m3. Whatever therelationship was to actual mass, these data indicate thatsmoke continued to decline throughout the Depression.
The major breakthrough in smoke management re-sulted from the work of Raymond Tucker, a mechanicalengineering professor from Washington University of St.Louis. With an assignment to “clarify the air” in St. Louis,he worked between 1934 and 1940 on the alternativestrategy of regulating the fuel instead of the smoke. Initial“coal washing” rules reduced ash and sulfur but resultedin modest improvements in smoke.20 Tucker recognizedthat residential smoky coal, not just industry, was animportant part of the problem, and he advocated elimi-nating the use of bituminous coal.20 He also recognizedthat the shift would reduce sulfur dioxide (SO2) as well.Aided by a 2-week newspaper campaign in November1939 and one of the worst smoke episodes in St. Louishistory on November 28, 1939 (midnight at noon andnear zero visibility31), Tucker and a committee developeda regulation that would require consumers of high-vola-tility coal to use mechanical stokers or switch to smoke-less fuel. After the regulation was passed in 1940, the nextwinter brought a sharp contrast between the clean air of
St. Louis and smoke across the river in Illinois.20 Im-pressed by this achievement, citizenry and communityleaders in Pittsburgh united against increasing smokefrom rising steel production (Figure 4) and passed a sim-ilar ordinance in 1941.32 Although implementation wasdelayed by the war, civic leaders, the press, and industryworked to develop a program that took effect in 1946–1947.32 Figure 4 illustrates the dramatic improvementfrom the late 1940s on, putting an end to two centuries ofmisery in the Smoky City. Other cities, such as Cincinnatiand Milwaukee, eventually followed suit, but they had toovercome organized opposition from the coal industry.20
The viability of these regulations was enhanced bypipelines that increased access to affordable natural gas,and most consumers preferred gas to coal. Air in othercities, like Kansas City, benefited from ongoing consumerand economic choices to switch fuels.22 Other energyshifts also reduced urban smoke. Through the mid-1940s,a substantial amount of coal was used for transport insteam locomotives and water traffic. Electrification of ur-ban railroads in some urban areas and increasing use ofdiesel- and gasoline-powered vehicles greatly decreasedcoal smoke emissions from transport to negligibleamounts by 1955.33 Urban industry, elevator operators,and others also increasingly switched from direct coal useto more convenient and locally clean electric power, or tooil or natural gas. All of these shifts, which largely oc-curred at ground level, should have been particularly ef-fective in reducing urban population exposures to smoke(and sulfur oxides [SOx]) emissions. Coal was increasinglyused in power plants with efficient combustors and con-trol devices, minimizing direct particle emissions withhigher release points that further reduced local exposures.Some of these shifts were for efficiency and economicreasons,28 but others were driven by concern over smokeemissions.
Several essays and books have been written about thelegal, policy, societal, cultural, and technical aspects ofthe crusade against smoke in the United States andabroad.11,20,22,24,32,34–38 The following science and policyobservations on this period are based on their findings inlight of current knowledge.
(1) Several authors11,22 concluded that the smokeabatement movement was a failure, as evidencedby the lingering problems through the 1940s. Butas Stradling20 points out, the evidence suggeststhat early smoke programs brought some reduc-tions or held things in check, with the notableexception of World War I. Yet bituminous coaluse grew from 111 million t in 1890 to 556 mil-lion t by 1918, a 500% increase. The pressurefrom the early advocates and the efforts of thesmoke inspectors may have averted a more press-ing environmental disaster.20 In Pittsburgh, over-all dust fall did not decrease between 1912 and1923, but the tar content was reduced. This isconsistent with the increasing application of im-proved combustion approaches, which would beexpected to reduce the organic fraction of PM.This fraction contains polycyclic organics andother combustion products generally consideredto be more toxic than carbon cinders or ash.
Figure 4. Number of hours each year during which heavy smoke wasrecorded in Pittsburgh, 1895–1960.23 The low levels before 1898 wereat the end of a 5-yr period in which Pittsburgh had switched to homesand industry to natural gas. The “return to coal” brought back thesmoke, but the hiatus and return apparently changed the public per-ception and tolerance of the nuisance.24,44 Reductions and increasesthereafter are related to economic conditions that affected output andthe influence of smoke control programs.
Bachmann
Volume 57 June 2007 Journal of the Air & Waste Management Association 657

Although not measured, improved combustionshould also have reduced CO.
(2) The fact that the United States failed to addressthe pervasive smoke problem for decades is worthexploring. Morag-Levine11 addresses the failure ofnuisance law and the courts. The burden of proofin winning a nuisance suit is high enough with asingle source; when the nuisance consists ofmany emitters in an industrial city, it is difficultto show how a single entity adds detectableamounts. The courts long shared the prevailingattitude of many municipal governmental au-thorities that the smoke nuisance was the un-avoidable consequence of progress. This attitudewas evidenced in a Depression era decisionagainst a request to enjoin mounds of burningmine wastes:
“Much of our economic distress is becauseof the fact that there is not enough smokein Pittsburgh . . . The metropolis thatearned the sobriquet of the ”smoky city“has not been living up to those vaporouslaurels.”39
Although largely ignored in early smoke pro-grams, SO2 damage to vegetation from isolatedsmelters sparked both study and “successful” nui-sance lawsuits,12 including the notorious case ofthe Ducktown, TN, copper smelter. After thesmelter built tall stacks to avoid damage pay-ments to local farmers, substantial quantities ofSO2 crossed state lines into Georgia, damagingcrops and forests. Georgia brought suit in a caseultimately decided by the U.S. Supreme Court in1907 (Georgia vs. Tennessee Copper, 1907).
(3) The failure of municipalities to respond to thecitizenry regarding pervasive smoke is notablewhen contrasted with their response to contami-nated drinking water and sewage waste, whichwere addressed between 1850 and 1930.40,41
These programs cost municipalities substantialsums. In this case, evidence linking contamina-tion of these amenities and the spread of diseases,such as cholera and dysentery, in crowded citieswas apparent to both the citizenry and govern-ments. It was clear that the lack of these serviceslimited the economic vitality of the industrialcity, prompting leaders to respond quickly.
This was not the case for smoke. Despite the pre-vailing medical opinion and the claims of activ-ists, the case for health effects of smoke rested onlimited research and conjecture. Efforts by theMellon study group26,42 to examine health ef-fects, for example between “smoky” and “non-smoky” cities, produced equivocal results, as didthe accompanying review of the literature.24,43
Mellon study director John O’Connor wrote aletter to the editor of the Pittsburgh Sun that noted“indirect effects” on health and agreed with theSun editorial that stated:
“. . . those who favor smoke abatementdo not need the bugaboo of health tobolster up their case. The fact that Pitts-burgh is taxed $10,000,000 a year be-cause of the smoke nuisance is sufficientargument.”24
Municipalities were less likely to take the costlysteps needed to address what could be characterizedas a largely esthetic issue, however severe.
Given what we now know about the health effectsof high concentrations of suspended particles andSOx in London and New York, it is surprising thatU.S. research efforts through the 1930s were unableto reach more definitive conclusions about adversehealth effects. Two factors likely contributed:
• With no reliable routine measure of populationexposure to smoke, much less to other air pollut-ants, it was not possible to make realistic linkagesbetween air pollutants and health either acrosscities or from day to day. The Mellon review43 didfind reports of associations between urban fogs(e.g., London) and increased deaths, as well ashigher death rates in cities compared with non-urban areas, but this did not conclusively impli-cate air pollution.44
• The likely signal-to-noise ratio of air pollutioneffects was low. Death rates in the 1900s weremuch higher than today, and the leading causewas infectious disease, especially pneumonia andtuberculosis.45 Because fewer Americans smokedin 1900 and life expectancy was low, the cohortof people at highest risk of mortality from parti-cles (�65 yr with cardiovascular disease) was one-third of its present fraction of the population.46 Itwould take a rare, extreme event to detect an airpollution effect.
(4) The lack of routine air quality monitoring alsomade it difficult to provide objective evidenceabout the effectiveness of emissions reductions,both within and between cities. This slowed thetransfer of information about what worked andwhat did not. The lack of research and normativeobjectives allowed opponents to challenge con-cerns that the “nuisance” was also a pressing pub-lic health menace. Battles over these issues wererepeated in different cities and times. Morag-Le-vine11 suggests that the very nature of Americanlaw and governance prevented the “feasible tech-nology” approach that she argues (without com-parative measurements)47 improved air quality inGerman industrial cities long before improve-ments in the United States.
(5) It is regrettable that the federal governmentplayed no significant role, although the federallead on air pollution (Bureau of Mines) did someuseful research on improved coal combustion andthe Public Health Service and others sponsoredsome air pollution survey work. The Bureau ofMines, however, also dismissed prematurely therisks of adding lead (Pb) to gasoline based on
Bachmann
658 Journal of the Air & Waste Management Association Volume 57 June 2007

preliminary results of animal research in 1926.38
The disparate and underfunded municipal smokeabatement programs could not be expected toindependently to develop and implement coordi-nated strategies that might have accelerated themove to cleaner fuels and alternative uses of coalsuch as electricity and gasification. (The latter wasseriously explored in Pittsburgh after a brief pe-riod in 1887–1892, during which natural gas wasthe major fuel.)24 From its inception, the SmokePrevention Association (A&WMA predecessor)enhanced information sharing and standardiza-tion among municipal smoke engineers, therebycontributing to faster dissemination of improvedcombustion and dust control technologies.20
However, Stradling20 argues that the organiza-tion’s increasing focus on technical aspects ofimproving coal combustion and dust control re-inforced the presumption that the use of bitumi-nous coal as a primary fuel must continue. Thisprecluded an early, active consideration of thestrategies—electrification and alternative fuels—that provided a lasting solution to smoke onlydecades later.
(6) Additional research might also have explored andexpanded the evidence that led Mellon Instituteair pollution director Herbert Meller to concludethat much more attention should be paid to in-visible gaseous pollutants such as SO2 and CO.24
As noted above, improved combustion did littleto reduce SO2 emissions. Meller24 developed aresearch agenda on the concept of “hygienicallypure air” analogous to goals for drinking water orfood. He believed that protective ambient limitscould be set for various air contaminants. ButMellon funds were drying up during the Depres-sion, and he was unable persuade the U.S. PublicHealth Service (PHS) or others to support his vi-sion. Uekoetter38 notes how the prevailing atti-tudes of the era tended to “legitimate the leth-argy” of researchers and public officials regardingair pollution.
(7) The smoke experience also provides several exam-ples that support the suggestion by Brimble-come35 and Davidson23 that an increase in publicawareness and concern often accompanies a sud-den and perceptible degradation of air quality. AsGugliotta24 and Davidson23 suggest, this was cer-tainly the case for Pittsburgh after the end of thebrief period of clean skies (1884–1992), duringwhich the city was fueled by a local natural gasfield. In the minds of the townspeople, that pe-riod broke the necessary connection betweensmoke and industry.24
Citizens and the press in both St. Louis and Pitts-burgh were motivated by perceptible increases insmoke just before World War II. Their increasedconcern undoubtedly helped spur the adoption ofeffective rules. Other examples of community re-sponses to notable changes in air pollution that
spurred action came just a few years later, as sum-marized in the following section.
More than Meets the Eye: a New Sense of Urgency. Towardthe end of the 1900–1950s era, two unrelated develop-ments changed the course of air pollution control in theUnited States. In 1948, as Pittsburgh was enjoying dra-matic improvements from its smoke program, just 29 kmaway the small industrial community of Donora experi-enced an air pollution disaster that could not be ascribedsolely to smoke. An unusual meteorological inversion re-sulted in a 4-day buildup of fog, PM, and SOx from steeland zinc smelters and sulfuric acid plant emissions. Dur-ing the episode, 20 people died, and 6000 people (approx-imately 43% of the total Donora population) sufferedrespiratory problems described as “a gasping for air andcomplaints of unbearable chest pains.”48 The Donorastory made national headlines, as did a study of the epi-sode by PHS.49 As the first New York Times story on Do-nora noted, this episode appeared similar to an incidentin the industrial Meuse Valley of Belgium in 1930, inwhich 68 deaths were attributed to air pollution.48,50
The New York Times article on the PHS Donora reportbegan: “Air pollution as a major national health problemwas made the subject today of a 173 page report by thePublic Health Service.”48 A PHS spokesman said the Do-nora report proved “for the first time that air contamina-tion in an industrial community can actually cause acutedisabling diseases.” The U.S. Surgeon General “said thereshould be immediate research both into air pollution perse and the effect of polluted air in shutting out healthfulrays of the sun. He reported that he was asking Congresstoday for $250,000 as an added appropriation for thiswork.”48 The article accurately conveyed the report’s find-ing that no single pollutant was responsible, with the“smog cases” likely attributed to a combination of con-taminants. Nevertheless, “sulfur dioxide was listed as thechief culprit.”48 The report itself estimated that SO2 andparticulate matter (PM) levels likely reached 1800 �g/m3
and 5300 �g/m3 respectively.49
The times were indeed changing. Not only did theword “smoke” not appear in the story, but one of thepollutant gases was prominently featured. The federalinvolvement was immediate and prominent, and the PHSwas established as the lead federal agency. Most signifi-cantly, the message that air pollution was a national pub-lic health problem was now clear. Whereas Stern25 notedthat people soon forgot the episode, such a convincingdemonstration of a link between air quality and severehealth effects on American soil helped to galvanize na-tional support for long-range efforts needed to addressnot just “smoke”, but “air pollution.”
The second transforming development was the unex-plained occurrence of eye-burning smog events beginningin 1943 in Los Angeles, one of the major urban areas thatused virtually no coal. Although it is called smog, it con-sisted neither of smoke nor fog, and it turned out to be anew form of air pollution that appeared as widespreadhaze that burned the eyes. Analyses of Los Angeles Inter-national Airport visibility data suggested that althougheye irritation became noticeable in 1943, the haze in thebasin had been worsening for some time. Even in the
Bachmann
Volume 57 June 2007 Journal of the Air & Waste Management Association 659

1930s, visual ranges above 20 km were rare in the summerand early fall,51 which we now recognize as the peakseason for smog formation.
Seeking expert advice, in 1946 the Los Angeles Timeshired Raymond Tucker, recognized for his work in St.Louis, to study the problem and recommend solutions.Tucker’s recommendations20,52 focused on banning obvi-ous sources of PM and SOx emissions such as incineratorsand fires at waste dumps, monitoring industrial emis-sions, and penalizing diesel truck drivers with smokyemissions. In 1947, California passed the first statewidelegislation authorizing county air pollution regulationsfor anything other than smoke, and Los Angeles Countyimmediately formed an Air Pollution Control District. Butthere was no “silver bullet” strategy, as was the case forsmoke in St. Louis. When the kinds of sensible measuresTucker recommended20,52 were later adopted, dust fallwas reduced, but the controls failed to address the mainsources of the smog problem. In addition to initial regu-latory activities, the city, industry, and the state mountedresearch and monitoring programs to better understandthe nature, sources, and effects of smog. In this case,officials perceived the sudden and growing eye-stingingsmog episodes as an economic threat to an area whosegrowth in part depended on the attraction of its warm,sunny skies to health seekers.52
Both the Donora disaster and Los Angeles smog prob-lems gave national attention to the seriousness of airpollution. In late 1949, acting on a request led by theBureau of Mines, President Truman asked the Secretary ofthe Interior to head a federal committee to organize theFirst U.S. Technical Conference on Air Pollution, whichwas held in Washington, DC, in May 1950.25 The letter,however, stressed that any federal efforts were to be lim-ited to assessment and resources “since the responsibili-ties for corrective action and the benefits are primarilylocal in character”.53 It would be more than a decadebefore federal involvement moved beyond communitysupport and research.
Part II: Building the Foundations of AQM(1950–1960)
In 1950, reflecting the new priorities in the field, the SmokePrevention Association changed its name to the Air Pollu-tion and Smoke Prevention Association. In 1952, it becamethe Air Pollution Control Association. This was an eventfulyear for air pollution. After moderate progress in New YorkCity and continuing newspaper stories and citizen com-plaints critical of the city’s Smoke Bureau, New York createda new Department of Air Pollution Control, with a directorwho had medical instead of combustion engineering cre-dentials.54 With the influence of coal smoke waning andnew concerns over public health and invisible pollutants,the transition in New York, in other cities, and at the federallevel elevated the importance of health professionals in airpollution control programs.20
By 1950, Professor Arie Haagen-Smit of the CaliforniaInstitute of Technology had identified O3 as a major com-ponent of the smog that caused respiratory problems anddamaged vegetation and rubber.55 In 1952, his smogchamber studies found the source of the problem—byinjecting and irradiating samples of refinery emissions
and auto exhaust, Haagen-Smit could produce high levelsof O3.56 Mixing O3 with gasoline fumes produced alde-hydes and other compounds that were responsible for eyeirritation. The emergence of smog in California couldnow be related to the rapid growth of population, vehiclemiles traveled,57 and stationary sources of invisible fumes,all in a basin where the prevailing meteorology was con-ducive to trapping and transforming the emissions in theabundant California sunshine. It would be some time,however, before a consensus was reached on controllingautomotive emissions.
Near the end of 1952, (December 5–12), the worst airpollution disaster on record occurred in London, En-gland. Initially, heavy fog obliterated visibility, causingtraffic accidents and canceling events, but eventually of-ficial reports noted crowded hospitals and increased mor-tality.58,59 A year later, a report set the number of deathsat approximately 4000 (today estimates of the totals are asmuch as three times higher). This not only cemented therelationship between pollution and health, but also re-sulted in a substantial increase in research and monitor-ing, both in the United States and in Europe. The resultsof the British research, in particular, would form much ofthe basis for the first U.S. NAAQS for PM and SO2 in1971.60,61
In 1954, responding to a request from SenatorsThomas Kuchel (California) and Homer Capehart (Indi-ana), President Eisenhower asked the Secretary of Health,Education, and Welfare (HEW) to lead an interdepart-mental committee on Community Air Pollution.53 Thecommittee recommended a federal program of researchand technical assistance that was later enacted as the AirPollution Control Act of 1955.25 The one-and-a-half-pagelaw authorized the Secretary of HEW to fund federal re-search and to assist states and educational institutions intraining personnel and carrying out research. The effortwas to be led by the research-oriented PHS, which hadalready begun sponsoring such activities. In addition torecognizing the dangers of air pollution, the law statedthe policy of Congress to “preserve and protect the pri-mary responsibility and rights of the states and local gov-ernments in controlling air pollution. . . ” The bill autho-rized $5 million/yr for 5 yr, but only $16.5 million of theauthorized $25 million was actually appropriated duringthe period.53 The law was extended in 1959, and in 1962 adirective to study motor vehicle exhaust was included.25
Meanwhile, regulation and control of air pollutionwas continued by municipalities and the State of Califor-nia. In the East, the continuing transition to cleaner fuelsand power, aided by continuing municipal programs toregulate stationary sources, resulted in reductions in bothPM and SOx in the central portions of formerly smokycities. The PHS National Air Sampling Network (NASN),with the help of local authorities, began measuring parti-cles and chemical components in 1953 with high-volumesamplers in 17 communities.62 Later reconfigured and ex-panded to additional locations and to include gases, NASNbegan to provide objective information about trends inthese air pollutants. The Los Angeles Air Pollution ControlDistrict (LAPCD) began to act on the Haagen-Smit find-ings, starting with controlling hydrocarbon emissionsfrom industrial gasoline storage tanks in 1953.63 At the
Bachmann
660 Journal of the Air & Waste Management Association Volume 57 June 2007

end of the decade, the LAPCD limited the amount ofreactive olefins in gasoline.64
In 1954, Los Angeles experienced several severe pho-tochemical smog episodes, which prompted concernsabout possible serious health consequences, particularlyin light of the recent Donora and London disasters.65,66 In1955, LAPCD established an ambient monitoring-basedalert system with three graduated levels (Table 2): (1) aninitial warning, (2) curtailment of certain emissionssources, and (3) emergency actions.66 At the time the alertlevels were developed, the scientific literature containedseveral published occupational studies of O3 and someanimal toxicology, but very little else,67 forcing policychoices with limited information. The emergency episodealert and management system approach was an importantinnovation that was later made part of the CAA andremains in use today. Ironically, the initial year markedthe highest level of O3 ever recorded in Los Angeles (0.68ppm). In 1956, the network expanded to 15 sites, andresearchers used the information to develop the first com-munity health studies of photochemical air pollution.The results of their research formed much of the basis forthe first national photochemical oxidant standards in1971.67
Setting episode criteria levels to prevent significantharm begs the question for both policymakers and thepublic at large of what levels might represent clean air.The industrial hygiene community was familiar with theuse of the so-called ‘“threshold limit values” and “maxi-mum allowable concentrations” for various substances inoccupational settings.66 As California State Department ofPublic Health researcher John Goldsmith wrote, such lim-its “are neither really thresholds, nor allowable.”65,66
Their origin and purpose (a guide to limit exposures formost healthy adult workers) make them ill-suited for theapplication of protecting the general population fromambient air pollution. Nevertheless, as Meller had realizedin 1933,24,68 California policy makers and health officialsconcluded that establishing limits for ambient air wouldprovide a useful target for air pollution control programs.In 1959, then-California Governor Edmund “Pat” Browntook the position that such standards must be set beforecontrol programs for automobiles were established.69 Inthat same year, the legislature passed a law instructing theCalifornia Department of Health (CDH) “to develop and
publish” standards for the quality of California’s air, andthe department followed with the first state ambient airquality standards for several pollutants. Separate legisla-tion required the CDH to establish maximum allowablestandards for motor vehicle emissions.
The CDH, unlike with later ambient standards, didnot define a protective level, but instead concentrations itjudged to be associated with three standards of harm—adverse, serious, and emergency (see Table 3 summary),following the approach but not the conclusions of theLAPCD. The CDH listing of standards66 included briefsummaries of the studies that provided their basis, or inthe case of pollutants for which they judged sufficientevidence was not available, a mention of suggestive evi-dence or evidence of absence. Plant damage and/or visi-bility featured prominently as the basis for adverse levels.The “basis” summary listed only two O3 health studies,and CDH found no direct health basis for standards. Yetseveral additional occupational and other studies existedat that time.67 One might understand if the more aggres-sive LAPCD, which had set alert levels for O3 as well asnitrogen dioxide (NO2), felt undercut by the state experts.The CDH also moved on its mandate to develop automo-bile exhaust emissions standards, using roll-back model-ing of projected air quality in 1970 to estimate whatautomotive reductions might be needed to meet tighterair quality standards.66
California and some members of Congress wanted topush the auto industry to develop and install emissioncontrols. After more aggressive legislation was defeated, inpart because of PHS objections to national regulations,Congress in 1960 enacted legislation requiring the PHS toreport to Congress on motor vehicles, air pollution, andhealth.53 Although reorganizing to form a Division of AirPollution in 1960, the PHS saw itself as a resource and
Table 2. Alert stages for toxic air pollutants in Los Angeles (1955).66
In ppm of air
GasFirstAlerta Second Alertb
ThirdAlertc
CO 100/hr 100/2 hr —200/0.5 hr 200/hr 200/2 hr
300/10 min 300/20 min 300/hrNOx 3 5 10SOx 3 5 10O3 0.5 1 1.5
Notes: aStill safe but approaching level where preventative action is required.bA health menace exists at a preliminary stage. cA dangerous health menaceexists.
Table 3. Table of Standards for Ambient Air Quality in California (1959)(after Stern, 1962, Table XVII).66
Pollutant
�Adverse� Level (level at which there willbe sensory irritation, damage to
vegetation, reduction in visibility, orsimilar effects)
Oxidant �Oxidant Index�: 0.15 ppm/hr by the potassiumiodide method (eye irritation, plant damage,and visibility impaction)
O3
NO2
HCPhotochemical aerosolsCarcinogens Not applicableSO2 1 ppm/hr, or 0.3 ppm/8 h (plant damage)a
Sulfuric acid Footnote references to toxicology resultsCO Not applicableb
Pb Not applicableEthylene Footnote indicates standard expected in 1 yrPM Sufficient to reduce visibility to less than
approximately 4.82 km when relativehumidity is less than 70%
Notes: aSerious level: 5 ppm for 1 h (bronchoconstriction in human subjects).Emergency level: 10 ppm for 1 h (severe distress in human subjects).bSerious level: 30 ppm for 8 h or 120 ppm for 1 h (interference with oxygentransport by blood).
Bachmann
Volume 57 June 2007 Journal of the Air & Waste Management Association 661

research organization and “neither sought nor wanted”authority to control pollution.53
Part III: The Race to the Top (1961–1970)The 1960s were a time of major social, political, andcultural change in America. These societal developmentsalso had a profound influence on public perception ofenvironmental issues, specifically air pollution, as grow-ing problems. At the beginning of the decade, federalinvolvement was limited to a modest contribution toresearch, monitoring, and state assistance, whereas mu-nicipalities had the primary responsibility for controllingair pollution. The combined response was limited anduneven. The Division of Air Pollution in the PHS had 251employees and a budget of about $4 million in 1960.70
Close to 60% of the $10 million spent by all state andlocal air programs was in California. By the end of thedecade, federal legislation and a new agency would set theagenda, with national regulations for air quality, mobilesources, and some stationary sources. The primary re-sponsibility for implementing this agenda would shiftfrom municipalities to the states: 84 municipalities butonly 8 states had authorized air pollution programs in1960.25 By 1970, all 50 states had programs.
Federal Legislation—Round 1. In 1962, national awarenessabout the environment was raised by Rachel Carson’sSilent Spring,71 which was the subject of a CBS specialreport the following year. In December, the Second Na-tional Conference on Air Pollution25 garnered some at-tention for the issue in the United States, just as anotherair pollution episode was under way in London. AlthoughBritish programs had reduced coal smoke, an estimated850 people died in this event.61
President Johnson agreed to support the HEW’s ad-vocacy of an expanded federal role in air pollution. Sen-ator Edmund Muskie (Maine) and Congressman KennethRoberts (Alabama) worked closely during hearings andinto conference to craft the final legislation, which wassigned by President Johnson in December as “The CleanAir Act of 1963” (Table 4). The key innovation, termed the“Abatement Conference,” was a complex multistage pro-cess that maintained the primacy of state and local au-thority over air pollution control. It contained no ambi-ent or emissions standard requirements, and generallymade HEW participation contingent on a request fromthe state, with the exception of interstate air pollution.
The law’s use of “criteria” to mean a summary of therelationship between air pollutant levels and effects onthe “health or welfare of persons” was not widespread atthe time. As noted above, the CDH called its sciencesummary “the basis” for the California ambient stan-dards. Stern later cited the 1961 CDH report, which con-tained a 53-item cause and effect tabulation for SOx, as anexample of air pollution criteria.66 The difference betweenwhat is meant by “air quality criteria” and “air qualitystandards” apparently led to confusion in the PHS andlater in Congressional hearings. With no deadlines orspecific mandates, the PHS produced only one set of cri-teria pursuant to the 1963 CAA, for SOx in 1967. It in-cluded 79 cause-and-effect statements, but also contained
a table of alternatives with ranges of concentrations that“can be collectively utilized as criteria of acceptable airquality.”66 Today, this table looks more like modern EPAstaff paper (SP) recommendations for air quality standardsrather than air quality criteria. For example, the summarytable listed 24-hr SO2 ranges of 0.05–0.08 ppm maximumand 1 hr of 0.04–0.06 ppm. As a comparison, the current24-hr SO2 NAAQS is 0.14 ppm, second maximum. It is notsurprising that Congress heard substantial criticism of thefirst PHS criteria document (CD).72
The omission of federal regulations or authority toaddress mobile sources seems glaring. California had al-ready adopted two sets of standards (positive crankcaseventilation [PCV] beginning with 1963 models cars andtailpipe limits with 1966 models sold in California). Automanufacturers began including PCV devices on a volun-tary basis nationwide by 1963.73 Congress held multiplepublic hearings on the issue and in 1965 passed the MotorVehicle Air Pollution Control Act (Table 4). It allowed theHEW Secretary to set emissions limits for new motorvehicles, but with no deadlines.25
Meanwhile, states and municipalities showed littleenthusiasm for the abatement procedure authorized un-der the 1963 law.25 By late 1967, HEW had no requests forintrastate pollution abatement and only three requests forfederal intervention in interstate pollution abatement.Stern25 concludes that “very little air pollution abatementwas actually accomplished by these procedures.” By 1966,53 cities had limits on PM emissions from combustion, 15cities regulated PM from sources other than combustion,and only 6 cities had regulations on the sulfur content offuel. Ten states had set air quality standards for one (usu-ally total suspended particles [TSP]) or more substances.Advocates in Congress and the Administration began toconclude that something stronger was needed.
By the mid-1960s, there was sufficient nationwideambient air quality data to evaluate ambient concentra-tions and trends. TSPs had dropped from the mid-1950s,62
but composite averages (95 sites) remained approximately100 �g/m3 annual geometric mean for 1960–1965 withindividual city averages ranging up to approximately 200�g/m3.60 SO2 levels began to decline, with compositeannual averages (32 sites) near 0.02 ppm in 1965.61 Butpeak 24-hr values ranged between 0.18 and 0.74 ppm infive eastern cities. Annual NO2 levels were between 0.03and 0.04 ppm in six eastern urban areas and 0.05 ppm inLos Angeles74 The ninth-percentile 8-hr CO levels (1962–1967) ranged from 18 to 27 ppm for five eastern cities andwere 27 and 29 ppm for Los Angeles and Denver, respec-tively.75 The number of days with at least 1 hr above 0.10ppm oxidant (buffered KI method) ranged between ap-proximately 10 and 52 in five eastern cities and approxi-mately half of all days with measurements in two South-ern California sites.66 Growing levels of CO and NO2 ledsome states in the Northeast to consider whether to fol-low California’s lead on automotive standards.76
Unless one lived in an area with established air qual-ity norms, it may have been hard to grasp the meaning ofthese ambient numbers. People depended in part on theirown senses, and in part on accounts in the press relayingannouncements of periodic alerts, as in Los Angeles. NewYork experienced periodic episodes of highly visible smog
Bachmann
662 Journal of the Air & Waste Management Association Volume 57 June 2007

in 1962 and 1963. State officials in New York and New Jerseydeveloped and expanded the episode alert and mitigationsystem adopted in Los Angeles. In 1965, the New York StateAir Pollution Control Board required that the New York Cityagency expand the network to five locations. A warning
system was in place for one of the more remarkable episodesof the decade during Thanksgiving 1966.77
Because of widespread stagnation conditions in theEast during late November 1966, high PM, CO, SO2, andNO2 levels were recorded in New York and other cities on
Table 4. Key federal legislation.25,53,82
Title Overview of Major ProvisionsKey Provisions Related to Air Quality
Standards
The Clean Air Act of 1963 Authorized the DHEW (PHS) to expand its research program,provide grants to states and local air control agenciescovering over half the cost of developing or improvingprograms, and to conduct studies on air problems ofinterstate or nationwide significance. Section 5established a Federal role in control actions whereby theHEW Secretary—on his own or at the request of state orlocal officials—could initiate a conference procedure toabate interstate pollution. Authorized $65 million over 3yr. Required semiannual reports on motor vehicleemissions and established a technical committee toevaluate progress.
Section 103 Authorized DHEW/PHS to �compileand publish criteria� on the effects of problemair pollutants.
The Motor Vehicle Control Act (1965) Authorized DHEW to set �practicable� emissions standardsfor new motor vehicles, but established no deadlines.Added provisions for abatement of international pollutionbetween the United States and Canada and Mexico, andauthorized additional research for SO2 and motor vehicleemissions
None
The Clean Air Act Amendments of 1966 Extended the 1963 law. Added authority for grants tomaintain (not just develop) state and local programs.Authorized $55.5 million for 2 yr
None
The Air Quality Act of 1967 Established an AQM approach, with required actions bystates and increased Federal role in establishing AQCRs,criteria for ambient state standards, review of statestandards and control plans, and authority to step in ifstates failed to develop standards or plans or failed toenforce violations. HEW also given authority to seekimmediate court action to stop emissions in episodeswhere there is �imminent and substantial endangerment’to the health. Abatement conference process wasmaintained until new AQM approach was implemented.Authorized HEW to establish a fuel additive registrationprogram and grants to states for motor vehicleinspection programs. Preempted state regulation of newautomobile emissions except for California.
Required HEW to develop air quality criteria forparticular pollutants that describe the effectson health and welfare of varyingconcentrations of each pollutant orcombinations. They must be reviewed byother agencies and advisory committeesrequired by the law. More specifically, the lawrequired reconsideration of the 1967 HEW SOx
criteria.
The Clean Air Act Amendments of 1970 Established the fundamental structure of current U.S. airquality management (see Figure 2). EPA establishesNAAQS, provides guidance to states on implementation;States have primary responsibility to develop SIPs toattain and maintain the standards by specified dates,(3–5 yr from NAAQS), EPA reviews SIPs, sanctions forfailure to plan or submit an adequate plan. EPA has twoauthorities to regulate stationary sources directly: (1)Section 111—technology-based standards for newsources of �criteria� pollutants; states apply suchtechnologies to existing sources for designated non-criteria pollutants; and (2) Section 112—risk-basedstandards for hazardous air pollutants. New technologyforcing mobile source emissions standards set inlegislation at 90% reduction from 1970 models for HCand CO (1975 model year) and less restrictive NOx limit(1976 model year); procedure to extend deadlines ifneeded. Language indicates need to prevent significantdeterioration with no explicit requirements. Provisions forjudicial review of actions under the law.
S. 108 expanded definition of scientific criteria.S. 109 requires primary (health based) andsecondary (welfare based) NAAQS. RequiresNAAQS within 4 months for five pollutants forwhich criteria existed at enactment;established process for subsequent criteriaand NAAQS and requires periodic review ofestablished criteria and NAAQS.
Bachmann
Volume 57 June 2007 Journal of the Air & Waste Management Association 663

the eastern seaboard, and as far south and west as Chat-tanooga, TN, and Birmingham, AL. The New York-NewJersey area called alerts based on peak levels of PM (mea-sured by a tape transmittance sampler and CO, but notSO2. Warmer temperatures (reduced heating) and switch-ing of electric generators from residual oil to natural gaswere credited with lower SO2 levels than during previousepisodes. Later analyses of health information estimatedapproximately 170 excess deaths in New York City alone.With wide reporting of continuing smog alerts in LosAngeles, and levels in the East high enough to raise mor-tality, it was easy for the public to conclude that thecountry had an air pollution problem.
Federal Regulation—Round 2, an Opportunity Missed. Thethird National Conference on Air Pollution was held inDecember 1966, in part to build public interest and sup-port for a stronger federal role in air pollution controls.78
Vice President Hubert Humphrey, who opened the con-ference, spoke of the need for a regional approach withnationally uniform emissions standards. HEW SecretaryJohn Gardner summary of the Administration’s proposalsmade clear what lessons had been taken from the experi-ence of the 1963 Act:
“Lack of uniform air quality and emissionstandards serves as a deterrent both to statesand communities and to industry. Until stan-dards are devised, many communities will bereluctant to make the investments necessary tocontrol air pollution. And unless the commu-nities within a regional airshed require identi-cal controls from the sources of pollution, theirefforts are likely to be piecemeal and onlypartly effective.”79
At the close of the conference, however, it was clearthe Administration had not coordinated with SenatorMuskie, who said:
“With the exception of moving sources of pol-lution (for example, automobiles), I do not fa-vor fixed national emission standards for indi-vidual sources of pollution. We do neednational ambient air quality criteria, appliedas standards on a regional basis. The FederalGovernment is the logical entity to develop thecriteria, with the cooperation of public andprivate groups.”80
The story of why the Administration believed it couldovercome the opposition of the most powerful environ-mental voice in the Congress is outlined by Jones.53
Given the attention academics have paid to the ad-vantages of an emission- or technology-based approachover a risk-based air management system,11,12 it is surpris-ing not to find more discussion about the point in historyat which these two approaches were openly debated inthe legislative process. The Johnson Administration ar-gued that national standards for major stationary sourceswould avoid placing some industries at a competitive
disadvantage, with less emphasis on the speed of technol-ogy-based standards over those produced under an AQMapproach. Whatever the merits of national emission stan-dards, alone or in combination with ambient standards,Muskie remained opposed.53 He believed variations inlocal conditions would make national limits impossible,without over- or under-controlling in particular areas.The final legislation did not include such a provision.
Here, it appears that the fatal policy flaw was thepresumption by both sides that national emission stan-dards needed to be set at levels to achieve ambient stan-dards everywhere. That conception of emission standardsis not consistent with the core of the “best feasible tech-nology” ideal. As long as the Administration clung to theidea of regional ambient standards as targets to be met inparticular areas, uniform emission standards would haveto be unreasonably stringent to work in every location.Apparently, the thought of a uniform national technolo-gy-based approach, supplemented by more stringent localor state limits, was not acceptable to the Administrationbecause one of its policy goals was to ensure that industryin cleaner areas did not have an advantage over those indirtier areas.
Other factors also contributed to the defeat of uni-form stationary source limits. Many had doubts as towhether even the expanded PHS National Center for AirPollution Control (888 employees and $40 million appro-priation) was up to the task of setting industrial emissionstandards for so many sources.53 Many were disturbed bythe problem of federalism, in this case with the nationalgovernment reaching too far into the roles and responsi-bilities of state and local agencies. Finally, industry cer-tainly had varying opinions on the idea of nationallyuniform standards. In the end, Congress consigned theconcept to a provision requiring a 2-yr study exploringnational emissions standards for moving and stationarysources.81
President Johnson signed the Air Quality Act of 1967in November.25 It established a formal AQM process (Ta-ble 4) patterned after the Water Quality Act of 1965.82 Itrequired actions by HEW that triggered responses by thestates with tight deadlines, but it provided no penaltiesfor states that failed to comply. It also required the devel-opment of national criteria by HEW and regional specificair quality standards set by the states that could varyaccording local conditions and policy. The legislative his-tory of the Act contains a colloquy between NACPA chair-man John Middleton and Senator Muskie on the distinc-tion between criteria and standards. Middleton noted that“air quality standards are essentially an expression of pub-lic policy rather than scientific findings.” Muskie, appar-ently still unclear, summarized by saying “criteria are thetargets” and “standards are the timetable for meetingthem.”83
Federal Legislation—Third Time’s the Charm—or StrikeThree? By this time, the 1960s, were in full swing. Thecivil rights movement was winding down and mass anti-war protests escalated along with the war in Vietnam. Hairhit Broadway with a song called “Air.” In April 1968, theNew Yorker published an in-depth article summarizingboth the expanding results and practice of air pollution
Bachmann
664 Journal of the Air & Waste Management Association Volume 57 June 2007
research in the United States and Great Britain.84 Thearticle ends with a quote from a National Air PollutionControl Administration (NAPCA) epidemiologist: “Whatwe do know is that people get killed by air pollution, andI don’t see any excuse for there being enough air pollutionto kill people. Do you?”84 In 1969, Stewart Brand pub-lished an edition of the Whole Earth Catalog featuring aphotograph, taken by astronauts on their way to themoon, of a fragile Earth from space.85 Concern for theenvironment was escalating. Polls were showing a sub-stantial increase in public concern over environmentalissues, with air pollution beginning to appear high on thelists of national issues.53 Politicians, always attuned tosuch shifts, began to take serious notice. Senator GaylordNelson saw a linkage in both the audience and the meth-ods of the student protests against the Vietnam war. Heconceived the idea of a national teach-in on the environ-ment that eventually turned into a coordinated series ofevents held across the country on Earth Day in 1970.86
The nascent environmental movement was so successfulthat some activists became concerned that it would drainenergy from the anti-war effort and other causes.53
President Nixon saw the rising concern about theenvironment as an opportunity, and in 1969 the Admin-istration developed a broad agenda, beginning with thecreation of the CEQ in January 1970. That year, Nixonmade the environment the theme for the domestic por-tion of his State of the Union Address. He accompaniedhis rhetoric with a package of 37 proposals, includinglegislation and administrative moves, relating to multipleaspects of the environment.25,53 One of these led to theformation of EPA late in the year. Another set of proposalswould revise numerous aspects of the less than 3-yr-oldCAA, furthering increasing the role of the federal govern-ment. On the day the proposals were submitted, the pres-ident also announced that HEW was issuing more strin-gent motor vehicle emission standards under its existingauthority.25
With the president calling for fundamental change,the 1967 CAA was officially declared dead before it couldbe implemented. But structural problems in the approachbegan to appear. Neither the federal government nor thestates were equipped to implement the requirements ac-cording to schedule. An obvious problem was that controlactions could be triggered only after HEW issued criteria,and the states, many of which had little experience orexpertise in this area, established ambient standards.HEW was to issue criteria “as soon as possible.” It wasnearly a year later that HEW released the first two—re-vised criteria for SOx and a new document for PM. Thenext three criteria (CO, O3, and hydrocarbons [HC]) werenot scheduled until April 1970, with five more in thefollowing year.60,61,67,74,75,87
As is the case today at EPA, HEW prepared CDs usingin-house experts and outside consultants. The process wasmanaged by the Bureau of Criteria and standards ofNAPCA, headed by Dr. Delbert Barth. The Bureau con-tracted with various experts, including some with experi-ence in the CDH standards process. The 1967 CAA re-quired review and coordination with other agenciesthrough a federal committee as well as a panel of techni-cal experts. The bureau convened the National Air Quality
Criteria Advisory Committee (NAQCAC), a panel consist-ing of experts from academe, industry, and states. Thefederal review was handled through a group of 17 agencyliaisons. Both the development of criteria and establish-ment and execution of the mandated review process tooktime.
The other federal “trigger” for state action, specifica-tion of air quality control regions (AQCRs), also was notmoving quickly. By the end of 1969, only 25 AQCRs hadbeen designated, and an additional 57 were yet to becompleted; accordingly, by the same date, states had sub-mitted regional air quality standards for only 6 AQCRs.Congressional hearings that month highlighted the de-lays and problems, and representative Rogers pressedNAPCA to speed up the process. Chairman John Staggers(West Virginia) later summed up the factors contributingto the lack of progress as follows:
“First, cumbersome and time-consuming pro-cedures called for under the 1967 act; second,inadequate funding on Federal, State, and locallevels; third, scarcity of skilled personnel toenforce control measures; fourth, inadequacy ofavailable test and control technologies; fifth,organizational problems on the Federal levelwhere air pollution control has not been ac-corded a sufficiently high priority, and sixth,last but not least, failure on the part of theNational Air Pollution Control Administrationto demonstrate sufficient aggressiveness in im-plementing present law.”88
Later commentary by state and local air officialswould be even more pointed about the flaws in the frame-work. Victor Sussman, then air director of Pennsylvania,later called the exercise of defining air basins or AQCRs a“pointless charade” that should “soon be forgotten.”10 Healso believed that inadequate emission inventories andlimitations in modeling capability precluded their use indeveloping the kind of location-specific source emissionslimits tied to just attaining state standards. He also viewedthis approach as time consuming and unnecessary, favor-ing the approach of adopting best available control tech-nology (BACT) in areas that violated the standards. Hisrecommendation to apply such uniform limits, latercalled “reasonably available control technology” (RACT),in nonattainment areas before modeling, eventuallyformed the basis of U.S. policy and law.
Denver air director John O’Fallon believed Congressmade a serious mistake in delaying controls by imposingthe resource management process before BAT controls. Heargued that the Act should have called for:
. . . an immediate and direct frontal attack onthe air pollution problem by demanding a re-duction of industrial emissions at the source assoon as possible. National industrial emissionstandards should precede ambient air stan-dards as a logical and necessary prerequisite totheir attainment.9
Bachmann
Volume 57 June 2007 Journal of the Air & Waste Management Association 665

O’Fallon noted two arguments for national emissionstandards. In addition to ensuring equity of control re-quirements across areas, he noted that air pollutantstravel long distances, and eventually emissions in cleanareas could affect problem areas. He also believed Con-gress erred in shifting the focus of air pollution controlfrom the municipalities to the states noting that, in 1967,the cities had far more expertise in the issues.9 The needto create new programs and expertise in the majority ofstates contributed to delays in implementation.
Whether for sound policy reasons or political ones,by 1970 a consensus was developing that the CAA neededto be substantially strengthened. Ironically, SenatorMuskie had introduced a more incremental approach toreauthorizing the CAA, until the president’s proposalsand a blistering critique of the senator’s environmentalcredentials by Ralph Nader’s group in Vanishing Air,which was released in May 1970.89 The book states thatfollowing the signature of the 1967 act:
An enlightened, liberal press paid dutiful hom-age to the handiwork of the Senator fromMaine, calling the Air Quality Act a victory forMuskie and a blueprint for the nation. Ameri-can industry, on the other hand, breathed acollective sigh of relief. . . . 89
Jones53 presents an amusing analysis of the progressof the various versions of clean air legislation in 1970,terming it “speculative augmentation in Washington.”Given the intensity of environmental issues, particularlyafter Earth Day, politicians found themselves in a race tothe top. Each new piece of proposed clean air legislationintroduced that year—from Administration to House toSenate—became “more environmental” than the last.53
No one wanted to appear on the wrong side of this issue.Some legislators, for example Senator Thomas Eagleton(Missouri),88 clearly favored a return to the concept ofuniform national emission standards for stationarysources. The HEW report on the issue81 recommendedNAAQS, with national emissions standards only for newsources and for certain toxic and hazardous air pollutants(HAPs). Congress appeared satisfied with this approach.Support for federal issuance of national, as opposed toregional, ambient air quality standards seemed universal.
The legislative history indicates the most intense dis-cussions were related to automotive emission standards.One intriguing footnote to the development of thosestandards indicated that even these “technology” provi-sions appear to be at least partially based on a consider-ation of impacts relative to ambient health targets. Thelegislative history points to an analysis of the issue by theaforementioned Del Barth and NAPCA staff that was pre-sented at the 1970 Air Pollution Control Association(APCA) meeting.90 These authors used the same forecastand rollback approach followed by the CDH to recom-mend tailpipe emissions limits, beginning with their ownassessment of “desirable” air quality goals based on theCDs, which were 9 ppm for 8-hr CO, 0.06 ppm for 1-hrO3, and 0.1 ppm for 1-hr NO2. This also foreshadowed apossible NAPCA position on what standards for thesepollutants might be. The rollbacks needed to meet these
standards in 1980 resulted in estimated automotive emis-sions reductions of between 80% and 90% from the re-cently proposed 1970 emissions standards. This is in therange adopted in the final legislation.
After resolving differences between the Senate andHouse versions, a process that went well into December,the landmark CAA Amendments were passed, and signedinto law on New Year’s Eve. At that point, EPA was about4 weeks old. The bill covers 63 pages in the conferencereport and is well over double the length of the 1967 Act.Of most importance for this review are the criteria andNAAQS requirements, and aspects of their development.
Specifics of the NAAQS Requirements in the 1970 CAAAmendments. Sections 108 and 109 of the amendmentsgovern the criteria and NAAQS development and reviewprocess. Section 108 specifies development of scientificcriteria, with much of the language drawn from the pre-vious CAA, but with clarification of the process and thecharacteristics of the kinds of pollutants that should beconsidered. It specifies that the administrator publish alist for pollutants: (1) which have an adverse effect onpublic health or welfare; (2) which are derived from nu-merous or diverse mobile or stationary sources; and (3) forwhich criteria had not already been issued before enact-ment. As before,
“the criteria shall accurately reflect the latestscientific knowledge on the kind and extent ofall identifiable effects on public health andwelfare which may be expected from the pres-ence of the pollutant in the ambient air, invarying quantities.”3
The 1970 amendments eliminated requirements forconsultation with advisory committees and federal de-partments for criteria, but not for the associated controltechniques. It called for periodic review and reissuing ofthe criteria and issuance of new or revised criteria andcontrol techniques to be announced in the Federal Registerwith copies for the general public.
Section 109 specified that the EPA administrator pro-pose NAAQS within 30 days of enactment for each pollutantfor which air quality criteria had been issued before enact-ment. After a reasonable period for submission of writtenpublic comments (not longer than 90 days), the administra-tor was required to promulgate each standard, making suchmodifications as appropriate. At the time of enactment,criteria had been issued for five pollutants: PM, SOx, oxi-dants, HC, and CO. Section 109 specified that when criteriaare issued for additional pollutants, the administrator simul-taneously must propose NAAQS and follow the same proce-dures for existing criteria pollutants.
The 1970 CAA specifies two kinds of standards:• Primary NAAQS, “which in the judgment of the
Administrator, based on such criteria and allow-ing an adequate margin of safety, are requisite toprotect the public health.”
• Secondary NAAQS shall specify a level that “inthe judgment of the Administrator, based onsuch criteria, is requisite to protect the publicwelfare from any known or anticipated adverse
Bachmann
666 Journal of the Air & Waste Management Association Volume 57 June 2007

effects associated with the presence of such pol-lutant in the ambient air.”
Perhaps no aspect of this language has drawn moreconfusion, criticism, and commentary than the phrases“margin of safety” and “protect public health.” The orig-inal Senate proposal called for national standards “whichare necessary to protect the health of persons” and na-tional goals, “to protect the public health and welfarefrom any known or anticipated adverse effect.” Healthwas therefore covered by both standards and goals. Theproposal then listed a variety of effects that, in the finallegislation, were included in Section 302(h) as the defini-tion of public welfare. The commentary on the Senateproposal indicates that the standards should consider notonly the science in the air quality criteria, but also theneed for margins of safety to provide “a reasonable degreeof protection” against “hazards which research has notyet identified.” This concept was transferred from similarphrasing that appeared at the very end of the originalCDs. This “margin of safety” requirement was apparentlyimportant enough to put in the statutory language in thefinal version.
The Senate legislative history indicates that “refer-ence should be made to a representative sample of per-sons comprising the sensitive group rather than to a sin-gle person in such a group.”91 It adds that protection issufficient when there is an absence of adverse effects onthe health of a statistically related sample of persons insensitive groups, which essentially means the number ofpeople needed to detect an effect. The ManufacturingChemists Association commented on the statutory lan-guage91 and suggested that the phrase “health of persons”be changed to “public health” in the standards sectionand that “public” be inserted before health and welfare inthe criteria section. They agreed with the concept of pro-tecting sensitive populations but wanted to avoid theimpractical idea of protecting the most sensitive individ-ual. They also suggested the insertion of “adverse” before“effects on public health and welfare” in the goal provi-sion. All of these changes are consistent with the languageincorporated in the final statute.
The language and history do not provide any indica-tion that by using the phrase “margin of safety” Congressbelieved in an effects “threshold” (a term not used in thestatute or legislative history summarized above), as op-posed to the “lowest observed level of effects”88 thatformed the basis of the original criteria. As used in engi-neering, a margin of safety does not imply “zero risk,” assome92 have argued. The original Senate concept of hav-ing a two-stage approach to protecting health through“standards” and “goals” suggests that lawmakers did notexpect the standards to provide complete safety againstall effects or to be risk free. The clarifying additions of“adverse” and “public” in the final statute suggest thatCongress neither wanted to address trivial (nonadverse)effects, nor that standards would protect all Americans,no matter how sensitive. Statements later made by Con-gressional figures in the development of the 1977 CAAAmendments imply that these leaders understood thatthe standards would not provide absolute safety, and thattheir recollection of the terminology used in their 1970legislative history was a bit fuzzy.
Finally, in conference, the Senate dropped the stan-dards and goals in favor of primary and secondary stan-dards for public health and public welfare, respectively. Adistinction between the two was maintained by settingattainment deadlines for primary standards, but none forsecondary standards.
Section 107 places primary responsibility for AQMwith the states. Although it grandfathered prior AQCRs, itmade all non-AQCR areas within a state an AQCR, so thatthe entire state was covered by the NAAQS. The currentapproach of designating “nonattainment areas” was notadded until the 1977 CAA Amendments. Section 110 setsforth requirements for the development, submission, re-view, and approval of the SIPs. SIPs, which were to besubmitted within 9 months of NAAQS promulgation,were required to provide for attainment and maintenanceof the NAAQS, and enforcement of emissions standardsand other measures. Attainment of primary NAAQS wasrequired within 3 yr after EPA approval of the SIP, and forsecondary NAAQS within a “reasonable time.”
Part IV—Evaluating the Pre-NAAQS Era(1900–1970)
In keeping with the spirit of the AQM circle (Figure 2), itis important to provide some evaluation of what washappening in the atmosphere from 1900 to 1970. Thedata available for this purpose are limited in scope andresolution, and subject to substantial uncertainties. Asampling of the information, however, may provideenough of a mosaic to get a “big picture” of where andwhen progress was made over the period.
The earliest periodic measurements were for PM asdust fall, smoke shade, or TSP. We have seen the long-term trend for smoke in Pittsburgh (Figure 4). Figure 5shows available long-term trends for PM by two methodsfor New York. Although it took decades for both cities toimprove, it is clear that Pittsburgh, which started out witha far more serious problem, acted sooner and more deci-sively. Figure 6 depicts TSP trends for 1960–1970 for acomposite of 122 urban areas (mostly center city). As inNew York, the average began to improve in the latter halfof the decade. The composite SO2 maxima for 32 NASNsites suggest that urban SO2 levels began to decline after1966, at an average rate much slower than in New York.
Trends information for metals93 and benzene solubleorganics (BSO)94 show that reduction of PM and SO2
emissions had some additional benefits for urban areas.Between 1960 and 1970, particulate BSO (which containspolycyclic organics among other combustion products)was reduced by 55% at 32 urban sites, with 27 showingstatistically significant trends. The decline was stronglycorrelated with declines in residential coal use. Strikingreductions in northeastern vanadium and, to a lesser ex-tent, nickel between 1969 and 1972 were concurrentwith, and attributable to, reduced fuel sulfur regulations.Fuel oil desulfurization also reduces the content of thesemetals. Urban PM reductions were concurrent with reduc-tions in cadmium, iron, and manganese, but titaniumlevels increased. Composite Pb, associated with auto emis-sions, increased between 1965 and 1968 but by 1973returned to the 1965 levels.
Bachmann
Volume 57 June 2007 Journal of the Air & Waste Management Association 667

Data for the remaining criteria pollutants for thisperiod outside of California are limited to several citiesfrom the HEW “CAMP” network for 1962–1972.95 Theselimited measurements are of uneven quality and show amixture of trends in four eastern cities and Denver. Ni-trogen oxides (NOx) levels increased in all areas, with NO2
flat to increasing. CO (five cities) declined, partly en-hanced by a method change, and oxidant (three cities)increased in Chicago and decreased in Philadelphia andCincinnati.
The highest oxidant/O3 levels were in California.Whereas maximum oxidant levels in Los Angeles fluctu-ated with no clear trend between 1955 and 1972, more
robust statistics began to show a response to control mea-sures in 1960. Box and Tiao63 used intervention analysesto examine the combined impact of the 1960 reduction ofolefin content in gasoline and the opening of a freeway.Using 1955–1972 data, their model found a statistically sig-nificant reduction in the monthly average of peak O3 hourlyvalues after the intervention. They also detected a small butsignificant benefit of the more gradual reductions after the1966 California tailpipe standards. The control strategiesbased on Arie Haagen-Smit’s smog chamber research appar-ently worked in the real world. More generally, in the LosAngeles basin between 1962 and 1971, NO2 trended up-ward, whereas CO levels declined.96
From a national perspective, the air quality measure-ments summarized above are limited in time and space.Most reflect urban center concentrations. Although this isimportant in terms of peak exposures, many people livesome distance from the center of the city or suburbs, andsubstantial gradients in concentrations are likely. Further-more, the most abundant indicator, TSP, does not providea clear distinction between distributions of fine andcoarse particles. Recognizing the strong relationship be-tween PM2.5 and light extinction, EPA and others beganto use airport visual range data as an indicator of long-term fine particle trends in the 1970s.97 Despite somelimitations, seasonal visibility trends in various regions ofthe East still provide semiqualitative perspectives on airpollution patterns and trends beginning in 1948 that arenot available from ambient PM measurements.33
Visibility trends for the eastern seaboard suggest thatwintertime suburban/regional fine particle levels de-creased between 1948 and 1972, as early particle control
Figure 5. Trends in particulate matter in New York City (1930–1976).30,243 New York was described in 1899 as relatively smoke free butdeveloped smoky coal problems by the 1920s. A precipitous drop in PM followed the Depression, but the air in the 1950s was apparently notmuch improved over the 1930s. The levels did not begin to improve until after 1965 and continued thereafter. SO2 levels for 1954–1976 (notshown) actually increased through a peak in 1964, with a citywide annual average of 0.24 ppm.243 After that, SO2 levels declined rapidly through1972 and more gradually thereafter.
Figure 6. Historical trends in TSP concentrations, 1960–1988.244
Urban TSP began a long decline between 1965 and 1982. Thepattern between 1979 and 1982 is affected by a measurementartifact relating to the filter media.245 Little progress is apparent after1982.
Bachmann
668 Journal of the Air & Waste Management Association Volume 57 June 2007

programs were put in place and residential coal combus-tion declined. The rate of improvement was smaller forthe Ohio River valley region with no apparent trend inthe Midwest. But the most striking aspect is the consistentincrease in warm-season fine particles suggested by thedecrease in summer visual range found in all easternregions during this period. This important and apparentlybroad increase in population exposures to fine particlesand reduced visibility are not readily apparent in theoverall center city trends. Trends in seasonal coal usepatterns provide a strong hint as to the cause. In 1951,consumption clearly peaked in the winter with residentialand railroad use, and power generation comprised ap-proximately 25% of the total. By 1974, overall coal con-sumption had increased, but with much less seasonalityand a small summer peak; the power sector consumedmore than 60%.33 Another hint was in a limited datasetfrom urban and nonurban areas, suggesting the sulfate(SO4
�) fraction of TSP was increasing in the 1960s.98
We now know that the reductions in summertimevisibility across the East were strongly related to the in-creased emissions of SOx. The change in national emis-sions of criteria pollutants and their precursors is anotherway of evaluating what was happening in U.S. air pollu-tion. The longest period of record exists for SOx and NOx,estimated from fuel use information for 1900 to 1980(Figure 7). The trends have been broken down by majorsource sectors beginning in 1940 (Figure 8). A number ofsubstantial uncertainties exist in the development ofthese estimates from gross national statistics, but the gen-eral patterns are almost certainly meaningful. The early
record, combined with Figure 3, shows the influence ofoverall economic activity and coal use on SOx and NOx.Volatile organic compound (VOC), NOx, and CO emis-sions from mobile sources increased, with the power sec-tor responsible for increases in SOx after the early 1950s.The increase in all of these gaseous pollutants in the 1960sis also striking.
Although data do not exist for regional air qualitybefore 1970, the visibility patterns and current informa-tion permit some inferences with regard to the 1960s.Fine particle concentrations apparently increasedthroughout the East, particularly during the summer. In-crease in SO4
� and perhaps secondary organics must havebeen at least partly responsible for the lack of consistentTSP trends in nonurban areas.95 Wintertime decreases inprimary emissions of any particle size in urban areaswould be partially offset by increases in summertime sec-ondary fine particles. Whereas the summer increase waslargely because of increased emissions, other factors likelycontributed. Tall stacks reduced local peaks, but as wasknown to Georgia farmers at the turn of the century,dispersed SO2 over a wider area. New electricity genera-tion units were increasingly located in nonurban areas.
The higher SO4� and poorer visibility noted in the
summer late in this period appear disproportionate to themore uniform emissions expected between summer andwinter based on seasonal fuel use.33 This suggests photo-chemical conversion processes were important in the re-gion by the 1960s. By then, regional NOx emissions in theEast reached levels that, in combination with biogenicand anthropogenic VOC, could have produced the kind
Figure 7. Long-term trends in national SOx and NOx emissions.246 Trends in SOx are largely driven by coal combustion, and are qualitativelyconsistent with the coal use data in Figure 4. Other significant sources included smelters and residual oil. The largely monotonic increase in NOx
is related to total fossil fuel combustion, including coal in the early period with the increasing addition of automotive emissions. Emissions of bothpollutants peaked in the mid-1970s.
Bachmann
Volume 57 June 2007 Journal of the Air & Waste Management Association 669

of regional scale O3 episodes observed in the 1980s. Un-fortunately, regional monitoring of O3 was limited until1977.99 As noted above, oxidant levels did exceed the1971 1-hr standard in several eastern cities. As docu-mented later, SOx and NOx emissions during this periodalso were responsible for adverse effects on aquatic andterrestrial ecosystems related to acid deposition, nutrientloadings, and O3 damage.100–104
It has become fashionable in some circles14,28,105,106
to claim that air pollution in the United States used tobe much worse than today and that air contaminantshave been declining ever since we learned how to mea-sure them. Furthermore, it is claimed that state andlocal programs as well as societal shifts were alreadyaddressing the important air quality problems beforethe unnecessary and burdensome intrusion of the fed-eral government into the process.107 Whereas some ofthe specifics of these claims are true, they are half-truths; the environmental record through 1970 doesnot support either their fundamental premise or theirmain conclusions.
The PM and visibility trends show that the com-bined efforts of municipal and state pollution controlprograms and the beneficial changes in societal pat-terns of energy use and transportation reduced urbansmoke through the 1950s. But these factors did notcounter the collective emission pressures related to agrowing population, a growing economy, and othersocietal changes (e.g., the spread of suburbs and thereplacement of urban mass transit with personal auto-mobiles). The fact that the nation was unaware of thesedevelopments and growing problems is largely becauseof the low priority assigned to what was termed a nui-sance until 1949. Once the problem had been defined asa serious threat to health and a worsening eye-burningsmog problem emerged to frighten southern Califor-nians, increased federal and state resources stimulatedthe research and monitoring needed to understand theissues on a national level.
The growth in understanding and air pollution ex-pertise in many municipalities and states between 1955and 1970 was facilitated and later required by federal
Figure 8. Trends in emissions of key criteria pollutants by sector (1940–1997).247 Emissions of all pollutants peaked following passage of the1970 CAA. Requirements for reduced automotive emissions was a major cause of reductions in (c) VOC and (a) CO and the leveling of totalNOx emissions. Reductions or limits in growth of (b) SO2 and (d) NOx came from industrial and power generation sectors. VOC reductionsoccurred in industrial sectors.
Bachmann
670 Journal of the Air & Waste Management Association Volume 57 June 2007

grants, education, and training programs. The in-creased state and local regulatory activities on a na-tional level that resulted in marked declines in urbanSO2 and TSP from 1965 through 1972 were stimulatedin part by federal requirements in the 1963 and 1967legislation. None of this is meant to denigrate the lead-ership, initiative, or efforts and results delivered by thededicated air pollution experts in these agencies. Theprogress municipalities and some states made in smoke,PM, SO2, and O3 through the early 1960s came withoutdirect involvement from a federal government that sawits role limited to research and support. They, alongwith air pollution professionals in and leaders in rele-vant industries, are what make U.S. AQM the obvioussuccess it is today.
From the perspective of the 1960s, California andLos Angeles had the ability and the popular support toaddress the nation’s most difficult air quality problems,but even they, through both state and Congressionalrepresentatives, sought a federal role in air pollutioncontrol and enforcement. Despite programs that im-proved the air of many cities and apparently ended theovert “killer smog” episodes, on a national level airpollution was a growing problem. From what we knownow, it was more widespread and multidimensionalthan was generally realized at the time. Federal regula-tion of growing automobile emissions was an obviouspolicy choice. In the late 1960s, the societal forces (e.g.,increased affluence, increased awareness, improvedtechnology) that some argue would have dealt with airpollution without a federal presence, resulted in thepublic demanding a strong national assault on air pol-lution. They got it.
THE NAAQS (1971–2007)Part I: EPA Meets Statutory Deadlines forSetting NAAQS, Implementation Guidance
(1971–1975)Despite the fact that the EPA was less than a month oldwhen the CAA passed on December 31, 1970, the pro-posed standards for the original six NAAQS pollutantsappeared in the Federal Register on January 30, 1971; thefinal standards and monitoring guidance were publishedon April 30, 1971, meeting the 120-day statutory schedule(Table 5). It can be done, but perhaps only during a muchsimpler era than today.
Supplemental Tables 1 through 7 (http://www.awma.org/journals/pdfs/2007/6/10.3155-1047-3289.57.6.652_supplmaterial.pdf) present a detailed chronology andcommentary on the development of criteria and establish-ing, reviewing, and revising the NAAQS for each of theseven pollutants (i.e., PM, SOx, CO, O3, HC, NOx, and Pb)that were listed and regulated under Sections 108 and 109between 1971 and 2006. These tables constitute the core ofthis NAAQS history. Whereas the chronology tables are or-ganized by pollutant, the discussion here looks across mul-tiple pollutants to examine how NAAQS have been set andreviewed over the years (Table 6), with some discussion ofthe role of the NAAQS and scientific information in imple-menting improved AQM programs.
The original 1971 primary and secondary standards(for TSP, SO2, CO, O3, HC, and NO2) are summarized inTable 5). The four NAAQS components are as follows: (1)indicator—the specific pollutant to be measured (the in-dicator is not necessarily the same as the criteria pollutantclass, e.g., TSP for PM, or SO2 for SOx); (2) level—theconcentration (�g/m3 or ppm); (3) averaging time—thetime period (e.g., annual, 8 hr) associated with the specific
Table 5. 1971 U.S. Primary and secondary NAAQS.a
Pollutant (indicator)b LevelAveraging
Time Formb
PM (TSP) 75 �g/m3 Annual Geometric mean260 �g/m3 24 h Not to be exceeded more than once per year
TSP secondary standard 150 �g/m3 24 h Not to be exceeded more than once per yearSO2 0.03 ppm Annual Arithmetic mean
0.14 ppm 24 h Not to be exceeded more than once per yearSO2 secondary standards 60 �g/m3 Annual Arithmetic mean
(0.02 ppm)1300 �g/m3 3 h Not to be exceeded more than once per year(0.5 ppm)
CO 10 �g/m3 8 h Not to be exceeded more than once per year(9 ppm)40 �g/m3 1 h Not to be exceeded more than once per year(35 ppm)
Photochemical oxidants (as O3) 200 �g/m3 1 h Not to be exceeded more than once per year(0.08 ppm)
HC 160 �g/m3 3 h, 6–9 a.m. Not to be exceeded more than once per year(0.24 ppm)
NO2 100 �g/m3 Annual Arithmetic mean(0.053 ppm)
Notes: aWith the exception of PM and SO2, secondary NAAQS set identical to the primary standards. bThe terms �indicator� and �form� were not used in the 1971notice.
Bachmann
Volume 57 June 2007 Journal of the Air & Waste Management Association 671
level; and (4) form—aspects of statistical measures to beapplied to the level and averaging time. The 1971 stan-dards used a deterministic form, which applies to a par-ticular year as an average or a level not to be exceededmore than once. Later standards adopted statistical formssuch as expected annual mean or 98th percentile 24-hrconcentration averaged over 3 yr. Whereas most atten-tion in standard setting is focused on the level, the rela-tive protection or stringency of the NAAQS depends oneach of the four components. NAAQS also must be ac-companied by a Federal Reference Method, which detailsthe acceptable approaches for monitoring and data han-dling to determine compliance. Because the originalNAAQS were expressed in mass/volume terms, in 1971 alldata were required to be adjusted to standard temperature(25 °C) and sea-level pressure (760 mm Hg).1
The terse Federal Register proposals108,109 provided norationale for the administrator’s provisional decisions onspecific NAAQS or a clear articulation of how they werelinked to the scientific evidence. The final notice1 pro-vided only a brief response to comments that identifiedkey studies and effects for CO and oxidants. SupplementalTables 1–7 illustrate how specific statements in the CDsfor the pollutants appear to be linked to the averagingtimes and levels chosen for the respective standards, butexcept for CO and O3, that is the only guide to the basesfor the decisions.
Even more elusive is the decision-making process it-self. We know key staff involved included Bern Steiger-wald, then head of the EPA air pollution office inDurham, NC, which later became the Office of Air QualityPlanning and Standards (OAQPS); Del Barth, formerlyhead of the NAPCA criteria development group; and EdTuerk, a former deputy to NAPCA commissioner JohnMiddleton. In the month-old agency, the kinds of formalinternal procedures such as project initiation, steeringcommittees, policy office reviews, and clearance require-ments that characterized all subsequent NAAQS actionswere not yet established. After some initial options work,a group met in Washington to discuss specifics for theproposal. The proposed CO and oxidant standards wereidentical to those Del Barth had recommended in his1970 APCA paper,90 but in place of a 1-hr NO2 standard,there was a 24-hr standard and annual standards for NO2.Staff prepared a draft package on the standards for theadministrator, who was briefed on them, as well as thejust completed CD and associated listing decision forNOx, in late January.110 Ruckelshaus111 later recollectedthat the discussion at the briefing was relatively short andthe materials limited.
EPA received relatively few comments on the pro-posed standards and did not hold a public hearing onthem, something that had been required under the 1967CAA for the state standards. Public comment critical ofthe standards resulted a few notable changes. The finaloxidant standard was increased from 125 �g/m3 (0.06ppm) to 160 �g/m3 (0.08 ppm).1 Based on the presumedrelationship between HC and oxidant, this required acorresponding increase in the HC standard. EPA declinedto revise the 8-hr CO standard, but agreed that the evi-dence was uncertain. The proposed 1-hr level was, how-ever, raised from 15 to 40 mg/m3, which was more in line
with the levels in the relevant study in the criteria. Theproposed 24-hr NO2 and SO2 standards were droppedbecause of lack of evidence for that averaging time. Publicrecords indicate that John Middleton briefed Ruckelshauson the NAAQS decision on April 14, 1971.110 The finalstandards, together with necessary FRMs, were issued onApril 30, 1971, accompanied by a press release that in-cluded a synopsis of the administrator’s views.
“These are tough standards,” Ruckelshaus said.“They are based on investigations conducted atthe outer limits of our capability to measure con-nections between levels of pollution and effectson man. In the case of CO, one of the mostimportant automobile pollutants, we have set astandard to protect against effects reported byinvestigations that prompt arguments evenamong our own scientists. In the case of photo-chemical oxidants, also largely contributed to byautomobiles, our standards approach levels thatoccur fairly commonly in nature.
“The legislative history of the CAA makes itplain,” he added, “that when we talk aboutprotecting the ”public health“ against pollutedair, we are talking about protecting those citi-zens who are particularly sensitive to it—inother words, those citizens already afflictedwith cardio-respiratory problems. If we haveerred at all in setting these standards, we haveerred on the side of public health.”112
Although EPA lacked the time or capacity for regulatoryimpact analysis, the administrator was aware that thesestandards would have important consequences. The pressrelease also summarized the difficulties in meeting thesestandards in various areas around the country, noting theimportance of the vehicle emission standards and admittinga dearth of information critical to meeting the oxidant stan-dards, and limitations in the state of current control tech-nologies for NOx and SOx. In the case of PM and SO2,Administrator Ruckelshaus suggested an aggressive versionof the strategy Raymond Tucker had implemented in St.Louis:
“He [Ruckelshaus] said seven metropolitan areasmight have serious trouble meeting the sulfuroxides and particulate standards. . . ‘We esti-mate that to bring air pollution levels down to thestandard for particulates in New York will requirea 300% increase in natural gas usage in the city.The only encouraging feature in the prognosis isthat curing the particulate problem with naturalgas will also take care of the sulfur oxides prob-lem.’ He forecast somewhat less serious difficul-ties for Chicago, St. Louis, Baltimore, Hartford,Buffalo, and Philadelphia.”112
The Consequences of a Hurried Process. Given the impor-tance of the NAAQS, it is surprising that neither industrynor environmental stakeholders were more aggressive incommenting or in pursuing the issue in litigation.
Bachmann
672 Journal of the Air & Waste Management Association Volume 57 June 2007

These interests may not have understood the potentialimpacts, and industry may have been distracted byseveral major enforcement actions the EPA was pursingunder various statutes.113 In early 1972, however, Ken-necott Copper Corp. used the Act’s provisions for citi-zen suits and judicial review to challenge the scientificbasis for the annual secondary SO2 standard. This casechanged the regulatory process for all subsequentNAAQS decisions. Given the short deadlines, EPA used
an “informal rulemaking process” to propose and pro-mulgate the standards. The D.C. Circuit Court of ap-peals found that the rulemaking record did not give it asufficient basis to complete its review. It remanded thestandard back to the agency, calling for a more com-plete explanation of its basis. EPA quickly recognized ithad erred in ascribing the vegetation damage observed ina study with high peaks to the long-term average. EPAupdated the criteria for SO2 effects on vegetation, and
Year PM SOx O3/Oxidant CO HC NOx Pb - CD CD
1970 CD CD CD - P,F P,F P,F P,F P,F CD,P,F - - -
CD, P, F-revoke 2o
1975 - EPA decision to review all six criteria and NAAQS; DC Circuit orders Pb NAAQS - CD, P- CD,P F - CD, SP F CD, 1st SP
1980 DC Cir.Ct. P Rev. Paper DC Cir.Ct. - P CD - CD, SP SP- F, Revoked- P Decision CDA,SPA P
1985 F, revoke 2o F - CDA, SPA CDA,SPA CD CD, CDA - F PM10, - ANPR PM2.5 P - CDA,SP
1990 CDA, SP- CD - P SP - F, 2o F CD - CDA,SPA,P F, no P
1995 CD,SP1o SP,P - CD, SP, P F SP2o ,P F- F,PM2.5 F, 8-hr - - DC Cir.Ct. - DCCir.Ct DCCir.Ct
2000 CD - Supreme Ct. Supreme Ct. - UVb P - UVb F - CD
2005 SP - P, F CD CD - SP, P SP
Table 6. Chronology of Criteria Review and NAAQS Decisions, 1969 –2007.
Notes: CD � Final Criteria Document; SP � Final OAQPS Staff Paper; CDA,SPA � addenda updating CD, SP; P � proposed; F � promulgation of final decision(F � major revision). Court Actions � Major review and decisions by the D.C. Circuit Court of Appeals, Supreme Court. UVb P,F � EPA’s response to remandto reconsider O3 NAAQS for �protective effect� of ground level O3 against UVb radiation. 1o , 2o � primary, secondary standards. Only TSP (1971–1987) and SO2
(1971–2007) have secondary standards that differ from primary.
Bachmann
Volume 57 June 2007 Journal of the Air & Waste Management Association 673

after consultation with other federal agencies, ulti-mately withdrew the annual secondary standard andreaffirmed the 3-hr standard. This embarrassment led tothe adoption of more formal regulation developmentprocedures within the agency, as well as stricter admin-istrative procedures.110,114 Internally, the process addedreview of recommended rules by a steering committee,consisting of representatives from a number of head-quarters media, policy, and research offices as well asEPA regional offices. Steering committee approval wasrequired before bringing a decision to the administra-tor. In the case of the SO2 secondary standard review,the recommended proposal appeared before the steer-ing committee no fewer than three times and the ad-ministrator was briefed twice.110 The proposal also un-derwent review by OMB.
Under the expanded administrative procedures114:(1) EPA was to make available to the public the informa-tion and technical methodologies it relied upon by thetime of proposal; (2) the preambles to proposal and finalrules were to provide a detailed explanation of EPA’s de-cision; (3) EPA was required to respond to all “significant”comments on the proposal by the time it issues its finalrule; and (4) all of the above documents, analyses, pream-bles, and responses constituted the record that the courtwould examine in reviewing the final standard decision.Objections not raised in the record could not be raised incourt. The halcyon days of a speedy NAAQS process wereover.
Whatever Happened to the Other Ambient Standards? In a1970 response to questions from Muskie’s committee,Middleton provided a schedule for the development of airquality criteria beyond the five that had been issued.88,115
The schedule listed 24 elements, compounds and mix-tures over a 5-yr period, beginning with, in 1971, fluo-rides, Pb, NOx, and polynuclear organics. Senate sponsorsexpected NAAQS for at least five more pollutants. A fewstates had ambient standards for some of these pollut-ants.25 Yet, after the passage of the amendments, EPAlisted and issued criteria for only one additional pollut-ant, NOx/NO2, which was included in the original 1971standards.
NAPCA and later EPA commissioned the NAS to pre-pare reports on a number of the pollutants it was evalu-ating as potentially requiring criteria. These reports cameout over a period of years,116–124 and were used by agencystaff, but not for developing criteria. EPA managementrealized that the level of effort required to establish, mon-itor, implement, and enforce NAAQS represented a largeresource burden, for state and local agencies, EPA, andindustry. With the ongoing effort to implement and en-force NAAQS affecting every major source category of airpollution, the EPA set a high hurdle for adding new cri-teria pollutants.
As EPA management and staff considered the evi-dence for a particular pollutant, they would determinewhether the problems it presented would be handledadequately by implementing existing NAAQS, or fasterand more effectively by one of the other regulatory mech-anisms provided by the new amendments. For example, if
a pollutant came from one or only a few source categories,it might be better regulated under the Section 111 or 112stationary source mechanisms. The existing NAAQS in-cluded particles and five of the most prevalent gases.Advanced particle controls were effective for a number ofthe metals and trace elements on the list, and stationaryand mobile hydrocarbon limits would cover many addi-tional substances. The exceptions included the more vol-atile elements such as mercury, those emitted from poorlycontrolled residual oil or gasoline combustion (e.g.,nickel, vanadium, and Pb) and problematic inorganicgases from industrial processes such as hydrogen fluorideand hydrogen sulfide. These more source specific issuescould be addressed with a more targeted and less intensiveprocess than the NAAQS.
Pb was one of the first priorities on the 1970 list ofupcoming criteria. Early on, EPA decided it would use theCAA fuel additive authority to reduce the Pb content ingasoline—which was necessary to ensure the effectivenessof automotive catalysts as well as to reduce direct healtheffects. These reductions would address the most perva-sive source of Pb exposure, and if needed, stationarysource standards could address more isolated problemssuch as Pb smelters. The essence of this alternative ap-proach was communicated to the administrator in amemo on January 21, 1971.13 EPA decided that an ambi-ent Pb standard was not necessary. An alternative ratio-nale was used to dismiss odors. According to Bern Steiger-wald,125 he and others in management viewed odors as afairly complex and location-specific nuisance problemthat was best left to local and state authorities. The agencydid move under Section 111(d) of CAA to regulate bothnew and existing sources of a class of odors, reducedsulfur compounds. Morag-Levine11 is strongly critical ofthe U.S. regulatory approach to localized problems, par-ticularly odors.
By January 1971, EPA management had decided toregulate beryllium, mercury, and asbestos under the firstSection 112 National Emissions Standards for HazardousPollutant (NESHAP), which were promulgated a monthbefore the NAAQS.126 Later, analysts in the OAQPS Pol-lutant Strategies Branch applied a “preferred standardpath analysis” to each pollutant that was the subject ofsuccessive NAS or other authoritative reports. Staff usedpollutant-specific information to make recommenda-tions, recognizing that the NAAQS should be consideredas a last resort. My first experience was with vanadium,where the external science advisors (NAQCAC) andthe agency concurred that the SO2 controls would bemore than adequate to preclude a NAAQS or other directregulation. In the early 1970s, one-by-one EPA assignedthe pollutants that NAPCA had slated for criteria andNAAQS to alternative approaches, including no addi-tional regulation. Between 1975 and 1980, EPA promul-gated NESHAPS for major sources of vinyl chloride, ben-zene, radionuclides, and inorganic arsenic.126 Severalsource categories emitting fluorides, reduced sulfur com-pounds, and sulfuric acid mist were regulated under Sec-tion 111(d).127 But until EPA was sued, there would be nonew NAAQS.
Bachmann
674 Journal of the Air & Waste Management Association Volume 57 June 2007

Implementation in Transition
“. . . even though air resource management is acrooked wheel, it is the only wheel in town andtherefore we have to gamble against it.” VictorSussman, Director of Air Pollution Controlin Pennsylvania, January 1972
The 1970 CAA Amendments set tight deadlines forSIP development, review, and approval (15 months afterthe final NAAQS). Although not specifically required, EPAdeveloped regulations and guidance for SIP developmentand submission that were proposed in March and promul-gated in August 1971, just over 5 months from the dead-line for SIP submission.128 The proposal garnered morethan 400 written public comments, considerably morethan the NAAQS. Besides deadlines for submission andattainment drawn from the CAA, features in the finalguidance included: (1) “regions” in the state were classi-fied into three priority categories according to the severityof the ambient violation, with more stringent require-ments for priority I areas; (2) control plans approved for“example” regions would be automatically approved ifapplied to equal or lower priority regions; (3) require-ments for public hearings; (4) provisions encouragingstates to consider the socioeconomic impacts and relativecosts and benefits of various emissions control strategies;emissions fees or other economic incentives authorized;(5) requirements for legally enforceable complianceschedules; and (6) approaches for considering the reduc-tions expected from the federal mobile source rules. SIPsneeded to achieve attainment 3 yr after plan approval(generally 1975), unless granted an extension of up to 2yr.
Neither the amount of specific requirements nor thelateness in issuing them was welcome to the states. Al-though some recognized that the procedures imposed auseful rigor, they also consisted of requirements and de-tails that were burdensome to understaffed agencies.States that had developed plans under the 1967 CAA hadto repackage what had already been done to conform toEPA requirements. Moreover, with new faces in EPA re-gional offices, and perpetual reorganizations of NAPCA/EPA air offices, relationships needed to be re-estab-lished.53
States developed and submitted plans, and EPAmoved to review and approve them. It soon became clearthat many states could not meet the 1975 attainmentdeadlines for all NAAQS, particularly the four related toautomotive emissions. Even if the CAA’s requirements formotor vehicles could have been met by 1975, only ap-proximately 10% of the fleet would be controlled. EPAdetermined that available data were not sufficient forstates to develop transportation control strategies or topredict the outcome on air quality. In May 1972, theagency granted a 2-yr extension to 17 states for meetingthe CO and oxidant standards.53 As a result of a lawsuit onthe action in January 1973, the D.C. Circuit Court orderedEPA to rescind the extensions. The administrator wiredthe governors of these states that each would be requiredto submit revised plans by April that showed to attain-ment with the standards by mid-1975.53 Under another
court order, in January 1973 EPA established a FederalImplementation Plan to attain NAAQS in southern Cali-fornia, including draconian measures such as gas ration-ing that prompted press and public outrage there.
In the end, the measures were not implemented, theadministrator did not go to jail, and it was clear CAAwould need some fixes. These early problems and con-frontations in implementation, along with the 1973 en-ergy crisis, clearly affected thinking about the nature ofAQM. In 1971, the administrator’s strategy had been topush hard to make all of the deadlines for standard set-ting, plan development, and implementation. Faced withthe impracticality of attaining these goals on schedule,growing concerns that air pollution regulations were ag-gravating energy dependency, and forcing unpopularmeasures, either the standards or the deadlines needed tochange. The passage of the Energy Supply and Environ-mental Coordination Act of 1974, in particular, marked asignificant change in the overall enthusiasm for air pol-lution control. EPA was directed to promote the use ofcoal under the Orwellian heading of “clean fuels policy.”On the positive side, energy conservation stimulated byhigh prices slowed the growth in demand. It was not untilthe 1977 CAA Amendments that Congress addressed theunderlying issues in AQM. Meanwhile, the agency andthe states soldiered on.
The good news during this period was that someindicators of air pollution continued to improve. A look atair quality, emissions, and even visibility figures discussedearlier demonstrates this. The “flattening” of SOx emis-sions growth was accompanied by a stabilization of visi-bility trends in the eastern United States.33 Reductions inPM and SO2 emissions were directly related to implemen-tation of state and municipal regulatory programs devel-oped in part under the 1967 program but continuingunder the new mandates. An analysis that separatedtrends in counties above and below the TSP NAAQS found“that the entire decline in TSP during the early 1970soccurred in nonattainment counties and that two-thirdsof the 1971–1974 decline in these counties occurred be-tween 1971 and 1972, the first year that the 1970 CAAwas in force.”129 Nevertheless, by 1976, EPA sent letters to45 states indicating that their SIPs were deficient for oneor more of the NAAQS.
New NAAQS Science—Two Steps Forward and One Step Back.The supplemental chronology tables highlight some ofthe more important scientific and technical develop-ments that eventually reshaped the NAAQS. The newCAA had funded and generated national interest in a largevariety of projects related to health and welfare effects,atmospheric sciences, and control technologies. Two arenotable. First is the recognition of the multimodal sizedistribution for PM in 1972.130 This concept was clearlycritical in framing subsequent research131 and ultimatelypolicy and control choices for PM. Second is the increasein attention to aerosol composition and transport thatarose from the early results of the EPA Community Healthand Environmental Surveillance System (CHESS) pro-gram.132 These results suggested health effects at levelsbelow the NAAQS, and that transformations of SOx mightbe more important than the gas itself.
Bachmann
Volume 57 June 2007 Journal of the Air & Waste Management Association 675
Unfortunately, clear problems in some aspects ofmonitoring and quality control, as well as an overly ag-gressive marketing of the results,133 led to the demise ofthe EPA’s air pollution epidemiology program, and legis-lative restrictions on its use for policy in 1977.134 It isimportant to recognize the numerous problems with as-pects of the CHESS program. Nevertheless, a substantialamount of information on air quality, particle size andcomposition, and health was collected that likely wouldhave been useful if checked and reanalyzed. The resultsmight have accelerated some of the changes that were notmade until two decades later. The agency lost substantialexpertise in a core discipline for years. Yet preliminaryCHESS implications led some, including the National In-stitute of Environmental Sciences, to sponsor improvedprograms,135 and caused others to examine the atmo-spheric and multimedia impacts of regional-scale trans-port and chemistry of air pollution.136,137 In the long run,the research and analyses in these areas would have aprofound impact on the development of standards andimplementation of regional strategies for PM, visibilityimpairment, acid rain, and O3.
Part II: Revisionist History (1976–1993)For essentially the same reasons that no new pollutantswere listed under Section 108, EPA had little interest inrevising the NAAQS in the first 5 yr. Internal reviews ofthe NAAQS conducted by health experts in the Office ofResearch and Development (ORD), as well as a 1974 re-view by the NAS done as part of a Congressionally man-dated report on the automobile standards,138 came toessentially the same conclusions:
“In general, the evidence that has accumulatedsince the promulgation of the Federal ambientair quality standards by the EPA Administratoron April 30, 1971, supports those standards.Hence, on balance, the panels found no sub-stantial basis for changing the standards.”138
The NAS panel called for more research, emphasizingfine particles, NO2, and oxidants in particular. Between1971 and 1975, neither internal nor external forcespushed EPA to re-examine the original suite of standards.
The hiatus ended in 1976 with two events. First,NRDC sued EPA in 1975 to list Pb as a criteria pollutantand to set standards. The agency argued it had the discre-tion to follow the more effective risk management ap-proach for Pb outlined above. The D.C. Circuit Courtdisagreed and on March 1, 1976, ordered EPA to begin theprocess. The agency listed Pb at the end of the month.Second, during 1976 the NAQCAC began surveying theexisting criteria and, by June, was drafting a final reportthat recommended a complete review and revision of allof the existing CDs.139 In September 1976, the recentlycreated EPA Science Advisory Board (SAB) disbandedNAQCAC as a part of its restructuring of advisory panels.
On August 16, 1976, Bern Steigerwald and OAQPSstaff met with Del Barth of ORD. They decided it was timeto begin the review process and discussed alternative ra-tionales for determining the sequence of the reviews.From Steigerwald’s policy perspective, it would be best to
begin with the pollutants for which specific implementa-tion measures were least advanced, and the science wasmost limited and then move on to SOx and PM, for whichimplementation measures were more advanced. OAQPSwas aware of questions being raised by API, states, andothers on whether a few hours above the oxidant stan-dards were worth the effort to develop disruptive trans-portation control plans.13,140 This made oxidants the log-ical choice to undergo review first. By the fall, EPAprovided the following schedule in a response to NAQ-CAC:
• Photochemical oxidants (and related HC)—Au-gust 1977
• NOx—February 1978• CO—August 1978• SOx (and associated particulates)—August 1979• PM—August 1979The response indicated that formal publication of the
documents would occur between 3 and 15 months laterthan those dates depending upon whether it would benecessary to develop new or revised standards as a re-sult.141 EPA followed this order but did not meet thesedeadlines (Table 6). The last two (SOx and PM) were com-bined into a single document, which was actually issuedin August 1982.142
Mislead. Work started on the Pb document even beforethe anticipated court decision. The overlapping O3 reviewbegan in September 1976. Because no major CDs hadbeen developed since 1970, the criteria review functionhad been transferred to the Criteria and Special StudiesOffice (CSSO), a small group located in the health effectslaboratory in Research Triangle Park, NC. The fact thatthis organization was not ready for “prime time” becameapparent after the release of the first external review draftin October 1976 and the reaction of the special leadcriteria review subcommittee of the SAB. OAQPS was sur-prised when the draft CD recommended a specific Pbstandard, inconsistent with the separation of criteria andstandards in the statute. They were even less satisfied withthe high level of 5 �g/m3. SAB panel members stronglycriticized the poor quality of the effort, as well as theweakness of the recommendation.13
Melnick’s review13 asserts that “EPA’s scientists” rec-ommended 5 �g/m3 and that the agency did an “aboutface” when it later proposed a much lower level of 1.5�g/m3. Furthermore, he repeats Pb industry suggestionsthat this “reversal” might have been influenced by Assis-tant Administrator for Air David Hawkins, who came tothe EPA from NRDC in 1977. These suggestions are dis-missed by those closest to the project and contradicted bythe comments of the independent SAB; this is apparenteven in Melnick’s account.13 The draft CSSO recommen-dation was inconsistent with a 1972 EPA Pb report thatsuggested 2 �g/m3 as a level of concern to health.13 Theirinappropriate NAAQS recommendation cannot be con-strued as representing the mainstream views of agencyscientists.
The ultimate result of this embarrassing experiencewas a reorganization that created a separate Environmen-tal Criteria Assessment Office (ECAO). An academic ex-pert from the University of North Carolina who had been
Bachmann
676 Journal of the Air & Waste Management Association Volume 57 June 2007

brought in to complete the final drafts of the Pb docu-ment, Lester Grant, became acting and later permanentdirector of ECAO in October 1978. EPA would accordhigher priority to the criteria program through the re-mainder of the scheduled reviews.
Because this was the first major NAAQS action since1971, the OAQPS staff who developed the recommenda-tions and analyses were the first to go through the greatlyexpanded internal review and administrative review pro-cedures. As detailed in the chronology, Pb represented achallenge because of the multiple exposure routes, andthe fact that, like CO, the best indicator of exposure wasa blood concentration. The OAQPS staff developed aninventive approach and analysis that: (1) established atarget blood Pb level that would protect 99.5% of chil-dren, based on the recommendations of the Centers forDisease Control; (2) estimated a baseline level from non-air sources; (3) used limited data to set an assumed airPb/blood Pb ratio; and (4) calculated the air concentrationthat would keep the total baseline plus air Pb below thetarget level. As the preamble143 and reviewers13 noted,these analyses were subject to multiple uncertainties, andwere sensitive to the selection of many of the parametersestimated. Whereas the staff methodology was reviewedby internal scientists, policymakers, and the public, it wasnot submitted to the SAB for review.
As for all NAAQS decisions, the final choice on thestandard was constrained and informed by the scientificinformation, but ultimately based on the policy judgmentof a politically responsible decision-maker, the EPA ad-ministrator. After consideration of and reaction to publiccomments, and review and discussion on the final pack-age by OMB, the administrator promulgated a Pb standardof 1.5 �g/m3 quarterly average in TSP.144 The exposition ofthe rationale and response to comments in the proposal andfinal preambles for the Pb NAAQS set the tone for laterNAAQS and bear little resemblance to the 1971 Notices.
In 1979, the Lead Industries Association sued EPA onseveral aspects of the decision. The final ruling (Lead In-dustries Assoc., Inc. vs. EPA, 647 F. 2d 1130, cert. den. 449U.S. 1042 [1980]), set precedents that guided the agency’sdecision-making in future reviews. The major conclusionsreached by the court include:
• The text of the CAA and legislative history indi-cated that EPA could not consider economic andtechnological factors in setting NAAQS underSection 109.
• The margin of safety was designed to addresshealth effects that had not yet been uncovered byresearch and effects for which medical signifi-cance was a matter of disagreement. Requiringthe agency to wait until it could conclusivelydemonstrate that a particular effect is adverse wasinconsistent with the CAA’s precautionary andpreventive orientation.
• The Pb industries as petitioners argued that EPAwas required to set a safe level and then adjust foran adequate margin of safety. The court held thatthe administrator was not limited to this ap-proach but had the discretion to determine theappropriate approach to best fulfill the goals ofCAA in the margin of safety. This is the kind of
policy choice the CAA leaves to the administra-tor’s judgment.
• With respect to the specific technical basis for thestandards, the court found adequate evidence inthe record to support EPA’s findings regarding thefirst adverse health effects level for Pb exposure aswell as more serious effects of anemia and centralnervous system detriments at increasingly higherlevels. The agency was not arbitrary or capriciousin determining other factors used in its analysisthat led to the standard level.
• The court also praised EPA’s execution of theexpanded administrative procedures it had earlierrequired. It cited “the rigorous scientific and pub-lic review which permitted a thorough ventila-tion of the complex scientific and technical issuespresented by this rulemaking proceeding.”
O3, a Risky Business—But First Some Words from Our Spon-sors. The review of criteria and NAAQS for oxidantslagged the Pb process, with a period of substantial over-lap. At the outset, it was decided that the indicator for thestandard would be formally changed to O3, and the CDreferred to “ozone and other photochemical oxidants.”Although initiating the review on its own, EPA was againsubject to a court-ordered schedule filed by the API. Theprocess was late enough to be affected by legislative de-velopments, particularly the CAA Amendments of 1977.
These amendments addressed a number of issues thathad arisen since 1970, including the attainment deadlinesfor the NAAQS, vehicle emission standards, prevention ofsignificant deteriorations (PSDs), as well as newer con-cerns, such as visibility in National Parks. They madeseveral changes that affected the NAAQS process:
• The CAA required that EPA review all of the ex-isting criteria and standards by 1980 and every 5yr thereafter.
• It established a scientific committee (later namedCASAC) to review the existing criteria and stan-dards and to make recommendations to the ad-ministrator regarding any new standards or revi-sion of existing criteria and standards asappropriate, and on the same 5-yr schedule. Theseven-member committee had to include at leastone physician, a member of the NAS, and a rep-resentative from state or local air agencies.
• It required that, within 1 yr after enactment, EPAestablish a short-term primary standard for NO2
unless the administrator found it unnecessarybased on the scientific criteria.
• Section 307(d) required public hearings of pro-posals and mandated the administrative proce-dures summarized above, including identifica-tion of all ex parte correspondence and meetingsregarding NAAQS decisions. (This included anydiscussion or paper related to the decision withoutside parties, generally between proposal andpromulgation.)
• Minor changes in the wording of Section 108were made to clarify the precautionary approach.
Other legislation passed in 1978, the EnvironmentalResearch Development Demonstration Authorization
Bachmann
Volume 57 June 2007 Journal of the Air & Waste Management Association 677

Act,145 required that EPA submit NAAQS proposals to theSAB for review.
Supplemental Table 4 provides an overview of the O3
criteria and standards review process as well as the keydevelopments and issues raised. Given a reinterpretationof the original study upon which the standard was basedand the limited new evidence of effects at levels above0.15 ppm, EPA proposed to relax the level of the standardto 0.10 ppm.146 The proposal preamble presents the agen-cy’s thinking at the time about a number of the generalissues critical to standard setting. In particular, it indicatesthat EPA was aware of criticism that the fundamentalpremise of the standards was built on a scientific fallacy;namely, the illusory concept of a “threshold” for healtheffects. The preamble quoted the 1974 NAS report tosupport the notion that “in no case is there evidence thatthe threshold levels have clear physiological meaning.”147
It also cited the legislative history of the 1977 CAAAmendments. The relevant House committee observedthat the concepts of threshold and adequate margin ofsafety were “necessary simplifications to permit the Ad-ministrator to set standards.”148 That is, Congress recon-sidered the issue in light of the scientific information, anddecided that a change to the statute was not needed.
The preamble addresses EPA’s view of the situationfor O3, noting that the science suggests no clear thresholdfor the health effects:
“Rather there is a continuum consisting ofozone levels at which health effects are certain,through levels at which scientist(s) can gener-ally agree that health effects have been clearlydemonstrated, and down to levels at which theindications of health effects are less certain andharder to identify. Selecting a standard fromthis continuum is a judgment of prudent publichealth practice, and does not imply some dis-crete or fixed margin of safety that is appendedto a known ‘threshold.’”147
This treatment of the issue was the product of theefforts by staff in the OAQPS’s Pollutant Strategies Branch,who began gearing up shortly after the decision to reviewthe O3 standard. After reviewing how the margin of safetyconcept was applied in engineering and federal occupa-tional and food safety regulations, they developed a moreformal approach consistent with the prevailing scientificinformation and decision analysis theory.149,150 This riskframework was used on a trial basis and results werepresented in the proposal as preliminary. It was not usedin the final decision. Nevertheless, the terminology andconcepts that were developed and discussed by the staffduring that period guided future analytical work on riskand exposure and clarified the approach to developingand arraying information for decision makers.
Rejecting the illusion that ambient standards couldprovide absolute safety through the threshold-safety fac-tor approach, OAQPS staff began with the followingpremise: an adequate margin of safety exists, by defini-tion, when risks associated with a particular standard arejudged to be acceptable.151 Here, risk means a probabilityapplied strictly to particular adverse events occurring in agiven period of time based on the state of information at
the time of decision-making. From this point, it becomescritical to identify the major uncertainties that give rise tothe risk in question. Some of these include uncertaintiesabout the concentration or exposure-effects relationshipfor sensitive groups that are the focus of NAAQS deci-sions, and uncertainty about the existence of an effect inhumans that has been demonstrated only in animals.Another important uncertainty was that associated withthe temporal and spatial distribution of air pollutant con-centrations and exposure when the standard is barelyattained. Analyses of this uncertainty were also developedfor O3. One of the results was the move to a more robuststatistical form (expected exceedance) in the specificationof standards.
Of particular concern to the O3 NAAQS was uncer-tainty about the point at which observed responses insensitive groups are understood to be “adverse.” For someair pollution effects observed in epidemiology studies(e.g., mortality, hospital admissions), there is little ques-tion about “adversity.” But it is a continuing issue forpollutants such as O3 and CO that rely substantially oncontrolled human studies. Ethics do not permit humantesting to present a substantial risk of permanent harm, sothe studies often cannot use the most sensitive individu-als or investigate the most serious effects. In the case ofO3, EPA needed to consider the evidence from controlledhuman studies that found reversible changes in certainlung function tests, as well as some symptoms. No objec-tive criteria existed for interpreting the significance of thevarious responses. OAQPS staff therefore consulted withhealth experts to determine at the point at which suchchanges become “adverse” to health. The experts gener-ally concluded a range of between 5% and 15% drop inthe particular lung function test used. This was used inthe O3 decisions. In later years, the American ThoracicSociety produced guidelines152 for interpreting the adver-sity of the effects of air pollution for controlled humanand epidemiological studies.
The risk assessment framework also helped staff de-fine the respective roles of science and risk assessment, aswell as their responsibilities in assessing and presentinginformation to decision makers. Although not always suc-cessful, the staff aspired to the standard articulated byGranger Morgan that the objective of good policy analysis“is to evaluate, order, and structure incomplete knowl-edge so as to allow decisions to be made with as completean understanding as possible of the current state ofknowledge, its limitations, and its implications.”153
In part, this meant that, unlike the approach oftenfollowed in developing risk assessments for carcinogens,risk and exposure assessments developed for the NAAQSwould focus on the central tendency of the estimates, andnot on ninety-fifth percentile risk numbers or risk bench-marks that included hidden safety factors. It also meantexamining all of the information, from the most robustreplicated studies in humans, to more uncertain resultsfrom single studies with suggestive, but not conclusiveevidence. Although it was important to place greatestweight on the best information, the decisions should notrely wholly on the evidence from a single conclusivestudy, but also be influenced by less certain evidence ofrisk at lower levels.
Bachmann
678 Journal of the Air & Waste Management Association Volume 57 June 2007
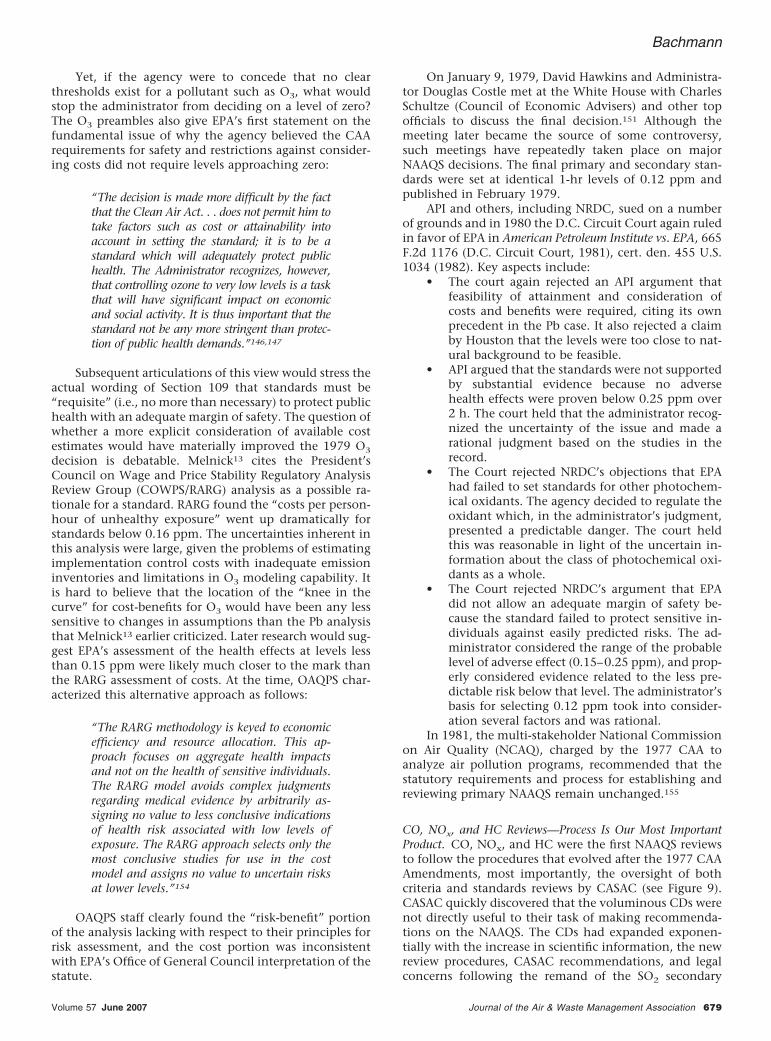
Yet, if the agency were to concede that no clearthresholds exist for a pollutant such as O3, what wouldstop the administrator from deciding on a level of zero?The O3 preambles also give EPA’s first statement on thefundamental issue of why the agency believed the CAArequirements for safety and restrictions against consider-ing costs did not require levels approaching zero:
“The decision is made more difficult by the factthat the Clean Air Act. . . does not permit him totake factors such as cost or attainability intoaccount in setting the standard; it is to be astandard which will adequately protect publichealth. The Administrator recognizes, however,that controlling ozone to very low levels is a taskthat will have significant impact on economicand social activity. It is thus important that thestandard not be any more stringent than protec-tion of public health demands.”146,147
Subsequent articulations of this view would stress theactual wording of Section 109 that standards must be“requisite” (i.e., no more than necessary) to protect publichealth with an adequate margin of safety. The question ofwhether a more explicit consideration of available costestimates would have materially improved the 1979 O3
decision is debatable. Melnick13 cites the President’sCouncil on Wage and Price Stability Regulatory AnalysisReview Group (COWPS/RARG) analysis as a possible ra-tionale for a standard. RARG found the “costs per person-hour of unhealthy exposure” went up dramatically forstandards below 0.16 ppm. The uncertainties inherent inthis analysis were large, given the problems of estimatingimplementation control costs with inadequate emissioninventories and limitations in O3 modeling capability. Itis hard to believe that the location of the “knee in thecurve” for cost-benefits for O3 would have been any lesssensitive to changes in assumptions than the Pb analysisthat Melnick13 earlier criticized. Later research would sug-gest EPA’s assessment of the health effects at levels lessthan 0.15 ppm were likely much closer to the mark thanthe RARG assessment of costs. At the time, OAQPS char-acterized this alternative approach as follows:
“The RARG methodology is keyed to economicefficiency and resource allocation. This ap-proach focuses on aggregate health impactsand not on the health of sensitive individuals.The RARG model avoids complex judgmentsregarding medical evidence by arbitrarily as-signing no value to less conclusive indicationsof health risk associated with low levels ofexposure. The RARG approach selects only themost conclusive studies for use in the costmodel and assigns no value to uncertain risksat lower levels.”154
OAQPS staff clearly found the “risk-benefit” portionof the analysis lacking with respect to their principles forrisk assessment, and the cost portion was inconsistentwith EPA’s Office of General Council interpretation of thestatute.
On January 9, 1979, David Hawkins and Administra-tor Douglas Costle met at the White House with CharlesSchultze (Council of Economic Advisers) and other topofficials to discuss the final decision.151 Although themeeting later became the source of some controversy,such meetings have repeatedly taken place on majorNAAQS decisions. The final primary and secondary stan-dards were set at identical 1-hr levels of 0.12 ppm andpublished in February 1979.
API and others, including NRDC, sued on a numberof grounds and in 1980 the D.C. Circuit Court again ruledin favor of EPA in American Petroleum Institute vs. EPA, 665F.2d 1176 (D.C. Circuit Court, 1981), cert. den. 455 U.S.1034 (1982). Key aspects include:
• The court again rejected an API argument thatfeasibility of attainment and consideration ofcosts and benefits were required, citing its ownprecedent in the Pb case. It also rejected a claimby Houston that the levels were too close to nat-ural background to be feasible.
• API argued that the standards were not supportedby substantial evidence because no adversehealth effects were proven below 0.25 ppm over2 h. The court held that the administrator recog-nized the uncertainty of the issue and made arational judgment based on the studies in therecord.
• The Court rejected NRDC’s objections that EPAhad failed to set standards for other photochem-ical oxidants. The agency decided to regulate theoxidant which, in the administrator’s judgment,presented a predictable danger. The court heldthis was reasonable in light of the uncertain in-formation about the class of photochemical oxi-dants as a whole.
• The Court rejected NRDC’s argument that EPAdid not allow an adequate margin of safety be-cause the standard failed to protect sensitive in-dividuals against easily predicted risks. The ad-ministrator considered the range of the probablelevel of adverse effect (0.15–0.25 ppm), and prop-erly considered evidence related to the less pre-dictable risk below that level. The administrator’sbasis for selecting 0.12 ppm took into consider-ation several factors and was rational.
In 1981, the multi-stakeholder National Commissionon Air Quality (NCAQ), charged by the 1977 CAA toanalyze air pollution programs, recommended that thestatutory requirements and process for establishing andreviewing primary NAAQS remain unchanged.155
CO, NOx, and HC Reviews—Process Is Our Most ImportantProduct. CO, NOx, and HC were the first NAAQS reviewsto follow the procedures that evolved after the 1977 CAAAmendments, most importantly, the oversight of bothcriteria and standards reviews by CASAC (see Figure 9).CASAC quickly discovered that the voluminous CDs werenot directly useful to their task of making recommenda-tions on the NAAQS. The CDs had expanded exponen-tially with the increase in scientific information, the newreview procedures, CASAC recommendations, and legalconcerns following the remand of the SO2 secondary
Bachmann
Volume 57 June 2007 Journal of the Air & Waste Management Association 679
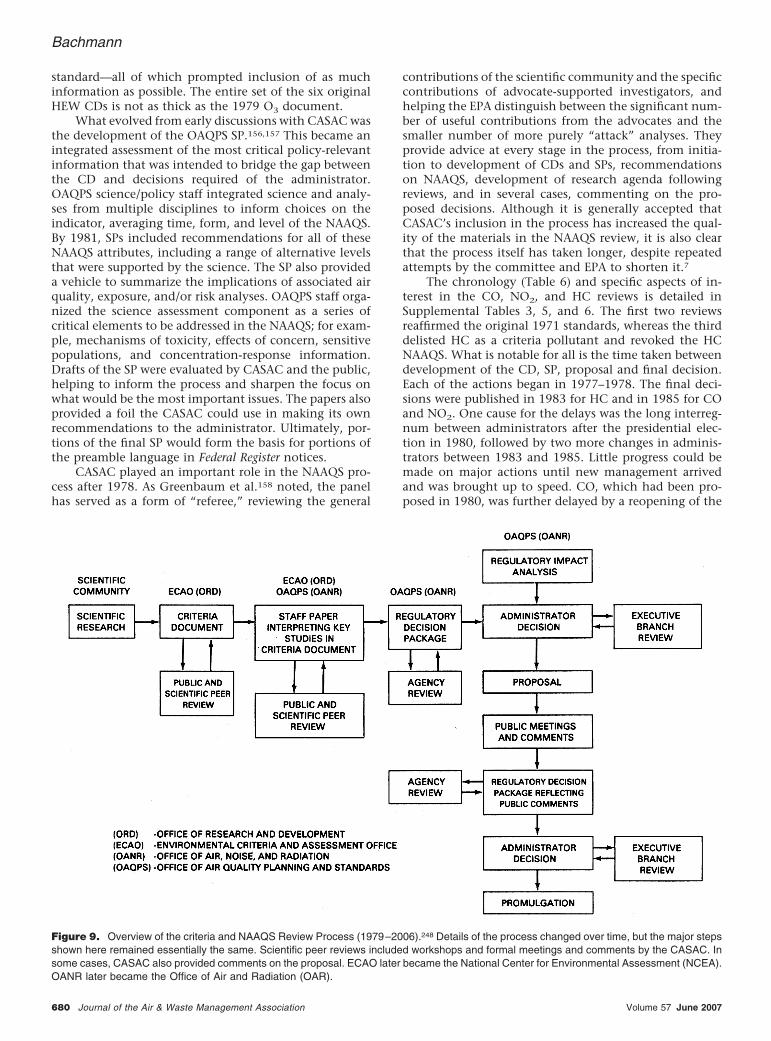
standard—all of which prompted inclusion of as muchinformation as possible. The entire set of the six originalHEW CDs is not as thick as the 1979 O3 document.
What evolved from early discussions with CASAC wasthe development of the OAQPS SP.156,157 This became anintegrated assessment of the most critical policy-relevantinformation that was intended to bridge the gap betweenthe CD and decisions required of the administrator.OAQPS science/policy staff integrated science and analy-ses from multiple disciplines to inform choices on theindicator, averaging time, form, and level of the NAAQS.By 1981, SPs included recommendations for all of theseNAAQS attributes, including a range of alternative levelsthat were supported by the science. The SP also provideda vehicle to summarize the implications of associated airquality, exposure, and/or risk analyses. OAQPS staff orga-nized the science assessment component as a series ofcritical elements to be addressed in the NAAQS; for exam-ple, mechanisms of toxicity, effects of concern, sensitivepopulations, and concentration-response information.Drafts of the SP were evaluated by CASAC and the public,helping to inform the process and sharpen the focus onwhat would be the most important issues. The papers alsoprovided a foil the CASAC could use in making its ownrecommendations to the administrator. Ultimately, por-tions of the final SP would form the basis for portions ofthe preamble language in Federal Register notices.
CASAC played an important role in the NAAQS pro-cess after 1978. As Greenbaum et al.158 noted, the panelhas served as a form of “referee,” reviewing the general
contributions of the scientific community and the specificcontributions of advocate-supported investigators, andhelping the EPA distinguish between the significant num-ber of useful contributions from the advocates and thesmaller number of more purely “attack” analyses. Theyprovide advice at every stage in the process, from initia-tion to development of CDs and SPs, recommendationson NAAQS, development of research agenda followingreviews, and in several cases, commenting on the pro-posed decisions. Although it is generally accepted thatCASAC’s inclusion in the process has increased the qual-ity of the materials in the NAAQS review, it is also clearthat the process itself has taken longer, despite repeatedattempts by the committee and EPA to shorten it.7
The chronology (Table 6) and specific aspects of in-terest in the CO, NO2, and HC reviews is detailed inSupplemental Tables 3, 5, and 6. The first two reviewsreaffirmed the original 1971 standards, whereas the thirddelisted HC as a criteria pollutant and revoked the HCNAAQS. What is notable for all is the time taken betweendevelopment of the CD, SP, proposal and final decision.Each of the actions began in 1977–1978. The final deci-sions were published in 1983 for HC and in 1985 for COand NO2. One cause for the delays was the long interreg-num between administrators after the presidential elec-tion in 1980, followed by two more changes in adminis-trators between 1983 and 1985. Little progress could bemade on major actions until new management arrivedand was brought up to speed. CO, which had been pro-posed in 1980, was further delayed by a reopening of the
Figure 9. Overview of the criteria and NAAQS Review Process (1979–2006).248 Details of the process changed over time, but the major stepsshown here remained essentially the same. Scientific peer reviews included workshops and formal meetings and comments by the CASAC. Insome cases, CASAC also provided comments on the proposal. ECAO later became the National Center for Environmental Assessment (NCEA).OANR later became the Office of Air and Radiation (OAR).
Bachmann
680 Journal of the Air & Waste Management Association Volume 57 June 2007

public comment period and then by the discovery ofpotential problems that affected a number of key studies(Supplemental Table 3).
As noted above, the 1977 CAA Amendments calledfor a short-term NO2 standard, based in part on the sug-gestion by the 1974 NAS report138 recommendations. Ini-tial review suggested this might not be appropriate, butafter holding a public meeting in the summer of 1978,EPA moved on to a full criteria review without takingformal action. ORD began studies of short-term exposuresto evaluate preliminary results from earlier short-termstudies. After 1981, the process was further delayed byinternal agency disagreements on whether a short-termstandard should be proposed and a second change in theEPA administrator in 1983. By then, the agency needed toexamine newer research not included in the 1982 CD.
In contrast, the revocation of the HC standard wentsmoothly. As noted earlier, the only basis for this standardwas to help with O3 attainment, and states never plannedto meet it beyond the controls they developed for O3.There was little disagreement with retaining the CO andNO2 standards, but some concern about the need for theshort-term standard. The articulation of key policy rele-vant studies and issues led to research recommendations,with work targeted to them sponsored by EPA, HEI, andothers.
This illustrates one of the continuing and less appre-ciated benefits of the NAAQS. The intense science andpolicy interaction enables EPA and others to sharpen themost important scientific and analytical questions thatneed to be addressed for future reviews. The continuedfocus on remaining air pollution problems and the needfor future reviews means such research strategies can rea-sonably be forecast over multiple years. This reduces, butdoes not fully eliminate, the “pollutant of the month”syndrome where research priorities shift from one con-cern to the next. In the case of the NAAQS, sometimesresearch funding is like a roller coaster, but it usually stayson the tracks.
PM and SOx.
“The interest in air pollution is inversely pro-portional to its concentration.” Sir PatrickLawther, circa 1981.
The PM and SOx reviews were the last to start and thelast to finish. They were also among the most conten-tious, fraught with intrusive litigation, dueling expertpanels, and a little intrigue. Key aspects of the history aresummarized in Supplemental Tables 1 and 2 and also in arecent paper.158 This summary will deal more with theprocess and some personal reflections than with the mostcritical aspects of the decision.
The late start and subsequent delays in these reviewspermitted some opportunities to suggest research andmonitoring efforts that would assist with critical issuesbefore the nearly decade-long process was completed.Two NAS panels had published major reports on SOx
159
and airborne particles.160 Comparing the summary ofcontrolled human studies of SO2 with ambient data sug-gested that peak SO2 concentrations near large point
sources might produce effects of concern, but very littlework had been done on asthmatics. This was importantbecause the original standards had been based on epide-miology studies where both SO2 and PM were high.OAQPS communicated this as a research priority to ORD,which was eventually able to produce results that, to-gether with those from other studies, were critical in thefinal stages of the review.161
OAQPS staff also worked with health and atmo-spheric scientists before the review to consider the scienceand policy basis for an indicator for the PM standard. Allagreed that TSP was not the best indicator for PM. TSPcontained substantial amounts of large particles that didnot penetrate to the lung. Accordingly, because the TSPstandards were often exceeded in dusty rural locations,OAQPS had developed a “rural fugitive dust policy” thatplaced low priority on such violations.162 Given the rec-ommendations of the 1974 NAS report,159 many assumedEPA would move to a fine or respirable particle (�3.5 �m)standard, or perhaps a standard for SO4
�. The key policyquestion was what range of particle sizes might be ofconcern to the most sensitive individuals. The healthexperts concluded that inhalable particles as large as10–15 �m in aerodynamic diameter could reach sensitiveregions of the lung.134 Atmospheric scientists recognizedthat the differences in formation mechanisms and chem-ical composition between fine and coarse particles mightsupport another useful breakpoint. Miller et al.134 pro-vided a technical basis to develop new monitoring ap-proaches and EPA established a temporary Inhalable Par-ticle Network (IPN) to measure both fine and inhalableparticles (i.e., PM15) at more than 100 locations.163 Theresults from the IPN in the early 1980s not only provedimportant in the final standards, but also formed the firstbasis for later epidemiological studies, including the Amer-ican Chemical Society (ACS) prospective cohort study.164
AISI represented an industry that was being hard hitby foreign competition as well as by the TSP standards.They sued EPA in 1978 in part to ensure that the results ofthe agency’s CHESS studies were not used in the review.At one point, AISI lawyers got a temporary restrainingorder from a Pittsburgh judge that resulted in shuttingdown a closed expert workshop on early drafts. All subse-quent workshops were open to the public. (I recall spend-ing about 10 hr in depositions being questioned on vari-ous aspects of my role in the process, and my personalnotebooks had to be turned over and were copied duringdiscovery.) More productively, AISI also contracted withseveral pioneering British epidemiologists, whose studieshad been cited in the 1969 CD to interpret their work inthe context of standards.165 Not to be outdone, ECAOcountered by hiring a group of epidemiologists from theHarvard School of Public Health to provide an alternativeview.166 In 1981, new management came to EPA, bringinga different style and atmosphere. As Bill Ruckelshaus latersaw it:
“. . . it was a nightmare. . . I mean it wasreally awful. . . . In one of the offices they hadcompiled a ‘hit list’ of career appointees, drawnup in colored ink on charts. They were targetedfor dismissal because of alleged disloyalty to
Bachmann
Volume 57 June 2007 Journal of the Air & Waste Management Association 681

the administration. And the whole staff wasaware of such things! . . . Very clear signalswent out to the people of the agency whichsaid, we don’t trust you. We don’t trust youto do what we want done. It generated enor-mous employee morale problems.”167 (empha-sis in original)
Before the PM/SO2 review process was over, I was toend up giving briefings on the PM and SOx standards tofour different administrators. Such briefings were oftencrowded with various aides and representatives of inter-ested offices. A number of months after the CASAC closedon the SP and made their final recommendations on thestandards (January 1982), I received a phone call from ahigh level EPA political appointee with some instructionsfor an immediate special briefing limited to this official,Administrator Ann Gorsuch, and me. In this after-hourssession, I reviewed the scientific and policy bases for thedecision. In response to a question at the end, I noted theresults of the then draft PM Regulatory Impacts Analysis(RIA)168 were not included because they had not beenreviewed and contained cost information that could notbe considered in the decision. I then summarized the keyfinding, which though preliminary and uncertain, sug-gested that the estimated benefits of the PM10 standardsexceeded the costs even at the lowest end of the ranges ofthe two standards combined. The administrator was furi-ous. She could not believe that the air office would de-velop material that would undercut her choice for the PMstandards. Almost certainly because of that exchange, wereceived no official guidance for the proposal before sheleft the agency, and PM was caught in limbo. This is theonly case in which I know that an RIA had a directinfluence on an administrator’s nondecision regardingthe NAAQS.
Bill Ruckelshaus returned for his second term as EPAadministrator in May 1983, and within months took upthe NAAQS reviews. After a number of briefings, he in-structed us to propose a decision that would highlight thedifficulty and importance of the decision, state that itcould not be made solely on science, and asked if underthe statute “is there room to consider other, non-scientificfactors in making the major social policy judgment ofpicking a precise number from a range of scientificallyjustified values.” He proposed the CASAC and staff ranges,with an inclination to the lower end, which was pub-lished in March 1984.169
Despite the combined criteria, OAQPS prepared sep-arate SPs for PM and SO2, because the evidence suggestedmaintaining separate standards for both. The SO2 paperlagged PM by about 6 months, and we briefed Ruck-elshaus a number of times on this decision. The alterna-tive staff and CASAC recommendations were: (1) keep theoriginal standards, or (2) add a short-term standard basedon the new chamber studies. He decided not to revise theoriginal standards. At the time, Management believedthat the decision did not need to be formally announcedin the Federal Register. Soon after, Ruckelshaus left EPA.
The accumulated delays in the process meant that the1982 SOx/PM CD was aging by 1985, when we begandiscussions with the new EPA Administrator Lee Thomas
on what to do about final decisions for PM and SO2.Moreover, the early portions of the review had stimulateda fair amount of new research and reanalyses of old datafor both pollutants. The agency decided it would be bestto take advantage of these new findings by developing“addenda” to update the CDs as well as SPs. In response tothe growing number of new PM studies, agency staffstarted review and evaluation, with the assistance of twoanalysts brought in to work on statistical issues in epide-miology, including a reanalyses of the London mortalitydata.170
After the updates and another round of reviews andbriefings, Administrator Thomas signed the final rule forthe PM10 standards in July 1987, deferring a decision on aPM2.5 standard to protect visibility.171 Because the ad-denda included SO2 as well as PM, another decision wasrequired on whether the new studies on short-term effectsand expanded exposure analyses would change the priordecision. In April 1988, EPA proposed not to revise theSO2 standards, but solicited comment on an alternative ofadding a 1-hr primary standard of 0.4 ppm.172 Therewould be no more NAAQS proposals or promulgationnotices for the next 4 yr.
Some Additional Reflections. From one perspective, the1971 NAAQS survived the first wave of revisions fairlywell, with three of them unchanged (CO, NO2, SO2); onerelaxed (O3); one deemed unnecessary (HC); one newpollutant added (Pb); and one that was partly relaxed(TSP) and slightly tightened (PM10). The new process wasfar more thorough and resulted in much greater stake-holder participation and the key premises and conceptswere sharpened and tested. The effort also stimulated asubstantial amount of new research on all of the pollut-ants. Overall, however, these first NAAQS reviews werecumbersome and beset with delays attributable to theprocess and to numerous transitions and problems inupper management. They also exemplify what Sunteincalls “the tyranny of the status quo.”173 Even smallchanges to the NAAQS could reopen the process of desig-nations and SIPs. Accordingly, EPA was reluctant to makemodest improvements to some NAAQS (e.g., to statisticalforms, more appropriate averaging times) without com-pelling evidence of the need to revise, as was the case forO3 and PM. EPA also missed some important opportuni-ties and deferred decisions in cases where the scienceappeared to support actions that policymakers were sim-ply not ready to take.
One of the most important of these was related toprotecting public welfare, an issue that the 2004 NRCAQM Committee4 highlights as a continuing challenge.Most notorious was acid rain. It was clear that if theexecutive branch did not want to move either on a tar-geted approach (suggested by Ruckelshaus in 1983–1984)or more general legislation (recommended by the NCAQin 1981155), EPA was not going to be able to sustainsecondary standards either. Accordingly, the agencyfound it necessary to defer action on deposition-relatedissues repeatedly in NOx, SO2, and PM notices. The effectsof O3 on vegetation also received “secondary” priority.The 1978 O3 proposal developed a rationale for maintain-ing the original 1-hr secondary standard of 0.08 ppm. In
Bachmann
682 Journal of the Air & Waste Management Association Volume 57 June 2007
the final notice, the primary standard level became thelevel for the secondary standards. To justify this, EPAchanged the criterion it had proposed for determiningadverse effects on welfare.148
EPA also missed an opportunity in the 1987 deferralof a decision on a secondary fine particle standard basedon a solid link to visibility. Such a standard would haveresulted in a national PM2.5 monitoring network up to adecade before one was finally put into place. That wouldhave accelerated the specificity of studies on health ef-fects, exposures, and source-receptor relationships. Ofcourse, it would have been better to set separate primarystandards for fine and coarse particles in 1987. But theavailable epidemiology information, in which aerometrydid not clearly separate the two, could not be used tosupport two PM indicators.174,175 Things might have beendifferent if reanalysis of the useful portions of the effectsinformation and particle size and composition data col-lected in EPA’s CHESS program had been possible. ButCongressional and legal actions precluded a dispassionatere-examination of the evidence on its own merits.
A subsequent Administration and Congress soon de-livered a legislative program to address acid rain andregional haze in the form of Title IV and Section 169B ofthe CAA Amendments of 1990. These programs repre-sented a more efficient approach to these issues than theNAAQS process could at that time. The 1990 CAA Amend-ments show that the nation’s leaders were sometimeswilling to address both ecosystem damage and estheticeffects of air pollution. But they also appeared to be sen-sitive to regional differences in the need for protection. Infact, aspects of the Section 169 visibility program sug-gested an alternative to improve the utility and effective-ness of future secondary standards. The specific visibilitygoals could change depending upon the context of aparticular national park or wilderness area, and strategiesto protect visibility in them also varied.176
The concept of critical levels and loads4,177 thatchange with the sensitivity of affected ecosystems is sim-ilar to what appears to be working for regional haze pro-grams and could be used in AQM. By contrast, the re-gional ambient standards approach in the 1967 CAA didnot make sense, in part because of the lack of a uniformlevel of health protection for people across locations. Thesame is not the case for terrestrial and aquatic ecosystems,which vary in sensitivity with location. It would also behelpful if such goals could be expressed in a way thatcombined multiple stressors, instead of focusing on singlepollutants. Unlike the CDH in 1959, it has been difficultfor EPA administrators to set tougher standards for publicwelfare than they do for health. As illustrated by thetiming of key decisions on secondary standards in severalof the chronology tables, this has been the case acrossadministrations and across parties. It might be easier tosupport if the goals could be targeted to the most sensitivelocations.
A secondary fine particle standard would have helpedwith another generally unaddressed issue in these firstrevisions: that is the tendency to consider criteria pollut-ants one at a time. The SO2-PM link to the contrary, eachof the NAAQS decisions tended to focus on a specific
pollutant, when many nonspecific responses to air pollu-tion must be the result of combinations of them.178 PM,however, is itself a multiple pollutant. The use of a fineparticle indicator prompts control strategists to considermultiple primary particles and several gaseous precursorsand photochemical reactions that link PM with O3, NOx,SOx, VOC, and ammonia (NH3) emissions.179 AlthoughEPA began to adopt a “one atmosphere” perspective inimplementing regulations after combining the PM and O3
NAAQS reviews in 1997, the process would have comesooner with a secondary fine particle standard in 1987.
The implementation history of the SO2 and PM stan-dards also highlights the limitations of NAAQS for ad-dressing SOx on different geographic scales. As notedabove, by the early to mid 1970s, EPA realized that somestrategies to meet the SO2 standards, notably tall stacksand intermittent controls, increased the spread of acidicsulfates that were of potential concern to health, visibil-ity, and acid rain.98,180 As a result, EPA and later Congressattempted, through complex policies and modeling guid-ance, to limit or proscribe such approaches and use theSIP process to minimize SO2 emissions from major sourcessuch as power generators and smelters.88,181 But with in-creasing energy concerns, it was harder to justify thedesignations and limits EPA originally required for Ohiopower plants based on conservative point source model-ing when local monitors were not violating the SO2 stan-dards. Controversy over modeling details and limits forvarious plants continued into the 1980s, and the endresult was an increase in allowable emission rates for largepoint sources. From the standpoint of the attaining theSO2 or TSP standards, the results were acceptable. But thereluctance to adopt appropriate NAAQS prolonged theregional problems associated with SO2. The continuingmodeling battles also illustrates how AQM can breakdown, even for primary pollutants, without appropriateground rules.
Another way to evaluate the performance of theNAAQS, as well as other components of the U.S. AQMsystem, regarding regional loadings of SOx is to compare itwith that of other developed countries for the same pe-riod. Between 1975 and 1990, the combined SOx emissiontotals for the United Kingdom, Germany, and France de-clined by approximately 55%, as compared with an 18%reduction for the United States.182 Despite the fact thatthese countries emitted less than half of U.S. emissions,the absolute reductions they achieved were about thesame as for the United States. The theory under the 1970CAA was that clean new plants meeting New Source Per-formance Standards (NSPS) would eventually replaceolder high-emitting plants. In practice, however, the largecapital expenditures needed to construct new facilities,slower growth because of energy conservation, as well theadditional costs of NSPS and BACT controls, all contrib-uted to decisions to prolong the life span of existinguncontrolled coal-fired power plants (some more than50–60 yr old).4,183 The theory was flawed. Clearly, Amer-ica had some catching up to do.
At the other end of the scale, the decision not to adda short-term SO2 standard meant that a large number oflocalized peak excursions could continue to present risksto asthmatics in such areas. Whereas EPA may have been
Bachmann
Volume 57 June 2007 Journal of the Air & Waste Management Association 683
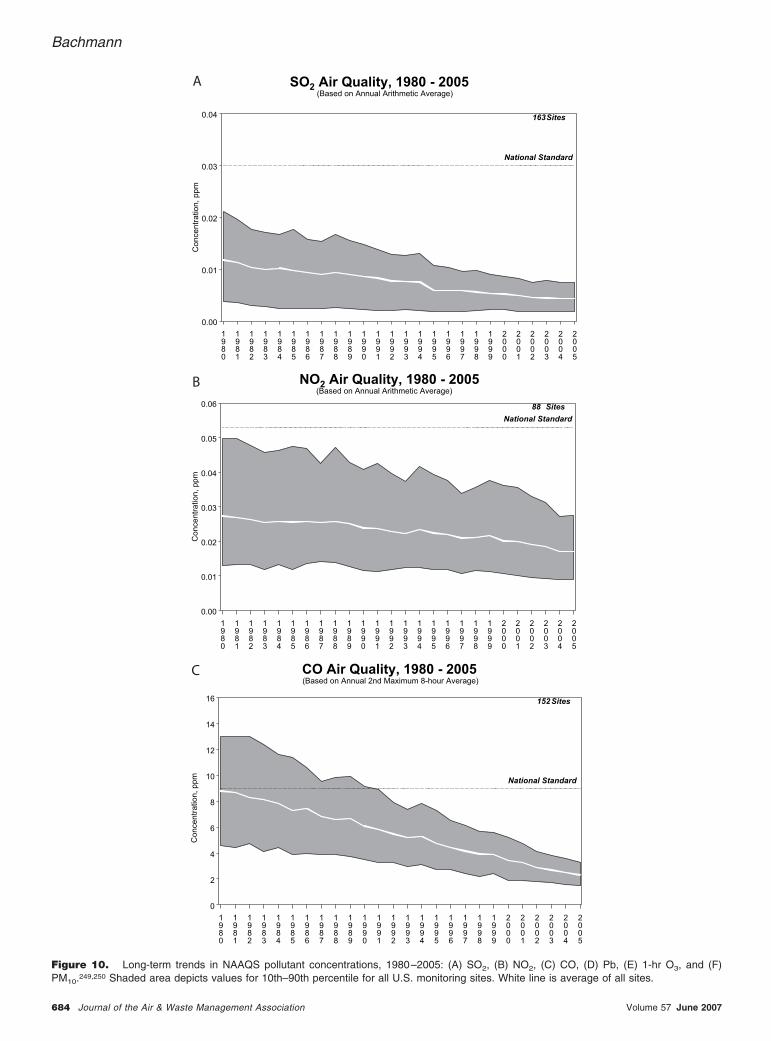
(Based on Annual Arithmetic Average)
Concentration,ppm
0.00
0.01
0.02
0.03
0.04
1980
1981
1982
1983
1984
1985
1986
1987
1988
1989
1990
1991
1992
1993
1994
1995
1996
1997
1998
1999
2000
2001
2002
2003
2004
2005
National Standard
163Sites
SO2 Air Quality, 1980 - 2005A
B(Based on Annual Arithmetic Average)
0.00
0.01
0.02
0.03
0.04
0.05
0.06
1980
1981
1982
1983
1984
1985
1986
1987
1988
1989
1990
1991
1992
1993
1994
1995
1996
1997
1998
1999
2000
2001
2002
2003
2004
2005
National Standard
88 Sites
Concentration,ppm
NO2 Air Quality, 1980 - 2005
C(Based on Annual 2nd Maximum 8-hour Average)
0
2
4
6
8
10
12
14
16
1980
1981
1982
1983
1984
1985
1986
1987
1988
1989
1990
1991
1992
1993
1994
1995
1996
1997
1998
1999
2000
2001
2002
2003
2004
2005
National Standard
152Sites
Concentration,ppm
CO Air Quality, 1980 - 2005
Figure 10. Long-term trends in NAAQS pollutant concentrations, 1980–2005: (A) SO2, (B) NO2, (C) CO, (D) Pb, (E) 1-hr O3, and (F)PM10.249,250 Shaded area depicts values for 10th–90th percentile for all U.S. monitoring sites. White line is average of all sites.
Bachmann
684 Journal of the Air & Waste Management Association Volume 57 June 2007

(Based on Annual 2nd Maximum 1-Hour Average)
0.00
0.05
0.10
0.15
0.20
1980
1981
1982
1983
1984
1985
1986
1987
1988
1989
1990
1991
1992
1993
1994
1995
1996
1997
1998
1999
2000
2001
2002
2003
2004
2005
National Standard
286Sites
Concentration,ppm
Ozone Air Quality, 1980 - 2005E
(Based on Seasonally-Weighted Annual Average)
Concentration,ug/m3
0
10
20
30
40
50
60
1990 1991 1992 1993 1994 1995 1996 1997 1998 1999 2000 2001 2002 2003 2004 200
National Standard
435 Sites
PM10 Air Quality, 1990 - 2005
(Based on Annual Maximum Quarterly Average)
Concentration,ug/m3
0.0
0.5
1.0
1.5
2.0
2.5
1980
1981
1982
1983
1984
1985
1986
1987
1988
1989
1990
1991
1992
1993
1994
1995
1996
1997
1998
1999
2000
2001
2002
2003
2004
2005
National Standard
16 Sites
Lead Air Quality, 1980 - 2005D
F
Figure 10. Cont.
Bachmann
Volume 57 June 2007 Journal of the Air & Waste Management Association 685

correct in handling this issue through its 1998 state-basedintervention level proposal, the process thus far supportsMorag-Levine’s11 contention that the risk-based approachof the CAA can fail to address localized exposures to airpollution. If NAAQS are not the right mechanism, whatalternative approach would move more quickly to addresslocalized issues for criteria and for that matter, toxic pol-lutants? By the 1980s, the risk-based approach to HAPs inSection 112 of the 1970 CAAs had clearly failed whenconfronted with the issue of carcinogens, and Section 111actions mostly concentrated on new sources of criteria pol-lutants. The 1990 CAA Amendments finally broke the HAPsstalemate with the Title III technology-based program.
Air Quality 1980–1990. Figure 10, A–F, depicts U.S. airquality trends for 1980–2005. By 1990, SO2 and NO2 werebecoming less of a problem, at least in terms of the orig-inal standards, and Pb levels had been reduced, not onlyin air but also in children’s blood.184 CO levels continuedto be violate the NAAQS in a number of cities, as was thecase for the new PM10 standards. The delays in the muchanticipated replacement of the TSP NAAQS were matchedby a lack of progress in TSP air quality for 1982–1988(Figure 6). As Steigerwald125 had observed for O3 in 1976,a widespread lack of confidence in the NAAQS reducedthe effort to implement them. Still, the biggest nationalproblem from a SIP standpoint was O3, where a slowimprovement ended with a peak in the hot summer of1988. A meteorologically adjusted regional analysis of1980–1998 1-hr O3 found significant declines for LosAngeles, the Northeast corridor, and the western bank ofLake Michigan, with isolated increases in the South-east.185 The multistate regional episodes of high O3 in theeastern U.S. brought attention to the causes of a phenom-enon that had been well recognized in scientific circles.
The emerging scientific consensus resulted in a majorshift in policy and control strategies for O3. Until the1990s, with the exception of California, SIP strategies forO3 control focused exclusively on controlling VOC emis-sions. Although biogenic VOC emissions were known tobe large, early regional modeling found that removingthem made little difference to O3 levels. Only in laterregional runs did analysts discover that removing anthro-pogenic VOC produced a similar result. The insights pro-vided by field and modeling research studies186–188 andEPA regional simulations suggested that reducing regionalO3 in the East required major reductions of NOx emissionsfrom anthropogenic sources, and that NOx controls couldbe beneficial in urban areas as well.189 An NRC report189
helped advance both science and policy in this area, even-tually facilitating legislation, multistate regional coordi-nation such as the Ozone Transport Assessment Group,and the Ozone Transport Commission, and funding forpublic-private research partnerships including NARSTOand the Southern Oxidants Study.
The O3 problems were not solely related to regionaltransport or chemistry. Many areas in the country failedto meet the 1987 deadlines that had been extended by the1977 CAA for attaining O3, and in some cases CO, stan-dards. Congress and industry commissioned studies toexamine why more progress was not being made.190,191
These studies found a number of factors contributed,
from inadequate assumptions regarding “rule effective-ness” and poor enforcement, to the development of“cheater SIPs” that were encouraged by unreasonabledeadlines. The combination of rising concerns about acidrain and failure to attain the O3 standards coincided withthe arrival of a new president, George W. Bush, who hadpledged to address these issues. This created another oneof those special “moments,” as in 1970, when a consensusemerged that something significant had to be done. Theresult was the CAA Amendments of 1990.192
The development of these amendments is not cov-ered in this review. Although these far-reaching changesrepresented a major development in U.S. AQM, they didnot tinker directly with the NAAQS process. Figure 11illustrates how each of the major amendments to the CAAin 1970, 1977, and 1990 increasingly tweaked each of themajor steps in the evolving U.S. AQM system.
Part III: Riding the Waves (1993–2006)As detailed in the chronology tables, the “third wave” ofNAAQS development (second for Pb) actually began asearly as 1983 for O3 and as late as 1987 for CO. Butwhether standards were ready for decision-making or not,no formal rulemaking occurred after mid-1988 until 1992.This was actually a strategic choice by EPA managementwho, between 1989 and late 1990, were focusing on the1990 CAA Amendments. Analysts in OAQPS and other airoffices were also preoccupied by the amendment effort.The NAAQS represented a distraction both in terms ofpublic communication and in-house effort. Apparently,other stakeholders were also distracted, for the period wasunusually quiet with respect to litigation. That began tochange in 1991–1993, when environmental groups filed aseries of deadline suits to force completion of the O3 andSO2 reviews and to begin the next review of the PMstandards. Given the 1977 5-yr review requirements, EPAhad no defense. EPA’s response to suits requiring comple-tion of ongoing reviews was to issue decisions not torevise the particular standards.
Some of these lawsuits were motivated by the aware-ness of increasing scientific evidence that health effects ofO3 and PM occurred at levels below the standards.193 Theinformation on O3 came from controlled human studiesby EPA and others, as well as some epidemiology andpanel studies. These suggested that prolonged exposures(6–7 hr) to O3 produced effects at lower levels. JoelSchwartz published an increasing body of PM time-seriesepidemiological studies for U.S. cities using TSP and thenew PM10 data, with new long-term results from the Har-vard Six-City and ACS studies.164,194,195 Although detailsof other reviews are summarized in the supplementaltables, the main NAAQS action in the 1990s was about O3
and PM.As the deadline for the lawsuits was approaching, the
1992 elections brought yet another transition at the topof EPA. EPA Administrator William Reilly signed the pro-posed decision not to revise the O3 standard, and incom-ing Administrator Carol Browner issued the final. Thedeadline suit left little choice. A number of the newerstudies had not been reviewed in the 1989 CD update.Browner agreed that it would be better to issue the finaldecision and then begin a forced march to revise the
Bachmann
686 Journal of the Air & Waste Management Association Volume 57 June 2007

criteria and review the NAAQS on that basis. She alsomade a review of the criteria and standards for PM a highpriority.
As shown in Supplemental Tables 1 and 4, the com-pletion of these reviews eventually took on a differentcharacter from those of the past. Initially, criteria and SPstook 2 yr to reach a point for staff to brief management.Unlike the second-term Ruckelshaus and Lee Thomas,Administrator Browner relied more heavily on the AirAssistant Administrator Mary Nichols to wade throughthe details of the scientific assessments. She was briefedon the key issues, findings and staff recommendations,and agreed with her assistants and staff that both stan-dards needed to be revised.
From that point on, Browner focused on strategicconsiderations regarding how such revisions might suc-cessfully be negotiated over executive and legislative op-position. This desire and the technical linkages betweenO3 and PM resulted in a decision to arrange the reviewschedules so as to link the formal regulatory proposal andpromulgation actions together for the two pollutants.Public communications and dealing with Congressionalcommittee staff became a high priority for EPA manage-ment. As a result of these concerted efforts, press coverageand public participation in the process were unprecedent-ed.196 The three simultaneous 2-day public hearings werepacked and EPA received some 70,000 public comments,
a large majority of which favored tighter standards. Theextent of this strong sentiment partially blunted strongopposition to the standards, in the manner that Earth Dayencouraged the 1970 CAA Amendments.
The Greenbaum et al.158 review of the process notedthe difference in interest group involvement pre- andpost-proposal. In the pre-proposal period, such groupstried to influence the scientific basis for EPA’s decisions.These efforts include providing comments to EPA andCASAC on draft CDs and SPs, as well as participating inCASAC meetings. Industry presented analyses findingweaker statistical strength or negative associations be-tween PM and adverse health effects.197,198 NRDC’s re-port199 finding 40,000 deaths/yr from PM was releasedjust before the CASAC meeting on the standards. Duringthe post-proposal period, the emphasis shifted to provid-ing Congress, local elected officials, the media, and thepublic with “spin” on the science.200,201 The emphasis ondiscussion of peer-reviewed science was often replaced bydiscussion of commissioned analyses with results distilledto the “sound bite.”
Nuance and uncertainty were also lacking in EPA’s pub-lic communications after proposal. The agency’s sound bitewas that the science demanded the revisions. Although itwas true that EPA’s assessment of the science found a needto tighten the standards, the particular standards proposedwere obviously not wholly determined by science. The SP
Figure 11. Evolution of the U.S. AQM hybrid approach. The 1970 amendments established NAAQS-driven AQM requirements but addednational rules for new mobile and stationary sources. To address failure to attain, new scientific knowledge, and gaps in protection, majoramendments in 1977 and 1990 added: (1) extended attainment deadlines; (2) increasingly prescriptive requirements for SIPs; (3) incrementalrevisions to address interstate transport; and (4) new national goals for clean air areas (1977) and acid deposition (1990), and provisions forimplementation by the states (PSD, visibility) or the EPA (acid rain trading program) and more.
Bachmann
Volume 57 June 2007 Journal of the Air & Waste Management Association 687

and Federal Register notices aired the key issues and uncer-tainties in the data, the wide disagreement among CASACmembers on the levels, particularly for PM2.5, and the resultsof quantitative risk assessments for both pollutants. Thefinal rule summarized and provided EPA’s responses to allmajor comments and criticisms. The notion that the specificdecisions were a policy choice based on consideration of thescience and risks was clearly expressed. The agency alsoreleased an RIA that showed an estimated range of benefitsassociated with partial attainment of the PM2.5 standardsexpected by 2010 exceeded projected costs by a factor of2–10 and that the costs and benefits for O3 were comparablewith each other.202
The O3 and PM decisions presented an interestingcontrast in terms of the strength and nature of the under-lying evidence as well as the severity of the effects. Thesewere the first NAAQS revisions in which quantitative riskassessments played a major role. Although the PM assess-ment was judged too uncertain to be used to select par-ticular levels, it supported the need to revise the standardand in deciding to make the annual standard the morestringent (controlling) standard relative to the daily. ForPM, the epidemiological evidence for effects at particularlevels was uncertain, but the reported effects were serious,with a large number of individuals at risk. The O3 riskassessment was based largely on lung function and symp-toms from controlled human studies, and applied to as-sess alternative standards in multiple cities, with a smalleranalysis based on hospital admission studies. CASACfound this assessment useful in making its own recom-mendations on the O3 standards.203 Here, the effects weremuch more certain than for PM, but much less severe. Theranges of risk estimated in different cities for alternativestandards partially overlapped, which misled some intothinking the risk assessment had showed no differencesamong them. The differences were often small, but sig-nificant in terms of total numbers.
Congress held several hearings on the NAAQS, andBrowner was steadfast in her support of both standardsagainst some harsh questioning. In May, she had a 1-hrmeeting with President Clinton; she reported that thepresident quickly accepted her decision and spent muchof the time discussing how to reduce unnecessary burdensin the implementation process. This resulted in some ofus writing the first draft of a letter that was later sent byClinton to EPA directing implementation be carried outso as to “maximize common sense, flexibility, and costeffectiveness.”204 The letter called for the agency to com-plete the next review of the standards in the statutorytime frames (i.e., by July 2002) and noted that the need toestablish a monitoring network and collect 3 yr of datawould result in the next PM review being completed be-fore the new PM2.5 standards could be implemented.
The final decisions announced by Clinton in June1997205 were generally similar to what was proposed, withthe long-awaited addition of PM2.5 standards, as well asmore stringent standards for O3. Again, primary standardswere set equal to secondary standards for both pollutants.Congress chose not to exercise its new authority underthe 1996 Congressional Review Act to overturn the stan-dards. In due course, petitions for review were filed by a
large number of parties, addressing a broad range of is-sues. The outcome would hinge not on the voluminousbriefs petitioners filed challenging EPA’s interpretation ofthe science, but would instead focus on the more generalissue so many academic reviews had raised over the years.That is, given a wide range of scientific opinion and noclear thresholds, what criteria do EPA use for making theultimate normative choice on the standards.
In May 1999, a three-judge panel of the D.C. CircuitCourt issued an initial ruling holding that “the growingempirical evidence demonstrating a relationship betweenfine particle pollution and adverse health effects amplyjustifies establishment of new fine particle standards.”(American Trucking Associations vs. EPA, D.C. CircuitCourt, 1999). The panel also found “ample support” forEPA’s decision to regulate coarse particle pollution, butvacated the 1997 PM10 standards, concluding in part thatPM10 is a “poorly matched indicator for coarse particulatepollution” because it includes fine particles. EPA removedthe vacated 1997 PM10 standards. The pre-existing 1987PM10 standards remained in place.
The three-judge panel, however, also held (two toone) that EPA’s approach to establishing the level of thePM and O3 standards promulgated in 1997 effected “anunconstitutional delegation of legislative authority.” Al-though the panel stated that “the factors EPA uses indetermining the degree of public health concern associ-ated with different levels of ozone and PM are reason-able,” it remanded the rule to EPA, stating that when theagency considers these factors for potential nonthresholdpollutants “what EPA lacks is any determinate criterionfor drawing lines” to determine where the standardsshould be set. It also required EPA to consider the possible“beneficent” effects of ground level O3 in terms of pro-tecting against UVb from the sun. The panel again foundthat the administrator is not permitted to consider thecost of implementing those standards in setting them.
Both sides filed cross appeals on these issues to theU.S. Supreme Court. In February 2001, the Supreme Courtissued a unanimous decision upholding EPA’s position onboth the constitutional and cost issues (Whitman vs.American Trucking Associations, 531 U.S. 457, 464, 475–476). On the constitutional issue, the court held that thestatutory requirement that NAAQS be “requisite” to pro-tect public health with an adequate margin of safety suf-ficiently guided EPA’s discretion, affirming EPA’s ap-proach of setting standards that are neither more nor lessstringent than necessary. The Supreme Court remandedthe case to the D.C. Circuit Court of Appeals for resolu-tion of any remaining issues that had not been addressedin that court’s earlier rulings (Id. at 475–476). In March2002, the Court of Appeals rejected all remaining chal-lenges to the standards, holding that EPA’s PM2.5 stan-dards were reasonably supported by the administrativerecord and were not “arbitrary and capricious” (AmericanTrucking Associations vs. EPA, 283 F.3d 355, 369–372, D.C.Circuit Court). EPA subsequently concluded that smallbut unquantifiable benefit of smog-O3, if any, could notoffset the larger known harms and left the standards asoriginally promulgated.206
Some advocates for alternative approaches173,207 crit-icized the Supreme Court’s ruling. Schoenbrod207 suggests
Bachmann
688 Journal of the Air & Waste Management Association Volume 57 June 2007

the court rejected his “non-delegation” argument for “po-litical problems” it might create for the court, and notbased on a sound reading of constitutional law. Ironically,this highlights a problem for Schoenbrod,207 Melnick,13
and others who criticize EPA’s NAAQS decisions as beingbased on factors not openly discussed. No matter howdetailed the written record supporting a policy or judg-ment, it is always possible to suspect other motivations.We might, for example, speculate that the court realizedthat if it had accepted Schoenbrod’s position,207 the resultwould have delayed the standards by years at the possiblecost of tens of thousands of additional premature deaths.Was it politics or precaution?
In terms of air quality, the most important effect ofthese standards was the establishment of major multistatecontrol programs in 1998 and 2005, the “NOx SIP call”and the Clean Air Interstate Rule (CAIR).208 Each of theseprograms is based on adapting the highly cost-effectiveacid rain-style cap-and-trade programs to implementingthe ambient standards.209 Such programs are a goodmatch for reducing the regional component of O3 andfine particles. Preliminary air quality data suggests thatthat the NOx SIP call produced the kinds of O3 reductionsexpected in the first 2 yr of the program.210,211 In the nextdecade, the CAIR rule will result in further significantreductions in fine particles, easing the implementationburden in areas throughout the eastern U.S., with esti-mated costs of $2.6 billion to $3.1 billion and benefits of$86 billion to $100 billion/yr by 2015.212 The new O3 andPM2.5 NAAQS also helped to secure support for tighteremissions standards and lower fuel sulfur regulations pro-mulgated after 1999 for several categories of on- and non-road gasoline and diesel powered mobile sources.4
Both standards have also had the expected effect ofincreasing monitoring for PM2.5 and components, andresearch on the most crucial issues identified in the re-view.213–215 As Schoor216 noted recently, subsequent re-search on exposure, controlled human studies and newand reanalyzed epidemiology for PM support Browner’sdecision to establish the new standards in the face ofuncertainties. Reanalysis of the key long-term health ef-fects studies164 disproved the notion that they were “junkscience” based on problematic “hidden data.” As summa-rized in Supplemental Table 1, the most recent PM re-view217 resulted in a tightening of the 24-hr PM2.5 stan-dard, something Carol Browner said would “not happenin our lifetime.” One guide to the reduction in uncer-tainty for fine particle health effects over the years is thechange in the range of levels CASAC recommended forthe 24-hr standards. In 1986, the range of recommended24-hr standards for PM10 was 140–250 �g/m3.218 In 1996,the range among various panelists for 24-hr PM2.5 wentfrom 20 to over 65 �g/m3.203 But in 2006, the nearlyunanimous consensus of the panel ranged between 30and 35 �g/m3 for 24-hr PM2.5.219 Furthermore, in thisreview the panel believed the EPA staff risk assessmentcould be used in deciding the levels of the standards.Administrator Stephen Johnson chose not to accept thisadvice, and based his decision on an assessment of thestrength of the underlying studies.
Obviously, important issues and uncertainties re-main, notably related to particle composition, the role of
the gas and particle mixtures, and for that matter, whatthe D.C. Circuit will have to say in response to promisedlitigation. Another set of issues for particle pollution isdeveloping improved information on the concentration,composition, and health effects relationships for coarseparticles. The most recent review of this issue was conten-tious because of the limited nature of the effects informa-tion, particularly with respect to coarse particles found inmore rural communities.
The current O3 review is far along enough to con-clude that the 1997 NAAQS are unlikely to be relaxed.Both EPA staff and CASAC have concluded that the in-creased evidence from controlled human studies and ep-idemiology studies suggest the need for more stringent O3
standards.220 It will be interesting to see whether and howthe quantitative risk assessment is used in the decisionson the standard, and also what judgments are made as tothe nature of the effects associated with O3.
THE END OF HISTORY?The Last SPs—A New Process
In late 2005 as the NAAQS team was preparing the PMFederal Register proposal notice for signature, they got anearly Christmas present when EPA Deputy AdministratorMarcus Peacock5 requested a hard look at the process forreviewing the criteria and standards, and for recommen-dations to improve the strength and increase the speed ofthe process. Staff held discussions with stakeholders, in-cluding CASAC, and reviewed the results and recommen-dations of past efforts to improve the process. The finalagency workgroup report5 released in 2006 contains anumber of recommendations to modernize and improvethe efficiency of the process. Scientific assessment wouldbecome more continuous and make better use of currentinformation technology. The “compendium” of all stud-ies would be kept separate from a trimmed down “Inte-grated Science Assessment,”5 which would combine fea-tures of recent CDs with the integrated effects portions ofthe SP. The SP would be replaced with a “Policy Assess-ment Document” that retained the portions of the SP thattranslated the integrated science and the results of sepa-rate staff analysis of risk and exposure into a range ofpolicy alternatives.
As a participant in the workgroup, I believe that, ifwell staffed and implemented, these suggestions wouldresult in more relevant and timely products. The deputyadministrator largely accepted these recommendations,and also decided that future policy assessment materialswould reflect the input of EPA management, and not onlystaff views. He also decided that the policy alternativeswould be released in the form of a final “Advanced Noticeof Proposed Rulemaking” that would be published in theFederal Register and not as a separate policy documentreviewed in advance by CASAC. I am much less enamoredof this last decision, both because it reduces the ability ofCASAC to provide early insights on the presentation, andbecause the nature of Federal Register notices might notpermit the kind of technical depth, illustration, and rigorthat can be attained in a separate document that did nothave the additional costs per page of a notice. In anyevent, the new process is already being put into place asappropriate in the ongoing and planned NAAQS reviews
Bachmann
Volume 57 June 2007 Journal of the Air & Waste Management Association 689

for Pb, NO2, SO2, CO, and PM. The O3 and Pb SPs arelikely the last of their kind.
New Challenges—Back to the FutureThe remarkable progress made over the last 40 yr of AQMin the United States has led some to suggest that it is timeto stop worrying about air pollution and move on theother matters.106 Certainly, conventional air pollution isnot the national priority today that it was at the time ofthe passage of the 1970 CAA Amendments. Few areas donot meet the SO2, NO2, CO, and Pb NAAQS. Yet, we stillhave a significant number of areas that do not meet theO3 and PM2.5 standards, we are decades from approachingthe national visibility goal, and acid and nutrient deposi-tion is still a concern for some ecosystems.4 We are wellon the way to significant new improvements in all ofthese areas, but the end is not fully in sight. Moreover,whereas risks from air pollution are, on average, modest,it is still reasonable to expect that the cumulative effectmay number in tens of thousands of early deaths nation-wide. The “end of air pollution history” advocates find itnecessary to dismiss the recent literature on the healtheffects of PM and O3 as “junk science”, but mainstreamexperts believe the risks remain significant.219–221
The NRC committee on AQM4 views air pollution asa continuing problem. Their 2004 Report4 lists severalmajor challenges that air quality managers will need tocontend with in the upcoming decades together withrecommendations and actions to reshape the AQM pro-cess so that it is better able to meet these challenges. Thefollowing briefly discusses some key challenges, high-lighting issues most related to NAAQS review andimplementation.
Meeting NAAQS for O3 and PM2.5 and Reducing RegionalHaze. As noted above, EPA and the states are alreadyimplementing the kind of multipollutant, multistate con-trol strategies recommended by the NRC to address thesegoals through the “NOx SIP call” and the CAIR “cap-and-trade” programs. But more will be needed, particularly inCalifornia and other western areas that are not part ofthese programs. Post-CAIR nonattainment forecasts forO3 and the 2006 PM2.5 NAAQS208,222 suggest post-CAIRattainment strategies will need to focus on subregionaland urban scale sources. A focus on urban sources ofprimary PM is also consistent with a robust strategy toreduce all of the major components of PM2.5. The 2002review addresses other visibility strategy issues.176,223
Controlling HAPs and Ensuring Environmental Justice. As il-lustrated in this history, NAAQS and hazardous air pol-lutant programs have had little overlap. We noted howdecision makers relied on NAAQS implementation in re-ducing some toxic pollutants. The NRC is calling for amore coordinated and integrated multipollutant pro-grams. Although reductions in urban air pollution havebenefited the substantial poor and minority populationsliving there,224,225 some issues remain. Part II of the pre-vious section discussed how the NAAQS and early imple-mentation of the risk-based version of Section 112 re-sulted in a gap in protection for people who reside very
near localized point sources of pollution. A similar chal-lenge may be presented by emerging information from anumber of epidemiology and roadside measurements thatare suggesting that people who live near heavily traveledhighways are subject to an unusually high risk of in-creased mortality and illness.226 If this proves to be thecase, it could have implications for urban planning, trafficcontrol, and air quality network design, as well as foridentifying approaches to address the source emissionsresponsible.
Protecting against Non-Threshold Pollutants. This restate-ment of a now 30-yr-old NRC observation138 reflects acontinuing challenge that EPA confronted in the 1978 O3
review. But in the early years of the NAAQS, the informa-tion on air pollution effects at lower levels was almostnonexistent, in part because air pollution levels werehigh. The idea of margin of safety as a concentrationbelow the “lowest demonstrated effects level” (not athreshold) made science/policy sense. By the first O3 re-view, EPA staff had restated the concept in terms of “ac-ceptable risk” and worked to improve both quantitativerisk assessment and presentation of qualitative informa-tion in the SP to provide a sense of the risk in terms of itsseverity and its potential societal impact, as indicated bythe size of the sensitive populations exposed at alternativelevels.
As we have seen, continued research on the healtheffects of air pollution over the last 50 yr appears to befinding effects at ever lower concentrations. Many ofthese effects remain adverse, and some are serious, even atlower levels. As the uncertainties are reduced and thetools for quantitative risk assessments are improved, theconcept of interpreting the margin of safety in terms ofacceptable risk will force decision makers to face harderchoices. For policy makers, there is a substantial differ-ence in the following two hypothetical risk statements: 1)“mortality effects may extent to lower levels than thosemeasured in this study” and 2) “based on subjective prob-ability encoding of expert judgment and the underlyingepidemiology, there is a 95% probability that between1000 and 5000 additional deaths will occur nationwide atthat level.”
It is not clear that we have reached that point yet, asevidenced by extensive science and risk-based argumentssubmitted by a number of groups who opposed tighten-ing the PM NAAQS.227–230 Still, the NRC is right to suggestthat may be where things are heading, and this issue willcontinue to be raised in the context of the NAAQS. TwoD.C. Circuit Court judges have already suggested theadoption of generic principles for acceptable risk deci-sions in NAAQS. An example is the one-in-a-million inci-dence rate sometimes used in making decisions on car-cinogens. Yet we know far more about each of the highlystudied criteria pollutants than we do about most toxic airpollutants. Given the widely divergent nature of the ef-fects and populations exposed among these six pollutants(Supplemental Tables 1–7), this is a daunting task. Howdoes one develop a “common risk metric” to comparetime to angina attack with reduced IQ in children or a15% reduction in lung function (e.g., FEV) in an asth-matic? Some suggest placing an economic value on such
Bachmann
690 Journal of the Air & Waste Management Association Volume 57 June 2007

effects as a metric, perhaps in terms of “quality of lifeyears (QALYs).”173 But others17,231 find methodologicaland ethical issues with use of such an approach as anenvironmental policy decision rule. The QALY approach,which discounts the values assigned to the lives of asth-matics or the elderly, would represent a departure fromthe CAA focus on protecting sensitive populations.
Since 1970, Congress and the courts consistentlyhave concluded that an explicit consideration of costsand benefits in setting the NAAQS is not permitted. Costsand feasibility have, however, repeatedly been central todecisions about the extent and timing of the implemen-tation of the standards. This has occurred in state andlocal actions, in EPA policy decisions, and in Congres-sional actions to extend deadlines and alter requirementsfor attainment in the 1977 and 1990 CAA Amendments.Experience shows that setting unrealistic attainmentdeadlines leads to problems in implementation from fail-ure to respond to the development and approval of paperprograms that cannot be implemented or that containedrigged attainment demonstrations.191
Those who argue that the system would be moreefficient if NAAQS decisions reflected a balance of costsand benefits173 typically fail to recognize this would notnecessarily the case, even in theory. For example, in bal-ancing the national costs and benefits of tightening theO3 NAAQS, the costs might well be driven by a limitednumber of locations such as Southern California and theNortheast Corridor, whereas other areas of the countrymight meet the NAAQS at lower costs. The result would bea national standard that is less stringent because of highcosts in a limited number of areas, which means less than“optimal protection” in much of the country. The currentsystem can be theoretically more efficient by allowingmore localized consideration of costs and feasibility andadjusting attainment deadlines that vary with the severityof the problem. It also provides an incentive to continuemaking progress even in areas that do not attain. This hasindeed been the experience in Southern California.
As for the NAAQS themselves, various observers havesuggested that because they are not set at zero, as wouldappear necessary if there is no threshold, costs must havebeen taken into account, with the “real” rationale leftunexplained. But as we have seen in the 1979 O3 pream-ble and the 2001 Supreme Court decision, EPA adminis-trators are clearly aware that NAAQS decisions have sig-nificant societal consequences and a balance is struckbetween establishing a standard that the administratorjudges results in an acceptable risk. Congress was aware in1977 and 1990 that NAAQS do not provide an absolutelevel of safety, and continued to place the decision in thehands of a politically responsible decision-maker, not apanel of scientists. This does not mean that the decision isunfettered. The scientific review and policy assessmentsplace limits on the range of supportable alternatives. Thejudicial review, although typically giving great deferenceto the administrator’s decisions, is a check against whollyunreasonable decisions that are clearly not supported bythe science. Meanwhile, both Congress and the public areapprised of the scientific uncertainties, risks, as well ascosts and benefits of alternative decisions through thepublication of the risk and policy assessments and RIAs
that accompany the NAAQS decisions. This oversight alsoserves as a long-term check on the system.
In practice, NAAQS decisions and resulting imple-mentation have not resulted in the kinds of problemsfeared by some.13,92 Between 1970 and 1990, the esti-mated benefits of the evolving system actually increasedat a faster rate than costs.232 If future developments sug-gest changes are necessary or desirable, then the initialfocus should be on expanded authority or specific legis-lative rules for cost-effective multipollutant emissions re-ductions from existing sources. The acid rain cap, forexample, has proven to be less litigious, faster to imple-ment, and easier to enforce than ambient standards. Aproblem with such legislative rules is that it may take anact of Congress to change them. An alternative that rec-ognizes the more recent science is national, regional, orlocal declining emissions caps, or rate of progress require-ments that are dependent on more systematic account-ability measures than are possible with limited ambientmonitoring. The acid rain cap experience shows the crit-ical importance of continuous emissions monitoring tosuch programs. Ambient standards or targets still play avital role by providing a metric against which to judgeprogress, to compare areas, and to stimulate additionalresearch into the nature of the benefits and costs of airprograms.
Climate Change and Intercontinental Transport. These arelong-term issues with multiple dimensions. An obviousAQM concern is that air strategies may need to be ad-justed to compensate for changes in temperature andweather patterns that accompany climate “forcings.”233
But an equally important dimension is how to integratetraditional air quality programs with the programs andstrategies that are likely to be aimed at limiting climatechange in the future. Some state air programs are alreadyfacing the issue. The prospects for near-term legislation234
are enhanced by the recent Supreme Court ruling that theCAA provides EPA authority to regulate CO2 (Massachu-setts et al. vs. Environmental Protection Agency et al., D.C.Circuit Court, 2007). A related issue is the internationaltransport of conventional air pollution,235 which can af-fect progress in attaining NAAQS and visibility goals,97,176
and PM and O3 also affects climate236,237 by radiativeforcing (e.g., warming and cooling by various particles),and nucleation effects on the location and amount ofprecipitation.238 Consideration of climate effects suggestsstrategies to address background O3 should reduce meth-ane, not NOx.
The remaining NRC challenge, protecting ecosystems,is discussed in part II of the previous section.
The CAA Advisory Committee (CAAAC) Recommendations.In 2004, EPA asked the multi-stakeholder CAAAC to beginworking on the NRC recommendations to improve theAQM process. In early 2005, a CAAAC AQM subcommit-tee issued a Phase I report containing 47 interim recom-mendations related to accountability, streamlining ap-provals and other aspects of the system.6 Phase II is
Bachmann
Volume 57 June 2007 Journal of the Air & Waste Management Association 691

nearing completion.7 CAAAC is actively considering ap-proaches that would replace the current NAAQS pollut-ant-specific SIP process with comprehensive AQM plan-ning. This process would create comprehensive AQMplans that result in an integrated, multiple pollutant ap-proach to managing air quality that would encompassboth criteria and HAPs. Based on the Phase I recommen-dations, the approach would put less emphasis on upfrontmodeling demonstrations in SIP development, and moreon accountability measures that would trigger additionalmeasures if the plan proved to be inadequate. Making thisapproach work would require a number of accommoda-tions at all levels of government, but it appears to beworth the effort.
CONCLUSIONSThis review is timed to coincide with the celebration ofthe 100th anniversary of A&WMA. It has examined over100 yr of air pollution history in an effort to illuminatehow we arrived at the present hybridized U.S. AQM sys-tem. We have seen that the lack of progress in addressingoppressive levels of coal smoke and gases between 1900and 1940 appears largely because of a common view thatthe air pollution “nuisance” was inextricably linked toeconomic progress. With few exceptions, notably theMellon Foundation, there was little scientific curiosityabout the effects, amounts, and nature of air pollutionand no comprehensive urban programs to reduce it untilthe 1940s. The emergence of Los Angeles smog and theDonora and London episodes did much to kindle a na-tional recognition of the problems, which in turn stimu-lated funding for research and monitoring needed to un-derstand and address them.
Although at least one visionary grasped the potentialvalue of pollutant-specific ambient air quality limits inthe 1930s, the first attempts to develop them in theUnited States came from officials in Los Angeles and Cal-ifornia in 1955 and 1959. The first federal legislationmandating an AQM program driven by regional ambientstandards was the 1967 CAA. An alternative approach,uniform technology standards on stationary as well asmobile sources, was set aside. Societal and political forcesin the 1968–1970 prompted the more far reaching andchallenging 1970 CAA, which established the basic frame-work still in use.
From 1971 onward, experience in implementing theCAA provisions, advances in scientific and technical in-formation, and changes in economic, energy, and societalconditions have resulted in changes in the practice of allaspects of AQM, as well as legislative changes, many ofwhich have resulted in improving the efficiency and ef-fectiveness of the system. Making improvements based oncontinuous monitoring and assessment of what worksand what doesn’t is the principal advantage of the AQMsystem, as summarized in Figure 2. As a result, by almostany measure, U.S. air quality today is dramatically im-proved over 1970, with cumulative benefits estimated intrillions of dollars.
Yet not every program worked as well as intended,and delays and administrative burdens have plagued theapproach as well. The administrative burdens had eco-nomic and efficiency consequences for affected parties,
and hurt the overall credibility of the program. Somedelays in standard setting and implementation prolongedeffects on public health and the environment that mightwell be measured in hundreds of billions of dollars inbenefits foregone.
NAAQS-driven AQM was initially most successful inreducing primary particles and gases from stationarysources in urban and industrial areas. The federal andCalifornia automotive standards began making signifi-cant reductions after introduction of the catalytic con-verter in 1975. As understanding of effects and atmo-spheric sciences improved through the 1980s and 1990s,AQM programs in California and portions of the East werebetter able to address O3, and later PM2.5. Between 1975and 1990, however, other developed countries did farmore than the United States to reduce total loadings ofSOx. The 1990 CAA represented a breakthrough with thehighly effective market-based program for power sectorSOx emissions, and technology based standards for HAPs.Even though market-based SOx programs had been ad-vanced by the Nixon administration as early as 1971,239 itis not clear they could have functioned well withoutadequate emissions monitoring systems.232 During thisperiod, the NAAQS and periodic reviews provided impor-tant benchmarks that stimulated important new research,required development of improved state and local controlprograms, and drove increasingly stringent national legisla-tive and regulatory limits for mobile sources. After someunfortunate delays, the PM2.5 and O3 NAAQS have resultedin recent major new cap-and-trade programs that will con-tinue to reduce multiple stationary source pollutants.
As noted in the previous sections, we are not quitefinished, and a number of challenges remain to be ad-dressed. The CAAAC recommendations reflects a growingunderstanding that AQM must do a better job of integrat-ing with other priorities facing state and local govern-ments, such as smart growth and related national issuessuch as energy policy and climate programs. We appear tobe at one of those critical times when a science-policy-political consensus may emerge with respect to legislationon climate, and this may well be accompanied by a re-opening of the CAA. We need to be ready. The NRC andCAAAC recommendations are a good place to start. Therecursive approach to AQM is a sound idea. Happy birth-day AWMA, and as the song says, if we keep working atthis circle, “there’s a better home a waitin’ in the sky.”240
ACKNOWLEDGMENTSThanks to the A&WMA’s Critical Review Committee forthe opportunity to address this broad topic as I completedmy EPA career. I particularly recognize Drs. Judith Chowand John Watson at Desert Research Institute (DRI) fortheir guidance and thoughtful comments on the drafts, aswell as the support of DRI’s Jo Gerrard, who formatted themanuscript, including figures, tables, and references, andMary MacLaren, who recorded the references. Eric Diet-erle and his editing group in the Engineering Communi-cations and Marketing Department at Iowa State Univer-sity provided editing support as well. Members of theCommittee and Susan Wierman (Mid-Atlantic RegionalAir Management Association) provided helpful com-ments on an interim draft. Many former EPA colleagues
Bachmann
692 Journal of the Air & Waste Management Association Volume 57 June 2007

(some retired) provided references, figures, historical in-sights, or reviews of some sections. These include HarveyRichmond, John Hannon, Steven Silverman, Gerry Glea-son, Neil Frank, Douglas Solomon, David Mintz, DaveMckee, William Wilson, Joann Rice, Dale Evarts, RobBrenner, Alan Basala, Les Grant, Michael Berry, JohnO’Connor, Bob Neligan, Darryl Tyler, Mike Jones, JoePaisie, Tom Helms, Barry Gilbert, Joe Tikvart, Bill Cox,and John Silvasi. I also appreciated insights and assistancefrom Rudi Husar (Washington University in St. Louis),Arlene Fiore (National Oceanic and Atmospheric Admin-istration), Peter Mueller (TropoChem), Dan Greenbaum(Health Effects Institute), James Reisa (NAS), and MikeKoerber (Lake Michigan Air Directors Consortium). Thestaff and collection at the EPA library in Research TrianglePark, NC, were invaluable in accessing historical docu-ments on legislative history, early editions of the Sterncompendium, and out-of-print PHS documents. LisaBucher and Andy Knopes of A&WMA provided timelyassistance and guidance during production of the paperand the platform presentation.
REFERENCES1. U.S. Environmental Protection Agency. National Primary and Sec-
ondary Ambient Air Quality Standards. Fed. Regist. 1971, 36, 8186.2. Lewis, J. The birth of EPA. EPA J. 1985 11, 6-11.3. The Clean Air Act Amendments of 1970-P.L. 91-604 (December 31,
1970), Plus Technical Amendments Made by P.L. 92-157 (November18, 1971).
4. National Research Council. Air Quality Management in the UnitedStates; The National Academies Press: Washington, DC, 2004.
5. Peacock, M. Memorandum from Marcus Peacock, Deputy Adminis-trator to Dr. George Gray and Bill Wehrum. Process for Reviewing theNational Ambient Air Quality Standards, December 7, 2006; availableat http://www.epa.gov/ttn/naaqs/memo_process_for_reviewing_naaqs.pdf(accessed 2007).
6. Recommendations to the Clean Air Act Advisory Committee: Phase I andNext Steps; Air Quality Management Work Group, 2005; available athttp://www.epa.gov/air/caaac/aqm/report1-17-05.pdf (accessed 2007).
7. Recommendations to the Clean Air Act Advisory Committee: Phase II DraftReport; Air Quality Management Work Group: Research Triangle Park,NC, 2007, Draft Report.
8. De Nevers, N.H.; Neligan, R.E.; Herschel, H.S. Air Quality Manage-ment, Pollution Control Strategies, Modeling, and Evaluation; In AirPollution, Volume V: Air Quality Management; Stern, A.C., Ed.; Aca-demic Press: New York, NY, 1977.
9. O’Fallon, J.E. Deficiencies in the Air Quality Act of 1967; Law Con-temp. Problems 1968, 33, 275-296.
10. Sussman, V.H. New Priorities in Air Pollution Control; J. Air Poll.Control Assoc. 1971, 21, 201-203.
11. Morag-Levine, N. Chasing the Wind: Regulating Air Pollution in theCommon Law State; Princeton University Press: Princeton, NJ, 2003.
12. Colburn, J.E. The Future of Air Pollution Control in the CorporatistState. Environ. Law Report 2004, 34, 10577.
13. Melnick, R.S. Regulation and the Courts; The Brookings Institution:Washington, DC, 1983.
14. Schoenbrod, D. Goals Statutes or Rules Statutes: the Case of the CleanAir Act. UCLA Law Rev. 1983, 30, 740.
15. Feller, J.M. Non-Threshold Pollutants and Air Quality Standards.Environ. Law 1994, 24, 833.
16. Wagner, W.E. The Science Charade in Toxic Risk Regulation; Colum-bia Law Rev. 1995, 95, 1613-1723.
17. Latin, H. Ideal Versus Real Regulatory Efficiency: Implementation ofUniform Standards and “Fine-Tuning” Regulatory Reforms; StanfordLaw Rev. 1985, 37, 1267-1332.
18. deNevers, N. Air Pollution Control Philosophies; J. Air Poll. ControlAssoc. 1977, 27, 197-205.
19. Schakenbach, J.; Vollaro, R.; Forte, R. Fundamentals of SuccessfulMonitoring, Reporting, and Verification under a Cap-and-Trade Pro-gram; J. Air & Waste Manage. Assoc. 2006, 56, 1576-1583.
20. Stradling, D. Smokestacks and Progressives: Environmentalists, Engineers,and Air Quality in America, 1881–1951; Johns Hopkins UniversityPress: Baltimore, MD, 1999.
21. Melosi, M.V. Environmental Crisis in the City: the Relationshipbetween Industrialization and Urban Pollution; In Pollution and Re-form in American Cities, 1870–1930; Melosi, M.V. Ed.; University ofTexas Press: Austin, TX, 1980.
22. Grinder, R.D. The Battle for Clean Air: the Smoke Problem in Post-Civil War America; In Pollution and Reform in American Cities, 1870–1930; Melosi, M.V. Ed.; University of Texas Press: Austin, TX, 1980,pp 83-103.
23. Davidson, C.I. Air Pollution in Pittsburgh: a Historical Perspective; J.Air Poll. Control Assoc. 1979, 29, 1035-1041.
24. Gugliotta, A. Ph.D. Dissertation. Hell with the Lid Taken Off: aCultural History of Air Pollution—Pittsburgh. University of NotreDame, Notre Dame, IN, 2004.
25. Stern, A.C. History of Air Pollution Legislation in the United States; J.Air Poll. Control Assoc. 1982, 32, 44-61.
26. Mellon Institute of Industrial Research and School of Specific IndustriesSmoke Investigation; University of Pittsburgh: Pittsburgh, PA, 1914.
27. Smoke Abatement and Electrification of Railway Terminals in Chicago;Chicago Association of Commerce Committee: Chicago, IL, 1915.
28. Goklany, I.M. Clearing the Air. The Real Story of the War on Air Pollu-tion; CATO Institute: Washington, DC, 1999.
29. More Soot Here than in Pittsburgh; The New York Times. April 1, 1928.30. City Air Pollution Is Below Average. Atmosphere, with 1.33 Tons,
Was Cleaner in 1936 than in 1935, Bureau Finds. Mercury aboveNormal. Mean for Year, 53 Degrees, 4 Higher than Usual—Sun Shone61% of Time; The New York Times. January 24, 1937.
31. St. Louis Clean Air Regional Partnership. St. Louis Then and Now: aHistory of Air Quality Concerns; 2005; available at http://www.cleanair-stlouis.com/local-air-quality.html (accessed 2007).
32. Tarr, J.A. Changing Fuel-Use Behavior and Energy Transitions: thePittsburgh Smoke-Control Movement, 1940–50; In The Search for theUltimate Sink: Urban Pollution in Historical Perspective; The Universityof Akron Press: Akron, OH, 1996, pp 227–261.
33. Husar, R.B.; Holloway, J.M.; Patterson, D.E.; Wilson, W.E. Spatial andTemporal Pattern of Eastern U.S. Haziness: a Summary; Atmos. Envi-ron. 1981, 15, 1919-1928.
34. Tarr, J.A. Devastation and Renewal: an Environmental History of Pitts-burgh and Its Region; University of Pittsburgh Press: Pittsburgh, PA,2003.
35. Brimblecombe, P. The Big Smoke: a History of Air Pollution in Londonsince Medieval Times; Methuen & Co. Ltd.: London, U.K., 1987.
36. Brimblecombe, P.; Rodhe, H. Air Pollution—Historical Trends; Dura-bility Build. Mater. 1988, 5, 291-308.
37. Uekoetter, F. Divergent Responses to Identical Problems: Business-men and the Smoke Nuisance in Germany and the United States,1880–1917; Business History Rev. 1999, 73, 641-676.
38. Uekoetter, F. The Merits of the Precautionary Principle: ControllingAutomobile Exhausts in Germany and the United States before 1945;In Smoke and Mirrors: the Politics and Culture of Air Pollution; DuPuis,E.M., Ed.; NYU Press: New York, 2004.
39. Pittsburgh Legal Journal Versailles Borough v McKeesport Coal &Coke Co. Pittsburgh Legal J. 1935, 83, 379.
40. Galishoff, S. Triumph and Failure: the American Response to theUrban Water Supply Problem, 1860–1923; In Pollution and Reform inAmerican Cities, 1870–1930; Melosi, M.V., Ed.; University of TexasPress: Austin, TX, 1980.
41. Tarr, J.A.; McCurley, J.; Yosie, T.F. The Development and Impact ofUrban Wastewater Technology Changing Concepts of Water QualityControl, 1850–1930; In Pollution and Reform in American Cities, 1870–1930; Melosi, M.V., Ed.; University of Texas Press: Austin, TX, 1980.
42. Klotz, O.; White, W.C. Papers on the Influence of Smoke on Health.Smoke Investigation Bulletin No. 9; Mellon Institute of Industrial Re-search, University of Pittsburgh: Pittsburgh, PA, 1914.
43. Cohoe, B.A. The Relation of Atmospheric Smoke and Health; InPapers on the Influence of Smoke on Health. Smoke Investigation BulletinNo. 9; Klotz, O.; White, W.C. Eds.; Mellon Institute of IndustrialResearch, University of Pittsburgh: Pittsburgh, PA, 1914.
44. Gugliotta, A. How, When, and for Whom Was Smoke a Problem inPittsburgh? In Devastation and Renewal. An Environmental History ofPittsburgh and Its Region; Tarr, J.A. Ed.; University of Pittsburgh Press:Pittsburgh, PA, 2003, pp 110-125.
45. Cutler, D.M.; Meara, E. Changes in the Age Distribution of Mortality overthe 20th Century; Harvard University: Cambridge, MA, 2001.
46. Hobbs, F.; Stoops, N. Demographic Trends in the 20th Century—Census2000 Special Reports; Censr-4; U.S. Department of Commerce, Eco-nomics and Statistics Administration, U.S. Census Bureau, 2002.
47. Bergmeier, M. Review of Frank Uekotter, Von der Rauchplage zurOkologischen Revolution: Eine Geschichte der Luftverschmutzungin Deutschland und den USA 1880–1970. H-German, H-Net Rev.2005;availableat:http://h-net.msu.edu/cgi-bin/logbrowse.pl?trx�vx&list�h-german&month�0510&week�b&msg�c4ryOd4xdlcZHvo9QnZ8Tg&user�&pw� (accessed 2007).
48. Furman, B. Government Spurs Poisoned Air Study. Report on Do-nora, PA, Calls It National Problem—Staten Island Pollution Sifted.Federal Help Is Provided. Public Health Service Asking $250,000 Morefor Work as 15 Cities Request Aid; The New York Times. October 14,1949.
49. Schrenk, H.H.; Heimann, H.; Clayton, G.D.; Gafafer, W.M.; Wexler,H. Air Pollution in Donora PA, Epidemiology of the Unusual Smog Episode
Bachmann
Volume 57 June 2007 Journal of the Air & Waste Management Association 693

of October 1948; Public Health Bull 306; U.S. Government PrintingOffice: Washington, DC, 1949.
50. Meuse Valley Deaths Due to Odd Conditions. Atmospheric Combi-nation Rare, Liege Police Commission Asserts in Report; The New YorkTimes. October 25, 1931.
51. Robinson, E. Effects of Air Pollution on Visibility; In Air Pollution;Stern, A.C., Ed.; Academic Press: New York, NY, 1962.
52. Dunsby, J. Localizing Smog: Transgressions in the Therapeutic Land-scape; In Smoke and Mirrors: the Politics and Culture of Air Pollution;DuPuis, E.M., Ed.; NYU Press: New York, NY, 2004, p 172.
53. Jones, C.O. Clean Air: the Policies and Politics of Pollution Control;University of Pittsburgh Press: Pittsburgh, PA, 1975.
54. First Chief Named for Air Pollution; The New York Times. November16, 1952.
55. Bradley, C.E.; Haagen-Smit, A.J. The Application of Rubber in theQuantitative Determination of Ozone. Rubber Chem. Technol. 1951,24, 750.
56. Haagen-Smit, A.J. Chemistry and Physiology of Los Angeles Smog;Ind. Eng. Chem. 1952, 44, 1342-1346.
57. California Air Resources Board. California’s Air Quality History KeyEvents; 2007; available at http://www.arb.ca.gov/html/brochure/history.htm (accessed 2007).
58. Lung Ills in London Rise in Wake of Fog; The New York Times.December 12–13, 1952.
59. London Struck Again by Lung-Stinging Fog; The New York Times.December 28, 1952.
60. Air Quality Criteria for Particulate Matter; AP-49; U.S. Department ofHealth, Education, and Welfare: Washington, DC, 1969.
61. Air Quality Criteria for Sulfur Oxides; AP-50; U.S. Department ofHealth, Education, and Welfare: Washington, DC, 1969.
62. Air Pollution Measurements of the National Air Sampling Network. Anal-ysis of Suspended Particulate Samples Collected 1953–1957; U.S. Depart-ment of Health, Education, and Welfare: Washington, DC, 1958.
63. South Coast Air Quality Management District. The Southland’s War onSmog: Fifty Years of Progress toward Clean Air; South Coast Air QualityManagement District, 1997.
64. Box, G.E.P.; Tiao, G.C. Intervention Analysis with Applications toEconomic and Environmental Problems. J. Am. Stat. Assoc. 1975, 70,70.
65. Goldsmith, J.R. Effects of Air Pollution on Humans; In Air Pollution,Vol. 1; Stern, A.C. Ed.; Academic Press: New York, NY, 1962.
66. Stern, A.C. Air Pollution Standards; In Air Pollution, Vol. 2; Stern, A.C.Ed.; Academic Press: New York, NY, 1962.
67. Air Quality Criteria for Photochemical Oxidants; AP-64; U.S. Departmentof Health, Education, and Welfare: Washington, DC, 1970.
68. Gugliotta, A. The Smoky City between the Wars; In Smoke and Mir-rors: the Politics and Culture of Air Pollution; DuPuis, E.M., Ed.; NYUPress: New York, NY, 2004, p 105.
69. California Maps Attack on Smog—Brown Signs Bill for Study byHealth Department—Special Session Seen; The New York Times. June14, 1959.
70. U.S. Senate, Committee on Public Works. A Study of Pollution—Air;Staff Report; 88th Congress, 1st Session: Washington DC, 1963.
71. Carson, R. Silent Spring; Ballantine: New York, NY, 1962.72. Martin, R.; Symington, L. A Guide to the Air Quality Act of 1967; Law
Contemp. Problems 1968, 33, 239-245.73. Bogan, B.W. Present Approach to Control of Motor Vehicle Exhaust
Emissions; In Proceedings: The Third National Conference on Air Pollu-tion; Publication No. 1669; U.S. Public Health Service: Washington,DC, 1966.
74. Air Quality Criteria for Nitrogen Oxides; U.S. Environmental ProtectionAgency: Washington, DC, 1971.
75. Air Quality Criteria for Carbon Monoxide; AP-62; U.S. Department ofHealth, Education, and Welfare: Washington, DC, 1970.
76. State Won’t Require Used Cars to Carry Antipollution Devices; TheNew York Times. September 29, 1966.
77. Fensterstock, J.C.; Fankhauser, R.K. Thanksgiving 1966 Air PollutionEpisode in the Eastern United States; U.S. Department of Health, Edu-cation, and Welfare: Durham, NC, 1968.
78. U.S. Department of Health, Education, and Welfare. Proceedings: TheThird National Conference on Air Pollution, Washington, DC, December12–14, 1966; Public Health Service Publication No. 1649; Office ofLegislative and Public Affairs, National Center for Air Pollution Con-trol: Washington, DC, 1967.
79. Gardner, J.W. Keynote Address: Control Now—for Clean Air; InProceedings, Third National Conference on Air Pollution; U.S. Depart-ment of Health, Education, and Welfare: Washington, DC, 1969, p15.
80. Muskie, E.S. Setting Goals for Clean Air; In Proceedings, Third NationalConference on Air Pollution; U.S. Department of Health, Education,and Welfare: Washington, DC, 1969, p 597.
81. National Emissions Standards Study. Report of the Secretary of HealthEducation and Welfare to the United States Congress in Compliance withthe Air Quality Act of 1967; U.S. Department of Health, Education, andWelfare: Washington, DC, 1970.
82. Reitze, A.W., Jr. The Legislative History of U.S. Air Pollution Control;Houston Law Rev. 1995, 36, 679.
83. U.S. Senate, Committee on Public Works. Air Pollution—1967, Hear-ings before the Subcommittee on Air and Water Pollution of the SenateCommittee on Public Works; on S. 780, 90th Congress, 1st Session,1967.
84. Iglauer, E. The Ambient Air; New Yorker. April 13, 1968.85. Whole Earth Catalog; Portola Institute: Menlo Park, CA, 1969.86. Nelson, G. Beyond Earth Day—Fulfilling the Promise; University of
Wisconsin Press: Madison, WI, 2002.87. Air Quality Criteria for Hydrocarbons; AP-64; U.S. Department of
Health, Education, and Welfare: Washington, DC, 1970.88. A Legislative History of the Clean Air Amendments of 1970, Vol. 2; Serial
No. 23-18; Environmental Policy Division, Congressional ResearchService, Library of Congress: Washington, DC, 1974.
89. Esposito, J.C. Vanishing Air; the Ralph Nader Study Group Report on AirPollution; Grossman Publishers: New York, NY, 1970.
90. Barth, D. Federal Motor Vehicle Emissions Goals for CO, HC, andNOx Based on Desired Air Quality Levels; J. Air Poll. Control Assoc.1970, 20, 519-527.
91. A Legislative History of the Clean Air Amendments of 1970, Vol. 1; SerialNumber 93-18; Environmental Policy Division, Congressional Re-search Service, Library of Congress: Washington, DC, 1974.
92. Blair, R.D. Problems of Pollution Standards: the Clean Air Act of1970; Land Econ. 1973, 49, 260-268.
93. National Trends in Trace Metals in Ambient Air 1965–1974; EPA-450/1-77-003; Office of Air and Waste Management, Office of Air QualityPlanning and Standards. U.S. Environmental Protection Agency: Re-search Triangle Park, NC, 2007.
94. Special Report: Trends in Concentrations of Benzene-Soluble SuspendedParticulate Fraction and Benzo(a)pyrene 1960–1972; EPA-450/2-74-022;Office of Air and Waste Management, Office of Air Quality Planningand Standards, U.S. Environmental Research Agency: Research Tri-angle Park, NC, 1974.
95. U.S. Environmental Protection Agency. National Air Quality and Emis-sions Trends Report, Volume 1, 1973; EPA/450-1-73-001-a; U.S. Gov-ernment Printing Office: Washington, DC, 1973.
96. U.S. Environmental Protection Agency. Monitoring and Air QualityTrends Report—1972; EPA/450/1-73-004; U.S. Government PrintingOffice: Washington, DC, 1972.
97. Protecting Visibility: an EPA Report to Congress; EPA-450/5-79-008; U.S.Environmental Protection Agency, Office of Air, Noise & Radiation,Office of Air Quality Planning and Standards: Research Triangle Park,NC, 1979.
98. Position Paper on Regulation of Atmospheric Sulfates; EPA-450/2-75-007;U.S. Environmental Protection Agency, Office of Air and Waste Man-agement, Office of Air Quality Planning and Standards: ResearchTriangle Park, NC, 1975.
99. Mueller, P.K.; Hidy, G.M.; Watson, J.G.; Baskett, R.L.; Fung, K.K.;Henry, R.C.; Lavery, T.F.; Warren, K.K. The Sulfate Regional Experiment(SURE): Report of findings (Vols. 1, 2, and 3); EA-1901; Electric PowerResearch Institute: Palo Alto, CA, 1983.
100. National Research Council. Acid Deposition. Atmospheric Processes inEastern North America. A Review of Current Scientific Understanding;National Academy Press: Washington, DC, 1983.
101. National Academy of Sciences. Acid Deposition: Effects on GeochemicalCycling and Biological Availability of Trace Elements; National Acade-mies Press: Washington, DC, 1985.
102. National Research Council. Acid Deposition: Long-Term Trends; TheNational Academies Press: Washington, DC, 1986.
103. NAPAP. National Acid Precipitation Assessment Program: 1990 Inte-grated Assessment Report, 24 Volumes; National Acid PrecipitationAssessment Program, Office of Director: Washington, DC, 1991.
104. U.S. Environmental Protection Agency. Summary of Selected New In-formation on Effects of Ozone on Health and Vegetation: Supplement to1986 Air Quality Criteria for Ozone and Other Photochemical Oxidants;EPA/600–8-88/105F; Office of Health and Environmental Assess-ment, Environmental Criteria and Assessment Office: Research Tri-angle Park, NC, 1992.
105. Schwartz, J. Finding Better Ways to Achieve Cleaner Air. (AmericanEnterprise Institute: Washington, DC, 2004); available at http://www.aei.org/publications/pubID.21225/pub_detail.asp (accessed 2007).
106. Schwartz, J. Breathing Easier about Air Quality; 2006. An EconomicPolicy Lecture Presented by Lindenwood University and Institute forStudy of Economics and the Environment. ISEE. Series 10; availableat http://www.joelschwartz.org/pdfs/ISEESchwartzFINAL.pdf (accessed2007).
107. Crandall, R.W. Controlling Industrial Pollution: the Economics of CleanAir; Brookings Institution: Washington, DC, 1983.
108. U.S. Environmental Protection Agency. National Primary and Sec-ondary Ambient Air Quality Standards and Air Pollution and Con-trol. Notice of Proposed Standards and List of Air Pollutants; Fed.Regist. 1971, 36, 1502-1515.
Bachmann
694 Journal of the Air & Waste Management Association Volume 57 June 2007
109. U.S. Environmental Protection Agency. National Primary and Sec-ondary Ambient Air Quality Standards. Notice of Proposed Standardfor Sulfur Oxides; Fed. Regist. 1971, 36, 5867.
110. Berry, M.A. A Method for Examining Policy Implementation: a Study ofDecision-Making for the National Ambient Air Quality Standards, 1964–1984; U.S. Environmental Protection Agency: Research Triangle Park,NC, 1984.
111. Ruckleshaus, W., EPA Administrator. Washington, DC. Personalcommunication to John Bachmann, Office of Air Quality Planningand Standards, 1983.
112. U.S. Environmental Protection Agency. EPA Sets National Air QualityStandards, 1971; available at http://www.epa.gov/history/topics/caa70/01.htm (accessed 2007).
113. Williams, D.C. The Guardian: EPA’s Formative Years, 1970–1973; EPA202-K-93-002; U.S. Environmental Protection Agency: Washington,DC, 1993.
114. Pedersen, W.F. Formal Records and Informal Rulemaking. Yale Law J.1975, 38, 38-88.
115. Middleton, J.T., Commissioner. Washington, DC. National Air Pol-lution Control Administration Letter to Hon. Jennings Randolph,Chair of the Senate Committee on Public Works, May 19, 1970.
116. National Research Council. Asbestos: the Need for and Feasibility of AirPollution Controls; National Academy of Sciences: Washington, DC,1971.
117. National Research Council. Chromium; National Academy of Sci-ences: Washington, DC, 1974.
118. National Research Council. Guides for Short-Term Exposures of thePublic to Air Pollutants II. Guide for Hydrogen Chloride; National Acad-emy of Sciences: Washington, DC, 1971.
119. National Research Council. Guides for Short-Term Exposures of thePublic to Air Pollutants III. Guide for Hydrogen Fluoride; National Acad-emy of Sciences: Washington, DC, 1971.
120. National Research Council. Guides for Short-Term Exposures of thePublic to Air Pollutants IV. Guide for Ammonia; National Academy ofSciences: Washington, DC, 1972.
121. National Research Council. Guides for Short-Term Exposures of thePublic to Air Pollutants VIII. Guide for Chlorine; National Academy ofSciences: Washington, DC, 1973.
122. National Research Council. Nickel; National Academy of Sciences:Washington, DC, 1975.
123. National Research Council. Particulate Polycyclic Organic Matter; Na-tional Academy of Sciences: Washington, DC, 1972.
124. National Research Council. Vanadium; National Academy of Sci-ences: Washington, DC, 1974.
125. Steigerwald, B.J., Director of Office of Air Quality Planning andStandards. Research Triangle Park, NC. Memorandum to AssistantAdministrator Roger Strelow, Washington, DC. Approaches to Un-workable Suspended Particulate Matter Problems, 1976.
126. Protection of Environment: National Emission Standards for Hazard-ous Air Pollutants: List of Pollutants and Applicability of Part 61(40CFR61.01). Code of Federal Regulations, Title 40, Vol 8, Part 61, p 8,2007; available at http://www.epa.gov/ttn/atw/40cfr61.01.html (ac-cessed 2007).
127. Status of Standards of Performance. Code of Federal Regulations, Title40, Part 59, 2007; available at http://www.epa.gov/ttn/atw/statstd.pdf(accessed 2007).
128. U.S. Environmental Protection Agency, Part II: Requirements forPreparation, Adoption, and Submittal of Implementation Plans. Fed.Regist. 1971, 36, 15186–15506.
129. Chay, K.Y.; Greenstone, M. Air Quality, Infant Mortality, and the CleanAir Act of 1970; NBER Working Paper 10053; National Bureau ofEconomic Research: Cambridge, MA, 2003.
130. Husar, R.B. The Emergence of the Bimodal Distribution Concept; InHistory & Reviews of Aerosol Science; Sem, G.J.; Boulaud, D.; Brimble-combe, P.; Ensor, E.S.; Gentry, J.W.; Marijinissen, J.C.M.; Preining,O., Eds.; American Association for Aerosol Research, 2005.
131. Miller, F.J.; Gardner, D.E.; Graham, J.A.; Lee, R.E., Jr.; Wilson, W.E.;Bachmann, J.D. Size Considerations for Establishing a Standard forInhalable Particulates; J. Air Poll. Control Assoc. 1979, 29, 610-615.
132. Health Consequences of Sulfur Oxides: a Report from CHESS 1970–1971;EPA-650/1-74-004; U.S. Environmental Protection Agency: ResearchTriangle Park, NC, 1974.
133. Byerly, R., Jr. Report on the Environmental Protection Agency’s ResearchProgram with Primary Emphasis on the Community Health and Environ-mental Surveillance System (CHESS): an Investigative Report; Serial SS;Committee on Science and Technology of the U.S. House of Repre-sentatives, 1976.
134. Environmental Research, Development, and Demonstration Autho-rization Act. 77.
135. Wilson, R.R.; Colome, S.D.; Spengler, J.D.; Wilson, D.G. Health Effectsof Fossil Fuel Burning, Assessment and Mitigation; Ballinger PublishingCo.: Cambridge, MA, 1980.
136. Hidy, G.M.; Tong, E.Y.; Mueller, P.K. Design of the Sulfate RegionalExperiment, Vol. 1; Report EC-125, NTIS PB-274947; Electric PowerResearch Institute: Palo Alto, CA, 1976.
137. MacCracken, M.C. MAP3S: an Investigation of Atmospheric, EnergyRelated Pollutants in the Northeastern United States; Atmos. Environ.1978, 12, 649-659.
138. National Academy of Sciences, National Academy of Engineering,Coordinating Committee on Air Quality Studies, United States Sen-ate, Committee on Public Works. Air Quality and Automobile EmissionControl, Executive Summary. Report for the 93rd Congress, 2nd Session;Serial No. 93-24; 1974.
139. Stern, A.C. Letter Recommending the Review and Revision of All AirQuality Criteria Documents, 1976.
140. Hatch, O. Senate Debate on S. 252, June 8, 1977; In Legislative Historyof 1977 CAAA, 1978, Vol. 3, p 793.
141. Talley, W.K. Washington, DC. Memorandum. Dates for the Revisionof Air Quality Criteria Documents, 1976.
142. Air Quality Criteria for Particulate Matter and Sulfur Oxides, Vol. I and II;EPA-600/8-82-029a; U.S. Environmental Protection Agency: ResearchTriangle Park, NC, 1982.
143. U.S. Environmental Protection Agency. Lead Ambient Air QualityStandard Proposal. Fed. Regist. 1977, 42, 63076.
144. U.S. Environmental Protection Agency. National Ambient Air Qual-ity Standard for Lead. Fed. Regist. 1978, 43, 46246.
145. Environmental Research Development Demonstration Authoriza-tion Act (ERDDAA), P.L. 95-155, 1977.
146. U.S. Environmental Protection Agency. Photochemical Oxidants.Proposed Revisions to the National Ambient Air Quality Standard.Fed. Regist. 1978, 43, 26962.
147. U.S. Environmental Protection Agency. National Primary and Sec-ondary Ambient Air Quality Standards. Revisions to the NationalAmbient Air Quality Standards for Photochemical Oxidants. Fed.Regist. 1979, 44, 8202.
148. Report of the U.S. House of Representatives Committee on Interstate andForeign Commerce on the Clean Air Act Amendments of 1977; H.R.Report 95-924, 95th Congress, 2nd Session, 1978.
149. Richmond, H.M. A Framework for Assessing Health Risks Associatedwith National Ambient Air Quality Standards; Environ. Prof. 1981, 3,225-234.
150. Feagans, T.B.; Biller, W.F. A General Method for Assessing Health RisksAssociated with Primary National Ambient Air Quality Standards; U.S.Environmental Protection Agency: Research Triangle Park, NC, 1981.
151. Richmond, H.M. Master of Public Administration, University ofNorth Carolina at Chapel Hill, NC, 1979.
152. American Thoracic Society Guidelines as to What Constitutes anAdverse Respiratory Health Effect, with Special Reference to Epide-miologic Studies of Air Pollution. Am. Rev. Respir. Dis. 1985, 131,666-668.
153. Morgan, G. Bad Science and Good Policy Analysis. Science 1978, 201,971.
154. Walter Barber. Research Triangle Park, NC. Memorandum to DavidHawkins (Washington, DC) on the President’s Council on Wage andPrice Stability Regulatory Analysis Review Group (COWPS/RARG)Critique of the Proposed NAAQS for Ozone. November 8, 1978.
155. National Commission on Air Quality. To Breathe Clean Air; The Na-tional Commission on Air Quality: Washington, DC, 1981.
156. Dowd, R.M.; Yosie, T.F. The Role of Science in EPA Decision Making;Environ. Sci. Technol. 1981, 15, 1137-1141.
157. Friedlander, S.K. Setting Ambient Air Quality Standards: Improving theProcess; Clean Air Scientific Advisory Committee, Science AdvisoryBoard, U.S. Environmental Protection Agency: Research TrianglePark, NC, 1981.
158. Greenbaum, D.S.; Bachmann, J.D.; Krewski, D.; Samet, J.M.; White,R.; Wyzga, R.E. Particulate Air Pollution Standards and Morbidity andMortality: Case Study; Am. J. Epidemiol. 2001, 154, S78-S90.
159. National Research Council. Sulfur Oxides; National Academy of Sci-ences: Washington, DC, 1978.
160. National Research Council (National Academy of Sciences). AirborneParticles; University Park Press: Baltimore, MD, 1979.
161. Review of the National Ambient Air Quality Standards for Sulfur Oxides:Updated Assessment of Scientific and Technical Information. Addendumto the 1982 OAQPS Staff Paper; EPA 450/05 86-013; Strategies and AirStandards Division, Office of Air Quality Planning and Standards,U.S. Environmental Protection Agency: Research Triangle Park, NC,1986.
162. Steigerwald, B.J., Director of the Office of Air Quality Planning andStandards. Durham, NC. Memorandum to Assistant AdministratorRoger Strelow. Approaches to Unworkable Suspended ParticulateMatter Problems, 1974.
163. Watson, J.G.; Chow, J.C.; Shah, J.J. Analysis of Inhalable and FineParticulate Matter Measurements; EPA-450/4-81-035; U.S. Environmen-tal Protection Agency: Research Triangle Park, NC, 1981.
164. Pope, C.A., III; Dockery, D.W. Health Effects of Fine Particulate AirPollution: Lines that Connect; J. Air & Waste Manage. Assoc. 2006,56, 709-742.
Bachmann
Volume 57 June 2007 Journal of the Air & Waste Management Association 695

165. Holland, W.W.; Bennett, A.E.; Cameron, I.R.; Florey, C.V.; Leeder,S.R.; Schilling, R.S.; Swan, A.V.; Waller, R.E. Health Effects of Partic-ulate Pollution: Reappraising the Evidence. Am. J. Epidemiol. 1979,110, 527-659.
166. Ware, J.H.; Thibodeau, L.A.; Speizer, F.E.; Colume, S.P.; Ferris, B.G.,Jr. Assessment of the Health Effects of Atmospheric Sulfur Oxides andParticulate Matter: Evidence from Observational Studies; Environ.Health Perspect. 1981, 41, 255-276.
167. Ruckleshaus, W. William D. Ruckleshaus: Oral History Interview; EPA202-K-92-0003; U.S. Environmental Protection Agency: Research Tri-angle Park, NC, 1993.
168. Regulatory Impact Analysis of the National Ambient Air Quality Standardsfor Particulate Matter. Second addendum; Office of Air Quality Plan-ning and Standards, U.S. Environmental Protection Agency: ResearchTriangle Park, NC, 1986.
169. U.S. Environmental Protection Agency. Proposed Revisions to Na-tional Ambient Air Quality Standards for Particulate Matter to Con-trol Particles 10 Micrometers or Less. Fed. Regist. 1984, 49, 10408-10462.
170. Schwartz, J.; Marcus, A. Statistical Reanalysis of Data Relating Mortalityto Air Pollution during London Winters 1958–1972; U.S. EnvironmentalProtection Agency, Office of Policy Planning and Evaluations(Schwartz) and Office of Air Quality Planning and Standards (Mar-cus): Research Triangle Park, NC, 1986.
171. U.S. Environmental Protection Agency. Air Programs; Review of theNational Secondary Ambient Air Quality Standards for ParticulateMatter; Advance Notice of Proposed Rulemaking. Fed. Regist. 1987,52, 24670-24671.
172. U.S. Environmental Protection Agency. Proposed Decision Not toRevise the National Secondary Ambient Air Quality Standards forSulfur Oxides (Sulfur Dioxide) Proposed Rule. Fed. Regist. 1988, 53,14926-14952.
173. Suntein, C. Risk and Reason: Safety, Law, and the Environment; Cam-bridge University Press: Cambridge, U.K., 2002.
174. Review of the National Ambient Air Quality Standards for ParticulateMatter. Updated Assessment of Scientific and Technical Information. Ad-dendum to the 1982 OAQPS Staff Paper; EPA 450/05 86-012; Strategiesand Air Standards Division, Office of Air Quality Planning and Stan-dards, U.S. Environmental Protection Agency: Research TrianglePark, NC, 1986.
175. U.S. Environmental Protection Agency. Revisions to National Ambi-ent Air Quality Standards for Particulate Matter. Fed. Regist. 1987, 52,24634-24669.
176. Watson, J.G. Visibility: Science and Regulation; J. Air & Waste Man-age. Assoc. 2002, 52, 628-713.
177. Bull, K.R. The Critical Loads/Levels Approach to Gaseous PollutantEmission Control; Environ. Poll. 1991, 69, 105-123.
178. Chow, J.C.; Watson, J.G.; Mauderly, J.L.; Costa, D.L.; Wyzga, R.E.;Vedal, S.; Hidy, G.M.; Altshuler, S.L.; Marrack, D.; Heuss, J.M.; Wolff,G.T.; Pope, C.A., III; Dockery, D.W. 2006 Critical Review Discus-sion—Health Effects of Fine Particulate Air Pollution: Lines thatConnect; J. Air & Waste Manage. Assoc. 2006, 56, 1368-1380.
179. Review of the National Ambient Air Quality Standards for ParticulateMatter: Policy Assessment of Scientific and Technical Information—OAQPS Staff Paper; EPA-452/R-96-013; U.S. Environmental ProtectionAgency, Office of Air Quality Planning and Standards: Research Tri-angle Park, NC, 1996.
180. Train, R. EPA Administrator. Statement Prepared by the Congres-sional Research Service of the Library of Congress for the Committeeon Environment and Public Works, U.S. Senate, Washington, DC,April 9, 1976; In Legislative History of 1977 CAAA, 1978, Vol. 3, p 739.
181. A Legislative History of the Clean Air Act Amendments of 1977—aContinuation of the Clean Air Act Amendments of 1970, Vol. 3; Envi-ronmental Policy Division, Congressional Research Service, Libraryof Congress: Washington, DC, 1978.
182. National Air Quality and Emissions Trends Report, 1991; 450-R-92-001;U.S. Environmental Protection Agency, Office of Air Quality Plan-ning and Standards: Research Triangle Park, NC, 1992.
183. National Research Council. New Source Review for Stationary Sources ofAir Pollution; The National Academies Press: Washington, DC, 2006.
184. Meyer, P.A.; Pivetz, T.; Ignam, T.A.; Homa, D.M.; Schoonover, J.;Brody, D. Surveillance for Elevated Blood Lead Levels among Chil-dren—United States—1997–2001; MMWR Surveillance Summaries2003, 52, 1-21.
185. Lin, C.Y.C., Jacob, D.J.; Fiore, A.M. Trends in Exceedances of theOzone Air Quality Standard in the Continental United States, 1980–1998; Atmos. Environ. 2001, 35, 3217-3228.
186. Chameides, W.L.; Saylor, R.D.; Cowling, E.B. Ozone Pollution in theRural United States and the New NAAQS. Science 1997, 276, 916.
187. Tanner, R.L.; Valente, R.J.; Meagher, J.F. Measuring Inorganic NitrateSpecies with Short Time Resolution from an Aircraft Platform byDual-Channel Ozone Chemiluminescence; J. Geophys. Res. 1998,103, 22387-22392.
188. Pierson, W.R.; Gertler, A.W., Bradow, K.L. Comparison of the SCAQSTunnel Study with other On-Road Vehicle Emission Data; J. Air &Waste Manage. Assoc. 1990, 40, 1495-1504.
189. National Research Council. Rethinking the Ozone Problem in Urban andRegional Air Pollution; The National Academies Press: Washington,DC, 1991.
190. American Petroleum Institute. Detailed Analysis of Ozone State Imple-mentation Plans in Seven Areas Selected for Retrospective Evaluation ofReasons for State Implementation Plan Failure, Vol. 1, Executive Sum-mary; No. 3708/89; Pacific Environmental Services, Inc.: Reston, VA;and Systems Applications, Inc.: San Rafael, CA, 1989.
191. Congress of the United States, Office of Technology Assessment.Catching Our Breath. Next Step for Reducing Urban Ozone. Summary;OTA-O-413; U.S. Government Printing Office: Washington, DC,1989.
192. Clean Air Act Amendments. USC 7401-7671q, P.L. 101-549.193. Hilts, P.J. Studies Say Soot Kills Up to 60,000 in U.S. Each Year; The
New York Times. July 19, 1993.194. Dockery, D.W.; Pope, C.A., III; Xu, X.; Spengler, J.D.; Ware, J.H.; Fay,
M.E.; Ferris, B.G.; Speizer, F.E. An Association between Air Pollutionand Mortality in Six U.S. Cities; N. Engl. J. Med. 1993, 329, 1753-1759.
195. Pope, C.A., III; Thun, M.J.; Namboodiri, M.M.; Dockery, D.W.; Evans,J.S.; Speizer, F.E.; Heath, C.W. Particulate Air Pollution as a Predictorof Mortality in a Prospective Study of U.S. Adults; Am. J. Respir. Crit.Care Med. 1995, 151, 669-674.
196. Cushman, J.H. Administration Issues Its Proposal for Tightening ofAir Standards; The New York Times. November 28, 1996.
197. Li, Y.; Roth, H.D. Daily Mortality Analysis by Using Different Regres-sion Models in Philadelphia County, 1973–1990; Inhal. Toxicol.1995, 7, 45-58.
198. Moolgavkar, S.H. Air Pollution and Mortality; N. Engl. J. Med. 1994,330, 1237-1238.
199. Shprentz, D.S. Breath-Taking: Premature Mortality Due to Particulate AirPollution in 239 American Cities; Natural Resources Defense Council:New York, NY, 1996.
200. Clean Air Goals May Change; The New York Times. December 1, 1996.201. Cushman, J.H., Jr. EPA Advocating Higher Standards to Clean the Air;
The New York Times. November 26, 1996.202. Regulatory Impact Analyses for the Particulate Matter and Ozone National
Ambient Air Quality Standards and Proposed Regional Haze Rule; Inno-vative Strategies and Economics Group, Office of Air Quality Plan-ning and Standards, U.S. Environmental Protection Agency: ResearchTriangle Park, NC, 1997.
203. Wolff, G.T. Washington, DC, 1996. Letter to Carol M. Browner, U.S.Environmental Protection Agency Administrator. Closure on Draft Of-fice of Air Quality Planning and Standards OAQPS Staff Paper (Review ofthe National Ambient Air Quality Standards for Particulate Matter:Policy Assessment of Scientific and Technical Information).
204. Clinton, W.J., President. Washington, DC. Memorandum for theAdministrator of the Environmental Protection Agency. Implemen-tation of Revised Air Quality Standards for Ozone and ParticulateMatter, 1997.
205. Clinton Sharply Tightens Air Pollution Regulations Despite Concernover Costs; The New York Times. June 26, 1997.
206. U.S. Environmental Protection Agency. National Ambient Air Qual-ity Standards for Ozone: Final Response to Remand. Fed. Regist. 2002,63, 614-645.
207. Schoenbrod, D. Politics and the Principle that Elected LegislatorsShould Make the Laws. Harvard J. Law Public Policy 2003, 26, 239-280.
208. Rule to Reduce Interstate Transport of Fine Particulate Matter andOzone (Clean Air Interstate Rule); Revisions to Acid Rain Program;Revisions to the NOx SIP Call; Final Rule; Fed. Regist. 2005, 70,25162-25405.
209. Burtraw, D.; Palmer, K. SO2 Cap-and-Trade Program in the UnitedStates: a “Living Legend” of Market Effectiveness In Choosing Envi-ronmental Policy: Comparing Instruments and Outcomes in the UnitedStates and Europe; Harrington, W.; Morgenstern, R.; Sterner, T. Eds.;Resources for the Future: Washington, DC, 2004.
210. Kim, S.-W.; Heckel, A.; McKeen, S.A.; Frost, G.J.; Hsie, E.-Y.; Trainer,M.K.; Richter, A.; Burrows, J.P.; Peckham, S.E.; Grell, G.A. Satellite-Observed U.S. Power Plant NOx Emission Reductions and Their Im-pact on Air Quality. Geophys. Res. Lett. 2006, 33, L22812.
211. 2001 Ozone Transport Commission (OTC) NOx Budget Compliance Re-port; U.S. Environmental Protection Agency, Office of Air and Radi-ation, Clean Air Markets Division: Washington, DC, 2002.
212. Regulatory Impact Analysis for the Final Clean Air Interstate Rule; EPA-452/R-05-002; U.S. Environmental Protection Agency, Office of Airand Radiation, Air Quality Strategies and Standards Division, Emis-sion Monitoring and Analysis Division and Clean Air Markets Divi-sion: Research Triangle Park, NC, 2005.
213. National Research Council. Research Priorities for Airborne ParticulateMatter: I—Immediate Priorities and a Long-Range Research Portfolio; TheNational Academies Presss: Washington, DC, 1998.
Bachmann
696 Journal of the Air & Waste Management Association Volume 57 June 2007

214. National Research Council. Research Priorities for Airborne ParticulateMatter: II—Evaluating Research Progress and Updating the Portfolio; TheNational Academies Press: Washington, DC, 1999.
215. National Research Council. Research Priorities for Airborne ParticulateMatter: III—Early Research Progress; The National Academies Press:Washington, DC, 2001.
216. Schoor, J.L. Carol Browner’s Legacy: PM2.5. Environ. Sci. Technol.2006, 40, 4531.
217. U.S. Environmental Protection Agency. A National Ambient AirQuality Standard for Particulate Matter: Final Rule. Fed. Regist. 2006,71, 61144-61233.
218. Lippmann, M., CASAC Chairman. Washington, DC. Letter to Envi-ronmental Protection Agency Administrator Lee Thomas, 1986.
219. Henderson, R.; Cowling, E.B.; Crapo, J.D.; Miller, F.J.; Poirot, R.L.;Speizer, F.E.; Zielinska, B. Clean Air Scientific Advisory Committee rec-ommendations concerning the proposed National Ambient Air QualityStandards for particulate matter: Letter to Stephen L. Johnson; EPA-CASAC-LTR-06-002, March 21, 2006; EPA Clean Air Scientific Advi-sory Committee: Washington, DC, 2006.
220. Henderson, R. Clean Air Scientific Advisory Committee’s (CASAC) Re-view of the Agency’s Final Ozone Staff Paper; EPA-CASAC-07-002, 2007.
221. Industrial Economics, I. Expanded Expert Judgment Assessment of theConcentration-Response Relationship between PM2.5 Exposure and Mor-tality, Final Report; Industrial Economics, Inc.: Cambridge, MA, 2006.
222. Regulatory Impact Analyses—2006 National Ambient Air Quality Stan-dards for Particle Pollution; U.S. Environmental Protection Agency:Research Triangle Park, NC, 2006.
223. Chow, J.C.; Bachmann, J.D.; Wierman, S.S.G., Mathai, C.V.; Malm,W.C.; White, W.H.; Mueller, P.K.; Kumar, N.K.; Watson, J.G. CriticalReview Discussion—Visibility: Science and Regulation; J. Air & WasteManage. Assoc. 2002, 52, 973-999.
224. Kahn, M.E. The Beneficiaries of Clean Air Act Regulation; Regul. Mag.2001, 24, 33-38.
225. Gianessi, L.P.; Peskin, H.M.; Wolff, E. The Distributional Effects ofUniform Air Pollution Policy in the United States; Quarterly J. Econ.1979, 93, 281-301.
226. Provisional Assessment of Recent Studies on Health Effect of ParticulateMatter Exposure; EPA EPA/600/R-06/063; National Center for Envi-ronmental Assessment, U.S. Environmental Protection Agency: Re-search Triangle Park, NC, 2006.
227. Utility Air Regulatory Group. Comments of the Utility Air RegulatoryGroup on National Ambient Air Quality Standards for Particulate Matter,Proposed Rule; Docket No. OAR-2001-0017-2214, 2006.
228. Menotti, D.E.; Knight, J.A. Letter (from Law Firm of Pillsbury,Winthrop, Shaw and Pittman) on Behalf of 19 Industry and BusinessAssociations Regarding Comments on EPA’s Proposed “National Am-bient Air Quality Standards for Particulate Matter.” Docket No. OAR-2001-0017-1523, 2006.
229. Koenig H.M. Annapolis Center for Science-Based Public Policy, An-napolis, MD. Letter to Administrator Johnson Regarding Commentson the Health Effects of EPA’s Particulate Matter Air Quality StandardProposal. Docket No. OAR-2001-0017-1435, 2006.
230. Electric Power Research Institute. Comments on the Proposed Rulefor National Ambient Air Quality Standards for Particulate MatterSubmitted by Ronald E. Wyzga and Annette Rohr, Electric PowerResearch Institute. Docket No. OAR-2001-0017-1538, 2006.
231. McGarity, T.O. Professor Sunstein’s Fuzzy Math. Georgetown Law J.2002, 90, 2341.
232. Cole, D.H.; Grossman, P.Z. When Is Command-and-Control Effi-cient? Institutions, Technology, and the Comparative Efficiency ofAlternative Regulatory Regimes for Environmental Protection. Wis-consin Law Rev. 1999, 887-938.
233. Climate Change 2007: the Physical Science Basis. Summary for Policy-makers. Contribution of Working Group I to the Fourth Assessment Reportof the Intergovernmental Panel on Climate Change; IntergovernmentalPanel on Climate Change (IPCC): Geneva, Switzerland, 2007.
234. Mack, J. Climate Change Initiatives Are Heating Up in the UnitedStates. EM 2006, November, 8-13.
235. Stohl, A. Intercontinental Transport of Air Pollution; Springer-Berlin:Heidelberg, Germany, 2004.
236. Hansen, J. Air Pollution as a Climate Forcing: a Workshop; April 29–May 3, 2002, Honolulu, HI, 2002.
237. Hansen, J. Air Pollution as a Climate Forcing: a Second Workshop; April4–6, 2005, Honolulu, HI, 2005.
238. Borys, R.D.; Lowenthal, D.H.; Cohn, S.A.; Brown, W.O.J. Mountain-top and Radar Measurements of Anthropogenic Aerosol Effects onSnow Growth and Snowfall Rate. Geophys. Res. Lett. 2003, 30, 1538.
239. Davies, J.C., III; Davies, B.S. The Politics of Pollution, 2nd ed.; Bobbs-Merrill: Indianapolis, IN, 1975.
240. Ada R. Habershon, Music; Charles H. Gabriel, Lyrics. Will the Circle BeUnbroken? 1907.
241. U.S. Environmental Protection Agency. Air Emissions Trends—Contin-ued Progress through 2005; available at http://www.epa.gov/airtrends/econ-emissions.html (accessed 2007).
242. U.S. Environmental Protection Agency. The Benefits and Costs of theClean Air Act, 1970 to 1990; Report Prepared for the U.S. Congress.Washington, DC, 1997.
243. Eisenbud, Merril. Overview of Aerosol Research; In Aerosols: Anthro-pogenic and Natural, Sources and Transport; Kneip, T.J.; Lioy, P.J., Eds;New York Academy of Sciences: New York, NY, 1980.
244. U.S. Environmental Protection Agency. National Air Quality and Emis-sions Trends Report 1988. EPA-450/4-90/002. Research Triangle Park,NC, 1990.
245. Neil Frank. Nationwide Trends in Total Suspended Particulate. QualityAssurance in Air Pollution Measurements. Johnson, T.R.; Penkala,S.J., Eds; Transactions (1985), Air Pollution Control Association In-ternational Specialty Conference, October 1984.
246. Gschwandtner, G.; Eldridge, K. Historic Emissions of Sulfur and Nitro-gen Oxides in the United States from 1900 to 1980; Vol. 1, Results.EPA/600/7-85/009A; Environmental Protection Agency: ResearchTriangle Park, NC, 1985.
247. National Air Pollutant Emission Trends, 1900–1998. EPA-454/R-00-002. U.S. Environmental Protection Agency, Office of Air QualityPlanning and Standards: Research Triangle Park, NC, 2000.
248. Padgett, J.; Richmond, H. The Process of Establishing and RevisingNational Ambient Air Quality Standard. J. Air Poll. Control Assoc.1983, 33, 13.
249. David Mintz. Research Triangle Park, NC. Personal communicationto John Bachmann. Updated Trends Figures. March 15, 2007.
250. Latest Findings on National Air Quality 2002 Status and Trends. EPA454/-03-001. U.S. Environmental Protection Agency, Office of AirQuality Planning and Standards: Research Triangle Park, NC, 2003.
About the AuthorJohn Bachmann heads Vision Air Consulting, Chapel Hill,NC. He is formerly the Associate Director for Science/Policyand New Programs, Office of Air Quality Planning and Stan-dards, U.S. Environmental Protection Agency, ResearchTriangle Park, NC. Address correspondence to John Bach-mann, Vision Air Consulting, 120 Glen Ridge Dr., ChapelHill, NC 27516; phone: �1-919-619-0769; e-mail:[email protected].
Bachmann
Volume 57 June 2007 Journal of the Air & Waste Management Association 697

1
EPA Alumni-Chuck Elkins
From: John Bachmann [[email protected]]Sent: Thursday, March 24, 2011 8:40 AMTo: Chuck Elkins ElkinsSubject: Fwd: Your A&WM article on the history of the NAAQS
That was easy. No restrictions. John B Sent from my iPad Begin forwarded message:
From: "Lisa Bucher" <[email protected]> Date: March 24, 2011 7:50:16 AM EDT To: "John Bachmann" <[email protected]> Subject: RE: Your A&WM article on the history of the NAAQS
Hi, John: Yes, A&WMA grants the EPA Alumni Association permission to post your article on their Web site. We do ask that the below citation accompanies the online posting: The 2007 A&WMA Critical Review, "Will the Circle Be Unbroken: A History of the U.S. National Ambient Air Quality Standards," by John D. Bachmann was published in the June 2007 issue of the Journal of the Air & Waste Management Association (J. Air & Waste Manage. Assoc. 2007, 57, 652-697; DOI:10.3155/1047-3289.57.6.652). To obtain copies and reprints, please contact the Air & Waste Management Association (A&WMA) directly at 1-412-232-3444 or online at www.awma.org. If they need the permission in writing (on A&WMA letterhead) let me know and I will provide. Also, let me know if they need me to provide them with the article .pdf. Regards, Lisa
Lisa Bucher Managing Editor Air & Waste Management Association (A&WMA) One Gateway Center, 3rd Floor 420 Fort Duquesne Blvd. Pittsburgh, PA 15222-1435 [email protected] 412-904-6023 412-232-3450 (fax) www.awma.org
Please consider the environment before printing this e-mail
From: John Bachmann [mailto:[email protected]] Sent: Wednesday, March 23, 2011 4:00 PM To: Lisa Bucher Subject: Fwd: Your A&WM article on the history of the NAAQS

2
Could you get a ruling on this request from the EPA alumni association? John B. Begin forwarded message: From: "EPA Alumni-Chuck Elkins" <[email protected]> Date: March 23, 2011 3:27:15 PM EDT To: "'John Bachmann'" <[email protected]> Subject: Your A&WM article on the history of the NAAQS John, as you will see on the Association website (www.EPAalumni.org) [look in the right hand column on the opening page], we have initiated a process of providing access to members and the public to key publications by EPA alumni, the first being Glenn Schweitzer’s book on controlling hazardous chemicals. I’m hoping to add John Quarles’ book once I get copyright permission. I would like to add your very informative article on the NAAQS to the website. I notice that the copyright is held by A&WM Association. If you are interested in making the article available, could you ask the A&WM Association whether they would give our Association a royalty‐free license to make it digitally available? It would seem that enough years have passed by so that they cannot have any realistic anticipation of additional fees for selling copies of it—especially since I know you have handed out copies of the article to many of us in the past. Thanks Chuck Elkins Executive Director EPA Alumni Association www.EPAalumni.org Tel: 202‐686‐3518 Fax: 202‐686‐3518 (same as telephone) Cell: 202‐309‐2974 (not always monitored)
This email and any attached files are confidential and intended solely for the intended recipient(s). If you are not the named recipient you should not read, distribute, copy or alter this email. Any views or opinions expressed in this email are those of the author and do not represent those of the company. Warning: Although precautions have been taken to make sure no viruses are present in this email, the company cannot accept responsibility for any loss or damage that arise from the use of this email or attachments.