Embed Size (px)
Citation preview
DRAFT, NOT FOR DISTRIBUTION
20
Growth and Labor Sufficiency in Russia:
Will Russia Face Labor Force Shortage in the Next 20 Years?
Background Note1
Draft, July 2011
The World Bank
1 This background note prepared by Toru Nishiuchi and Yulia Mironova (ECSPE Consultants) under the guidance of
Sudharshan Canagarajah (ECSPE Lead Economist). We are grateful to Sergey Ulatov, Karlis Smiths, Victor Sulla, Shoghik
Hovhannisyan and Matin Kholmatov for helpful comments and suggestions. Authors’ e-mail address:
DRAFT, NOT FOR DISTRIBUTION
2
Table of Contents
Introduction ........................................................................................................................................................ 3
1. An analytical framework .............................................................................................................................. 4
2. Labor force projections under various demographic scenarios ................................................................... 6
3. Sources of GDP growth over 2000-2010 in Russia and its two federal districts ........................................... 9
4. Estimation of potential labor force deficit/surplus in the next 20 years .................................................... 12
5. Concluding observations and policy implications ...................................................................................... 14
References ........................................................................................................................................................ 16
Annex I: Data Sources........................................................................................................................................ 17
Annex II: Simulated labor deficit/surplus in Russia: Optimistic scenario ............................................................ 18
Annex III: Simulated labor deficit/surplus in Russia : Pessimistic scenario.......................................................... 19
Annex IV: Simulated labor deficit/surplus depending on TFP growth rates in Central and North -West Federal
Districts ............................................................................................................................................................. 20
Figures and Tables
Figure 1: Labor and Capital Income in 1995-2010 (percent of GDP) .................................................................. 5
Figure 2: Demographic forecasts, total and working age (15-64 years old) population, million people .............. 6
Figure 3: Labor force participation projections up to 2030 under various demographic scenarios ..................... 8
Figure 4: Estimated factors contribution to total and non-oil-gas GDP growth in Russian Federation, 2001-2010
(percentage points) ............................................................................................................................................. 9
Figure 5: Estimated factors contribution to GRP growth in two federal districts of Russian Federation, 2001-
2009 (percentage points) .................................................................................................................................. 11
Figure 6: Simulated labor deficit/surplus depending on TFP growth rates for Russian Federation, by 2020 and
2030 .................................................................................................................................................................. 12
Figure 7: South Korea total factor productivity growth rates, 1985-2008 (percent per year) ........................... 14
Figure 8: Average TFP growth in selected OECD countries, 1985-2008 (percent per year) ............................... 14
Table 1: Results of Growth Accounting for total and non-oil-gas GDP for Russia, 2001-2010 based on actual
data, 2011-2030 based on forecasted values (percentage points) .................................................................... 10
Table 2: Simulated labor deficit/surplus depending on TFP growth rates for Russian Federation and its two
federal districts, by 2020 and 2030 ................................................................................................................... 13
DRAFT, NOT FOR DISTRIBUTION
3
Introduction
ussian economy demonstrated strong economic performance over the decade prior to the global
economic crisis in 2008 and 2009. Economic growth averaged 6.9 percent per year and GDP per capita
increased almost nine times in nominal US dollars terms over the period from 1999 to 2008. This growth
episode began as a bounce-back after the 1998 financial collapse. With a weakened ruble, domestic
manufacturers were better positioned to compete with imports. Then, as oil prices climbed, the country
saw a large inflow of foreign exchange, further fueling growth and centering the Russian economic growth
model on high prices of hydrocarbons, which generated about 20 percent of total GDP, half of the budget
revenues and accounted for about 60 percent of Russian merchandise exports.
Strong economic growth in Russia created vast economic opportunities for neighboring countries which
benefited from exports expansion at the Russian market, incomes generated by labor migrants attracted
to Russia by substantial wage differentials, and Russian investments. Total Russian imports from CIS
countries more than tripled between 2001 and 2008. Exports of labor to Russia from the poorest CIS
countries – Tajikistan, Kyrgyzstan and Moldova - appeared to be even more critical for their welfare than
the trade-in-goods linkage. Remittances from labor migrants working in Russia constituted a very
significant source of incomes for population in those countries, accounting for 30 -50 percent of their GDP
in 2008. Estimated total number of foreign labor migrants working in Russia was about 2.5 million people,
or 3.4 percent of total employment; at that labor migrants accounted for over 10 percent of total
employment in Moscow city2, major center of economic activities in Russia, where jobs for migrants were
mainly created in non-tradable sectors, including construction, retail trade, and selected types of services.
Following a decade of strong economic growth, the country was hit hard by the crisis. Even though the
authorities saved significant portion of the oil revenues in the Russian Stabilization Fund, they gradually
began to spend more and more of it in the years preceding the crisis. At the same time, private sector
activity was also very dynamic. So when the crisis hit and oil prices collapsed, the economy was
overheated, and therefore output declined by more than in other countries (IMF, 2010). The government
implemented massive fiscal stimulus of about 10 percent of GDP to protect the economy. Despite large
stimulus and favorable commodity prices, growth has been modest - 4.0 percent in 2010 and 4.1 percent
in Q1-2011. Ministry of Economic Development of Russian Federation forecast average real GDP growth of
4.1 percent per year over 2011-2014, which is broadly in line with the WB, IMF and EIU outlook for Russia.
The crisis demonstrated again external vulnerability of the Russian economy. Economic team of the
Russian Government recognized that new drivers of growth are needed for Russia to sustain steady
economic growth in future. Economic modernization to boost productivity and export diversification is
among the top priorities on the Russian economic policy agenda.
However, this task is complicated by demographic situation in Russia, which po pulation has been declining
over the last decade and which implies declining working age population in the next decade or two. This
means that in order to achieve targeted economic growth rates the country may need to attain even
higher productivity gains.
2 http://mirpal.org/Статистика/Сводные%20таблицы%20за%202005-2008%20гг..html
R
DRAFT, NOT FOR DISTRIBUTION
4
This note therefore attempts to quantify relationship between economic growth and growth of labor
force, using growth accounting relationship, in order to clarify the gap between projected number of labor
force of Russian nationals under various demographic scenarios and required number of labor force to
achieve targeted level of GDP under various assumptions on total factor productivity (TFP) growth,
population’s participation rates in labor force and capital accumulation level.
The note is organized as follows. Section 1 presents an analytical framework. Section 2 provide s
projections of labor force under several demographic scenarios. Section 3 analyses sources of growth in
Russia and in two Russian Federal Districts during 2000-2010, differentiating between total GDP growth
and non-oil-gas GDP growth. This analysis underlines assumptions in scenarios used in simulations to
estimate labor force deficit/surplus in Russia in the next twenty years presented in Section 4. Policy
implications and concluding remarks follow.
1. An analytical framework
e use a standard growth accounting framework to analyse sources of growth in Russia,
differentiating between growth generated by labor and capital inputs contribution and
contribution from the increases in total factor productivity (TFP). We consider a model of an open
economy that evolves in discrete time and each time period, denoted by an index, represents one year
(World Bank, 2011). We assume that the economy has access to a technology to produce output by
combining capital and labor inputs according to the Cobb-Douglas production function with constant
returns to scale defined by equation (1):
(1)
where denotes output, is the stock of physical capital, denotes the amount of labor input, is a
measure of the productivity level of capital and labor, and the technology parameter which
measures the relative contribution of capital to the production of output and which in a competitive
economy coincides with the share of output distributed as payments to capital. Capital depreciates at a
constant rate of between time periods and can be augmented through investment evolving according to
the equation (2):
(2)
where denotes aggregate investment. We assume that capital depreciation rate is 0.05, which is
commonly used in the literature. Imposing various assumptions on targeted GDP growth, TFP growth, and
investment-to-GDP ratio we simulate required labor force growth rate under various scenarios using the
equation (3):
(3)
W
DRAFT, NOT FOR DISTRIBUTION
5
Finally, we estimate potential labor force deficit/surplus as a difference between projected labor force
under various demographic scenarios and required labor force estimated using growth rates obtained by
equation (3).
We understand various limitations of this framework as well as of the data. Growth accounting
methodology has been criticized, among others, for “residual” nature of the TFP growth, for the
underlying assumptions about production function and for that it cannot identify whether the productivity
growth caused the capital accumulation, or whether the capital accumulation made additional innovations
possible. The other concerns refer to measures of changes in output and the inputs and to choice of
parameters, including possible underutilization of available capital stock or employed labor, and sensitivity
of the results to the choice of the technology parameter α which as empirical evidence demonstrate varies
substantially across the countries (Gollin, 2002). However, there are studies (Bosworth and Collins, 2003
and Caselli, 2004), which we rely on, arguing that growth accounting is a valuable tool that can - and have
- improved understanding of growth experiences across countries.
We address some of the limitations. First we use data on capital stock adjusted for capital utilization (see
World Bank, 2007a and IMF, 2006). Second, we use observable estimate for parameter measured as
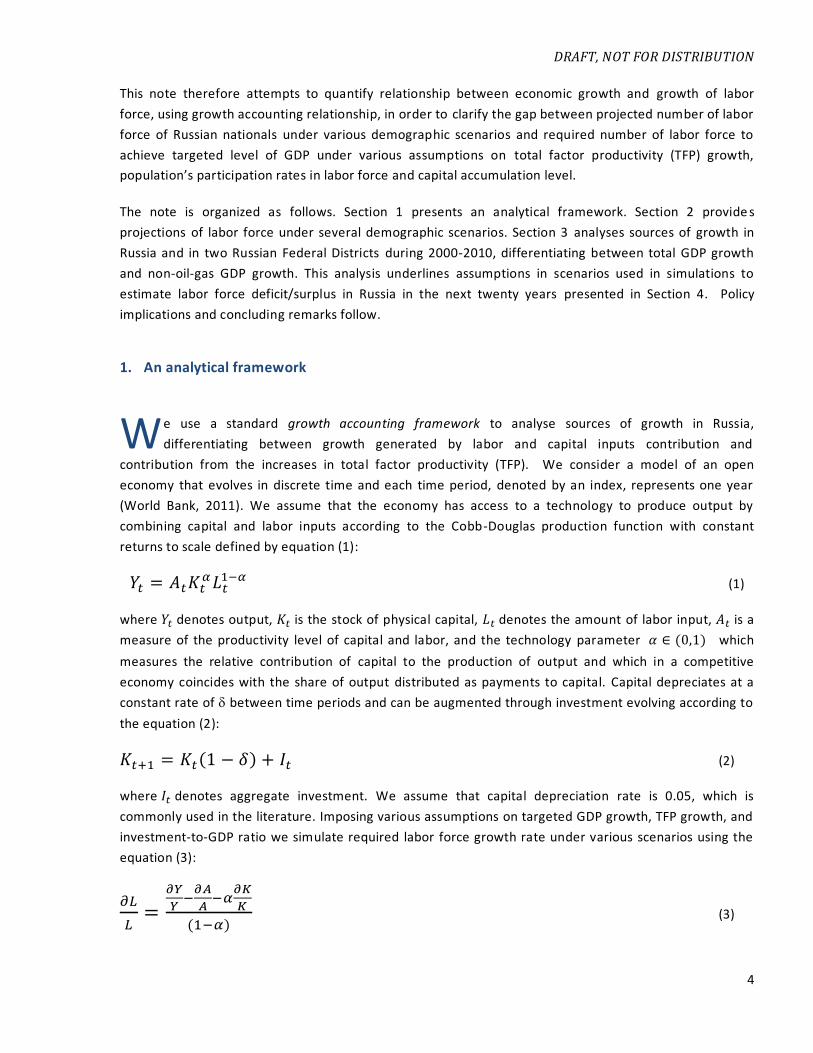
share of profits and mixed incomes in total value added (see Figure 1 a). Third, though this simple growth
accounting framework as it currently stands does not include other growth determinants – such as the
savings rate - we incorporate sensitivity analysis of labor requirement various combinations of investment
rate which is highly correlated with savings rate (see Figure 1b).
Finally, with all limitation, we believe that this framework is still useful to demonstrate how labor force
needs in Russian Federation may change in future depending on targeted economic growth rates,
improvements in factors productivity, level of participation of working age population in labor force and
investment levels; so the Government could address potential labor force shortage beforehand.
The analysis presented in this note is conducted in three steps. First, we project labor force in the next
twenty years for the three demographic scenarios provided by the National Statistics Committee of
Russian Federation (NSC RF) and imposing several alternative assumptions on expected labor participation
Figure 1a: Labor and Capital Income in 1995-2010 (percent of GDP)
Figure 2b: National savings and investment rate, average 1980-2008
Source: NSC RF Source: Savings and Growth in Egypt, World Bank (2011)
DRAFT, NOT FOR DISTRIBUTION
6
rate (LPR). Second, we use presented above framework to estimate TFP contribution to GDP growth in
Russia over the last decade, differentiating between oil-gas and non-oil-gas GDP. We also analyse sources
of growth using this framework for two Russia’s regions . Third, we estimate the gap between projected
number of labor force of Russian nationals and required number of labor force to achieve targeted level of
GDP under various assumptions on TFP growth, LPR and investment-to-GDP ratio.
2. Labor force projections under various demographic scenarios
ussian Federation has been undergoing though the period of sharp demographic decline over the last
decade. Despite strong and robust economic growth, Russia over these years has been facing
exceptional population decline fueled by low fertility and high mortality in large part due to untimely
deaths from heart disease and traffic accidents. Between 1992 and 2009 Russia’s population declined by
approximately 7 million from 149 in 1992 to an estimated 142 million people, which is corresponding to
Russia’s population in 1984. Migration has become the only source of population growth. According to
UNFPA (2010) total natural population decline for these years amounted to 12.6 million, which implies
that migration compensated for approximately half of it.
Recent years recorded however assuring population increase up to estimated 142.9 million in 2010. The
natural decline of Russia's population in 2009 went down by almost a third; birth r ate grew by 2.9 and
death rate reduced by 3 percentage points. Improved health outcomes also contributed, so that child
mortality in Russia decreased by 3.5 percent, cardiovascular diseases' toll went down by 4.6 percent, and
the TB death rate declined 7.8 percent in 2010.
Unfortunately reduction of population decline rate in recent years is likely to be only a temporary trend
for a number of reasons. First, a significant increase in the number of women of childbearing age as a
result improved fertility in the 80s, contributed to an increase in the number of births. Second, starting
from 2001 the 60-year mark was passes by a smaller generation born during the war, which inhibited the
growth of the number of deaths. The influence of both factors will weaken in the next few years, i.e. the
number of potential mothers will return to the level of the early 90s, and the number of elderly will start
growing at expense of the most
numerous post-war generations.
As a result favorable impact of
these structural factors on the
population growth in the first
decade of XXI century, in its
second decade will reverse (see
UNFPA, 2010 for details). Almost
all the forecasts predict a further
reduction Russia's population,
although at different rate of
reduction. This will lead to a
decline of working age
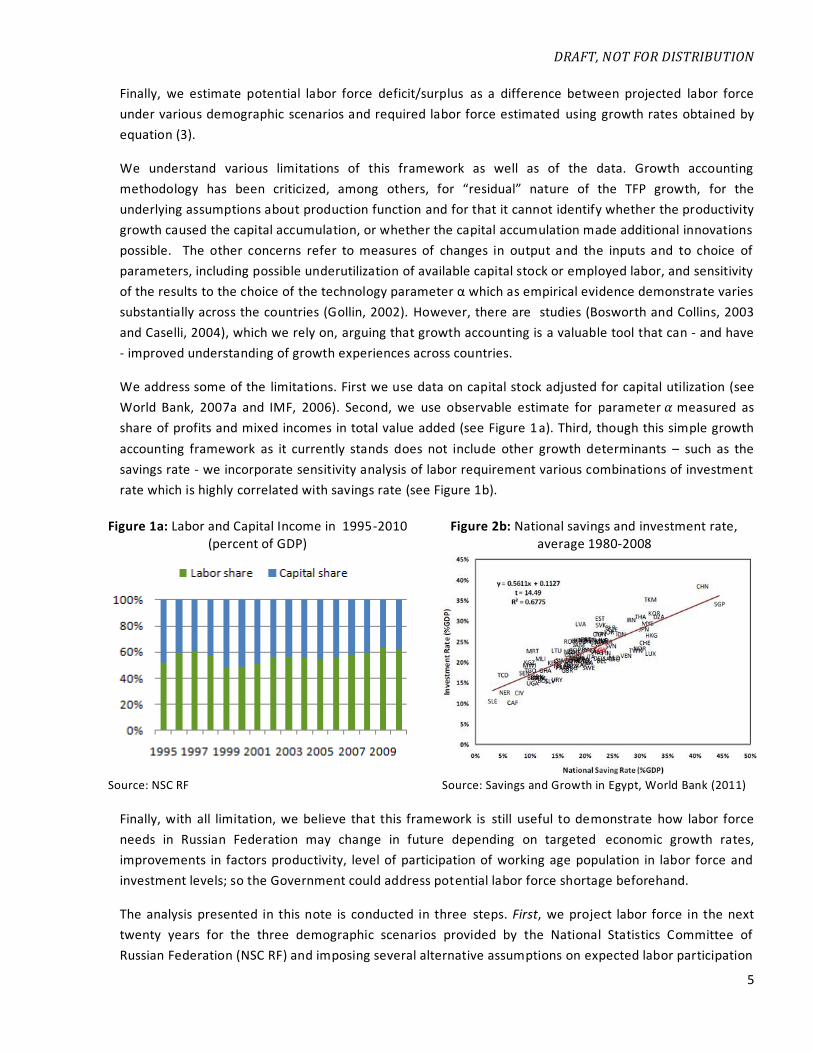
population. Figure 2 illustrates
potential decline of working age
R
Figure 3: Demographic forecasts, total and working age (15-64 years old) population, million people
Source: NSC RF
DRAFT, NOT FOR DISTRIBUTION
7
population for three demographic scenarios based on the forecast prepared by N SC RF. This shows that
number if working age population may decline from about 103 million people as of 2010 up to 86.4 million
in 2030. The direct economic consequence of this decline is a reduction of productive labor force which
may potentially have negative implication for economic growth.
In this section we present estimated labor force participation (measured as number of employed) in the
next twenty years for the three demographic scenarios and imposing several alternative assumptions on
expected labor participation rates as in the situation of declining population increasing labor participation
rates could partially solve the problem of shrinking labor force. We use population projections by age
group and sex provided by NSC RF. In projecting the number of labor force, we rely on three demographic
scenarios - baseline, optimistic and pessimistic (see Figure 2) and impose following assumptions on labor
force participation rates:
(a) Base case: participation rates by age and gender will remain at average level observed over
2006-2008; we exclude 2009 as there was increase in unemployment in 2009 due to the crisis
(b) EU25 convergence: participation rates for all age-gender groups will move toward those of the
current average of the 25 members of the European Union, converging by 2030; currently EU25
LPRs are substantially higher than in Russia for younger and older people (15-24 years old and
over 60 years old)
(c) 2.5 percent across the board: gradual increase in labor force participation rates for all age-
gender groups, reaching a level 2.5 percentage points higher than they were in 2006-2008
(d) Older workers: gradually increasing participation rates for workers, age 60 to 64, so that the
rates are 5 percentage points higher in 2030 than in 2006-2008
(e) 40 to 59 year olds: gradually increased participation rates for both men and women in this age
group, so that the rates are 5 percentage points higher in 2030 than in 2006-2008
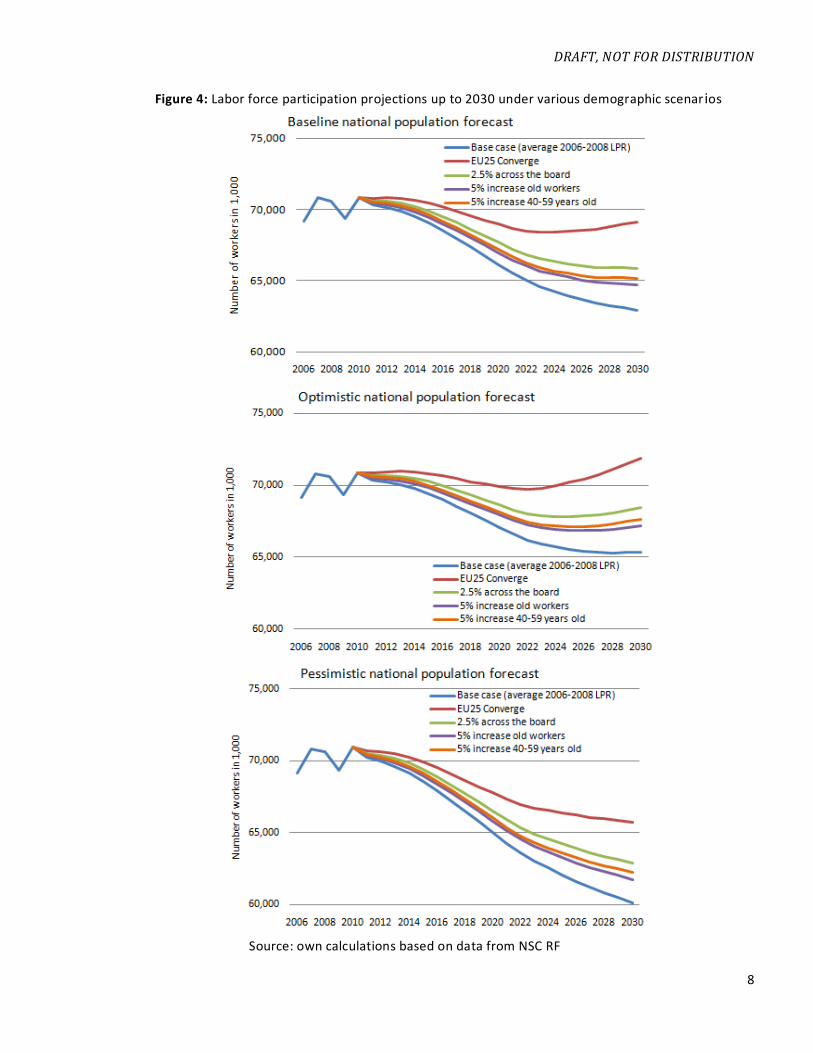
Labor force participation projections for the three scenarios are presented in Figure 3. In 2006-2008 total
employment averaged at 70.2 million people. Our estimate for labor force participation by the year 2030
varies from 62.9 to 69.1 million for the baseline demographic scenario, from 65.3 to 71.8 million for the
optimistic demographic scenario, and from 60.1 to 65.7 million under pessimistic scenario. This means
that if pessimistic demographic scenario realizes and labor participation rates will remain unchanged at
the level of 2006-2008, labor force participation may decline by as much as 10 million people or by 14.3
percent from the current level. This will be a fairly substantial burden on economic growth as it will be
more difficult to sustain high growth rates.
Figure 3 shows that beyond promoting across the board increase in labor participation rates decline in
labor force is mitigated by policies encouraging higher participation of younger people (15-24 years old) in
the labor force and promoting middle-age workers (40-59 years old and older) to stay longer in labor
market. The later could be practically implemented through postponing retirement age, but given the low
levels of life expectancy in Russia, this seems to be politically difficult to implement.
In addition to declining labor force in Russia, its quality is deteriorating in terms of education. 2011 Global
Competitiveness Report for Russia (WEF, 2011) argues that although the country’s highly educated
population is now among its key advantages; Russia will most likely not be able to maintain this advantage
DRAFT, NOT FOR DISTRIBUTION
8
Figure 4: Labor force participation projections up to 2030 under various demographic scenar ios
Source: own calculations based on data from NSC RF
DRAFT, NOT FOR DISTRIBUTION
9
over the medium to longer term without major investment into improving the quality of educational
system. The past five years have seen a significant deterioration in the quality of education in Russia, even
in math and science - which had been one of the key strengths of the Russian education while educational
outcomes in India, China, and Brazil have been improving and OECD countries show stable results. Though
in our further analysis we do not account for the deteriorating quality of labor force, as measured by its
education, we believe that this argument makes our findings stronger.
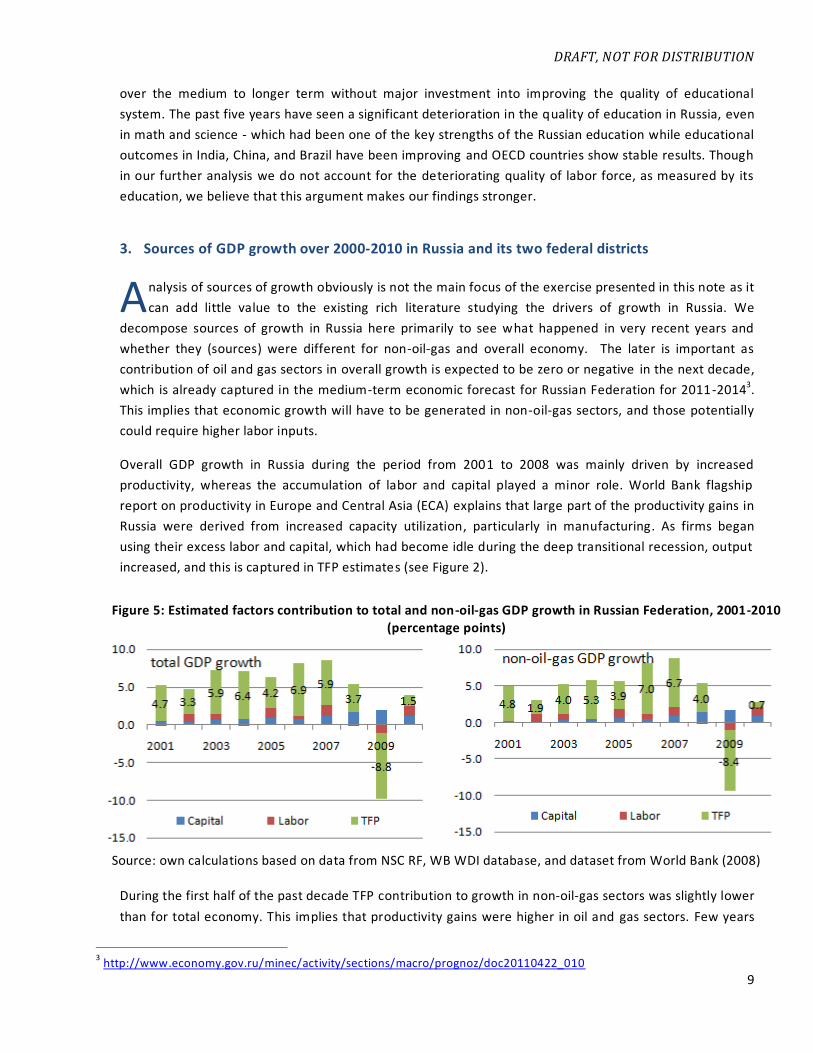
3. Sources of GDP growth over 2000-2010 in Russia and its two federal districts
nalysis of sources of growth obviously is not the main focus of the exercise presented in this note as it
can add little value to the existing rich literature studying the drivers of growth in Russia. We
decompose sources of growth in Russia here primarily to see what happened in very recent years and
whether they (sources) were different for non-oil-gas and overall economy. The later is important as
contribution of oil and gas sectors in overall growth is expected to be zero or negative in the next decade,
which is already captured in the medium-term economic forecast for Russian Federation for 2011-20143.
This implies that economic growth will have to be generated in non-oil-gas sectors, and those potentially
could require higher labor inputs.
Overall GDP growth in Russia during the period from 2001 to 2008 was mainly driven by increased
productivity, whereas the accumulation of labor and capital played a minor role. World Bank flagship
report on productivity in Europe and Central Asia (ECA) explains that large part of the productivity gains in
Russia were derived from increased capacity utilization, particularly in manufacturing. As firms began
using their excess labor and capital, which had become idle during the deep transitional recession, output
increased, and this is captured in TFP estimates (see Figure 2).
During the first half of the past decade TFP contribution to growth in non-oil-gas sectors was slightly lower
than for total economy. This implies that productivity gains were higher in oil and gas sectors. Few years
3 http://www.economy.gov.ru/minec/activity/sections/macro/prognoz/doc20110422_010
A
Figure 5: Estimated factors contribution to total and non-oil-gas GDP growth in Russian Federation, 2001-2010 (percentage points)
Source: own calculations based on data from NSC RF, WB WDI database, and dataset from World Bank (2008)
DRAFT, NOT FOR DISTRIBUTION
10
before the crisis, during 2006-2008, TFP contribution in non-oil-gas sectors was higher than for total
economy. Recent Global Competitiveness Report for Russia (WEF 2011) also shows that recently
productivity in supporting sectors (which are mostly market services, including construction, retail trade,
hospitality and etc.) grew faster than in many basic sectors (mining and manufacturing, where the
government is the main proponent and owner). However, dynamic development of supporting sectors
was fueled by oil incomes, which cannot drive the future growth.
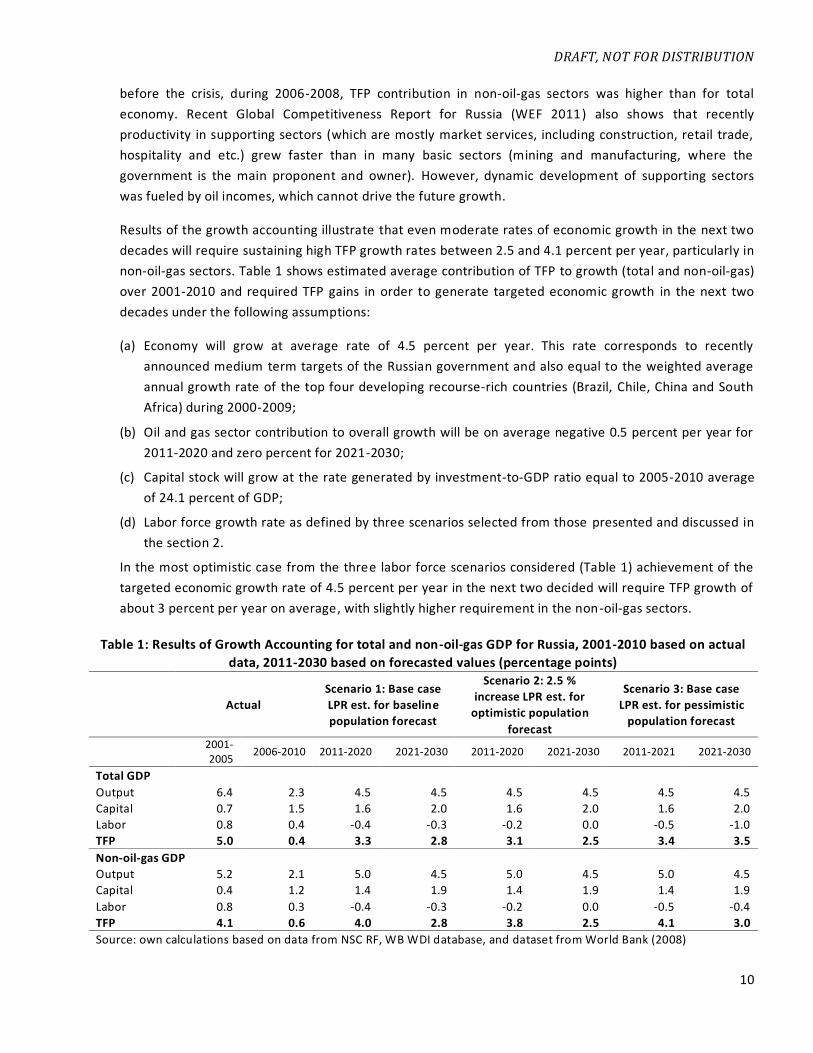
Results of the growth accounting illustrate that even moderate rates of economic growth in the next two
decades will require sustaining high TFP growth rates between 2.5 and 4.1 percent per year, particularly in
non-oil-gas sectors. Table 1 shows estimated average contribution of TFP to growth (total and non-oil-gas)
over 2001-2010 and required TFP gains in order to generate targeted economic growth in the next two
decades under the following assumptions:
(a) Economy will grow at average rate of 4.5 percent per year. This rate corresponds to recently
announced medium term targets of the Russian government and also equal to the weighted average
annual growth rate of the top four developing recourse-rich countries (Brazil, Chile, China and South
Africa) during 2000-2009;
(b) Oil and gas sector contribution to overall growth will be on average negative 0.5 percent per year for
2011-2020 and zero percent for 2021-2030;
(c) Capital stock will grow at the rate generated by investment-to-GDP ratio equal to 2005-2010 average
of 24.1 percent of GDP;
(d) Labor force growth rate as defined by three scenarios selected from those presented and discussed in
the section 2.
In the most optimistic case from the three labor force scenarios considered (Table 1) achievement of the
targeted economic growth rate of 4.5 percent per year in the next two decided will require TFP growth of
about 3 percent per year on average, with slightly higher requirement in the non-oil-gas sectors.
Table 1: Results of Growth Accounting for total and non-oil-gas GDP for Russia, 2001-2010 based on actual
data, 2011-2030 based on forecasted values (percentage points)
Actual
Scenario 1: Base case
LPR est. for baseline
population forecast
Scenario 2: 2.5 %
increase LPR est. for
optimistic population
forecast
Scenario 3: Base case
LPR est. for pessimistic
population forecast
2001-2005
2006-2010 2011-2020 2021-2030 2011-2020 2021-2030 2011-2021 2021-2030
Total GDP
Output 6.4 2.3 4.5 4.5 4.5 4.5 4.5 4.5
Capital 0.7 1.5 1.6 2.0 1.6 2.0 1.6 2.0
Labor 0.8 0.4 -0.4 -0.3 -0.2 0.0 -0.5 -1.0
TFP 5.0 0.4 3.3 2.8 3.1 2.5 3.4 3.5
Non-oil-gas GDP
Output 5.2 2.1 5.0 4.5 5.0 4.5 5.0 4.5
Capital 0.4 1.2 1.4 1.9 1.4 1.9 1.4 1.9
Labor 0.8 0.3 -0.4 -0.3 -0.2 0.0 -0.5 -0.4
TFP 4.1 0.6 4.0 2.8 3.8 2.5 4.1 3.0
Source: own calculations based on data from NSC RF, WB WDI database, and dataset from World Bank (2008)
DRAFT, NOT FOR DISTRIBUTION
11
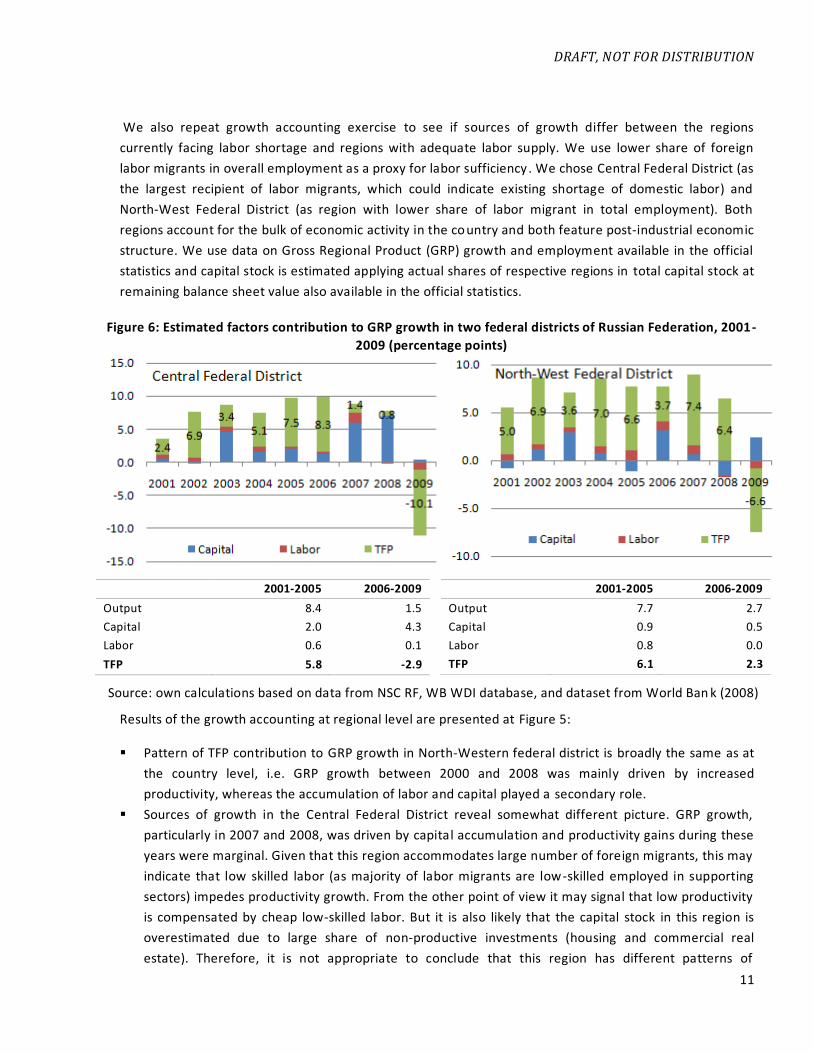
We also repeat growth accounting exercise to see if sources of growth differ between the regions
currently facing labor shortage and regions with adequate labor supply. We use lower share of foreign
labor migrants in overall employment as a proxy for labor sufficiency . We chose Central Federal District (as
the largest recipient of labor migrants, which could indicate existing shortage of domestic labor) and
North-West Federal District (as region with lower share of labor migrant in total employment). Both
regions account for the bulk of economic activity in the co untry and both feature post-industrial economic
structure. We use data on Gross Regional Product (GRP) growth and employment available in the official
statistics and capital stock is estimated applying actual shares of respective regions in total capital stock at
remaining balance sheet value also available in the official statistics.
Results of the growth accounting at regional level are presented at Figure 5:
Pattern of TFP contribution to GRP growth in North-Western federal district is broadly the same as at
the country level, i.e. GRP growth between 2000 and 2008 was mainly driven by increased
productivity, whereas the accumulation of labor and capital played a secondary role.
Sources of growth in the Central Federal District reveal somewhat different picture. GRP growth,
particularly in 2007 and 2008, was driven by capital accumulation and productivity gains during these
years were marginal. Given that this region accommodates large number of foreign migrants, this may
indicate that low skilled labor (as majority of labor migrants are low-skilled employed in supporting
sectors) impedes productivity growth. From the other point of view it may signal that low productivity
is compensated by cheap low-skilled labor. But it is also likely that the capital stock in this region is
overestimated due to large share of non-productive investments (housing and commercial real
estate). Therefore, it is not appropriate to conclude that this region has different patterns of
Figure 6: Estimated factors contribution to GRP growth in two federal districts of Russian Federation, 2001-
2009 (percentage points)
2001-2005 2006-2009
Output 8.4 1.5
Capital 2.0 4.3
Labor 0.6 0.1
TFP 5.8 -2.9
2001-2005 2006-2009
Output 7.7 2.7
Capital 0.9 0.5
Labor 0.8 0.0
TFP 6.1 2.3
Source: own calculations based on data from NSC RF, WB WDI database, and dataset from World Ban k (2008)
DRAFT, NOT FOR DISTRIBUTION
12
productivity growth, but given its significance for economy, it may well deserve more in -depth analysis
of growth drivers.
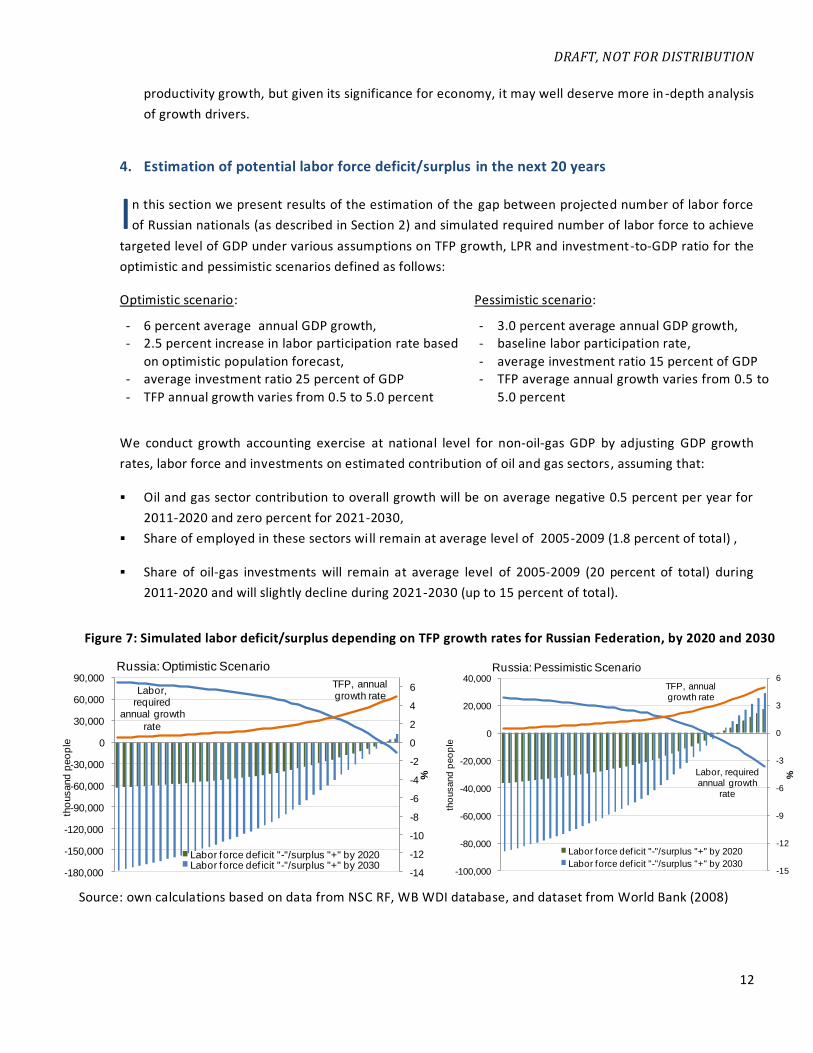
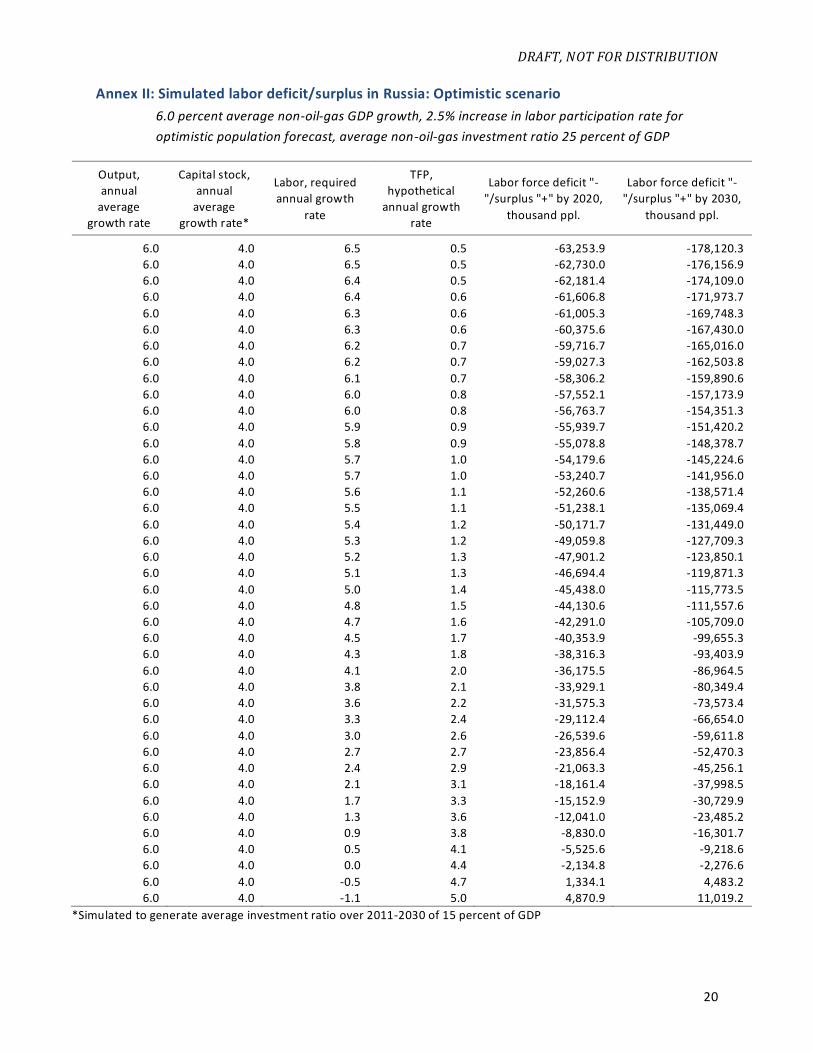
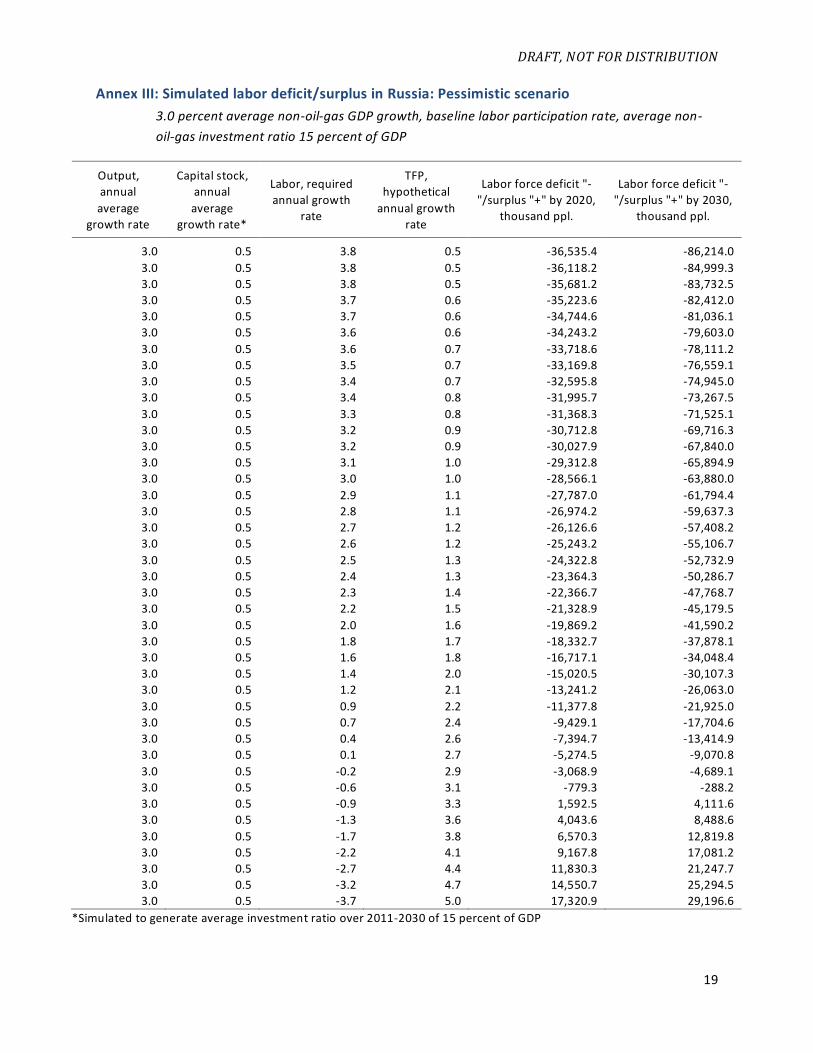
4. Estimation of potential labor force deficit/surplus in the next 20 years
n this section we present results of the estimation of the gap between projected number of labor force
of Russian nationals (as described in Section 2) and simulated required number of labor force to achieve
targeted level of GDP under various assumptions on TFP growth, LPR and investment-to-GDP ratio for the
optimistic and pessimistic scenarios defined as follows:
Optimistic scenario:
- 6 percent average annual GDP growth, - 2.5 percent increase in labor participation rate based
on optimistic population forecast, - average investment ratio 25 percent of GDP
- TFP annual growth varies from 0.5 to 5.0 percent
Pessimistic scenario:
- 3.0 percent average annual GDP growth, - baseline labor participation rate,
- average investment ratio 15 percent of GDP - TFP average annual growth varies from 0.5 to
5.0 percent
We conduct growth accounting exercise at national level for non-oil-gas GDP by adjusting GDP growth
rates, labor force and investments on estimated contribution of oil and gas sectors, assuming that:
Oil and gas sector contribution to overall growth will be on average negative 0.5 percent per year for
2011-2020 and zero percent for 2021-2030,
Share of employed in these sectors will remain at average level of 2005-2009 (1.8 percent of total) ,
Share of oil-gas investments will remain at average level of 2005-2009 (20 percent of total) during
2011-2020 and will slightly decline during 2021-2030 (up to 15 percent of total).
I
Figure 7: Simulated labor deficit/surplus depending on TFP growth rates for Russian Federation, by 2020 and 2030
Source: own calculations based on data from NSC RF, WB WDI database, and dataset from World Bank (2008)
Labor, required
annual growth
rate
TFP, annual growth rate
-14
-12
-10
-8
-6
-4
-2
0
2
4
6
-180,000
-150,000
-120,000
-90,000
-60,000
-30,000
0
30,000
60,000
90,000
%
tho
usand
peo
ple
Russia: Optimistic Scenario
Labor force def icit "-"/surplus "+" by 2020Labor force def icit "-"/surplus "+" by 2030
Labor, required annual growth
rate
TFP, annual growth rate
-15
-12
-9
-6
-3
0
3
6
-100,000
-80,000
-60,000
-40,000
-20,000
0
20,000
40,000
%
tho
usand
peo
ple
Russia: Pessimistic Scenario
Labor force def icit "-"/surplus "+" by 2020
Labor force def icit "-"/surplus "+" by 2030
DRAFT, NOT FOR DISTRIBUTION
13
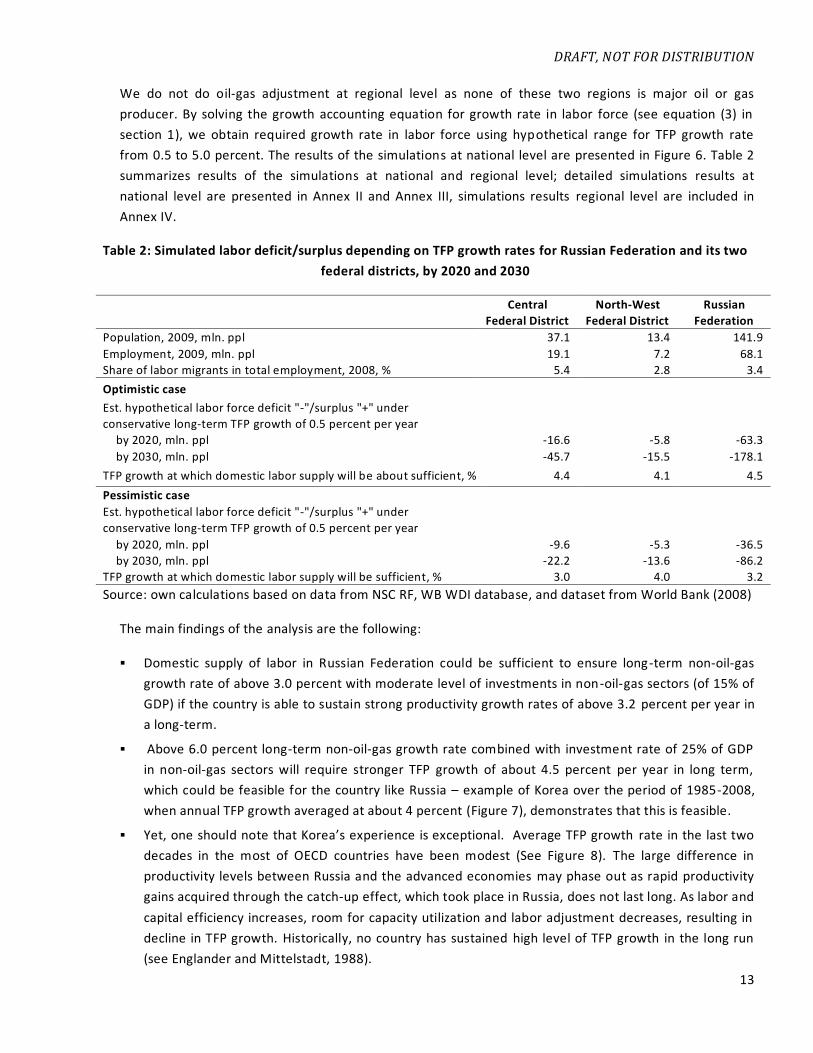
We do not do oil-gas adjustment at regional level as none of these two regions is major oil or gas
producer. By solving the growth accounting equation for growth rate in labor force (see equation (3) in
section 1), we obtain required growth rate in labor force using hypothetical range for TFP growth rate
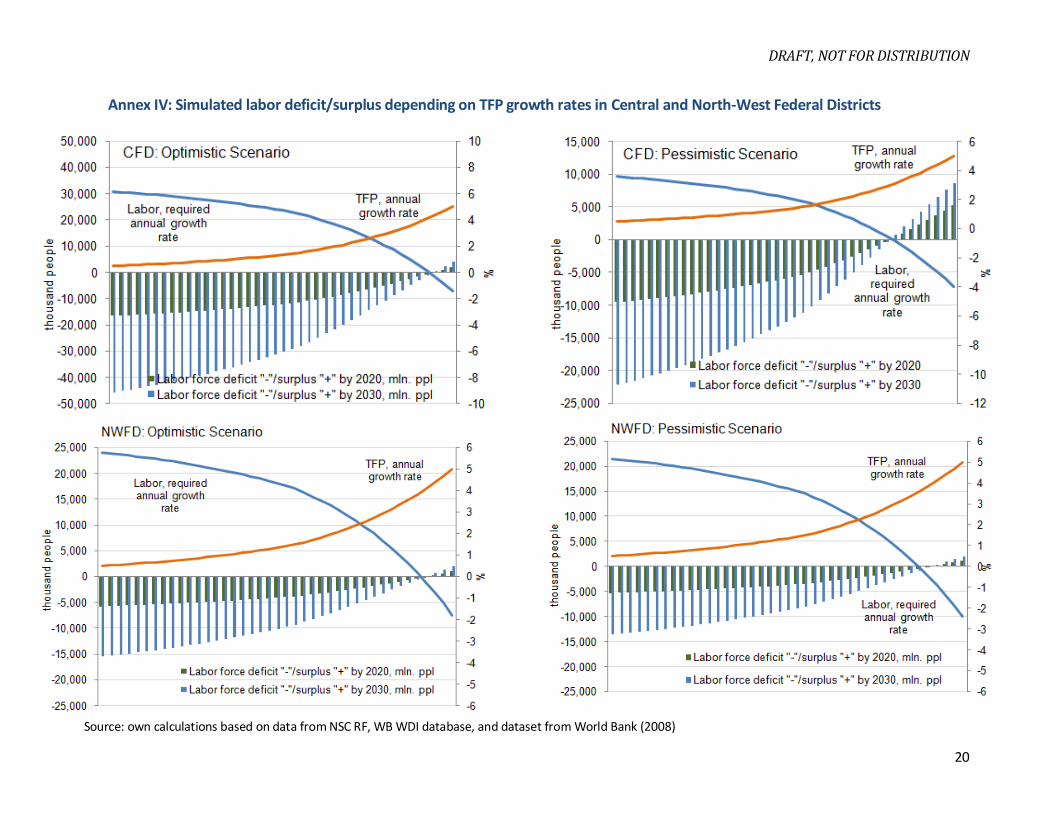
from 0.5 to 5.0 percent. The results of the simulations at national level are presented in Figure 6. Table 2
summarizes results of the simulations at national and regional level; detailed simulations results at
national level are presented in Annex II and Annex III, simulations results regional level are included in
Annex IV.
Table 2: Simulated labor deficit/surplus depending on TFP growth rates for Russian Federation and its two
federal districts, by 2020 and 2030
Central
Federal District
North-West
Federal District
Russian
Federation
Population, 2009, mln. ppl 37.1 13.4 141.9
Employment, 2009, mln. ppl 19.1 7.2 68.1
Share of labor migrants in total employment, 2008, % 5.4 2.8 3.4
Optimistic case
Est. hypothetical labor force deficit "-"/surplus "+" under
conservative long-term TFP growth of 0.5 percent per year
by 2020, mln. ppl -16.6 -5.8 -63.3
by 2030, mln. ppl -45.7 -15.5 -178.1
TFP growth at which domestic labor supply will be about sufficient, % 4.4 4.1 4.5
Pessimistic case
Est. hypothetical labor force deficit "-"/surplus "+" under
conservative long-term TFP growth of 0.5 percent per year
by 2020, mln. ppl -9.6 -5.3 -36.5
by 2030, mln. ppl -22.2 -13.6 -86.2
TFP growth at which domestic labor supply will be sufficient, % 3.0 4.0 3.2
Source: own calculations based on data from NSC RF, WB WDI database, and dataset from World Bank (2008)
The main findings of the analysis are the following:
Domestic supply of labor in Russian Federation could be sufficient to ensure long-term non-oil-gas
growth rate of above 3.0 percent with moderate level of investments in non-oil-gas sectors (of 15% of
GDP) if the country is able to sustain strong productivity growth rates of above 3.2 percent per year in
a long-term.
Above 6.0 percent long-term non-oil-gas growth rate combined with investment rate of 25% of GDP
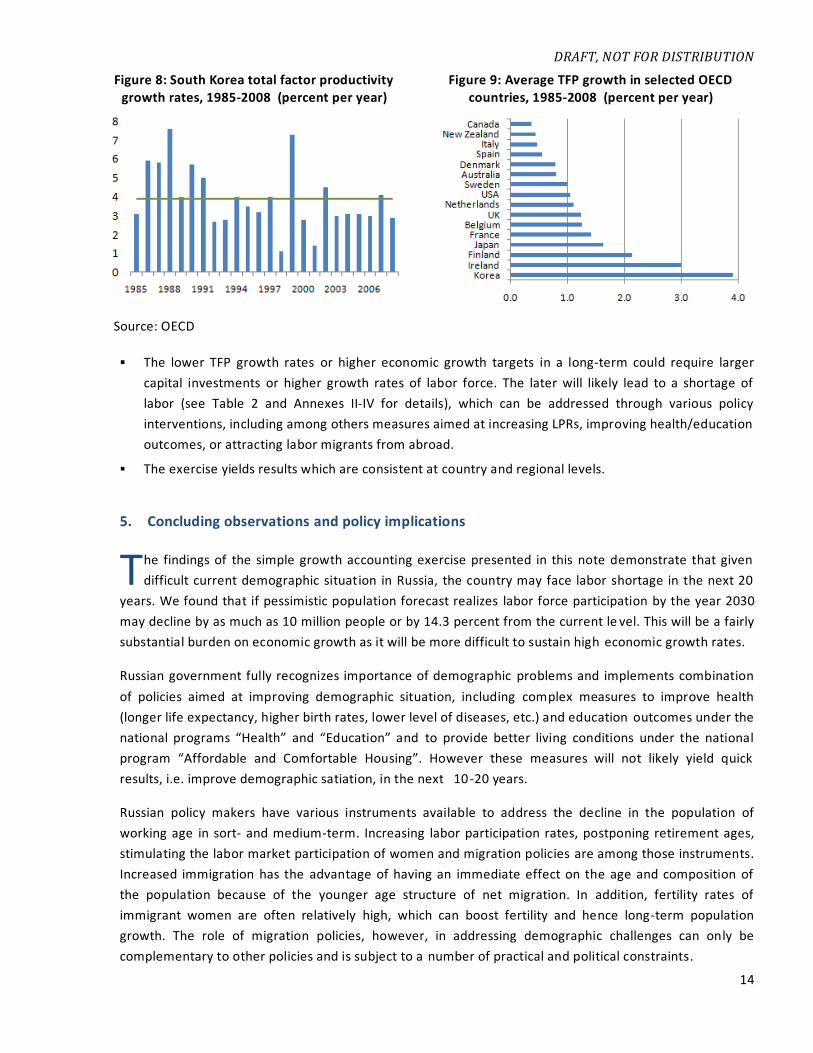
in non-oil-gas sectors will require stronger TFP growth of about 4.5 percent per year in long term,
which could be feasible for the country like Russia – example of Korea over the period of 1985-2008,
when annual TFP growth averaged at about 4 percent (Figure 7), demonstrates that this is feasible.
Yet, one should note that Korea’s experience is exceptional. Average TFP growth rate in the last two
decades in the most of OECD countries have been modest (See Figure 8). The large difference in
productivity levels between Russia and the advanced economies may phase out as rapid productivity
gains acquired through the catch-up effect, which took place in Russia, does not last long. As labor and
capital efficiency increases, room for capacity utilization and labor adjustment decreases, resulting in
decline in TFP growth. Historically, no country has sustained high level of TFP growth in the long run
(see Englander and Mittelstadt, 1988).
DRAFT, NOT FOR DISTRIBUTION
14
The lower TFP growth rates or higher economic growth targets in a long-term could require larger
capital investments or higher growth rates of labor force. The later will likely lead to a shortage of
labor (see Table 2 and Annexes II-IV for details), which can be addressed through various policy
interventions, including among others measures aimed at increasing LPRs, improving health/education
outcomes, or attracting labor migrants from abroad.
The exercise yields results which are consistent at country and regional levels.
5. Concluding observations and policy implications
he findings of the simple growth accounting exercise presented in this note demonstrate that given
difficult current demographic situation in Russia, the country may face labor shortage in the next 20
years. We found that if pessimistic population forecast realizes labor force participation by the year 2030
may decline by as much as 10 million people or by 14.3 percent from the current le vel. This will be a fairly
substantial burden on economic growth as it will be more difficult to sustain high economic growth rates.
Russian government fully recognizes importance of demographic problems and implements combination
of policies aimed at improving demographic situation, including complex measures to improve health
(longer life expectancy, higher birth rates, lower level of diseases, etc.) and education outcomes under the
national programs “Health” and “Education” and to provide better living conditions under the national
program “Affordable and Comfortable Housing”. However these measures will not likely yield quick
results, i.e. improve demographic satiation, in the next 10-20 years.
Russian policy makers have various instruments available to address the decline in the population of
working age in sort- and medium-term. Increasing labor participation rates, postponing retirement ages,
stimulating the labor market participation of women and migration policies are among those instruments.
Increased immigration has the advantage of having an immediate effect on the age and composition of
the population because of the younger age structure of net migration. In addition, fertility rates of
immigrant women are often relatively high, which can boost fertility and hence long-term population
growth. The role of migration policies, however, in addressing demographic challenges can only be
complementary to other policies and is subject to a number of practical and political constraints.
Figure 8: South Korea total factor productivity growth rates, 1985-2008 (percent per year)
Figure 9: Average TFP growth in selected OECD countries, 1985-2008 (percent per year)
Source: OECD
T
DRAFT, NOT FOR DISTRIBUTION
15
Russia has been already receiving large inflows of labor migrants which partially offset decline in total
population (see paragraph 1 in section 2). But these massive migrant inflows featured mostly un-skilled
labor which was attracted by large wage differentials fueled by country’s oil wealth. With envisaged
decline of oil and gas sectors output, the needs in this type of labor will subside. Now the Government
may consider setting up new requirements for recruitment of foreign labor (e.g. education, skills, age
groups, etc.) to be able to attract labor of higher quality to specific sectors or regions. This will not only
help to close the labor market gap, but contribute to overall labor productivity and country
competitiveness improvement. This will, however, require substantial preparatory work, including labor
needs assessment at sectoral and regional level.
We show that domestic supply of labor in Russian Federation under current demographic trends and
maintaining current level of investments could be sufficient to ensure sustainable long-term non-oil-gas
growth rate of above 3.0 percent only if the country is able to sustain strong productivity growth rates of
about 3-4 percent per year in a long-term.
These are high rates, but feasible. First, there are examples demonstrating that this is possible - South
Korea sustained 3.9 percent average total factor productivity growth rates over the period from 1985 to
2008. Second, strong productivity gains in Russia over the last decade were derived at large extent from
increased capacity utilization. Macroeconomic stability, better governance and business environment,
financial deepening, and investments in infrastructure, particularly in information and communication
technology (ICT), were other drivers of productivity growth (see WEF, 2011). However, it is commonly
agreed that Russian economy still has substantial potential to improve its productivity. The Russian
government is inclined to realize this potential using traditional industrial policy instruments. A number of
analytical/policy studies, however, warn that productivity growth may require more fundamental
structural reforms.
For example, WB RER (2011) discusses factors with the strongest positive impact on productivity of
Russian firms, which include investment climate, competition policy, innovations and skills level of labor.
WEF GCR (2011) suggests that Russia can realize its potential and improve competitiveness by building on
the three key advantages - large domestic and foreign market size, its stock of well-educated population,
and its undisputable wealth in natural resources - and by addressing the five key challenges - rule of law
and the institutional framework, eroding quality of education, week competition environment, financial
market supervision, outdated business/management processes. Finally, Gaddy and Ickes (2010) argue that
Russia’s growth strategy cannot succeed only through eradicating the “typical set” of efficiency problems,
i.e. weak property rights, corruption, etc. They argue that the country needs to eliminate systematic
misuse of assets rooted in the inherited production structure and “oil rent addiction”. The former refers to
the particular kinds of physical and human capital that were accumulated in the Soviet era and the
manner in which they were allocated, including their spatial allocation. The later implies that there is an
imperative to distribute a large share of Russia’s oil and gas rents to the production enterprises that
employ this inherited physical and human capital.
DRAFT, NOT FOR DISTRIBUTION
16
References
Bosworth and Collins (2003), The Empirics of Growth: An Update, Brookings Institution, Washington DC
Caselli (2004), Accounting for Cross-Country Income Differences, Handbook of Economic Growth, Harvard
Englander and Mittelstadt (1988), Total Factor Productivity: Macroeconomic and Structural Aspects of the
Slowdown, OECD Economic Studies
Fischer, Sahay and Vegh (1998), How far is Eastern Europe from Brussels? IMF working paper
Gaddy and Ickes (2010) Bear Traps: Can Russia Avoid the Pitfalls on the Road to Sustainable Economic
Growth? Center for Research on International Financial and Energy Security, Pennsylvania State University
Gollin (2002), Getting income shares right. Journal of Political Economy 110, 458–74
Gurvich et al. (2008), Cyclical Fiscal Policy in Resource Rich Countries, High School of Economics, Moscow
IMF (2010) Economic Health Check, Russia: Fragile Recovery from Crisis
IMF (2006), The Utilization-Adjusted Output Gap: Is the Russian Economy Overheating?
IMF (2004), Domestic and global perspectives of migration to the United States, country report to the
United States
Doudeijns and Dumont (2003), Immigration and Labor shortages: Evaluation of needs and limits of
selection policies in recruitment of foreign labor, OECD Working Paper
World Bank (2007a), Unleashing Prosperity: Productivity Growth in Eastern Europe and Former Soviet
Union
World Bank (2007b), From Red to Gray - The "Third Transition" of Aging Populations in Eastern Europe and
the Former Soviet Union
World Bank (2005), Russian Federation Country Economic Memorandum
World Bank (2005), Dying Too Young: Addressing Premature Mortality and Ill Health Due to Non -
Communicable Diseases and Injuries in the Russian Federation
World Economic Forum (WEF) (2011), The Russia Competitiveness Report 2011: Laying the Foundation for
Sustainable Prosperity
UNFPA (2010), Social and Demographic Development in Russia: 15 Years beyond Cairo Program
DRAFT, NOT FOR DISTRIBUTION
20
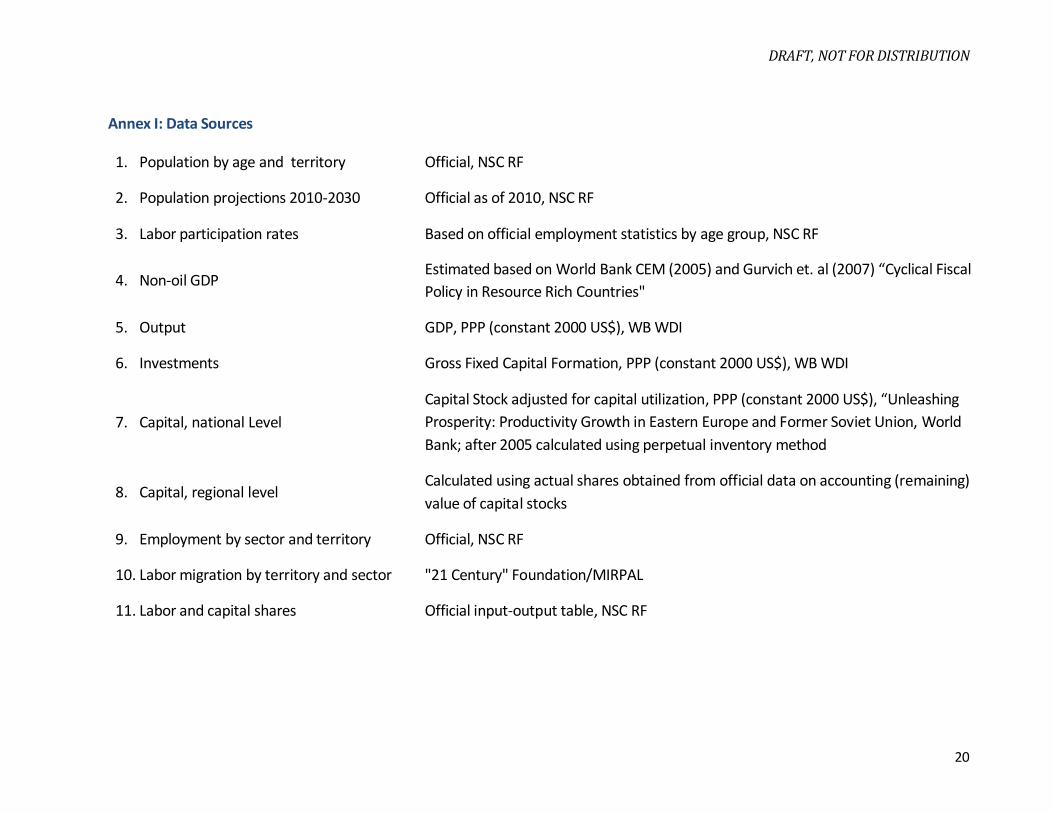
Annex I: Data Sources
1. Population by age and territory Official, NSC RF
2. Population projections 2010-2030 Official as of 2010, NSC RF
3. Labor participation rates Based on official employment statistics by age group, NSC RF
4. Non-oil GDP Estimated based on World Bank CEM (2005) and Gurvich et. al (2007) “Cyclical Fiscal
Policy in Resource Rich Countries"
5. Output GDP, PPP (constant 2000 US$), WB WDI
6. Investments Gross Fixed Capital Formation, PPP (constant 2000 US$), WB WDI
7. Capital, national Level
Capital Stock adjusted for capital utilization, PPP (constant 2000 US$), “Unleashing
Prosperity: Productivity Growth in Eastern Europe and Former Soviet Union, World
Bank; after 2005 calculated using perpetual inventory method
8. Capital, regional level Calculated using actual shares obtained from official data on accounting (remaining)
value of capital stocks
9. Employment by sector and territory Official, NSC RF
10. Labor migration by territory and sector "21 Century" Foundation/MIRPAL
11. Labor and capital shares Official input-output table, NSC RF
DRAFT, NOT FOR DISTRIBUTION
20
Annex II: Simulated labor deficit/surplus in Russia: Optimistic scenario
6.0 percent average non-oil-gas GDP growth, 2.5% increase in labor participation rate for
optimistic population forecast, average non-oil-gas investment ratio 25 percent of GDP
Output,
annual
average
growth rate
Capital stock,
annual
average
growth rate*
Labor, required
annual growth
rate
TFP,
hypothetical
annual growth
rate
Labor force deficit "-
"/surplus "+" by 2020,
thousand ppl.
Labor force deficit "-
"/surplus "+" by 2030,
thousand ppl.
6.0 4.0 6.5 0.5 -63,253.9 -178,120.3
6.0 4.0 6.5 0.5 -62,730.0 -176,156.9
6.0 4.0 6.4 0.5 -62,181.4 -174,109.0
6.0 4.0 6.4 0.6 -61,606.8 -171,973.7
6.0 4.0 6.3 0.6 -61,005.3 -169,748.3
6.0 4.0 6.3 0.6 -60,375.6 -167,430.0
6.0 4.0 6.2 0.7 -59,716.7 -165,016.0
6.0 4.0 6.2 0.7 -59,027.3 -162,503.8
6.0 4.0 6.1 0.7 -58,306.2 -159,890.6
6.0 4.0 6.0 0.8 -57,552.1 -157,173.9
6.0 4.0 6.0 0.8 -56,763.7 -154,351.3
6.0 4.0 5.9 0.9 -55,939.7 -151,420.2
6.0 4.0 5.8 0.9 -55,078.8 -148,378.7
6.0 4.0 5.7 1.0 -54,179.6 -145,224.6
6.0 4.0 5.7 1.0 -53,240.7 -141,956.0
6.0 4.0 5.6 1.1 -52,260.6 -138,571.4
6.0 4.0 5.5 1.1 -51,238.1 -135,069.4
6.0 4.0 5.4 1.2 -50,171.7 -131,449.0
6.0 4.0 5.3 1.2 -49,059.8 -127,709.3
6.0 4.0 5.2 1.3 -47,901.2 -123,850.1
6.0 4.0 5.1 1.3 -46,694.4 -119,871.3
6.0 4.0 5.0 1.4 -45,438.0 -115,773.5
6.0 4.0 4.8 1.5 -44,130.6 -111,557.6
6.0 4.0 4.7 1.6 -42,291.0 -105,709.0
6.0 4.0 4.5 1.7 -40,353.9 -99,655.3
6.0 4.0 4.3 1.8 -38,316.3 -93,403.9
6.0 4.0 4.1 2.0 -36,175.5 -86,964.5
6.0 4.0 3.8 2.1 -33,929.1 -80,349.4
6.0 4.0 3.6 2.2 -31,575.3 -73,573.4
6.0 4.0 3.3 2.4 -29,112.4 -66,654.0
6.0 4.0 3.0 2.6 -26,539.6 -59,611.8
6.0 4.0 2.7 2.7 -23,856.4 -52,470.3
6.0 4.0 2.4 2.9 -21,063.3 -45,256.1
6.0 4.0 2.1 3.1 -18,161.4 -37,998.5
6.0 4.0 1.7 3.3 -15,152.9 -30,729.9
6.0 4.0 1.3 3.6 -12,041.0 -23,485.2
6.0 4.0 0.9 3.8 -8,830.0 -16,301.7
6.0 4.0 0.5 4.1 -5,525.6 -9,218.6
6.0 4.0 0.0 4.4 -2,134.8 -2,276.6
6.0 4.0 -0.5 4.7 1,334.1 4,483.2
6.0 4.0 -1.1 5.0 4,870.9 11,019.2
*Simulated to generate average investment ratio over 2011-2030 of 15 percent of GDP
DRAFT, NOT FOR DISTRIBUTION
19
Annex III: Simulated labor deficit/surplus in Russia: Pessimistic scenario
3.0 percent average non-oil-gas GDP growth, baseline labor participation rate, average non-
oil-gas investment ratio 15 percent of GDP
Output,
annual
average
growth rate
Capital stock,
annual
average
growth rate*
Labor, required
annual growth
rate
TFP,
hypothetical
annual growth
rate
Labor force deficit "-
"/surplus "+" by 2020,
thousand ppl.
Labor force deficit "-
"/surplus "+" by 2030,
thousand ppl.
3.0 0.5 3.8 0.5 -36,535.4 -86,214.0
3.0 0.5 3.8 0.5 -36,118.2 -84,999.3
3.0 0.5 3.8 0.5 -35,681.2 -83,732.5
3.0 0.5 3.7 0.6 -35,223.6 -82,412.0
3.0 0.5 3.7 0.6 -34,744.6 -81,036.1
3.0 0.5 3.6 0.6 -34,243.2 -79,603.0
3.0 0.5 3.6 0.7 -33,718.6 -78,111.2
3.0 0.5 3.5 0.7 -33,169.8 -76,559.1
3.0 0.5 3.4 0.7 -32,595.8 -74,945.0
3.0 0.5 3.4 0.8 -31,995.7 -73,267.5
3.0 0.5 3.3 0.8 -31,368.3 -71,525.1
3.0 0.5 3.2 0.9 -30,712.8 -69,716.3
3.0 0.5 3.2 0.9 -30,027.9 -67,840.0
3.0 0.5 3.1 1.0 -29,312.8 -65,894.9
3.0 0.5 3.0 1.0 -28,566.1 -63,880.0
3.0 0.5 2.9 1.1 -27,787.0 -61,794.4
3.0 0.5 2.8 1.1 -26,974.2 -59,637.3
3.0 0.5 2.7 1.2 -26,126.6 -57,408.2
3.0 0.5 2.6 1.2 -25,243.2 -55,106.7
3.0 0.5 2.5 1.3 -24,322.8 -52,732.9
3.0 0.5 2.4 1.3 -23,364.3 -50,286.7
3.0 0.5 2.3 1.4 -22,366.7 -47,768.7
3.0 0.5 2.2 1.5 -21,328.9 -45,179.5
3.0 0.5 2.0 1.6 -19,869.2 -41,590.2
3.0 0.5 1.8 1.7 -18,332.7 -37,878.1
3.0 0.5 1.6 1.8 -16,717.1 -34,048.4
3.0 0.5 1.4 2.0 -15,020.5 -30,107.3
3.0 0.5 1.2 2.1 -13,241.2 -26,063.0
3.0 0.5 0.9 2.2 -11,377.8 -21,925.0
3.0 0.5 0.7 2.4 -9,429.1 -17,704.6
3.0 0.5 0.4 2.6 -7,394.7 -13,414.9
3.0 0.5 0.1 2.7 -5,274.5 -9,070.8
3.0 0.5 -0.2 2.9 -3,068.9 -4,689.1
3.0 0.5 -0.6 3.1 -779.3 -288.2
3.0 0.5 -0.9 3.3 1,592.5 4,111.6
3.0 0.5 -1.3 3.6 4,043.6 8,488.6
3.0 0.5 -1.7 3.8 6,570.3 12,819.8
3.0 0.5 -2.2 4.1 9,167.8 17,081.2
3.0 0.5 -2.7 4.4 11,830.3 21,247.7
3.0 0.5 -3.2 4.7 14,550.7 25,294.5
3.0 0.5 -3.7 5.0 17,320.9 29,196.6
*Simulated to generate average investment ratio over 2011-2030 of 15 percent of GDP
DRAFT, NOT FOR DISTRIBUTION
20
Annex IV: Simulated labor deficit/surplus depending on TFP growth rates in Central and North-West Federal Districts
Source: own calculations based on data from NSC RF, WB WDI database, and dataset from World Bank (2008)