Embed Size (px)
Citation preview
1
Will outsourcing of commercial property management functions add to performance?
A quantitative analysis of the Swedish market
Sigrid Katzler, Björn Berggren & Christina Gustafsson
Abstract
Purpose – An important strategic decision for real estate companies is whether to outsource
real estate management functions or to manage the properties in-house. Earlier real estate research has
shown that outsourcing of different managerial operations can lead to cost reduction, and the stated
reasons include cost control, access to specialised competence and access to a specific technology. The
focus has been on outsourcing in the corporate property sector, not the commercial property sector,
and only a few studies have focused on outsourcing as a way to increase firms’ results. The purpose of
this paper is to examine how outsourcing of different managerial functions affects profitability in the
commercial property sector at the property level.
Design/methodology/approach – The empirical base of this paper is commercial real estate data for
Sweden between 1999 and 2014, attained through MSCI. Regression analysis was conducted to test the
effects of outsourcing of different real estate management functions on total income, total costs and
net income for properties with different characteristics and in different time periods.
Findings – The regression results indicate that outsourcing for companies in which ownership of real
estate is their core business has limited power to increase net income and reduce costs. Outsourcing of
technical management separately does seem to increase the total income, but the cause effect is unclear
and needs to be investigated further.
Research limitations – Individual properties cannot be identified for confidentiality reasons, thus
making the analysis of a panel impossible. The lack of access to information on ownership of individual
properties means that the potential effect of owner category on results cannot be controlled for.
Originality – This study is one of the first to measure the performance of firms that outsource part or
all of their real estate management functions in the commercial real estate sector.
Keywords Commercial properties, Outsourcing, Performance measurement, Real estate management,
Value creation
Paper type Research paper
2
1. INTRODUCTION
An important strategic decision for real estate investors is whether to outsource real estate management
functions or to manage the properties in-house. In the real estate management literature, the focus of
attention has been on corporate real estate, not on strategic decisions for commercial real estate
owners. Most studies on outsourcing in the corporate sector focus on cost reduction, but there is a lack
of empirical studies linking different levels of outsourcing to returns. The fundamental questions that
need to be answered are which functions are core business functions (and thus should be performed
within the real estate firm) and which functions can be outsourced. Traditionally, management can be
outsourced at two different levels: (a) technical management or (b) combined technical and managerial
management (full outsourcing). Managerial management includes administration, financial management
and tenant relations. Different types of investors in the real estate market have different liabilities and
different investment perspectives where the number and size of transactions within the property
portfolio, local market knowledge and the characteristics of the company’s real estate portfolio are
major drivers behind the choice of whether to outsource real estate management functions. Research
on large real estate investors in Sweden suggests that real estate investors of a similar type make
different decisions regarding whether to outsource real estate management functions. These differences
in decision-making could be because of different perceptions of how different levels of outsourcing
affect profitability at the property level.
The aim of this paper is to test empirically whether outsourcing services within the real estate
sector will lead to improved performance in the outsourcing companies. To fulfil this aim, an analysis is
conducted on the potential gains from outsourcing at the company versus property levels. Then testing
is performed to determine the effects of different outsourcing strategies on total income, total cost and
net income at the property level.
In Section 2, the theoretical points of departure are presented together with a literature review
on outsourcing in general and outsourcing within the corporate real estate sector in particular. In
Section 3, the data and the methods used are presented. Section 4 presents the results; these results are
then analysed in Section 5. The conclusions of the paper and several suggestions for future research are
presented in Section 6.
3
1. THEORETICAL POINTS OF DEPARTURE
1.1 Background of outsourcing The idea behind the concept of outsourcing has been a part of academic research since the 1930s when
Ronald Coase (1937) published his seminal work on the nature of the firm. In that article, the
boundaries of the firm with regard to the chosen structure are elaborated upon. The boundaries of the
firm are also the focus of research by Williamson (1985). The fundamental issue relates to transaction
costs and how the firm ought to minimise these costs by choosing which operations to conduct within
the firm and which services and products to acquire in the market. A study by Thompson (1967)
analysed the core activities of an organisation and how to protect them within the organisation. This
analysis has been furthered by researchers such as Hamel and Prahalad (1991) and Peteraf (1993). The
fundamental questions that management has to answer are which functions are deemed core functions
that need to be protected and performed within the firm and which functions can be outsourced. This
paper adheres to the following definition of outsourcing by Meyers (2002), who stated that outsourcing
is “the strategic use of outside resources to perform activities traditionally handled by internal staff and
resources” (p.).
According to Quinn (1999), a core competency is not something that the firm does relatively
well, but rather it is a world-class service that has the potential of creating a competitive edge (Quinn et
al., 1996). Traditionally, outsourcing has been associated with manufacturing. Today, outsourcing is the
main ingredient in any firm’s strategy, irrespective of industry (Holcomb and Hitt, 2007).
Because of transaction costs, complete contracts that anticipate all possible events and the
different actions that are appropriate cannot be written. Instead, incomplete contracts are written that
specify only some actions. Certain parts in the contract must be taken but not others. Hart (1988)
described how incomplete contracts and residual rights of control provide a useful framework for
thinking about the boundaries of the firm. However, the authors of the present paper do not have
access to information regarding the contracts between the outsourcing companies and the property
consultancy firms. For this reason, it is not the focus of this paper.
1.2 Pros of outsourcing A number of previous studies have investigated the potential that outsourcing can offer to a firm that
decides to outsource some of its services or production. As previously mentioned here, one of the most
often stated benefits of outsourcing has to do with the ability of the outsourcing firm to focus on its
core business (Palm, 2015; Quinn, 1999). That is, the outsourcing firm can place greater focus on the
4
most value-adding functions within the firm, thereby increasing the total value of the firm (Greco,
1997; Sharp, 2013).
In addition to an increased focus on core competencies, outsourcing could lead to an increase
in flexibility of the outsourcing firm’s operations (Kotabe et al., 2012). By outsourcing redundant
operations that tie up resources, the entire firm could become more flexible (Bartelink et al., 2015).
Related to the increased flexibility is the fact that outsourcing lowers the costs of operations and
employees (Damodaran et al., 1997). A shift from a firm’s own employees to the use of subcontractors
results in a completely different cost structure of the firm. This has been one of the most important
factors behind the use of outsourcing within the manufacturing industry since the 1990s (Quinn, 1999).
In a competitive market such as real estate management, a firm’s ability to develop and innovate
is a way for the firm to gain competitive advantage (Farncombe and Waller, 2005; Palm, 2013).
Therefore, the potential of outsourcing to provide access to cutting-edge knowledge and development
could be seen as extremely important. Previous studies have highlighted the importance of outside
expertise in innovating firms and making them more competitive (Quinn, 1999; Matsham and
Heywood, 2012). The acquisition of outside advice through outsourcing provides valuable input into
the strategic development of a firm within the current market and creates a possibility for outsourcing
to expand to other markets. Research has shown that a firm’s use of outsourcing can possibly connect
the firm to new markets through the use of different networks and connections of the subcontracting
firm (Kolawole and Agha, 2015).
From time to time, new management ideas obtain a foothold within the market. One of these
has to do with organisational restructuring or re-engineering (Grover et al., 1995). The idea behind re-
engineering is to rethink the business model and to rethink the value-creating process within the firm.
The use of outsourcing could be seen as a vital piece in the re-engineering process of the firm (Tas and
Sunder, 2004).
Finally, one additional benefit of outsourcing is the inherent risk-reducing element it contains (Quinn,
1999). With its use of outside expertise and minimisation of fixed costs, outsourcing provides a means
to free up internal resources and to reduce financial and operational risks (Kimbler and Rutherford,
1993; Matsham and Heywood, 2012).
1.3 Risks associated with outsourcing The rise in the popularity of outsourcing has led to an increased interest in the potential downside of
outsourcing activities and functions (cf. Pichler and Turner, 2007; Timm, 2009). Previous studies have
5
indicated that using subcontractors could lead to a number of problems within the outsourcing firm.
Some of the more troublesome problems are addressed in the remaining paragraphs of this subsection.
By using a subcontractor, the outsourcing firm will definitively experience a loss of
management control. Depending on the type of control that is lost, the impact will be more or less
severe. Previous research has indicated that losing contact with customers could be seen as very
problematic (Knowles, 2004; Palm, 2015). Even though the outsourcing firm might not lose the entire
relationship with a particular customer, the firm might still potentially lose sensitive data (Palm, 2013;
2015), which in itself is very problematic.
Another potential problem of outsourcing is how to control the quality of a firm’s services or
products (Quinn et al., 1995). When the outsourcing firm relinquishes control of customer care and
satisfaction to a subcontractor, this could be seen as a major risk. Related to this quality control issue is
how the outsourcing firm can be assured that the subcontractor attends to the needs of end users as
there is a potential risk for opportunistic behaviour (cf. Jensen and Meckling, 1976; Williamson, 1985).
Real estate markets are especially prone to informational asymmetry and incomplete contracts because
of high asset specificity and highly imperfect markets (Freybote and Gibler, 2011). (For a fuller
discussion on agency risks in outsourcing corporate real estate functions, see Black and Gibler, 2004.)
Finally, some studies question the savings that outsourcing could accomplish by claiming that
there are hidden costs associated with outsourcing as well as potential legal problems (Matsham and
Heywood, 2012). In conclusion, although there are a number of potential benefits in using a well-
planned outsourcing strategy, there are also considerable risks and potential problems associated with
outsourcing. Outsourcing firms must therefore carefully consider what their core functions and
competencies are (Kolawole and Agha, 2015).
1.4 Outsourcing in the commercial real estate sector Outsourcing in a service industry, for example, commercial real estate, is quite different from
outsourcing within the manufacturing sector (Manning et al., 1997; Quinn, 1999; Kolawole and Agha,
2015). Whilst the outsourcing of production is a game changer for many industrial firms, the
outsourcing of part of the services that a real estate company manages could be seen as less dramatic
(Damodaran et al., 1997).
Basically, the outsourcing of real estate firms can be divided into two different strategies. The
more common type of strategy is to outsource technical services, such as cleaning and maintenance, as
they are seldom seen as core competencies that create a competitive advantage. Another strategy is the
outsourcing of different types of managerial services. Managerial services include a large number of
6
different activities such as bookkeeping, customer contact, invoicing, support and other more or less
qualified services (Palm, 2011). An interesting question is what types of managerial services are
considered by a commercial real estate company to be core competencies. The answer could differ
depending on the chosen strategy (Palm, 2013). Previous studies have indicated that the real estate
sector has been rather slow in adapting new management strategies such as customer orientation and
outsourcing (Black and Gibler, 2004; Rasila and Gersberg, 2007; Palm, 2011). This slowness has been
attributed to the uniqueness of the real estate sector and the fact that the assets are illiquid (cf. Wilson et
al., 2001; Farncombe and Waller, 2005). For property management firms to enter the market, the
investment is mainly the professional and manual labour force rather than capital investments.
Therefore, the property service market should have a high number of suppliers and a high degree of
contestability (Lam, 2012).
There exists a relationship between occupier satisfaction and property performance that justifies
a tenant-oriented approach to property management (Oyedokun et al., 2014). Although attracting new
tenants is a high priority for real estate companies, retaining current tenants is handled at the real estate
management level and, according to Reichheld (1996), could increase profits by 40 per cent for office
building management. The increase in profits comes mainly from the reduced vacancy between
consecutive tenants, the decrease in acquisition costs (marketing, concessions) and the decrease in
operating costs because current tenants are familiar with services and procedures (Appel-Meulenbroek,
2008).
As evidenced by the theoretical points of departure, there are several potential benefits and
risks associated with outsourcing in the real estate sector. The most relevant theories for analysing
profitability at the property level are those referring to core competencies, economies of scale and level
of contestability. One hypothesis is that outsourcing of technical management provides the outsourcing
firm with access to specialised competence and technology that could lead to a reduction in costs. The
outsourcing of technical management might also have a positive effect on total income by allowing the
outsourcing firm to focus on managerial management, including tenant relationships. In theory,
competition between providers of property management services should lead to services of higher
quality/lower cost, affecting both total income and total costs, and the competition is probably
different in different regions and during different periods in the business cycle. The size of the
properties has an impact on the ability to create manageable units, and a property owner with a
geographically diverse portfolio consisting of small properties might be better off outsourcing
management services. A potential risk when outsourcing managerial management is the loss of control
over tenant satisfaction, thereby increasing the risk of vacancies.
7
2. DATA AND METHOD
The Swedish real estate market, the sample and the data distribution are described in this section. The
regression models and the variables used for the analysis are then presented.
2.1 The Swedish real estate market Until the early 1970s, the commercial space rental market was of very limited size in Sweden. The
standard way for industrial and service companies to deal with the provision of premises was to build
and manage these premises in-house. As the private service sector in Sweden started growing in the late
1970s, the commercial rental market also started to grow. Large parts of the service sector originate
from past industrial enterprises that gradually switched from the production of physical products to
selling services. Starting in the early 1980s, ownership of real estate became more dominated by
institutional investors, such as pension funds and insurance companies, using the same financial
evaluation models for real estate as for stocks and bonds, which led to a longer investment horizon
with the real return on the asset as the main decision criterion (Lind and Lundström, 2009; Palm, 2015).
The outsourcing trend for real estate management in Sweden started in the 1990s and increased
over the period 2003 to 2007 with the inflow of international investors into the Swedish commercial
real estate market (Lind, 2015). Outsourcing became a trend because an in-house professional
management team would take too long to establish and may also cause problems in the exit stage for a
fund (Palm, 2013).
Today, external real estate management is preferred by funds and international investors in
general, whereas most of the Swedish publicly listed real estate companies and some of the largest
institutional investors carry out their real estate management in-house with their own staff. Short-term
investors are generally in favour of external real estate management. In addition, some long-term
investors, for example, Swedish institutions, have outsourced all real estate management (Palm, 2013;
Lind, 2015). Another trend being followed by institutions is the investment in real estate via joint
ventures and/or the use of external asset managers for the management of real estate portfolios.
The value of the Swedish real estate market is estimated to be 12,000 billion SEK, 1 but the
professionally managed investment market constitutes only 10 per cent of the total Swedish real estate
stock (Lind, 2015). Twenty-two public real estate companies listed on the Stockholm Stock Exchange
own one third of these properties. A majority of these manage their properties in-house, with some
support being received from external service suppliers.
1 10 SEK is approximately equivalent to 1 euro.
8
Institutional investors, including life, pension and insurance funds, hold 28 per cent of the value
of the investment market. During the past 20 years, several Swedish institutions have outsourced their
real estate management with mixed results. A few have since reverted and insourced their management
again. A rough estimate is that half of the Swedish institutional real estate portfolios are managed in-
house at present.
International investors and funds with holdings of 21 per cent of the Swedish investment
market have almost consistently found outsourcing of real estate management more suitable for their
short-term strategy. The remaining properties are mostly owned by private investors.
The data for this study were provided by MSCI from their Swedish property databank – the
basis for the IPD Swedish property index. MSCI collects data from 40 investors with holdings of more
than 500 billion SEK, which covers 40 per cent of the investment market as previously described here.
Data were available for individual properties for the time period 1997 to 2014, and included more than
10,000 observations prior to the analysis. Following the removal of outliers, 9528 observations on
office properties remained.
This study is limited to office buildings so as to make comparisons of income variables easier.
In addition, the index is dominated by large real estate owners, so the benefit for smaller investors to
outsource might not be captured in the results. To guarantee confidentiality, the authors of this study
do not have access to information on ownership of individual properties, meaning that the type of
investor cannot be used as a variable. Finally, individual properties cannot be identified, thus making
the analysis of panel data impossible.
3.1.1Datadistribution
MSCI divides the Swedish real estate market into six regions for office buildings. Stockholm is the
capital of Sweden, and three of six regions belong in Stockholm, namely Stockholm central business
district (CBD), Stockholm central area and the rest of greater Stockholm. Together, the three
Stockholm regions make up more than half of the databank; Gothenburg and Malmö are the second
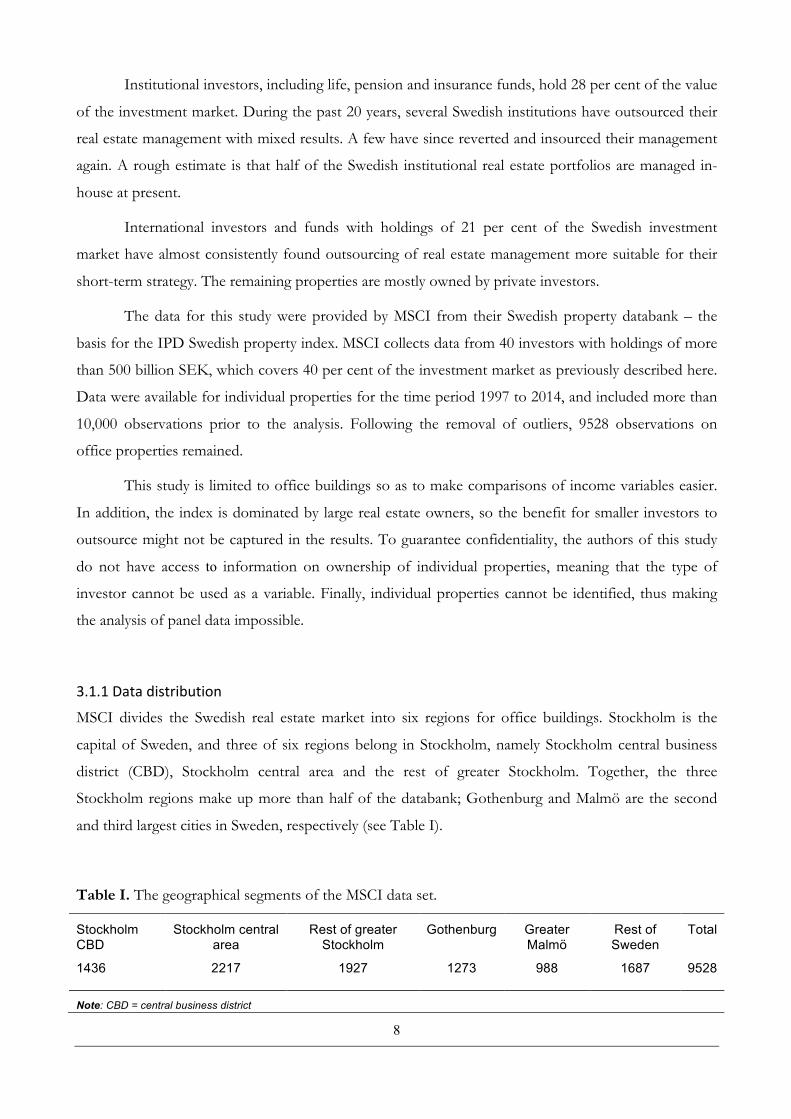
and third largest cities in Sweden, respectively (see Table I).
Table I. The geographical segments of the MSCI data set.
Stockholm CBD
Stockholm central area
Rest of greater Stockholm
Gothenburg Greater Malmö
Rest of Sweden
Total
1436 2217 1927 1273 988 1687 9528
Note: CBD = central business district
9
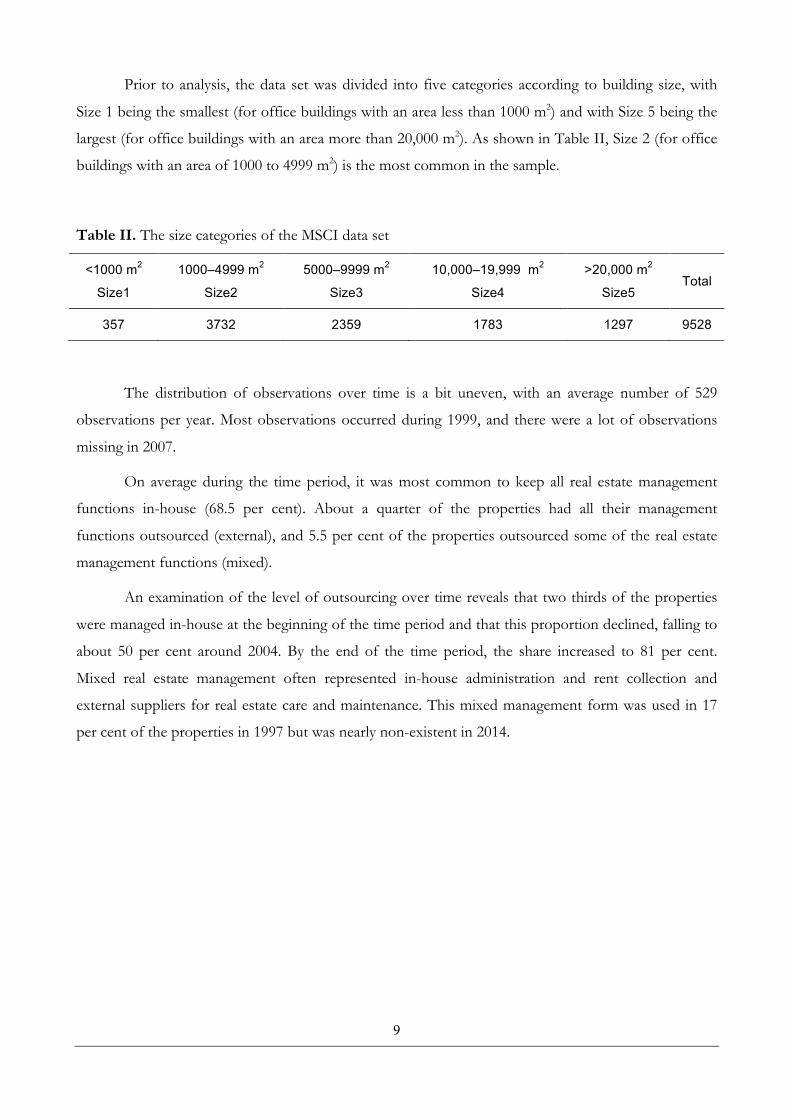
Prior to analysis, the data set was divided into five categories according to building size, with
Size 1 being the smallest (for office buildings with an area less than 1000 m2) and with Size 5 being the
largest (for office buildings with an area more than 20,000 m2). As shown in Table II, Size 2 (for office
buildings with an area of 1000 to 4999 m2) is the most common in the sample.
Table II. The size categories of the MSCI data set
<1000 m2
Size1
1000–4999 m2
Size2
5000–9999 m2
Size3
10,000–19,999 m2
Size4
>20,000 m2
Size5 Total
357 3732 2359 1783 1297 9528
The distribution of observations over time is a bit uneven, with an average number of 529
observations per year. Most observations occurred during 1999, and there were a lot of observations
missing in 2007.
On average during the time period, it was most common to keep all real estate management
functions in-house (68.5 per cent). About a quarter of the properties had all their management
functions outsourced (external), and 5.5 per cent of the properties outsourced some of the real estate
management functions (mixed).
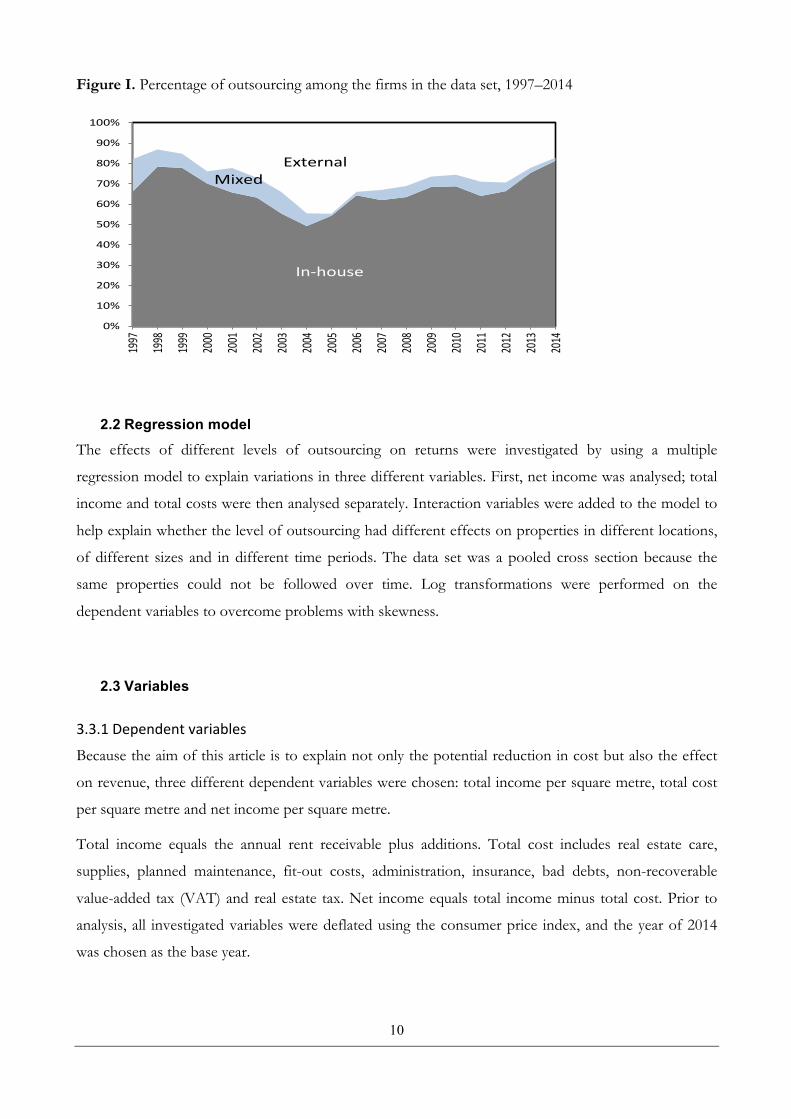
An examination of the level of outsourcing over time reveals that two thirds of the properties
were managed in-house at the beginning of the time period and that this proportion declined, falling to
about 50 per cent around 2004. By the end of the time period, the share increased to 81 per cent.
Mixed real estate management often represented in-house administration and rent collection and
external suppliers for real estate care and maintenance. This mixed management form was used in 17
per cent of the properties in 1997 but was nearly non-existent in 2014.
10
Figure I. Percentage of outsourcing among the firms in the data set, 1997–2014
2.2 Regression model The effects of different levels of outsourcing on returns were investigated by using a multiple
regression model to explain variations in three different variables. First, net income was analysed; total
income and total costs were then analysed separately. Interaction variables were added to the model to
help explain whether the level of outsourcing had different effects on properties in different locations,
of different sizes and in different time periods. The data set was a pooled cross section because the
same properties could not be followed over time. Log transformations were performed on the
dependent variables to overcome problems with skewness.
2.3 Variables 3.3.1Dependentvariables
Because the aim of this article is to explain not only the potential reduction in cost but also the effect
on revenue, three different dependent variables were chosen: total income per square metre, total cost
per square metre and net income per square metre.
Total income equals the annual rent receivable plus additions. Total cost includes real estate care,
supplies, planned maintenance, fit-out costs, administration, insurance, bad debts, non-recoverable
value-added tax (VAT) and real estate tax. Net income equals total income minus total cost. Prior to
analysis, all investigated variables were deflated using the consumer price index, and the year of 2014
was chosen as the base year.
0%
10%
20%
30%
40%
50%
60%
70%
80%
90%
100%19
97
1998
1999
2000
2001
2002
2003
2004
2005
2006
2007
2008
2009
2010
2011
2012
2013
2014
Mixed
In-house
External
11
3.3.2Independentvariables
Two dummy variables were created to measure the impact of the level of outsourcing on revenue:
mixed outsourcing (where economic functions, rental contracts and customer services are handled in-
house, and technical management is outsourced) and full outsourcing (where all real estate management
is handled by an external real estate manager). The observations where all real estate management was
kept in-house were used as base cases.
3.3.3Controlvariables
A number of control variables were chosen to control for factors other than the level of outsourcing
with a potential effect on revenue:
Business cycle: The Swedish real estate market for offices followed a cyclical pattern, with positive
capital returns for time periods 1997 to 2000, 2005 to 2007 and 2010 to 2014, and with negative capital
returns for time periods 2001 to 2004 and 2008 to 2009. Four dummy variables were created: Cycle 1,
1997 to 2000; Cycle 2, 2001 to 2004; Cycle 3, 2005 to 2007; and Cycle 4, 2008 to 2009. Observations
from years 2010 to 2014 represented the base case. As shown in Table III, with the exception of the
average total cost for Cycle 3, all three dependent variables increased over time.
Table III. Average values for the dependent variables grouped by property cycle
Average 1997–2000
Cycle1
2001–2004
Cycle2
2005–2007
Cycle3
2008–2009
Cycle4
2010–2014
Cycle5
Total income 1410 1803 2054 2110 2273
Total cost 512 626 766 699 708
Net income 876 1149 1253 1376 1531
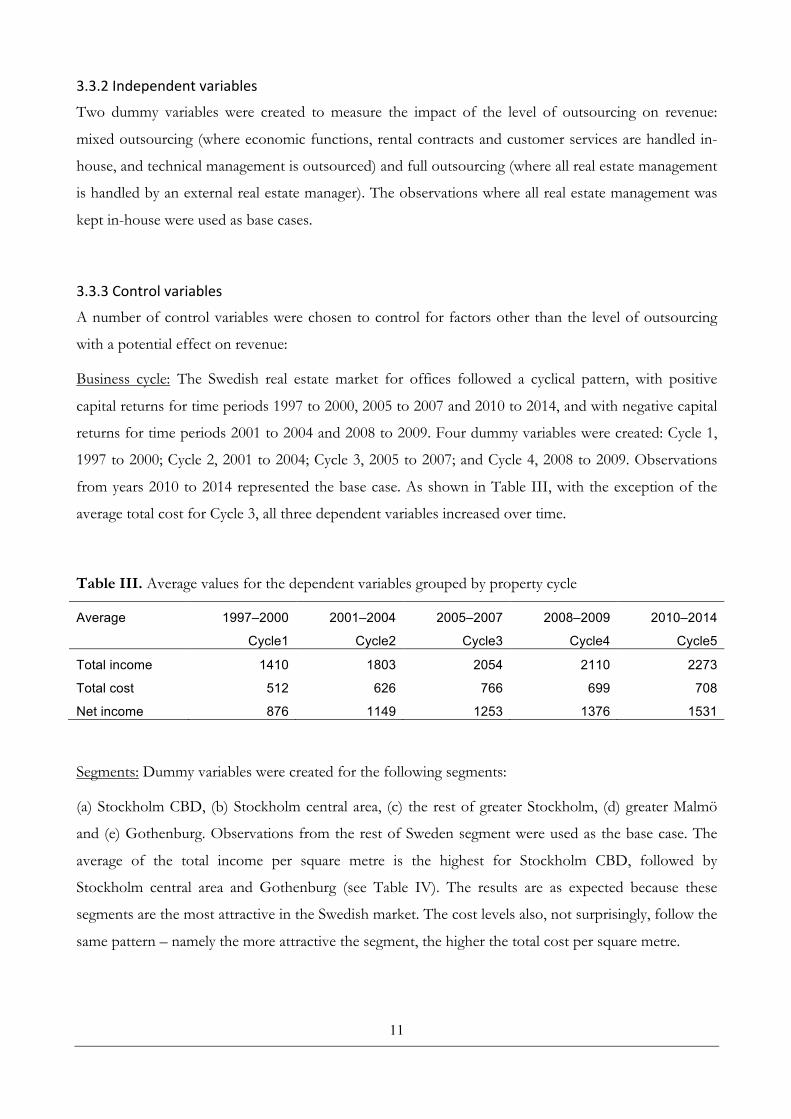
Segments: Dummy variables were created for the following segments:
(a) Stockholm CBD, (b) Stockholm central area, (c) the rest of greater Stockholm, (d) greater Malmö
and (e) Gothenburg. Observations from the rest of Sweden segment were used as the base case. The
average of the total income per square metre is the highest for Stockholm CBD, followed by
Stockholm central area and Gothenburg (see Table IV). The results are as expected because these
segments are the most attractive in the Swedish market. The cost levels also, not surprisingly, follow the
same pattern – namely the more attractive the segment, the higher the total cost per square metre.
12
Table IV. Average of dependent variables grouped by segment
Average Stockholm CBD
Stockholm central area
Rest of greater Stockholm Gothenburg Greater
Malmö Rest of
Sweden
Total income 3531 2218 1371 1484 1285 1048
Total cost 1036 734 494 557 467 452
Net income 2370 1471 852 922 814 594
Note: CBD = central business district
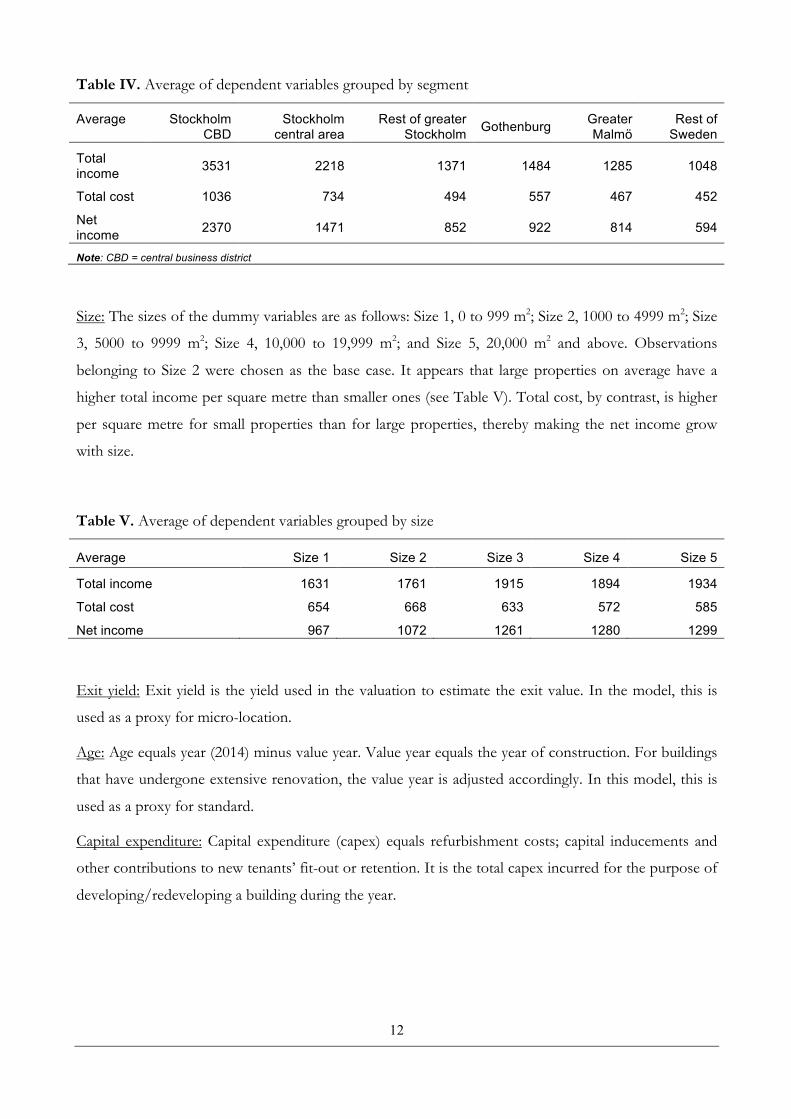
Size: The sizes of the dummy variables are as follows: Size 1, 0 to 999 m2; Size 2, 1000 to 4999 m2; Size
3, 5000 to 9999 m2; Size 4, 10,000 to 19,999 m2; and Size 5, 20,000 m2 and above. Observations
belonging to Size 2 were chosen as the base case. It appears that large properties on average have a
higher total income per square metre than smaller ones (see Table V). Total cost, by contrast, is higher
per square metre for small properties than for large properties, thereby making the net income grow
with size.
Table V. Average of dependent variables grouped by size
Average Size 1 Size 2 Size 3 Size 4 Size 5
Total income 1631 1761 1915 1894 1934
Total cost 654 668 633 572 585
Net income 967 1072 1261 1280 1299
Exit yield: Exit yield is the yield used in the valuation to estimate the exit value. In the model, this is
used as a proxy for micro-location.
Age: Age equals year (2014) minus value year. Value year equals the year of construction. For buildings
that have undergone extensive renovation, the value year is adjusted accordingly. In this model, this is
used as a proxy for standard.
Capital expenditure: Capital expenditure (capex) equals refurbishment costs; capital inducements and
other contributions to new tenants’ fit-out or retention. It is the total capex incurred for the purpose of
developing/redeveloping a building during the year.
13
2.4 Econometric analysis The analysis was conducted in three steps. The first step examines how the choice of outsourcing
influences net income. The second and third steps focus on the impact on total income and total costs,
respectively, to provide a better understanding of what drives the differences. The econometric
approach is identical in the three steps, as a gradually more elaborate model is provided. Three models
are presented for each step.
The analysis starts with a crude model that includes only the two outsourcing dummies: one
that captures if only the technical management is outsourced (mixed outsourcing) and one that captures
if all management functions are outsourced (full outsourcing). Thus, for all models and steps, the base
is the case when management is handled in-house.
The second model adds a set of control variables: five segment dummies, three dummies that
capture the size of the property, the exit yield (as a proxy for micro-location); age (as a proxy for
standard); capex, (refurbishments for the current year) and, finally, four time dummies that capture
from which property cycle the observation is gathered.
The third, and most elaborate, model adds a series of interaction variables meant to shed light
on whether the two levels of outsourcing influence different kinds of property in different ways. The
first set of interaction variables handles whether mixed outsourcing has different effects on properties
in different market segments by interacting mixed outsourcing with the five different macro-location
dummies. The second set of interaction variables does the same for the property size dummies, and the
third set of interaction variables does the same for the property cycle dummies. The same sets of
interaction variables are also included in the model to study the effects of full outsourcing.
Because the interpretation of the impact of dummy variables on the dependent variable differs
from that of continuous variables (see, for instance, Giles, 2011), an adjusted coefficient (adj β) is
calculated using the following expression: 𝑎𝑑𝑗𝛽 = 𝐸𝑥𝑝 𝛽 − 1.
3. RESULTS
The Results section is divided into three parts, with each part devoted to one of the dependent
variables. For each variable, the analysis is conducted in three steps: in the first step, the only
independent variables are the outsourcing variables; in the second step, the control variables are added;
and in the third step, the interaction variables are added to the model.
14
3.1 Outsourcing and net income The first question to address is whether the choice of outsourcing influences the net income. The
results from the three models, labelled A1, A2 and A3, respectively, are shown in Table IV. Several
interesting observations can be made from the results in Table IV. Model A1, which contains no
control variables, possesses very low explanatory power, exhibiting an adjusted R2 value of only 0.03.
Given how crude the model is, this is not surprising. Even so, it is worth noting that mixed outsourcing
is associated with a statistically significant negative impact on net income. Model A1, however, provides
no evidence for any correlation between net income and full outsourcing.
This result changes with Model A2, to which a set of control variables is added. Most of the
control variables turn out to be significant, have the right sign and are of reasonable magnitude. It is
worth noting that the capex variable has a negative sign, which is probably because an office could be
expected to be vacant during refurbishment. Interestingly, there is now no evidence for any association
between mixed outsourcing and net income. However, there is a statistically significant negative
correlation between full outsourcing and net income. Interpreting this finding should be made with
caution at this stage. It could be that outsourcing results in reduced net income, through reduced total
income, increased costs or a combination thereof. However, it could also be that real estate owners
have a greater tendency to use full outsourcing for properties that generate lower net incomes. With the
addition of control variables, the adjusted R2 value increases significantly to 0.457.
Model A3, the most interesting of the three models, contains the interaction variables. It is
important to note that the inclusion of the interaction variables changes the interpretation of both the
outsourcing dummies and those control variables that have corresponding interaction variables. The
fact that the coefficients for these variables change between Models A2 and A3 is thus not surprising.
This time, the explanatory power of the model increases only marginally, to 0.462.
The picture provided by Model A2 remains basically unchanged. In most cases, there is no
significant relationship between mixed outsourcing and net income. There are two important
exceptions. First, there is a positive relationship between mixed outsourcing and net income for the
smallest class of properties, manifested through a positive and statistically significant coefficient on
MixedSize1. Second, the opposite applies for large properties as MixedSize4 is negative and statistically
significant. A possible explanation is that economies of scale for outsourced technical management are
hard to achieve for real estate owners with a limited real estate portfolio.
For full outsourcing, a more complex pattern can be observed. Unlike for mixed outsourcing,
four of five segment variables are statistically significant and have a positive sign. The interaction
variable for Size 5 is statistically significant and has a negative sign. The effect of full outsourcing during
a period of increasing property values (Cycle 3, 2005–2007) was negative. This was somewhat
15
surprising because competition between service providers is believed to increase in an upturning
market. Thus, there are several significant relationships between outsourcing and net income. As noted,
this could be because of a correlation between outsourcing choice and total income and/or cost. The
next step is to study this in more detail, starting with total income.
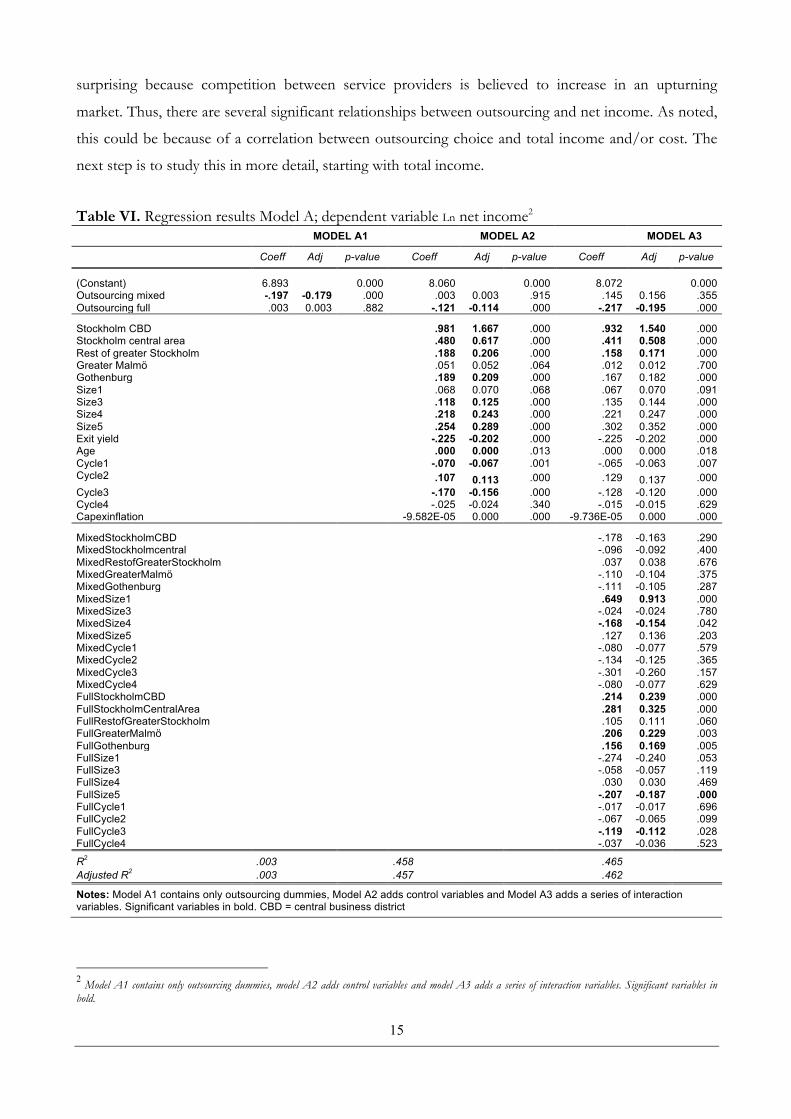
Table VI. Regression results Model A; dependent variable Ln net income2
MODEL A1 MODEL A2 MODEL A3
Coeff Adj p-value Coeff Adj p-value Coeff Adj p-value
(Constant) 6.893 0.000 8.060 0.000 8.072 0.000 Outsourcing mixed -.197 -0.179 .000 .003 0.003 .915 .145 0.156 .355 Outsourcing full .003 0.003 .882 -.121 -0.114 .000 -.217 -0.195 .000
Stockholm CBD
.981 1.667 .000 .932 1.540 .000 Stockholm central area .480 0.617 .000 .411 0.508 .000 Rest of greater Stockholm .188 0.206 .000 .158 0.171 .000 Greater Malmö .051 0.052 .064 .012 0.012 .700 Gothenburg .189 0.209 .000 .167 0.182 .000 Size1 .068 0.070 .068 .067 0.070 .091 Size3 .118 0.125 .000 .135 0.144 .000 Size4 .218 0.243 .000 .221 0.247 .000 Size5 .254 0.289 .000 .302 0.352 .000 Exit yield -.225 -0.202 .000 -.225 -0.202 .000 Age .000 0.000 .013 .000 0.000 .018 Cycle1 -.070 -0.067 .001 -.065 -0.063 .007 Cycle2
.107 0.113 .000 .129 0.137 .000 Cycle3 -.170 -0.156 .000 -.128 -0.120 .000 Cycle4 -.025 -0.024 .340 -.015 -0.015 .629 Capexinflation -9.582E-05 0.000 .000 -9.736E-05 0.000 .000
MixedStockholmCBD
-.178 -0.163 .290 MixedStockholmcentral -.096 -0.092 .400 MixedRestofGreaterStockholm .037 0.038 .676 MixedGreaterMalmö -.110 -0.104 .375 MixedGothenburg -.111 -0.105 .287 MixedSize1 .649 0.913 .000 MixedSize3 -.024 -0.024 .780 MixedSize4 -.168 -0.154 .042 MixedSize5 .127 0.136 .203 MixedCycle1 -.080 -0.077 .579 MixedCycle2 -.134 -0.125 .365 MixedCycle3 -.301 -0.260 .157 MixedCycle4 -.080 -0.077 .629 FullStockholmCBD .214 0.239 .000 FullStockholmCentralArea .281 0.325 .000 FullRestofGreaterStockholm .105 0.111 .060 FullGreaterMalmö .206 0.229 .003 FullGothenburg .156 0.169 .005 FullSize1 -.274 -0.240 .053 FullSize3 -.058 -0.057 .119 FullSize4 .030 0.030 .469 FullSize5 -.207 -0.187 .000 FullCycle1 -.017 -0.017 .696 FullCycle2 -.067 -0.065 .099 FullCycle3 -.119 -0.112 .028 FullCycle4 -.037 -0.036 .523
R2 .003 .458 .465 Adjusted R2 .003 .457 .462
Notes: Model A1 contains only outsourcing dummies, Model A2 adds control variables and Model A3 adds a series of interaction variables. Significant variables in bold. CBD = central business district
2 Model A1 contains only outsourcing dummies, model A2 adds control variables and model A3 adds a series of interaction variables. Significant variables in bold.

16
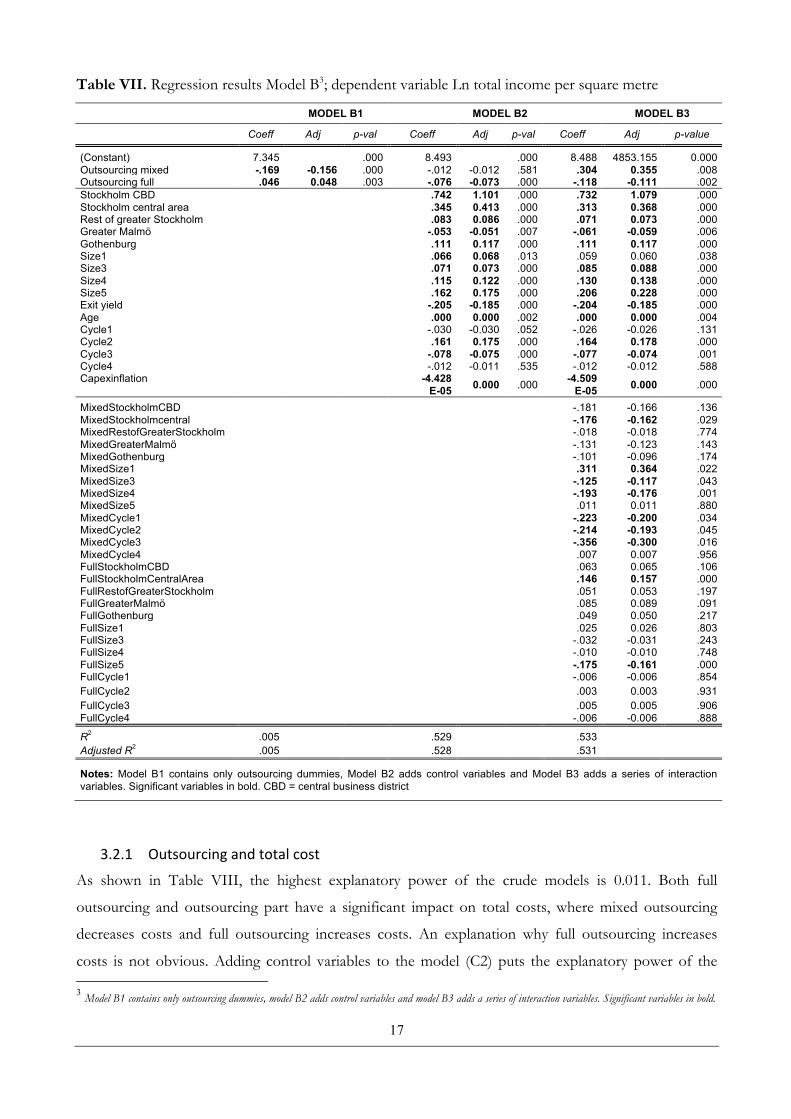
3.2 Outsourcing and total income Table VII exhibits the results of the regression where total income is the dependent variable, and some
differences can be observed from when net income was explained. Model B1 still has very low
explanatory power, but the adjusted R2 value of 0.05 is higher than that for Model A1. Mixed
outsourcing is still significant and has a negative impact; however, this time, a significant effect from
full outsourcing can be observed, although positive.
With the addition of control variables, the explanatory power of Model B1 increases to an R2
value of 0.528. With the exception of Cycle 1 and Cycle 4, all control variables are significant and have
the expected sign. No significant correlation between mixed outsourcing and total income can now be
seen.
A slight increase in the R2 value to 0.531 can be seen in Model B3. Adding the interaction
variables has the effect that both mixed and full outsourcing are now statistically significant but with
opposite signs from Model B1.
For mixed outsourcing, more significant variables are found than when explaining net income.
For smaller objects (Size 1) the impact of mixed outsourcing is positive, but the opposite holds for
larger objects (Sizes 3 and 4). For earlier time periods in the sample (Cycles 1–3), the effect of mixed
outsourcing on total income is negative. Why mixed outsourcing (outsourcing of technical
management only) has a significant impact on income variables is not intuitively clear, but it could be
either because tenants satisfied with technical management stay longer or because the outsourcing of
technical management allows the outsourcing firm to focus on other aspects of tenant relations,
thereby increasing total income.
For full outsourcing, a positive effect from outsourcing in Stockholm central area can be seen
together with a negative effect for the largest size category.
17
Table VII. Regression results Model B3; dependent variable Ln total income per square metre
MODEL B1 MODEL B2 MODEL B3
Coeff Adj p-val Coeff Adj p-val Coeff Adj p-value
(Constant) 7.345 .000 8.493 .000 8.488 4853.155 0.000 Outsourcing mixed -.169 -0.156 .000 -.012 -0.012 .581 .304 0.355 .008 Outsourcing full .046 0.048 .003 -.076 -0.073 .000 -.118 -0.111 .002 Stockholm CBD .742 1.101 .000 .732 1.079 .000 Stockholm central area .345 0.413 .000 .313 0.368 .000 Rest of greater Stockholm .083 0.086 .000 .071 0.073 .000 Greater Malmö -.053 -0.051 .007 -.061 -0.059 .006 Gothenburg .111 0.117 .000 .111 0.117 .000 Size1 .066 0.068 .013 .059 0.060 .038 Size3 .071 0.073 .000 .085 0.088 .000 Size4 .115 0.122 .000 .130 0.138 .000 Size5 .162 0.175 .000 .206 0.228 .000 Exit yield -.205 -0.185 .000 -.204 -0.185 .000 Age .000 0.000 .002 .000 0.000 .004 Cycle1 -.030 -0.030 .052 -.026 -0.026 .131 Cycle2 .161 0.175 .000 .164 0.178 .000 Cycle3 -.078 -0.075 .000 -.077 -0.074 .001 Cycle4 -.012 -0.011 .535 -.012 -0.012 .588 Capexinflation -4.428
E-05 0.000 .000 -4.509 E-05 0.000 .000
MixedStockholmCBD
-.181 -0.166 .136 MixedStockholmcentral -.176 -0.162 .029 MixedRestofGreaterStockholm -.018 -0.018 .774 MixedGreaterMalmö -.131 -0.123 .143 MixedGothenburg -.101 -0.096 .174 MixedSize1 .311 0.364 .022 MixedSize3 -.125 -0.117 .043 MixedSize4 -.193 -0.176 .001 MixedSize5 .011 0.011 .880 MixedCycle1 -.223 -0.200 .034 MixedCycle2 -.214 -0.193 .045 MixedCycle3 -.356 -0.300 .016 MixedCycle4 .007 0.007 .956 FullStockholmCBD .063 0.065 .106 FullStockholmCentralArea .146 0.157 .000 FullRestofGreaterStockholm .051 0.053 .197 FullGreaterMalmö .085 0.089 .091 FullGothenburg .049 0.050 .217 FullSize1 .025 0.026 .803 FullSize3 -.032 -0.031 .243 FullSize4 -.010 -0.010 .748 FullSize5 -.175 -0.161 .000 FullCycle1 -.006 -0.006 .854 FullCycle2
.003 0.003 .931
FullCycle3 .005 0.005 .906 FullCycle4 -.006 -0.006 .888
R2 .005 .529 .533 Adjusted R2 .005 .528 .531
Notes: Model B1 contains only outsourcing dummies, Model B2 adds control variables and Model B3 adds a series of interaction variables. Significant variables in bold. CBD = central business district
3.2.1 Outsourcingandtotalcost
As shown in Table VIII, the highest explanatory power of the crude models is 0.011. Both full
outsourcing and outsourcing part have a significant impact on total costs, where mixed outsourcing
decreases costs and full outsourcing increases costs. An explanation why full outsourcing increases
costs is not obvious. Adding control variables to the model (C2) puts the explanatory power of the 3 Model B1 contains only outsourcing dummies, model B2 adds control variables and model B3 adds a series of interaction variables. Significant variables in bold.

18
model on par with the model explaining net income. A pronounced decrease in the number of
significant variables can now be seen. This could be expected as costs are most likely not as dependent
on some of the attributes (e.g. segments) as total income. Neither outsourcing part nor full outsourcing
is significant in this model.
A slight increase in the R2 value to 0.432 can be seen in Model C3. Mixed outsourcing and full
outsourcing are still not significant.
For mixed outsourcing, the costs are higher for offices in the rest of greater Stockholm and
lower for the smallest size category and for Cycle 2. That properties with outsourced technical
management have higher costs compared with in-house management for offices in greater Stockholm
could be because of a lack of competition between service providers in the peripheral parts of
Stockholm. The gains from outsourcing technical management for small properties compared with in-
house management could be because of economies of scale.
For full outsourcing, the costs are higher for offices in Stockholm CBD. In contrast to mixed
outsourcing, the costs are higher for the smallest properties. For the two largest groups and Cycle 1,
costs are lower for full outsourcing.
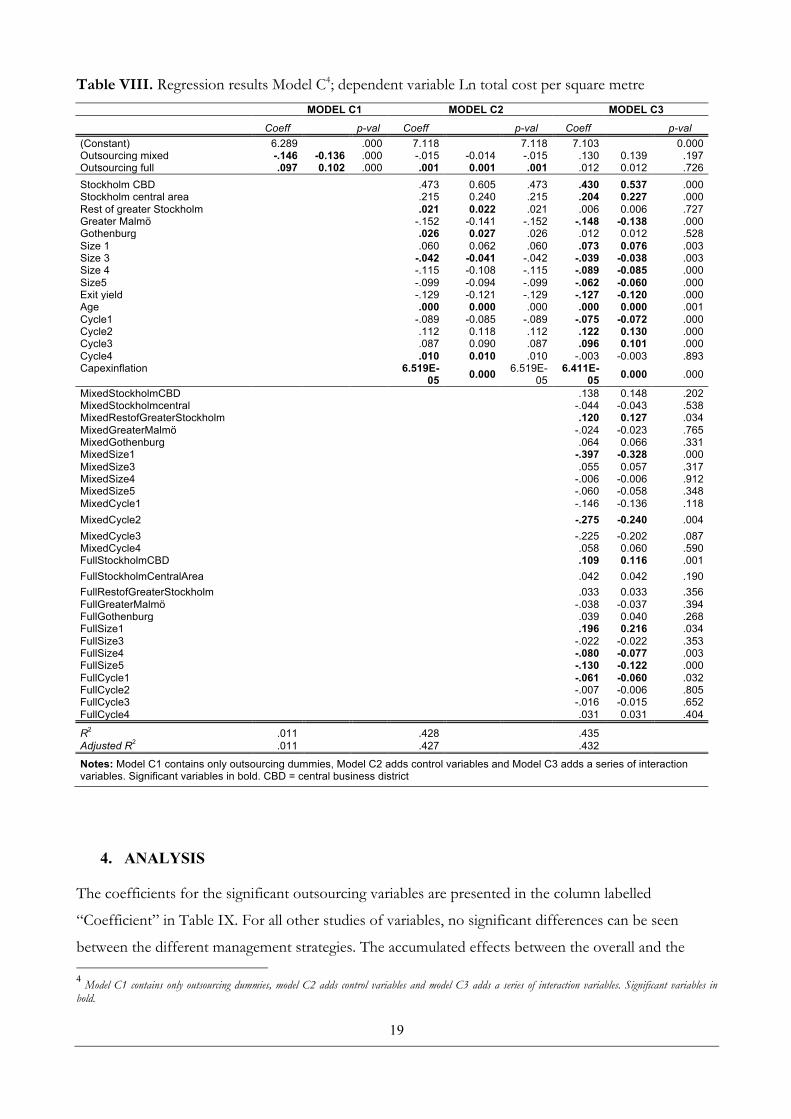
19
Table VIII. Regression results Model C4; dependent variable Ln total cost per square metre MODEL C1 MODEL C2 MODEL C3
Coeff p-val Coeff p-val Coeff p-val
(Constant) 6.289 .000 7.118 7.118 7.103 0.000 Outsourcing mixed -.146 -0.136 .000 -.015 -0.014 -.015 .130 0.139 .197 Outsourcing full .097 0.102 .000 .001 0.001 .001 .012 0.012 .726 Stockholm CBD
.473 0.605 .473 .430 0.537 .000
Stockholm central area .215 0.240 .215 .204 0.227 .000 Rest of greater Stockholm .021 0.022 .021 .006 0.006 .727 Greater Malmö -.152 -0.141 -.152 -.148 -0.138 .000 Gothenburg .026 0.027 .026 .012 0.012 .528 Size 1 .060 0.062 .060 .073 0.076 .003 Size 3 -.042 -0.041 -.042 -.039 -0.038 .003 Size 4 -.115 -0.108 -.115 -.089 -0.085 .000 Size5 -.099 -0.094 -.099 -.062 -0.060 .000 Exit yield -.129 -0.121 -.129 -.127 -0.120 .000 Age .000 0.000 .000 .000 0.000 .001 Cycle1 -.089 -0.085 -.089 -.075 -0.072 .000 Cycle2 .112 0.118 .112 .122 0.130 .000 Cycle3 .087 0.090 .087 .096 0.101 .000 Cycle4 .010 0.010 .010 -.003 -0.003 .893 Capexinflation 6.519E-
05 0.000 6.519E-05
6.411E-05 0.000 .000
MixedStockholmCBD .138 0.148 .202 MixedStockholmcentral -.044 -0.043 .538 MixedRestofGreaterStockholm .120 0.127 .034 MixedGreaterMalmö -.024 -0.023 .765 MixedGothenburg .064 0.066 .331 MixedSize1 -.397 -0.328 .000 MixedSize3 .055 0.057 .317 MixedSize4 -.006 -0.006 .912 MixedSize5 -.060 -0.058 .348 MixedCycle1 -.146 -0.136 .118 MixedCycle2
-.275 -0.240 .004
MixedCycle3 -.225 -0.202 .087 MixedCycle4 .058 0.060 .590 FullStockholmCBD .109 0.116 .001 FullStockholmCentralArea
.042 0.042 .190
FullRestofGreaterStockholm .033 0.033 .356 FullGreaterMalmö -.038 -0.037 .394 FullGothenburg .039 0.040 .268 FullSize1 .196 0.216 .034 FullSize3 -.022 -0.022 .353 FullSize4 -.080 -0.077 .003 FullSize5 -.130 -0.122 .000 FullCycle1 -.061 -0.060 .032 FullCycle2 -.007 -0.006 .805 FullCycle3 -.016 -0.015 .652 FullCycle4 .031 0.031 .404
R2 .011 .428 .435 Adjusted R2 .011 .427 .432
Notes: Model C1 contains only outsourcing dummies, Model C2 adds control variables and Model C3 adds a series of interaction variables. Significant variables in bold. CBD = central business district
4. ANALYSIS
The coefficients for the significant outsourcing variables are presented in the column labelled
“Coefficient” in Table IX. For all other studies of variables, no significant differences can be seen
between the different management strategies. The accumulated effects between the overall and the 4 Model C1 contains only outsourcing dummies, model C2 adds control variables and model C3 adds a series of interaction variables. Significant variables in bold.
20
interaction effects are presented in the column labelled “Accumulated coefficient” in Table IX. No
overall effects are detected for Model A mixed outsourcing and for Model C mixed outsourcing and
full outsourcing, so no accumulated coefficient is presented.
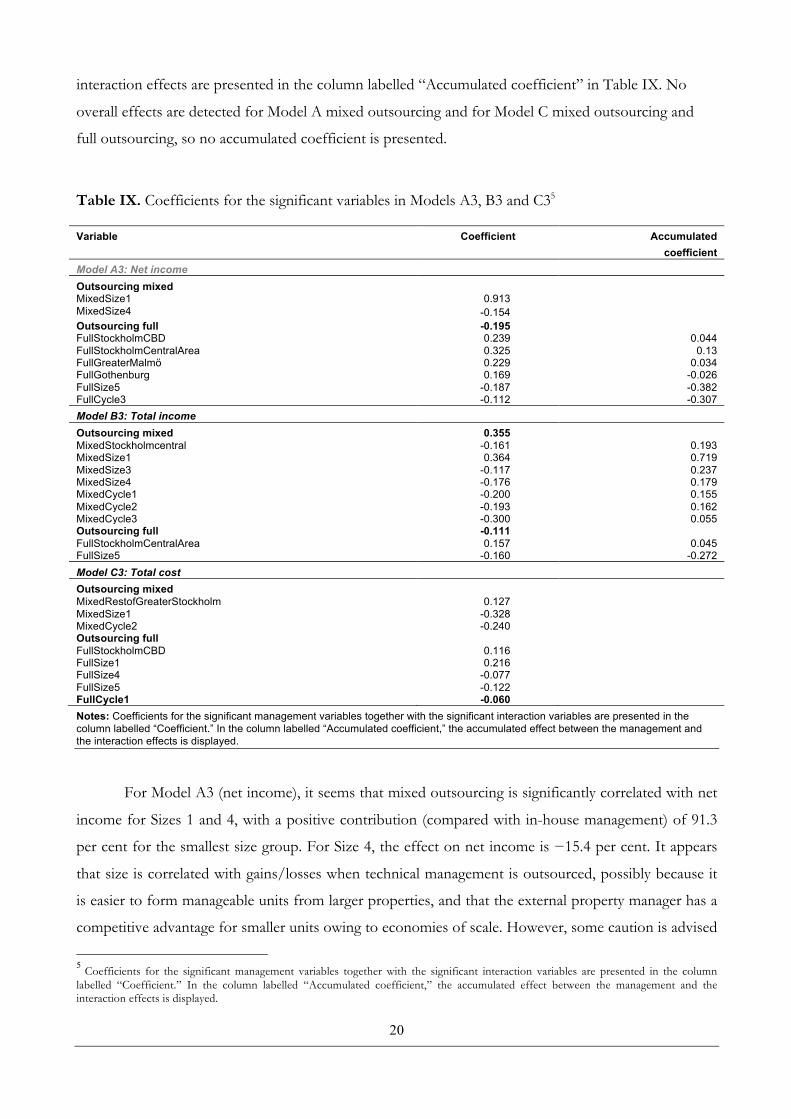
Table IX. Coefficients for the significant variables in Models A3, B3 and C35
Notes: Coefficients for the significant management variables together with the significant interaction variables are presented in the column labelled “Coefficient.” In the column labelled “Accumulated coefficient,” the accumulated effect between the management and the interaction effects is displayed.
For Model A3 (net income), it seems that mixed outsourcing is significantly correlated with net
income for Sizes 1 and 4, with a positive contribution (compared with in-house management) of 91.3
per cent for the smallest size group. For Size 4, the effect on net income is −15.4 per cent. It appears
that size is correlated with gains/losses when technical management is outsourced, possibly because it
is easier to form manageable units from larger properties, and that the external property manager has a
competitive advantage for smaller units owing to economies of scale. However, some caution is advised
5 Coefficients for the significant management variables together with the significant interaction variables are presented in the column labelled “Coefficient.” In the column labelled “Accumulated coefficient,” the accumulated effect between the management and the interaction effects is displayed.
Variable Coefficient Accumulated coefficient
Model A3: Net income Outsourcing mixed MixedSize1 0.913 MixedSize4 -0.154 Outsourcing full -0.195 FullStockholmCBD 0.239 0.044 FullStockholmCentralArea 0.325 0.13 FullGreaterMalmö 0.229 0.034 FullGothenburg 0.169 -0.026 FullSize5 -0.187 -0.382 FullCycle3 -0.112 -0.307 Model B3: Total income Outsourcing mixed 0.355 MixedStockholmcentral -0.161 0.193 MixedSize1 0.364 0.719 MixedSize3 -0.117 0.237 MixedSize4 -0.176 0.179 MixedCycle1 -0.200 0.155 MixedCycle2 -0.193 0.162 MixedCycle3 -0.300 0.055 Outsourcing full -0.111 FullStockholmCentralArea 0.157 0.045 FullSize5 -0.160 -0.272 Model C3: Total cost Outsourcing mixed MixedRestofGreaterStockholm 0.127 MixedSize1 -0.328 MixedCycle2 -0.240 Outsourcing full FullStockholmCBD 0.116 FullSize1 0.216 FullSize4 -0.077 FullSize5 -0.122 FullCycle1 -0.060
21
when examining the large gains for the smallest group. Because it constitutes only 3 per cent of the
sample, there is potential bias in Size 1 compared with the other size groups.
For full outsourcing, the two most attractive segments in the sample, Stockholm CBD and
Stockholm central area, have an accumulated positive effect on net income. This is also true for Malmö,
although the effect is smaller. A possible explanation is that more attractive real estate markets have a
large number of competitors in the property management sector, leading to an increase in quality and a
decrease in costs when property management services in these segments are outsourced.
For Model B3 (total income), the accumulated coefficients for mixed outsourcing are positive
for Stockholm central area; for Sizes 1, 3 and 4; and for Cycles 1 to 3. For full outsourcing, only
properties in Stockholm central area show a positive effect from outsourcing, and the total income is
4.5 per cent higher than for the base case. It appears that the outsourcing of technical management has
a positive effect on total income for some properties but that the outsourcing of managerial
management as well somehow cancels out the positive effect of mixed outsourcing on total income.
Finally, for Model C3 (total cost), it seems that mixed outsourcing for the smallest size category
(Size 1) reduces costs and that the same is true for Cycle 2 (2001–2004). Mixed outsourcing in the rest
of greater Stockholm increases costs, however. That the outsourcing of technical management has the
potential to reduce costs for small properties is as could be expected because property management
companies in theory could manage small properties more efficiently because of economies of scale.
Because Cycle 2 was a time period of negative capital return in the Swedish real estate market, a
possible explanation for the decreased cost when outsourcing technical management could be that
more competition exists between suppliers of management services in a market with less transaction
activity. Full outsourcing decreases costs for Sizes 4 and 5 and for Cycle 1. For Stockholm CBD and
Size 1, full outsourcing increases total costs. That the outsourcing of all property management
functions affects total costs in different ways for different types of properties is apparent from the data,
but the cause effect is unclear.
5. CONCLUSIONS
The potential benefits of outsourcing real estate management functions at the property level are access
to specialised competence and technology, with the potential to increase income (rents) and decrease
costs. A productivity efficiency effect can also be expected because of market competition in property
management services, and the effect is expected to vary for different segments and during different
phases of the property cycle. Finally, because of economies of scale, property management companies
should be able to manage smaller units more efficiently than property companies.
22
It appears that outsourcing for large institutional investors and real estate companies where
ownership of commercial real estate is the core business has limited power to increase net income and
reduce costs at the property level. Outsourcing technical management has a large positive effect on net
income for the smallest size category; however, because of the relatively small sample size of the
smallest size category, the results should be interpreted with caution. For full outsourcing, a positive
effect on net income can be seen in the most attractive segments, Stockholm CBD and Stockholm
central area. This could be because of high competition in the market for property management
services, thereby increasing quality and reducing costs compared with in-house management. For total
income, outsourcing technical management separately seems to increase the total income for
Stockholm central area and for several of the size groups and cycles. How technical management
affects income variables is not clear, but a possible explanation could be that tenants satisfied with
technical management stay longer, thereby reducing vacancies. Another possible explanation is that the
outsourcing of technical management allows the outsourcing firm to focus on managerial management.
For full outsourcing, the gains on total income are limited, and a positive effect can be detected in only
Stockholm central area. The discrepancy between mixed and full outsourcing in this case might indicate
that outsourcing managerial management has a negative effect on rental income.
The outsourcing of technical management reduces costs for the smallest size category, as well
as for the time period between 2001 and 2004, but increases costs for the rest of greater Stockholm.
Full outsourcing decreases costs for Sizes 4 and 5 and for Cycle 1. For Stockholm CBD and Size 1, full
outsourcing increases total costs. It seems that the outsourcing of all property management functions
affects total costs in different ways for different types of properties, but the cause effect is unclear. It
could be that when all the property management functions are managed under the same roof, greater
focus is on increasing income than on controlling costs. The strategies employed to increase income
also raise costs.
In theory, the outsourcing of technical management in the real estate sector should be
successful because of the potential access to cutting-edge knowledge. For the most part, the results in
this study contradict the preceding statement, which might indicate that because of their size, the
investors under study (large institutional investors and real estate companies) already have access to
specialised internal competence. However, this matter needs to be studied further. Two results that
appear contra-intuitive are how outsourcing of technical management can result in increased total
income and how outsourcing of managerial management functions affects total costs. Part of the
answer might lie in how the contracts between property owners and property managers are written and
whether the incentives are for increasing income or controlling costs.

23
Although results from the outsourcing of managerial management cannot be measured
separately, the results from full outsourcing versus mixed outsourcing could indicate a negative effect
from the outsourcing of managerial functions on total income. One could argue that the real estate
management functions affecting customer loyalty should be considered core business functions for
commercial real estate investors with a long investment horizon. More studies are needed on tenant
satisfaction in the commercial real estate market to determine where customer value is created.
24
REFERENCES
Appel-Meulenbroek, R. (2008), “Managing ‘keep’ factors of office tenants to raise satisfaction and loyalty”, Property Management, Vol. 26 No. 1, pp. 43-55.
Bartelink, R., Appel-Meulenbroek, R., van den Berg, P. and Gehner, E. (2015), “Corporate real estate risks: a survey on risk perception amongst corporate real estate practitioners”, Journal of Corporate Real Estate, Vol. 17 No. 4, pp. 301-322.
Black, R.T. and Gibler, K.M. (2004), “Agency risks in outsourcing corporate real estate functions”, Journal of Real Estate Research, Vol. 26 No. 2, pp. 137-160.
Brambor, T., Clark, W.R. and Golder, M. (2006), “Understanding interaction models: improving empirical analyses”, Political Analysis, Vol. 14 No. 1, pp. 63-82.
Coase, R.H. (1937), “The nature of the firm”, Economica, Vol. 4 No. 16, pp. 386-405.
Damodaran, A., John, K. and Liu, C.H. (1997), “The determinants of organizational form changes: evidence and implications from real estate”, Journal of Financial Economics, Vol. 45 no. 2, pp. 169-192.
Farncombe, M. and Waller, A. (2005), “Outsourcing for corporate real estate managers: how can real estate learn lessons from other industries?”, Journal of Corporate Real Estate, Vol. 7 No. 3, pp. 258-270.
Freybote, J. and Gibler, K.M. (2011), “Trust in corporate real estate management outsourcing relationships”, Journal of Property Research, Vol. 28 No. 4, pp. 341-360.
Gibler, K. and Black, R. (2009), “Agency risks in outsourcing corporate real estate functions”, Journal of Real Estate Research.
Giles, D.E. (2011), “Interpreting dummy variables in semi-logarithmic regression models: exact distributional results”, working paper EWP 1101, Department of Economics, University of Victoria, Victoria, British Columbia, Canada, January.
Greco, J. (1997), “Outsourcing: the new partnership”, Journal of Business Strategy, Vol. 18 No. 4, pp. 48-54.
Grover, V., Jeong, S.R., Kettinger, W.J. and Teng, J.T.C. (1995), “The implementation of business process reengineering”, Journal of Management Information Systems, Vol. 12 No.1, pp. 109-144.
Hamel, G. and Prahalad, C.K. (1991), “Corporate imagination and expeditionary marketing”, Harvard Business Review, Vol. 69 July-August, pp. 81-92.
Hart, O.D. (1988), “Incomplete contracts and the theory of the firm”, Journal of Law, Economics, & Organization, Vol 4 No. 1, pp 119-139.
Hilletofth, P. and Hilmola, O.-P. (2010), “Role of logistics outsourcing on supply chain strategy and management: survey findings from Northern Europe”, Strategic Outsourcing: An International Journal, Vol. 3 No. 1, pp. 46-61.
Holcomb, T.R. and Hitt, M.A. (2007), “Toward a model of strategic outsourcing”, Journal of Operations Management, Vol. 25 No. 2, pp. 464-481.
25
Jain, R.K. and Natarajan, R. (2011), “Factors influencing the outsourcing decisions: a study of the banking sector in India”, Strategic Outsourcing: An International Journal, Vol. 4 No. 3, pp. 294-322.
Jensen, M.C. and Meckling, W.H. (1976), “Theory of the firm: managerial behavior, agency costs and ownership structure”, Journal of Financial Economics, Vol. 3 No. 4, pp. 305-360.
Kimbler, L.B. and Rutherford, R.C. (1993), “Corporate real estate outsourcing: a survey of the issues”, Journal of Real Estate Research, Vol. 8 No. 4, pp. 525-540.
Knowles, G. (2004), “A case study for in-house real estate services”, Journal of Corporate Real Estate, Vol. 6 No. 4, pp. 325-334.
Kolawole, I.O. and Agha, E.A. (2015), “Achieving organizational performance through business process outsourcing”, European Scientific Journal, Vol. 11 No. 4, pp. 457-473.
Kotabe, M., Mol, M.J., Murray, J.Y. and Parente, R. (2012), “Outsourcing and its implications for market success: negative curvilinearity, firm resources, and competition”, Journal of the Academy of Marketing Science, Vol. 40 No. 2, pp. 329-346.
Kremic, T., Tukel, O.I. and Rom, W.O. (2006), “Outsourcing decision support: a survey of benefits, risks, and decision factors”, Supply Chain Management: An International Journal, Vol. 11 No. 6, pp. 467-482.
Krumm, P.J.M.M. and de Vries, J. (2003), “Value creation through the management of corporate real estate”, Journal of Property Investment & Finance, Vol. 21 No. 1, pp. 61-72.
Lam, T.Y.M. (2012), “Economic perspective on outsourcing of property management services”, Property Management, Vol. 30 No. 4, pp. 318-332.
Lind, H. (2015), “Vertical integration in the real estate sector: three case studies”, working paper, Department of Real Estate and Construction Management, The Royal Institute of Technology, Stockholm, date.
Lind, H. and Lundström, S. (2009), Kommersiella fastigheter i samhällsbyggandet [Commercial real estate in the built environment], SNS Förlag, Stockholm, Sweden.
Lonsdale, C. and Cox, A. (2000), “The historical development of outsourcing: the latest fad?”, Industrial Management & Data Systems, Vol. 100 No. 9, pp. 444-450.
Manning, C.A., Rodriguez, M. and Roulac, S.E. (1997), “Which corporate real estate management functions should be outsourced?”, Journal of Real Estate Research, Vol. 14 No. 3, pp. 259-274.
Matsham, A. and Heywood, C. (2012), “An investigation of corporate real estate management outsourcing in Melbourne”, paper presented at The 18th Annual Pacific-Rim Real Estate Society Conference, date, Adelaide, Australia.
McCarty, T.D., Hunt, R. and Truhan, J.E. (2006), “Transforming CRE value through relationship management”, Journal of Corporate Real Estate, Vol. 8 No. 1, pp. 4-18.
McDonagh, J. and Hayward, T. (2000), “Outsourcing corporate real estate asset management in New Zealand”, Journal of Corporate Real Estate, Vol. 2 No. 4, pp. 351-371.
Oyedokun, T.B., Oletubo, A. and Adewusi, A.O. (2014), “Satisfaction of occupiers with management of rented commercial properties in Nigeria: an empirical study”, Property Management, Vol. 32 No. 4, pp. 284-294.
26
Palm, P. (2011), “Customer orientation in real-estate companies: the espoused values of customer relations”, Property Management, Vol. 29 No. 2, pp. 130-145.
Palm, P. (2013), “Strategies in real estate management: two strategic pathways”, Property Management, Vol. 31 No. 4, pp. 311-325.
Palm, P. (2015), Challenges of commercial real estate management, Doctoral Dissertation, The Royal Institute of Technology, Stockholm, Sweden.
Peteraf, M.A. (1993), “The cornerstones of competitive advantage: a resource-based view”, Strategic Management Journal, Vol. 14 No. 3, pp. 179-191.
Pichler, F.B. and Turner, S.J. (2007), “The power and pitfalls of outsourcing”, Nature Biotechnology, Vol. 25 No. 10, pp. 1093-1096.
Quinn, J.B. (1999), “Strategic outsourcing: leveraging knowledge capabilities”, Sloan Management Review, Vol. 40 No. 4, pp. 9-21.
Quinn, J.B., Anderson, P. and Finkelstein, S. (1996), “Making the most from the best”, Harvard Business Review, Vol. 74 March-April, pp. 71-80.
Rasila, M.H. and Gersberg, N.F. (2007), “Service quality in outsourced facility maintenance services”, Journal of Corporate Real Estate, Vol. 9 No. 1, pp. 39-49.
Reichheld, F.F. and Teal, T. (2001), The Loyalty Effect: The Hidden Force behind Growth, Profits, and Lasting Value, Harvard Business Press, Place of publication.
Sharp, D. (2013), “Risks ahead: the transformation of the corporate real estate function”, Journal of Corporate Real Estate, Vol. 15 No. 3/4, pp. 231-243.
Sinha, P., Akoorie, M.E.M., Ding, Q. and Wu, Q. (2011), “What motivates manufacturing SMEs to outsource offshore in China?: Comparing the perspectives of SME manufacturers and their suppliers”, Strategic Outsourcing: An International Journal, Vol. 4 No. 1, pp. 67–88.
Stoy, C. and Kytzia, S. (2004), “Strategies of corporate real estate management: strategic dimensions and participants”, Journal of Corporate Real Estate, Vol. 6 No. 4, pp. 353-370.
Tas, J. and Sunder, S. (2004), “Financial services business process outsourcing”, Communications of the ACM, Vol. 47 No. 5, pp. 50-52.
Thompson, J.D. (1967), Organizations in Action: Social Science Bases of Administrative Theory, Transaction, New York, NY.
Timm, R. (2009), “The trouble with outsourcing”, Property Australia, Vol. 24 No. 3, pp. 33-34.
Williamson, O.E. (1985), The Economic Institutions of Capitalism, Simon and Schuster, New York, NY.
Wilson, C., Leckman, J., Cappucino, K. and Pullen, W. (2001), “Towards customer delight: added value in public sector corporate real estate”, Journal of Corporate Real Estate, Vol. 3 No. 3, pp. 215-221.
Yakhlef, A. (2009) “Outsourcing as a mode of organizational learning”, Strategic Outsourcing: An International Journal, Vol. 2 No. 1, pp. 37-53.