Embed Size (px)
Citation preview

Will Market Competition Trump Gender Discrimination in India?
Ejaz Ghani, Arti Grover Goswami, Sari Kerr, and William Kerr
June 2016
Abstract: Empowering women to engage in productive employment is not only critical to achieving gender equality but also critical for economic growth and poverty reduction. This paper studies the pattern of female activity and gender segmentation in the Indian manufacturing and services sectors. Although the share of women entrepreneurs and employees is larger in manufacturing than in services, segmentation based on gender is pervasive in both sectors. Theory, dating back to Gary Becker, suggests that competitive reforms should reduce the extent of this segregation. In spite of competition-inducing reforms such as investment in Golden Quadrilateral (GQ) highways, trade liberalization and domestic reforms that India undertook since the turn of the century, this pattern of gender based segmentation has not subsided over the years. Specifically, investments in GQ upgrades are found to have null effects on female activity and gender segmentation. Although there is some evidence of a negative correlation between segmentation among male employees and industry level trade liberalization reforms, overall it had a very limited impact on female participation in labor force and in reducing segmentation among female employees. Finally, domestic reforms that dismantled product reservations for small-scale industries induced greater participation among women in economic activity and are correlated with a modest decline in segmentation among male employees. Segregation among female employees is positively associated with these reforms.
JEL Classification: J16; F13, F14, F16, J7, J21, O12, O25, O38, O53
Keywords: Trade liberalization, India, De-reservation, Manufacturing, Services, Segmentation, Discrimination, Competition, Gender inequality, Female labor force participation
Acknowledgments: We thank Alexis Brownell for excellent research assistance. We also thank Petia Topalova and Ishani Tewari for respectively sharing their trade policy and domestic policy data with us. The views expressed here are those of the authors and not of any institution they may be associated with.

1
I. Introduction
It is widely established that women earn less and have lower access to economic opportunities. For instance, women are more likely than men to engage in lower productivity activities, work as unpaid family members, work in the informal sector, and move in and out of the workforce. Since the 1990s, female labor force participation has stagnated globally at around 55%. Most employed women are half as likely to be working full-time, relative to employed men. And when women participate in workforce, they earn 10-30% less than men (World Bank, 2011, 2014, 2016). These gaps are starker in developing countries like India or those in the Middle East but nonetheless are also present in the most advanced nations such as Sweden.1 Gender discrimination in India, in terms of deprivation of economic opportunities, education or even basic health services, continues amidst the recent modernization of its economy. For example, the World Economic Forum’s (WEF) Gender gap report (2015) ranks India at 108th position out of a sample of 145 countries. Although political quotas for women in India have significantly improved their participation in political affairs, nonetheless, these developments are not matched in economic and business spheres where India ranks among the lowest 15 countries in the WEF’s indices on economic participation and opportunity, educational attainment and health and survival.2 Female participation in the labor force, although rising, is only 29%, as compared to 83% for men. This figure is very low compared to its peers and neighbors such as the Philippines (53%), Nepal (83%) and other advanced countries (e.g., UK, 70%). India desperately needs to unlock this workforce to reach not only sustainable development goals on gender equality, human development, and poverty eradication but also to foster economic growth and shared prosperity.
If gender disparity in India is a result of discriminatory hiring practices in the labor market, then economists, dating back to Gary Becker, would argue that competition should drive out such discrimination.3 The idea behind this theory is that people prefer to work with their own “types.” In lax environments, or when firms have market power, managers may engage in discriminatory behavior to hire their own “type” and still be able to remain in business. However, competition is thought to put a brake on the scope of discrimination and crony capitalism. If a firm is in a fierce battle for survival, then it must optimize to stay in business, and firms with managers who are willing to give up (or never had) tendencies to discriminate over employees will be more likely to succeed. Evidence from the United States suggests that following deregulations in the banking sector, discrimination within banks and among product markets declined due to greater competition.4 However, a systematic study on the impact of pro-competitive reforms on gender discrimination and/or segmentation in developing countries is rather scarce.
1 See Albrecht, Björklund and Vroman (2003) for evidence on Sweden. 2 India ranks among the top 10 countries in the WEF’s political empowerment index, which is one of the pillars of the Gender gap index. 3 Becker (1957). 4 Black and Strahan (2001) and Levine, Levkov and Rubinstein (2014).

2
This paper investigates the patterns of female entrepreneurship, labor force participation and gender-based segmentation across Indian manufacturing and services sectors. The paper attempts to link the broad changes in these patterns over the last two decades to change in pro-competitive reforms. While some of the imbalances observed are undoubtedly due to discrimination, we use the term “segmentation” because perfect gender balance is not efficient either. Gender-based comparative advantage in certain occupations and group-based specialization imply that workforces will never be perfectly balanced at the plant or industry level. India's enormous imbalances, however, suggest that it is far from the efficient level.
Our paper makes two important contributions to the literature. One, the limited research that does study the ‘gendered’ impact of competition in developing countries mainly investigates the effect on female labor force participation (FLFP) rates, sectoral employment patterns and wage inequality. The focus of our work is to additionally highlight the impact of such reforms on gender segmentation. Specifically, India's work force is highly segmented by gender. For instance, an earlier study on India’s informal manufacturing reveals that 92% of employed women are in female-owned businesses while 97% of working men are employed in male-owned enterprises (Ghani, Kerr and O'Connell, 2014). Said differently, our work describes the extreme inclination of female-led establishments to hire female employees and likewise the tendency of male-owned plants to have a primarily male-dominated workforce. Furthermore, we use a novel index that measures segmentation based on the perspective of an average employee, to additionally offer insights on the role of pro-competitive forces in mitigating segmentation.
Two, most studies on developing countries have employed trade liberalization as a competitive force to study the changes in gender discrimination thereafter. A few studies in the context of developed countries have also focused on domestic banking reforms. Using establishment level data from India, we study the impact on gender-based outcomes and segmentation in both manufacturing and services emanating from a range of pro-competitive reforms including not only India’s mostly exogenous trade liberalization episode, but also industry-specific domestic reforms and infrastructural reforms.
We are not aware of any such studies for developing countries in Africa and/or South Asia. Yet India is a very important laboratory for studying these effects. First, India has a history of discrimination, broadly speaking, be it by gender, caste, or otherwise. Moreover, this matters for India’s economic growth and development. For instance, Khera (2016) finds that an improvement in public provisions (such as better water facilities, sanitation development, and access to electricity) which increases female labor participation by 1.5% would lead to a 1.4% gain in GDP. Lawson (2008) estimates that India’s per capita income could be 10% to 13% higher than under the baseline scenario of unchanged gender inequality in 2020 if the gender gap decreases by 50% from its 2008 value. The widely followed crimes against women in India and the growth of female political set-asides speak to this important struggle of mainstreaming gender parity in India’s growth narrative.

3
Second, a striking feature of the Indian data is that one knows the gender composition of the workforce. Most notably, we are not aware of large-scale datasets studies that are able to unite owner’s gender, employee gender, and localized competition in the manner that this study does.5 In the case of unorganized sector manufacturing and services sector establishments, one also knows the gender of the business owner. This provides exceptional details about gender-based employment patterns that stretch over a long period of time. This offers a very rare opportunity to study gender-based outcomes, especially in a developing economy setting. As establishments also have geographic and industry identifiers, one can make very precise assessments of discrimination behavior. For example, our work asks whether gender discrimination is more or less prevalent in leading or lagging regions and states. How does this relate to the local education of the workforce or the quality of physical infrastructure in these regions?
Our descriptive work suggests that there is a clear pattern of gender segmentation in both manufacturing and services. For example, in the unorganized manufacturing sector, about 90% of employees in female-owned business are female, while this share is 81% in the case of services. Further, the extent of gender segmentation in India’s female-owned as well as male-owned businesses has increased over the years. Beyond these core results, we also note that since 2001, the share of female entrepreneurs and their resulting employment has increased in the informal manufacturing sector.6 For the services sector, these statistics are, however, much lower in level as well as in growth terms. Finally, although the share of female employment is slightly lower in services than in manufacturing, it has shown dynamic growth from 2001 to 2006.
These broad patterns mask the varying trends in female entrepreneurship, employment, and gender segmentation across leading versus lagging regions as well as among the industries within manufacturing and services. Our state and industry level descriptive statistics suggest that the states and industries with higher female entrepreneurship shares are also the ones with higher female participation shares in employment. Further, there is a positive association between female involvement in ownership or in employment and gender segmentation in female-led businesses. In general, the magnitude of this correlation is found to be stronger in unorganized manufacturing than in the services sector.
Among the correlates of female activity, we find that participation of women in both manufacturing and services is greatly influenced by larger working age populations and female-to-male gender ratios in the local economy. Technology plays a vital role in reducing gender segmentation in the services industry relative to that in informal manufacturing. Across the board, we find a relatively higher importance of district level local infrastructure in determining female participation and in reducing gender segmentation among male-led plants.
5 Relatedly, Ghani, Kerr and O'Connell (2014) did some early parallel work in this regard with respect to female political set-asides. 6 Ghani, Mani and O'Connell (2013) document the substantial increase in female entrepreneurship in India’s unorganized manufacturing sector from 1994 to 2000.

4
India has undergone massive competitive changes since the turn of the millennium. This has perhaps been a result of a conscious strategy of restructuring the economy through a wide variety of reforms, such as the massive trade liberalization episode of the 1990s, the large-scale investment in highway infrastructure in the 2000s, and more recently the domestic reforms that dismantled reservations of products for smaller plants. These macro reforms are known to have enhanced economic activity and improved allocative efficiency and productivity at the firm level (Ghani, Goswami and Kerr, 2016a; Topalova and Khandelwal, 2011; Tewari and Wilde, 2015). As opposed to the theoretical predictions of competition in reducing taste-based discrimination, our aggregate level trends point to an increase in gender segmentation in Indian manufacturing and services sectors. It is feasible that some other factors, beyond competition, are leading this trend. To test the micro impact of increased competition on gender segmentation, we exploit the spatial and industry level variation in reforms where certain districts (e.g., in GQ upgrades) or specific industries (e.g., in tariff liberalization or de-reservations) were differentially affected.
We begin with utilizing the spatial variation in the design of a major infrastructure project in India. The Golden Quadrilateral (GQ) project that upgraded 5,846 kilometers of roads connecting many of India’s major industrial, agricultural and cultural centers not only heightened economic activity for Indian manufacturing but also facilitated a more natural sorting of certain industries from nodal districts into periphery locations. The upgrades also encouraged decentralization by making intermediate cities more attractive for manufacturing entrants. Importantly, and the subject of ongoing research, the upgrades are also associated with better allocative efficiency in the organized manufacturing sector (Ghani, Goswami and Kerr, 2016a). Our descriptive results, however, do not find any impact of such competitive forces on gender segmentation among districts located in proximity to the GQ highways. By comparison, we find a decline in segmentation among non-nodal districts lying away from the highway, which is rather opposite to what theory would predict.
In a subsequent experiment, we switch to exploiting the industry level variation in the pro-competitive trade liberalization reforms.7 Beginning in 1991, trade reforms opened the Indian economy by substantially reducing the tariff rates on a large number of products. These mostly exogenous reforms allow for an industry level long-difference analysis of trade-based competition. For empirical identification, these reforms offer ample variation internal to India. For example, the trade deregulations took place at different times for various products. This staggered timing in trade reforms across a range of products provides enough room to use an econometric tool to identify the stimulus in competition across industries. Our results suggest a very limited correlation of tariff changes to participation of women in Indian manufacturing. Nonetheless, we do find that a reduction in trade protection is associated with a decline in segmentation among male-led plants. A positive correlation between trade reforms and
7 See, for example, Topalova (2007; 2010) and Topalova and Khandelwal (2011) for some of the effects of trade liberalization on poverty alleviation, inequality and productivity enhancement.

5
segmentation among female-led businesses, however, dilutes our confidence in the link between trade liberalization-induced competition and gender segmentation.
Finally, we identify the consequences on gender segmentation of enhanced competitive forces due to the elimination of products reserved for small-scale industries (SSI).8 With the aim of promoting SSI, the Government of India (GOI) embarked on a policy of reserving products exclusively for production by smaller plants.9 Starting with the third five year plan (1961-1966), this list of reserved products progressively became larger over the years up until 1997. Since 1997, after the Expert Committee report under the Chairmanship of Dr. Abid Hussain (GOI, 1997), India has witnessed a reversal of reservation policy and gradually most products were de-reserved by 2007. Our work reveals that industry level de-reservations were positively associated with overall activity, in general, and specifically with female activity. Like the trade reforms, de-reservation reforms are also associated with a decline in segmentation among male-owned businesses, while they are associated with an increase in segmentation among female-owned plants.
This multi-dimensional analysis has immense relevance for policy. For instance, cutting across the spatial dimension, we note that certain locational traits such as leading versus lagging states generate higher levels of gender segmentation but they do not respond differently to investments in infrastructure. Further, we find that certain district traits such as the local infrastructure and technology usage play an important role in mitigating gender segmentation in India. Finally, our work on the impact of pro-competitive reforms on gender segmentation points to the possibility that not all policies are equally effective in reducing discrimination. For instance, we find null effects of reforms that enhance competition in a spatial context. Specifically, districts located in proximity to the GQ highway did not witness an increase in activity of women or a reduction in segmentation post-upgrade. By comparison, industry-specific pro-competitive reforms, such as trade liberalization and product de-reservation, are associated with a decline in segmentation among male employees and an increase in participation among women. The efficiency of the state underlies these features, and our project helps trace out how these traits govern their effectiveness in promoting competitive workforces.
The paper beyond this point is organized as follows: Section II describes the related literature, while Section III details the sources of data for our work. Section IV presents the empirical design, and Section V contains key descriptive results and our metrics of segmentation. This section subsequently presents the district level view of gender segmentation followed by an industry level analysis. We conclude the paper in Section VI with some final remarks on the policy dimensions of this work. 8 See for instance, Tewari and Wilde (2015) and Martin, Harrison and Nataraj (2014) for evidence on how de-reservation policy enhanced competition in India. 9 Product reservation for SSI was based on the rationale that small firms would help create jobs and expand industrial activity across the country. However, the continued poor performance of SSI brought the reservation policy under scrutiny, especially after the 1991 reforms that broke the protectionist regime in India.

6
II. Related Literature
Our work is related to two different strands of literature, one that links the impact of pro-competitive changes in the economy to discrimination in hiring decisions and another that specifically deals with gender-based differences in economic outcomes. The first strand of literature specifically relates to the economics of discrimination, dating back to Becker (1957). This area of research has noted the challenges of separating out taste-based discrimination from statistical discrimination from unobservable factors. Recent updates on the state-of-the-art literature include Charles and Guryan (2011) and Lang and Lehmann (2012). Although our work contributes to this literature, it differs from it in an important way. Much of the discrimination discussion focuses on how to measure and interpret individual level wage differentials absent any reform or cross-group comparisons. The focus of this paper is centered on workplace segmentation by gender of employees and owners and how competitive changes can induce changes in discrimination patterns.10
It is widely perceived that competition trumps “taste-based discrimination” and inefficient management practices. Competitive forces are likely to turn employment outcome in favor of females because firms that incur an efficiency loss from discriminating against women will be competed away from the market unless they change their hiring strategy. Since women offer cheap and flexible labor in many settings vis-à-vis men, greater competition induces feminization of the workforce (e.g., Cagatay and Ozler, 1995; Elson, 1999; Standing, 1999; Black and Brainerd, 2004; Heyman, Svaleryd and Vlachos, 2013).11
We experiment with three different elements of pro-competitive reforms—large-scale infrastructure investments, trade liberalization and domestic policy reforms. Large-scale infrastructure projects are known to encourage competition in a spatial context rather than in the traditional product space. For instance, investment in highways is known to reduce transport and trade costs that allow cities to specialize better in production activities of their core competencies and promote higher growth and productivity.12 In the case of India, the Golden Quadrilateral highway investment project has received wide attention. Research on GQ has noted the positive spillovers created through improved manufacturing outcomes in terms of output, employment, plant entry and entrepreneurship as well enhanced productivity and allocative efficiency (Datta, 2011; Ghani, Goswami and Kerr, 2016a; 2016b). GQ is also known to have driven spatial 10 Examples include a study of ethnic Indian clustering for global contracts on oDesk (Ghani, Kerr and Stanton, 2014) and for industry entrepreneurship in Kerr and Mandorff (2015). These settings, especially when used in comparative regression formats, can provide alternative and complementary routes to studying discrimination that avoid some of the challenges of direct wage-based work. 11 For more studies on the impact of product market competition on discrimination, see Ashenfelter and Hannan (1986); Hellerstein, Neumark and Troske (2002); Meng (2004); and Zweimüller et al. (2008). 12 For example, see Storeygard (2012) for a study on Africa; Donaldson (2014) for the impact of colonial railway infrastructure in India; Banerjee, Duflo and Qian (2012) for an impact evaluation of road and rail investments in China; Michaels (2008), Chandra and Thompson (2001) and Duranton and Turner (2012) for studies on the impact of highway investments in the United States; and Holl and Viladecans-Marsal (2011) for a similar study on Spain.

7
spillovers in economic activity across neighboring regions that might have helped activate intermediate-sized cities located in proximity to the GQ highways (Khanna, 2014; Ghani, Goswami and Kerr, 2016a). Our paper is the first to examine how competitive forces created through investments in infrastructure projects, such as the GQ, may affect gender segmentation of workforce.
Another channel through which large infrastructure investments elicit a differential response on the gender dimension is through migration of potential workers. As opposed to countries like China, there are no restrictions to labor mobility within India, and hence workers are likely to migrate in response to enhanced employment opportunities in new and more productive plants located close to the highways. Mobility in India, however, remains generally low (Munshi and Rosenzweig 2009) due to the high costs of migration. Furthermore, the movement of women for work is extremely rare due to severe social frictions (Banerjee and Raju, 2009; Shanthi, 2006). Thus, the GQ episode may change the gender composition of entrepreneurship and workforce via the interaction of competitive forces with the migration of male and female workers.
Trade liberalization and domestic industry reforms can influence gender differences in labor market outcomes primarily through three channels. First, trade liberalization and related reforms increase competition and encourage firms to reduce their costs. The pro-competitive effects thus diminish the scope for taste-based discrimination. Second, these reforms also bring technological change, as part of a cost reduction strategy or perhaps as a spillover benefit of an open trade regime, for instance. If technological change is skill-biased and men and women differ in terms of their education levels, this will have an effect on gender inequality. Third, reforms can prompt sectoral re-allocation of resources from import competing to exporting sectors in the case of trade, or from small firms to large firms in the case of de-reservation.
A sizeable literature is devoted to studying the impact of trade liberalization on economic outcomes, including firm productivity (Topalova and Khandelwal, 2011; Krishna and Mitra, 1998; Sivadasan, 2009) and export performance in India and elsewhere.13 The gains from liberalization result from a reallocation of resources from less productive to more productive firms (Melitz, 2003), through product shedding which forces firms to focus on their core competency (Bernard, Redding and Schott, 2006) and through enhanced access to higher quality intermediate inputs (Goldberg et al., 2010). Some studies suggest that business and labor regulations inhibit efficient reallocation of resources following trade liberalization. Thus, developing countries need to institute complementary policies to realize the potential benefits of trade reforms (Bolaky and Freund, 2004; Hoekman and Javorcik, 2004).
13 See Tybout, De Melo and Corbo (1991) and Pavcnik (2002) for Chile; Harrison (1994) for Côte d’Ivoire; Tybout and Westbrook (1995) for Mexico; Fernandes (2007) for Colombia; Muendler (2004) and Schor (2004) for Brazil; and Amiti and Konings (2007) for Indonesia.

8
Trade liberalization has also been linked to reduced incidence of poverty and inequality.14 In the case of India, this link has been spatially evaluated by Topalova (2007, 2010). A district with higher exposure to tariff liberalization experienced lower reductions in rural poverty, while urban poverty is unaffected by these reforms. Her work suggests that rural and urban inequality were also unaffected by liberalization.15 Although a number of studies find small effects of trade reforms on wage inequality, 16 they have been associated with reduced incidence of child labor in India and Indonesia,17 improvements in schooling and investments in human capital formation,18 and decline in urban unemployment in Indian states with flexible labor markets.19
Cross-country studies are mostly inconclusive on the impact of trade and globalization in promoting gender equality. For instance, the empirical relationship between trade flows and female labor force participation is often found to be contingent on the country’s income level and economic structure and the time period considered (e.g., Wood, 1991; Bussman, 2009; Cooray, Gaddis and Wacker, 2012). One of the shortcomings of cross-country studies is the lack of comparability of data across a range of countries. Studies using micro data at the level of households, employees and establishments offer a much broader scope for a detailed and meaningful analysis. Country-specific literature on the issue has documented a positive association between export-orientation and feminization of workforce.20 Some studies go further to establish that the causality runs from liberalization to better outcomes for female employment, that is, trade liberalization is found to positively contribute to a convergence of male and female labor force participation and employment rates.21
By comparison, using a panel of Indian formal manufacturing firms from 1998-2008, Banerjee and Veermani (2015) argue that, in spite of massive trade liberalization, India has witnessed a declining trend in female workforce participation rates since the late 1990s. Their results suggest that female employment intensity (FEI), defined as the share of all employees who are female, reduced as a result of trade liberalization. Reforms seem to have induced a skill-biased technological change, which promoted firms to hire more male workers at the expense of female
14 See Goldberg and Pavcnik (2007) for a survey on developing countries. 15 For related studies, see Porto (2004) on Argentina; McCaig (2011) on Vietnam; Goldberg and Pavcnik (2005) on Colombia. 16 Most studies in the field focus primarily on Latin America (e.g., Cragg and Epelbaum, 1996; Revenga, 1996; Hanson and Harrison, 1999), while there are some studies on, for example, Morocco (Currie and Harrison, 1997) and Brazil (Castilho, Menéndez and Sztulman, 2012; Kovak, 2013). 17 See, for example, Edmonds, Pavcnik and Topalova (2010); Kis-Katos and Sparrow (2011). 18 For instance, see Edmonds, Pavcnik and Topalova (2010) for India. 19 Hasan et al. (2012). 20 See, for instance, Fontana (2009); Nordas (2003) for a survey on the gender-based effects of trade liberalization in developing countries; for country-specific studies, see Ozler (2000) for Turkey; Ederington, Minier and Troske (2009) for Colombia; Aguayo-Tellez et al. (2013) for Mexico; Rahman and Islam (2013) for Bangladesh; Subramanian and Roy (2001) for Mauritius. 21 See for example, Juhn, Ujhelyi and Villegas-Sanchez (2014) for a study on Mexico; Gaddis and Pieters (2014) for work on Brazil.

9
workers, while the resource reallocation effect arising from India’s comparative advantage in unskilled labor intensive industries, which could have potentially generated greater employment opportunities for largely unskilled Indian women, has been weak to deflect FEI in their favor. The observed skill-biased technological change emanating from reforms is a reasonable possibility given that India tends to specialize in capital and skill intensive manufacturing and services, a pattern incongruent to its comparative advantage, much noted in the literature (Kochhar, Kumar and Subramanian, 2006; Panagariya, 2007, 2008; and Krueger, 2010).22 Moreover, reallocation of resources could have also been smaller than expected because even though trade liberalization addressed the barriers to participation in trade, India’s factor markets, especially land and labor, remained highly distorted (Duranton et al., 2015, 2016).
The other set of industry reforms linked to our work is that of de-reservation of products pertaining to small scale industry. Although reservation of products for SSI is unique to India, many developing countries share this concern of promoting their small and medium firms. Since 1967, the Indian government started the SSI promotion policy with only 47 items. In three decades, the number of items reserved for SSI increased to more than 1,000 products. Research suggests that such a reservation policy failed to achieve its said objective and in fact nurtured inefficiency. Specifically, the reservation policy is noted to be a drag not only on employment growth in the manufacturing sector (Mohan, 2002) but also on participation in exports (Panagariya, 2008).
Starting with 1997 onwards, following the expert committee report (GOI, 1997), there was a gradual reversal in reservation policy which intensified in the mid-2000s. De-reservation could be perceived as a decline in fixed entry cost that naturally results in an increased competition in the product market. Higher competition requires firms to raise their productivity to survive in the industry. The staggered timing of de-reservation across different products has been utilized by some studies to make an impact evaluation of such a policy change.23 De-reservation induced faster growth among larger plants relative to smaller ones. This policy change promoted the growth of young entrants and incumbents that were previously capital constrained (Martin, Nataraj and Harrison, 2014). Research suggests that districts that had a greater exposure to de-reservation during 2000-2007 showed heightened increase in employment and wages. Removal of restrictions on choice of products allowed formal Indian manufacturing firms to expand their size as measured by output, employment and capital. De-reservation also pushed greater
22 After the trade reforms, Veermani (2012) finds that the share of capital-intensive manufacturing in exports increased from 23% in 1990 to nearly 54% in 2010, while the share of unskilled labor-intensive manufacturing declined from 43% to 22% during the same period. 23 De-reservation policy was part of the major industrial policies, including trade liberalization and industrial licensing, but instituted a few years post the 1991 reforms.

10
improvements in productivity of Indian formal manufacturing firms (Tewari, 2011; Garcia-Santana and Pijoan-Mas, 2014).24
Increased competition due to de-reservation is not the only channel through which such a policy change may impact the gender segmentation in Indian manufacturing. Recent research reveals that de-reservation of products exclusively for SSI changed the evolution of product churning, which pushed firm productivity to a higher level (Tewari and Wilde, 2015). Prior to the reform, reservation of certain products for SSI constrained the ability of multiproduct firms to achieve their optimal product mix. However, once the policy was dismantled, there was a significant increase in product scope among formal firms in Indian manufacturing.25 Product churning is thus an additional margin of reallocative activity, which, as in the case of trade liberalization, is likely going to have a gender dimension. If the de-reserved products were mainly unskilled labor intensive, for instance, then an expansion of product scope by formal and larger firms is likely going to increase their scale of production and thus have a positive impact on FEI. Gender segmentation, on the other hand, could move in either direction depending on the proportion of de-reserved products appropriated by female entrepreneurs and the skills required in producing these de-reserved products. Thus, our work also contributes to studies of business practices in small firms and economic advancement in developing countries (e.g., Ardagna and Lusardi, 2008; Schoar, 2009)
Finally, our work is also related to and contributes to the literature on targeted policies that impact the social and economic well-being of women.26 Political reservations for women in India,27 for instance, have contributed much to investments in infrastructure or reallocation of public goods directly relevant to the needs of women (Chattopadhyay and Duflo, 2004; Duflo, 2005), creating public works employment for women (Ghani, Mani and O'Connell, 2013), lowering crime against women (Iyer et al., 2012) and encouraging entrepreneurship among women in the informal sector (Ghani, Kerr and O'Connell, 2014).28 Our work builds on such studies of gender differences in entrepreneurship and employment (e.g., Estrin and Mickiewicz, 2011; Minniti, 2010; Minniti and Naudé, 2010; Rosenthal and Strange, 2012). This strand of research basically argues that activating half of a country’s potential workforce can be a significant driver of economic growth beyond promoting gender equality (Duflo, 2012; World Bank, 2011).
24 By comparison, Bollard, Klenow and Sharma (2013) do not find evidence of increase in firm productivity following de-reservation, partly perhaps because of their measure of de-reservation, which is not based on product level information. 25 See Goldberg et al. (2010) for a study on the impact of trade liberalization and product scope among formal Indian manufacturing firms. 26 Examples include Mammen and Paxson (2000), Dhaliwal (2000), Mitra (2002), Ghosh and Cheruvalath (2007), Amin (2010), Field, Jayachandran and Pande (2010), Pillania, Lall and Saha (2010), Jensen (2010), Verheul, Stel and Thurik (2006), Bruhn (2009), Munshi (2011), Kobeissi (2010), and World Bank (2008). 27 See Pande and Ford (2011) for a comprehensive review of the literature on gender quotas. 28 Ghani, Kerr and O'Connell (2013) provide a spatial analysis of gender differences in entrepreneurship in Indian manufacturing, while Klapper and Parker (2011) provide a review of the literature on female entrepreneurship.

11
Nonetheless, despite significant economic advancement since liberalization, the role of women in the Indian economy still lags well behind that of advanced economies (e.g., Mammen and Paxson, 2000; World Bank, 2008, 2012). Cross-country data from the World Bank Entrepreneurship Snapshots find that India’s rates of business ownership (overall, and female-to-male ratio) and female labor force participation are lower than its stage of development would suggest. This dual under-performance has cultural and economic antecedents, but it is starting to change. Women are making economic gains in the Indian economy, and further progress represents a tremendous growth opportunity for the country. Our work contributes to this debate by utilizing pro-competitive policies as a possible channel for promoting greater participation of women in economic activity and reducing gender segmentation.
III. Data
Our work examines the pattern and evolution of female labor force participation rates and gender segmentation in the manufacturing and services sectors. We begin by describing the manufacturing and services data, followed by a discussion on constructing varying measures of gender segmentation. Manufacturing
We use the same plant level information as much of prior research on the Indian economy, including Duranton et al. (2015). This project primarily draws upon two major sources of data – the National Sample Survey Organization (NSSO) for unorganized manufacturing and services and Annual Survey of Industries (ASI) for organized manufacturing. Manufacturing activity undertaken in the unorganized sector, such as households (own-account manufacturing enterprises, or OAME) and unregistered workshops, is covered by the NSSO. Following the first Economic Census 1977, small establishments and enterprises not employing any hired workers (that is, OAME) that engaged in manufacturing and repair activities were surveyed on a sample basis in the 33rd round of the NSSO during 1978-79. Subsequent surveys covering OAEs and Non-Directory Manufacturing Establishments (NDME) were conducted in the 40th and 45th rounds of the NSSO during 1984-85 and 1989-90, respectively. In 1994-95, the first integrated survey on unorganized manufacturing and repair enterprises, covering OAMEs, NDMEs, and DMEs, was undertaken during the 51st round of the NSSO. Subsequently, surveys of manufacturing enterprises in the unorganized sector were conducted in the 56th (2000-01), 62nd (2005-06), and 67th (2010-11) rounds.29
29 Thus, the surveys on unorganized manufacturing enterprises usually covered: (i) manufacturing enterprises not registered under Sections 2m(i) and 2m(ii) of the Factories Act, 1948; (ii) manufacturing enterprises registered under Section 85 of the Factories Act, 1948; (iii) non-ASI enterprises engaged in cotton ginning, cleaning, and baling (NIC-2004, code 01405); and (iv) non-ASI enterprises manufacturing bidi and cigar (those registered under the Bidi and Cigar Workers (condition of employment) Act, 1966, as well as those un-registered). Some of the surveys (such as 2010-11) covered trading enterprises and services establishments, but we exclude them for the
12
Starting with the 51st round, NSSO surveys collected information on the owners of establishments. Establishments are asked to identify broadly from the following categories: co-operative society; female individual proprietorship; male individual proprietorship; partnership; private limited company; public limited company and others. Our work concerning the gender of the owners considers only those establishments that identify themselves as either female or male individual proprietorships. These constitute over 97% of total observations in our cleaned sample. The information captured in this field is an outcome of the survey and not a factor in the stratification design.30
Additionally, the NSSO also provides the gender of each employee engaged in the establishment. Our work on women’s labor market dynamics using the gender composition of employees is supplemented with the organized manufacturing data from the Annual Survey of Industries (ASI). The ASI provides microdata on the organized manufacturing sector of the economy, which is not covered by the NSSO. The ASI is undertaken annually by the Central Statistical Organization, a department in the Ministry of Statistics and Program Implementation, Government of India. Under the Indian Factory Act of 1948, all establishments employing more than 20 workers without using power or 10 employees using power are required to be registered with the Chief Inspector of Factories in each state. This register is used as the sampling frame for the ASI.31 The ASI extends to the entire country, except the states of Arunachal Pradesh, Mizoram and Sikkim and the Union Territory (UT) of Lakshadweep.
purposes of our paper. Additionally, the NSSO excludes: (i) repairing enterprises not falling under Section ‘D’ of NIC-2004; (ii) departmental units such as railway workshops, RTC workshops, government mint, sanitary, water supply, gas, storage, etc. in line with ASI coverage; (iii) units covered under ASI; and (iv) public sector units. The sample design for the unorganized sector is a stratified multi-stage design. The first stage units (FSU) are the census villages in the rural sector and Urban Frame Survey (UFS) blocks in the urban sector. The ultimate stage units are enterprises in both sectors. In the case of large FSUs, one intermediate stage of sampling is the selection of three hamlet-groups/sub-blocks from each large rural/urban FSU. Two frames were used (as per the 62nd round survey): List frame and Area frame. List frame was used for urban manufacturing enterprises only. For unorganized manufacturing enterprises, a list of about 8000 large non-ASI manufacturing units in the urban sector prepared on the basis of the data of the census of manufacturing enterprises conducted by Development Commissioners of Small Scale Industries in 2003 was used as the list frame for surveys in 2005-06 and 2010-11. Area frame was adopted for both rural and urban sectors. The list of villages as per census 2001 was used as the frame for the rural sector, and the latest available list of UFS blocks was used as the frame in the urban sector. The relevant year’s economic census was used as the frame for towns with population 10 lakhs or more (as per Census 2001). 30 The categories listed for the ownership and premises fields are taken from the 1994 survey instrument. Later surveys expanded the listed categories to include additional ownership categories that do not overlap with the primary male/female proprietary categories used in this work. See Ghani, Kerr and O'Connell (2014) for more details. 31 The sampling design followed in in most ASI surveys is a stratified circular systematic one. All factories in the updated frame (universe) are divided into two sectors: Census and Sample. The Census Sector is comprised of industrial units that belong to the six less-industrially developed states or UTs: Manipur, Meghalaya, Nagaland, Tripura, Sikkim, and the Andaman & Nicobar (A&N) Islands. For the rest of the states/UTs, the Census Sector includes (i) units having 100 or more workers and (ii) all factories covered under Joint Returns. All other units

13
The ASI provides statistical information to assess changes in the growth, composition, and structure of the organized manufacturing sector, comprising activities related to manufacturing processes, repair services, gas and water supply, and cold storage. Specifically, for the purpose of our project, we are able to extract information on the number of employees by gender. That is, we have the exact count of male and female employees for most establishments in organized manufacturing with the ASI data and for the services and unorganized manufacturing sectors from the NSSO records. For some analyses, we exclude records where the male and female employee counts do not add up to within 10% of the reported total employment for the firm.
We use ASI surveys from the same fiscal years as the NSSO data described above to investigate the impact of increased competitiveness ensuing from infrastructure investments, trade liberalization and domestic regulation reforms. ASI surveys have a similar design32 and stratification as the NSSO surveys. However, the ASI survey does not provide any information on the gender of the owners. Thus, our indices on gender segmentation that match the gender of employees with that of the owner cannot be constructed for the organized manufacturing data. This limitation on ASI data does not impose a major constraint as roughly 99% of plants and 80% of employment are covered by the NSSO. Besides, we are still able to measure segmentation in the organized sector by developing a novel index based on the information on the gender of employees. For an average employee, this index computes the share of his/her co-workers that are of the same gender. Computing this alternative employee-based index of gender segmentation allows us to compare our results for the organized manufacturing sector with that observed in the unorganized manufacturing and the services sectors.
Services
Beginning with the 57th round conducted during July 2001 to June 2002, the NSSO surveyed unorganized enterprises belonging to the services sector. This survey was repeated in the 63rd round (2006-2007) and 67th round (2010-2011). The survey covered the whole of the Indian Union except (i) the Leh (Ladakh), Kargil, Punch and Rajauri districts of Jammu & Kashmir, (ii) interior villages situated beyond five km of a bus route in Nagaland, and (iii) villages of the Andaman and Nicobar Islands, which remain inaccessible throughout the year. Thus the corresponding State/UT level estimates and the all-India results presented in this report relate to the areas covered under survey.
Unfortunately, the NSSO coverage for services across subindustries is less consistent over time. The 57th round surveyed, broadly, all unorganized service sector enterprises engaged in the
belonging to the strata (state x four-digit industry of the NIC-04 framework) having four or fewer units are also considered as Census Sector units. Finally, the remaining units, excluding those of Census Sector, called the Sample Sector, are arranged in order of their number of workers and samples are then drawn circular systematically considering a sampling fraction of 20% within each stratum (state x sector x four-digit industry) for all states. An even number of units with a minimum of four are selected and evenly distributed in two sub-samples. 32 The ASI sampling frame is based on business registers rather than the Economic Census.

14
activities of hotels and restaurants; transport, storage and communication; real estate, renting and business activities; education; health and social work and other community, social and personal service activities. The 63rd and 67th rounds additionally covered financial intermediation services, which were not covered in the 57th round, while specific sectors such as non-mechanized transport activities related to transport via railways and activities of business, employers and professional organizations were excluded after the 57th round. The 67th round also extended coverage to include service sector enterprises pursuing the activities of wholesale and retail trade, repair of motor vehicles, motorcycles and personal and household goods, as well as services related to waste collection, treatment and disposal. The NSSO does not survey public administration and defense, private households with employed persons, or extra-territorial organizations and bodies. As with manufacturing, the sample stratification in services also includes both the district level and the two-digit NIC sectors.33 Although some changes in NIC definitions are evident, we have placed them into a consistent format using 2004 definitions.
Consistent with the manufacturing surveys, the NSSO collects establishment level information for services regarding output, inputs (raw materials and other inputs), fixed assets, value of land and buildings, employment, energy consumption, and so on. Additionally, for our purposes, we observe the gender of the owners of these services establishments through similar categories of ownership structure choices available for unorganized manufacturing. Establishments reporting either female or male proprietors constitute about 95% of the total establishments in the cleaned sample. Additionally, as in both the organized and the unorganized surveys, the services survey by NSSO also collects information on the gender of employees.
Yearly values for variables that are reported on a monthly basis are obtained by multiplying by 12 in the case of perennial and casual enterprises; we multiply by the reported number of months a business is in operation for seasonal enterprises. Monetary values are deflated and converted to 2005 PPP in USD values. Deflators for disaggregate services are calculated from the gross value added (GVA) in current prices relative to the GVA in constant prices, available from the Ministry of Statistics and Programme Implementation (MOPSI) India. These disaggregate services include: (i) electricity, gas & water supply, (ii) construction, (iii) trade, (iv) hotels & restaurants, (v) railways, (vi) transport by other means, (vii) storage, (viii) communication, (ix) banking & insurance, (x) real estate, (xi) public administration & defense, and (xii) other services. For deflating purposes, we use the three-digit NIC codes and description to allocate each services establishment into these broad disaggregate categories. 33 Irrespective of the size of establishments, the 57th and the 67th round surveys include all establishment enterprises in the main geographical sampling frame (“area frame”), while the 63rd round introduced a separate “list frame” for the largest enterprises in the corporate sector. Although 998 of such large service sector firms were initially identified in the list frame, for multiple reasons only 438 of them were finally surveyed. While this sampling difference could raise concerns, they are alleviated by the fact that the former two surveys also paid attention to large enterprises in a manner very similar to the list frame of the 63rd round. For instance, the 57th round surveyed all enterprises with 200 or more workers, thus making the 57th survey round comparable with the 63rd round.

15
When comparing manufacturing with the services data, we use the following years from organized and unorganized manufacturing: 2000-01 and 2005-06 for both sectors, and additionally 2009-10 from the ASI and 2010-11 from the NSSO. Otherwise, based on the policy experiment we are conducting, we take advantage of the appropriate sample years for organized and unorganized manufacturing available to us. For the sake of simplicity, we refer to the sample year by the start year in the case of services survey. For manufacturing, we refer to the surveys by their end years to simplify the comparison with services. For instance, the manufacturing sample survey in the year 2005-06 is referred to as the 2006 survey. Likewise, we use 2010 in the tables and text to refer to the years 2009-10 for ASI data and years 2010-11 for NSSO data. For services, we always refer the surveys by their start year.
Sample Preparation
Our descriptive work primarily compares manufacturing and services during the overlapping period of 2000-2010. The raw data have 155,513 ASI observations and 408,002 NSSO observations. For the ASI, we drop establishments that are not “open,” excluding plants that were closed or non-operational when surveyed, were deleted due to deregistration, and were out of coverage (that is, belonging to defense, oil storage, etc.). Next, we drop ASI establishments that do not belong to the manufacturing sector. Such industries may relate to mining and quarrying, fishing and aquaculture, or the services sector. Finally, we flag observations with null, missing, negative, or extremely large values of output, output per worker, and employment. At this stage, those states that are not surveyed by ASI are also flagged from the NSSO surveys. These include the states of Arunachal Pradesh, Mizoram, Sikkim, and the Union Territory of Lakshadweep. We also flag observations that have blank state codes. In the end, we drop observations that have any one of the flags described above. These drops result in a final sample of about 93,000 for the organized sector and 400,000 for the unorganized sector for the three survey years under consideration.
The NSSO surveys many more establishments in the services sector, about 800,000 during our period of study. We drop some very small industries: NIC 61 (Inland, sea and coastal water transport), 73 (Research on natural sciences, engineering, social sciences and humanities), and 90 (Sanitation services). We also drop NIC industries 37 (Recycling) and 50–52 (Wholesale and retail trade, repair of motor vehicles & household goods) due to inconsistent coverage across survey years. The latter exclusions substantially reduce the included establishment counts.
In our policy analyses, we also exclude plants from small and conflict states. These include the Andaman and Nicobar Islands, Dadra & Nagar Haveli, Daman & Diu, Jammu & Kashmir, Tripura, Manipur, Meghalaya, Mizoram, Nagaland and Assam. In some analyses, we drop observations for plants with negative value added, missing raw materials value and missing values of fixed assets. Lastly, we also drop any observation in the services sector surveyed from the states of Arunachal Pradesh, Lakshadweep, Mizoram and Sikkim because they are not covered by the organized manufacturing survey, with which we seek to compare trends. The
16
latter step impacts less than 1% of our sample. We are left with about 352,000 observations corresponding to the year 2001, 186,000 from 2006, and 109,000 in the year 2010. These correspond to 421 districts in each year. In the regression analysis at the district level, we additionally drop a small number of observations that lack district identifiers.
IV. Empirical Strategy
The paper first describes through trend and cross-sectional tabulations the concentration of gender employment in establishments in Indian manufacturing and services and then investigates the impact of pro-competitive reforms on gender segmentation. An advantage of this approach from the perspective of measuring growth in gender segmentation is that the layers are nested. That is, we can consider broad sectors (manufacturing and services), regions and industries within these sectors, and then cohorts or groups of firms (e.g., plants owned by females versus those led by males). This sheds light on many otherwise hidden mechanisms for changes in gender segmentation. We can understand whether the effects happen through changes in segregation at establishments or reallocation across establishments, through major shifts in activity across regions in India or homogeneous growth in gender based segmentation.
In the next exercise, we evaluate the extent and direction of association between pro-competitive reforms and the gender dimension of economic activity in Indian manufacturing and services. By design, the three drivers of competition—i.e., investment in GQ highways, the trade liberalization episode of 1991 and the dismantling of reservations of products exclusively for SSI since 1999—have been studied before in the Indian context and were shown to have important effects. Thus, we adapt methodologies and insights from these prior studies to enable our efforts. In other words, our project does not need to prove that investments in highways, trade reforms or de-reservation of products are important, but we instead look directly at the gender dimension of economic consequences motivated by these reforms.
We examine the pro-competitive effects of trade and domestic reforms on female activity and segmentation in a regression framework. For instance, trade liberalization reforms remarkably lowered both the input and output tariffs (Topalova, 2007), while an isolated set of reforms targeting SSI repealed the historical product reservations protecting small businesses (Tewari and Wilde, 2015). The staggered removal of these international and domestic protections boosted competition.
We use a long-difference strategy similar to the one applied in Ghani, Goswami and Kerr (2016a) by analyzing differences in the timing of the implementation of reforms across industries. We conduct a panel analysis for a total of 50 industries that allows us to exploit this industry level timing variation and differences in traits across industries. Industries are defined at the three-digit level within the manufacturing sector. Specifically, to measure the direct effect of any industry level reform, we consider the following reduced form estimating equation:

17
∆𝑌𝑌𝑖𝑖 = 𝛼𝛼 + 𝛽𝛽∆𝑋𝑋𝑖𝑖 + 𝛾𝛾𝑍𝑍𝑖𝑖 + 𝜀𝜀𝑖𝑖 (1)
where ∆𝑌𝑌𝑖𝑖 is the outcome variable of interest relating to female activity or gender segmentation for industry i. Female activity is measured through two alternative indices: (i) share of female-owned plants and (ii) share of females in total employment. Segmentation, broadly defined, is the extent to which people of the same gender tend to segregate and work together. Thus, segmentation in a workforce could be measured from two perspectives: (i) the gender of the owner and (ii) the gender of the employees. Segmentation is most directly measured by the extent to which the gender of owners influences their decision to hire workers of the same gender. For female-owned establishments, for instance, this is measured as the share of female employees in total employment, while for male-led businesses segmentation is computed as the share of male employees in total employment. A shortcoming of this measure, however, is that we need information on the gender of the owner, which, unfortunately, is unavailable for the organized manufacturing surveys.
In an alternative setting, we view gender segmentation through the perspective of an average employee. For an average employee, we compute the share of people that this employee works with who are of his/her gender. For example, for an average female worker, we measure segmentation as the share of other workers at her establishment that are also female, while we compute a similar metric for an average male employee. In our work, we sometimes also consider the segmentation of the combined group, that is, for an average employee we compute the percent of co-workers in the establishment who are of the same gender.
Since trade and domestic industry reforms have been widely known to impact primarily the organized manufacturing sector (e.g., Topalova, 2007; Tewari and Wilde, 2015), we measure segmentation in our regressions using metrics that are possible to calculate with the ASI data. Nevertheless, it is useful to clarify here that our industry level regression work includes industry level information from both the formal and the informal manufacturing sectors, as trade reforms could have indirectly impacted the informal sector via reallocation effects.
∆𝑋𝑋𝑖𝑖 in equation (1) is the related change in the industry level reforms, which could take the form of change in tariff protection or an index measuring the change in de-reservation of products exclusively for SSI. We follow Topalova and Khandelwal (2011) in using three alternative indices for measuring trade protection: (i) output tariffs, (ii) input tariffs, and (iii) effective rate of protection. Topalova and Khandelwal (2011) use the industry specific nominal levels of tariffs on output and intermediate inputs. Although using nominal tariffs is attractive since both tariffs are well-measured and comparable across time, nonetheless it is less apt for measuring the effective protection on an industry when both output and input tariffs change drastically and simultaneously. Topalova and Khandelwal (2011), therefore, construct an index on the effective rate of protection (ERP) to capture the net effect of lowering tariffs on output and intermediate inputs, defined as

18
𝐸𝐸𝐸𝐸𝐸𝐸𝑖𝑖,𝑡𝑡 =𝑂𝑂𝑂𝑂𝑂𝑂𝑂𝑂𝑂𝑂𝑂𝑂 𝑂𝑂𝑡𝑡𝑡𝑡𝑖𝑖𝑓𝑓𝑓𝑓𝑖𝑖,𝑡𝑡 − 𝐼𝐼𝐼𝐼𝑂𝑂𝑂𝑂𝑂𝑂 𝑂𝑂𝑡𝑡𝑡𝑡𝑖𝑖𝑓𝑓𝑓𝑓𝑖𝑖,𝑡𝑡
1 − ∑ 𝛼𝛼𝑖𝑖,𝑠𝑠𝑠𝑠
where 𝐸𝐸𝐸𝐸𝐸𝐸𝑗𝑗,𝑡𝑡 is the effective rate of protection in industry i at time t and 𝛼𝛼𝑖𝑖,𝑠𝑠 is the share of input s in the value of output in industry i. Input tariffs are constructed as:
𝐼𝐼𝐼𝐼𝑂𝑂𝑂𝑂𝑂𝑂 𝑂𝑂𝑡𝑡𝑡𝑡𝑖𝑖𝑓𝑓𝑓𝑓𝑖𝑖,𝑡𝑡 = � 𝛼𝛼𝑖𝑖,𝑠𝑠𝑠𝑠
.𝑂𝑂𝑂𝑂𝑂𝑂𝑂𝑂𝑂𝑂𝑂𝑂 𝑂𝑂𝑡𝑡𝑡𝑡𝑖𝑖𝑓𝑓𝑓𝑓𝑠𝑠,𝑡𝑡
These tariff changes are measured from 1987 to 2000, the sample period available to us from Topalova and Khandelwal (2011). Trade reforms are established to be exogenous to the Indian formal manufacturing sector, particularly in the period prior to 1997 (Topalova, 2007; Topalova and Khandelwal, 2011). Since we measure the change in trade reforms up to the year 2000, we are not overly concerned about the endogeneity of these reforms. When estimating the impact of tariff changes, we measure the change in the female activity from 1994-2010, thereby taking advantage of the full sample period available to us.
For industry de-reservations, our explanatory variable of interest is simply the increase in the share of de-reserved products for SSI. These changes are measured from 1999-2009, as made available from Tewari and Wilde (2015). As in the case of trade reforms, we measure change in female activity and segmentation in these regressions from 1994-2010, including industry level information from both the formal as well as the informal manufacturing sectors. Although these reforms are mostly considered exogenous, particularly to formal manufacturing activity (Martin, Nataraj and Harrison, 2014; Tewari and Wilde, 2015), we are not aware of any study that considers the impact of de-reservation on the informal manufacturing sector in India or establishes its exogeneity in this particular context. Looking ahead in our work, we do expect de-reservations to impact the informal manufacturing sector as most plants in this sector are, by definition, small. Therefore, any policy that lifts protection off the relevant industries in this sector is likely going to have a large impact on competition. Future work that hopes to study the impact of these reforms on the informal sector should also aim to establish the exogeneity of these reforms to the informal sector.
𝑍𝑍𝑖𝑖 in equation (1) is the set of other controls in our estimating equation, such as the initial value of the dependent variable, the share of female employment in total employment in the given industry i or the change in this share over the considered period. 𝜀𝜀𝑖𝑖 is the i.i.d. error term.
𝛽𝛽 is the coefficient of interest to us. A change in reform is defined in such a way that it represents an increase in competition. For example, for trade liberalization reforms, we define our explanatory variable as a decline in tariffs or ERP, while in the case of de-reservation reforms, we measure the increase in the share of de-reserved products. Theory predicts 𝛽𝛽 to be negative with respect to segmentation because an increase in competitive forces is likely to reduce the extent of segmentation. We next move to describing female activity and segmentation

19
patterns in India and examining whether enhanced competition by way of domestic and international reforms has played a role in changing these trends.
V. Results
Descriptive Tabulations
Table 1a broadly describes the manufacturing and services sector data. Panel A presents the raw count of observations available for the years 2001, 2006 and 2010 in both the manufacturing and the services sectors. The services sector is officially unorganized, including its largest establishments, but we proxy an “organized services” sector using the same definition as present in manufacturing (more than 10 employees) so that we can compare the trends in the establishment size distribution of services with that of manufacturing.34 For the unorganized sector in both manufacturing and services, we additionally present the observation count of female-owned plants.35 Panel B applies sample weights to these observations to estimate the total number of plants in the Indian economy within these broad categories. Panel C presents the estimated employment levels by the presented groups, while Panel D provides estimates of the value of the total output by the categories shown in the table. Finally, Panel E records the district count for the manufacturing and services sectors where female-owned plants are observed.
The table reveals several interesting features with regard to female ownership of establishments in manufacturing and services. (i) The share of female-owned plants in informal manufacturing is larger than that in services. For example, in 2010, 39% of total plants in unorganized manufacturing and 9% of total plants in services are female-owned. This partially explains why the share of employment in female-owned plants in unorganized manufacturing is much larger than that in services. (ii) The share of female-owned plants in the unorganized manufacturing sector witnessed a considerable increase from 27% in 2001 to 38% in 2006 but stagnated thereafter (Panel B). This pattern holds true for employment in female-owned plants as well, where the share of employment in female-owned plants spiked from 17% in 2001 to 25% in 2006 (Panel C). By comparison, plant count and employment shares among female-owned plants in the services sector recorded only a marginal increase of less than 1% since the first survey in 2001. (iii) The output share of female-owned plants remains low and hovers around 8% and 6% in unorganized manufacturing and services, respectively. 34 Although we refer to establishments with more than 10 employees as “organized,” most private sector services enterprises, whether small or large, are officially in the unorganized sector because services establishments in India are not officially required to register under the Indian Factories Act, 1948. An alternative approach could be to disaggregate services into own-account enterprises (OAE) and establishment enterprises (EE) with the former representing the plants that operate without any hired workers on a regular basis, while the latter refers to those that employ them. While the OAE are clearly informal plants, EE could potentially include both informal and formal sector enterprises. 35 As noted earlier, this information is not available for organized manufacturing. Although we can identify the gender of the owners in “organized” services, these larger establishments account for barely 2% of all plants, so we do not present the details here for the sake of consistency with the manufacturing sector.
20
Panel A of Table 1b shows the gender composition of employees among the categories presented in Table 1a, while Panel B calculates their respective shares. The table suggests that: (i) In 2010, female employees make up 31.5% of total employment in manufacturing and 27% in services. (ii) The share of females in manufacturing employment increased only marginally since 2001, while that in services increased substantially by 12% from 2001 to 2006. (iii) Of the total employment in manufacturing and services, manufacturing absorbs about 55-60% of labor. Although manufacturing employed 71% of the female workforce in the two sectors in 2001, this share has declined to 56% in 2006, suggesting that more female workers are finding services to be a better or more available employment avenue than manufacturing. (iv) There is a clear pattern of gender segmentation in both manufacturing and services. For instance, in unorganized manufacturing an average of 90% of employees in female-owned business are females, while this share is 81% in the case of services. (v) It is even more striking to note that in spite of the competitive reforms that India has undertaken, this pattern of gender based segmentation has in fact become more accentuated over the years. For instance, the share of female employees in female-led informal manufacturing plants increased from 88% in 2001 to 93% in 2010. In the case of services, the share of female employees in women-led establishments increased from 75% to 87% during the same period. Likewise, the share of male employees in male-owned businesses has increased from 80% to 86% in unorganized manufacturing.
Tables 2a and 2b present the state level trends pertaining to the participation of women in manufacturing and services, respectively. These tables suggest that in both manufacturing and services, Andhra Pradesh, Tamil Nadu and West Bengal are among the states that have the highest number and shares of female-owned plants, while Bihar and Assam are the states with the lowest shares of female-owned plants. It is perhaps surprising that the nation’s capital, Delhi, has the lowest share of female-owned establishments in manufacturing. Its position in services sector is only slightly above the national average.
Not surprisingly, the states that have the highest count and shares of female entrepreneurs are also the states with highest count (and shares, shown in the continued section of Tables 2a and 2b) of females in workforce, be it manufacturing or services. This pattern could be associated with the some of the economic, social and policy traits of the state. For example, two out of the top four states with the highest count of women employed in manufacturing are from South India (Tamil Nadu and Andhra Pradesh). In the case of services, it is again the states from South India that account for large employment count (and shares, shown in the continued sections of Tables 2a and 2b) in female participation in economic activity.
To explore whether richer states have characteristics that promote higher ownership of plants, Panels A and B of Figure 1 plot the GDP per capita in 2000 against the corresponding share of female-led plants in unorganized manufacturing (Panel A) and services (Panel B). Although there appears to be no relationship between female entrepreneurship in the unorganized manufacturing sector and the per capita income of the state, the ownership of plants in the services sector has a marginally positive association to the level of per capita income of the state.

21
Is the gender gap in female ownership converging or widening between leading and lagging states? To assess this, Panels C and D in Figure 1 plot the growth in the state’s female-ownership share in informal manufacturing and services, respectively, against its per capita GDP in 2000. The slightly positive slope of the plots in Panels C and D suggest that the states with higher income have, to a certain extent, displayed higher growth in shares of female-led plants. Thus, the gap in female-led plants has been somewhat widening between the leading and lagging states. The subsequent sections of this paper will refine this picture and analyze this growth in terms of distances from big cities and the spatial impact of competition through investments in infrastructure.
The continued sections of Tables 2a and 2b suggest that the states with higher employment of women or those with the highest shares of female-led plants are also among the most segmented when it comes to employing workers of the same gender. Figures 2a and 2b graph varying measures of gender segmentation to assess the segregation of employment in informal manufacturing and services, respectively. Plotting the average share of female employees in a state against the average share of female-owned establishments, Panel A in Figures 2a and 2b show that a larger share of female-owned plants in a state is associated with higher labor force participation among women in both informal manufacturing as well as in services. This is a first suggestion that female-led establishments perhaps offer greater opportunities for other women to engage in their ventures.
Panel B of Figure 2a, which plots the extent of segmentation in female-led establishments against the share of female-owned plants in a state, confirms the hypothesis for informal manufacturing that female-owned plants tend to hire more female workers and that this segregation of employment by gender is more acute in states that have a higher share of female-owned plants. Segmentation in services is, however, less acute relative to unorganized manufacturing. Panel B of Figure 2b suggests that, relative to unorganized manufacturing, segmentation in female-owned plants in the services sector is mostly non-responsive (or, at best, slightly negatively related) to the share of female-led establishments. The share of female-led establishments, however, has a negative association with the segmentation in male-led plants (Panel C in Figures 2a and 2b), thereby suggesting that higher share of female-led plants in a state is associated with a lower segmentation in male-led plants.
We also correlate gender segmentation in a state with the share of women in its labor force. Panel D in Figures 2a and 2b plots the share of female employment against the state’s gender segmentation among female-owned plants, while Panel E does the same for segmentation in male-led businesses. These plots suggest that while higher labor force participation among women engenders greater state level segmentation among female-led plants, it is correlated with lower segmentation in male-led plants. Thus, when women hit the labor market, they are absorbed by both female-led and male-led establishments, but proportionally more so in the former type. This is true for both informal manufacturing as well as services, although the strength of this association is far weaker in services.

22
Panel F in Figure 2a examines the relationship between segmentation in male-led plants with those that are led by females in informal manufacturing, while Figure 2b repeats the same for services. This plot suggests that there is a negative relationship between segmentation in female-led plants and those that are led by males. When female-owned plants are more segmented, male-owned plants tend to be less segmented. This correlation between segmentation in female-owned plants and male-owned businesses in the case of services is much weaker than that observed in informal manufacturing.
Figure 2c plots the state level correlation between female activity across the informal manufacturing and services sectors. Panel A suggests that there is a positive correlation between female entrepreneurship shares in the two sectors, while Panel B shows a significantly positive correlation between the state level female labor force participation shares in manufacturing and services. Further, we find that the state level segmentation in female-owned (Panel C) and male-owned establishments (Panel D) in the two sectors is also positively correlated, although the strength of this association is higher among male-owned plants. These plots are indicative of certain underlying state-specific traits that dictate not only the participation of women in labor force but also their attitudes in hiring decisions among male and female entrepreneurs.
We next study the pattern in economic participation and gender segmentation by industry. Tables 3a and 3b present the 2-digit industry level break up of female participation in entrepreneurship, employment and segmentation in manufacturing and services, respectively. Among manufacturing, tobacco products, wearing apparel and textiles attract the largest count and share of women entrepreneurs, perhaps because globally these industries are known to impose lower requirements on physical labor. Among services, it is the education, sewage, refuse disposal, sanitation and financial intermediation services that attract the largest share of female proprietors. These are broadly also the industries that attract the largest count and shares of female employees (the latter is shown in the continued section of Tables 3a and 3b).
Are women proprietors pre-dominantly in low-paying industries? To show how differences across ownership shares in female-led plants vary by industry level wages, Figure 3a plots the average 2-digit industry wages in 2010 against the female ownership shares in 2000. Panel A presents the case for unorganized manufacturing, while Panel B repeats the same for services. Panels C and D plot the growth in the share of female-led plants in informal manufacturing and services, respectively. Panel A suggests that there is a strong negative relationship between average industry wages and the share of industry in female-led plants in the unorganized sector, and Panel C finds that the concentration of female entrepreneurs in low-wage industries is growing over time. Thus, women entrepreneurs in unorganized manufacturing are more dominant in industries that pay lower average wages and the growth in women entrepreneurs is higher in such industries. By comparison, this association between the share of female-owned plants and average industry wages in the services sector is only mildly negative when all

23
industries are considered (Panel B).36 Looking at the growth in the share of female-led plants in the services industries in Panel D, when all observations are considered, the differences between female entrepreneurs in high wage industries and those in low wage industries appear to be narrowing over the study period.
Tables 3a and 3b suggest that industries that show higher rates of female entrepreneurship and employment are also broadly the industries that show the highest segmentation in terms of female employees being matched to female owners. If people prefer to work with their own “types” then in the case of India, gender of the owner overwhelmingly predicts the gender of the employees. This is also true for male-led plants, where, for instance, radio, television, and communication equipment, other transport equipment and fabricated metal products are among the most segmented in informal manufacturing, while in the case of services, male-led plants in water transport, land transport and research and development tend to employ the largest share of male workers. Although segmentation by gender is increasing in most industries, it is remarkably heightened in female-led plants in the basic metals and motor vehicles, trailers and semi-trailers segments of informal manufacturing, while within services it has increased the most in postal and telecommunications and real estate services.
Figure 3b plots segmentation patterns in India at the 2-digit industry level for the informal manufacturing sector, while Figure 3c does the same for the services sector. Panel A in both figures confirms a strong association between female entrepreneurship in an industry and female participation in the labor force. As with the state level plots (in Figures 2a and 2b), the industry level plots in Figures 3b and 3c also suggest that gender segmentation in services is less acute than in unorganized manufacturing. For instance, although we note a positive relationship between gender segmentation and the share of female-led establishments in Panel B, and likewise in Panel D with the share of females in total employment, the slope of this plot is steeper for unorganized manufacturing than for that in services. Further, we observe a negative industry level correlation between segmentation among male-led plants and the share of female-led establishments (Panel C) and likewise, with the share of females in total employment (Panel E). Finally, Panel F suggests a negative association, at the 2-digit industry level, between segmentation in male-owned plants with that in female-owned plants. However, this relationship is weaker in the services sector than in informal manufacturing.
Table 4 describes the spatial layout of the gender dimension of economic activity. The table presents the share of female-led plants, their share in employment and segmentation by gender of owners in regions around the seven largest cities in India: Mumbai, Kolkata, Delhi, Bangalore, Chennai, Hyderabad and Ahmedabad. Using distances between district centroids, we define nine distance bands in intervals of 100 km stretching from 0-100 km to 800+ km. In Appendix Table
36 We infer these correlations to be rather weak because, in unreported robustness checks, scatter plots excluding the outliers actually suggest this relationship to be slightly positive.

24
1, we instead consider the distance to the three largest cities: Mumbai, Kolkata and Delhi. The latter set of three largest cities is referred to as “big-3”, while the group including the seven largest cities is denoted “big-7”. Panel A in Table 4 presents female activity and gender segmentation around the big-7 cities (and big-3 in Appendix Table 1) for the unorganized manufacturing sector, while Panel B repeats the same for services. Table 4 reveals that the share of female owned businesses declines with distance from big-7 cities, although this pattern is slightly muted in informal manufacturing for districts located within 500 km of the big-7 cities. In terms of female employment share, we note a declining average share with distance from big-7 cities in the services sector, while we do not observe any definitive spatial location pattern in the case of unorganized manufacturing. On the other hand, Appendix Table 1 suggests that distance to big-3 cities does not influence the share of female activity, whether measured in terms of ownership share or employment share. Although gender segmentation is higher for female-owned plants than male-owned plants in the unorganized manufacturing sector and vice-versa for the services sector, we do not observe any decisive spatial pattern either with respect to the distance of districts from big-7 (Table 4) or big-3 cities (Appendix Table 1). The first six columns in Table 5 present an account of gender segmentation across establishment sizes, where segmentation is measured using our owner-based metrics. As this measure of segmentation can be calculated only for the unorganized manufacturing and the services sectors, these columns exclude the extent of activity and segmentation in organized manufacturing. We note that for all size bands, segmentation has, in general, increased from 2001-2010. Further, irrespective of whether segmentation is based on female-owned or male-owned establishments, it is larger for small plants. Segmentation in female-owned plants decreased more rapidly by establishment size during 2001 and 2006 but by 2010 the pattern across establishment size is similar to that observed in male-owned establishments. The next six columns of Table 5 present the alternative segmentation metric that views segregation through the gender of an average employee. The advantage of using this metric is that we can additionally include segregation among the larger organized plants in Indian manufacturing. In general, this metric suggests that segmentation is larger for an average male employee vis-à-vis an average female employee across all size bands. Said differently, on average, a male employee is more likely to be working with a male co-worker than a female employee is to be working with a female co-worker. This measure of segmentation is also at its peak in smaller plants, however, for female employees it declines with increase in plant size up to mid-sized plants (3.5-9.5 employees). Beyond this size range, the extent of female segregation remains roughly constant. Segmentation among male employees in manufacturing does not change much across the various size bands. In services, we observe a marginal but smooth decline across size bands in the services sector. In unreported tabulations, we find that

25
segmentation for the combined group of employees follows a pattern similar to that observed among male employees in each sector. Relatedly, in Appendix Table 2 we offer more detailed disaggregation by establishment size to confirm that the declining pattern in segmentation by establishment size is not simply a statistical artifact. The table shows that for every employee increase in plant size, we systematically observe decline in segmentation, thereby suggesting that the observed pattern is not something that a random allocation would predict. Comparison Points The gender segmentation reported above is visibly strong, and several comparisons can help quantify further. The most straightforward comparisons can be developed for the segmentation metrics that view segregation through the gender of an average employee and their surrounding workforce. In Table 5, we observed that the manufacturing workforce surrounding the average female rose from being 71.8% female in 2001 to 81.1% female in 2010, while a similar increase from 87% to 90.4% happened for men within manufacturing across the same period. A first comparison point would the level expected if everyone sorted purely at random. This baseline measure depends upon the gender share of the workforce. From Table 1b, women rose from 29.7% to 31.5% of the manufacturing workforce across 2001 to 2010. Thus, while women would have been expected to match with a random gender composition of about 30%, the true composition was more than double at about 75%. Likewise, while men would have expected a 70% random match to their own gender, the true composition was around 90%. For services, the same is true. Segmentation rapidly rose from 67.1% for women in 2001 to 82.4% in 2010 using this metric, during a period where female worker shares rose from 17.6% to 27.3%. Thus, both the levels and growth in segmentation outpaced what was expected from random assignment. Likewise, male segmentation remained very high at 93% throughout the study timeframes, while the expected segmentation would have fallen from 82.4% in 2001 to 72.7% in 2010. Beyond this simple view of aggregate sorting, comparison points across the establishment size distribution and by gender of business owners are more complicated. This is because one encounters small numbers of employees (so segmentation levels have natural jumps as one adjusts integer counts of employees) and that one employee, by definition, is being assigned a gender in the categorization of the plant. For example, if looking at female-owned firm with two reported workers, the observation that the firm is owned and operated by woman places numerical limits on the gender balance internally and makes it substantially more likely than random that women will be working together.

26
To provide benchmarks for these more complicated settings, we conduct Monte Carlo estimations that quantify differences across the establishment size distribution in how much extra gender segmentation exists compared to the random baseline for our owner-based metrics. These simulations assign ownership based upon the first employee draw and they are tailored to match the overall gender balance in India by sector. Within each simulation, we randomly build 1000 firms by each size category and calculate the observed gender segmentation if owners and workers sorted at random. Conducting 1000 such simulations, we obtain expected values and variances for workplace segmentation levels across the establishment size distribution. Figure 4 documents the results. Panels A and B present our general female and male segmentation indices—how similar is the gender composition of a firm’s workforce to a focal employee—by firm size and also their simulated counterparts. The dark red bars are the actual segmentation levels, while the light blue bars represent predicted segmentation based upon India’s workforce composition and firm size. For women, segmentation levels are highest among the smallest firms and largest firms. By contrast, Monte Carlo simulations predict a uniform decline in firm size; for the largest firms, the expected segmentation levels are basically the same as those contemplated above for the economy as a whole. This pattern is quite interesting as it suggests root causes of abnormal segmentation are most prevalent among small enterprises and very large establishments, which have different economic properties and competitive environments. Panel B, by contrast, shows that gender segmentation for men is consistently higher than anticipated by the Monte Carlo simulations but also uniformly declining in firm size. Panels C and D turn to our estimations of segmentation that focus on the match of employees to the gender of the owner. We can only calculate these metrics for establishments with ten employees or fewer. It is, of course, possible to simulate expected levels of owner-based segmentation for larger establishments, and we do this extension so that we have baselines than are comparable to Panels A and B. Owner-based segmentation for women-owned enterprises shows its greatest deviation from expectation for the smallest firms of 1-3 employees, with deviations shrinking substantially for larger establishments. By contrast, male-owned establishments have a more modest deviation from baseline for the smallest firms, but this appears to widen somewhat for larger establishments. Said differently, it appears women business owners are increasingly likely compared to random hiring to pull workers of both genders while scaling small enterprises, while men have a greater capacity to continue scaling with a focus on male employees. We have also investigated a comparison point to the United States using the Longitudinal Employer-Household Dynamics (LEHD) database. The LEHD is a confidential database maintained by the U.S. Census Bureau. Sourced from required state unemployment insurance reporting, the LEHD provides linked employer-employee records for all private sector firms in 29 covered states. Among the information included for each employee is the worker's quarterly
27
salary, age, gender, citizenship status, and place of birth. This wealth of information allows us to observe directly the establishment level workforce composition by gender in a manner similar to the Indian data. (By comparison, the LEHD does not record the gender of the business owner.) Kerr et al. (2015) provide additional details. Our LEHD estimates are not disclosed, and we only provide an approximate benchmark in this first report for our India data. In the United States, both men and women tend to match with a workforce that is approximately 60% their own gender during the 2001-2010 period. This shows quite limited variation over states, and the time trend is overall very weak. The United States has roughly equal employment of both genders, so the expected shares are about 50%. Thus, the United States displays a much more modest and stable level of segmentation compared to India at the establishment level. Ideally, researchers in other countries with administrative data of workforce gender can also provide comparison points. Correlates of Female Activity in India Table 6a presents our first district level regression results that estimate the correlates of female participation in economic activity and gender segmentation, measured as the average over the period 2001-2010. The estimations in Tables 6a and 6b use information on 421 districts in India, are weighted by log district population and report robust standard errors. Table 6a suggests that a higher female-to-male ratio in population is highly correlated with heightened activity among females, including higher segmentation in female-led plants and lower segmentation in male-led plants. A larger demographic dividend, measured as the ratio of working age population relative to non-working age population, is also associated with increased activity and lower segmentation, especially in male-led plants. In the case of services sector, however, a higher working age population is significantly correlated with higher segmentation in female-led plants. Another difference between unorganized manufacturing and services is in the role of technology. Interestingly, the proportion of plants using the Internet in the services sector is associated with larger female employment share and lower segmentation in both the male-led and the female-led establishments. Comparably, we find null effects of Internet usage among plants on female based activity or segmentation in unorganized manufacturing. Besides these, most other district level traits are not found to be correlated with either the participation of women in manufacturing and services or gender segmentation. The result continues to hold across a wide range of specifications and sample restrictions (e.g., young plants, high-wage plants and so on). Table 6b repeats the set-up in Table 6a using the change in female activity over the period covering 2001 to 2010 as the dependent variable. In addition to the listed covariates, these regressions also control for the initial value of the dependent variable. The most interesting feature of this table is that the state of electronic infrastructure and technology, as measured by the share of plants using the Internet, is strongly correlated with the decline in female

28
participation in manufacturing activity and the concurrent rise in services. Further, the use of Internet among plants is also associated with a decline in segmentation in both manufacturing and services. Physical infrastructure, measured as the local district level composite comprising of measures on the quality of roads, telecom, electricity and safe drinking water, is also associated with heightened shares of women-led enterprises, particularly in informal manufacturing. In both the sectors, physical infrastructure is also significantly and positively correlated with the female employment shares and a decline in segmentation among male-led establishments. It is, however, associated with increased segmentation among female-led plants. These results are broadly robust to including only young plants or only plants paying higher wages, or to excluding some of the explanatory variables such as the spatial fixed effects measured via the distance from the biggest cities. District View of Competition: GQ Analysis The fact that local district level physical infrastructure is correlated with female activity and reduced segregation by gender in primarily male-led plants provides a basis for our next exercise regarding the spatial organization of female activity around the GQ highways. The internal infrastructure of India limits the scope of competition as it can be difficult to move products and services efficiently, and local barriers and corruption can prevent entry. The GQ network, totaling a length of 5,846 km, connects the four major cities of Delhi, Mumbai, Chennai, and Kolkata. Beyond the four major cities that the GQ network connects, the highway touches many smaller cities like Dhanbad in Bihar, Chittaurgarh in Rajasthan, and Guntur in Andhra Pradesh. The GQ upgrades began in 2001, with a target completion date of 2004. In total, 23% of the work was completed by the end of 2002, 80% by the end of 2004, 95% by the end of 2006, and 98% by the end of 2010.37
Prior work, such as Datta (2011) finds evidence of improved inventory efficiency and input sourcing for manufacturing establishments located on the GQ network almost immediately after the upgrades commenced. Likewise, Ghani, Goswami and Kerr (2016a) demonstrate that the GQ highway project had an immediate and lasting impact on economic outcomes such as output, employment, establishment count and productivity for the formal sector of Indian manufacturing. Specifically, Ghani, Goswami and Kerr suggest that the GQ upgrades increased organized manufacturing output by 15%-19% over the 2000-2010 period. For reference, Indian manufacturing output doubled during this period, and 37% of this growth occurred in the non-nodal districts within 0-10 km of the GQ network. Their estimates thus credit nearly a fifth of the organized sector growth to better connectivity provided by the enhanced GQ network, with all of that impact concentrated in adjacent districts. Using these results that point to a heightened
37 Differences in completion points were due to initial delays in awarding contracts, land acquisition and zoning challenges, funding delays, and related contractual problems.

29
competition in districts located close to the GQ highway as a starting point of our study, we examine whether the GQ upgrades shifted the gender balances through the competition channel.
To this end, we descriptively evaluate if establishments located in districts that were in close proximity to the highway (i.e., areas where Ghani, Goswami and Kerr show pre-post productivity enhancements) are linked to a shift in the gender segmentation of their workforce. Table 7 presents the share of female-led plants, the share of women in employment and segmentation by gender of owners. This table includes an analysis of the unorganized manufacturing and services sectors, as information on the gender of owners is not available for organized manufacturing. Appendix Tables 3a and 3b present the results for segmentation viewed through the lens of an average employee, where Appendix Table 3b includes the break-up of activity for organized manufacturing as well. Following Ghani, Goswami and Kerr (2016a, 2016b), we measure female activity and segmentation in the extended distance bands: 0-10 km, 10-50 km, 50-100 km, 100-250 km and over 250 km. The table records not only female activity and segmentation for each year but also notes the change in these measures from 2001 to 2010. Panel A presents the allocation of gender-based activity around the GQ for unorganized manufacturing (in Appendix Table 3b, Panel A presents organized manufacturing), while Panel B repeats the same for services (in Appendix Table 3b, Panel B presents organized services).
Table 7 suggests that as the distance of non-nodal districts from the GQ highways increases, female participation in informal manufacturing and services activity is mostly increasing, and segmentation among female-owned plants is sharply decreasing, especially so in the districts lying in the 10-50 km range. This is opposite to the expectations of Becker’s theory on the impact of competitive forces on taste-based discrimination. The GQ had a significant and a longer term economic impact on the organized sector (Ghani, Goswami and Kerr, 2016a), however, Ghani, Goswami and Kerr (2013, 2016b) show that the unorganized sector had a very limited response to these highway upgrades. Therefore, one may argue that competitive pressure did not apply to unorganized plants in the manufacturing sector.
In Appendix Tables 3a and 3b, we also consider female activity and gender segmentation, as viewed from the perspective of an individual employee, among unorganized and organized sectors, respectively. The gender segmentation index in the appendix tables measures the percentage of an individual's fellow employees who are of the same gender. This measure of segmentation allows us to consider information on the organized sector, where the economic impact of GQ upgrades has been shown to be substantially large. For both informal and formal manufacturing sector, these tables suggest that segmentation among employees did not decrease substantially in districts lying within 0-10 km of the GQ highway where Ghani, Goswami and Kerr (2016a) recorded heightened activity. In fact, we observe a sharp decline in segmentation in

30
both formal and informal manufacturing in districts lying 10-50 km from GQ highways, where the earlier study quantifies null effects of GQ upgrades.38
Alternatively, the result on increase in female activity and decreasing segmentation (by gender of the owner or with respect to the employee-based measure) with increase in distance from the GQ could be driven by the fact that the districts such as those lying in the 10-50 km range of the GQ highway are rather different from those that are located closer to the highway. To follow our hypotheses, we conducted a district level regression analysis similar to that in Tables 6a and 6b, first including all plants and then, in an alternative specification, including only young or incumbent plants. Our unreported regression results suggest that GQ highways have insignificant impact on female-based activity in either the manufacturing or the services sector, and that most district traits did not have any role in explaining these results. Finally, the results on higher female activity and decreased segmentation in districts away from GQ highways could perhaps be due to substantial increase in entry relative to the competitive response of incumbent plants. The tabulations in Appendix Table 4 suggest that the pattern of female activity in terms of entrepreneurship and shares in employment, as well segmentation by gender of owners among young plants (that is, plants that are less than 4 years of age), along the GQ highway is not very different from the full sample of plants. Industry View of Competition: Trade/De-reservations Reforms Tables 8a-8c show the association between female activity/segmentation and industry level trade liberalization reforms as measured through changes in output tariffs, input tariffs and effective rate of protection, respectively. As mentioned in Section IV, these regressions use information on the manufacturing sector because the changes in industry level tariffs only pertain to the manufacturing industries. Since large firms are known to participate most in international trade (e.g., Melitz, 2003), most studies analyze the impact of trade reforms on the formal sector only. Nonetheless, for our purposes we can include both the formal and the informal manufacturing sectors because trade liberalization is also known to drive reallocation of labor between the two sectors (e.g., Meñezes-Filho and Muendler, 2011). Panel A in each of Tables 8a-8c shows the impact of a decline in the trade protection index, measured from 1987 to 2000, on the change in the log value of total employment, Panel B presents the results on the change in the log value of female employment, while Panel C is the regression of the change in female employment shares. As we must necessarily include the formal sector in this regression analysis, we can only take advantage of the segmentation measures viewed from the perspective of the employees. Panels D, E and F present the results on the change in segmentation among male, female and all employees, respectively. The change in these dependent variables is measured from 1994-2010.
38 Following Ghani, Goswami and Kerr (2016a), we also attempted an impact evaluation of GQ upgrades on female activity and employee based segmentation in a regression framework but mostly found null results across the board.

31
We measure trade reform in terms of a decline in tariffs such that liberalization would be equivalent to an increase in competition. Estimations in Tables 8a-8c include 50 industry level observations that are weighted by log industry employment. All change variables are winsorized at the top 5% and bottom 95% level and transformed to unit standard deviation. Estimates in the tables report robust standard errors. Starting with Column 1, our baseline estimate controls for the initial value of the dependent variable, while Column 2 deviates from the baseline specification in Column 1 in that it drops the industry employment weights. Column 3 drops the initial level of the dependent variable from the baseline estimation. Column 4 adds the initial female employment share for the industry in the baseline specification, while Column 5 adds to the specification in Column 4 the change in female employment shares. For most specifications in Tables 8a-8c, we do not observe a significant effect of changes in tariff reforms on industry size or female activity, measured in Panels A-C across all three alternative indices of tariff reforms. In the specification that drops the initial value of the dependent variable, we observe that a decrease in output tariff is associated with a decline in the share of female employment (Panel B, Column 3 in Table 8a), which is consistent with the sluggish response of female employment intensity noted in Banerjee and Veermani (2015). Decline in both input and output tariffs in this specification is also associated with a concurrent decline in segmentation among male employees (Panel D, Column 3 in Tables 8a and 8b). Decline in tariffs, especially those on intermediate inputs, is also strongly associated with an increase in segmentation among female employees (Panel E in Table 8b). This could perhaps be a result of greater entry at the bottom in terms of a larger number of females working in their own establishments or due to other factors not captured by our regression framework. Finally, the result on the change in segmentation for all employees points to a mostly negative correlation with enhanced competition through trade liberalization (Panel F, Column 3 in Tables 8a-8c). Overall, we do find some evidence consistent with theory when measuring the impact of trade liberalization on the direction of change in segmentation among male employees. However, the observed effect of competition in affecting segmentation among female employees is not in agreement with what theory would predict. We next examine the association between an increase in the share of unreserved of products for SSI and female activity/segmentation for Indian manufacturing. An increase in the extent of de-reservation corresponds to an enhanced level of competition through a decline in entry cost, and theory would predict a lower extent of segmentation, per se. Replicating the set-up in Tables 8a-8c with the change in the share of unreserved products for SSI from 1999 to 2009 as a dependent variable, Table 9 suggests a positive association between de-reservation reforms and overall activity (Panel A), the extent of female participation (Panel B) and the share of female employment (Panel C). De-reservation is also correlated with a decline in overall segmentation

32
(Panel F), which appears to be mainly driven by a decline in segregation among male employees (Panel D). This is anticipated given that male employees comprise about 70% of the total manufacturing employment (Table 1b, Panel B). Segmentation among female employees, on the other hand, is positively correlated with de-reservation reforms (Panel E), although for the reason noted above its impact is weak in affecting the overall segmentation among employees (Panel F). Figures 5a and 5b plot the correlations noted in Tables 8a-8c and 9 for segmentation among male and female employees, respectively. Panels A, B and C measure the correlation with respect to trade reforms as measured by output tariffs, input tariffs and ERP, respectively, while Panel D measures the association with respect to de-reservation reforms. The slopes of the plots in Panels A through D of Figure 5a are mildly negative, suggesting that both trade and domestic industry level reforms are associated with a decline in segmentation among male employees. By comparison, the slope of the plots in Panels A through D of Figure 5b is positive and most noticeably so in the de-reservation plot of Panel D, thereby suggesting a positive association between enhanced industry level competition and segregation among in female employees. VI. Conclusions The international community, under the aegis of the United Nations, has been pursuing gender equality since 2000, which now features as one of the primarily sustainable development goals (SDG). In this regard, empowering women to engage in productive employment is critical to achieving not only this SDG but is also pivotal to economic growth, poverty eradication, reducing child mortality, improving maternal health and attaining universal primary education. Gender inequality, in any society, is deeply rooted in attitudes, institutions and market forces. Social norms and attitudes in India have a long history of not affording women equal economic opportunities and social status.
This paper studies the pattern of female activity and gender segmentation in the Indian manufacturing and services sectors. Our results suggest a clear pattern of gender segmentation in both manufacturing and services, where, for instance, about 90% of employees in female-owned business in unorganized manufacturing are females. Although India has undertaken many competitive reforms since the turn of the century, this pattern of gender based segmentation has not subsided over the years. Beyond this central result, we find that the share of female-owned plants in informal manufacturing is not only larger (39%, in 2010) than that in services (9%) but has also recorded a significant increase since 2001. Employment of females in services, although still lower than manufacturing in our sample, has recorded a significant increase since 2001. Finally, our descriptive work also sheds light on divergence in state and industry level patterns in female participation in entrepreneurship and employment as well as gender segmentation.
When examining the effect of competition on female participation in economic activity, our results with respect to investments in GQ highways are rather weak. In fact, as opposed to what

33
theory would predict, we find that districts located farther from the highway witnessed decline in segmentation relative to those located close to GQ. As for trade liberalization reforms, we do observe a limited but expected decline in segmentation among male employees, but the evidence on segmentation among female employees is opposite to what theory would predict. Finally, de-reservation reforms that reduced the share of products reserved exclusively for small scale industries are deeply associated with increased activity, especially for females. It is also strongly correlated with decline in segmentation among male employees. Most research studying the labor market impacts of international trade differentiates workers by their education or skills. Recently some studies have included gender dimension by essentially measuring participation of women or through wage differentials. Gender segmentation, however, is a further dimension through which trade liberalization can affect labor market outcomes. Likewise, the gender dimension of domestic industry reforms and large scale investment in infrastructure projects is rather under-studied. Our study suggests that globalization and trade policy made a limited contribution towards India’s convergence in gender segmentation, while domestic pro-competitive reforms are strongly associated with lower segmentation among male employees. Thus, policies targeting the domestic competitive environment are perhaps more effective in mitigating discrimination in the labor market.
Developing countries around the world are evaluating and adopting pro-competitive policies in the hope of promoting growth. Such policy packages originate in different economic spheres ranging from trade and regulatory reforms, infrastructure investments, urban land-use policies such as zoning laws, reforms on labor market rigidities, and so on. The competition induced from such policies can generate economic growth through higher productivity, reduced factor misallocation, and increased factor involvement (e.g., rising female labor force participation). Nonetheless, it is less clear if such policies achieve their goals and, if not, where they stumble. India is simultaneously a leader in promoting women's participation in government but also a laggard in gender issues in the workplace. Its growth rate for manufacturing has been disappointing compared to its potential. Our work dissects many features of these gaps and also quantifies the linkages that exist. It helps understand which regulatory reforms are particularly effective in reducing gender segmentation, so that other regions within India, or nations outside of India, can learn how to make their efforts count the most. By way of such reforms, developing countries have an opportunity to not only improve the allocative efficiency of factors but also create an environment of equal opportunity and growth.
Our work considers the impact on gender segmentation and participation of women emanating from three of the many pro-competitive policies that India has undertaken in the last two decades. There are other policies such as political reservations for women, changes in labor regulations,39 and those pertaining to inheritance rights on property, which could be linked to 39 For instance, Besley and Burgess (2004) analyze the effects of state level amendments in labor regulations on manufacturing outcomes in India.

34
segmentation in the Indian economy.40 Thus, future work in this field could include competition induced through other policies as well. Further, our work points to an interesting correlation of technology, as measured by Internet penetration, with gender segmentation in the services sector. We do not delve deeper into this association, and perhaps future studies could seek to understand the differences in the association of technology with gender segmentation in manufacturing versus services.
References
Amin, M. 2010. Gender and informality. World Bank Enterprise Note # 16.
Amiti, M. and J. Konings. 2007. Trade Liberalization, Intermediate Inputs and Productivity. American Economic Review 97(5): 1611–1638.
Aguayo-Tellez, E., J. Airola, C. Juhn and C. Villegas-Sanchez. 2013. Did Trade Liberalization Help Women? The Case of Mexico in the 1990s. Research in Labor Economics 38: 1-35.
Albrecht, J., A. Björklund, and S. Vroman. 2003. Is There a Glass Ceiling in Sweden? Journal of Labor Economics, 21(1): 145-177.
Ardagna, S., and A. Lusardi. 2008. Explaining International Differences in Entrepreneurship: The Role of Individual Characteristics and Regulatory Constraints. NBER Working Paper # 14012
Ashenfelter, O. and T. Hannan. 1986. Sex Discrimination and Product Market Competition: The Case of the Banking Industry. Quarterly Journal of Economics, 101(1): 149-174.
Banerjee, A., E. Duflo and N. Qian. 2012. On the Road: Access to Transportation Infrastructure and Economic Growth in China. NBER Working Papers # 17897, National Bureau of Economic Research
Banerjee, A. and S. Raju. 2009. Gendered Mobility: Women Migrants and Work in Urban India. Economic and Political Weekly, 44(28): 115-123
Banerjee, P. and C. Veermani. 2015. Trade Liberalisation and Women's Employment Intensity: Analysis of India's Manufacturing Industries. Indira Gandhi Institute of Development Research (IGIDR) Working Paper #018
Becker, Gary S. 1957. The Economics of Discrimination. Chicago: Chicago University Press.
40 It was only in 2005 that the government of India amended its inheritance laws to allow females an equal right to inherit their parent’s land and property.
35
Bernard, A., S. Redding, and P. Schott. 2006. Multi-Product Firms and Trade Liberalization,’’ NBER working paper # 12782. National Bureau of Economic Research.
Besley, T. and R. Burgess. 2004. Can Labor Regulation Hinder Economic Performance? Evidence from India. Quarterly Journal of Economics 119(1): 91-134.
Bhalla, S. S., and Kaur, R. 2011. Labour Force Participation of Women in India: Some facts, some queries. LSE Asia Research Centre, Working Paper # 40.
Black, S., and E. Brainerd 2004. Importing Equality? The Impact of Globalization on Gender Discrimination. Industrial and Labor Relations Review, 57(4): 540-559.
Black, S. and P. Strahan 2001. The Division of Spoils: Rent-Sharing and Discrimination in a Regulated Industry. American Economic Review, 91(4): 814-831.
Bolaky, B., and Caroline Freund. 2004. Trade, Regulations and Growth,’’ World Bank Policy Research working paper # 3255.
Bollard, A., P. Klenow and G. Sharma. 2013. India's Mysterious Manufacturing Miracle. Review of Economic Dynamics, 16(1): 59-85.
Bruhn, M. 2009. Female-owned firms in Latin America: Characteristics, performance, and obstacles to growth. World Bank Policy Research Working Paper #5122.
Bussmann, M. 2009. The Effect of Trade Openness on Women’s Welfare and Work Life. World Development, 37(6): 1027-1038.
Cagatay, N., and Ozler, S. 1995. Feminization of the Labour Force: The Effects of Long-Term Development and Structural Adjustment. World Development, 23(11): 1883-1894.
Castilho, M., M. Menéndez and A. Sztulman. 2012. Trade Liberalization, Inequality, and Poverty in Brazilian States. World Development, 40(4): 821-835.
Chandra, A. and E. Thompson, 2000. Does Public Infrastructure Affect Economic Activity? Evidence from the Rural Interstate Highway System. Regional Science and Urban Economics, 30(4): 457-490.
Charles, K. and J. Guryan. 2011. Studying Discrimination: Fundamental Challenges and Recent Progress. Annual Review of Economics, Annual Reviews, 3(1):479-511.
Chattopadhyay, R., and E. Duflo. 2004. Women as Policy Makers: Evidence from a Randomized Policy Experiment in India. Econometrica, 72(5): 1409-1443.
Cooray, A., I. Gaddis and K. Wacker. 2012. Globalization and Female Labor Force Participation in Developing Countries: An Empirical (Re-)Assessment. CRC-PEG Discussion Paper 129 University of Göttingen.

36
Cragg, M., and M. Epelbaum. 1996. Why has Wage Dispersion Grown in Mexico? Is it the Incidence of Reforms or the Growing Demand for Skills? Journal of Development Economics, 51(1): 99–116.
Currie, J. and A. Harrison. 1997. Sharing the Costs: The Impact of Trade Reform on Capital and Labor in Morocco. Journal of Labor Economics, 15 (3, part 2):44–71.
Datta, S. 2011. The Impact of Improved Highways on Indian Firms. Journal of Development Economics, 99(1): 46-57.
Dhaliwal, S. 2000. Asian Female Entrepreneurs and Women in Business—An Exploratory Study. Enterprise and Innovation Management Studies,1(2): 207-216.
Donaldson, D. 2014. Railroads of the Raj: Estimating the Impact of Transportation Infrastructure, forthcoming American Economic Review
Duflo, E. 2005. Why Political Reservations? Journal of the European Economic Association 3(2): 668-678.
Duflo, E. 2012. Women Empowerment and Development. Journal of Economic Literature, 50(4): 1051–1079
Duranton, G. and M. A. Turner, 2012. Urban Growth and Transportation. Review of Economic Studies, 79 (4): 1407-1440
Duranton, G. E. Ghani, A. Goswami and W. Kerr. (2015). The Misallocation of Land and Other Factors of Production in India. World Bank Policy Research Working Paper # 7221.
Duranton, G. E. Ghani, A. Goswami and W. Kerr. (2016). A Detailed Anatomy of Factor Misallocation in India. World Bank Policy Research Working Paper # 7547.
Edmonds, E., N. Pavcnik and P. Topalova. 2010. Trade Adjustment and Human Capital Investments: Evidence from Indian Tariff Reform. American Economic Journal: Applied Economics, 2(4): 42-75.
Ederington, J., J. Minier and K. Troske. 2009. Where the Girls Are: Trade and Labor Market Segregation in Colombia. IZA Discussion Paper 4131, Institute for the Study of Labor.
Elson, D. 1999. Labour Markets as Gendered Institutions: Equality, Efficiency and Empowerment Issues. World Development, 27(3): 611-627.
Estrin, S. and T. Mickiewicz. 2011. Institutions and Female Entrepreneurship. Small Business Economics, 37(4): 397-415.

37
Field, E., S. Jayachandran, and R. Pande. 2010. Do Traditional Institutions Constrain Female Entrepreneurship? A Field Experiment on Business Training In India. American Economic Review Papers and Proceedings, 100(2): 125-129.
Fontana, M. 2009. The Gender Effects of Trade Liberalization in Developing Countries: A Review of the Literature. In M. Bussolo, and R. De Hoyos, Gender Aspects of the Trade and Poverty Nexus: A Micro-Macro Approach. Palgrave Macmillan.
Fernandes, A. 2007. Trade Policy, Trade Volumes and Plant-Level Productivity in Colombian Manufacturing Industries. Journal of International Economics 71(1): 52–71.
Gaddis, I. and J.Pieters. 2014. The Gendered Labor Market Impacts of Trade Liberalization: Evidence from Brazil. World Bank Policy Research Working Paper # 7095.
García-Santana, M. and Pijoan-Mas, J. 2014. The Reservation Laws in India and the Misallocation of Production Factors. Journal of Monetary Economics, 66(0): 193-209.
Goldberg, P., A. Khandelwal, N. Pavcnik and P. Topalova. 2010. Multiproduct Firms and Product Turnover in the Developing World: Evidence from India. The Review of Economics and Statistics, 92(4): 1042-1049.
Goldberg, P. and N. Pavcnik. 2007. Distributional Effects of Globalization in Developing Countries. Journal of Economic Literature, 45(1): 39-82.
Goldberg, P. and N. Pavcnik. 2005. Trade, Wages, and the Political Economy of Trade Protection: Evidence from the Colombian Trade Reforms. Journal of International Economics 66(1): 75–105.
Ghani, E., A. Goswami and W. Kerr. 2016a. Highway to Success in India: The Impact of the Golden Quadrilateral Project for the Location and Performance of Manufacturing. The Economic Journal, 126(591): 317-357.
Ghani, E., A. Goswami and W. Kerr. 2016b. Highways and Spatial Location within Cities: Evidence from India. World Bank Economic Review, forthcoming.
Ghani, E., A. Goswami, and W. Kerr. 2013. The Golden Quadrilateral Highway Project and Urban/Rural Manufacturing in India. World Bank Policy Research Working Paper # 6620.
Ghani, E., W. Kerr, and S. O'Connell. 2013. Local Industrial Structures and Female Entrepreneurship in India. Journal of Economic Geography, 13(6): 929-964.
Ghani, E., W. Kerr, and S. O'Connell. 2014. Political Reservations and Women’s Entrepreneurship in India. Journal of Development Economics, 108(C): 138-153.
38
Ghani, E., A. Mani, and S. O'Connell. 2013. Can Political Empowerment Help Economic Empowerment? Women Leaders and Female Labor Force Participation in India. World Bank mimeo.
Ghani, E., W. Kerr, and C. Stanton. 2014. Diasporas and Outsourcing: Evidence from oDesk and India. Management Science, 60(7): 1677-1697.
Government of India (GOI). 1997. Report of the Expert Committee on Small Enterprises. New Delhi. Available at: http://www.isedonline.org/uploads/userfiles/file/file/Report%20of%20the%20Expert%20Committee%20on%20Small%20Enterprises%20Shri%20Abid%20Hussain.pdf Hanson, G., and A. Harrison. 1999. Trade and Wage Inequality in Mexico. Industrial and Labor Relations Review, 52(2): 271–88.
Hasan, R. D. Mitra, P. Ranjan, and R.Ahsan. 2012. Trade Liberalization and Unemployment: Theory and Evidence from India. Journal of Development Economics, 97(2): 269-280.
Harrison, A. 1994. Productivity, Imperfect Competition and Trade Reform. Journal of International Economics, 36(1): 53–73.
Hellerstein, J., D. Neumark, and K. R. Troske. 2002. Market Forces and Sex Discrimination. Journal of Human Resources, 37(2): 353-380.
Heyman, F., H. Svaleryd and J. Vlachos. 2013. Competition, Takeovers and Gender Discrimination. ILR Review, 66(2): 409-432.
Hoekman, B., and S. Javorcik. 2004. Policies Facilitating Firm Adjustment to Globalization. Oxford Review of Economic Policy, 20(3): 457–473.
Holl, A. and E. Viladecans-Marsal, 2011. Infrastructure and Cities: The Impact of New Highways on Urban Growth. Universitat de Barcelona-Institut d’Economia de Barcelona Working Paper.
Iyer, L., A. Mani, P. Mishra, and P. Topalova. 2012. The Power of Political Voice: Women's Political Representation and Crime in India. American Economic Journal: Applied Economics 4(4): 165-193.
Ghosh, P. and R. Cheruvalath. 2007. Indian Female Entrepreneurs as Catalysts for Economic Growth and Development. The International Journal of Entrepreneurship and Innovation, 8(2): 139-148.
Jensen, R. 2010. Economic Opportunities and Gender Differences in Human Capital: Experimental Evidence from India. NBER Working Paper # 16021.
39
Juhn, C., G. Ujhelyi, and C. Villegas-Sanchez. 2014. Men, Women, and Machines: How Trade Impacts Gender Inequality. Journal of Development Economics 106(C): 179-193.
Kerr, S., W. Kerr, and W. Lincoln. 2015. Skilled Immigration and the Employment Structures of U.S. Firms. Journal of Labor Economics 33(S1): S109-S145.
Kerr, W. and M. Mandorff. 2015. Social Networks, Ethnicity, and Entrepreneurship. NBER Working Paper # 21597.
Khanna, G. 2014. Road Oft Taken: The Route to Spatial Development. Unpublished manuscript.
Khera, P. 2016. Macroeconomic Impacts of Gender Inequality and Informality in India. IMF Working Paper #16
Kis-Katos, K. and R. Sparrow. 2011. Child Labor and Trade Liberalization in Indonesia. Journal of Human Resources, 46(4): 722-749.
Klapper, L. and S. Parker. 2011. Gender and Business Environment for New Firm Creation”, World Bank Research Observer, 26(2): 237-257.
Kobeissi, N. 2010. Gender Factors and Female Entrepreneurship: International Evidence and Policy Implications. Journal of International Entrepreneurship, 8(1): 1-35
Kochhar, K., Kumar, U., Rajan, R., and Subramanian, A. 2006. India's Pattern of Development: What Happened, What Follows? Journal of Monetary Economics, 53(5): 981-1019.
Kovak, B. 2013. Regional Effects of Trade Reform: What is the Correct Measure of Liberalization? American Economic Review, 103(5): 1960-1976.
Krishna, P. and D. Mitra. 1998. Trade Liberalization, Market Discipline and Productivity Growth: New Evidence from India. Journal of Development Economics 56(2): 447–462.
Krueger, A. 2010. Trade Liberalization and Growth in Developing Countries. In J. Siegfried, Better living through economics. Harvard University Press
Lang, K., and J. Lehmann. 2012. Racial Discrimination in the Labor Market: Theory and Empirics. Journal of Economic Literature, 50(4): 959-1006.
Lawson, S., 2008, Women Hold Up Half the Sky. Goldman Sachs Global Economics Paper #164.
Levine, R., A. Levkov and Y. Rubinstein. 2014. Bank Deregulation and Racial Inequality in America. Critical Finance Review, 3(1): 1-48.
Mammen, K. and C. Paxson. 2000. Women's Work and Economic Development. Journal of Economic Perspectives, 14(4): 141-164

40
Martin, L., Nataraj, S., and Harrison, A. 2014. In with the Big, Out with the Small: Removing Small-Scale Reservations in India. NBER Working Paper # 19942. National Bureau of Economic Research.
McCaig, B. 2011. Exporting out of Poverty: Provincial Poverty in Vietnam and U.S. Market Access. Journal of International Economics, 85(1): 102–113.
Melitz, M. 2003. The Impact of Trade on Intra-Industry Reallocations and Aggregate Industry Productivity. Econometrica, 71(1):1695–1725.
Meñezes-Filho, N. and A. Muendler. 2011. Labor Reallocation in Response to Trade Reform. NBER Working Paper # 17372, National Bureau of Economic Research.
Meng, X. 2004. Gender Earnings Gap: The Role of Firm Specific Effects. Labour Economics, 11(5): 555-573.
Michaels, G. 2008. The Effect of Trade on the Demand for Skill: Evidence from the Interstate Highway System. The Review of Economics and Statistics, 90 (4): 683-701.
Minniti, M. 2010. Female Entrepreneurship and Economic Activity. European Journal of Development Research, 22(3): 294–312.
Minniti, M. and W. Naudé. 2010. What Do We Know About The Patterns and Determinants of Female Entrepreneurship Across Countries? European Journal of Development Research 22(3): 277-293.
Mitra, R. 2002. The Growth Pattern of Women-Run Enterprises: An Empirical Study in India. Journal of Developmental Entrepreneurship, (2): 217–37.
Mohan, R. 2002. Small-Scale Industry Policy in India: A Critical Evaluation. In: Krueger, A. O. (Ed.), Economic Policy Reforms and the Indian Economy. Chicago: University of Chicago Press.
Muendler, M. 2004. Trade, Technology, and Productivity: A Study of Brazilian Manufacturers. CESifo Working Paper # 1148.
Munshi, K. 2011. Strength in Numbers: Networks as a Solution to Occupational Traps. Review of Economic Studies, 78(3): 1069-1101.
Munshi, K. and M. Rosenzweig. 2009. Why is Mobility in India so Low? Social Insurance, Inequality, and Growth. NBER Working Papers 14850, National Bureau of Economic Research.
Nordås, H. 2003. The Impact of Trade Liberalization on Women's Job Opportunities and Earnings in Developing Countries. World Trade Review, 2(2): 221-231
Ozler, S. 2000. Export Orientation and Female Share of Employment: Evidence from Turkey. World Development, 28(7): 1239-1248.

41
Panagariya, A. 2007. Why India lags behind China and How Can it Bridge the Gap. World Economy, 30(2): 229-248.
Panagariya, A. 2008. India: The Emerging Giant. New York: Oxford University Press.
Pande, R., and D. Ford. 2011. Gender Quotas and Female Leadership: A Review. Background Paper for the World Development Report on Gender.
Pavcnik, N. 2002. Trade Liberalization, Exit and Productivity Improvements: Evidence from Chilean Plants. Review of Economic Studies, 69(1): 245–276.
Pillania, R., M. Lall, and S. Saha. 2010. Motives For Starting Business: Indian Women Entrepreneur’s Perspectives. International Journal of Indian Culture and Business Management, 3(1): 48-67.
Porto, G. 2004. Trade Reforms, Market Access and Poverty in Argentina. World Bank Policy Research Working Paper # 3135. Washington, DC: World Bank.
Rahman, R. I., and Islam, R. 2013. Female Labour Force Participation in Bangladesh: Trends, Drivers and Barriers. International Labour Organization.
Revenga, A. 1996. Employment and Wage Effects of Trade Liberalization: The case of Mexican Manufacturing. Journal of Labor Economics, 15(3): 20–43.
Rosenthal, S. and W. Strange. 2012. Female Entrepreneurship, Agglomeration, and a New Spatial Mismatch. Review of Economics and Statistics, 94(3): 764-788.
Schoar, A. 2009. The Divide between Subsistence and Transformational Entrepreneurship. In Lerner, Josh, and Scott Stern (eds.) Innovation Policy and the Economy, Chicago, IL: University of Chicago Press
Schor, A. 2004. Heterogeneous Productivity Response to Tariff Reduction: Evidence from Brazilian Manufacturing Firms. Journal of Development Economics, 75(2): 373–396.
Shanthi, R. 2006. Female Labour Migration in India: Insights from NSSO Data. Working Paper # 4. Chennai: Madras School of Economics.
Sivadasan, J. 2009. Productivity Consequences of Product Market Liberalization: Micro-Evidence from Indian Manufacturing Sector Reforms. B.E. Journal of Economic Analysis and Policy, 9(1): Article 42.
Standing, G. 1999. Global feminization Through Flexible Labour: A Theme Revisited. World Development, 27(3): 583-602.

42
Storeygard, A. 2012. Farther on Down the Road: Transport Costs, Trade and Urban Growth. World Bank Policy Research Working Paper # 6444; forthcoming in Review of Economic Studies
Subramanian, A. and Roy, D. 2001. Who Can Explain the Mauriritan Miracle: Meade, Romer, Sachs or Rodrik? IMF Working Paper # 116.
Tewari, I. 2011. Is Small Beautiful? Evidence from India’s Product Reservation Policy for Small Industry. Unpublished mimeo.
Tewari I. and J. Wilde. 2014. Multiproduct Firms, Product Scope and Productivity: Evidence from India’s Product Reservation Policy. Unpublished mimeo.
Thomas, J. J. 2012. India's Labour Market During the 2000s. Economic and Political Weekly, 47(51): 39-51
Topalova, P. 2007. Trade Liberalization, Poverty and Inequality: Evidence from Indian Districts. In A. Harrison (Ed.), Globalization and Poverty (Cambridge, MA: National Bureau of Economic Research).
Topalova, P. 2010. Factor Immobility and Regional Impacts of Trade Liberalization: Evidence on Poverty from India,’’ American Economic Journal: Applied Economics 2(4): 1–41.
Topalova, P. and A. Khandelwal. 2011. Trade Liberalization and Firm Productivity: the Case of India. The Review of Economics and Statistics, 93(3): 995–1009.
Tybout, J., J. De Melo, and V. Corbo. 1991. The Effects of Trade Reforms on Scale and Technical Efficiency: New Evidence from Chile. Journal of International Economics, 231(3): 31–250.
Tybout, J., and M. Westbrook. 1995. Trade Liberalization and the Dimensions of Efficiency Change in the Mexican Manufacturing Industries. Journal of International Economics, 39(1): 53–78.
Veeramani, C. 2012. Anatomy of India's Merchandise Export Growth, 1993-94 to 2010-11. Economic and Political Weekly, 47(1): 94-1014.
Verheul, I., A. Stel, and R. Thurik. 2006. Explaining Female and Male Entrepreneurship at the Country Level. Entrepreneurship and Regional Development, 18(2), 151-183
Wood, A. 1991. North-South Trade and Female Labour in Manufacturing: An Asymmetry. Journal of Development Studies, 27(2): 168-189.
World Bank. 2008. Reducing Gender Based Differences in Formality and Productivity.

43
World Bank, 2011. World Development Report, 2012: Gender Equality and Development. World Bank, Washington DC
World Bank. 2014. Gender at Work: A Companion to the World Development Report on Jobs. World Bank, Washington DC
World Bank, 2016. Gender Inequality, Poverty Reduction and Inclusive Growth: Gender Strategy 2016-2023 . World Bank, Washington DC
World Economic Forum. 2015. Gender Gap Report. Geneva, Switzerland.
Zweimüller, M., R. Winter-Ebner, and D. Weichselbaumer. 2008. Market Orientation and Gender Wage Gaps: an International Study. Kyklos, 61(4): 615-635.

Figure 1: Shares of female ownership by state
0%
10%
20%
30%
40%
50%
60%
70%
80%
90%
0 10,000 20,000 30,000 40,000 50,000 60,000Fem
ale-
owne
d sh
are
of fi
rms
State GDP per capita in 2000
A. Female ownership of unorganized manufacturing in 2000
0%
5%
10%
15%
20%
25%
30%
35%
40%
45%
0 10,000 20,000 30,000 40,000 50,000 60,000
Fem
ale-
owne
d sh
are
of fi
rms
State GDP per capita in 2000
B. Female ownership of services in 2000
-20%
-10%
0%
10%
20%
30%
40%
50%
0 10,000 20,000 30,000 40,000 50,000 60,000
Gro
wth
in sh
are
of fe
mal
e ow
ners
hip
State GDP per capita in 2000
C. Growth in female ownership share of unorganized mfg., 2001-2010
-4%
-2%
0%
2%
4%
6%
8%
0 10,000 20,000 30,000 40,000 50,000 60,000G
row
th in
shar
e of
fem
ale
owne
rshi
p
State GDP per capita in 2000
D. Growth of female ownership share of services, 2001-2010

Figure 2a: Correlation in female activity for unorganized manufacturing by state
0%
10%
20%
30%
40%
50%
60%
70%
80%
0% 10% 20% 30% 40% 50% 60% 70% 80% 90%
Shar
e of
em
ploy
ees
in st
ate
that
are
fe
mal
e
Share of establishments in state that are female-owned
A. Female-owned firms vs. female employees
40%
50%
60%
70%
80%
90%
100%
0% 10% 20% 30% 40% 50% 60% 70% 80% 90%Shar
e of
fem
ale
empl
oyee
s in
fem
ale-
owne
d es
tabl
ishm
ents
Share of establishments in state that are female-owned
B. Female-owned firms vs. segmentation in female-owned firms
60%
65%
70%
75%
80%
85%
90%
95%
100%
0% 10% 20% 30% 40% 50% 60% 70% 80% 90%
Shar
e of
mal
e em
ploy
ees
in m
ale-
owne
d es
tabl
ishm
ents
Share of establishments in state that are female-owned
C. Female-owned firms vs. segmentation in male-owned firms
40%
50%
60%
70%
80%
90%
100%
0% 10% 20% 30% 40% 50% 60% 70% 80%Shar
e of
fem
ale
empl
oyee
s in
fem
ale-
owne
d es
tabl
ishm
ents
Share of employees in state that are female
D. Female employee share vs. segmentation in female-owned firms
60%
65%
70%
75%
80%
85%
90%
95%
100%
0% 10% 20% 30% 40% 50% 60% 70% 80%Shar
e of
mal
e em
ploy
ees
in m
ale-
owne
d es
tabl
ishm
ents
Share of employees in state that are female
E. Female employee share vs. segmentation in male-owned firms
60%
65%
70%
75%
80%
85%
90%
95%
100%
40% 50% 60% 70% 80% 90% 100%Shar
e of
mal
e em
ploy
ees
in m
ale-
owne
d es
tabl
ishm
ents
Share of female employees in female-owned establishments
F. Segmentation in female-owned vs. male-owned firms

Figure 2b: Correlation in female activity for services by state
0%
5%
10%
15%
20%
25%
30%
35%
40%
45%
0% 5% 10% 15% 20% 25% 30% 35% 40%
Shar
e of
em
ploy
ees
in st
ate
that
are
fe
mal
e
Share of establishments in state that are female-owned
A. Female-owned firms vs. female employees
40%45%50%55%60%65%70%75%80%85%90%
0% 5% 10% 15% 20% 25% 30% 35% 40%Shar
e of
fem
ale
empl
oyee
s in
fem
ale-
owne
d es
tabl
ishm
ents
Share of establishments in state that are female-owned
B. Female-owned firms vs. segmentation in female-owned firms
70%
75%
80%
85%
90%
95%
100%
0% 5% 10% 15% 20% 25% 30% 35% 40%
Shar
e of
mal
e em
ploy
ees
in m
ale-
owne
d es
tabl
ishm
ents
Share of establishments in state that are female-owned
C. Female-owned firms vs. segmentation in male-owned firms
40%45%50%55%60%65%70%75%80%85%90%
0% 5% 10% 15% 20% 25% 30% 35% 40%Shar
e of
fem
ale
empl
oyee
s in
fem
ale-
owne
d es
tabl
ishm
ents
Share of employees in state that are female
D. Female employee share vs. segmentation in female-owned firms
70%
75%
80%
85%
90%
95%
100%
0% 5% 10% 15% 20% 25% 30% 35% 40%Shar
e of
mal
e em
ploy
ees
in m
ale-
owne
d es
tabl
ishm
ents
Share of employees in state that are female
E. Female employee share vs. segmentation in male-owned firms
70%
75%
80%
85%
90%
95%
100%
40% 50% 60% 70% 80% 90%Shar
e of
mal
e em
ploy
ees
in m
ale-
owne
d es
tabl
ishm
ents
Share of female employees in female-owned establishments
F. Segmentation in female-owned vs. male-owned firms

Figure 2c: Correlation in female activity across sectors by state
0%
5%
10%
15%
20%
25%
30%
35%
40%
0% 10% 20% 30% 40% 50% 60% 70% 80%
Serv
ices
Manufacturing
B. Share of employees in state who are female
40%
45%
50%
55%
60%
65%
70%
75%
80%
85%
90%
40% 50% 60% 70% 80% 90% 100%
Serv
ices
Manufacturing
C. Segmentation in female-owned firms
70%
75%
80%
85%
90%
95%
100%
60% 65% 70% 75% 80% 85% 90% 95% 100% 105%
Serv
ices
Manufacturing
D. Segmentation in male-owned firms
0%
5%
10%
15%
20%
25%
30%
35%
40%
0% 10% 20% 30% 40% 50% 60% 70% 80% 90%
Serv
ices
Manufacturing
A. Shares of female-owned establishments

Figure 3a: Shares of female ownership by industry
-20%
-10%
0%
10%
20%
30%
40%
50%
60%
70%
80%
90%
0 500 1000 1500 2000 2500 3000Fem
ale-
owne
d sh
are
of fi
rms
Average industry wage in 2010
A. Female ownership of manufacturing in 2000
0%
10%
20%
30%
40%
50%
60%
70%
80%
90%
0 500 1000 1500 2000 2500 3000
Fem
ale-
owne
d sh
are
of fi
rms
Average industry wage in 2010
B. Female ownership of services in 2000
-10%
-5%
0%
5%
10%
15%
20%
25%
0 500 1000 1500 2000 2500 3000
Gro
wth
in sh
are
of fe
mal
e ow
ners
hip
Average industry wage in 2010
C. Growth in female ownership share of mfg., 2001-2010
-60%
-50%
-40%
-30%
-20%
-10%
0%
10%
20%
0 500 1000 1500 2000 2500 3000
Gro
wth
in sh
are
of fe
mal
e ow
ners
hip
Average industry wage in 2010
D. Growth of female ownership share of services, 2001-2010
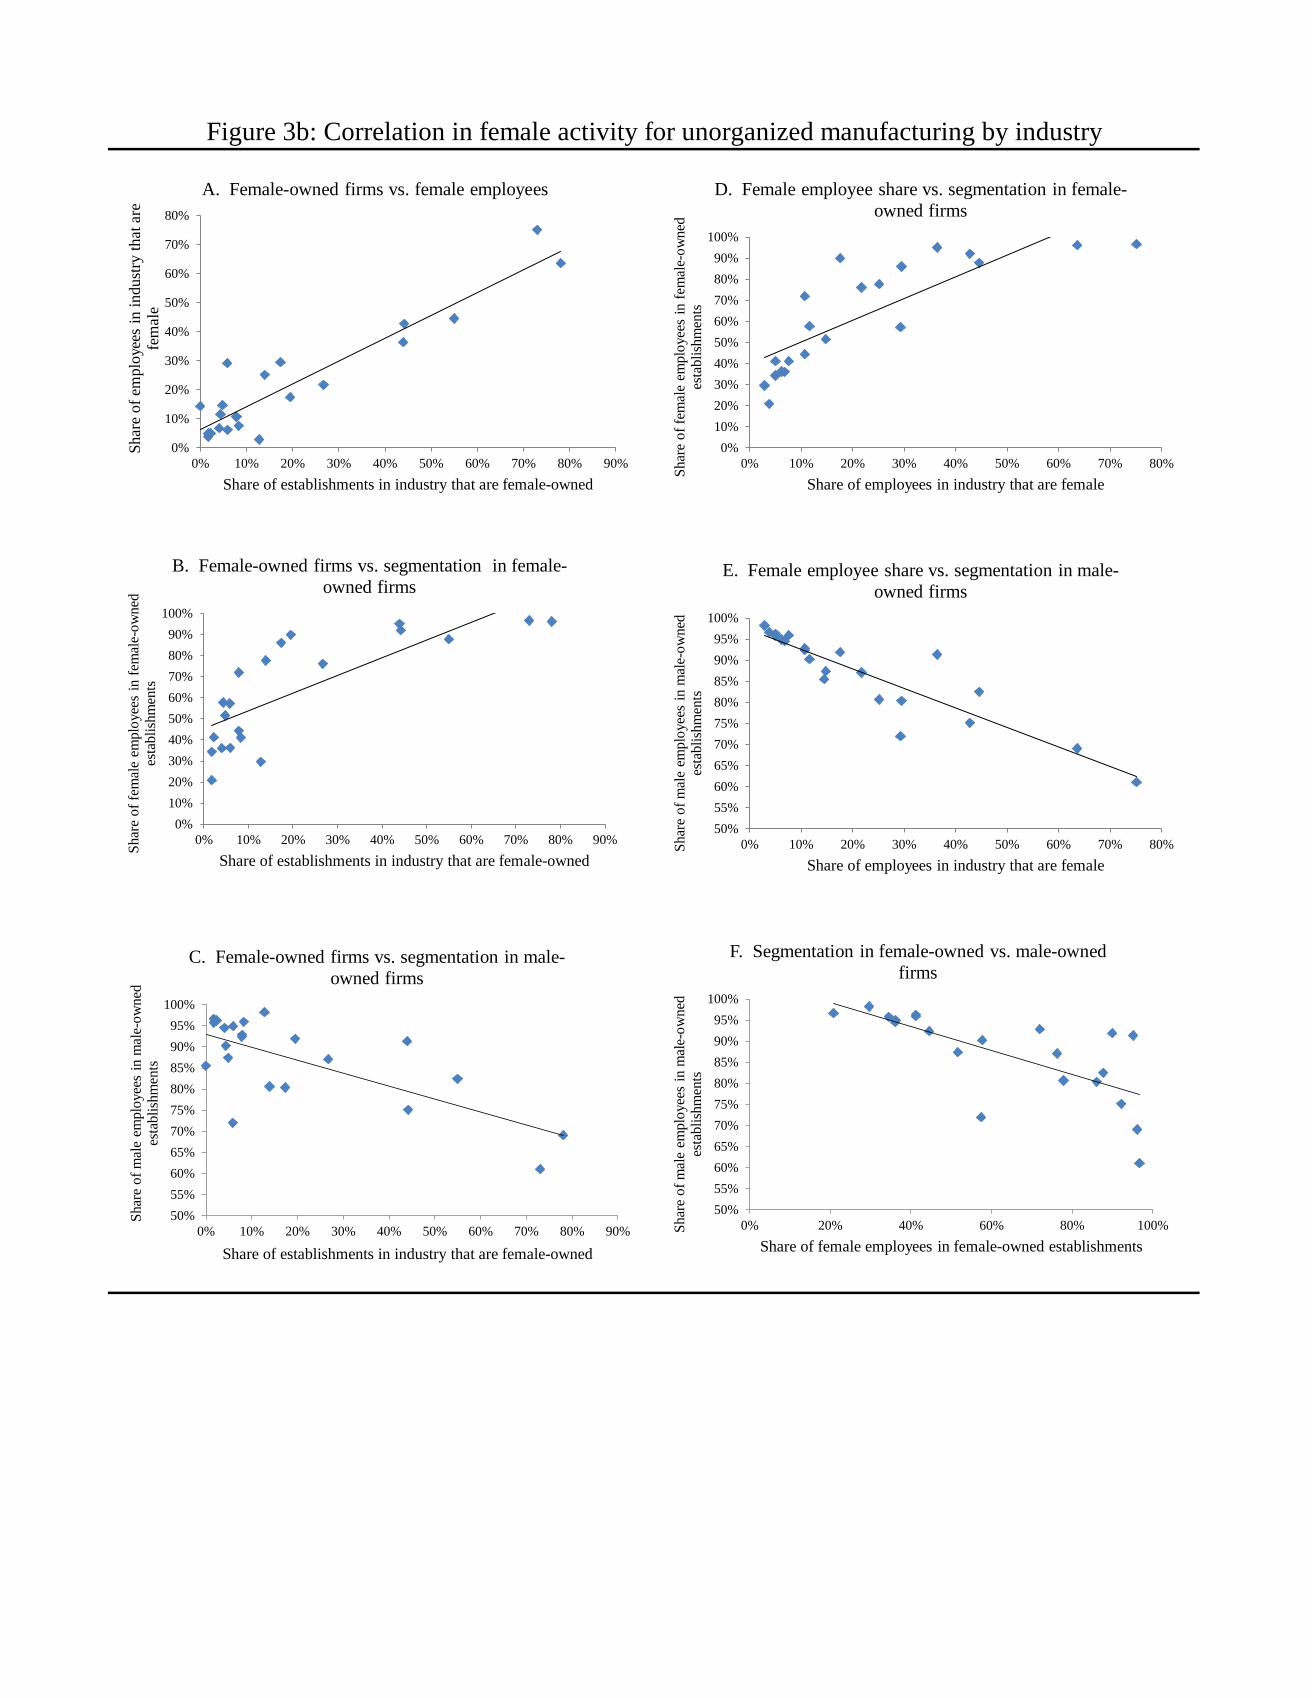
Figure 3b: Correlation in female activity for unorganized manufacturing by industry
0%
10%
20%
30%
40%
50%
60%
70%
80%
0% 10% 20% 30% 40% 50% 60% 70% 80% 90%
Shar
e of
em
ploy
ees
in in
dust
ry th
at a
re
fem
ale
Share of establishments in industry that are female-owned
A. Female-owned firms vs. female employees
0%10%20%30%40%50%60%70%80%90%
100%
0% 10% 20% 30% 40% 50% 60% 70% 80% 90%Shar
e of
fem
ale
empl
oyee
s in
fem
ale-
owne
d es
tabl
ishm
ents
Share of establishments in industry that are female-owned
B. Female-owned firms vs. segmentation in female-owned firms
50%55%60%65%70%75%80%85%90%95%
100%
0% 10% 20% 30% 40% 50% 60% 70% 80% 90%
Shar
e of
mal
e em
ploy
ees
in m
ale-
owne
d es
tabl
ishm
ents
Share of establishments in industry that are female-owned
C. Female-owned firms vs. segmentation in male-owned firms
0%10%20%30%40%50%60%70%80%90%
100%
0% 10% 20% 30% 40% 50% 60% 70% 80%Shar
e of
fem
ale
empl
oyee
s in
fem
ale-
owne
d es
tabl
ishm
ents
Share of employees in industry that are female
D. Female employee share vs. segmentation in female-owned firms
50%55%60%65%70%75%80%85%90%95%
100%
0% 10% 20% 30% 40% 50% 60% 70% 80%Shar
e of
mal
e em
ploy
ees
in m
ale-
owne
d es
tabl
ishm
ents
Share of employees in industry that are female
E. Female employee share vs. segmentation in male-owned firms
50%55%60%65%70%75%80%85%90%95%
100%
0% 20% 40% 60% 80% 100%Shar
e of
mal
e em
ploy
ees
in m
ale-
owne
d es
tabl
ishm
ents
Share of female employees in female-owned establishments
F. Segmentation in female-owned vs. male-owned firms
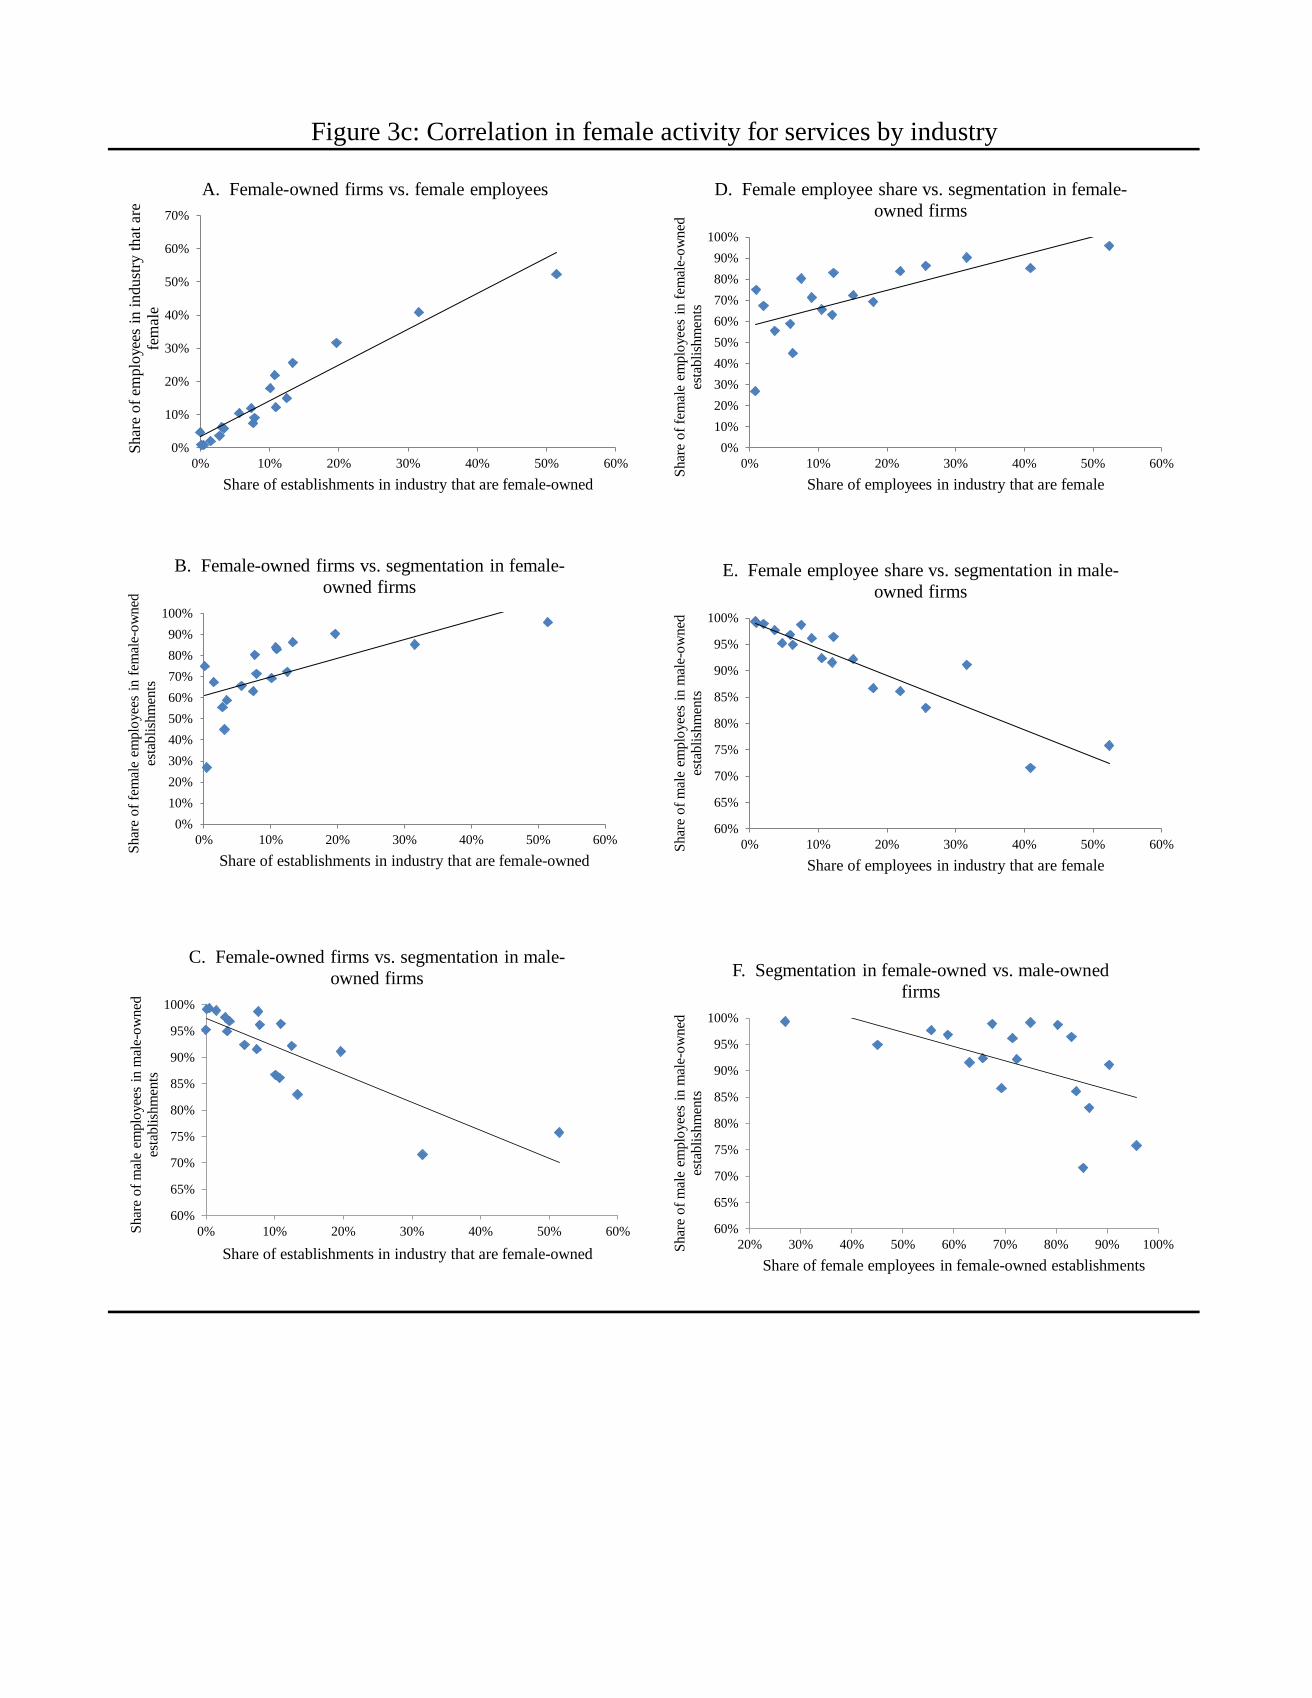
Figure 3c: Correlation in female activity for services by industry
0%
10%
20%
30%
40%
50%
60%
70%
0% 10% 20% 30% 40% 50% 60%
Shar
e of
em
ploy
ees
in in
dust
ry th
at a
re
fem
ale
Share of establishments in industry that are female-owned
A. Female-owned firms vs. female employees
0%10%20%30%40%50%60%70%80%90%
100%
0% 10% 20% 30% 40% 50% 60%Shar
e of
fem
ale
empl
oyee
s in
fem
ale-
owne
d es
tabl
ishm
ents
Share of establishments in industry that are female-owned
B. Female-owned firms vs. segmentation in female-owned firms
60%
65%
70%
75%
80%
85%
90%
95%
100%
0% 10% 20% 30% 40% 50% 60%Shar
e of
mal
e em
ploy
ees
in m
ale-
owne
d es
tabl
ishm
ents
Share of establishments in industry that are female-owned
C. Female-owned firms vs. segmentation in male-owned firms
0%10%20%30%40%50%60%70%80%90%
100%
0% 10% 20% 30% 40% 50% 60%Shar
e of
fem
ale
empl
oyee
s in
fem
ale-
owne
d es
tabl
ishm
ents
Share of employees in industry that are female
D. Female employee share vs. segmentation in female-owned firms
60%
65%
70%
75%
80%
85%
90%
95%
100%
0% 10% 20% 30% 40% 50% 60%Shar
e of
mal
e em
ploy
ees
in m
ale-
owne
d es
tabl
ishm
ents
Share of employees in industry that are female
E. Female employee share vs. segmentation in male-owned firms
60%
65%
70%
75%
80%
85%
90%
95%
100%
20% 30% 40% 50% 60% 70% 80% 90% 100%Shar
e of
mal
e em
ploy
ees
in m
ale-
owne
d es
tabl
ishm
ents
Share of female employees in female-owned establishments
F. Segmentation in female-owned vs. male-owned firms

A. Female worker segmentation in total B. Male worker segmentation in total
C. Female worker concentration in female-owned enterprises D. Male worker concentration in male-owned enterprises
Figure 4: Comparisons to Monte Carlo simulations of gender segmentation
Actual
Simulated

A. Declines in overall trade tariff levels, 1987-2000 B. Declines in input trade tariff levels, 1987-2000
C. Declines in ERP tariff levels, 1987-2000 D. Increases in product share unreserved for small plants, 1999-2009
Figure 5a: Changes in male segmentation with industry-level reforms

A. Declines in overall trade tariff levels, 1987-2000 B. Declines in input trade tariff levels, 1987-2000
C. Declines in ERP tariff levels, 1987-2000 D. Increases in product share unreserved for small plants, 1999-2009
Figure 5b: Changes in female segmentation with industry-level reforms

2001 2006 2010 2001 2006 2010
Total 244,258 116,108 134,617 351,916 186,481 109,631 Organized sector 25,532 35,096 33,072 8,044 4,928 3,922 Unorganized sector 218,726 81,012 101,545 343,872 181,553 105,709 Female-owned establishments 42,190 18,752 22,804 27,745 14,912 8,135 Female-owned share 0.20 0.25 0.23 0.08 0.09 0.08
Total 16,977,350 16,929,551 17,751,937 14,180,251 16,381,770 17,737,379 Organized sector 98,976 104,575 118,145 146,442 342,599 252,335 Unorganized sector 16,878,374 16,824,976 17,633,793 14,033,810 16,039,171 17,485,044 Female-owned establishments 4,417,408 6,174,508 6,647,471 1,081,446 1,289,543 1,419,807 Female-owned share 0.27 0.38 0.39 0.08 0.09 0.09
Total 40,678,774 40,299,063 43,161,148 26,064,374 32,607,152 34,091,395 Organized sector 6,716,239 7,469,639 9,593,975 3,179,267 6,339,472 4,964,826 Unorganized sector 33,962,535 32,829,425 33,567,173 22,885,107 26,267,679 29,126,569 Female-owned establishments 5,551,358 7,552,761 7,852,968 1,716,817 1,966,594 1,987,362 Female-owned share 0.17 0.25 0.25 0.08 0.09 0.08
Total 650,110 870,814 1,303,527 123,347 157,407 192,437 Organized sector 501,302 704,960 1,066,705 31,466 67,359 34,845 Unorganized sector 148,808 165,854 236,822 91,881 90,048 157,592 Female-owned establishments 7,128 10,371 18,486 4,615 4,777 7,522 Female-owned share 0.06 0.08 0.09 0.06 0.06 0.05
Organized sector n.a. n.a. n.a. 159 117 127 Unorganized sector 414 413 415 407 412 412
C. Estimated employment levels
E. District count where female-owned establishments are observed
Notes: Descriptive statistics taken from the Annual Survey of Industries (ASI) and National Sample Survey (NSS). Gender of owner is not present for organized sector of manufacturing. Organized sector for services is defined to be over 10 employees to mimic manufacturing definition. Female-owned share of establishments, employees, and output is calculated as a share of establishments for which we know the gender of the owner.
D. Estimated output levels (in millions)
Table 1a: Female-owned Indian manufacturing and services establishmentsManufacturing Services
A. Raw count of data observations
B. Estimated number of establishments
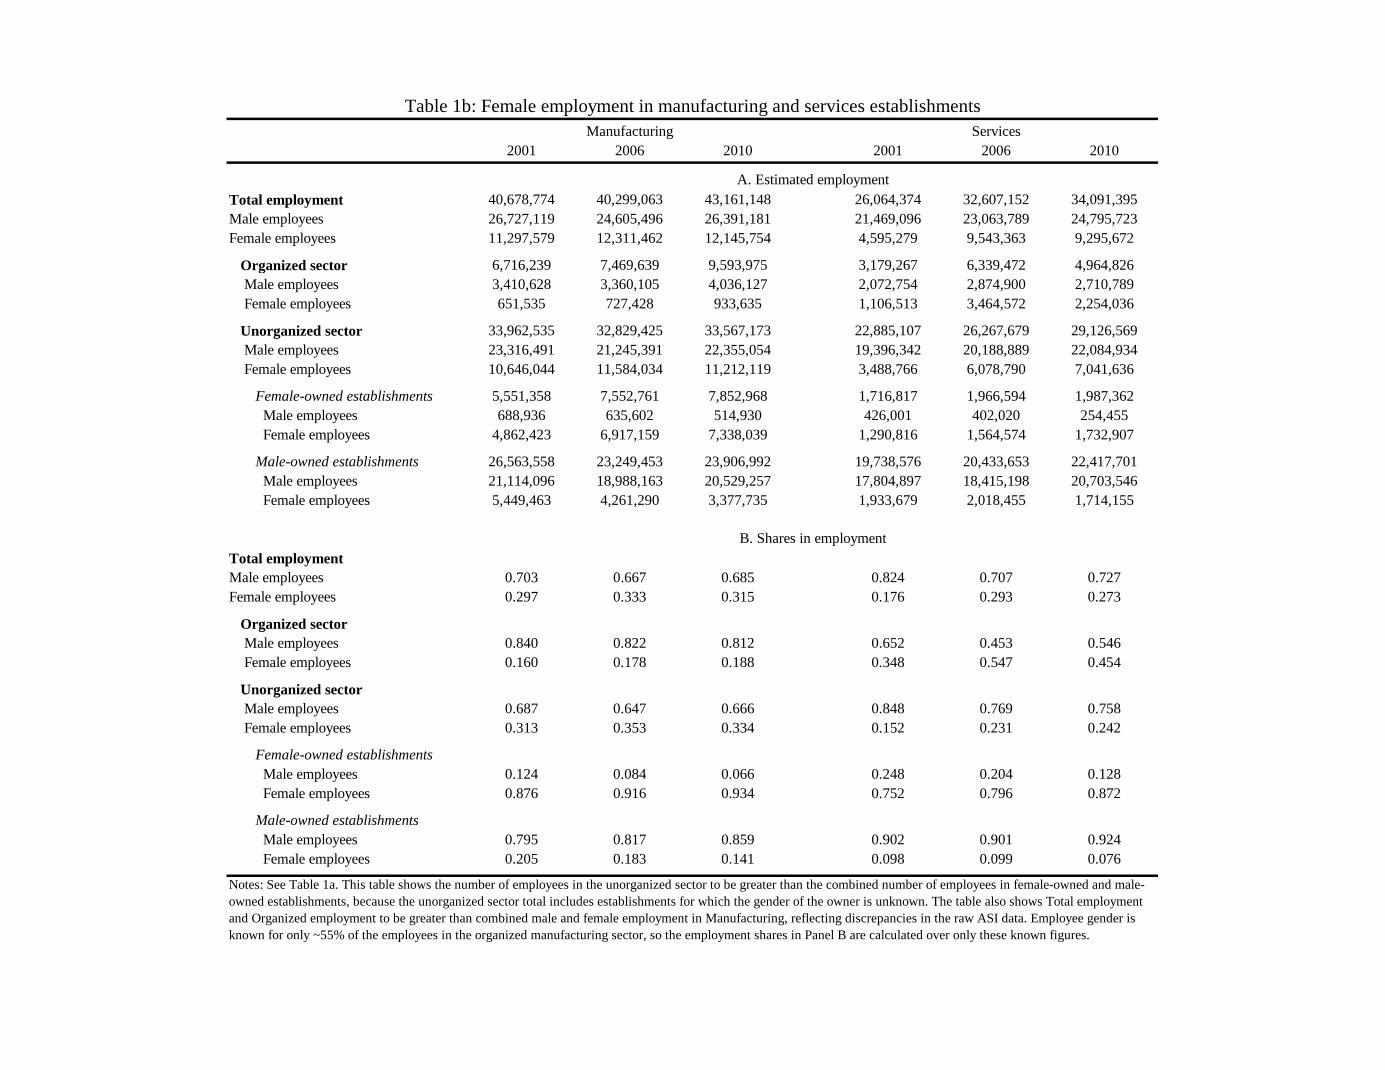
2001 2006 2010 2001 2006 2010
Total employment 40,678,774 40,299,063 43,161,148 26,064,374 32,607,152 34,091,395Male employees 26,727,119 24,605,496 26,391,181 21,469,096 23,063,789 24,795,723Female employees 11,297,579 12,311,462 12,145,754 4,595,279 9,543,363 9,295,672
Organized sector 6,716,239 7,469,639 9,593,975 3,179,267 6,339,472 4,964,826 Male employees 3,410,628 3,360,105 4,036,127 2,072,754 2,874,900 2,710,789 Female employees 651,535 727,428 933,635 1,106,513 3,464,572 2,254,036
Unorganized sector 33,962,535 32,829,425 33,567,173 22,885,107 26,267,679 29,126,569 Male employees 23,316,491 21,245,391 22,355,054 19,396,342 20,188,889 22,084,934 Female employees 10,646,044 11,584,034 11,212,119 3,488,766 6,078,790 7,041,636
Female-owned establishments 5,551,358 7,552,761 7,852,968 1,716,817 1,966,594 1,987,362 Male employees 688,936 635,602 514,930 426,001 402,020 254,455 Female employees 4,862,423 6,917,159 7,338,039 1,290,816 1,564,574 1,732,907
Male-owned establishments 26,563,558 23,249,453 23,906,992 19,738,576 20,433,653 22,417,701 Male employees 21,114,096 18,988,163 20,529,257 17,804,897 18,415,198 20,703,546 Female employees 5,449,463 4,261,290 3,377,735 1,933,679 2,018,455 1,714,155
Total employmentMale employees 0.703 0.667 0.685 0.824 0.707 0.727Female employees 0.297 0.333 0.315 0.176 0.293 0.273
Organized sector Male employees 0.840 0.822 0.812 0.652 0.453 0.546 Female employees 0.160 0.178 0.188 0.348 0.547 0.454
Unorganized sector Male employees 0.687 0.647 0.666 0.848 0.769 0.758 Female employees 0.313 0.353 0.334 0.152 0.231 0.242
Female-owned establishments Male employees 0.124 0.084 0.066 0.248 0.204 0.128 Female employees 0.876 0.916 0.934 0.752 0.796 0.872
Male-owned establishments Male employees 0.795 0.817 0.859 0.902 0.901 0.924 Female employees 0.205 0.183 0.141 0.098 0.099 0.076
Notes: See Table 1a. This table shows the number of employees in the unorganized sector to be greater than the combined number of employees in female-owned and male-owned establishments, because the unorganized sector total includes establishments for which the gender of the owner is unknown. The table also shows Total employment and Organized employment to be greater than combined male and female employment in Manufacturing, reflecting discrepancies in the raw ASI data. Employee gender is known for only ~55% of the employees in the organized manufacturing sector, so the employment shares in Panel B are calculated over only these known figures.
B. Shares in employment
A. Estimated employment
Table 1b: Female employment in manufacturing and services establishmentsManufacturing Services

2001 2006 2010 2001 2006 2010 2001 2006 2010
A & N Islands 156 276 1,077 0.058 0.124 0.365 582 735 1,489Andhra Pradesh 462,841 781,483 738,543 0.293 0.523 0.448 1,211,931 1,343,064 1,280,655Assam 50,482 86,028 31,967 0.182 0.256 0.149 108,839 148,888 61,584Bihar 100,153 308,913 83,989 0.080 0.230 0.106 585,070 738,829 250,850Chandigarh 1,517 385 2,590 0.280 0.307 0.394 1,778 507 2,971Dadra & Nagar Haveli 63 336 373 0.052 0.378 0.219 169 414 664Daman & Diu 257 1,235 1,004 0.274 0.541 0.456 297 821 745Delhi 14,651 10,421 16,895 0.069 0.117 0.080 29,660 16,303 36,748Goa 5,557 2,119 2,156 0.236 0.229 0.245 16,218 3,942 2,962Gujarat 64,193 140,227 731,896 0.124 0.227 0.518 180,765 250,451 984,459Haryana 24,979 43,600 31,900 0.137 0.207 0.147 35,973 53,724 66,222Himachal Pradesh 16,670 28,594 15,801 0.176 0.271 0.172 27,974 38,642 25,034Jammu & Kashmir 20,739 37,002 70,198 0.101 0.221 0.317 127,045 64,533 77,184Karnataka 527,936 554,116 441,334 0.513 0.583 0.516 831,698 916,185 613,393Kerala 231,825 322,860 250,942 0.493 0.540 0.510 390,135 482,499 378,332Madhya Pradesh 187,745 203,577 321,501 0.193 0.197 0.299 577,256 629,079 560,929Maharashtra 267,695 350,540 495,671 0.222 0.321 0.351 523,060 481,317 750,058Manipur 43,663 40,241 30,574 0.831 0.826 0.728 54,834 51,321 38,622Meghalaya 5,549 12,078 4,164 0.266 0.351 0.272 9,968 19,076 8,295Nagaland 2,150 4,345 3,009 0.377 0.454 0.436 2,812 5,199 3,055Orissa 214,223 246,641 128,810 0.220 0.268 0.212 631,835 736,597 333,903Pondicherry 3,368 3,364 7,594 0.296 0.275 0.463 10,776 9,279 13,609Punjab 105,863 113,022 122,894 0.327 0.400 0.302 131,763 142,785 134,767Rajasthan 139,662 172,954 168,201 0.231 0.277 0.262 281,378 243,984 237,139Tamil Nadu 634,130 764,995 775,129 0.428 0.533 0.472 1,326,412 1,465,538 1,388,878Tripura 5,304 12,437 14,318 0.150 0.279 0.202 26,660 25,507 28,143Uttar Pradesh 444,719 626,239 724,302 0.190 0.271 0.295 1,257,009 1,207,882 1,437,150West Bengal 841,320 1,306,482 1,430,641 0.307 0.487 0.535 1,929,985 2,101,350 1,997,934
Nationwide 4,417,408 6,174,508 6,647,471 0.266 0.375 0.386 10,311,885 11,178,449 10,715,774
Notes: See Table 1.
Table 2a: State-level distribution of female activity in unorganized manufacturingEstimated count of female-
owned establishmentsShare of establishments in state
that are female-owned Estimated count of female
employees

2001 2006 2010 2001 2006 2010 2001 2006 2010
A & N Islands 0.100 0.161 0.263 0.576 0.597 0.925 0.940 0.895 0.901Andhra Pradesh 0.403 0.509 0.426 0.902 0.964 0.940 0.713 0.711 0.780Assam 0.252 0.296 0.163 0.890 0.950 0.934 0.848 0.857 0.923Bihar 0.263 0.344 0.198 0.869 0.956 0.789 0.778 0.783 0.855Chandigarh 0.104 0.226 0.311 0.663 0.897 0.977 0.964 0.934 0.951Dadra & Nagar Haveli 0.074 0.260 0.165 0.417 0.818 0.960 0.952 0.972 0.913Daman & Diu 0.123 0.239 0.227 0.754 0.960 0.962 0.974 0.986 0.965Delhi 0.038 0.041 0.051 0.409 0.476 0.595 0.983 0.986 0.983Goa 0.331 0.208 0.159 0.917 0.831 0.969 0.779 0.927 0.960Gujarat 0.144 0.171 0.357 0.681 0.759 0.945 0.895 0.903 0.871Haryana 0.104 0.124 0.141 0.723 0.832 0.846 0.949 0.965 0.922Himachal Pradesh 0.217 0.276 0.182 0.789 0.898 0.868 0.890 0.889 0.926Jammu & Kashmir 0.285 0.251 0.244 0.935 0.944 0.984 0.764 0.885 0.969Karnataka 0.436 0.513 0.430 0.937 0.966 0.967 0.803 0.751 0.846Kerala 0.470 0.462 0.442 0.925 0.930 0.943 0.771 0.786 0.827Madhya Pradesh 0.324 0.335 0.322 0.900 0.853 0.940 0.775 0.752 0.854Maharashtra 0.207 0.199 0.250 0.726 0.826 0.883 0.869 0.923 0.899Manipur 0.746 0.757 0.679 0.986 0.983 0.989 0.923 0.906 0.878Meghalaya 0.272 0.293 0.278 0.826 0.781 0.787 0.910 0.889 0.877Nagaland 0.331 0.419 0.419 0.953 0.943 0.979 0.925 0.892 0.934Orissa 0.391 0.459 0.304 0.711 0.839 0.875 0.671 0.634 0.798Pondicherry 0.339 0.263 0.408 0.790 0.723 0.937 0.741 0.899 0.882Punjab 0.215 0.270 0.181 0.833 0.964 0.941 0.945 0.955 0.974Rajasthan 0.272 0.217 0.208 0.892 0.853 0.897 0.844 0.923 0.938Tamil Nadu 0.439 0.495 0.432 0.928 0.949 0.941 0.730 0.723 0.758Tripura 0.380 0.184 0.255 0.604 0.857 0.959 0.659 0.913 0.861Uttar Pradesh 0.259 0.269 0.296 0.889 0.881 0.918 0.843 0.870 0.883West Bengal 0.385 0.454 0.462 0.887 0.930 0.967 0.740 0.821 0.847
Nationwide 0.321 0.363 0.337 0.876 0.916 0.934 0.795 0.817 0.859
Notes: See Table 1.
Table 2a (continued)Share of employees in state who
are womenShare of female employees in female-owned establishments
Share of male employees in male-owned establishments

2001 2006 2010 2001 2006 2010 2001 2006 2010
A & N Islands 245 277 691 0.105 0.113 0.149 744 1,001 2,157Andhra Pradesh 153,000 167,854 220,891 0.118 0.120 0.125 717,846 722,063 793,474Assam 22,774 73,445 14,517 0.059 0.131 0.047 37,017 106,430 33,603Bihar 42,951 89,802 53,082 0.030 0.069 0.047 168,668 237,011 136,923Chandigarh 1,703 1,881 1,779 0.100 0.098 0.075 5,351 5,705 5,578Dadra & Nagar Haveli 224 162 664 0.100 0.105 0.154 392 258 1,525Daman & Diu 255 265 393 0.132 0.148 0.151 421 334 723Delhi 24,143 14,030 32,961 0.103 0.099 0.094 53,478 36,121 117,721Goa 1,819 5,945 3,364 0.140 0.231 0.148 7,106 15,045 7,725Gujarat 40,412 49,288 83,095 0.073 0.080 0.093 72,415 99,046 155,804Haryana 15,697 23,107 24,146 0.074 0.075 0.072 57,954 72,922 82,845Himachal Pradesh 6,733 6,697 12,029 0.088 0.063 0.093 13,188 19,912 22,959Jammu & Kashmir 5,733 4,259 4,979 0.054 0.031 0.037 21,709 18,019 29,065Karnataka 49,951 61,191 83,473 0.077 0.093 0.111 193,560 192,897 281,105Kerala 69,391 103,849 84,644 0.125 0.140 0.135 196,098 282,835 224,618Madhya Pradesh 38,807 37,898 47,107 0.067 0.068 0.064 128,332 138,866 148,570Maharashtra 107,804 149,592 191,522 0.106 0.113 0.122 316,617 376,063 398,265Manipur 3,407 3,727 5,087 0.145 0.151 0.209 10,221 10,957 13,412Meghalaya 9,379 15,589 13,135 0.398 0.323 0.382 18,510 30,973 20,698Nagaland 1,970 1,546 945 0.155 0.205 0.129 4,843 5,483 2,760Orissa 37,435 29,991 22,424 0.062 0.059 0.043 245,378 126,914 80,543Pondicherry 2,340 6,014 5,026 0.170 0.210 0.233 8,904 20,842 12,314Punjab 27,942 38,415 38,581 0.081 0.088 0.097 88,075 100,772 95,305Rajasthan 22,887 29,192 40,822 0.044 0.051 0.064 82,768 98,275 118,021Tamil Nadu 116,992 122,916 155,113 0.122 0.124 0.125 497,407 514,582 539,777Tripura 1,852 2,891 1,576 0.042 0.047 0.013 4,032 4,732 9,130Uttar Pradesh 169,949 127,425 140,823 0.067 0.055 0.059 543,937 558,141 573,011West Bengal 116,091 133,018 149,127 0.076 0.069 0.076 186,230 221,739 241,858
Nationwide 1,091,887 1,300,267 1,431,996 0.079 0.088 0.089 3,681,202 4,017,939 4,149,488
Table 2b: State-level distribution of female activity in services
Notes: See Table 1.
Estimated count of female-owned establishments
Share of establishments in state that are female-owned
Estimated count of female employees

2001 2006 2010 2001 2006 2010 2001 2006 2010
A & N Islands 0.139 0.173 0.240 0.572 0.711 0.603 0.911 0.895 0.832Andhra Pradesh 0.311 0.290 0.256 0.761 0.787 0.867 0.747 0.777 0.828Assam 0.070 0.144 0.079 0.751 0.845 0.823 0.968 0.954 0.965Bihar 0.078 0.125 0.085 0.739 0.734 0.895 0.943 0.912 0.954Chandigarh 0.158 0.055 0.131 0.585 0.784 0.743 0.898 0.972 0.933Dadra & Nagar Haveli 0.102 0.092 0.157 0.442 0.476 0.917 0.953 0.966 0.971Daman & Diu 0.096 0.083 0.104 0.418 0.297 0.749 0.961 0.962 0.943Delhi 0.115 0.127 0.144 0.641 0.741 0.853 0.948 0.938 0.920Goa 0.251 0.276 0.199 0.759 0.688 0.902 0.812 0.840 0.883Gujarat 0.087 0.107 0.116 0.477 0.816 0.884 0.945 0.949 0.940Haryana 0.157 0.151 0.154 0.754 0.789 0.906 0.900 0.912 0.905Himachal Pradesh 0.106 0.116 0.110 0.510 0.692 0.786 0.937 0.933 0.954Jammu & Kashmir 0.124 0.081 0.111 0.846 0.790 0.746 0.926 0.947 0.925Karnataka 0.163 0.186 0.195 0.772 0.834 0.843 0.892 0.881 0.875Kerala 0.209 0.233 0.221 0.805 0.822 0.853 0.863 0.850 0.862Madhya Pradesh 0.124 0.136 0.118 0.716 0.685 0.798 0.920 0.910 0.930Maharashtra 0.160 0.165 0.153 0.659 0.750 0.883 0.913 0.909 0.927Manipur 0.255 0.250 0.342 0.844 0.836 0.865 0.854 0.860 0.840Meghalaya 0.396 0.365 0.351 0.774 0.789 0.816 0.839 0.901 0.958Nagaland 0.202 0.315 0.229 0.854 0.678 0.779 0.879 0.800 0.849Orissa 0.228 0.154 0.097 0.785 0.863 0.701 0.801 0.883 0.935Pondicherry 0.232 0.316 0.293 0.495 0.617 0.839 0.824 0.750 0.865Punjab 0.162 0.160 0.159 0.781 0.844 0.918 0.913 0.918 0.929Rajasthan 0.093 0.098 0.108 0.583 0.696 0.818 0.930 0.939 0.939Tamil Nadu 0.282 0.271 0.236 0.774 0.813 0.827 0.786 0.801 0.838Tripura 0.068 0.063 0.064 0.777 0.833 0.932 0.963 0.975 0.948Uttar Pradesh 0.136 0.145 0.133 0.798 0.723 0.795 0.911 0.896 0.907West Bengal 0.090 0.090 0.097 0.774 0.801 0.902 0.966 0.967 0.965
Nationwide 0.162 0.168 0.156 0.738 0.778 0.850 0.890 0.892 0.907
Notes: See Table 1.
Table 2b (continued)Share of employees in state who
are womenShare of female employees in female-owned establishments
Share of male employees in male-owned establishments

2001 2006 2010 2001 2006 2010 2001 2006 2010
15 Food products and beverages 322,477 407,214 310,072 0.110 0.163 0.144 1,511,752 1,421,604 956,76216 Tobacco products 1,368,973 2,008,088 1,807,527 0.654 0.721 0.815 2,143,567 2,861,262 2,266,57217 Textiles 821,118 1,132,295 1,327,794 0.349 0.467 0.509 2,262,706 2,256,550 2,316,94818 Wearing apparel; dressing and dyeing of fur 906,643 1,452,207 2,214,195 0.327 0.464 0.526 1,128,173 1,633,362 2,573,95519 Leather tanning; luggage, handbags, footwear 8,017 12,125 10,538 0.047 0.089 0.100 35,845 35,690 35,90520 Wood and wood products; straw and plating articles 477,855 437,638 206,609 0.173 0.211 0.135 1,379,253 1,223,001 570,93821 Paper and paper products 37,462 125,430 50,259 0.435 0.782 0.432 75,048 198,602 94,87122 Publishing, printing and media reproduction 8,763 9,559 12,701 0.066 0.089 0.079 32,926 41,686 55,18323 Coke, refined petroleum and nuclear fuel 196 392 38 0.029 0.074 0.041 1,973 1,541 1,10124 Chemicals and chemical products 165,455 332,369 152,666 0.781 0.821 0.739 258,966 510,297 263,46125 Rubber and plastic products 23,952 14,017 78,498 0.284 0.220 0.297 52,187 52,163 125,98126 Other non-metallic mineral products 35,521 33,779 40,912 0.045 0.056 0.074 792,384 502,389 631,42727 Basic metals 643 1,373 10,000 0.018 0.044 0.186 3,530 4,967 14,91028 Fabricated metal products, except machinery 11,141 11,230 8,922 0.018 0.019 0.014 98,328 65,839 57,17829 Machinery and equipment, n.e.c. 3,575 3,782 1,141 0.023 0.023 0.005 19,153 15,363 20,48430 Office, accounting and computing machinery 0 0 0 0.000 0.000 0.000 82 519 55031 Electrical machinery and apparatus, n.e.c. 3,051 4,346 952 0.051 0.043 0.036 32,323 21,864 7,21232 Radio, television, and comm. equipment 275 565 2,084 0.048 0.124 0.004 3,233 936 10,12433 Medical, precision and optical instruments, watches 409 408 232 0.054 0.045 0.022 1,703 1,992 2,02334 Motor vehicles, trailers and semi-trailers 318 207 594 0.017 0.015 0.036 2,273 2,408 7,29835 Other transport equipment 212 8,020 568 0.014 0.337 0.032 1,170 2,738 2,28636 Furniture, manufacturing n.e.c. 221,350 179,464 411,169 0.170 0.162 0.252 475,311 323,674 700,604
Nationwide 4,417,408 6,174,508 6,647,471 0.266 0.375 0.386 10,311,885 11,178,449 10,715,774
Notes: See Table 1.
Table 3a: Industry-level distribution of female activity in unorganized manufacturingEstimated count of female-
owned establishmentsShare of establishments in
industry that are female-owned Estimated count of female
employees

2001 2006 2010 2001 2006 2010 2001 2006 2010
15 Food products and beverages 0.254 0.273 0.227 0.736 0.790 0.808 0.791 0.789 0.84016 Tobacco products 0.686 0.759 0.809 0.957 0.961 0.981 0.596 0.575 0.66117 Textiles 0.413 0.432 0.438 0.895 0.929 0.942 0.710 0.746 0.79818 Wearing apparel; dressing and dyeing of fur 0.277 0.382 0.434 0.928 0.961 0.964 0.910 0.922 0.91019 Leather tanning; luggage, handbags, footwear 0.098 0.090 0.133 0.641 0.590 0.928 0.927 0.939 0.92020 Wood and wood products; straw and plating articles 0.311 0.348 0.226 0.794 0.921 0.867 0.765 0.790 0.85721 Paper and paper products 0.372 0.653 0.311 0.811 0.956 0.865 0.788 0.845 0.84222 Publishing, printing and media reproduction 0.083 0.124 0.114 0.349 0.571 0.414 0.937 0.917 0.91923 Coke, refined petroleum and nuclear fuel 0.097 0.093 0.254 0.471 0.383 0.695 0.911 0.934 0.77824 Chemicals and chemical products 0.558 0.729 0.622 0.931 0.981 0.973 0.780 0.623 0.66925 Rubber and plastic products 0.212 0.247 0.192 0.735 0.608 0.943 0.878 0.813 0.92226 Other non-metallic mineral products 0.332 0.268 0.278 0.598 0.618 0.506 0.678 0.745 0.73627 Basic metals 0.033 0.057 0.137 0.170 0.215 0.850 0.971 0.955 0.95228 Fabricated metal products, except machinery 0.070 0.046 0.033 0.274 0.252 0.507 0.936 0.962 0.97529 Machinery and equipment, n.e.c. 0.047 0.033 0.033 0.172 0.254 0.198 0.958 0.973 0.96930 Office, accounting and computing machinery 0.126 0.206 0.102 . . . 0.874 0.794 0.89831 Electrical machinery and apparatus, n.e.c. 0.157 0.098 0.092 0.528 0.532 0.671 0.860 0.928 0.92132 Radio, television, and comm. equipment 0.116 0.053 0.016 0.633 0.038 0.414 0.917 0.942 0.98833 Medical, precision and optical instruments, watches 0.073 0.068 0.062 0.597 0.291 0.194 0.946 0.945 0.94634 Motor vehicles, trailers and semi-trailers 0.028 0.029 0.093 0.116 0.553 0.568 0.974 0.982 0.93235 Other transport equipment 0.021 0.027 0.039 0.311 0.030 0.548 0.982 0.976 0.98836 Furniture, manufacturing n.e.c. 0.179 0.128 0.219 0.890 0.876 0.933 0.913 0.946 0.899
Nationwide 0.321 0.363 0.337 0.876 0.916 0.934 0.795 0.817 0.859
Notes: See Table 1.
Table 3a (continued)Share of employees in
industry who are womenShare of female employees in female-owned establishments
Share of male employees in male-owned establishments

2001 2006 2010 2001 2006 2010 2001 2006 2010
55 Hotels and restaurants 213,009 201,287 271,978 0.103 0.101 0.099 841,013 889,696 970,84760 Land transport; pipelines 21,018 27,643 7,204 0.005 0.007 0.001 51,922 53,261 24,95261 Water transport 2 58 0 0.000 0.003 0.000 511 58 29363 Supporting/auxiliary transport activities; travel agencies 3,748 2,994 3,279 0.044 0.028 0.020 8,933 13,681 30,97064 Post and telecommunications 83,704 171,186 60,881 0.143 0.092 0.139 137,654 377,026 97,74765 Financial intermediation . 17,739 21,291 . 0.200 0.193 . 40,634 85,29666 Insurance and pension funding, except social security . 3,974 4,464 . 0.066 0.086 . 4,522 4,69367 Activities auxiliary to financial intermediation . 19,693 28,680 . 0.126 0.092 . 28,900 38,69470 Real estate activities 2,620 22,206 37,643 0.033 0.110 0.092 5,625 33,088 48,05071 Renting machinery/equipment & personal/household goods 11,592 12,360 15,035 0.023 0.026 0.034 31,378 30,395 30,18572 Computers and related activities (for business) 2,082 1,831 4,786 0.129 0.045 0.047 4,746 12,669 21,71373 Research and development 0 0 0 0.000 0.000 0.000 237 0 074 Other business activities 28,801 23,911 70,609 0.050 0.039 0.079 85,987 106,074 242,57680 Education 294,912 292,002 333,376 0.271 0.318 0.357 970,366 953,301 1,206,73685 Health and social work 142,865 139,060 82,711 0.110 0.131 0.081 340,811 398,808 407,77090 Sewage, refuse disposal, sanitation, and similar activities 37,609 20,374 10,203 0.826 0.425 0.292 47,899 35,204 13,09491 Activities of membership organizations n.e.c. 1,616 1,550 1,278 0.036 0.004 0.004 1,230 11,124 3,30792 Recreational, cultural and sporting activities 10,916 7,886 8,972 0.031 0.035 0.036 64,188 28,950 27,82693 Other service activities 237,393 334,514 469,606 0.094 0.139 0.167 1,088,702 1,000,546 894,740
Nationwide 1,091,887 1,300,267 1,431,996 0.079 0.088 0.089 3,681,202 4,017,939 4,149,488
Table 3b: Industry-level distribution of female activity in services
Notes: See Table 1.
Estimated count of female-owned establishments
Share of establishments in industry that are female-owned
Estimated count of female employees

2001 2006 2010 2001 2006 2010 2001 2006 2010
55 Hotels and restaurants 0.182 0.192 0.166 0.656 0.657 0.765 0.864 0.853 0.88460 Land transport; pipelines 0.009 0.011 0.004 0.190 0.141 0.478 0.992 0.991 0.99761 Water transport 0.015 0.002 0.011 0.500 1.000 0.985 1.000 0.98963 Supporting/auxiliary transport activities; travel agencies 0.047 0.049 0.093 0.451 0.291 0.609 0.971 0.962 0.91664 Post and telecommunications 0.142 0.148 0.162 0.497 0.768 0.905 0.919 0.915 0.93265 Financial intermediation . 0.260 0.373 . 0.844 0.963 . 0.877 0.94666 Insurance and pension funding, except social security . 0.068 0.082 . 0.636 0.970 . 0.990 0.98467 Activities auxiliary to financial intermediation . 0.141 0.103 . 0.788 0.872 . 0.957 0.97170 Real estate activities 0.049 0.124 0.098 0.341 0.856 0.946 0.963 0.954 0.96971 Renting machinery/equipment & personal/household goods 0.037 0.038 0.035 0.444 0.563 0.658 0.973 0.975 0.98272 Computers and related activities (for business) 0.135 0.135 0.090 0.521 0.670 0.700 0.914 0.901 0.93273 Research and development 0.142 0.000 0.000 n.a. n.a. n.a. 0.858 1.000 1.00074 Other business activities 0.084 0.101 0.131 0.549 0.597 0.823 0.941 0.921 0.90980 Education 0.389 0.414 0.424 0.868 0.844 0.847 0.744 0.720 0.68485 Health and social work 0.186 0.239 0.233 0.828 0.856 0.833 0.896 0.854 0.83490 Sewage, refuse disposal, sanitation, and similar activities 0.841 0.509 0.221 0.996 0.909 0.968 0.567 0.745 0.96291 Activities of membership organizations n.e.c. 0.024 0.028 0.009 0.618 0.614 0.792 0.997 0.977 0.99492 Recreational, cultural and sporting activities 0.081 0.051 0.045 0.617 0.605 0.542 0.970 0.963 0.97393 Other service activities 0.268 0.272 0.230 0.797 0.868 0.929 0.781 0.814 0.895
Nationwide 0.162 0.168 0.156 0.738 0.778 0.850 0.890 0.892 0.907
Notes: See Table 1.
Table 3b (continued)Share of employees in
industry who are womenShare of female employees in female-owned establishments
Share of male employees in male-owned establishments

Distance 2001 2006 2010 Average 2001 2006 2010 Average 2001 2006 2010 Average 2001 2006 2010 Average
0-100 0.225 0.393 0.400 0.339 0.222 0.279 0.282 0.261 0.803 0.852 0.917 0.857 0.863 0.874 0.890 0.876100-200 0.298 0.468 0.446 0.404 0.362 0.443 0.421 0.408 0.903 0.961 0.961 0.942 0.758 0.790 0.802 0.783200-300 0.297 0.301 0.383 0.327 0.322 0.306 0.333 0.320 0.854 0.864 0.918 0.879 0.803 0.820 0.858 0.827300-400 0.312 0.461 0.448 0.407 0.369 0.434 0.409 0.404 0.880 0.928 0.955 0.921 0.775 0.813 0.853 0.814400-500 0.310 0.429 0.387 0.375 0.350 0.434 0.338 0.374 0.894 0.950 0.948 0.931 0.802 0.792 0.874 0.823500-600 0.188 0.292 0.248 0.243 0.314 0.327 0.267 0.302 0.909 0.911 0.843 0.888 0.779 0.834 0.860 0.824600-700 0.180 0.177 0.255 0.204 0.327 0.356 0.312 0.332 0.889 0.887 0.945 0.907 0.757 0.727 0.840 0.775700-800 0.229 0.209 0.325 0.254 0.309 0.247 0.321 0.292 0.908 0.924 0.956 0.929 0.795 0.859 0.852 0.835
800+ 0.086 0.285 0.354 0.242 0.286 0.305 0.282 0.291 0.904 0.945 0.987 0.945 0.763 0.870 0.943 0.859
0-100 0.099 0.100 0.110 0.103 0.178 0.157 0.162 0.166 0.766 0.787 0.864 0.806 0.894 0.915 0.916 0.908100-200 0.092 0.100 0.107 0.100 0.209 0.193 0.196 0.199 0.771 0.792 0.874 0.812 0.848 0.876 0.872 0.866200-300 0.089 0.082 0.086 0.086 0.156 0.164 0.157 0.159 0.696 0.742 0.864 0.768 0.893 0.892 0.906 0.897300-400 0.071 0.075 0.082 0.076 0.161 0.174 0.156 0.164 0.721 0.793 0.854 0.789 0.889 0.877 0.903 0.889400-500 0.083 0.094 0.069 0.082 0.152 0.171 0.123 0.149 0.689 0.792 0.811 0.764 0.897 0.890 0.929 0.905500-600 0.060 0.096 0.079 0.078 0.133 0.176 0.152 0.154 0.760 0.814 0.810 0.794 0.919 0.889 0.904 0.904600-700 0.073 0.070 0.068 0.070 0.174 0.154 0.117 0.148 0.807 0.720 0.857 0.795 0.866 0.888 0.927 0.894700-800 0.029 0.054 0.059 0.047 0.122 0.135 0.144 0.133 0.766 0.688 0.753 0.736 0.906 0.906 0.895 0.902
800+ 0.058 0.081 0.063 0.067 0.093 0.124 0.125 0.114 0.772 0.852 0.819 0.815 0.942 0.930 0.934 0.935
B. Services
Notes: See Table 1. Seven largest cities are Mumbai, Delhi, Kolkata, Chennai, Bangalore, Hyderabad and Ahmedabad. Distances measured in km.
Table 4: Female-owned activity by distance ring to 7 largest citiesShare of establishments in each band that
are female-ownedShare of employees in each band who are
femaleShare of female employees in female-
owned establishmentsShare of male employees in male-owned
establishments
A. Unorganized manufacturing

2001 2006 2010 2001 2006 2010 2001 2006 2010 2001 2006 2010
0.5 - 1 0.971 0.989 0.999 0.948 0.962 0.996 0.976 0.986 0.998 0.982 0.982 0.9971.5 - 3 0.838 0.895 0.884 0.736 0.763 0.820 0.641 0.713 0.708 0.814 0.830 0.8693.5 - 5 0.570 0.670 0.733 0.805 0.832 0.879 0.541 0.580 0.634 0.878 0.897 0.926
5.5 - 9.5 0.295 0.242 0.464 0.850 0.839 0.855 0.501 0.543 0.548 0.914 0.909 0.91510-19 0.545 0.592 0.560 0.884 0.881 0.88420-29 N/A N/A 0.573 0.558 0.584 0.848 0.870 0.79830-49 0.546 0.544 0.544 0.758 0.908 0.80550-99 0.634 0.499 0.497 0.828 0.928 0.789100+ 0.779 0.791 0.709 0.867 0.895 0.809Total 0.876 0.916 0.934 0.795 0.817 0.859 0.718 0.787 0.811 0.870 0.884 0.904
0.5 - 1 0.902 0.940 0.999 0.994 0.994 0.999 1.000 1.000 0.996 1.000 1.000 0.9991.5 - 3 0.661 0.706 0.782 0.839 0.825 0.870 0.595 0.759 0.774 0.900 0.887 0.9143.5 - 5 0.653 0.611 0.689 0.830 0.843 0.861 0.609 0.637 0.756 0.901 0.903 0.916
5.5 - 9.5 0.530 0.615 0.674 0.813 0.809 0.838 0.596 0.655 0.853 0.888 0.890 0.89510-19 0.633 0.629 0.729 0.777 0.749 0.755 0.661 0.921 0.878 0.860 0.869 0.84420-29 0.571 0.456 0.598 0.693 0.716 0.655 0.535 0.865 0.619 0.779 0.838 0.74630-49 0.582 0.409 0.522 0.652 0.841 0.787 0.602 0.649 0.596 0.745 0.787 0.77950-99 0.710 0.547 0.655 0.534 0.758 0.524 0.624 0.631 0.689 0.734 0.710 0.576100+ . . 0.150 0.372 0.556 0.812 0.799 0.506 0.568 0.827 0.705 0.844Total 0.738 0.778 0.850 0.890 0.892 0.907 0.671 0.819 0.824 0.930 0.925 0.934
A. Unorganized and organized manufacturing
B. Services
Notes: See Table 1. Part-time employees are represented as one-half of a full-time employee.
Table 5: Gender segmentation by establishment sizeShare of female employees in female-
owned establishmentsShare of male employees in male-
owned establishmentsShare of the avg. female employee's co-
workers who are also femaleShare of the avg. male employee's
co-workers who are also maleEmpl.Count

Share of female-owned plants
Share of femaleemployees
Share of female empl. in female-
owned plants
Share of male empl. in male-owned plants
Share of female-owned plants
Share of femaleemployees
Share of female empl. in female-
owned plants
Share of male empl. in male-owned plants
(1) (2) (3) (4) (5) (6) (7) (8)
Percentage of pop. in rural setting -0.030 0.039 0.002 -0.055** -0.011 -0.010 0.039 0.004(0.063) (0.054) (0.038) (0.026) (0.016) (0.027) (0.043) (0.022)
Log district population 0.028** 0.023** 0.001 -0.020*** 0.000 -0.003 0.002 0.003(0.011) (0.010) (0.011) (0.006) (0.004) (0.006) (0.009) (0.005)
Demographic dividend 0.075** 0.133*** -0.032 -0.119*** 0.072*** 0.150*** 0.065* -0.117***(0.037) (0.033) (0.043) (0.024) (0.014) (0.024) (0.038) (0.021)
Female-to-male ratio 0.680*** 1.018*** 0.418** -0.664*** 0.097** 0.416*** 0.016 -0.390***(0.182) (0.160) (0.162) (0.078) (0.038) (0.067) (0.121) (0.058)
Percentage of pop. in sch. caste or tribe 0.175 0.244** 0.160 -0.145** 0.108*** 0.100* 0.035 -0.025(0.110) (0.100) (0.115) (0.059) (0.037) (0.059) (0.092) (0.051)
Literacy rate 0.078 -0.095 0.019 0.152** 0.010 -0.323*** 0.081 0.346***(0.096) (0.091) (0.088) (0.060) (0.028) (0.051) (0.080) (0.044)
Composite infrastructure measure 0.064*** 0.012 0.032*** 0.015 0.010** 0.049*** 0.009 -0.042***(0.015) (0.015) (0.012) (0.009) (0.004) (0.008) (0.013) (0.007)
Log distance to national highway -0.003 -0.003 -0.002 -0.000 0.000 -0.001 -0.006 0.000(0.006) (0.005) (0.006) (0.003) (0.002) (0.003) (0.004) (0.003)
Log distance to state highway 0.000 0.002 -0.002 -0.003 -0.000 -0.001 0.006 0.002(0.006) (0.005) (0.005) (0.003) (0.002) (0.003) (0.006) (0.002)
Log distance to railway 0.004 -0.001 0.003 0.003 0.003** 0.003 -0.004 -0.002(0.006) (0.005) (0.004) (0.003) (0.001) (0.003) (0.005) (0.003)
Prop. of plants in district using internet -0.342 -0.471 -0.369 0.164 0.057 0.225** -0.245* -0.196**(0.455) (0.448) (0.306) (0.207) (0.092) (0.102) (0.144) (0.084)
(0,1) 0-200 km from big-7 city 0.074*** 0.049* 0.012 -0.007 0.012* -0.003 0.076*** 0.015(0.027) (0.026) (0.024) (0.015) (0.006) (0.012) (0.022) (0.010)
(0,1) 200-400 km from big-7 city 0.050** 0.028 -0.021 0.004 0.003 -0.010 0.034 0.012(0.024) (0.023) (0.019) (0.013) (0.006) (0.009) (0.021) (0.008)
(0,1) 400-600 km from big-7 city 0.034* 0.013 -0.004 0.011 0.006 0.001 0.035 0.004(0.020) (0.021) (0.022) (0.014) (0.005) (0.008) (0.021) (0.008)
Table 6a: Average gender activity by district, 2001-2010Manufacturing Services
Notes: Estimations include 421 observations, are weighted by log district population, and report robust standard errors.

Share of female-owned plants
Share of femaleemployees
Share of female empl. in female-
owned plants
Share of male empl. in male-owned plants
Share of female-owned plants
Share of femaleemployees
Share of female empl. in female-
owned plants
Share of male empl. in male-owned plants
(1) (2) (3) (4) (5) (6) (7) (8)
Percentage of pop. in rural setting -0.097 -0.096* -0.056 0.019 -0.047* -0.024 0.060 -0.005(0.074) (0.057) (0.060) (0.033) (0.026) (0.034) (0.072) (0.023)
Log district population 0.024 0.011 -0.014 -0.008 -0.001 0.004 0.046*** -0.003(0.016) (0.013) (0.013) (0.008) (0.006) (0.007) (0.015) (0.005)
Demographic dividend 0.033 -0.024 -0.016 -0.005 0.053** 0.083*** 0.009 -0.067***(0.066) (0.051) (0.040) (0.028) (0.021) (0.026) (0.067) (0.021)
Female-to-male ratio 0.368 0.518*** -0.010 -0.416*** 0.182*** 0.274*** -0.188 -0.252***(0.229) (0.185) (0.204) (0.100) (0.058) (0.080) (0.210) (0.067)
Percentage of pop. in sch. caste or tribe 0.037 0.150 0.346** -0.105 0.009 0.047 0.527*** -0.021(0.147) (0.125) (0.153) (0.068) (0.049) (0.062) (0.158) (0.048)
Literacy rate 0.089 0.059 0.196 0.045 0.032 -0.114* 0.408*** 0.181***(0.119) (0.091) (0.128) (0.062) (0.045) (0.063) (0.151) (0.046)
Composite infrastructure measure 0.042* 0.043*** 0.048** -0.021* 0.005 0.026*** 0.025 -0.027***(0.022) (0.016) (0.021) (0.011) (0.006) (0.010) (0.022) (0.007)
Log distance to national highway 0.007 0.008 0.014* -0.003 0.001 -0.000 -0.007 0.001(0.007) (0.006) (0.007) (0.004) (0.002) (0.003) (0.008) (0.003)
Log distance to state highway 0.009 0.007 -0.010 -0.006 0.003 0.001 0.012 0.001(0.008) (0.007) (0.007) (0.004) (0.003) (0.003) (0.012) (0.002)
Log distance to railway -0.002 -0.008 -0.000 0.007* 0.006*** 0.009** -0.014* -0.003(0.007) (0.006) (0.006) (0.003) (0.002) (0.004) (0.008) (0.003)
Prop. of plants in district using internet -1.070*** -0.760** -0.956*** -0.046 0.203 0.530** -0.709*** -0.534***(0.382) (0.311) (0.244) (0.123) (0.205) (0.220) (0.262) (0.124)
(0,1) 0-200 km from big-7 city 0.059* 0.033 -0.050* 0.001 0.023** -0.001 0.051 0.011(0.035) (0.030) (0.026) (0.019) (0.010) (0.014) (0.043) (0.012)
(0,1) 200-400 km from big-7 city 0.037 0.021 -0.052** 0.011 0.000 -0.012 0.053 0.011(0.028) (0.023) (0.025) (0.015) (0.008) (0.011) (0.040) (0.010)
(0,1) 400-600 km from big-7 city -0.024 -0.031 -0.113*** 0.014 0.007 -0.011 0.032 0.015(0.024) (0.020) (0.038) (0.014) (0.008) (0.011) (0.038) (0.010)
Table 6b: Change in gender activity by district, 2001-2010Manufacturing Services
Notes: Estimations include 421 observations, are weighted by log district population, control for initial value of dependent variable, and report robust standard errors.

Distance 2001 2006 2010 Change 2001 2006 2010 Change 2001 2006 2010 Change 2001 2006 2010 Change
Nodal 0.155 0.244 0.230 0.075 0.100 0.108 0.144 0.044 0.618 0.732 0.815 0.197 0.949 0.964 0.937 -0.0120-10 0.273 0.393 0.429 0.156 0.350 0.390 0.364 0.014 0.860 0.919 0.935 0.075 0.760 0.791 0.849 0.08910-50 0.217 0.250 0.344 0.127 0.284 0.280 0.359 0.075 0.893 0.820 0.952 0.059 0.816 0.835 0.835 0.019
50-100 0.287 0.344 0.380 0.093 0.365 0.391 0.390 0.025 0.902 0.927 0.919 0.017 0.753 0.760 0.775 0.022100-250 0.233 0.380 0.375 0.142 0.317 0.394 0.342 0.025 0.887 0.932 0.941 0.054 0.790 0.794 0.867 0.077
250+ 0.340 0.457 0.393 0.053 0.359 0.412 0.339 -0.020 0.910 0.946 0.952 0.042 0.818 0.854 0.891 0.073
Nodal 0.089 0.129 0.117 0.028 0.118 0.160 0.150 0.032 0.679 0.733 0.866 0.187 0.942 0.922 0.922 -0.0200-10 0.082 0.097 0.095 0.013 0.168 0.174 0.167 -0.001 0.737 0.795 0.858 0.121 0.883 0.892 0.901 0.01810-50 0.087 0.064 0.084 -0.003 0.152 0.145 0.151 -0.001 0.792 0.767 0.852 0.060 0.904 0.903 0.903 -0.001
50-100 0.055 0.076 0.078 0.023 0.149 0.191 0.153 0.004 0.728 0.728 0.820 0.092 0.889 0.855 0.896 0.007100-250 0.069 0.068 0.071 0.002 0.170 0.169 0.151 -0.019 0.759 0.768 0.845 0.086 0.873 0.878 0.904 0.031
250+ 0.095 0.103 0.094 -0.001 0.164 0.163 0.151 -0.013 0.717 0.803 0.844 0.127 0.903 0.909 0.920 0.017
Notes: See Table 1. Distances measured in km.
Table 7: Female-owned activity by distance ring to GQ highway networkShare of establishments in each band that
are female-ownedShare of employees in each band who are
femaleShare of female employees in female-
owned establishmentsShare of male employees in male-owned
establishments
A. Unorganized manufacturing
B. Services

Baseline estimationExcluding industry
weightsExcluding initial level of
dependent variableIncluding initial female empl. share for industry
Including initial female empl. share for industry
and its change(1) (2) (3) (4) (5)
Decline in industry tariff -0.055 0.055 -0.084 -0.025 0.103(0.065) (0.201) (0.057) (0.075) (0.067)
Decline in industry tariff -0.254 -0.010 -0.451** -0.245 0.209(0.219) (0.211) (0.184) (0.209) (0.197)
Decline in industry tariff 0.322 -0.057 0.254 n.a. n.a.(0.278) (0.114) (0.324)
Decline in industry tariff -0.106 0.139 -0.275** -0.105 -0.055(0.122) (0.108) (0.130) (0.119) (0.073)
Decline in industry tariff 0.148 0.238* 0.088 0.119 0.016(0.098) (0.121) (0.102) (0.086) (0.059)
Decline in industry tariff -0.074 0.146 -0.190 -0.069 -0.083(0.098) (0.107) (0.115) (0.083) (0.095)
Table 8a: Industry-level competition analysis in manufacturing sector - baseline trade tariffs
Notes: Estimations include 50 industry-level observations, are weighted by log industry employment, winsorize changes at 5%/95% level, include initial values of dependent variables, report robust standard errors, and are transformed to unit standard deviations.
A. Change in log total employment
B. Change in log female employment
D. Change in male segmentation
F. Change in combined segmentation
C. Change in female employment share
E. Change in female segmentation

Baseline estimationExcluding industry
weightsExcluding initial level of
dependent variableIncluding initial female empl. share for industry
Including initial female empl. share for industry
and its change(1) (2) (3) (4) (5)
Decline in industry tariff 0.086 0.083 0.002 0.107 0.060(0.095) (0.248) (0.081) (0.080) (0.053)
Decline in industry tariff 0.400 0.196 -0.077 0.441 0.371***(0.246) (0.272) (0.211) (0.264) (0.093)
Decline in industry tariff 0.568 0.114 0.320 n.a. n.a.(0.354) (0.169) (0.431)
Decline in industry tariff -0.131 0.003 -0.344*** -0.149* -0.064(0.091) (0.136) (0.059) (0.087) (0.088)
Decline in industry tariff 0.200** -0.006 0.164 0.238* 0.131**(0.099) (0.109) (0.151) (0.122) (0.051)
Decline in industry tariff -0.170 0.036 -0.250* -0.105 -0.162(0.183) (0.141) (0.148) (0.125) (0.099)
F. Change in combined segmentation
Notes: See Table 8a.
Table 8b: Industry-level competition analysis in manufacturing sector - input trade tariffs
A. Change in log total employment
B. Change in log female employment
C. Change in female employment share
D. Change in male segmentation
E. Change in female segmentation

Baseline estimationExcluding industry
weightsExcluding initial level of
dependent variableIncluding initial female empl. share for industry
Including initial female empl. share for industry
and its change(1) (2) (3) (4) (5)
Decline in industry tariff -0.063 0.041 -0.085 -0.043 0.092(0.068) (0.189) (0.056) (0.078) (0.054)
Decline in industry tariff -0.257 -0.021 -0.366 -0.253 0.139(0.226) (0.185) (0.216) (0.229) (0.173)
Decline in industry tariff 0.254 -0.107 0.213 n.a. n.a.(0.290) (0.111) (0.299)
Decline in industry tariff -0.050 0.182* -0.193 -0.053 -0.016(0.130) (0.106) (0.145) (0.127) (0.075)
Decline in industry tariff 0.116 0.207* 0.069 0.094 0.006(0.088) (0.110) (0.088) (0.084) (0.058)
Decline in industry tariff 0.016 0.181* -0.109 -0.013 -0.016(0.077) (0.103) (0.090) (0.081) (0.092)
F. Change in combined segmentation
Notes: See Table 8a.
Table 8c: Industry-level competition analysis in manufacturing sector - ERP tariffs
A. Change in log total employment
B. Change in log female employment
C. Change in female employment share
D. Change in male segmentation
E. Change in female segmentation

Baseline estimationExcluding industry
weightsExcluding initial level of
dependent variableIncluding female initial empl. share for industry
Including female initial empl. share for industry
and its change(1) (2) (3) (4) (5)
Increase in share of products 0.165* 0.283** 0.056 0.177** 0.038unreserved in industry (0.088) (0.132) (0.099) (0.084) (0.064)
Increase in share of products 0.540** 0.373*** 0.127 0.534** 0.267unreserved in industry (0.223) (0.126) (0.240) (0.221) (0.202)
Increase in share of products 0.889*** 0.347*** 0.665** n.a. n.a.unreserved in industry (0.247) (0.119) (0.309)
Increase in share of products -0.133 -0.214** -0.370*** -0.150* 0.025unreserved in industry (0.082) (0.104) (0.081) (0.077) (0.094)
Increase in share of products 0.252** 0.023 0.245* 0.267** 0.035unreserved in industry (0.105) (0.131) (0.139) (0.117) (0.079)
Increase in share of products -0.025 -0.180* -0.181 -0.000 -0.093unreserved in industry (0.118) (0.101) (0.135) (0.095) (0.121)
F. Change in combined segmentation
Notes: Estimations include 50 industry-level observations, are weighted by log industry employment, winsorize changes at 5%/95% level, include initial values of dependent variables, report robust standard errors, and are transformed to unit standard deviations.
Table 9: Industry-level competition analysis in manufacturing sector - product de-reservations
A. Change in log total employment
B. Change in log female employment
C. Change in female employment share
D. Change in male segmentation
E. Change in female segmentation

Appendix Tables

Distance 2001 2006 2010 Average 2001 2006 2010 Average 2001 2006 2010 Average 2001 2006 2010 Average
0-100 0.214 0.352 0.371 0.312 0.192 0.227 0.254 0.224 0.780 0.806 0.908 0.831 0.886 0.908 0.903 0.899100-200 0.295 0.461 0.486 0.414 0.375 0.421 0.448 0.414 0.893 0.961 0.973 0.942 0.747 0.854 0.873 0.825200-300 0.177 0.260 0.378 0.271 0.247 0.259 0.318 0.274 0.697 0.806 0.896 0.800 0.815 0.855 0.885 0.852300-400 0.299 0.434 0.416 0.383 0.322 0.381 0.374 0.359 0.868 0.918 0.957 0.914 0.830 0.844 0.874 0.849400-500 0.184 0.245 0.259 0.229 0.274 0.313 0.237 0.275 0.838 0.917 0.933 0.896 0.808 0.806 0.897 0.837500-600 0.161 0.307 0.327 0.265 0.275 0.304 0.275 0.285 0.898 0.911 0.884 0.898 0.806 0.869 0.875 0.850600-700 0.303 0.276 0.341 0.307 0.362 0.390 0.353 0.368 0.918 0.931 0.946 0.932 0.788 0.744 0.844 0.792700-800 0.233 0.423 0.412 0.356 0.323 0.424 0.384 0.377 0.900 0.952 0.959 0.937 0.778 0.767 0.832 0.792
800+ 0.371 0.480 0.438 0.430 0.419 0.452 0.403 0.424 0.916 0.941 0.942 0.933 0.731 0.757 0.793 0.761
0-100 0.093 0.097 0.110 0.100 0.122 0.134 0.143 0.133 0.758 0.774 0.871 0.801 0.944 0.938 0.933 0.938100-200 0.086 0.082 0.083 0.084 0.119 0.128 0.123 0.124 0.749 0.781 0.902 0.811 0.940 0.937 0.941 0.940200-300 0.077 0.067 0.071 0.072 0.104 0.107 0.120 0.110 0.642 0.716 0.870 0.743 0.936 0.937 0.933 0.935300-400 0.060 0.061 0.054 0.058 0.131 0.131 0.108 0.123 0.760 0.742 0.838 0.780 0.919 0.912 0.935 0.922400-500 0.075 0.085 0.066 0.075 0.136 0.150 0.108 0.131 0.722 0.801 0.846 0.790 0.912 0.909 0.940 0.920500-600 0.047 0.078 0.072 0.066 0.117 0.140 0.124 0.127 0.754 0.802 0.827 0.794 0.917 0.919 0.926 0.921600-700 0.077 0.075 0.083 0.078 0.176 0.160 0.151 0.162 0.722 0.748 0.841 0.770 0.868 0.888 0.911 0.889700-800 0.070 0.076 0.085 0.077 0.200 0.182 0.186 0.189 0.719 0.732 0.820 0.757 0.841 0.866 0.868 0.858
800+ 0.112 0.124 0.122 0.119 0.236 0.253 0.226 0.238 0.767 0.808 0.849 0.808 0.836 0.821 0.852 0.837
Notes: See Table 4. Three largest cities are Mumbai, Delhi and Kolkata.
Appendix Table 1: Female-owned activity by distance ring to 3 largest citiesShare of employees in each band who are
femaleShare of establishments in each band that
are female-owned
B. Services
A. Unorganized manufacturing
Share of male employees in male-owned establishments
Share of female employees in female-owned establishments
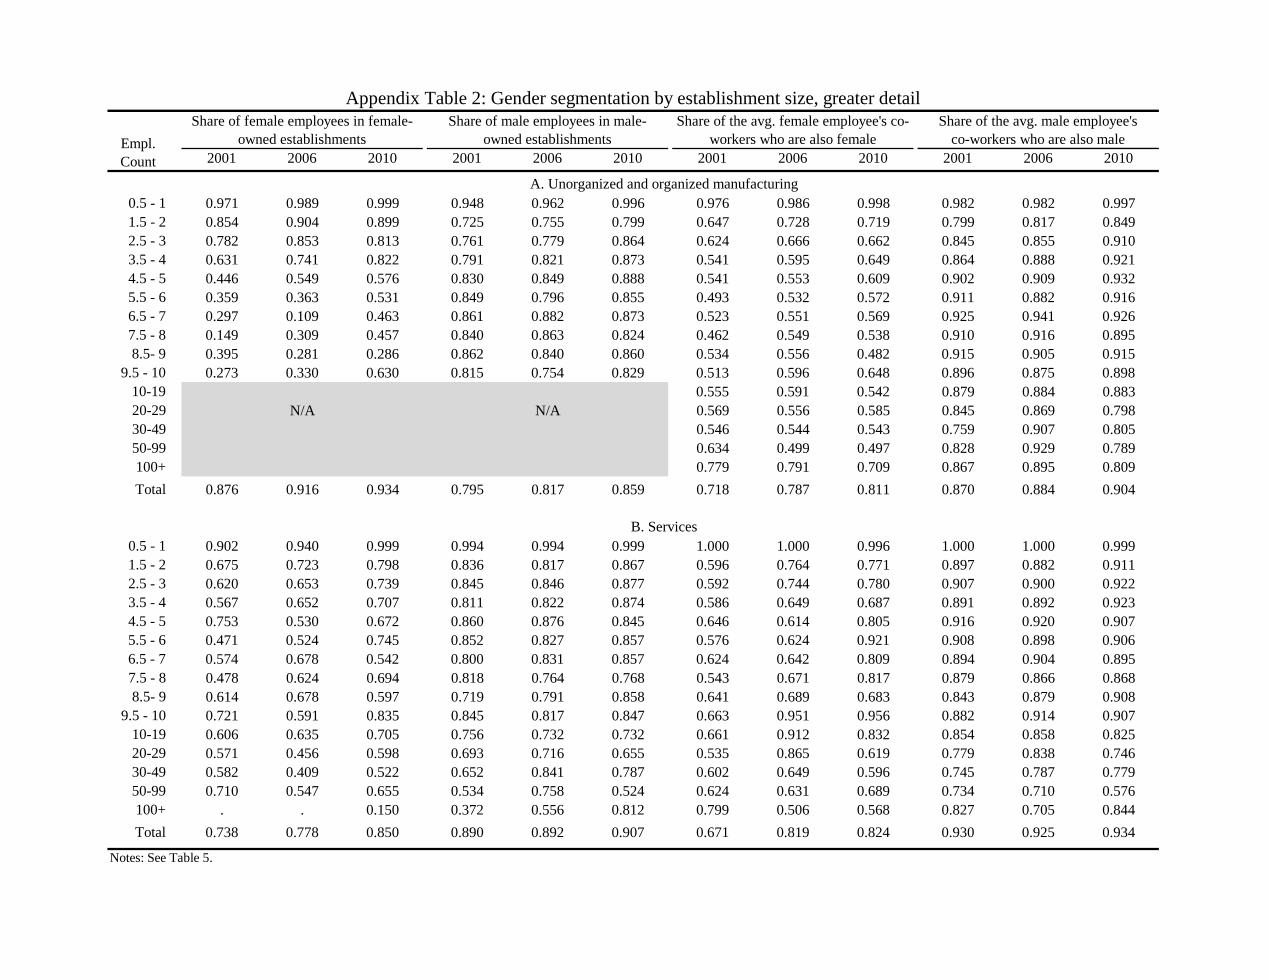
2001 2006 2010 2001 2006 2010 2001 2006 2010 2001 2006 2010
0.5 - 1 0.971 0.989 0.999 0.948 0.962 0.996 0.976 0.986 0.998 0.982 0.982 0.9971.5 - 2 0.854 0.904 0.899 0.725 0.755 0.799 0.647 0.728 0.719 0.799 0.817 0.8492.5 - 3 0.782 0.853 0.813 0.761 0.779 0.864 0.624 0.666 0.662 0.845 0.855 0.9103.5 - 4 0.631 0.741 0.822 0.791 0.821 0.873 0.541 0.595 0.649 0.864 0.888 0.9214.5 - 5 0.446 0.549 0.576 0.830 0.849 0.888 0.541 0.553 0.609 0.902 0.909 0.9325.5 - 6 0.359 0.363 0.531 0.849 0.796 0.855 0.493 0.532 0.572 0.911 0.882 0.9166.5 - 7 0.297 0.109 0.463 0.861 0.882 0.873 0.523 0.551 0.569 0.925 0.941 0.9267.5 - 8 0.149 0.309 0.457 0.840 0.863 0.824 0.462 0.549 0.538 0.910 0.916 0.8958.5- 9 0.395 0.281 0.286 0.862 0.840 0.860 0.534 0.556 0.482 0.915 0.905 0.915
9.5 - 10 0.273 0.330 0.630 0.815 0.754 0.829 0.513 0.596 0.648 0.896 0.875 0.89810-19 0.555 0.591 0.542 0.879 0.884 0.88320-29 N/A N/A 0.569 0.556 0.585 0.845 0.869 0.79830-49 0.546 0.544 0.543 0.759 0.907 0.80550-99 0.634 0.499 0.497 0.828 0.929 0.789100+ 0.779 0.791 0.709 0.867 0.895 0.809Total 0.876 0.916 0.934 0.795 0.817 0.859 0.718 0.787 0.811 0.870 0.884 0.904
0.5 - 1 0.902 0.940 0.999 0.994 0.994 0.999 1.000 1.000 0.996 1.000 1.000 0.9991.5 - 2 0.675 0.723 0.798 0.836 0.817 0.867 0.596 0.764 0.771 0.897 0.882 0.9112.5 - 3 0.620 0.653 0.739 0.845 0.846 0.877 0.592 0.744 0.780 0.907 0.900 0.9223.5 - 4 0.567 0.652 0.707 0.811 0.822 0.874 0.586 0.649 0.687 0.891 0.892 0.9234.5 - 5 0.753 0.530 0.672 0.860 0.876 0.845 0.646 0.614 0.805 0.916 0.920 0.9075.5 - 6 0.471 0.524 0.745 0.852 0.827 0.857 0.576 0.624 0.921 0.908 0.898 0.9066.5 - 7 0.574 0.678 0.542 0.800 0.831 0.857 0.624 0.642 0.809 0.894 0.904 0.8957.5 - 8 0.478 0.624 0.694 0.818 0.764 0.768 0.543 0.671 0.817 0.879 0.866 0.8688.5- 9 0.614 0.678 0.597 0.719 0.791 0.858 0.641 0.689 0.683 0.843 0.879 0.908
9.5 - 10 0.721 0.591 0.835 0.845 0.817 0.847 0.663 0.951 0.956 0.882 0.914 0.90710-19 0.606 0.635 0.705 0.756 0.732 0.732 0.661 0.912 0.832 0.854 0.858 0.82520-29 0.571 0.456 0.598 0.693 0.716 0.655 0.535 0.865 0.619 0.779 0.838 0.74630-49 0.582 0.409 0.522 0.652 0.841 0.787 0.602 0.649 0.596 0.745 0.787 0.77950-99 0.710 0.547 0.655 0.534 0.758 0.524 0.624 0.631 0.689 0.734 0.710 0.576100+ . . 0.150 0.372 0.556 0.812 0.799 0.506 0.568 0.827 0.705 0.844Total 0.738 0.778 0.850 0.890 0.892 0.907 0.671 0.819 0.824 0.930 0.925 0.934
A. Unorganized and organized manufacturing
B. Services
Notes: See Table 5.
Appendix Table 2: Gender segmentation by establishment size, greater detailShare of female employees in female-
owned establishmentsShare of male employees in male-
owned establishmentsShare of the avg. female employee's co-
workers who are also femaleShare of the avg. male employee's
co-workers who are also maleEmpl.Count

Distance 2001 2006 2010 Change 2001 2006 2010 Change 2001 2006 2010 Change
Nodal 0.951 0.958 0.924 -0.027 0.525 0.524 0.562 0.037 0.911 0.923 0.871 -0.0400-10 0.853 0.895 0.855 0.001 0.650 0.648 0.584 -0.065 0.793 0.838 0.785 -0.00910-50 0.916 0.933 0.847 -0.069 0.651 0.551 0.458 -0.193 0.864 0.883 0.761 -0.10350-100 0.762 0.885 0.782 0.021 0.557 0.628 0.535 -0.022 0.690 0.825 0.704 0.013
100-250 0.847 0.842 0.811 -0.036 0.549 0.575 0.576 0.028 0.771 0.770 0.739 -0.033250+ 0.840 0.859 0.808 -0.032 0.749 0.765 0.758 0.009 0.804 0.824 0.786 -0.019
Nodal 0.807 0.857 0.914 0.107 0.508 0.605 0.676 0.168 0.723 0.790 0.864 0.1410-10 0.808 0.833 0.783 -0.025 0.652 0.850 0.851 0.199 0.752 0.842 0.823 0.07110-50 0.881 0.817 0.852 -0.029 0.604 0.757 0.871 0.267 0.817 0.791 0.862 0.04650-100 0.854 0.841 0.817 -0.037 0.661 0.851 0.725 0.063 0.796 0.846 0.780 -0.016
100-250 0.785 0.834 0.757 -0.028 0.665 0.923 0.761 0.096 0.738 0.895 0.759 0.021250+ 0.816 0.789 0.766 -0.050 0.659 0.849 0.785 0.126 0.761 0.824 0.776 0.015
Notes: See Table 1. Distance measured in km.
A. Unorganized manufacturing
B. Services
Appendix Table 3a: Employee-based segmentation by distance to GQ - Services and Unorganized Mfg.Share of the avg. female employee's co-
workers who are also femaleCombined male and female metric for being with employees of same gender
Share of the avg. male employee's co-workers who are also male

Distance 2001 2006 2010 Change 2001 2006 2010 Change 2001 2006 2010 Change
Nodal 0.951 0.958 0.924 -0.027 0.525 0.524 0.562 0.037 0.911 0.923 0.871 -0.0400-10 0.853 0.895 0.855 0.001 0.650 0.648 0.584 -0.065 0.793 0.838 0.785 -0.00910-50 0.916 0.933 0.847 -0.069 0.651 0.551 0.458 -0.193 0.864 0.883 0.761 -0.10350-100 0.762 0.885 0.782 0.021 0.557 0.628 0.535 -0.022 0.690 0.825 0.704 0.013
100-250 0.847 0.842 0.811 -0.036 0.549 0.575 0.576 0.028 0.771 0.770 0.739 -0.033250+ 0.840 0.859 0.808 -0.032 0.749 0.765 0.758 0.009 0.804 0.824 0.786 -0.019
Nodal 0.807 0.857 0.914 0.107 0.508 0.605 0.676 0.168 0.723 0.790 0.864 0.1410-10 0.808 0.833 0.783 -0.025 0.652 0.850 0.851 0.199 0.752 0.842 0.823 0.07110-50 0.881 0.817 0.852 -0.029 0.604 0.757 0.871 0.267 0.817 0.791 0.862 0.04650-100 0.854 0.841 0.817 -0.037 0.661 0.851 0.725 0.063 0.796 0.846 0.780 -0.016
100-250 0.785 0.834 0.757 -0.028 0.665 0.923 0.761 0.096 0.738 0.895 0.759 0.021250+ 0.816 0.789 0.766 -0.050 0.659 0.849 0.785 0.126 0.761 0.824 0.776 0.015
Notes: See Table 1. Distance measured in km.
Appendix Table 3b: Employee-based segmentation by distance to GQ - Services and Organized Mfg.Combined male and female metric for being with employees of same gender
A. Organized manufacturing
B. Organized Services
Share of the avg. male employee's co-workers who are also male
Share of the avg. female employee's co-workers who are also female
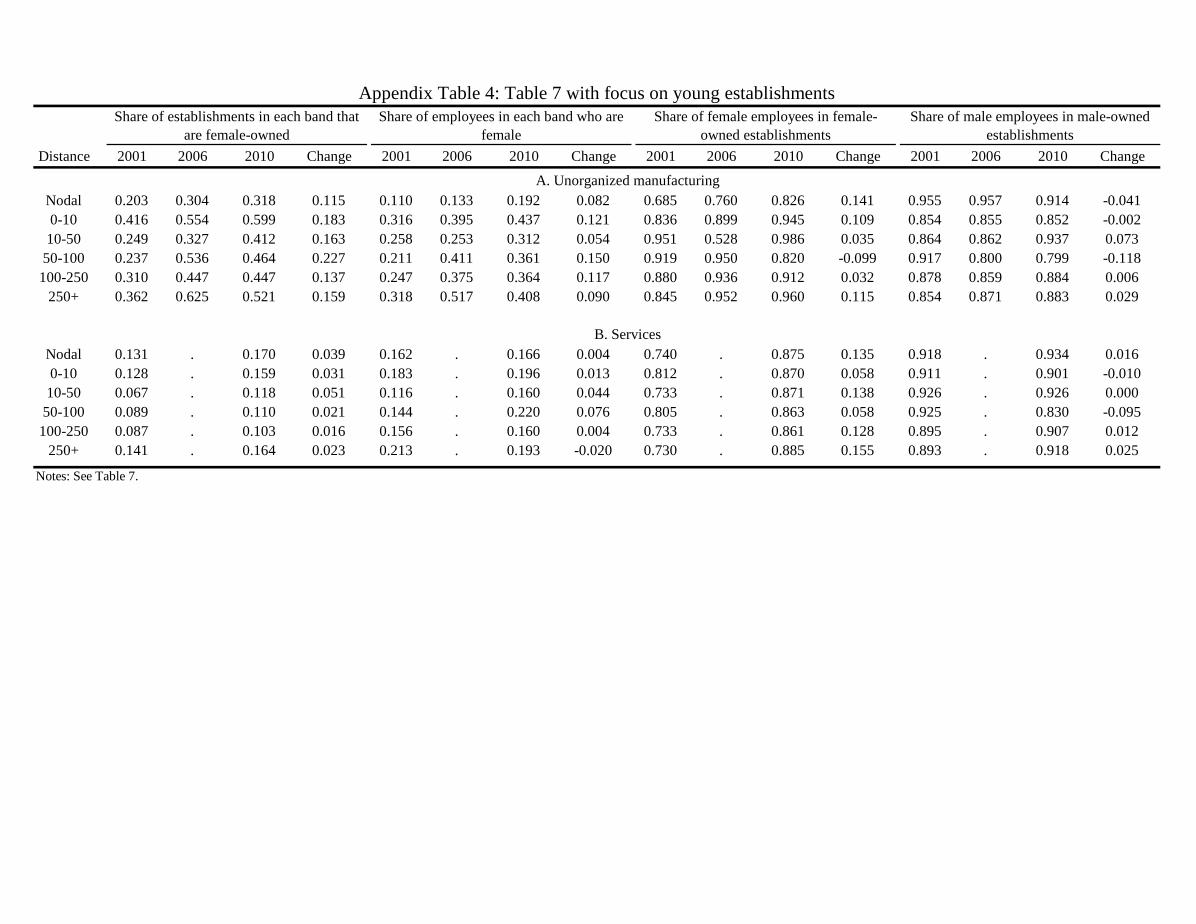
Distance 2001 2006 2010 Change 2001 2006 2010 Change 2001 2006 2010 Change 2001 2006 2010 Change
Nodal 0.203 0.304 0.318 0.115 0.110 0.133 0.192 0.082 0.685 0.760 0.826 0.141 0.955 0.957 0.914 -0.0410-10 0.416 0.554 0.599 0.183 0.316 0.395 0.437 0.121 0.836 0.899 0.945 0.109 0.854 0.855 0.852 -0.00210-50 0.249 0.327 0.412 0.163 0.258 0.253 0.312 0.054 0.951 0.528 0.986 0.035 0.864 0.862 0.937 0.073
50-100 0.237 0.536 0.464 0.227 0.211 0.411 0.361 0.150 0.919 0.950 0.820 -0.099 0.917 0.800 0.799 -0.118100-250 0.310 0.447 0.447 0.137 0.247 0.375 0.364 0.117 0.880 0.936 0.912 0.032 0.878 0.859 0.884 0.006
250+ 0.362 0.625 0.521 0.159 0.318 0.517 0.408 0.090 0.845 0.952 0.960 0.115 0.854 0.871 0.883 0.029
Nodal 0.131 . 0.170 0.039 0.162 . 0.166 0.004 0.740 . 0.875 0.135 0.918 . 0.934 0.0160-10 0.128 . 0.159 0.031 0.183 . 0.196 0.013 0.812 . 0.870 0.058 0.911 . 0.901 -0.01010-50 0.067 . 0.118 0.051 0.116 . 0.160 0.044 0.733 . 0.871 0.138 0.926 . 0.926 0.000
50-100 0.089 . 0.110 0.021 0.144 . 0.220 0.076 0.805 . 0.863 0.058 0.925 . 0.830 -0.095100-250 0.087 . 0.103 0.016 0.156 . 0.160 0.004 0.733 . 0.861 0.128 0.895 . 0.907 0.012
250+ 0.141 . 0.164 0.023 0.213 . 0.193 -0.020 0.730 . 0.885 0.155 0.893 . 0.918 0.025
Appendix Table 4: Table 7 with focus on young establishmentsShare of establishments in each band that
are female-ownedShare of employees in each band who are
femaleShare of female employees in female-
owned establishmentsShare of male employees in male-owned
establishments
A. Unorganized manufacturing
B. Services
Notes: See Table 7.