Embed Size (px)
Citation preview
POPULATIONSOCIETIES& No. 473
D E C E M B E R 2 0 1 0
CO
NTE
NTS
BU
LL
ET
IN
M
EN
SU
EL
D
’I
NF
OR
MA
TI
ON
D
E
L’
IN
ST
IT
UT
N
AT
IO
NA
L
D’
ÉT
UD
ES
D
ÉM
OG
RA
PH
IQ
UE
S
Human life expectancy has risen spectacularly since the mid-eighteenth century. In France, for example,
it has increased three-fold in 250 years, rising from an estimated 27 years for men and 28 years for women in
Life expectancy is still increasing in industrialized countries and has extended well beyond the biological limits announced just a few decades ago. Examining the record levels actually observed over time, Jacques Vallin and France Meslé present an overview of the successive stages of progress in human health and the factors behind this progress, and discuss the prospects for an ever longer length of life.
Will life expectancy increase indefinitely by three months every year?
Jacques Vallin and France Meslé *
Editorial – Will life expectancy increase indefinitely by three months every year? • Maximum life expectancies - p. 2 • Changes of pace - p. 2 • Rates of progress that vary with age - p. 3 • What is the situation beyond age 80? - p. 3
* Institut national d’études démographiques
1750-1759 [1], to almost 78 years for men and 85 years for women today. This, as we know, is the consequence of immense progress in the economic, medical, cultural and social spheres. Will the trend continue in years to come?
30
40
50
60
70
80
90
30
40
50
60
70
80
90
1750 1800 1850 1900 1950 2000 1750 1800 1850 1900 1950 2000
A) Annual record-holdercountries
INED117A10 INED
118A10
23 %
32 %
Life expectancy at birth (years)Life expectancy at birth (years)
Jenner
Pasteur
CardiovascularrevolutionB) Change of pace
0,5 %
11 %
Before1790
1790-1885
1886-1960
Since 1960
Sweden
England-WalesFinland
Denmark
Norway
Australia
Japan
Norway
Iceland
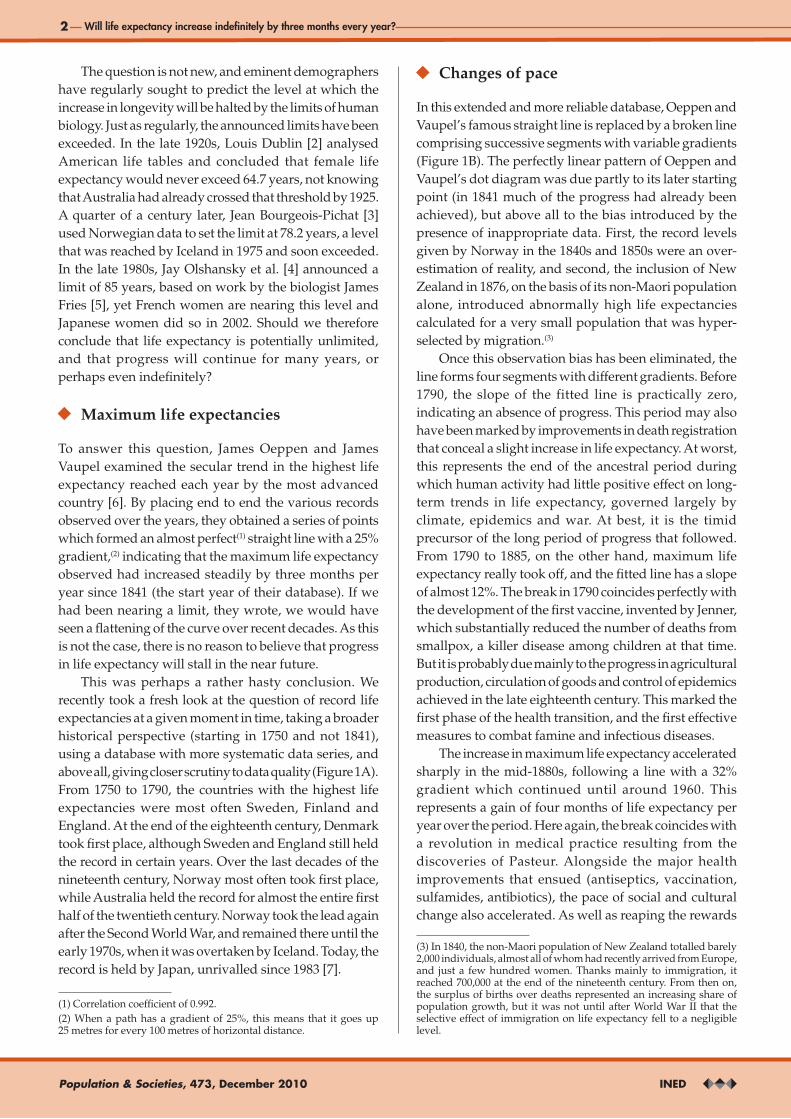
Figure 1 - Highest observed national female life expectancies at a given moment in the world (1750-2005)
Note: Graph A shows the different countries which, in turn, held the life expectancy record for the year. Graph B illustrates the changes of pace as measured by the gradient (in %) of the fitted lines. A 10% gradient signifies that life expectancy increases annually by one-tenth of a year; 20% by one-fifth of a year; 33% by one-third of a year. (J. Vallin and F. Meslé, Population & Societies, no. 473, Ined, december 2010)
2
INEDPopulation & Societies, 473, December 2010
Will life expectancy increase indefinitely by three months every year?
The question is not new, and eminent demographers have regularly sought to predict the level at which the increase in longevity will be halted by the limits of human biology. Just as regularly, the announced limits have been exceeded. In the late 1920s, Louis Dublin [2] analysed American life tables and concluded that female life expectancy would never exceed 64.7 years, not knowing that Australia had already crossed that threshold by 1925. A quarter of a century later, Jean Bourgeois-Pichat [3] used Norwegian data to set the limit at 78.2 years, a level that was reached by Iceland in 1975 and soon exceeded. In the late 1980s, Jay Olshansky et al. [4] announced a limit of 85 years, based on work by the biologist James Fries [5], yet French women are nearing this level and Japanese women did so in 2002. Should we therefore conclude that life expectancy is potentially unlimited, and that progress will continue for many years, or perhaps even indefinitely?
Maximum life expectancies
To answer this question, James Oeppen and James Vaupel examined the secular trend in the highest life expectancy reached each year by the most advanced country [6]. By placing end to end the various records observed over the years, they obtained a series of points which formed an almost perfect(1) straight line with a 25% gradient,(2) indicating that the maximum life expectancy observed had increased steadily by three months per year since 1841 (the start year of their database). If we had been nearing a limit, they wrote, we would have seen a flattening of the curve over recent decades. As this is not the case, there is no reason to believe that progress in life expectancy will stall in the near future.
This was perhaps a rather hasty conclusion. We recently took a fresh look at the question of record life expectancies at a given moment in time, taking a broader historical perspective (starting in 1750 and not 1841), using a database with more systematic data series, and above all, giving closer scrutiny to data quality (Figure 1A). From 1750 to 1790, the countries with the highest life expectancies were most often Sweden, Finland and England. At the end of the eighteenth century, Denmark took first place, although Sweden and England still held the record in certain years. Over the last decades of the nineteenth century, Norway most often took first place, while Australia held the record for almost the entire first half of the twentieth century. Norway took the lead again after the Second World War, and remained there until the early 1970s, when it was overtaken by Iceland. Today, the record is held by Japan, unrivalled since 1983 [7].
Changes of pace
In this extended and more reliable database, Oeppen and Vaupel’s famous straight line is replaced by a broken line comprising successive segments with variable gradients (Figure 1B). The perfectly linear pattern of Oeppen and Vaupel’s dot diagram was due partly to its later starting point (in 1841 much of the progress had already been achieved), but above all to the bias introduced by the presence of inappropriate data. First, the record levels given by Norway in the 1840s and 1850s were an over-estimation of reality, and second, the inclusion of New Zealand in 1876, on the basis of its non-Maori population alone, introduced abnormally high life expectancies calculated for a very small population that was hyper-selected by migration.(3)
Once this observation bias has been eliminated, the line forms four segments with different gradients. Before 1790, the slope of the fitted line is practically zero, indicating an absence of progress. This period may also have been marked by improvements in death registration that conceal a slight increase in life expectancy. At worst, this represents the end of the ancestral period during which human activity had little positive effect on long-term trends in life expectancy, governed largely by climate, epidemics and war. At best, it is the timid precursor of the long period of progress that followed. From 1790 to 1885, on the other hand, maximum life expectancy really took off, and the fitted line has a slope of almost 12%. The break in 1790 coincides perfectly with the development of the first vaccine, invented by Jenner, which substantially reduced the number of deaths from smallpox, a killer disease among children at that time. But it is probably due mainly to the progress in agricultural production, circulation of goods and control of epidemics achieved in the late eighteenth century. This marked the first phase of the health transition, and the first effective measures to combat famine and infectious diseases.
The increase in maximum life expectancy accelerated sharply in the mid-1880s, following a line with a 32% gradient which continued until around 1960. This represents a gain of four months of life expectancy per year over the period. Here again, the break coincides with a revolution in medical practice resulting from the discoveries of Pasteur. Alongside the major health improvements that ensued (antiseptics, vaccination, sulfamides, antibiotics), the pace of social and cultural change also accelerated. As well as reaping the rewards
(1) Correlation coefficient of 0.992.(2) When a path has a gradient of 25%, this means that it goes up 25 metres for every 100 metres of horizontal distance.
(3) In 1840, the non-Maori population of New Zealand totalled barely 2,000 individuals, almost all of whom had recently arrived from Europe, and just a few hundred women. Thanks mainly to immigration, it reached 700,000 at the end of the nineteenth century. From then on, the surplus of births over deaths represented an increasing share of population growth, but it was not until after World War II that the selective effect of immigration on life expectancy fell to a negligible level.
3
INED Population & Sociétés n° 473, décembre 2010
Espérance de vie : peut-on gagner trois mois par an indéfiniment ?
Population & Sociétés n° 473, décembre 2010
of these medical advances, a growing share of the population enjoyed the benefits of universal schooling, of new social security systems and the welfare state. This was the crowning of the first transition phase, called the “epidemiological transition” by Abdel Omran [8]. He believed it would lead to a pandemic of degenerative and man-made diseases that would halt the increase in life expectancy.
In fact, the increase in maximum life expectancy slowed down rapidly in the 1960s, to a level which corresponds closely to the “biological limit” put forward by Jean Bourgeois-Pichat in 1952, and it is easy to imagine that without the cardiovascular revolution(4) of the 1970s, human longevity would indeed have reached a ceiling. But thanks to this new strategy for reducing mortality, a further strong and linear increase in life expectancy was observed. With a gradient of 23%, representing 3 months gained per year, progress was slightly slower than before, however. This was the second phase of the health transition during which the increase in deaths from man-
Will life expectancy increase indefinitely by three months every year?
made diseases (road traffic accidents alcoholism, smoking, etc.) was brought under control, and effective means were found to combat cardiovascular diseases.
Today, however, the main benefits of this cardiovascular revolution have already been harvested, in the most advanced countries at least. So how will the curve of maximum life expectancies evolve over the coming years?
Rates of progress that vary with age
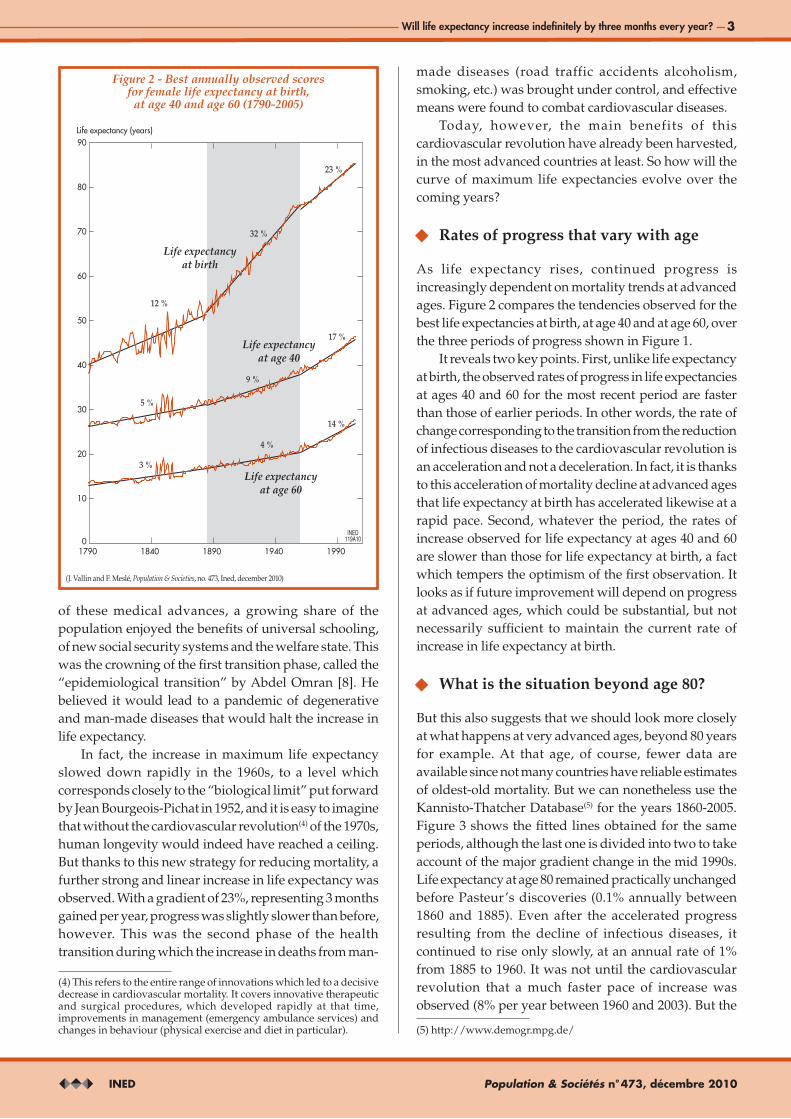
As life expectancy rises, continued progress is increasingly dependent on mortality trends at advanced ages. Figure 2 compares the tendencies observed for the best life expectancies at birth, at age 40 and at age 60, over the three periods of progress shown in Figure 1.
It reveals two key points. First, unlike life expectancy at birth, the observed rates of progress in life expectancies at ages 40 and 60 for the most recent period are faster than those of earlier periods. In other words, the rate of change corresponding to the transition from the reduction of infectious diseases to the cardiovascular revolution is an acceleration and not a deceleration. In fact, it is thanks to this acceleration of mortality decline at advanced ages that life expectancy at birth has accelerated likewise at a rapid pace. Second, whatever the period, the rates of increase observed for life expectancy at ages 40 and 60 are slower than those for life expectancy at birth, a fact which tempers the optimism of the first observation. It looks as if future improvement will depend on progress at advanced ages, which could be substantial, but not necessarily sufficient to maintain the current rate of increase in life expectancy at birth.
What is the situation beyond age 80?
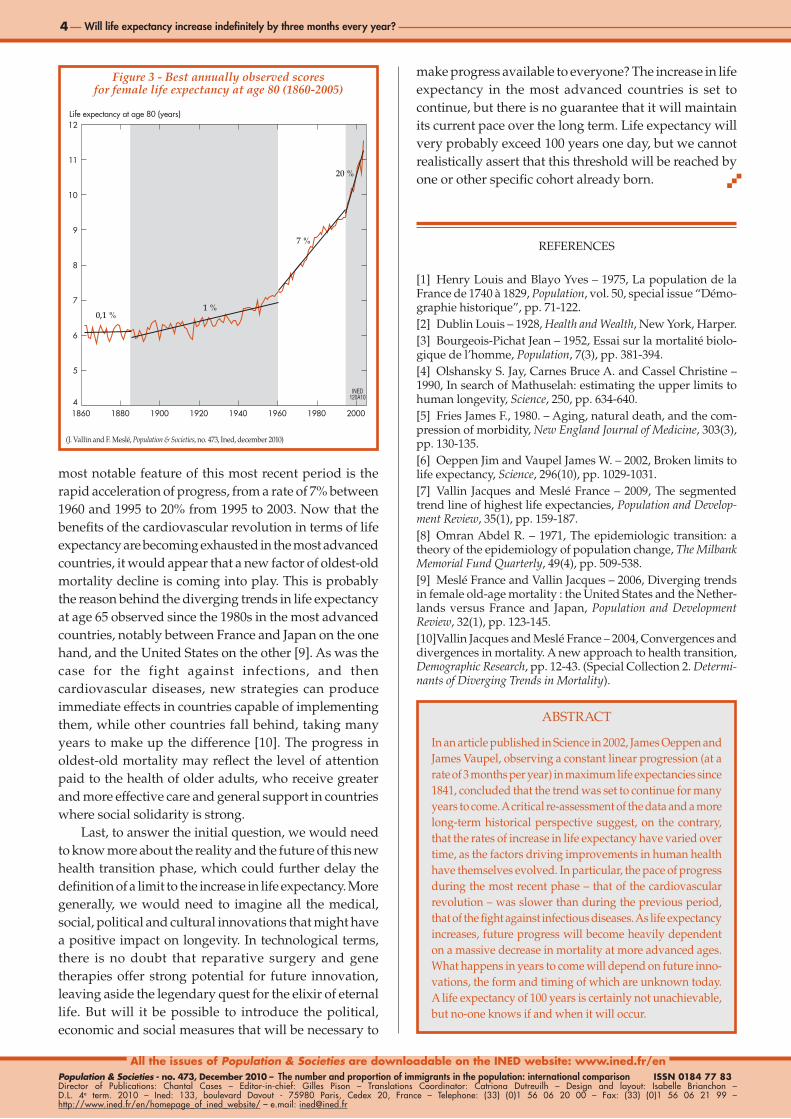
But this also suggests that we should look more closely at what happens at very advanced ages, beyond 80 years for example. At that age, of course, fewer data are available since not many countries have reliable estimates of oldest-old mortality. But we can nonetheless use the Kannisto-Thatcher Database(5) for the years 1860-2005. Figure 3 shows the fitted lines obtained for the same periods, although the last one is divided into two to take account of the major gradient change in the mid 1990s. Life expectancy at age 80 remained practically unchanged before Pasteur’s discoveries (0.1% annually between 1860 and 1885). Even after the accelerated progress resulting from the decline of infectious diseases, it continued to rise only slowly, at an annual rate of 1% from 1885 to 1960. It was not until the cardiovascular revolution that a much faster pace of increase was observed (8% per year between 1960 and 2003). But the
(5) http://www.demogr.mpg.de/
(4) This refers to the entire range of innovations which led to a decisive decrease in cardiovascular mortality. It covers innovative therapeutic and surgical procedures, which developed rapidly at that time, improvements in management (emergency ambulance services) and changes in behaviour (physical exercise and diet in particular).
0
10
20
30
40
50
60
70
80
90 Life expectancy (years)
1790 1840 1890 1940 1990
Life expectancyat age 40
Life expectancyat birth
Life expectancyat age 60
INED119A10
23 %
12 %
32 %
5 %
9 %
17 %
3 %
4 %
14 %
Figure 2 - Best annually observed scores for female life expectancy at birth,
at age 40 and age 60 (1790-2005)
(J. Vallin and F. Meslé, Population & Societies, no. 473, Ined, december 2010)
4 Espérance de vie : peut-on gagner trois mois par an indéfiniment ?
All the issues of Population & Societies are downloadable on the INED website: www.ined.fr/enPopulation & Societies - no. 473, December 2010 – The number and proportion of immigrants in the population: international comparison ISSN 0184 77 83Director of Publications: Chantal Cases – Editor-in-chief: Gilles Pison – Translations Coordinator: Catriona Dutreuilh – Design and layout: Isabelle Brianchon – D.L. 4e term. 2010 – Ined: 133, boulevard Davout - 75980 Paris, Cedex 20, France – Telephone: (33) (0)1 56 06 20 00 – Fax: (33) (0)1 56 06 21 99 –http://www.ined.fr/en/homepage_of_ined_website/ – e.mail: [email protected]
INED120A10
4
5
6
7
8
9
10
11
12
1860 1880 1900 1920 1940 1960 1980 2000
Life expectancy at age 80 (years)
0,1 % 1 %
7 %
20 %
most notable feature of this most recent period is the rapid acceleration of progress, from a rate of 7% between 1960 and 1995 to 20% from 1995 to 2003. Now that the benefits of the cardiovascular revolution in terms of life expectancy are becoming exhausted in the most advanced countries, it would appear that a new factor of oldest-old mortality decline is coming into play. This is probably the reason behind the diverging trends in life expectancy at age 65 observed since the 1980s in the most advanced countries, notably between France and Japan on the one hand, and the United States on the other [9]. As was the case for the fight against infections, and then cardiovascular diseases, new strategies can produce immediate effects in countries capable of implementing them, while other countries fall behind, taking many years to make up the difference [10]. The progress in oldest-old mortality may reflect the level of attention paid to the health of older adults, who receive greater and more effective care and general support in countries where social solidarity is strong.
Last, to answer the initial question, we would need to know more about the reality and the future of this new health transition phase, which could further delay the definition of a limit to the increase in life expectancy. More generally, we would need to imagine all the medical, social, political and cultural innovations that might have a positive impact on longevity. In technological terms, there is no doubt that reparative surgery and gene therapies offer strong potential for future innovation, leaving aside the legendary quest for the elixir of eternal life. But will it be possible to introduce the political, economic and social measures that will be necessary to
make progress available to everyone? The increase in life expectancy in the most advanced countries is set to continue, but there is no guarantee that it will maintain its current pace over the long term. Life expectancy will very probably exceed 100 years one day, but we cannot realistically assert that this threshold will be reached by one or other specific cohort already born.
Will life expectancy increase indefinitely by three months every year?
REFERENCES
[1] Henry Louis and Blayo Yves – 1975, La population de la France de 1740 à 1829, Population, vol. 50, special issue “Démo-graphie historique”, pp. 71-122.[2] Dublin Louis – 1928, Health and Wealth, New York, Harper.[3] Bourgeois-Pichat Jean – 1952, Essai sur la mortalité biolo-gique de l’homme, Population, 7(3), pp. 381-394.[4] Olshansky S. Jay, Carnes Bruce A. and Cassel Christine – 1990, In search of Mathuselah: estimating the upper limits to human longevity, Science, 250, pp. 634-640.[5] Fries James F., 1980. – Aging, natural death, and the com-pression of morbidity, New England Journal of Medicine, 303(3), pp. 130-135.[6] Oeppen Jim and Vaupel James W. – 2002, Broken limits to life expectancy, Science, 296(10), pp. 1029-1031.[7] Vallin Jacques and Meslé France – 2009, The segmented trend line of highest life expectancies, Population and Develop-ment Review, 35(1), pp. 159-187.[8] Omran Abdel R. – 1971, The epidemiologic transition: a theory of the epidemiology of population change, The Milbank Memorial Fund Quarterly, 49(4), pp. 509-538.[9] Meslé France and Vallin Jacques – 2006, Diverging trends in female old-age mortality : the United States and the Nether-lands versus France and Japan, Population and Development Review, 32(1), pp. 123-145.[10] Vallin Jacques and Meslé France – 2004, Convergences and divergences in mortality. A new approach to health transition, Demographic Research, pp. 12-43. (Special Collection 2. Determi-nants of Diverging Trends in Mortality).
ABSTRACT
In an article published in Science in 2002, James Oeppen and James Vaupel, observing a constant linear progression (at a rate of 3 months per year) in maximum life expectancies since 1841, concluded that the trend was set to continue for many years to come. A critical re-assessment of the data and a more long-term historical perspective suggest, on the contrary, that the rates of increase in life expectancy have varied over time, as the factors driving improvements in human health have themselves evolved. In particular, the pace of progress during the most recent phase – that of the cardiovascular revolution – was slower than during the previous period, that of the fight against infectious diseases. As life expectancy increases, future progress will become heavily dependent on a massive decrease in mortality at more advanced ages. What happens in years to come will depend on future inno-vations, the form and timing of which are unknown today. A life expectancy of 100 years is certainly not unachievable, but no-one knows if and when it will occur.
Figure 3 - Best annually observed scores for female life expectancy at age 80 (1860-2005)
(J. Vallin and F. Meslé, Population & Societies, no. 473, Ined, december 2010)