Embed Size (px)
Citation preview
The year 2020 will be a pivotal one for China’s annual shopping festival. By Jonathan Cheng, Kanaiya Parekh and Melanie Sanders
Will Covid-19 Change “Singles Day”?

Copyright © 2020 Bain & Company, Inc. All rights reserved.
About the authors
Jonathan Cheng leads Bain’s Retail practice in Greater China and is based in Hong Kong. Kanaiya Parekh is an expert partner in the firm’s Retail practice and is also based in Hong Kong. Melanie Sanders leads Bain & Company’s Asia-Pacific Retail practice and is based in Melbourne.
Will Covid-19 Change “Singles Day”?
1
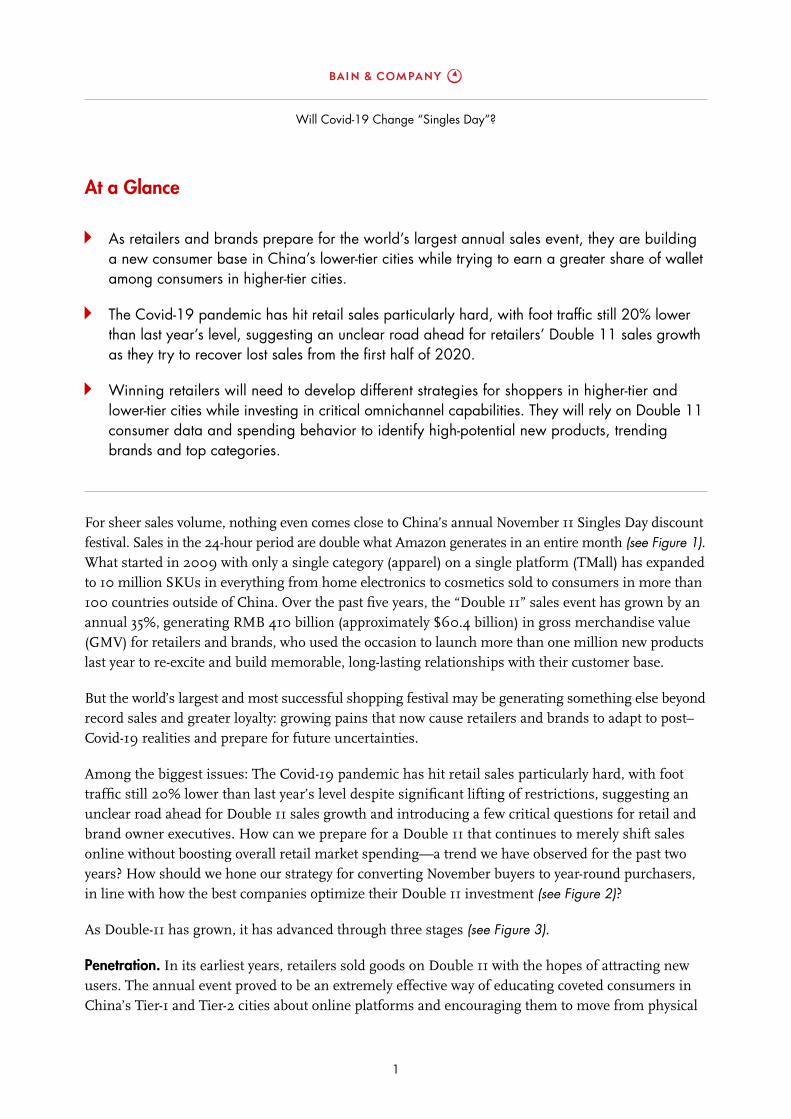
At a Glance
As retailers and brands prepare for the world’s largest annual sales event, they are building a new consumer base in China’s lower-tier cities while trying to earn a greater share of wallet among consumers in higher-tier cities.
The Covid-19 pandemic has hit retail sales particularly hard, with foot traffi c still 20% lower than last year’s level, suggesting an unclear road ahead for retailers’ Double 11 sales growth as they try to recover lost sales from the fi rst half of 2020.
Winning retailers will need to develop different strategies for shoppers in higher-tier and lower-tier cities while investing in critical omnichannel capabilities. They will rely on Double 11 consumer data and spending behavior to identify high-potential new products, trending brands and top categories.
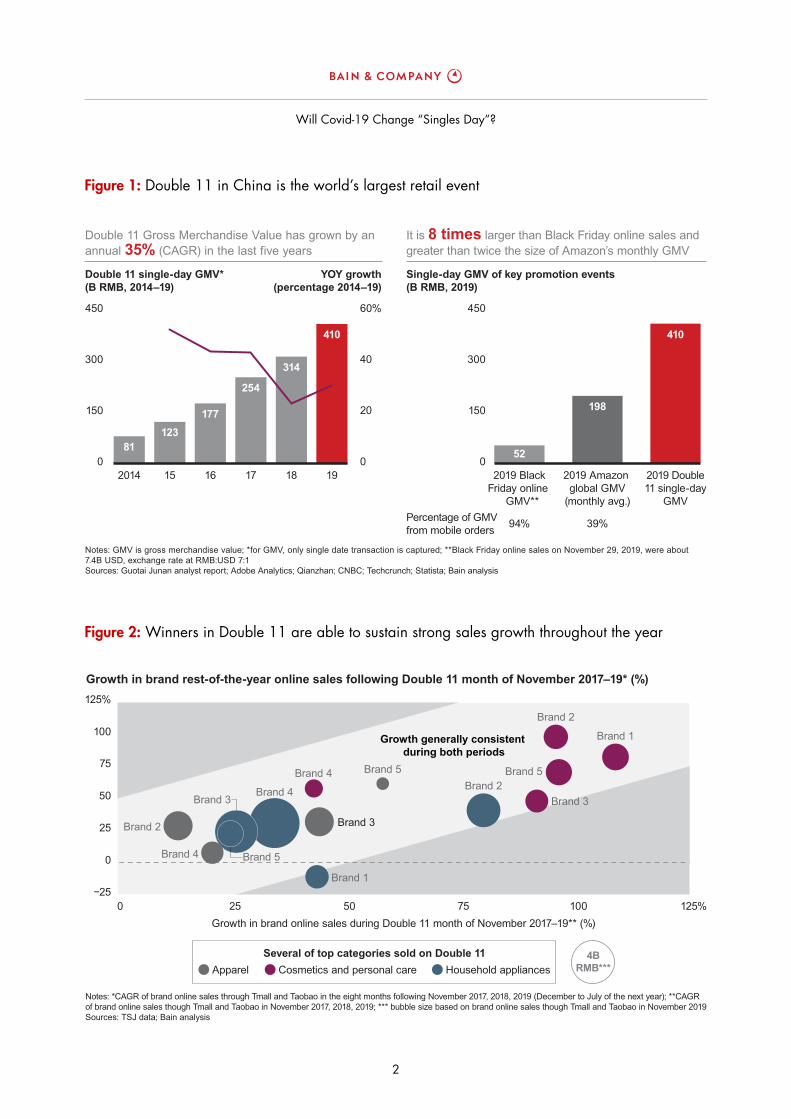
For sheer sales volume, nothing even comes close to China’s annual November 11 Singles Day discount
festival. Sales in the 24-hour period are double what Amazon generates in an entire month (see Figure 1). What started in 2009 with only a single category (apparel) on a single platform (TMall) has expanded
to 10 million SKUs in everything from home electronics to cosmetics sold to consumers in more than
100 countries outside of China. Over the past fi ve years, the “Double 11” sales event has grown by an
annual 35%, generating RMB 410 billion (approximately $60.4 billion) in gross merchandise value
(GMV) for retailers and brands, who used the occasion to launch more than one million new products
last year to re-excite and build memorable, long-lasting relationships with their customer base.
But the world’s largest and most successful shopping festival may be generating something else beyond
record sales and greater loyalty: growing pains that now cause retailers and brands to adapt to post–
Covid-19 realities and prepare for future uncertainties.
Among the biggest issues: The Covid-19 pandemic has hit retail sales particularly hard, with foot
traffi c still 20% lower than last year’s level despite signifi cant lifting of restrictions, suggesting an
unclear road ahead for Double 11 sales growth and introducing a few critical questions for retail and
brand owner executives. How can we prepare for a Double 11 that continues to merely shift sales
online without boosting overall retail market spending—a trend we have observed for the past two
years? How should we hone our strategy for converting November buyers to year-round purchasers,
in line with how the best companies optimize their Double 11 investment (see Figure 2)?
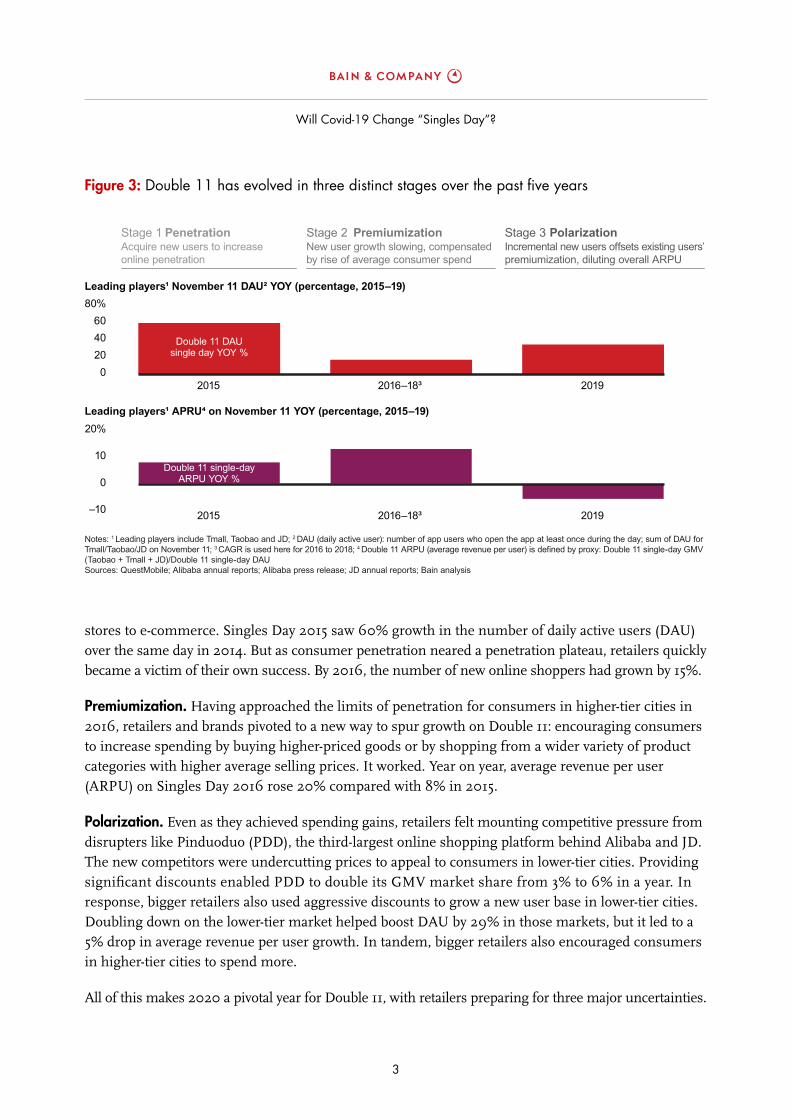
As Double-11 has grown, it has advanced through three stages (see Figure 3).
Penetration. In its earliest years, retailers sold goods on Double 11 with the hopes of attracting new
users. The annual event proved to be an extremely effective way of educating coveted consumers in
China’s Tier-1 and Tier-2 cities about online platforms and encouraging them to move from physical
Will Covid-19 Change “Singles Day”?
2
Figure 1: Double 11 in China is the world’s largest retail event
Notes: GMV is gross merchandise value; *for GMV, only single date transaction is captured; **Black Friday online sales on November 29, 2019, were about 7.4B USD, exchange rate at RMB:USD 7:1Sources: Guotai Junan analyst report; Adobe Analytics; Qianzhan; CNBC; Techcrunch; Statista; Bain analysis
2019 BlackFriday online
GMV**
52
2019 Amazon global GMV
(monthly avg.)
198
2019 Double11 single-day
GMV
410
Single-day GMV of key promotion events (B RMB, 2019)
94% 39%Percentage of GMV from mobile orders
0
150
300
450
0
150
300
450
0
20
40
60%
2014
81
15
123
16
177
17
254
18
314
19
410
Double 11 single-day GMV*(B RMB, 2014–19)
YOY growth(percentage 2014–19)
Double 11 Gross Merchandise Value has grown by an annual 35% (CAGR) in the last five years
It is 8 times larger than Black Friday online sales and greater than twice the size of Amazon’s monthly GMV
Figure 2: Winners in Double 11 are able to sustain strong sales growth throughout the year
Notes: *CAGR of brand online sales through Tmall and Taobao in the eight months following November 2017, 2018, 2019 (December to July of the next year); **CAGR of brand online sales though Tmall and Taobao in November 2017, 2018, 2019; *** bubble size based on brand online sales though Tmall and Taobao in November 2019Sources: TSJ data; Bain analysis
−25
0
25
50
75
100
125%
0 25 50 75 100 125%Growth in brand online sales during Double 11 month of November 2017–19** (%)
Brand 4
Growth in brand rest-of-the-year online sales following Double 11 month of November 2017–19* (%)
Brand 3Brand 2
Brand 2 Brand 3
Brand 1
Brand 5
Brand 2
Brand 1
Brand 3
Brand 4
Brand 4 Brand 5
Brand 5
4BRMB***
Several of top categories sold on Double 11Apparel Cosmetics and personal care Household appliances
Growth generally consistent during both periods
Will Covid-19 Change “Singles Day”?
3
Figure 3: Double 11 has evolved in three distinct stages over the past fi ve years
Notes: 1 Leading players include Tmall, Taobao and JD; 2 DAU (daily active user): number of app users who open the app at least once during the day; sum of DAU for Tmall/Taobao/JD on November 11; 3 CAGR is used here for 2016 to 2018; 4 Double 11 ARPU (average revenue per user) is defined by proxy: Double 11 single-day GMV (Taobao + Tmall + JD)/Double 11 single-day DAUSources: QuestMobile; Alibaba annual reports; Alibaba press release; JD annual reports; Bain analysis
–10
0
10
20%
2015 2016–18³ 2019
Leading players¹ APRU⁴ on November 11 YOY (percentage, 2015–19)
Double 11 single-dayARPU YOY %
0204060
80%
2015 2016–18³ 2019
Leading players¹ November 11 DAU² YOY (percentage, 2015–19)
Double 11 DAUsingle day YOY %
Stage 1 Stage 2 Stage 3PenetrationAcquire new users to increase online penetration
PremiumizationNew user growth slowing, compensated by rise of average consumer spend
PolarizationIncremental new users offsets existing users’ premiumization, diluting overall ARPU
stores to e-commerce. Singles Day 2015 saw 60% growth in the number of daily active users (DAU)
over the same day in 2014. But as consumer penetration neared a penetration plateau, retailers quickly
became a victim of their own success. By 2016, the number of new online shoppers had grown by 15%.
Premiumization. Having approached the limits of penetration for consumers in higher-tier cities in
2016, retailers and brands pivoted to a new way to spur growth on Double 11: encouraging consumers
to increase spending by buying higher-priced goods or by shopping from a wider variety of product
categories with higher average selling prices. It worked. Year on year, average revenue per user
(ARPU) on Singles Day 2016 rose 20% compared with 8% in 2015.
Polarization. Even as they achieved spending gains, retailers felt mounting competitive pressure from
disrupters like Pinduoduo (PDD), the third-largest online shopping platform behind Alibaba and JD.
The new competitors were undercutting prices to appeal to consumers in lower-tier cities. Providing
signifi cant discounts enabled PDD to double its GMV market share from 3% to 6% in a year. In
response, bigger retailers also used aggressive discounts to grow a new user base in lower-tier cities.
Doubling down on the lower-tier market helped boost DAU by 29% in those markets, but it led to a
5% drop in average revenue per user growth. In tandem, bigger retailers also encouraged consumers
in higher-tier cities to spend more.
All of this makes 2020 a pivotal year for Double 11, with retailers preparing for three major uncertainties.
Will Covid-19 Change “Singles Day”?
4
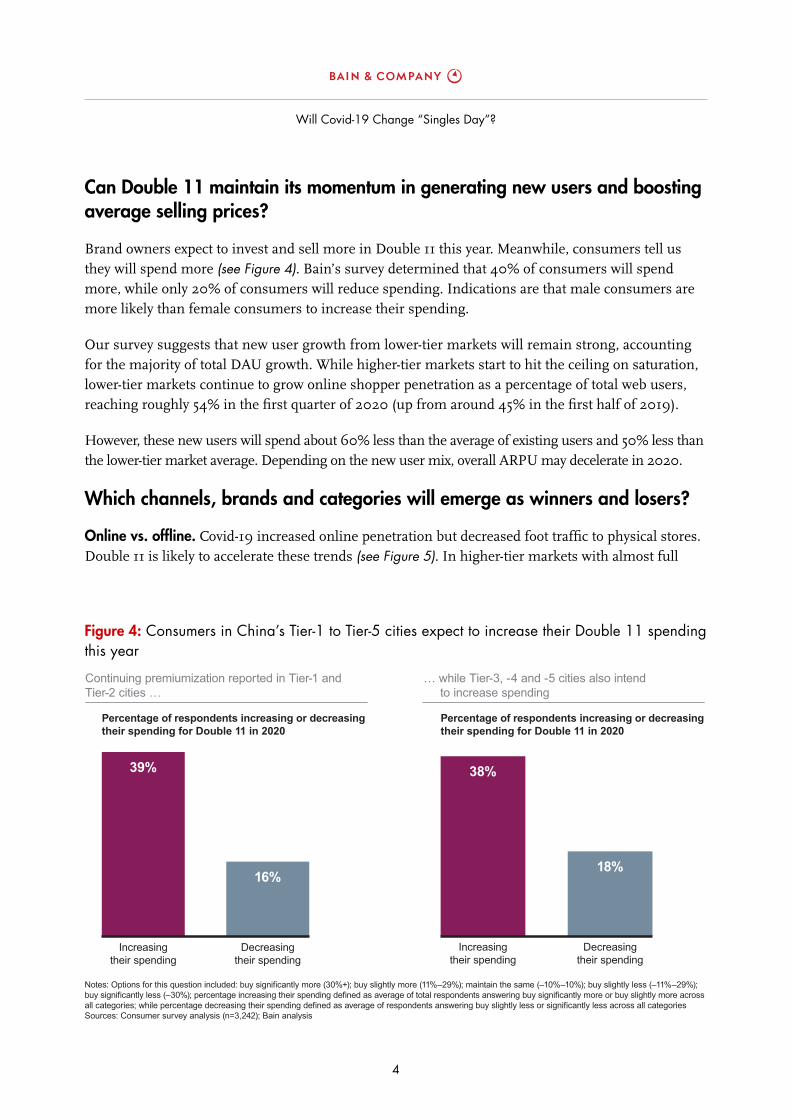
Figure 4: Consumers in China’s Tier-1 to Tier-5 cities expect to increase their Double 11 spending this year
0
10
20
30
40
0
10
20
30
Notes: Options for this question included: buy significantly more (30%+); buy slightly more (11%–29%); maintain the same (–10%–10%); buy slightly less (–11%–29%); buy significantly less (–30%); percentage increasing their spending defined as average of total respondents answering buy significantly more or buy slightly more across all categories; while percentage decreasing their spending defined as average of respondents answering buy slightly less or significantly less across all categoriesSources: Consumer survey analysis (n=3,242); Bain analysis
Continuing premiumization reported in Tier-1 and Tier-2 cities …
… while Tier-3, -4 and -5 cities also intend to increase spending
Increasingtheir spending
39%
Decreasingtheir spending
16%
Percentage of respondents increasing or decreasing their spending for Double 11 in 2020
Percentage of respondents increasing or decreasingtheir spending for Double 11 in 2020
Increasingtheir spending
38%
Decreasingtheir spending
18%
Can Double 11 maintain its momentum in generating new users and boosting average selling prices?
Brand owners expect to invest and sell more in Double 11 this year. Meanwhile, consumers tell us
they will spend more (see Figure 4). Bain’s survey determined that 40% of consumers will spend
more, while only 20% of consumers will reduce spending. Indications are that male consumers are
more likely than female consumers to increase their spending.
Our survey suggests that new user growth from lower-tier markets will remain strong, accounting
for the majority of total DAU growth. While higher-tier markets start to hit the ceiling on saturation,
lower-tier markets continue to grow online shopper penetration as a percentage of total web users,
reaching roughly 54% in the fi rst quarter of 2020 (up from around 45% in the fi rst half of 2019).
However, these new users will spend about 60% less than the average of existing users and 50% less than
the lower-tier market average. Depending on the new user mix, overall ARPU may decelerate in 2020.
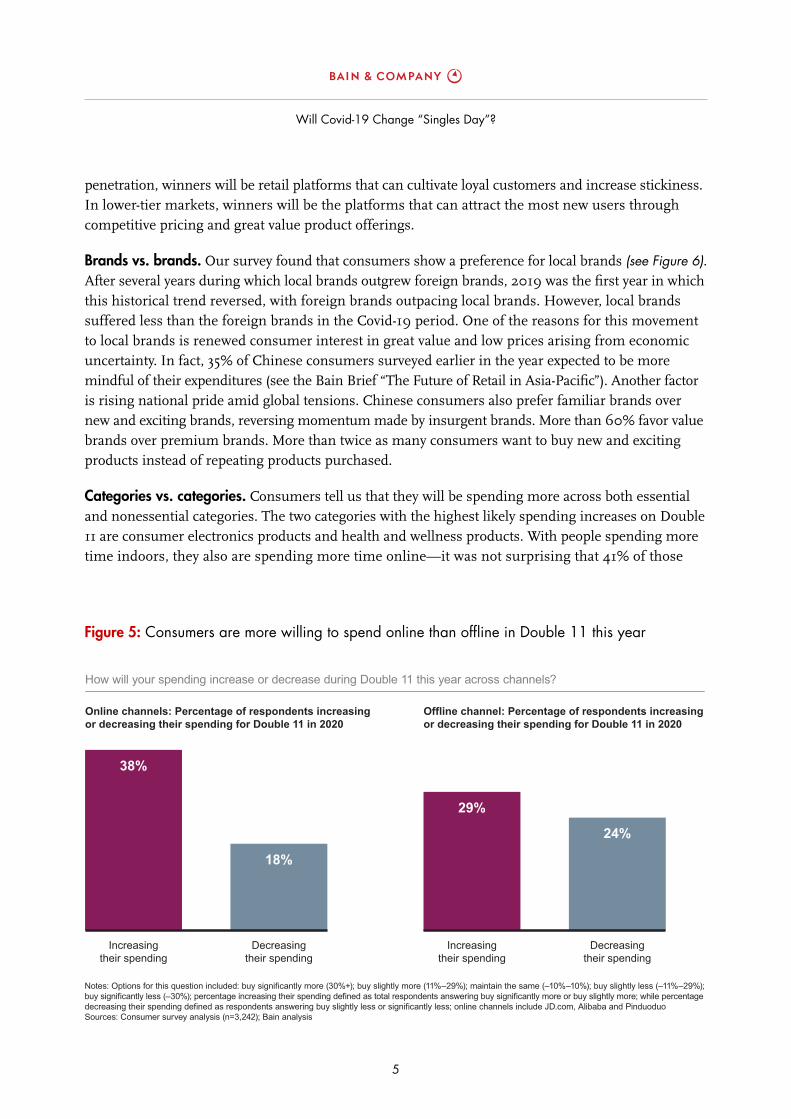
Which channels, brands and categories will emerge as winners and losers?
Online vs. offl ine. Covid-19 increased online penetration but decreased foot traffi c to physical stores.
Double 11 is likely to accelerate these trends (see Figure 5). In higher-tier markets with almost full
Will Covid-19 Change “Singles Day”?
5
penetration, winners will be retail platforms that can cultivate loyal customers and increase stickiness.
In lower-tier markets, winners will be the platforms that can attract the most new users through
competitive pricing and great value product offerings.
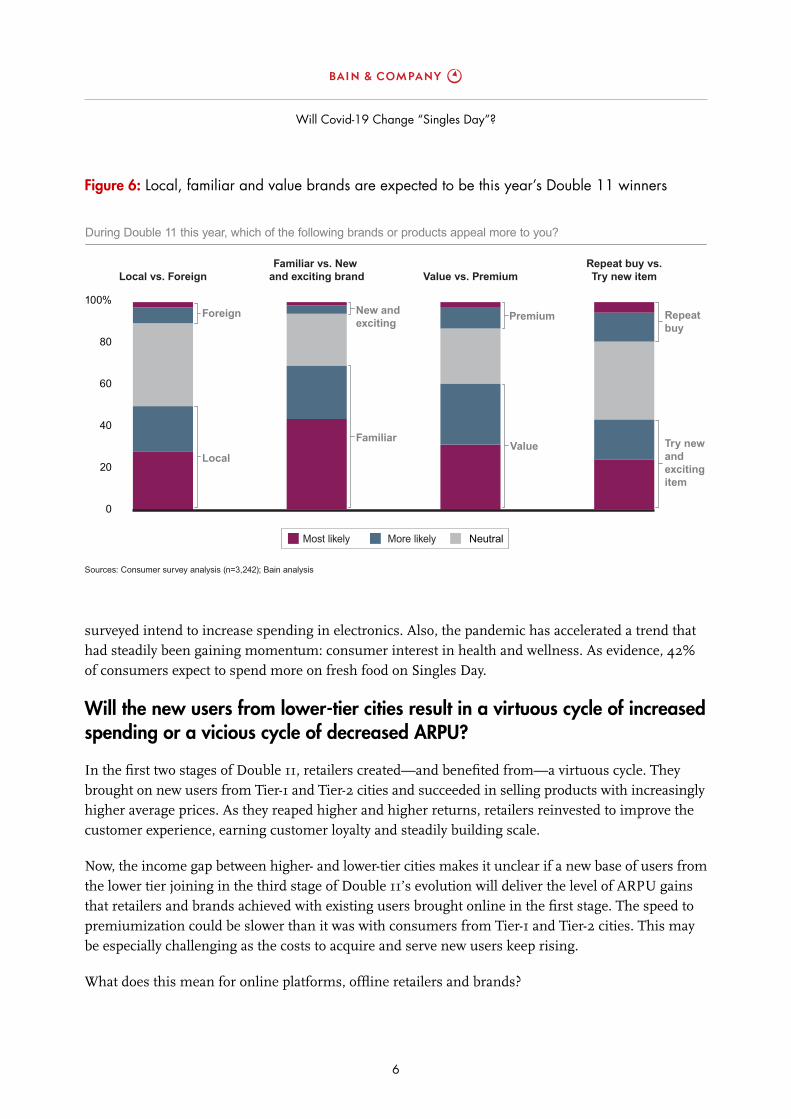
Brands vs. brands. Our survey found that consumers show a preference for local brands (see Figure 6). After several years during which local brands outgrew foreign brands, 2019 was the fi rst year in which
this historical trend reversed, with foreign brands outpacing local brands. However, local brands
suffered less than the foreign brands in the Covid-19 period. One of the reasons for this movement
to local brands is renewed consumer interest in great value and low prices arising from economic
uncertainty. In fact, 35% of Chinese consumers surveyed earlier in the year expected to be more
mindful of their expenditures (see the Bain Brief “The Future of Retail in Asia-Pacifi c”). Another factor
is rising national pride amid global tensions. Chinese consumers also prefer familiar brands over
new and exciting brands, reversing momentum made by insurgent brands. More than 60% favor value
brands over premium brands. More than twice as many consumers want to buy new and exciting
products instead of repeating products purchased.
Categories vs. categories. Consumers tell us that they will be spending more across both essential
and nonessential categories. The two categories with the highest likely spending increases on Double
11 are consumer electronics products and health and wellness products. With people spending more
time indoors, they also are spending more time online—it was not surprising that 41% of those
Figure 5: Consumers are more willing to spend online than offl ine in Double 11 this year
0
10
20
30
40
0
10
20
30
40
Notes: Options for this question included: buy significantly more (30%+); buy slightly more (11%–29%); maintain the same (–10%–10%); buy slightly less (–11%–29%); buy significantly less (–30%); percentage increasing their spending defined as total respondents answering buy significantly more or buy slightly more; while percentage decreasing their spending defined as respondents answering buy slightly less or significantly less; online channels include JD.com, Alibaba and PinduoduoSources: Consumer survey analysis (n=3,242); Bain analysis
How will your spending increase or decrease during Double 11 this year across channels?
Online channels: Percentage of respondents increasing or decreasing their spending for Double 11 in 2020
Increasingtheir spending
38%
Decreasingtheir spending
18%
Offline channel: Percentage of respondents increasing or decreasing their spending for Double 11 in 2020
Increasingtheir spending
29%
Decreasingtheir spending
24%
Will Covid-19 Change “Singles Day”?
6
Figure 6: Local, familiar and value brands are expected to be this year’s Double 11 winners
0
10
20
30
40
0
10
20
30
40
Sources: Consumer survey analysis (n=3,242); Bain analysis
During Double 11 this year, which of the following brands or products appeal more to you?
Local vs. ForeignFamiliar vs. New
and exciting brand Value vs. PremiumRepeat buy vs.Try new item
0
20
40
60
80
100%
Most likely More likely Neutral
Foreign
Local
New andexciting
FamiliarValue
Premium
Try newandexcitingitem
Repeat buy
surveyed intend to increase spending in electronics. Also, the pandemic has accelerated a trend that
had steadily been gaining momentum: consumer interest in health and wellness. As evidence, 42%
of consumers expect to spend more on fresh food on Singles Day.
Will the new users from lower-tier cities result in a virtuous cycle of increased spending or a vicious cycle of decreased ARPU?
In the fi rst two stages of Double 11, retailers created—and benefi ted from—a virtuous cycle. They
brought on new users from Tier-1 and Tier-2 cities and succeeded in selling products with increasingly
higher average prices. As they reaped higher and higher returns, retailers reinvested to improve the
customer experience, earning customer loyalty and steadily building scale.
Now, the income gap between higher- and lower-tier cities makes it unclear if a new base of users from
the lower tier joining in the third stage of Double 11’s evolution will deliver the level of ARPU gains
that retailers and brands achieved with existing users brought online in the fi rst stage. The speed to
premiumization could be slower than it was with consumers from Tier-1 and Tier-2 cities. This may
be especially challenging as the costs to acquire and serve new users keep rising.
What does this mean for online platforms, offl ine retailers and brands?
Will Covid-19 Change “Singles Day”?
7
Online platforms
Online platforms can make the most of their Double 11 investment by taking different approaches for
mature buyers and new buyers.
For mature consumers, the goal is to cultivate lifetime value. Platforms can achieve this by offering
an enriched engagement experience and establishing a relationship that transcends GMV to earn
loyalty, for example. One way to boost the engagement experience: create content especially for best-
selling “hero” SKUs. Alibaba platforms have recommended that merchants produce short videos for
70% of their SKUs, with three to fi ve videos for each SKU. Platforms can rigorously measure progress
with mature users in terms of engagement, new products launched and new formats introduced.
To grow with new users in lower-tier cities, the most successful platforms will focus on creating a
tailored customer proposition.
That means a customized product assortment for this segment, with a more cost-effi cient supply
chain and route to market, to account for the expensive customer acquisition costs and last-mile
delivery required to serve.
For both existing users and new users, platforms can create more value by capturing Double 11 con-
sumer intelligence to optimize decisions around product assortment, focusing on high-potential new
products as well as trending brands and categories.
Offl ine retailers
With the steady march of consumers from offl ine to online, physical store retailers need to reengage
consumers lost during Double 11 with the goal of converting them into loyal omnichannel consumers.
However, given the higher cost to serve these omnichannel consumers, companies need to adapt their
product assortment and supply chains for cost and effi ciency to ensure acceptable online economics.
That means streamlining store networks, fulfi llment and logistics as well as outsourcing or working
with ecosystem partners when it makes the most sense to simplify and manage costs effectively.
Offl ine retailers can enhance the physical store experience by starting with the basics and renovating
their locations to make them more visually appealing, especially to attract younger shoppers. They
can also focus on categories with low-online penetration (fresh food is a good example), with curated
SKUs and competitive pricing to differentiate from the online platforms.
Winning back online shoppers also requires physical retailers to cultivate a new and exciting product
assortment, relying on Double 11 consumer data to identify high-potential new products, trending
brands and categories.
It is also critical to double down on omnichannel capabilities—to go big or go home. That means
learning effi cient ways to source and convert online traffi c. It also means investing in the IT, data
Will Covid-19 Change “Singles Day”?
8
and supply chain infrastructure to support omnichannel retailing while building strategic ecosystem
partnerships to coinvest in and sustain rapid growth.
Brand owners
Brand owners need to differentiate between the distinct growth drivers for consumers in higher-tier
and lower-tier cities—and then pick the right battles. For most brands, the aim will be to increase
share of wallet in higher-tier markets and gain penetration in lower-tier markets, while managing
brand and product portfolios accordingly.
The best brands will establish direct relationships with the most valuable consumers, tracking
success not only in terms of Double 11 GMV but also in engagement, loyalty and lifetime value. They
will generate a 360-degree view of customers through their own transaction and engagement data, as
well as data from ecosystem sources. They will engage directly with consumers through an arsenal of
channels while also redesigning route-to-market capabilities for cross-channel synergy. Meanwhile,
they will embrace hyperlocal options, creating a single path to consumers that optimizes cost and
speed, launching new products as easily in offl ine channels as online.
The ultimate long-term value of Double 11 as China retailing’s most important 24 hours will depend
on how successfully online platforms, offl ine retailers and brands rise to the occasion—this November
11 and in the 364 days that follow.
Bold ideas. Bold teams. Extraordinary results.
Bain & Company is a global consultancy that helps the world’s most ambitious change makers define the future.
Across 59 offices in 37 countries, we work alongside our clients as one team with a shared ambition to achieve extraordinary results, outperform the competition and redefine industries. We complement our tailored, integrated expertise with a vibrant ecosystem of digital innovators to deliver better, faster and more enduring outcomes. Our 10-year commitment to invest over $1 billion in pro bono services brings our talent, expertise and insight to organizations tackling today’s urgent challenges in education, racial equity and social justice, economic development and the environment. Since our founding in 1973, we have measured our success by the success of our clients. We proudly maintain the highest level of client
advocacy in the industry, and our clients have outperformed the stock market 4-to-1.

For more information, visit www.bain.com