Embed Size (px)
Citation preview
Wildwood Park Master Plan 8100 Southeastern Ave. December 2010
Prepared By:
Wildwood Park Master Plan Indianapolis Parks & Recreation
2
Administration: Mayor Gregory A. Ballard, City of Indianapolis
City-County Council and Districts: Paul C. Bateman Jr. 11 Barbara Malone AL Vernon Brown 18 Angela Mansfield 2 Virginia J. Alig Cain 5 Janice McHenry 6 Jeffery L. Cardwell 23 Michael J. McQuillen 12 Bob Cockrum 22 Doris Minton-McNeill 15 Ed Coleman AL Mary Moriarty Adams 17 N. Susie Day 20 Jackie Nytes 9 Jose M. Evans 1 William C. Oliver 10 Aaron Freeman 25 Marilyn Pfisterer 14 Benjamin Hunter 21 Angel Rivera AL Maggie A. Lewis 7 Joanne Sanders AL Robert B. Lutz 13 Christine Scales 4 Brian Mahern 16 Mike Speedy 24 Dane Mahern 19 Ryan Vaughn 3
City-County Council Parks Committee: N. Susie Day, Chair Vernon Brown Monroe Gray Aaron Freeman Janice McHenry William C. Oliver Mike Speedy
Metropolitan Development Commission: Tim Ping, President Dorothy J. Jones, Vice-President James J. Curtis, Sr. Secretary J. Scott Keller, Vice-Secretary Diana Hamilton Lisa Kobe Randy Snyder Tasha Phelps Tom Morales
Board of Parks and Recreation: Stewart Lowry, Chair Dr. Jacqueline S. Greenwood Diana M. Hall Joseph E. Mayes Dr. Michael Twyman
Department of Parks and Recreation: Stewart Lowry, Director Donald A. Colvin Jr., Deputy Director
Project Coordination: Donald A. Colvin Jr., Deputy Director Lindsey Poore, Intern Andre Denman, Principal Park Planner Ali Bishel, Intern Benjamin Jackson, Senior Park Planner Katie Farmer, Intern
Wildwood Park Master Plan Indianapolis Parks & Recreation
3
INDEX
Introduction 4 History 5 Service Area 6 Demographic Summary 6 Exiting Conditions/Site Assessment 7 Public Participation Summary 9 Master Plan Recommendations 11 Action Plan 14 Conclusion 15 Funding Opportunities Appendix 1 Public Meeting Notes Appendix 2 Demographic Detail Appendix 3 Master Plan Presentation Boards Appendix 4 Board Resolutions Appendix 5
Indianapolis Parks Board Resolution Metropolitan Development Commission Board Resolution
Wildwood Park Master Plan Indianapolis Parks & Recreation
4
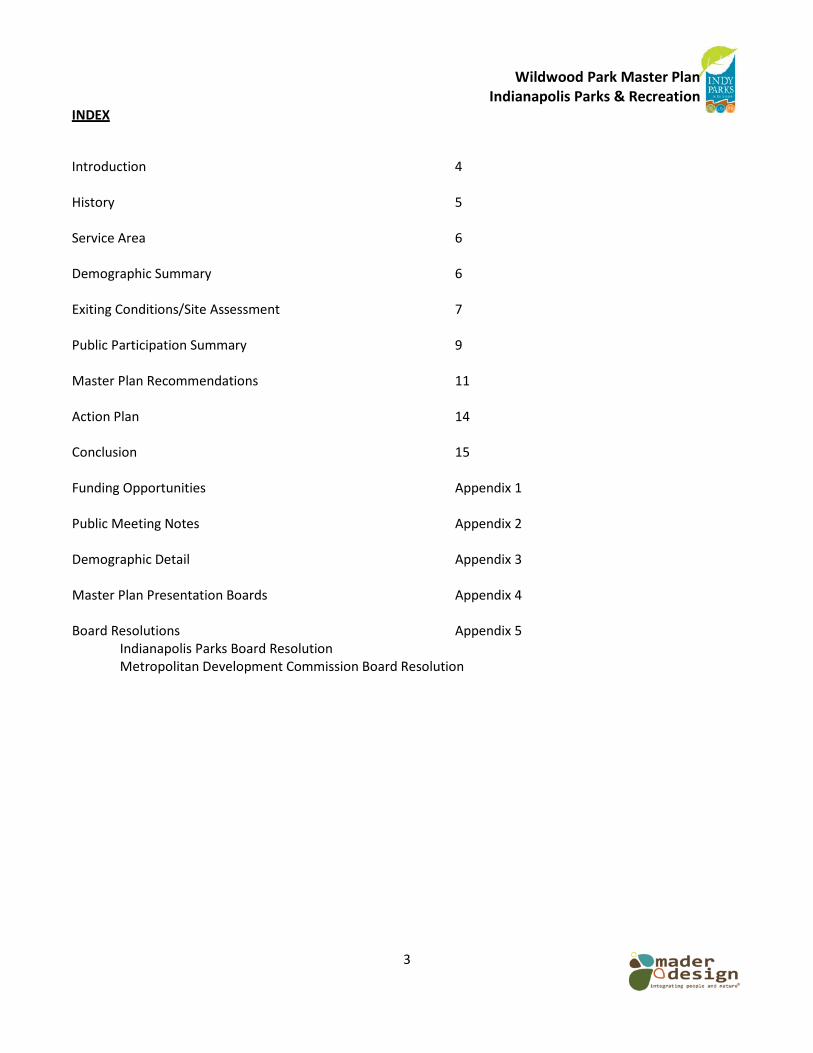
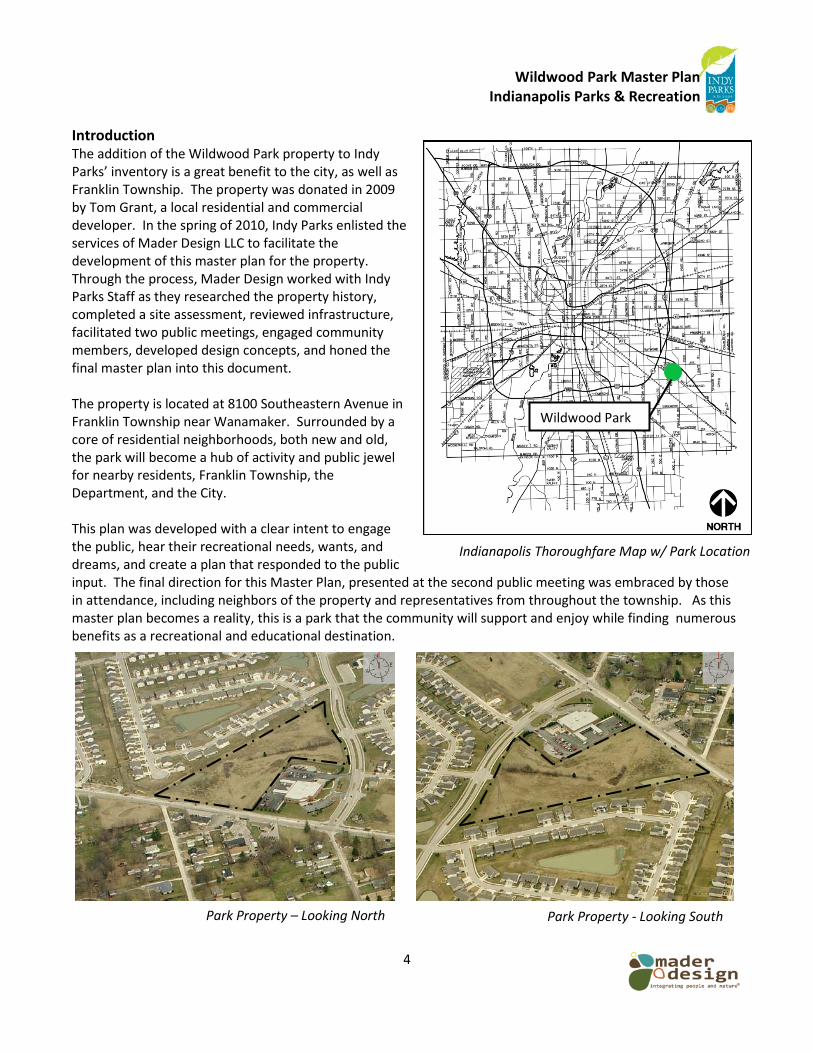
Introduction The addition of the Wildwood Park property to Indy Parks’ inventory is a great benefit to the city, as well as Franklin Township. The property was donated in 2009 by Tom Grant, a local residential and commercial developer. In the spring of 2010, Indy Parks enlisted the services of Mader Design LLC to facilitate the development of this master plan for the property. Through the process, Mader Design worked with Indy Parks Staff as they researched the property history, completed a site assessment, reviewed infrastructure, facilitated two public meetings, engaged community members, developed design concepts, and honed the final master plan into this document. The property is located at 8100 Southeastern Avenue in Franklin Township near Wanamaker. Surrounded by a core of residential neighborhoods, both new and old, the park will become a hub of activity and public jewel for nearby residents, Franklin Township, the Department, and the City. This plan was developed with a clear intent to engage the public, hear their recreational needs, wants, and dreams, and create a plan that responded to the public input. The final direction for this Master Plan, presented at the second public meeting was embraced by those in attendance, including neighbors of the property and representatives from throughout the township. As this master plan becomes a reality, this is a park that the community will support and enjoy while finding numerous benefits as a recreational and educational destination.
Indianapolis Thoroughfare Map w/ Park Location
Park Property - Looking South Park Property – Looking North
Wildwood Park
Wildwood Park Master Plan Indianapolis Parks & Recreation
5
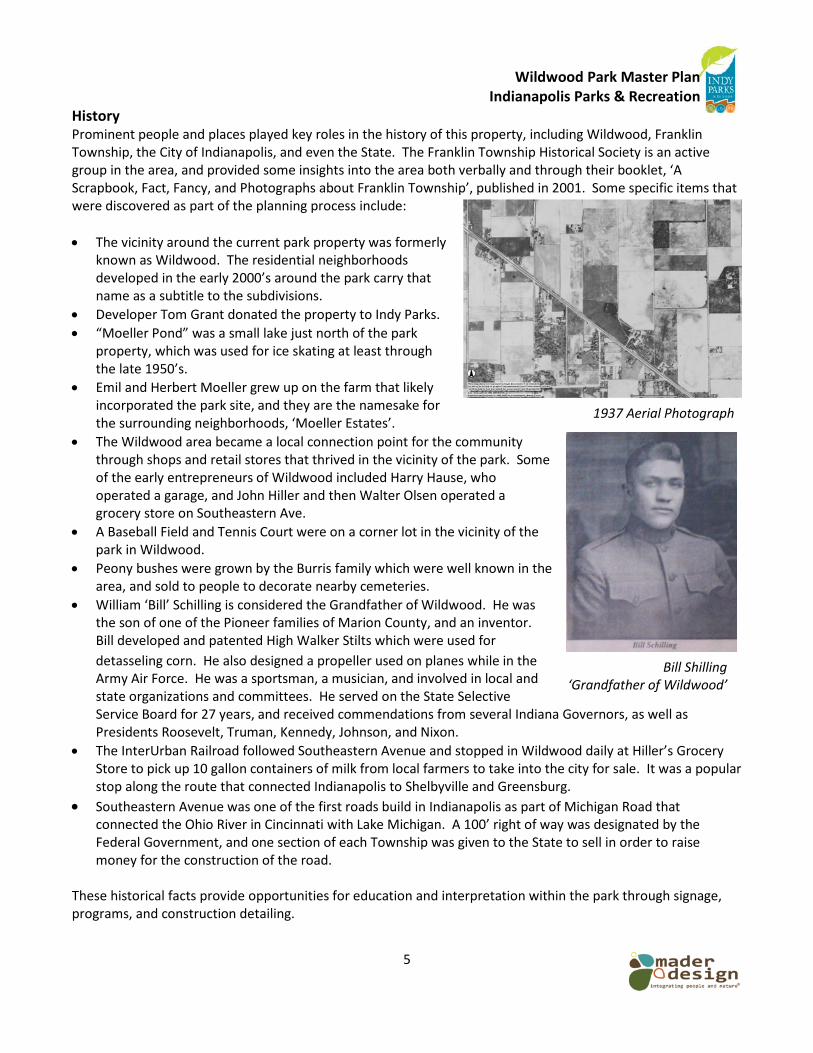
History Prominent people and places played key roles in the history of this property, including Wildwood, Franklin Township, the City of Indianapolis, and even the State. The Franklin Township Historical Society is an active group in the area, and provided some insights into the area both verbally and through their booklet, ‘A Scrapbook, Fact, Fancy, and Photographs about Franklin Township’, published in 2001. Some specific items that were discovered as part of the planning process include: • The vicinity around the current park property was formerly
known as Wildwood. The residential neighborhoods developed in the early 2000’s around the park carry that name as a subtitle to the subdivisions.
• Developer Tom Grant donated the property to Indy Parks. • “Moeller Pond” was a small lake just north of the park
property, which was used for ice skating at least through the late 1950’s.
• Emil and Herbert Moeller grew up on the farm that likely incorporated the park site, and they are the namesake for the surrounding neighborhoods, ‘Moeller Estates’.
• The Wildwood area became a local connection point for the community through shops and retail stores that thrived in the vicinity of the park. Some of the early entrepreneurs of Wildwood included Harry Hause, who operated a garage, and John Hiller and then Walter Olsen operated a grocery store on Southeastern Ave.
• A Baseball Field and Tennis Court were on a corner lot in the vicinity of the park in Wildwood.
• Peony bushes were grown by the Burris family which were well known in the area, and sold to people to decorate nearby cemeteries.
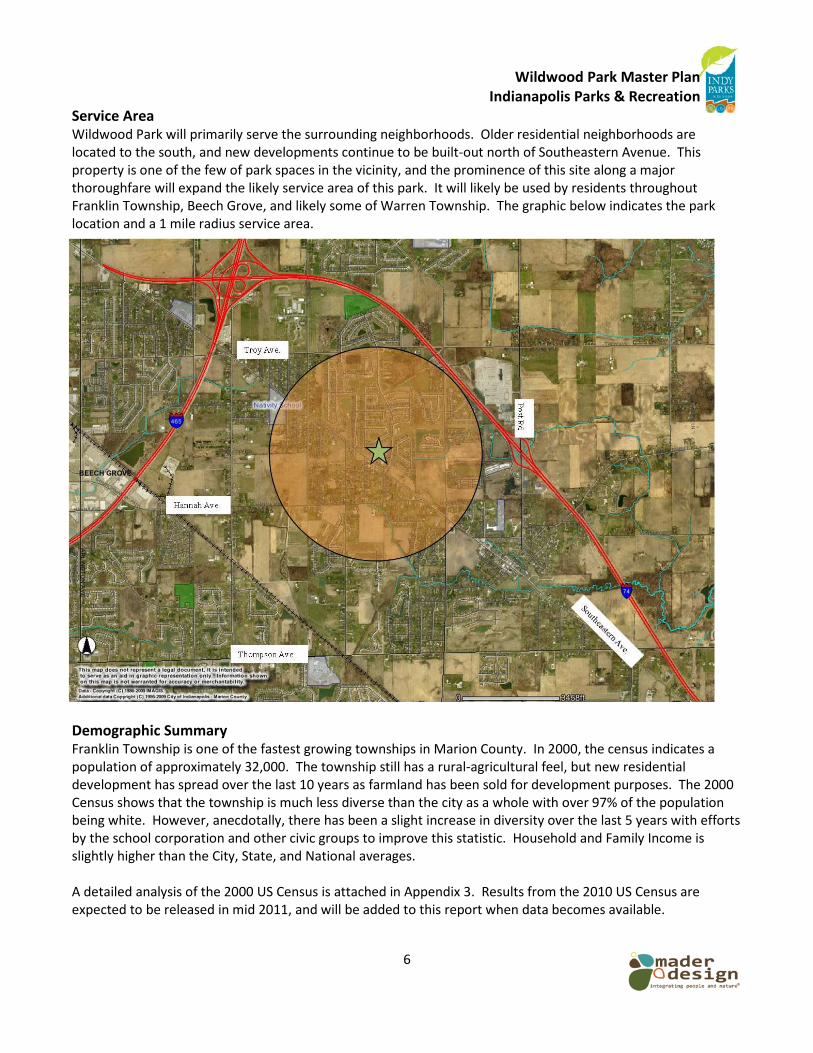
• William ‘Bill’ Schilling is considered the Grandfather of Wildwood. He was the son of one of the Pioneer families of Marion County, and an inventor. Bill developed and patented High Walker Stilts which were used for detasseling corn. He also designed a propeller used on planes while in the Army Air Force. He was a sportsman, a musician, and involved in local and state organizations and committees. He served on the State Selective Service Board for 27 years, and received commendations from several Indiana Governors, as well as Presidents Roosevelt, Truman, Kennedy, Johnson, and Nixon.
• The InterUrban Railroad followed Southeastern Avenue and stopped in Wildwood daily at Hiller’s Grocery Store to pick up 10 gallon containers of milk from local farmers to take into the city for sale. It was a popular stop along the route that connected Indianapolis to Shelbyville and Greensburg.
• Southeastern Avenue was one of the first roads build in Indianapolis as part of Michigan Road that connected the Ohio River in Cincinnati with Lake Michigan. A 100’ right of way was designated by the Federal Government, and one section of each Township was given to the State to sell in order to raise money for the construction of the road.
These historical facts provide opportunities for education and interpretation within the park through signage, programs, and construction detailing.
1937 Aerial Photograph
Bill Shilling ‘Grandfather of Wildwood’
Wildwood Park Master Plan Indianapolis Parks & Recreation
6
Service Area Wildwood Park will primarily serve the surrounding neighborhoods. Older residential neighborhoods are located to the south, and new developments continue to be built-out north of Southeastern Avenue. This property is one of the few of park spaces in the vicinity, and the prominence of this site along a major thoroughfare will expand the likely service area of this park. It will likely be used by residents throughout Franklin Township, Beech Grove, and likely some of Warren Township. The graphic below indicates the park location and a 1 mile radius service area.
Demographic Summary Franklin Township is one of the fastest growing townships in Marion County. In 2000, the census indicates a population of approximately 32,000. The township still has a rural-agricultural feel, but new residential development has spread over the last 10 years as farmland has been sold for development purposes. The 2000 Census shows that the township is much less diverse than the city as a whole with over 97% of the population being white. However, anecdotally, there has been a slight increase in diversity over the last 5 years with efforts by the school corporation and other civic groups to improve this statistic. Household and Family Income is slightly higher than the City, State, and National averages. A detailed analysis of the 2000 US Census is attached in Appendix 3. Results from the 2010 US Census are expected to be released in mid 2011, and will be added to this report when data becomes available.
Wildwood Park Master Plan Indianapolis Parks & Recreation
7
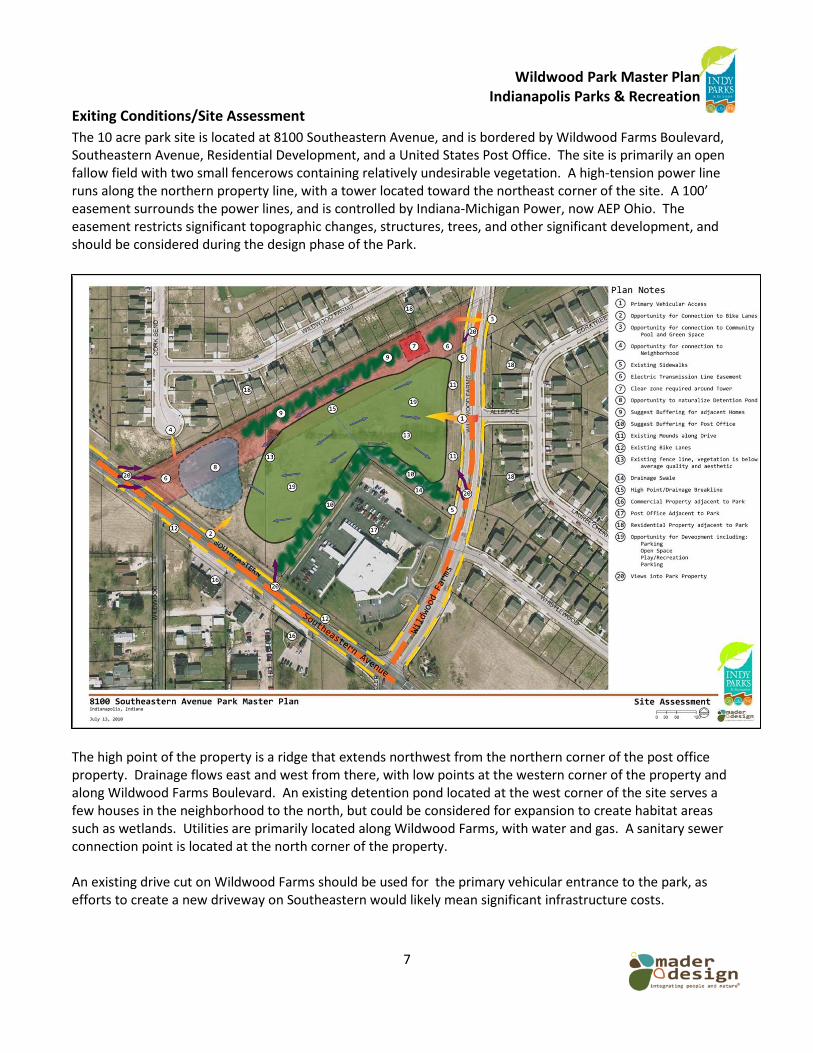
Exiting Conditions/Site Assessment The 10 acre park site is located at 8100 Southeastern Avenue, and is bordered by Wildwood Farms Boulevard, Southeastern Avenue, Residential Development, and a United States Post Office. The site is primarily an open fallow field with two small fencerows containing relatively undesirable vegetation. A high-tension power line runs along the northern property line, with a tower located toward the northeast corner of the site. A 100’ easement surrounds the power lines, and is controlled by Indiana-Michigan Power, now AEP Ohio. The easement restricts significant topographic changes, structures, trees, and other significant development, and should be considered during the design phase of the Park.
The high point of the property is a ridge that extends northwest from the northern corner of the post office property. Drainage flows east and west from there, with low points at the western corner of the property and along Wildwood Farms Boulevard. An existing detention pond located at the west corner of the site serves a few houses in the neighborhood to the north, but could be considered for expansion to create habitat areas such as wetlands. Utilities are primarily located along Wildwood Farms, with water and gas. A sanitary sewer connection point is located at the north corner of the property. An existing drive cut on Wildwood Farms should be used for the primary vehicular entrance to the park, as efforts to create a new driveway on Southeastern would likely mean significant infrastructure costs.
Wildwood Park Master Plan Indianapolis Parks & Recreation
8
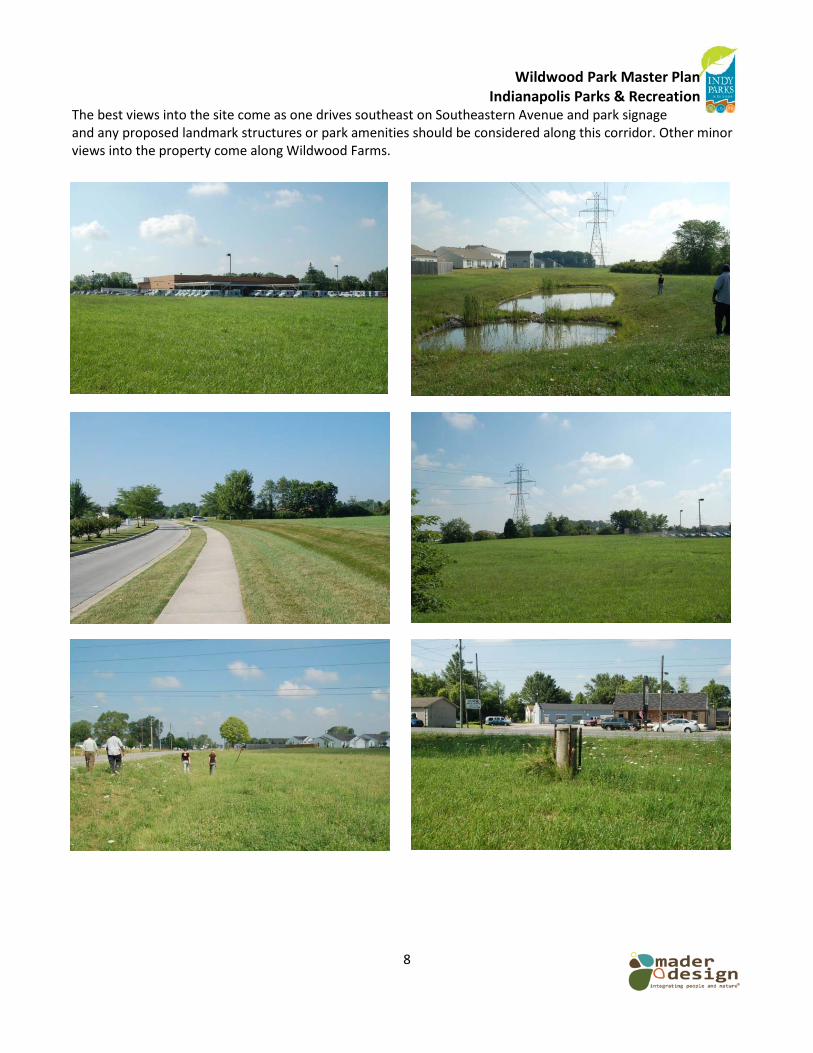
The best views into the site come as one drives southeast on Southeastern Avenue and park signage and any proposed landmark structures or park amenities should be considered along this corridor. Other minor views into the property come along Wildwood Farms.
Wildwood Park Master Plan Indianapolis Parks & Recreation
9
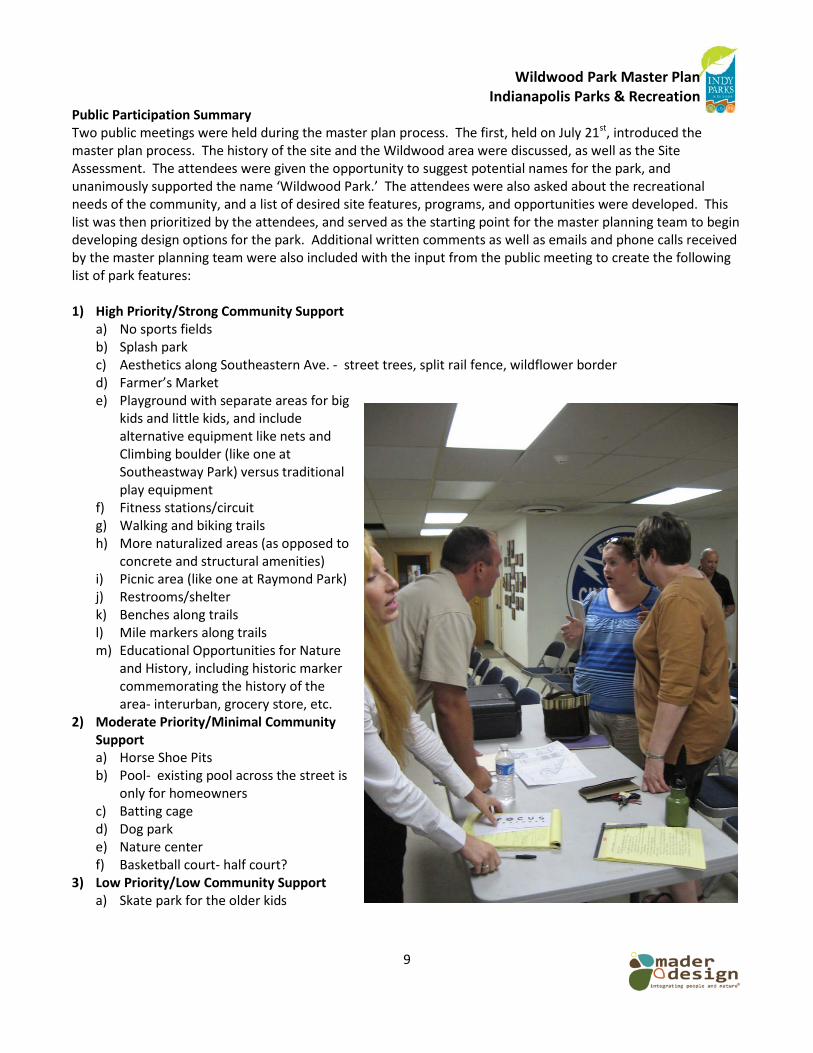
Public Participation Summary Two public meetings were held during the master plan process. The first, held on July 21st, introduced the master plan process. The history of the site and the Wildwood area were discussed, as well as the Site Assessment. The attendees were given the opportunity to suggest potential names for the park, and unanimously supported the name ‘Wildwood Park.’ The attendees were also asked about the recreational needs of the community, and a list of desired site features, programs, and opportunities were developed. This list was then prioritized by the attendees, and served as the starting point for the master planning team to begin developing design options for the park. Additional written comments as well as emails and phone calls received by the master planning team were also included with the input from the public meeting to create the following list of park features: 1) High Priority/Strong Community Support
a) No sports fields b) Splash park c) Aesthetics along Southeastern Ave. - street trees, split rail fence, wildflower border d) Farmer’s Market e) Playground with separate areas for big
kids and little kids, and include alternative equipment like nets and Climbing boulder (like one at Southeastway Park) versus traditional play equipment
f) Fitness stations/circuit g) Walking and biking trails h) More naturalized areas (as opposed to
concrete and structural amenities) i) Picnic area (like one at Raymond Park) j) Restrooms/shelter k) Benches along trails l) Mile markers along trails m) Educational Opportunities for Nature
and History, including historic marker commemorating the history of the area- interurban, grocery store, etc.
2) Moderate Priority/Minimal Community Support a) Horse Shoe Pits b) Pool- existing pool across the street is
only for homeowners c) Batting cage d) Dog park e) Nature center f) Basketball court- half court?
3) Low Priority/Low Community Support a) Skate park for the older kids
Wildwood Park Master Plan Indianapolis Parks & Recreation
10
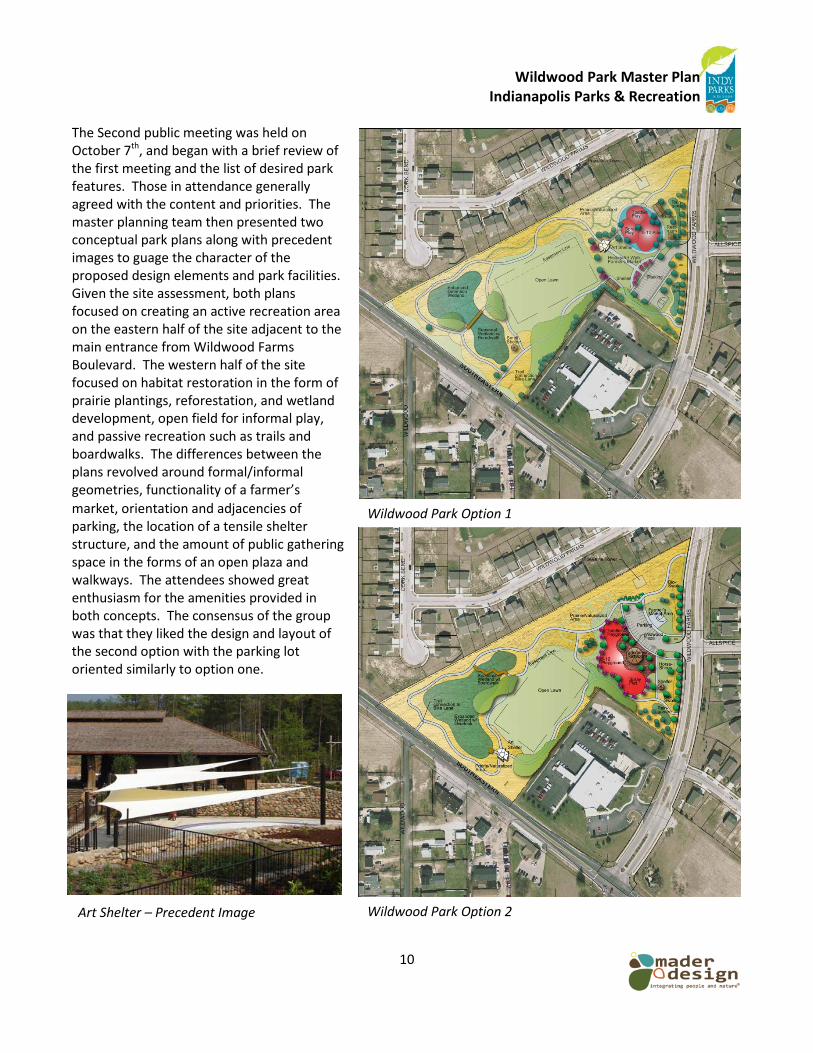
The Second public meeting was held on October 7th, and began with a brief review of the first meeting and the list of desired park features. Those in attendance generally agreed with the content and priorities. The master planning team then presented two conceptual park plans along with precedent images to guage the character of the proposed design elements and park facilities. Given the site assessment, both plans focused on creating an active recreation area on the eastern half of the site adjacent to the main entrance from Wildwood Farms Boulevard. The western half of the site focused on habitat restoration in the form of prairie plantings, reforestation, and wetland development, open field for informal play, and passive recreation such as trails and boardwalks. The differences between the plans revolved around formal/informal geometries, functionality of a farmer’s market, orientation and adjacencies of parking, the location of a tensile shelter structure, and the amount of public gathering space in the forms of an open plaza and walkways. The attendees showed great enthusiasm for the amenities provided in both concepts. The consensus of the group was that they liked the design and layout of the second option with the parking lot oriented similarly to option one.
Wildwood Park Option 1
Wildwood Park Option 2 Art Shelter – Precedent Image
Wildwood Park Master Plan Indianapolis Parks & Recreation
11
Master Plan Recommendations
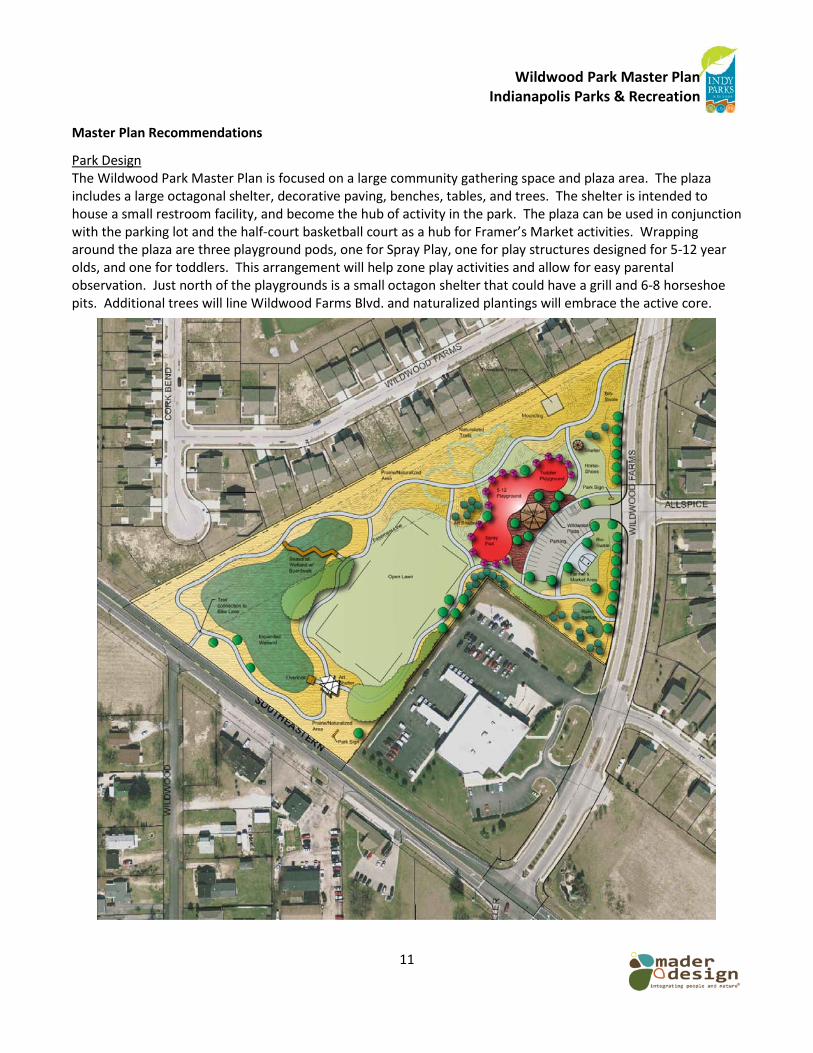
Park Design The Wildwood Park Master Plan is focused on a large community gathering space and plaza area. The plaza includes a large octagonal shelter, decorative paving, benches, tables, and trees. The shelter is intended to house a small restroom facility, and become the hub of activity in the park. The plaza can be used in conjunction with the parking lot and the half-court basketball court as a hub for Framer’s Market activities. Wrapping around the plaza are three playground pods, one for Spray Play, one for play structures designed for 5-12 year olds, and one for toddlers. This arrangement will help zone play activities and allow for easy parental observation. Just north of the playgrounds is a small octagon shelter that could have a grill and 6-8 horseshoe pits. Additional trees will line Wildwood Farms Blvd. and naturalized plantings will embrace the active core.
Wildwood Park Master Plan Indianapolis Parks & Recreation
12
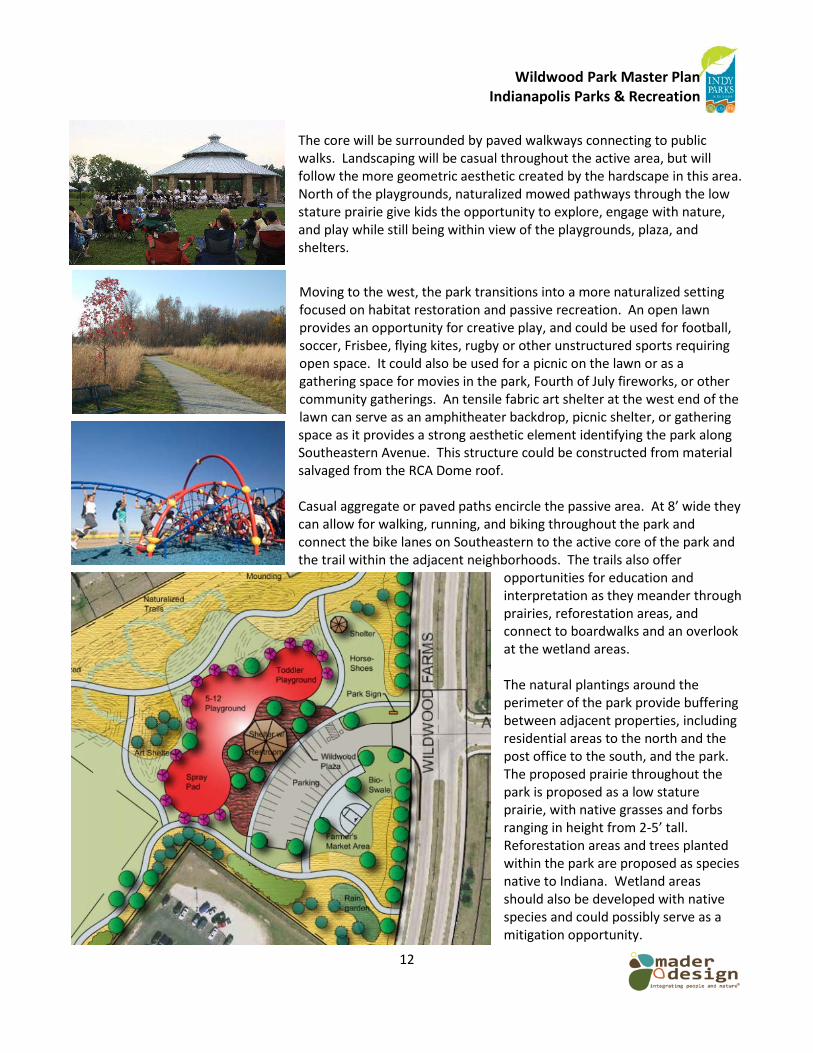
The core will be surrounded by paved walkways connecting to public walks. Landscaping will be casual throughout the active area, but will follow the more geometric aesthetic created by the hardscape in this area. North of the playgrounds, naturalized mowed pathways through the low stature prairie give kids the opportunity to explore, engage with nature, and play while still being within view of the playgrounds, plaza, and shelters.
Moving to the west, the park transitions into a more naturalized setting focused on habitat restoration and passive recreation. An open lawn provides an opportunity for creative play, and could be used for football, soccer, Frisbee, flying kites, rugby or other unstructured sports requiring open space. It could also be used for a picnic on the lawn or as a gathering space for movies in the park, Fourth of July fireworks, or other community gatherings. An tensile fabric art shelter at the west end of the lawn can serve as an amphitheater backdrop, picnic shelter, or gathering space as it provides a strong aesthetic element identifying the park along Southeastern Avenue. This structure could be constructed from material salvaged from the RCA Dome roof. Casual aggregate or paved paths encircle the passive area. At 8’ wide they can allow for walking, running, and biking throughout the park and connect the bike lanes on Southeastern to the active core of the park and the trail within the adjacent neighborhoods. The trails also offer
opportunities for education and interpretation as they meander through prairies, reforestation areas, and connect to boardwalks and an overlook at the wetland areas. The natural plantings around the perimeter of the park provide buffering between adjacent properties, including residential areas to the north and the post office to the south, and the park. The proposed prairie throughout the park is proposed as a low stature prairie, with native grasses and forbs ranging in height from 2-5’ tall. Reforestation areas and trees planted within the park are proposed as species native to Indiana. Wetland areas should also be developed with native species and could possibly serve as a mitigation opportunity.
Wildwood Park Master Plan Indianapolis Parks & Recreation
13
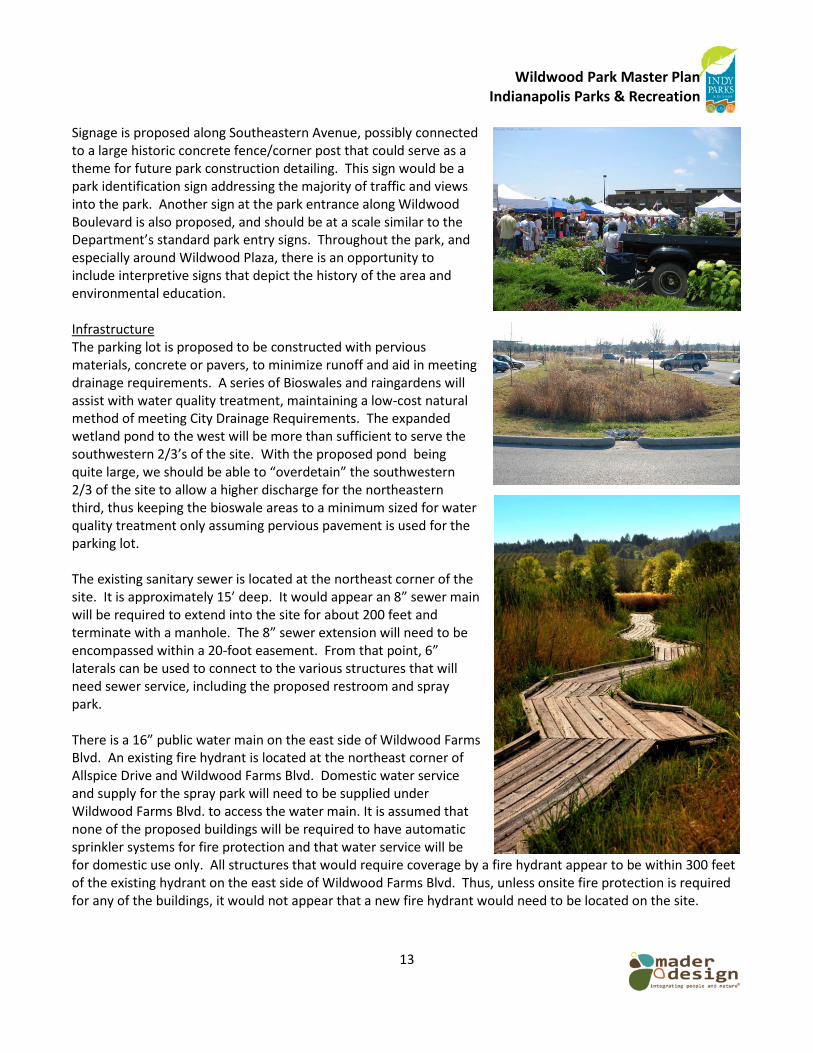
Signage is proposed along Southeastern Avenue, possibly connected to a large historic concrete fence/corner post that could serve as a theme for future park construction detailing. This sign would be a park identification sign addressing the majority of traffic and views into the park. Another sign at the park entrance along Wildwood Boulevard is also proposed, and should be at a scale similar to the Department’s standard park entry signs. Throughout the park, and especially around Wildwood Plaza, there is an opportunity to include interpretive signs that depict the history of the area and environmental education. Infrastructure The parking lot is proposed to be constructed with pervious materials, concrete or pavers, to minimize runoff and aid in meeting drainage requirements. A series of Bioswales and raingardens will assist with water quality treatment, maintaining a low-cost natural method of meeting City Drainage Requirements. The expanded wetland pond to the west will be more than sufficient to serve the southwestern 2/3’s of the site. With the proposed pond being quite large, we should be able to “overdetain” the southwestern 2/3 of the site to allow a higher discharge for the northeastern third, thus keeping the bioswale areas to a minimum sized for water quality treatment only assuming pervious pavement is used for the parking lot. The existing sanitary sewer is located at the northeast corner of the site. It is approximately 15’ deep. It would appear an 8” sewer main will be required to extend into the site for about 200 feet and terminate with a manhole. The 8” sewer extension will need to be encompassed within a 20-foot easement. From that point, 6” laterals can be used to connect to the various structures that will need sewer service, including the proposed restroom and spray park. There is a 16” public water main on the east side of Wildwood Farms Blvd. An existing fire hydrant is located at the northeast corner of Allspice Drive and Wildwood Farms Blvd. Domestic water service and supply for the spray park will need to be supplied under Wildwood Farms Blvd. to access the water main. It is assumed that none of the proposed buildings will be required to have automatic sprinkler systems for fire protection and that water service will be for domestic use only. All structures that would require coverage by a fire hydrant appear to be within 300 feet of the existing hydrant on the east side of Wildwood Farms Blvd. Thus, unless onsite fire protection is required for any of the buildings, it would not appear that a new fire hydrant would need to be located on the site.
Wildwood Park Master Plan Indianapolis Parks & Recreation
14
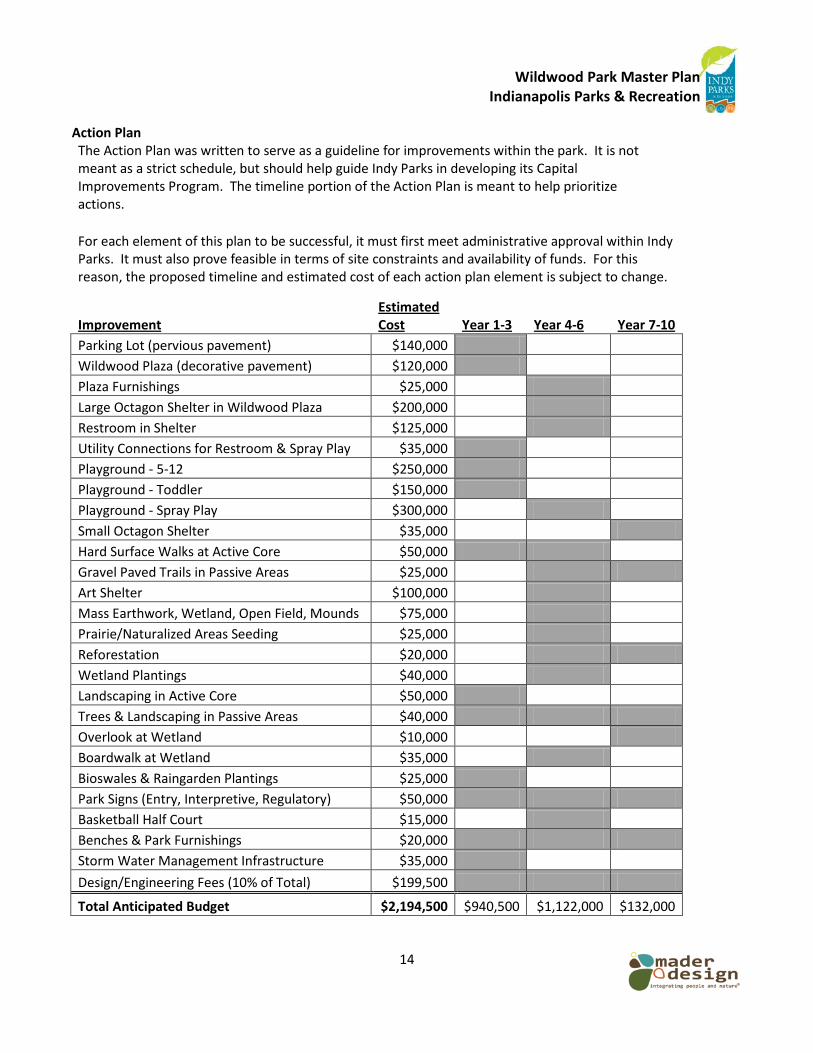
Action Plan The Action Plan was written to serve as a guideline for improvements within the park. It is not meant as a strict schedule, but should help guide Indy Parks in developing its Capital Improvements Program. The timeline portion of the Action Plan is meant to help prioritize actions. For each element of this plan to be successful, it must first meet administrative approval within Indy Parks. It must also prove feasible in terms of site constraints and availability of funds. For this reason, the proposed timeline and estimated cost of each action plan element is subject to change.
Improvement
Estimated Cost Year 1-3 Year 4-6 Year 7-10
Parking Lot (pervious pavement) $140,000 Wildwood Plaza (decorative pavement) $120,000 Plaza Furnishings $25,000 Large Octagon Shelter in Wildwood Plaza $200,000 Restroom in Shelter $125,000 Utility Connections for Restroom & Spray Play $35,000 Playground - 5-12 $250,000 Playground - Toddler $150,000 Playground - Spray Play $300,000 Small Octagon Shelter $35,000 Hard Surface Walks at Active Core $50,000 Gravel Paved Trails in Passive Areas $25,000 Art Shelter $100,000 Mass Earthwork, Wetland, Open Field, Mounds $75,000 Prairie/Naturalized Areas Seeding $25,000 Reforestation $20,000 Wetland Plantings $40,000 Landscaping in Active Core $50,000 Trees & Landscaping in Passive Areas $40,000 Overlook at Wetland $10,000 Boardwalk at Wetland $35,000 Bioswales & Raingarden Plantings $25,000 Park Signs (Entry, Interpretive, Regulatory) $50,000 Basketball Half Court $15,000 Benches & Park Furnishings $20,000 Storm Water Management Infrastructure $35,000 Design/Engineering Fees (10% of Total) $199,500
Total Anticipated Budget $2,194,500 $940,500 $1,122,000 $132,000
Wildwood Park Master Plan Indianapolis Parks & Recreation
15
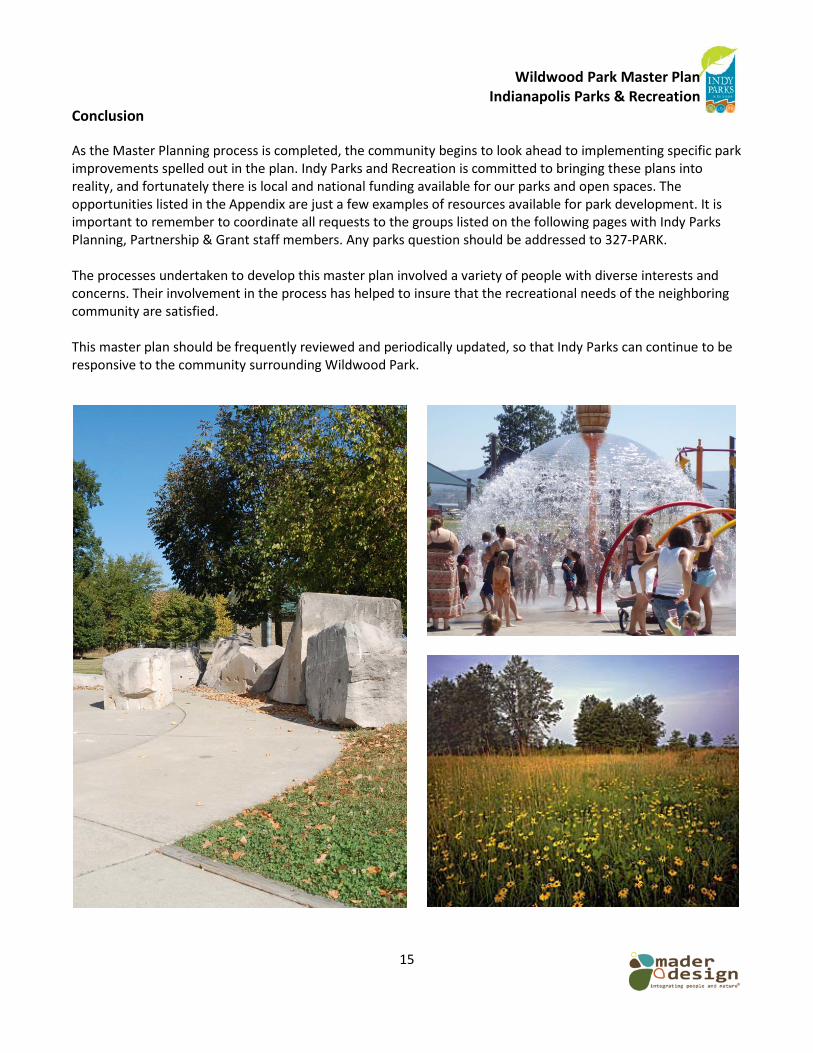
Conclusion
As the Master Planning process is completed, the community begins to look ahead to implementing specific park improvements spelled out in the plan. Indy Parks and Recreation is committed to bringing these plans into reality, and fortunately there is local and national funding available for our parks and open spaces. The opportunities listed in the Appendix are just a few examples of resources available for park development. It is important to remember to coordinate all requests to the groups listed on the following pages with Indy Parks Planning, Partnership & Grant staff members. Any parks question should be addressed to 327-PARK. The processes undertaken to develop this master plan involved a variety of people with diverse interests and concerns. Their involvement in the process has helped to insure that the recreational needs of the neighboring community are satisfied. This master plan should be frequently reviewed and periodically updated, so that Indy Parks can continue to be responsive to the community surrounding Wildwood Park.
Wildwood Park Master Plan Indianapolis Parks & Recreation
16
Appendix 1 - Funding Opportunities Park Advisory Councils - “Friends Of” Groups Park advisory councils represent one opportunity for participation by community members. These are volunteer citizens who come together to assist the Department of Parks and Recreation (DPR) with managing a park’s development. The Northwestway Park Advisory Council has assisted DPR in recent years with input about a disc golf course, a playground and trail improvements. Advisory Councils who wish to fund raise to advance park improvements can utilize the Indianapolis Parks Foundation to administer these funds. Some Advisory Councils have taken the step of registering as 501(c)(3), non-profit organizations, whose mission is to benefit the park. These “Friends Of” groups have been instrumental in raising awareness, funds and the standards for their parks. The Friends of Holliday Park has recently raised $3.8 million to construct the Holliday Park Nature Center. The Eagle Creek Park Foundation is in the midst of an ambitious $10 million program to improve Eagle Creek Park. The Friends of Garfield Park have raised more than $1 million to fund a maintenance endowment for the sunken gardens. From Public Meetings, and recent work at Acton Park, there appears to be some interest on behalf of Franklin Township residents to further develop a “Friends Of” group, or work with the Parks Foundation to develop a more robust fund dedicated to parks in Franklin Township. Granting Opportunities DPR in 2000 assigned a staff person as Grants Coordinator for the Department. These duties include identifying, researching, applying for and administering grants for capital improvements and programs in Indianapolis Parks. Recent grants have funded the Summer Lunch Program and improvements to Talbott & 29th Street Park. DPR is happy to assist community members who wish to apply for a grant to benefit a park. There are a great number of grants available to make parks better places to recreate. If you have a project you wish to seek a grant for, or know of a grant that could benefit a particular park, call 327-7050 and ask for information about grants. Indianapolis Parks Foundation The Indianapolis Park Foundation is a charitable organization that was created in 1991 to increase recreational opportunities in Indianapolis through contributions from our community. The Parks Foundation has been a vocal advocate for DPR and has provided more than $4 million in capital improvements, and nearly $1 million for parks programs. The Parks Foundation’s vision is that parks in Indianapolis will be quality spaces for all citizens to enjoy and that adequate financial resources will be available to support park projects, programs, maintenance and capital needs. To fulfill this vision, the Indianapolis Parks Foundation is currently initiating an aggressive fund raising campaign to strengthen its support of DPR. More information can be found at www.indyparksfoundation.org. Keep Indianapolis Beautiful Keep Indianapolis Beautiful (KIB) is a local non-profit organization that works to secure private donations for the benefit of local organizations, such as DPR. Founded in 1976 and renamed in 1997, KIB has been especially effective in establishing volunteer tree plantings in many Indianapolis Parks. KIB’s organizational abilities have helped both private companies and neighborhood organizations to hold successful volunteer planting events, building a sense of ownership and unity with in a community. More information can be found at www.kibi.org.
Wildwood Park Master Plan Indianapolis Parks & Recreation
17
Land and Water Conservation Fund (LWCF) The LWCF was established by Congress in 1965 to promote quality outdoor recreation opportunities in the United States. In the 30 years since its creation, LWCF has been responsible for the acquisition of nearly seven million acres of parkland and open space and the development of more than 37,000 parks and recreation projects. This grant must be applied for by a governmental agency, such as DPR and it requires a 50% percent funding match. Specific grant award levels vary by year. For more information visit www.ncrc.nps.gov/PROGRAMS/LWCF/index.html UPARR Program The Urban Park and Recreation Recovery (UPARR) program was established in November 1978 by to provide matching grants and technical assistance to economically distressed urban communities. The purpose of the program is to provide direct Federal assistance to urban localities for rehabilitation of critically needed recreation facilities. The law also encourages systematic local planning and commitment to continuing operation and maintenance of recreation programs, sites, and facilities. DPR has recently completed improvements at Willard Park, assisted in part by a $500,000 UPARR grant, and is now implementing a grant for Martin Luther King Park pool renovations. More information can be found at www.nps.gov/pub_aff/uparr/grants/index.html. Wetland Mitigation Often, when new construction occurs and existing wetlands are disturbed, a new wetland is required to be created elsewhere. IDEM requires specific ratios of acreage to be provided based on the type and quality of wetland disturbed. The 1 acre wetland pond proposed for the site could be an opportunity to use wetland mitigation money from other entities to build a natural park amenity. While dollars could be available for this construction, it is important to note that ongoing maintenance will be required, and the Department should be sure to weigh the current and future benefits with the potential costs.

Wildwood Park Master Plan Indianapolis Parks & Recreation
18
Appendix 2 - Public Meeting Notes
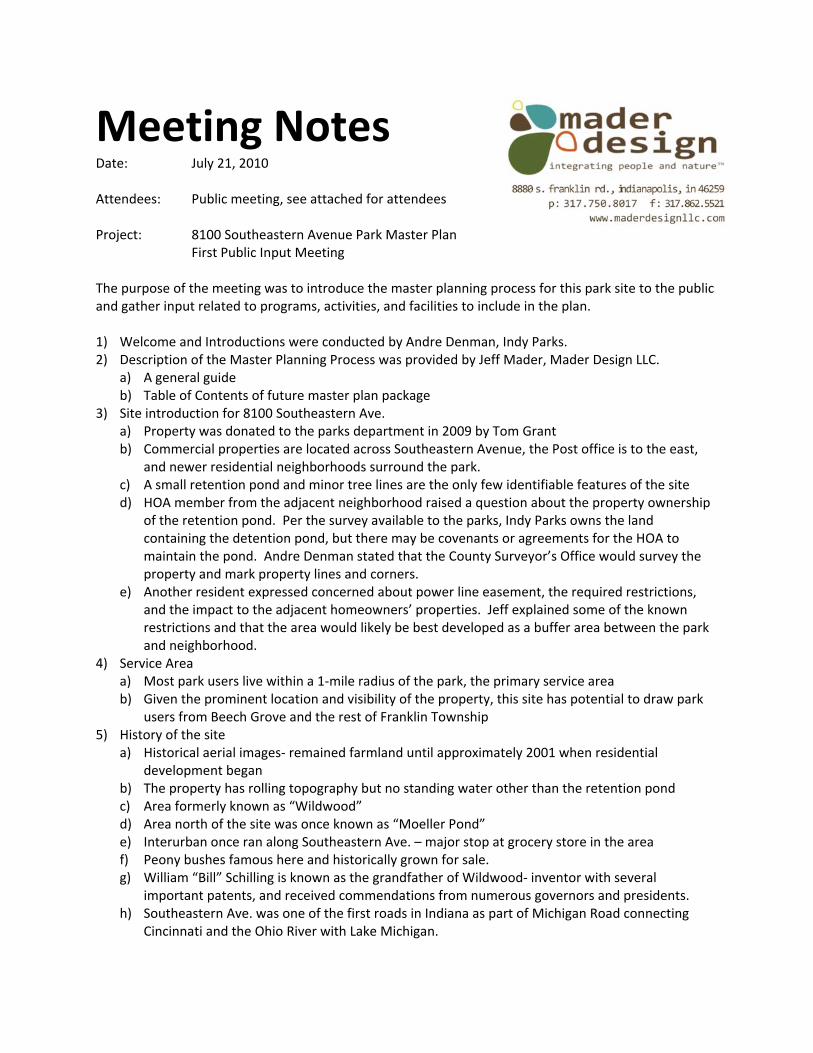
Meeting Notes Date: July 21, 2010 Attendees: Public meeting, see attached for attendees Project: 8100 Southeastern Avenue Park Master Plan First Public Input Meeting The purpose of the meeting was to introduce the master planning process for this park site to the public and gather input related to programs, activities, and facilities to include in the plan. 1) Welcome and Introductions were conducted by Andre Denman, Indy Parks. 2) Description of the Master Planning Process was provided by Jeff Mader, Mader Design LLC.
a) A general guide b) Table of Contents of future master plan package
3) Site introduction for 8100 Southeastern Ave. a) Property was donated to the parks department in 2009 by Tom Grant b) Commercial properties are located across Southeastern Avenue, the Post office is to the east,
and newer residential neighborhoods surround the park. c) A small retention pond and minor tree lines are the only few identifiable features of the site d) HOA member from the adjacent neighborhood raised a question about the property ownership
of the retention pond. Per the survey available to the parks, Indy Parks owns the land containing the detention pond, but there may be covenants or agreements for the HOA to maintain the pond. Andre Denman stated that the County Surveyor’s Office would survey the property and mark property lines and corners.
e) Another resident expressed concerned about power line easement, the required restrictions, and the impact to the adjacent homeowners’ properties. Jeff explained some of the known restrictions and that the area would likely be best developed as a buffer area between the park and neighborhood.
4) Service Area a) Most park users live within a 1‐mile radius of the park, the primary service area b) Given the prominent location and visibility of the property, this site has potential to draw park
users from Beech Grove and the rest of Franklin Township 5) History of the site
a) Historical aerial images‐ remained farmland until approximately 2001 when residential development began
b) The property has rolling topography but no standing water other than the retention pond c) Area formerly known as “Wildwood” d) Area north of the site was once known as “Moeller Pond” e) Interurban once ran along Southeastern Ave. – major stop at grocery store in the area f) Peony bushes famous here and historically grown for sale. g) William “Bill” Schilling is known as the grandfather of Wildwood‐ inventor with several
important patents, and received commendations from numerous governors and presidents. h) Southeastern Ave. was one of the first roads in Indiana as part of Michigan Road connecting
Cincinnati and the Ohio River with Lake Michigan.
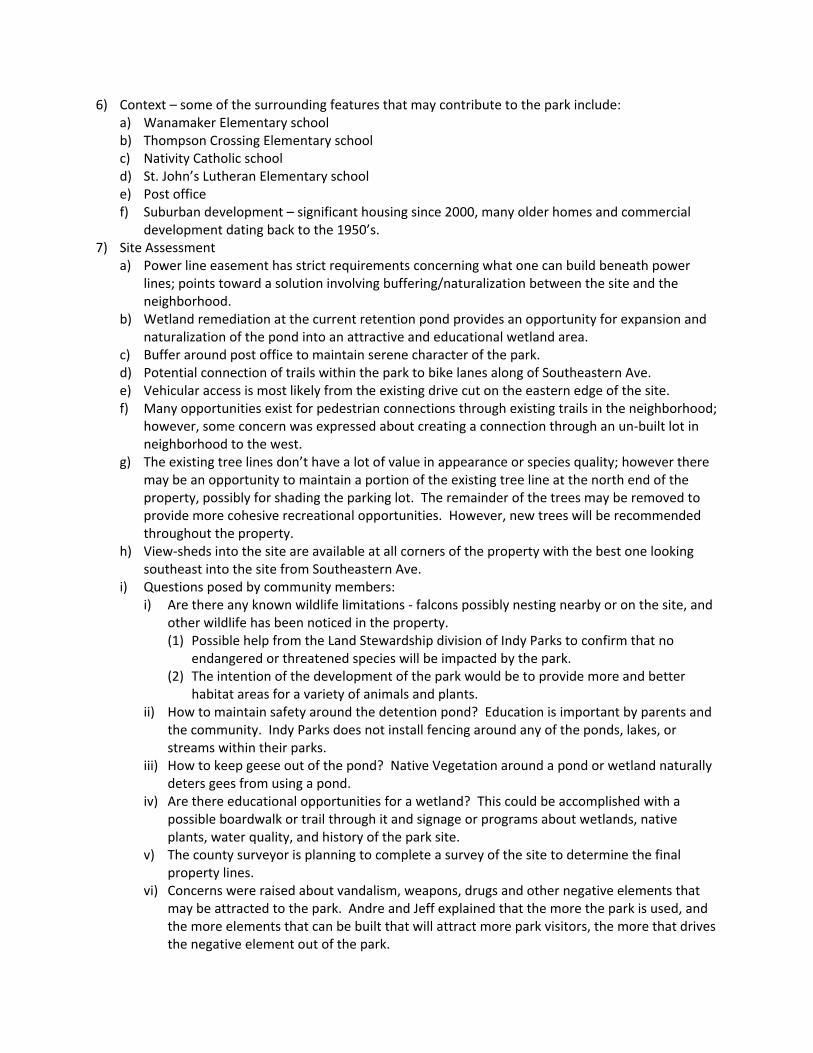
6) Context – some of the surrounding features that may contribute to the park include: a) Wanamaker Elementary school b) Thompson Crossing Elementary school c) Nativity Catholic school d) St. John’s Lutheran Elementary school e) Post office f) Suburban development – significant housing since 2000, many older homes and commercial
development dating back to the 1950’s. 7) Site Assessment
a) Power line easement has strict requirements concerning what one can build beneath power lines; points toward a solution involving buffering/naturalization between the site and the neighborhood.
b) Wetland remediation at the current retention pond provides an opportunity for expansion and naturalization of the pond into an attractive and educational wetland area.
c) Buffer around post office to maintain serene character of the park. d) Potential connection of trails within the park to bike lanes along of Southeastern Ave. e) Vehicular access is most likely from the existing drive cut on the eastern edge of the site. f) Many opportunities exist for pedestrian connections through existing trails in the neighborhood;
however, some concern was expressed about creating a connection through an un‐built lot in neighborhood to the west.
g) The existing tree lines don’t have a lot of value in appearance or species quality; however there may be an opportunity to maintain a portion of the existing tree line at the north end of the property, possibly for shading the parking lot. The remainder of the trees may be removed to provide more cohesive recreational opportunities. However, new trees will be recommended throughout the property.
h) View‐sheds into the site are available at all corners of the property with the best one looking southeast into the site from Southeastern Ave.
i) Questions posed by community members: i) Are there any known wildlife limitations ‐ falcons possibly nesting nearby or on the site, and
other wildlife has been noticed in the property. (1) Possible help from the Land Stewardship division of Indy Parks to confirm that no
endangered or threatened species will be impacted by the park. (2) The intention of the development of the park would be to provide more and better
habitat areas for a variety of animals and plants. ii) How to maintain safety around the detention pond? Education is important by parents and
the community. Indy Parks does not install fencing around any of the ponds, lakes, or streams within their parks.
iii) How to keep geese out of the pond? Native Vegetation around a pond or wetland naturally deters gees from using a pond.
iv) Are there educational opportunities for a wetland? This could be accomplished with a possible boardwalk or trail through it and signage or programs about wetlands, native plants, water quality, and history of the park site.
v) The county surveyor is planning to complete a survey of the site to determine the final property lines.
vi) Concerns were raised about vandalism, weapons, drugs and other negative elements that may be attracted to the park. Andre and Jeff explained that the more the park is used, and the more elements that can be built that will attract more park visitors, the more that drives the negative element out of the park.
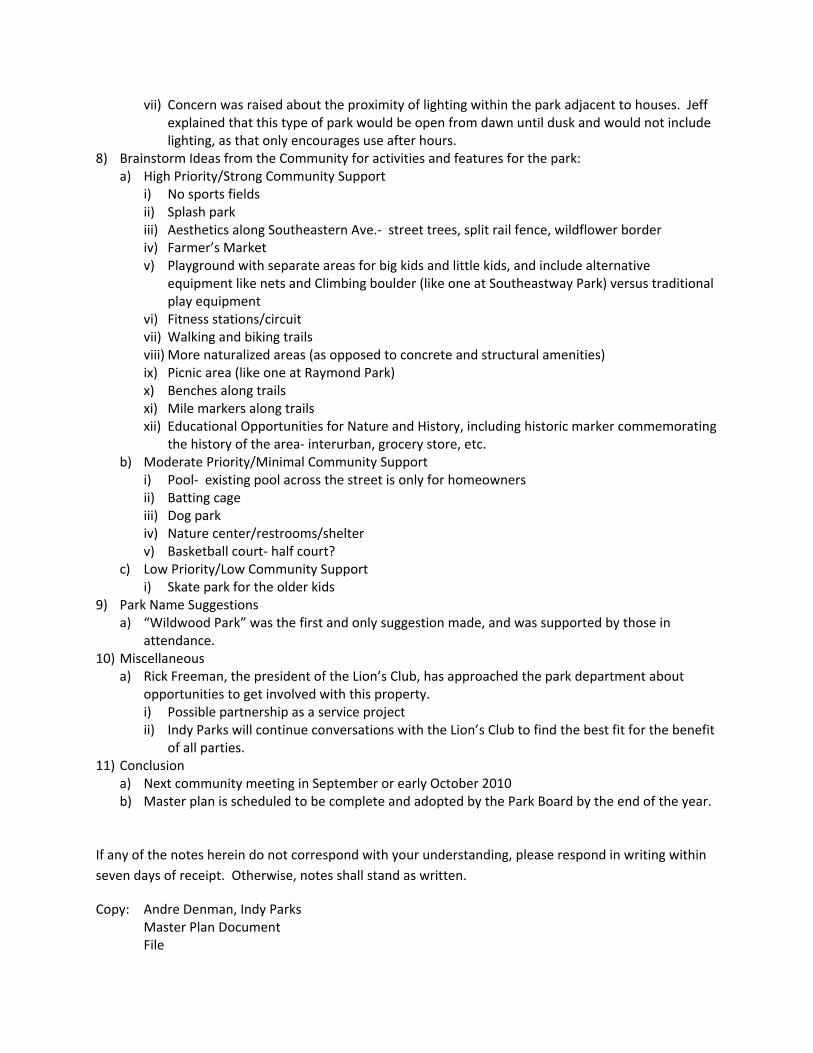
vii) Concern was raised about the proximity of lighting within the park adjacent to houses. Jeff explained that this type of park would be open from dawn until dusk and would not include lighting, as that only encourages use after hours.
8) Brainstorm Ideas from the Community for activities and features for the park: a) High Priority/Strong Community Support
i) No sports fields ii) Splash park iii) Aesthetics along Southeastern Ave.‐ street trees, split rail fence, wildflower border iv) Farmer’s Market v) Playground with separate areas for big kids and little kids, and include alternative
equipment like nets and Climbing boulder (like one at Southeastway Park) versus traditional play equipment
vi) Fitness stations/circuit vii) Walking and biking trails viii) More naturalized areas (as opposed to concrete and structural amenities) ix) Picnic area (like one at Raymond Park) x) Benches along trails xi) Mile markers along trails xii) Educational Opportunities for Nature and History, including historic marker commemorating
the history of the area‐ interurban, grocery store, etc. b) Moderate Priority/Minimal Community Support
i) Pool‐ existing pool across the street is only for homeowners ii) Batting cage iii) Dog park iv) Nature center/restrooms/shelter v) Basketball court‐ half court?
c) Low Priority/Low Community Support i) Skate park for the older kids
9) Park Name Suggestions a) “Wildwood Park” was the first and only suggestion made, and was supported by those in
attendance. 10) Miscellaneous
a) Rick Freeman, the president of the Lion’s Club, has approached the park department about opportunities to get involved with this property. i) Possible partnership as a service project ii) Indy Parks will continue conversations with the Lion’s Club to find the best fit for the benefit
of all parties. 11) Conclusion
a) Next community meeting in September or early October 2010 b) Master plan is scheduled to be complete and adopted by the Park Board by the end of the year.
If any of the notes herein do not correspond with your understanding, please respond in writing within
seven days of receipt. Otherwise, notes shall stand as written.
Copy: Andre Denman, Indy Parks Master Plan Document File
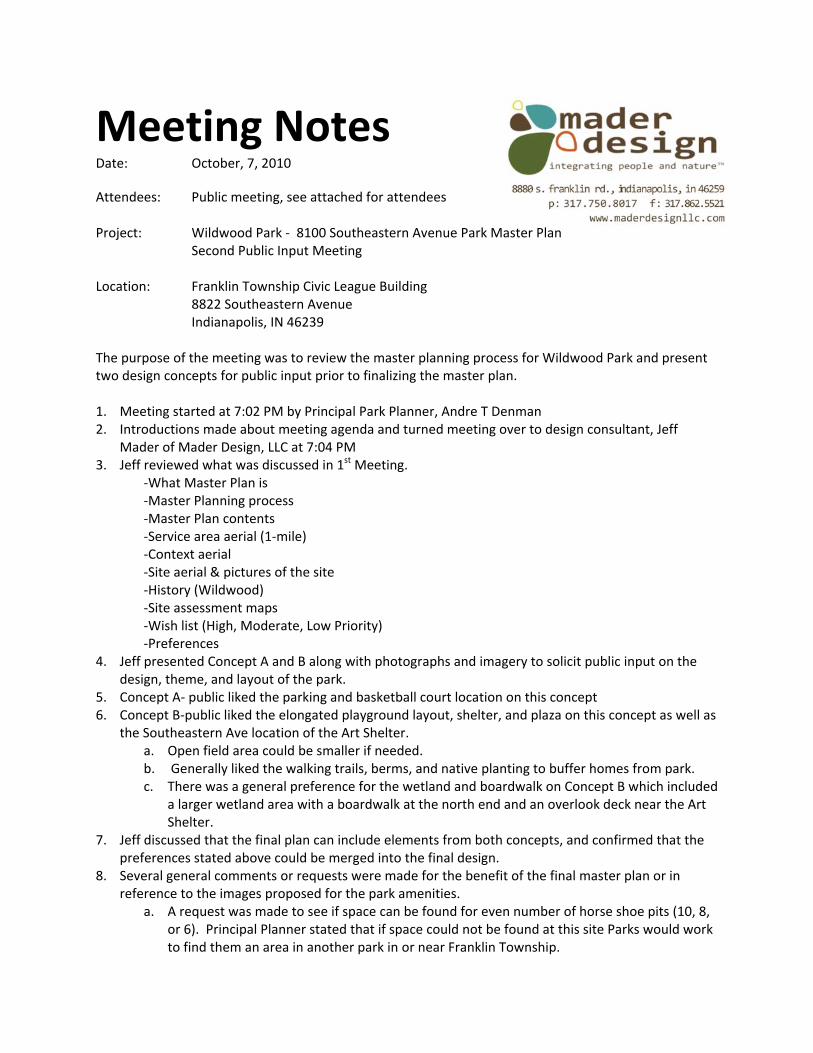
Meeting Notes Date: October, 7, 2010
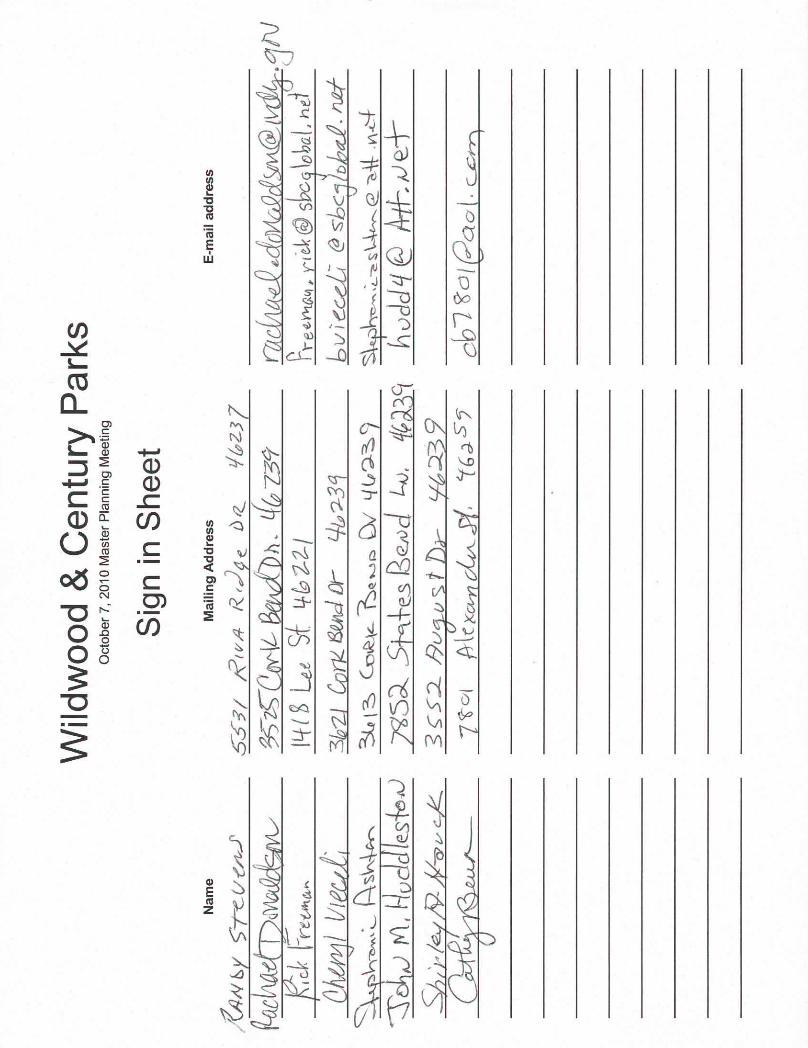
Attendees: Public meeting, see attached for attendees Project: Wildwood Park ‐ 8100 Southeastern Avenue Park Master Plan Second Public Input Meeting
Location: Franklin Township Civic League Building
8822 Southeastern Avenue Indianapolis, IN 46239
The purpose of the meeting was to review the master planning process for Wildwood Park and present two design concepts for public input prior to finalizing the master plan. 1. Meeting started at 7:02 PM by Principal Park Planner, Andre T Denman 2. Introductions made about meeting agenda and turned meeting over to design consultant, Jeff
Mader of Mader Design, LLC at 7:04 PM 3. Jeff reviewed what was discussed in 1st Meeting. ‐What Master Plan is ‐Master Planning process ‐Master Plan contents ‐Service area aerial (1‐mile) ‐Context aerial ‐Site aerial & pictures of the site ‐History (Wildwood) ‐Site assessment maps ‐Wish list (High, Moderate, Low Priority) ‐Preferences 4. Jeff presented Concept A and B along with photographs and imagery to solicit public input on the
design, theme, and layout of the park. 5. Concept A‐ public liked the parking and basketball court location on this concept 6. Concept B‐public liked the elongated playground layout, shelter, and plaza on this concept as well as
the Southeastern Ave location of the Art Shelter. a. Open field area could be smaller if needed. b. Generally liked the walking trails, berms, and native planting to buffer homes from park. c. There was a general preference for the wetland and boardwalk on Concept B which included
a larger wetland area with a boardwalk at the north end and an overlook deck near the Art Shelter.
7. Jeff discussed that the final plan can include elements from both concepts, and confirmed that the preferences stated above could be merged into the final design.
8. Several general comments or requests were made for the benefit of the final master plan or in reference to the images proposed for the park amenities.
a. A request was made to see if space can be found for even number of horse shoe pits (10, 8, or 6). Principal Planner stated that if space could not be found at this site Parks would work to find them an area in another park in or near Franklin Township.
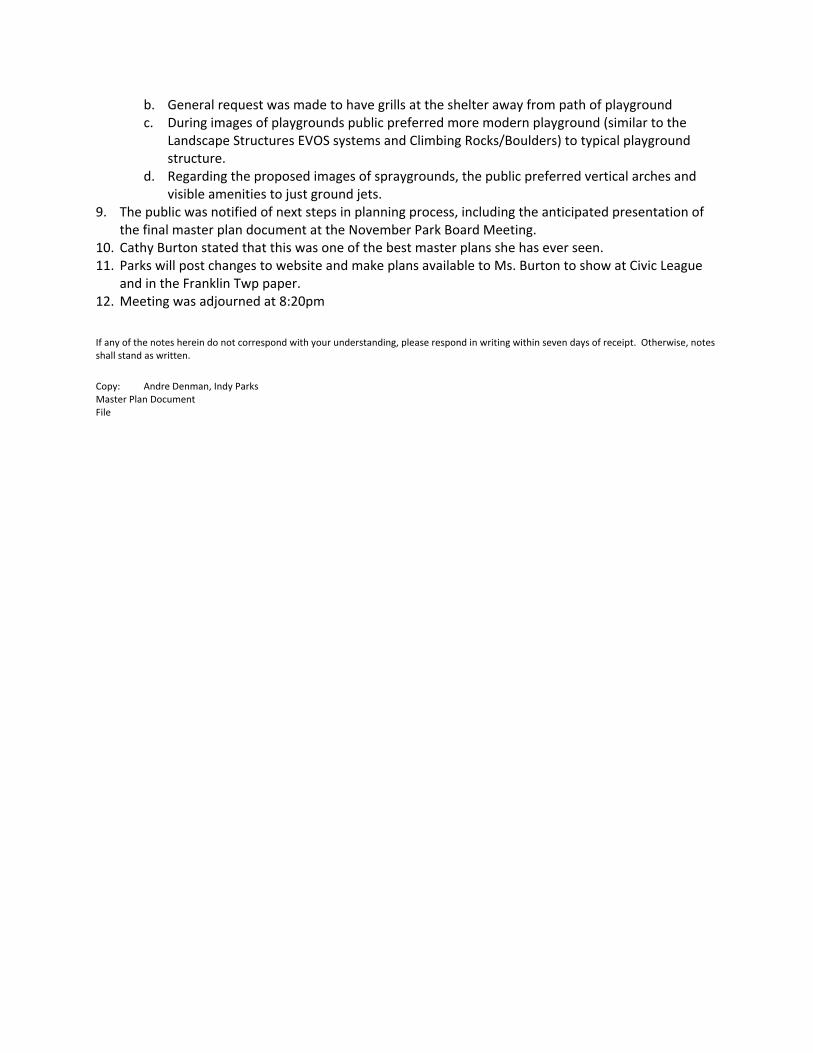
b. General request was made to have grills at the shelter away from path of playground c. During images of playgrounds public preferred more modern playground (similar to the
Landscape Structures EVOS systems and Climbing Rocks/Boulders) to typical playground structure.
d. Regarding the proposed images of spraygrounds, the public preferred vertical arches and visible amenities to just ground jets.
9. The public was notified of next steps in planning process, including the anticipated presentation of the final master plan document at the November Park Board Meeting.
10. Cathy Burton stated that this was one of the best master plans she has ever seen. 11. Parks will post changes to website and make plans available to Ms. Burton to show at Civic League
and in the Franklin Twp paper. 12. Meeting was adjourned at 8:20pm If any of the notes herein do not correspond with your understanding, please respond in writing within seven days of receipt. Otherwise, notes shall stand as written.
Copy: Andre Denman, Indy Parks Master Plan Document File
Wildwood&CenturyParks
October
7.2010
MasterPlanningMeeting
SigninSheet
-E-mailaddress
MailingAddress
SS3'1KII/,4
i<..(.J?e
.D
rZ...
1/(PZ37
~Z-~Qv-\L-Bew.tDh,
4(P73et
r1Lc1Jta&
£dcM
ciQr£SdV\@I~-!jN
Ilf{E
Le.esf
lff£;2-2-1
Pre~
Y1W
"1d=
(e-k@
sk~\o
l;aLh
ld3h1J
CoI/L.&
Ma-
%?-30,
bvie.c.e.Li@
SbCJ/Dbd.N
:f~
\~C
o~\£
-~~
>01::>
();
L/l;'
;).."
:;,7~~:<.:~s~e.
-e-\t.V\d
Zt5d-..
st:-+esBQ
Nd~.
1~d-39
hvddL
f@Itti-,
JJe.+
-:5
~,).2
f)utJ-iI').tDr
w..:
B9
l~OI
Prlc X
cvn~J?f,
'-(6,;)s,-
ob1
~C
lIpaol.
CJ?=!:\
Name
,(;:;.
/v&1
>r<-U-t/VY
P-ac~m~5iVV
R'e-kt~e~~~
CA/.dIJjI
/11M
;~-:>'.,,,,,,,',-f-\,,~~
-:r~,Jr
Il,I-Jud-JI-es-fo-.AJ
:;,)21'to/fiN
YO'I/
<:,k:,
~eJJ/'--

Wildwood Park Master Plan Indianapolis Parks & Recreation
19
Appendix 3 - Demographic Detail
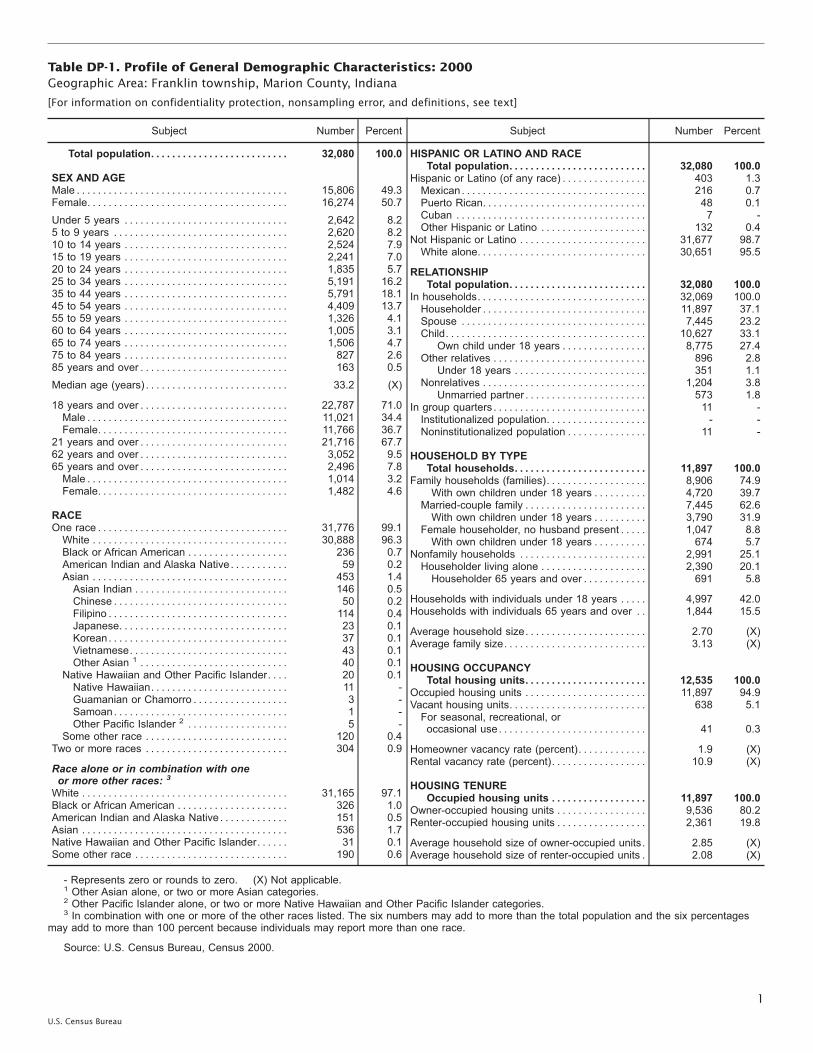
Table DP-1. Profile of General Demographic Characteristics: 2000Geographic Area: Franklin township, Marion County, Indiana
[For information on confidentiality protection, nonsampling error, and definitions, see text]
Subject Number Percent
Total population. . . . . . . . . . . . . . . . . . . . . . . . . . 32,080 100.0
SEX AND AGEMale . . . . . . . . . . . . . . . . . . . . . . . . . . . . . . . . . . . . . . . . 15,806 49.3Female. . . . . . . . . . . . . . . . . . . . . . . . . . . . . . . . . . . . . . 16,274 50.7Under 5 years . . . . . . . . . . . . . . . . . . . . . . . . . . . . . . . 2,642 8.25 to 9 years . . . . . . . . . . . . . . . . . . . . . . . . . . . . . . . . . 2,620 8.210 to 14 years . . . . . . . . . . . . . . . . . . . . . . . . . . . . . . . 2,524 7.915 to 19 years . . . . . . . . . . . . . . . . . . . . . . . . . . . . . . . 2,241 7.020 to 24 years . . . . . . . . . . . . . . . . . . . . . . . . . . . . . . . 1,835 5.725 to 34 years . . . . . . . . . . . . . . . . . . . . . . . . . . . . . . . 5,191 16.235 to 44 years . . . . . . . . . . . . . . . . . . . . . . . . . . . . . . . 5,791 18.145 to 54 years . . . . . . . . . . . . . . . . . . . . . . . . . . . . . . . 4,409 13.755 to 59 years . . . . . . . . . . . . . . . . . . . . . . . . . . . . . . . 1,326 4.160 to 64 years . . . . . . . . . . . . . . . . . . . . . . . . . . . . . . . 1,005 3.165 to 74 years . . . . . . . . . . . . . . . . . . . . . . . . . . . . . . . 1,506 4.775 to 84 years . . . . . . . . . . . . . . . . . . . . . . . . . . . . . . . 827 2.685 years and over . . . . . . . . . . . . . . . . . . . . . . . . . . . . 163 0.5Median age (years) . . . . . . . . . . . . . . . . . . . . . . . . . . . 33.2 (X)
18 years and over . . . . . . . . . . . . . . . . . . . . . . . . . . . . 22,787 71.0Male . . . . . . . . . . . . . . . . . . . . . . . . . . . . . . . . . . . . . . 11,021 34.4Female. . . . . . . . . . . . . . . . . . . . . . . . . . . . . . . . . . . . 11,766 36.7
21 years and over . . . . . . . . . . . . . . . . . . . . . . . . . . . . 21,716 67.762 years and over . . . . . . . . . . . . . . . . . . . . . . . . . . . . 3,052 9.565 years and over . . . . . . . . . . . . . . . . . . . . . . . . . . . . 2,496 7.8Male . . . . . . . . . . . . . . . . . . . . . . . . . . . . . . . . . . . . . . 1,014 3.2Female. . . . . . . . . . . . . . . . . . . . . . . . . . . . . . . . . . . . 1,482 4.6
RACEOne race . . . . . . . . . . . . . . . . . . . . . . . . . . . . . . . . . . . . 31,776 99.1White . . . . . . . . . . . . . . . . . . . . . . . . . . . . . . . . . . . . . 30,888 96.3Black or African American . . . . . . . . . . . . . . . . . . . 236 0.7American Indian and Alaska Native . . . . . . . . . . . 59 0.2Asian . . . . . . . . . . . . . . . . . . . . . . . . . . . . . . . . . . . . . 453 1.4Asian Indian . . . . . . . . . . . . . . . . . . . . . . . . . . . . . 146 0.5Chinese . . . . . . . . . . . . . . . . . . . . . . . . . . . . . . . . . 50 0.2Filipino . . . . . . . . . . . . . . . . . . . . . . . . . . . . . . . . . . 114 0.4Japanese. . . . . . . . . . . . . . . . . . . . . . . . . . . . . . . . 23 0.1Korean . . . . . . . . . . . . . . . . . . . . . . . . . . . . . . . . . . 37 0.1Vietnamese. . . . . . . . . . . . . . . . . . . . . . . . . . . . . . 43 0.1Other Asian 1 . . . . . . . . . . . . . . . . . . . . . . . . . . . . 40 0.1
Native Hawaiian and Other Pacific Islander. . . . 20 0.1Native Hawaiian. . . . . . . . . . . . . . . . . . . . . . . . . . 11 -Guamanian or Chamorro . . . . . . . . . . . . . . . . . . 3 -Samoan. . . . . . . . . . . . . . . . . . . . . . . . . . . . . . . . . 1 -Other Pacific Islander 2 . . . . . . . . . . . . . . . . . . . 5 -
Some other race . . . . . . . . . . . . . . . . . . . . . . . . . . . 120 0.4Two or more races . . . . . . . . . . . . . . . . . . . . . . . . . . . 304 0.9
Race alone or in combination with oneor more other races: 3White . . . . . . . . . . . . . . . . . . . . . . . . . . . . . . . . . . . . . . . 31,165 97.1Black or African American . . . . . . . . . . . . . . . . . . . . . 326 1.0American Indian and Alaska Native . . . . . . . . . . . . . 151 0.5Asian . . . . . . . . . . . . . . . . . . . . . . . . . . . . . . . . . . . . . . . 536 1.7Native Hawaiian and Other Pacific Islander. . . . . . 31 0.1Some other race . . . . . . . . . . . . . . . . . . . . . . . . . . . . . 190 0.6
Subject Number Percent
HISPANIC OR LATINO AND RACETotal population. . . . . . . . . . . . . . . . . . . . . . . . . . 32,080 100.0
Hispanic or Latino (of any race) . . . . . . . . . . . . . . . . 403 1.3Mexican . . . . . . . . . . . . . . . . . . . . . . . . . . . . . . . . . . . 216 0.7Puerto Rican. . . . . . . . . . . . . . . . . . . . . . . . . . . . . . . 48 0.1Cuban . . . . . . . . . . . . . . . . . . . . . . . . . . . . . . . . . . . . 7 -Other Hispanic or Latino . . . . . . . . . . . . . . . . . . . . 132 0.4
Not Hispanic or Latino . . . . . . . . . . . . . . . . . . . . . . . . 31,677 98.7White alone. . . . . . . . . . . . . . . . . . . . . . . . . . . . . . . . 30,651 95.5
RELATIONSHIPTotal population. . . . . . . . . . . . . . . . . . . . . . . . . . 32,080 100.0
In households. . . . . . . . . . . . . . . . . . . . . . . . . . . . . . . . 32,069 100.0Householder . . . . . . . . . . . . . . . . . . . . . . . . . . . . . . . 11,897 37.1Spouse . . . . . . . . . . . . . . . . . . . . . . . . . . . . . . . . . . . 7,445 23.2Child. . . . . . . . . . . . . . . . . . . . . . . . . . . . . . . . . . . . . . 10,627 33.1
Own child under 18 years . . . . . . . . . . . . . . . . 8,775 27.4Other relatives . . . . . . . . . . . . . . . . . . . . . . . . . . . . . 896 2.8
Under 18 years . . . . . . . . . . . . . . . . . . . . . . . . . 351 1.1Nonrelatives . . . . . . . . . . . . . . . . . . . . . . . . . . . . . . . 1,204 3.8
Unmarried partner . . . . . . . . . . . . . . . . . . . . . . . 573 1.8In group quarters . . . . . . . . . . . . . . . . . . . . . . . . . . . . . 11 -Institutionalized population. . . . . . . . . . . . . . . . . . . - -Noninstitutionalized population . . . . . . . . . . . . . . . 11 -
HOUSEHOLD BY TYPETotal households. . . . . . . . . . . . . . . . . . . . . . . . . 11,897 100.0
Family households (families). . . . . . . . . . . . . . . . . . . 8,906 74.9With own children under 18 years . . . . . . . . . . 4,720 39.7
Married-couple family . . . . . . . . . . . . . . . . . . . . . . . 7,445 62.6With own children under 18 years . . . . . . . . . . 3,790 31.9
Female householder, no husband present . . . . . 1,047 8.8With own children under 18 years . . . . . . . . . . 674 5.7
Nonfamily households . . . . . . . . . . . . . . . . . . . . . . . . 2,991 25.1Householder living alone . . . . . . . . . . . . . . . . . . . . 2,390 20.1Householder 65 years and over . . . . . . . . . . . . 691 5.8
Households with individuals under 18 years . . . . . 4,997 42.0Households with individuals 65 years and over . . 1,844 15.5
Average household size. . . . . . . . . . . . . . . . . . . . . . . 2.70 (X)Average family size. . . . . . . . . . . . . . . . . . . . . . . . . . . 3.13 (X)
HOUSING OCCUPANCYTotal housing units. . . . . . . . . . . . . . . . . . . . . . . 12,535 100.0
Occupied housing units . . . . . . . . . . . . . . . . . . . . . . . 11,897 94.9Vacant housing units. . . . . . . . . . . . . . . . . . . . . . . . . . 638 5.1For seasonal, recreational, oroccasional use . . . . . . . . . . . . . . . . . . . . . . . . . . . . 41 0.3
Homeowner vacancy rate (percent). . . . . . . . . . . . . 1.9 (X)Rental vacancy rate (percent). . . . . . . . . . . . . . . . . . 10.9 (X)
HOUSING TENUREOccupied housing units . . . . . . . . . . . . . . . . . . 11,897 100.0
Owner-occupied housing units . . . . . . . . . . . . . . . . . 9,536 80.2Renter-occupied housing units . . . . . . . . . . . . . . . . . 2,361 19.8
Average household size of owner-occupied units. 2.85 (X)Average household size of renter-occupied units . 2.08 (X)
- Represents zero or rounds to zero. (X) Not applicable.1 Other Asian alone, or two or more Asian categories.2 Other Pacific Islander alone, or two or more Native Hawaiian and Other Pacific Islander categories.3 In combination with one or more of the other races listed. The six numbers may add to more than the total population and the six percentages
may add to more than 100 percent because individuals may report more than one race.
Source: U.S. Census Bureau, Census 2000.
U.S. Census Bureau
1
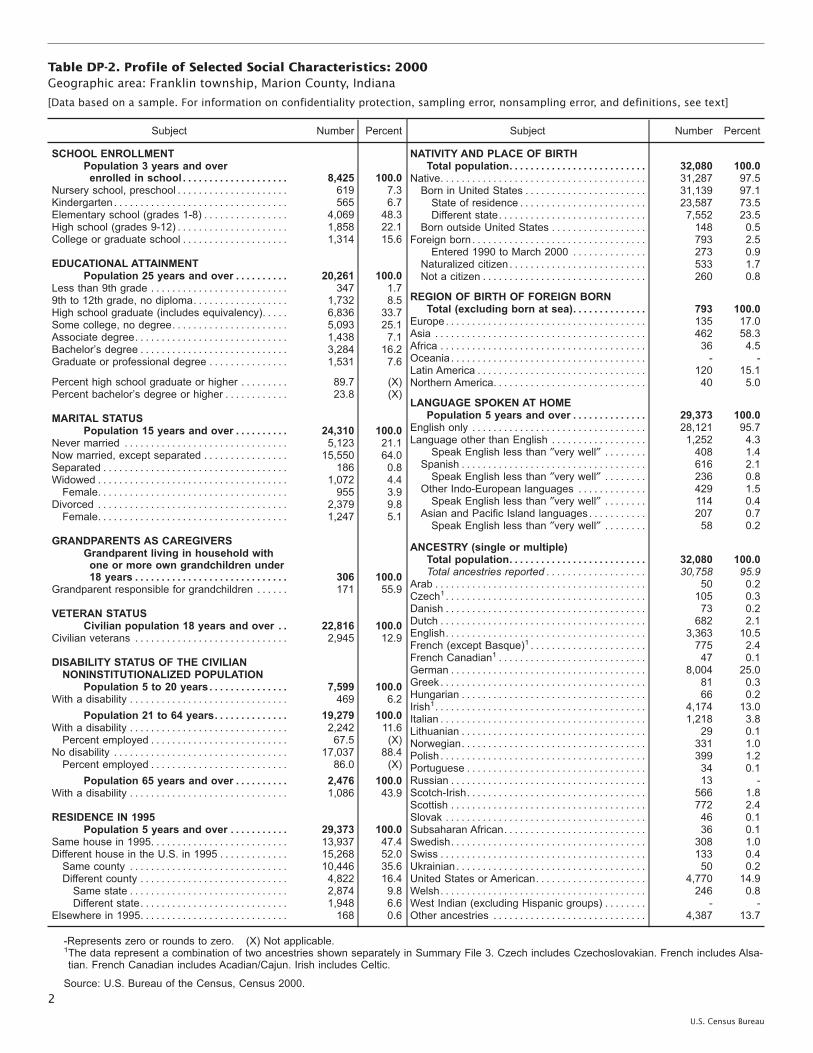
Table DP-2. Profile of Selected Social Characteristics: 2000Geographic area: Franklin township, Marion County, Indiana
[Data based on a sample. For information on confidentiality protection, sampling error, nonsampling error, and definitions, see text]
Subject Number Percent
SCHOOL ENROLLMENTPopulation 3 years and overenrolled in school . . . . . . . . . . . . . . . . . . . . 8,425 100.0
Nursery school, preschool . . . . . . . . . . . . . . . . . . . . . 619 7.3Kindergarten . . . . . . . . . . . . . . . . . . . . . . . . . . . . . . . . . 565 6.7Elementary school (grades 1-8) . . . . . . . . . . . . . . . . 4,069 48.3High school (grades 9-12) . . . . . . . . . . . . . . . . . . . . . 1,858 22.1College or graduate school . . . . . . . . . . . . . . . . . . . . 1,314 15.6
EDUCATIONAL ATTAINMENTPopulation 25 years and over . . . . . . . . . . 20,261 100.0
Less than 9th grade . . . . . . . . . . . . . . . . . . . . . . . . . . 347 1.79th to 12th grade, no diploma. . . . . . . . . . . . . . . . . . 1,732 8.5High school graduate (includes equivalency). . . . . 6,836 33.7Some college, no degree. . . . . . . . . . . . . . . . . . . . . . 5,093 25.1Associate degree. . . . . . . . . . . . . . . . . . . . . . . . . . . . . 1,438 7.1Bachelor’s degree . . . . . . . . . . . . . . . . . . . . . . . . . . . . 3,284 16.2Graduate or professional degree . . . . . . . . . . . . . . . 1,531 7.6
Percent high school graduate or higher . . . . . . . . . 89.7 (X)Percent bachelor’s degree or higher . . . . . . . . . . . . 23.8 (X)
MARITAL STATUSPopulation 15 years and over . . . . . . . . . . 24,310 100.0
Never married . . . . . . . . . . . . . . . . . . . . . . . . . . . . . . . 5,123 21.1Now married, except separated . . . . . . . . . . . . . . . . 15,550 64.0Separated . . . . . . . . . . . . . . . . . . . . . . . . . . . . . . . . . . . 186 0.8Widowed . . . . . . . . . . . . . . . . . . . . . . . . . . . . . . . . . . . . 1,072 4.4Female. . . . . . . . . . . . . . . . . . . . . . . . . . . . . . . . . . . . 955 3.9
Divorced . . . . . . . . . . . . . . . . . . . . . . . . . . . . . . . . . . . . 2,379 9.8Female. . . . . . . . . . . . . . . . . . . . . . . . . . . . . . . . . . . . 1,247 5.1
GRANDPARENTS AS CAREGIVERSGrandparent living in household withone or more own grandchildren under18 years . . . . . . . . . . . . . . . . . . . . . . . . . . . . . 306 100.0
Grandparent responsible for grandchildren . . . . . . 171 55.9
VETERAN STATUSCivilian population 18 years and over . . 22,816 100.0
Civilian veterans . . . . . . . . . . . . . . . . . . . . . . . . . . . . . 2,945 12.9
DISABILITY STATUS OF THE CIVILIANNONINSTITUTIONALIZED POPULATION
Population 5 to 20 years . . . . . . . . . . . . . . . 7,599 100.0With a disability . . . . . . . . . . . . . . . . . . . . . . . . . . . . . . 469 6.2
Population 21 to 64 years. . . . . . . . . . . . . . 19,279 100.0With a disability . . . . . . . . . . . . . . . . . . . . . . . . . . . . . . 2,242 11.6Percent employed . . . . . . . . . . . . . . . . . . . . . . . . . . 67.5 (X)
No disability . . . . . . . . . . . . . . . . . . . . . . . . . . . . . . . . . 17,037 88.4Percent employed . . . . . . . . . . . . . . . . . . . . . . . . . . 86.0 (X)
Population 65 years and over . . . . . . . . . . 2,476 100.0With a disability . . . . . . . . . . . . . . . . . . . . . . . . . . . . . . 1,086 43.9
RESIDENCE IN 1995Population 5 years and over . . . . . . . . . . . 29,373 100.0
Same house in 1995. . . . . . . . . . . . . . . . . . . . . . . . . . 13,937 47.4Different house in the U.S. in 1995 . . . . . . . . . . . . . 15,268 52.0Same county . . . . . . . . . . . . . . . . . . . . . . . . . . . . . . 10,446 35.6Different county . . . . . . . . . . . . . . . . . . . . . . . . . . . . 4,822 16.4Same state . . . . . . . . . . . . . . . . . . . . . . . . . . . . . . 2,874 9.8Different state. . . . . . . . . . . . . . . . . . . . . . . . . . . . 1,948 6.6
Elsewhere in 1995. . . . . . . . . . . . . . . . . . . . . . . . . . . . 168 0.6
Subject Number Percent
NATIVITY AND PLACE OF BIRTHTotal population. . . . . . . . . . . . . . . . . . . . . . . . . . 32,080 100.0
Native. . . . . . . . . . . . . . . . . . . . . . . . . . . . . . . . . . . . . . . 31,287 97.5Born in United States . . . . . . . . . . . . . . . . . . . . . . . 31,139 97.1State of residence . . . . . . . . . . . . . . . . . . . . . . . . 23,587 73.5Different state. . . . . . . . . . . . . . . . . . . . . . . . . . . . 7,552 23.5
Born outside United States . . . . . . . . . . . . . . . . . . 148 0.5Foreign born . . . . . . . . . . . . . . . . . . . . . . . . . . . . . . . . . 793 2.5
Entered 1990 to March 2000 . . . . . . . . . . . . . . 273 0.9Naturalized citizen . . . . . . . . . . . . . . . . . . . . . . . . . . 533 1.7Not a citizen . . . . . . . . . . . . . . . . . . . . . . . . . . . . . . . 260 0.8
REGION OF BIRTH OF FOREIGN BORNTotal (excluding born at sea). . . . . . . . . . . . . . 793 100.0
Europe . . . . . . . . . . . . . . . . . . . . . . . . . . . . . . . . . . . . . . 135 17.0Asia . . . . . . . . . . . . . . . . . . . . . . . . . . . . . . . . . . . . . . . . 462 58.3Africa . . . . . . . . . . . . . . . . . . . . . . . . . . . . . . . . . . . . . . . 36 4.5Oceania . . . . . . . . . . . . . . . . . . . . . . . . . . . . . . . . . . . . . - -Latin America . . . . . . . . . . . . . . . . . . . . . . . . . . . . . . . . 120 15.1Northern America. . . . . . . . . . . . . . . . . . . . . . . . . . . . . 40 5.0
LANGUAGE SPOKEN AT HOMEPopulation 5 years and over . . . . . . . . . . . . . . 29,373 100.0
English only . . . . . . . . . . . . . . . . . . . . . . . . . . . . . . . . . 28,121 95.7Language other than English . . . . . . . . . . . . . . . . . . 1,252 4.3
Speak English less than ″very well″ . . . . . . . . 408 1.4Spanish . . . . . . . . . . . . . . . . . . . . . . . . . . . . . . . . . . . 616 2.1Speak English less than ″very well″ . . . . . . . . 236 0.8
Other Indo-European languages . . . . . . . . . . . . . 429 1.5Speak English less than ″very well″ . . . . . . . . 114 0.4
Asian and Pacific Island languages . . . . . . . . . . . 207 0.7Speak English less than ″very well″ . . . . . . . . 58 0.2
ANCESTRY (single or multiple)Total population. . . . . . . . . . . . . . . . . . . . . . . . . . 32,080 100.0Total ancestries reported . . . . . . . . . . . . . . . . . . . 30,758 95.9
Arab . . . . . . . . . . . . . . . . . . . . . . . . . . . . . . . . . . . . . . . . 50 0.2Czech1. . . . . . . . . . . . . . . . . . . . . . . . . . . . . . . . . . . . . . 105 0.3Danish . . . . . . . . . . . . . . . . . . . . . . . . . . . . . . . . . . . . . . 73 0.2Dutch . . . . . . . . . . . . . . . . . . . . . . . . . . . . . . . . . . . . . . . 682 2.1English. . . . . . . . . . . . . . . . . . . . . . . . . . . . . . . . . . . . . . 3,363 10.5French (except Basque)1 . . . . . . . . . . . . . . . . . . . . . . 775 2.4French Canadian1 . . . . . . . . . . . . . . . . . . . . . . . . . . . . 47 0.1German . . . . . . . . . . . . . . . . . . . . . . . . . . . . . . . . . . . . . 8,004 25.0Greek . . . . . . . . . . . . . . . . . . . . . . . . . . . . . . . . . . . . . . . 81 0.3Hungarian . . . . . . . . . . . . . . . . . . . . . . . . . . . . . . . . . . . 66 0.2Irish1. . . . . . . . . . . . . . . . . . . . . . . . . . . . . . . . . . . . . . . . 4,174 13.0Italian . . . . . . . . . . . . . . . . . . . . . . . . . . . . . . . . . . . . . . . 1,218 3.8Lithuanian . . . . . . . . . . . . . . . . . . . . . . . . . . . . . . . . . . . 29 0.1Norwegian. . . . . . . . . . . . . . . . . . . . . . . . . . . . . . . . . . . 331 1.0Polish . . . . . . . . . . . . . . . . . . . . . . . . . . . . . . . . . . . . . . . 399 1.2Portuguese . . . . . . . . . . . . . . . . . . . . . . . . . . . . . . . . . . 34 0.1Russian . . . . . . . . . . . . . . . . . . . . . . . . . . . . . . . . . . . . . 13 -Scotch-Irish. . . . . . . . . . . . . . . . . . . . . . . . . . . . . . . . . . 566 1.8Scottish . . . . . . . . . . . . . . . . . . . . . . . . . . . . . . . . . . . . . 772 2.4Slovak . . . . . . . . . . . . . . . . . . . . . . . . . . . . . . . . . . . . . . 46 0.1Subsaharan African. . . . . . . . . . . . . . . . . . . . . . . . . . . 36 0.1Swedish. . . . . . . . . . . . . . . . . . . . . . . . . . . . . . . . . . . . . 308 1.0Swiss . . . . . . . . . . . . . . . . . . . . . . . . . . . . . . . . . . . . . . . 133 0.4Ukrainian . . . . . . . . . . . . . . . . . . . . . . . . . . . . . . . . . . . . 50 0.2United States or American. . . . . . . . . . . . . . . . . . . . . 4,770 14.9Welsh. . . . . . . . . . . . . . . . . . . . . . . . . . . . . . . . . . . . . . . 246 0.8West Indian (excluding Hispanic groups) . . . . . . . . - -Other ancestries . . . . . . . . . . . . . . . . . . . . . . . . . . . . . 4,387 13.7
-Represents zero or rounds to zero. (X) Not applicable.1The data represent a combination of two ancestries shown separately in Summary File 3. Czech includes Czechoslovakian. French includes Alsa-tian. French Canadian includes Acadian/Cajun. Irish includes Celtic.
Source: U.S. Bureau of the Census, Census 2000.
U.S. Census Bureau
2
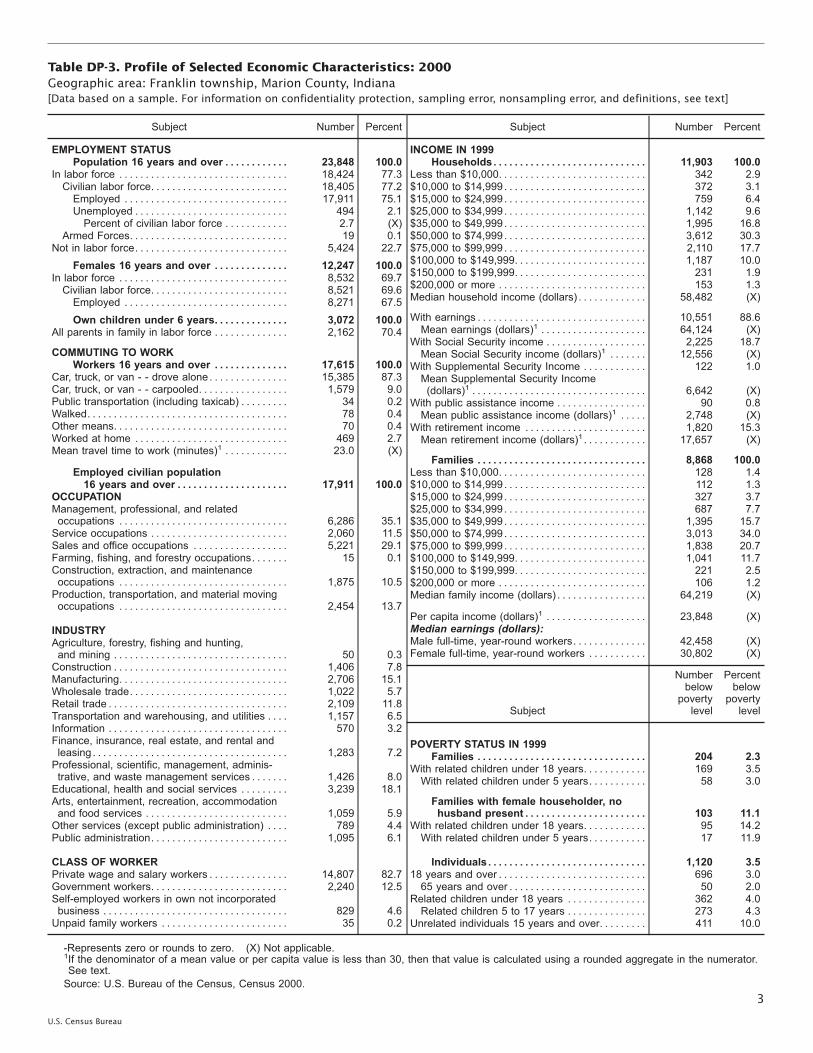
Table DP-3. Profile of Selected Economic Characteristics: 2000Geographic area: Franklin township, Marion County, Indiana[Data based on a sample. For information on confidentiality protection, sampling error, nonsampling error, and definitions, see text]
Subject Number Percent
EMPLOYMENT STATUSPopulation 16 years and over . . . . . . . . . . . . 23,848 100.0
In labor force . . . . . . . . . . . . . . . . . . . . . . . . . . . . . . . . 18,424 77.3Civilian labor force. . . . . . . . . . . . . . . . . . . . . . . . . . 18,405 77.2Employed . . . . . . . . . . . . . . . . . . . . . . . . . . . . . . . 17,911 75.1Unemployed . . . . . . . . . . . . . . . . . . . . . . . . . . . . . 494 2.1Percent of civilian labor force . . . . . . . . . . . . 2.7 (X)
Armed Forces. . . . . . . . . . . . . . . . . . . . . . . . . . . . . . 19 0.1Not in labor force. . . . . . . . . . . . . . . . . . . . . . . . . . . . . 5,424 22.7
Females 16 years and over . . . . . . . . . . . . . . 12,247 100.0In labor force . . . . . . . . . . . . . . . . . . . . . . . . . . . . . . . . 8,532 69.7Civilian labor force. . . . . . . . . . . . . . . . . . . . . . . . . . 8,521 69.6Employed . . . . . . . . . . . . . . . . . . . . . . . . . . . . . . . 8,271 67.5Own children under 6 years. . . . . . . . . . . . . . 3,072 100.0
All parents in family in labor force . . . . . . . . . . . . . . 2,162 70.4
COMMUTING TO WORKWorkers 16 years and over . . . . . . . . . . . . . . 17,615 100.0
Car, truck, or van - - drove alone . . . . . . . . . . . . . . . 15,385 87.3Car, truck, or van - - carpooled. . . . . . . . . . . . . . . . . 1,579 9.0Public transportation (including taxicab) . . . . . . . . . 34 0.2Walked. . . . . . . . . . . . . . . . . . . . . . . . . . . . . . . . . . . . . . 78 0.4Other means. . . . . . . . . . . . . . . . . . . . . . . . . . . . . . . . . 70 0.4Worked at home . . . . . . . . . . . . . . . . . . . . . . . . . . . . . 469 2.7Mean travel time to work (minutes)1 . . . . . . . . . . . . 23.0 (X)
Employed civilian population16 years and over . . . . . . . . . . . . . . . . . . . . . 17,911 100.0
OCCUPATIONManagement, professional, and relatedoccupations . . . . . . . . . . . . . . . . . . . . . . . . . . . . . . . . 6,286 35.1Service occupations . . . . . . . . . . . . . . . . . . . . . . . . . . 2,060 11.5Sales and office occupations . . . . . . . . . . . . . . . . . . 5,221 29.1Farming, fishing, and forestry occupations. . . . . . . 15 0.1Construction, extraction, and maintenanceoccupations . . . . . . . . . . . . . . . . . . . . . . . . . . . . . . . . 1,875 10.5Production, transportation, and material movingoccupations . . . . . . . . . . . . . . . . . . . . . . . . . . . . . . . . 2,454 13.7
INDUSTRYAgriculture, forestry, fishing and hunting,and mining . . . . . . . . . . . . . . . . . . . . . . . . . . . . . . . . . 50 0.3Construction . . . . . . . . . . . . . . . . . . . . . . . . . . . . . . . . . 1,406 7.8Manufacturing. . . . . . . . . . . . . . . . . . . . . . . . . . . . . . . . 2,706 15.1Wholesale trade. . . . . . . . . . . . . . . . . . . . . . . . . . . . . . 1,022 5.7Retail trade . . . . . . . . . . . . . . . . . . . . . . . . . . . . . . . . . . 2,109 11.8Transportation and warehousing, and utilities . . . . 1,157 6.5Information . . . . . . . . . . . . . . . . . . . . . . . . . . . . . . . . . . 570 3.2Finance, insurance, real estate, and rental andleasing . . . . . . . . . . . . . . . . . . . . . . . . . . . . . . . . . . . . . 1,283 7.2Professional, scientific, management, adminis-trative, and waste management services . . . . . . . 1,426 8.0Educational, health and social services . . . . . . . . . 3,239 18.1Arts, entertainment, recreation, accommodationand food services . . . . . . . . . . . . . . . . . . . . . . . . . . . 1,059 5.9Other services (except public administration) . . . . 789 4.4Public administration. . . . . . . . . . . . . . . . . . . . . . . . . . 1,095 6.1
CLASS OF WORKERPrivate wage and salary workers . . . . . . . . . . . . . . . 14,807 82.7Government workers. . . . . . . . . . . . . . . . . . . . . . . . . . 2,240 12.5Self-employed workers in own not incorporatedbusiness . . . . . . . . . . . . . . . . . . . . . . . . . . . . . . . . . . . 829 4.6Unpaid family workers . . . . . . . . . . . . . . . . . . . . . . . . 35 0.2
Subject Number Percent
INCOME IN 1999Households . . . . . . . . . . . . . . . . . . . . . . . . . . . . . 11,903 100.0
Less than $10,000. . . . . . . . . . . . . . . . . . . . . . . . . . . . 342 2.9$10,000 to $14,999 . . . . . . . . . . . . . . . . . . . . . . . . . . . 372 3.1$15,000 to $24,999 . . . . . . . . . . . . . . . . . . . . . . . . . . . 759 6.4$25,000 to $34,999 . . . . . . . . . . . . . . . . . . . . . . . . . . . 1,142 9.6$35,000 to $49,999 . . . . . . . . . . . . . . . . . . . . . . . . . . . 1,995 16.8$50,000 to $74,999 . . . . . . . . . . . . . . . . . . . . . . . . . . . 3,612 30.3$75,000 to $99,999 . . . . . . . . . . . . . . . . . . . . . . . . . . . 2,110 17.7$100,000 to $149,999. . . . . . . . . . . . . . . . . . . . . . . . . 1,187 10.0$150,000 to $199,999. . . . . . . . . . . . . . . . . . . . . . . . . 231 1.9$200,000 or more . . . . . . . . . . . . . . . . . . . . . . . . . . . . 153 1.3Median household income (dollars) . . . . . . . . . . . . . 58,482 (X)
With earnings . . . . . . . . . . . . . . . . . . . . . . . . . . . . . . . . 10,551 88.6Mean earnings (dollars)1 . . . . . . . . . . . . . . . . . . . . 64,124 (X)
With Social Security income . . . . . . . . . . . . . . . . . . . 2,225 18.7Mean Social Security income (dollars)1 . . . . . . . 12,556 (X)
With Supplemental Security Income . . . . . . . . . . . . 122 1.0Mean Supplemental Security Income(dollars)1 . . . . . . . . . . . . . . . . . . . . . . . . . . . . . . . . . 6,642 (X)
With public assistance income . . . . . . . . . . . . . . . . . 90 0.8Mean public assistance income (dollars)1 . . . . . 2,748 (X)
With retirement income . . . . . . . . . . . . . . . . . . . . . . . 1,820 15.3Mean retirement income (dollars)1 . . . . . . . . . . . . 17,657 (X)
Families . . . . . . . . . . . . . . . . . . . . . . . . . . . . . . . . 8,868 100.0Less than $10,000. . . . . . . . . . . . . . . . . . . . . . . . . . . . 128 1.4$10,000 to $14,999 . . . . . . . . . . . . . . . . . . . . . . . . . . . 112 1.3$15,000 to $24,999 . . . . . . . . . . . . . . . . . . . . . . . . . . . 327 3.7$25,000 to $34,999 . . . . . . . . . . . . . . . . . . . . . . . . . . . 687 7.7$35,000 to $49,999 . . . . . . . . . . . . . . . . . . . . . . . . . . . 1,395 15.7$50,000 to $74,999 . . . . . . . . . . . . . . . . . . . . . . . . . . . 3,013 34.0$75,000 to $99,999 . . . . . . . . . . . . . . . . . . . . . . . . . . . 1,838 20.7$100,000 to $149,999. . . . . . . . . . . . . . . . . . . . . . . . . 1,041 11.7$150,000 to $199,999. . . . . . . . . . . . . . . . . . . . . . . . . 221 2.5$200,000 or more . . . . . . . . . . . . . . . . . . . . . . . . . . . . 106 1.2Median family income (dollars) . . . . . . . . . . . . . . . . . 64,219 (X)
Per capita income (dollars)1 . . . . . . . . . . . . . . . . . . . 23,848 (X)Median earnings (dollars):Male full-time, year-round workers. . . . . . . . . . . . . . 42,458 (X)Female full-time, year-round workers . . . . . . . . . . . 30,802 (X)
Subject
Numberbelowpovertylevel
Percentbelowpovertylevel
POVERTY STATUS IN 1999Families . . . . . . . . . . . . . . . . . . . . . . . . . . . . . . . . 204 2.3
With related children under 18 years. . . . . . . . . . . . 169 3.5With related children under 5 years. . . . . . . . . . . 58 3.0
Families with female householder, nohusband present . . . . . . . . . . . . . . . . . . . . . . . 103 11.1
With related children under 18 years. . . . . . . . . . . . 95 14.2With related children under 5 years. . . . . . . . . . . 17 11.9
Individuals . . . . . . . . . . . . . . . . . . . . . . . . . . . . . . 1,120 3.518 years and over . . . . . . . . . . . . . . . . . . . . . . . . . . . . 696 3.065 years and over . . . . . . . . . . . . . . . . . . . . . . . . . . 50 2.0
Related children under 18 years . . . . . . . . . . . . . . . 362 4.0Related children 5 to 17 years . . . . . . . . . . . . . . . 273 4.3
Unrelated individuals 15 years and over. . . . . . . . . 411 10.0
-Represents zero or rounds to zero. (X) Not applicable.1If the denominator of a mean value or per capita value is less than 30, then that value is calculated using a rounded aggregate in the numerator.See text.Source: U.S. Bureau of the Census, Census 2000.
U.S. Census Bureau
3
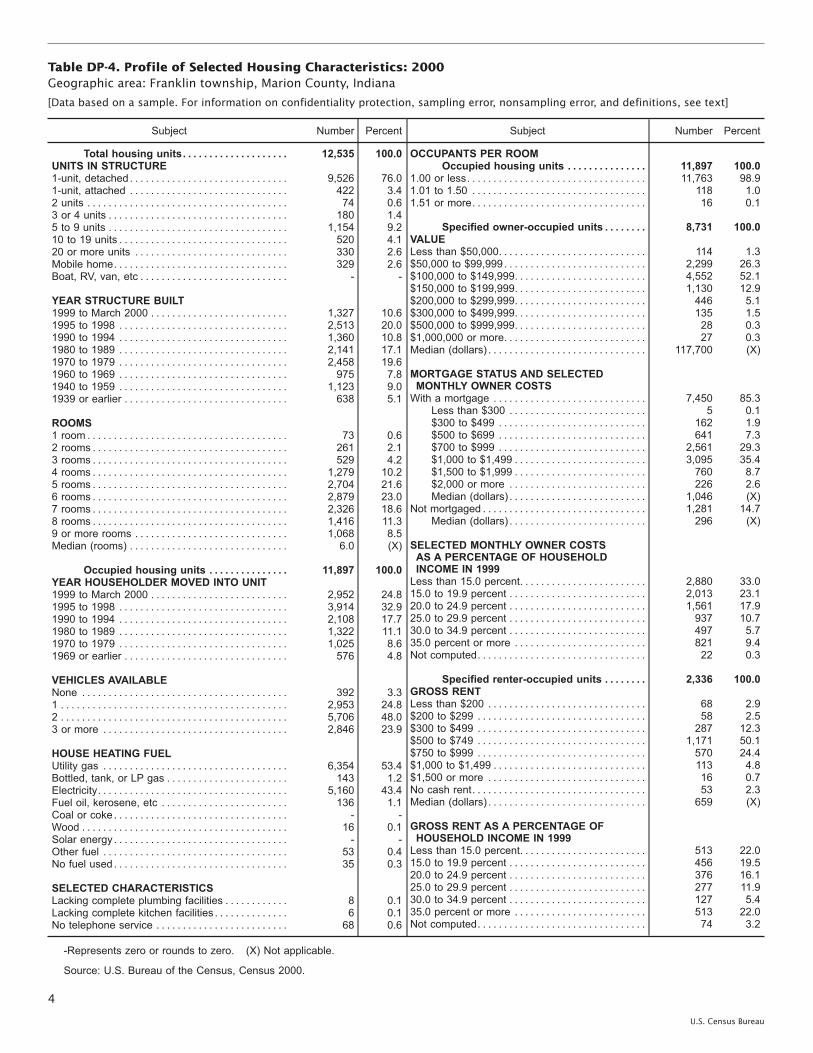
Table DP-4. Profile of Selected Housing Characteristics: 2000Geographic area: Franklin township, Marion County, Indiana
[Data based on a sample. For information on confidentiality protection, sampling error, nonsampling error, and definitions, see text]
Subject Number Percent
Total housing units. . . . . . . . . . . . . . . . . . . . 12,535 100.0UNITS IN STRUCTURE1-unit, detached . . . . . . . . . . . . . . . . . . . . . . . . . . . . . . 9,526 76.01-unit, attached . . . . . . . . . . . . . . . . . . . . . . . . . . . . . . 422 3.42 units . . . . . . . . . . . . . . . . . . . . . . . . . . . . . . . . . . . . . . 74 0.63 or 4 units . . . . . . . . . . . . . . . . . . . . . . . . . . . . . . . . . . 180 1.45 to 9 units . . . . . . . . . . . . . . . . . . . . . . . . . . . . . . . . . . 1,154 9.210 to 19 units . . . . . . . . . . . . . . . . . . . . . . . . . . . . . . . . 520 4.120 or more units . . . . . . . . . . . . . . . . . . . . . . . . . . . . . 330 2.6Mobile home. . . . . . . . . . . . . . . . . . . . . . . . . . . . . . . . . 329 2.6Boat, RV, van, etc . . . . . . . . . . . . . . . . . . . . . . . . . . . . - -
YEAR STRUCTURE BUILT1999 to March 2000 . . . . . . . . . . . . . . . . . . . . . . . . . . 1,327 10.61995 to 1998 . . . . . . . . . . . . . . . . . . . . . . . . . . . . . . . . 2,513 20.01990 to 1994 . . . . . . . . . . . . . . . . . . . . . . . . . . . . . . . . 1,360 10.81980 to 1989 . . . . . . . . . . . . . . . . . . . . . . . . . . . . . . . . 2,141 17.11970 to 1979 . . . . . . . . . . . . . . . . . . . . . . . . . . . . . . . . 2,458 19.61960 to 1969 . . . . . . . . . . . . . . . . . . . . . . . . . . . . . . . . 975 7.81940 to 1959 . . . . . . . . . . . . . . . . . . . . . . . . . . . . . . . . 1,123 9.01939 or earlier . . . . . . . . . . . . . . . . . . . . . . . . . . . . . . . 638 5.1
ROOMS1 room . . . . . . . . . . . . . . . . . . . . . . . . . . . . . . . . . . . . . . 73 0.62 rooms . . . . . . . . . . . . . . . . . . . . . . . . . . . . . . . . . . . . . 261 2.13 rooms . . . . . . . . . . . . . . . . . . . . . . . . . . . . . . . . . . . . . 529 4.24 rooms . . . . . . . . . . . . . . . . . . . . . . . . . . . . . . . . . . . . . 1,279 10.25 rooms . . . . . . . . . . . . . . . . . . . . . . . . . . . . . . . . . . . . . 2,704 21.66 rooms . . . . . . . . . . . . . . . . . . . . . . . . . . . . . . . . . . . . . 2,879 23.07 rooms . . . . . . . . . . . . . . . . . . . . . . . . . . . . . . . . . . . . . 2,326 18.68 rooms . . . . . . . . . . . . . . . . . . . . . . . . . . . . . . . . . . . . . 1,416 11.39 or more rooms . . . . . . . . . . . . . . . . . . . . . . . . . . . . . 1,068 8.5Median (rooms) . . . . . . . . . . . . . . . . . . . . . . . . . . . . . . 6.0 (X)
Occupied housing units . . . . . . . . . . . . . . . 11,897 100.0YEAR HOUSEHOLDER MOVED INTO UNIT1999 to March 2000 . . . . . . . . . . . . . . . . . . . . . . . . . . 2,952 24.81995 to 1998 . . . . . . . . . . . . . . . . . . . . . . . . . . . . . . . . 3,914 32.91990 to 1994 . . . . . . . . . . . . . . . . . . . . . . . . . . . . . . . . 2,108 17.71980 to 1989 . . . . . . . . . . . . . . . . . . . . . . . . . . . . . . . . 1,322 11.11970 to 1979 . . . . . . . . . . . . . . . . . . . . . . . . . . . . . . . . 1,025 8.61969 or earlier . . . . . . . . . . . . . . . . . . . . . . . . . . . . . . . 576 4.8
VEHICLES AVAILABLENone . . . . . . . . . . . . . . . . . . . . . . . . . . . . . . . . . . . . . . . 392 3.31 . . . . . . . . . . . . . . . . . . . . . . . . . . . . . . . . . . . . . . . . . . . 2,953 24.82 . . . . . . . . . . . . . . . . . . . . . . . . . . . . . . . . . . . . . . . . . . . 5,706 48.03 or more . . . . . . . . . . . . . . . . . . . . . . . . . . . . . . . . . . . 2,846 23.9
HOUSE HEATING FUELUtility gas . . . . . . . . . . . . . . . . . . . . . . . . . . . . . . . . . . . 6,354 53.4Bottled, tank, or LP gas . . . . . . . . . . . . . . . . . . . . . . . 143 1.2Electricity. . . . . . . . . . . . . . . . . . . . . . . . . . . . . . . . . . . . 5,160 43.4Fuel oil, kerosene, etc . . . . . . . . . . . . . . . . . . . . . . . . 136 1.1Coal or coke . . . . . . . . . . . . . . . . . . . . . . . . . . . . . . . . . - -Wood . . . . . . . . . . . . . . . . . . . . . . . . . . . . . . . . . . . . . . . 16 0.1Solar energy . . . . . . . . . . . . . . . . . . . . . . . . . . . . . . . . . - -Other fuel . . . . . . . . . . . . . . . . . . . . . . . . . . . . . . . . . . . 53 0.4No fuel used . . . . . . . . . . . . . . . . . . . . . . . . . . . . . . . . . 35 0.3
SELECTED CHARACTERISTICSLacking complete plumbing facilities . . . . . . . . . . . . 8 0.1Lacking complete kitchen facilities . . . . . . . . . . . . . . 6 0.1No telephone service . . . . . . . . . . . . . . . . . . . . . . . . . 68 0.6
Subject Number Percent
OCCUPANTS PER ROOMOccupied housing units . . . . . . . . . . . . . . . 11,897 100.0
1.00 or less. . . . . . . . . . . . . . . . . . . . . . . . . . . . . . . . . . 11,763 98.91.01 to 1.50 . . . . . . . . . . . . . . . . . . . . . . . . . . . . . . . . . 118 1.01.51 or more. . . . . . . . . . . . . . . . . . . . . . . . . . . . . . . . . 16 0.1
Specified owner-occupied units . . . . . . . . 8,731 100.0VALUELess than $50,000. . . . . . . . . . . . . . . . . . . . . . . . . . . . 114 1.3$50,000 to $99,999 . . . . . . . . . . . . . . . . . . . . . . . . . . . 2,299 26.3$100,000 to $149,999. . . . . . . . . . . . . . . . . . . . . . . . . 4,552 52.1$150,000 to $199,999. . . . . . . . . . . . . . . . . . . . . . . . . 1,130 12.9$200,000 to $299,999. . . . . . . . . . . . . . . . . . . . . . . . . 446 5.1$300,000 to $499,999. . . . . . . . . . . . . . . . . . . . . . . . . 135 1.5$500,000 to $999,999. . . . . . . . . . . . . . . . . . . . . . . . . 28 0.3$1,000,000 or more. . . . . . . . . . . . . . . . . . . . . . . . . . . 27 0.3Median (dollars) . . . . . . . . . . . . . . . . . . . . . . . . . . . . . . 117,700 (X)
MORTGAGE STATUS AND SELECTEDMONTHLY OWNER COSTSWith a mortgage . . . . . . . . . . . . . . . . . . . . . . . . . . . . . 7,450 85.3
Less than $300 . . . . . . . . . . . . . . . . . . . . . . . . . . 5 0.1$300 to $499 . . . . . . . . . . . . . . . . . . . . . . . . . . . . 162 1.9$500 to $699 . . . . . . . . . . . . . . . . . . . . . . . . . . . . 641 7.3$700 to $999 . . . . . . . . . . . . . . . . . . . . . . . . . . . . 2,561 29.3$1,000 to $1,499 . . . . . . . . . . . . . . . . . . . . . . . . . 3,095 35.4$1,500 to $1,999 . . . . . . . . . . . . . . . . . . . . . . . . . 760 8.7$2,000 or more . . . . . . . . . . . . . . . . . . . . . . . . . . 226 2.6Median (dollars) . . . . . . . . . . . . . . . . . . . . . . . . . . 1,046 (X)
Not mortgaged . . . . . . . . . . . . . . . . . . . . . . . . . . . . . . . 1,281 14.7Median (dollars) . . . . . . . . . . . . . . . . . . . . . . . . . . 296 (X)
SELECTED MONTHLY OWNER COSTSAS A PERCENTAGE OF HOUSEHOLDINCOME IN 1999Less than 15.0 percent. . . . . . . . . . . . . . . . . . . . . . . . 2,880 33.015.0 to 19.9 percent . . . . . . . . . . . . . . . . . . . . . . . . . . 2,013 23.120.0 to 24.9 percent . . . . . . . . . . . . . . . . . . . . . . . . . . 1,561 17.925.0 to 29.9 percent . . . . . . . . . . . . . . . . . . . . . . . . . . 937 10.730.0 to 34.9 percent . . . . . . . . . . . . . . . . . . . . . . . . . . 497 5.735.0 percent or more . . . . . . . . . . . . . . . . . . . . . . . . . 821 9.4Not computed. . . . . . . . . . . . . . . . . . . . . . . . . . . . . . . . 22 0.3
Specified renter-occupied units . . . . . . . . 2,336 100.0GROSS RENTLess than $200 . . . . . . . . . . . . . . . . . . . . . . . . . . . . . . 68 2.9$200 to $299 . . . . . . . . . . . . . . . . . . . . . . . . . . . . . . . . 58 2.5$300 to $499 . . . . . . . . . . . . . . . . . . . . . . . . . . . . . . . . 287 12.3$500 to $749 . . . . . . . . . . . . . . . . . . . . . . . . . . . . . . . . 1,171 50.1$750 to $999 . . . . . . . . . . . . . . . . . . . . . . . . . . . . . . . . 570 24.4$1,000 to $1,499 . . . . . . . . . . . . . . . . . . . . . . . . . . . . . 113 4.8$1,500 or more . . . . . . . . . . . . . . . . . . . . . . . . . . . . . . 16 0.7No cash rent. . . . . . . . . . . . . . . . . . . . . . . . . . . . . . . . . 53 2.3Median (dollars) . . . . . . . . . . . . . . . . . . . . . . . . . . . . . . 659 (X)
GROSS RENT AS A PERCENTAGE OFHOUSEHOLD INCOME IN 1999Less than 15.0 percent. . . . . . . . . . . . . . . . . . . . . . . . 513 22.015.0 to 19.9 percent . . . . . . . . . . . . . . . . . . . . . . . . . . 456 19.520.0 to 24.9 percent . . . . . . . . . . . . . . . . . . . . . . . . . . 376 16.125.0 to 29.9 percent . . . . . . . . . . . . . . . . . . . . . . . . . . 277 11.930.0 to 34.9 percent . . . . . . . . . . . . . . . . . . . . . . . . . . 127 5.435.0 percent or more . . . . . . . . . . . . . . . . . . . . . . . . . 513 22.0Not computed. . . . . . . . . . . . . . . . . . . . . . . . . . . . . . . . 74 3.2
-Represents zero or rounds to zero. (X) Not applicable.
Source: U.S. Bureau of the Census, Census 2000.
U.S. Census Bureau
4