Embed Size (px)
DESCRIPTION
a research report on beltek canadian water ltd
Citation preview
1. COMPANY PROFILE
1.1 Profile of the company
Beltek (India) Limited was a household name in north India in 1970s when television had just
come into the market in India. Throughout the 1980s, it introduced a number of models with
varying features when color televisions made their presence In 1995 Beltek Canadian Water
Limited (JV with Prime Water Canada) came into the beverages business and became one of the
first movers in the Bulk Water business with its brand “Prime”.
In the year 2003 BCWL was appointed as Franchisee for Aquafina (20Ltr) and is today the
market leader in Bulk Water business in Delhi/NCR
In 2007, Rohit verma became aware of products called "tonic drinks", which enjoyed widespread
popularity throughout Far East. His idea to market these functional drinks outside Asia evolved
whilst he sat at a bar at the Mandarin Hotel in Hong Kong. In 2005, Rohit verma founded wild
water. He fine-tuned the product, developed a unique marketing concept and started selling wild
water vitamin Drink on the Indian market in 2012. This was not only the launch of a completely
new product, in fact it was the birth of a totally new product category.
1

In 2013, Wild water launched its own flavor: strawberry kiwi– Strong & Natural. Very much in
line with the needs of today's consumers, Wild water – strawberry kiwi unlike traditional
vitamins drink - only contains ingredients of 100% natural sources.
Wild water extended its product portfolio with wild water Energy Shots: Starting in the USA,
now gradually rolling out globally.
The responsibility for the success of the world's fastest growing vitamin drink is shared by the
company's 9000 employees around the world. Today Wild water has annual sales of approx. 2
lakhs bottles in Delhi NCR.
Despite the ongoing difficulties presented by the global economic downturn, plans for growth
and investment in the business year 2014 remain - typically for wild water - very ambitious, but
continue to rest on a solid and conservative financial footing.
Wild water is a brand of vitamin bottled water products produced by PepsiCo, Inc., consisting of
flavored water. It was first distributed in Wichita, Kansas in 2008, before becoming more widely
sold across the United States, Spain, Canada, Lebanon, Turkey, the GCC countries, Iran, Egypt,
Vietnam, Pakistan and India. As of 2009, wild water represented 13.4 percent of domestic
bottled water sales in the United States, making it the number 1 vitamin bottled water brand as
measured by retail sales. Its primary competition includes
Wild-Water is actually your plain water but with natural ingredients like flavors and colors
with added Vitamins. It is a Smart Hydration option that has low sugar content and can be
substituted as your favorite drink replacing sugary colas and juices. Wild Water is the first of
its kind in India
2

Vitamin Water is another way of saying that this water contains Vitamins. It is a tasty way of
having your daily vitamins on the go. Wild-Water has Vitamins such as Vitamin A, C, E, B3,
B5, B6, B9, B12 & Zinc and it is good for your health Wild water is available in 3 different
flavors.
While, Tropical Citrus flavor is for energizing having natural caffeine and Guarani extracts
besides vitamins, the Lemonade flavor is for reload having electrolytes besides vitamins. The
Dragon fruit flavor is for immunity as it has higher quantity of vitamin C besides zinc and
terrine.
Children and elderly can consume Wild-Water safely as it is a near water drink with a safe
limit of vitamins. It contains no carbonation and low sugar content as compared to carbonated
drinks and juices. Please read the ingredients on each bottle for further details. For any concern
you may have regarding the ingredients please contact and consult your physician.
Although Wild-Water has much lower sugar content than in carbonated sugared beverages,
it is important to check with your physician regarding the consumption of Wild-Water if you are
diabetic.
Only one of the Wild-Water variants - Tropical Citrus has caffeine. Dragon Fruit and
Lemonade do not have caffeine. A bottle (400 ml) of tropical citrus flavoured Wild-Water has
36 grams of natural caffeine and 20 grams of guarana seed extracts which also gives caffeine.
Wild-Water has pure cane sugar and has been formulated with minimum amount of pure cane
sugar so that the beverage is not very sweet to drink. Please check the nutrition facts on label for
the amount of sugar
3

1.11 Registered Office Address
A-37 Mayapuri, Phase 2,
New Delhi- 110064. INDIA.
1.12 Contact: 011-41848484
1.13 [email protected]
1.14 WEBSITE=http://www.drinkwildwater.com
1.15 Geographical Areas of Operation
Wild-Water is available in 200+ high-end stores in Delhi and Gurgaon. The product is placed
in Modern Bazaar, Le Marche, Morning Store, all 24/7 outlets, popular convenes at petrol pumps
and other A class outlets in Delhi and Gurgaon. In case you cannot find Wild-Water
Beltek Canadian Water Ltd
A 16, Phase 2, Hosiery Complex, Noida, New Okhla Industrial Development Area, Uttar
Pradesh 201301 0120 256 7371
Beltek Canadian Water Limited
A-37, Mayapuri Industrial Area, Phase2, Mayapuri Industrial Area, New Delhi, DL 110064
011-4184 8484
4
Beltek India Ltd
B-89, Noida, Sector 5, New Okhla Industrial Development Area, Uttar Pradesh 201301
0120-242 1676
"Beltek Canadian Water Ltd. Mineral Water Head Office Mr. Rohit Verma A-37, Phase-Ii,
Mayapuri Industrial Area, Delhi, Delhi - 110064."
1.2 Nature of the organization
1.21 Packaging
Wild water is distributed in 4 US fluid ounces, 400 milliliters (17 US fl oz), 3 US fluid ounces , 5
US fluid ounces , 1 liter 1.5 liters bottles. The bottled vitamin water industry has drawn criticism
for the production and distribution of plastic product packaging, which consumes additional
petrochemicals.
The packaging has evolved from its original iteration for the purpose of partially offsetting
environmental impacts of production and shipment. This has primarily involved packaging
weight reduction. The weight of wild water bottles was reduced by approximately 50%, to 10.9
grams (0.38 oz), with a packaging redesign in 2009 which, according to the company, resulted in
the use of 75 million fewer pounds of plastic during the production process.
1.22 Sponsorship
Since shortly after its inception, the promotion of wild water has involved sports sponsorships.
As of 2011, it is listed as being an official sponsor of few League Soccer, the Professional Golf
Association, the Arizona Diamondbacks and the Carolina Panthers.
5

Beverage
Non-Alcoholic Beverages Alcoholic Beverages
Non-carbonated Carbonated Fruit Based Grain
Fruit Juices,Coffee,Tea,Packaged Water
Colas,Soda,Tonic Water
Wine,Brandy
Beer,Whisky
1.23 INDUSTRY PROFILE
BEVERAGE INDUSTRY
A beverage is a drink specifically prepared for human consumption. Beverages almost always
largely consist of water. Drinks often consumed include: Water (both flat or carbonated),Juice
based drinks, Soft drinks, Sports and Energy drinks, Alcoholic beverages like beer or spirits
,Coffee, tea ,Dairy products like milk. Commonly, drinks are filled into containers, like glass or
plastic bottles, steel or aluminum cans as well as cardboard supported packages, like the "Tetra
Pak" or others. Filling of beverages can be done cold, hot, ambient and cold-aseptic filling to
mention the latest trend of beverage marketing and technology.
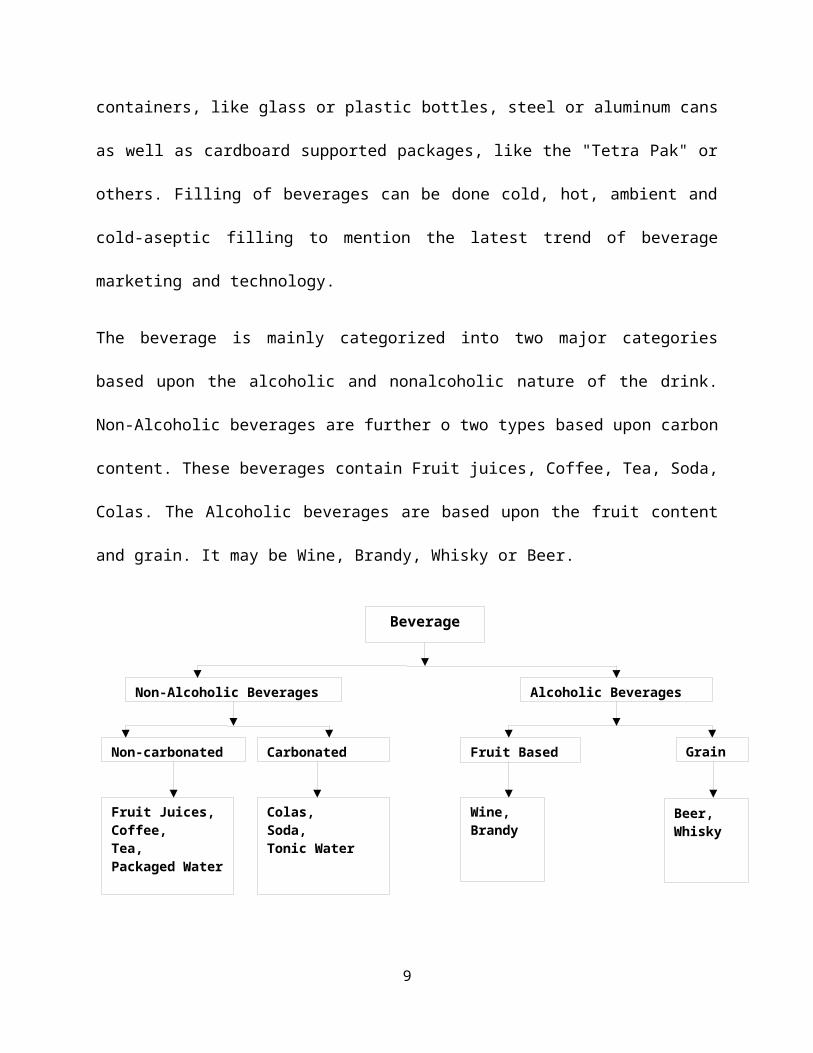
The beverage is mainly categorized into two major categories based upon the alcoholic and
nonalcoholic nature of the drink. Non-Alcoholic beverages are further o two types based upon
carbon content. These beverages contain Fruit juices, Coffee, Tea, Soda, Colas. The Alcoholic
beverages are based upon the fruit content and grain. It may be Wine, Brandy, Whisky or Beer.
6

FUTURE PROJECTIONS OF INDIAN BEVERAGE INDUSTRY
A) Beverage Industry is projected to have overall growth between 8% -8.5 %
B) Indian non-alcoholic drinks market is expected to at a CAGR of around 20% during 2011-
2015.
C) India Alcoholic Drinks Market to Grow Over 14% CAGR during 2011-2015.
D) The India Alcoholic Drinks Market Is Expected To Reach The 3 Billion Liter Mark By 2015.
E) The sectors which are projected to achieve excellent growth of 20% from wine.
F) Fruit/vegetable juice market will grow at a CAGR of around 30 per cent in value terms during
2011-2015.
G) The energy drinks segment which will grow at a CAGR of around 29 per cent during the
same period.
H) All in all, annual per capita consumption of packaged beverages is supposed to triple from 2.6
liters in 2000 to 8.7 liters in 2015. Demand for milk and milk-based beverages are also rising.
I) The estimated INR 340 bn Indian liquor industry is expected to maintain its CAGR of 15%
1.24 ABOUT THE TOPIC
A) CUSTOMER SATISFACTION
Customer satisfaction, a business term, is a measure of how products and services supplied by a
company meet or surpass customer expectation. Customer satisfaction is defined as "the number
of customers, or percentage of total customers, whose reported experience with a firm, its
products, or its services (ratings) exceeds specified satisfaction goals."
It is seen as a key performance indicator within business and is part of the four of a Balanced
Scorecard. In a competitive marketplace where businesses compete for customers, customer
7

satisfaction is seen as a key differentiator and increasingly has become a key element of business
strategy. Within organizations, customer satisfaction ratings can have powerful effects. They
focus employees on the importance of fulfilling customers’ expectations. Furthermore, when
these ratings dip, they warn of problems that can affect sales and profitability. These metrics
quantify an important dynamic. When a brand has loyal customers, it gains positive word-of-
mouth marketing, which is both free and highly effective. In researching satisfaction, firms
generally ask customers whether their product or service has met or exceeded expectations.
Thus, expectations are a key factor behind satisfaction. When customers have high expectations
and the reality falls short, they will be disappointed and will likely rate their experience as less
than satisfying. For this reason, a luxury resort, for example, might receive a lower satisfaction
rating than a budget motel—even though its facilities and service would be deemed superior in
“absolute” terms.
B) MARKETING EFFECTIVENESS
Marketing effectiveness is the quality of how marketers go to market with the goal of
optimizing their spending to achieve good results for both the short-term and long-term.
Marketing effectiveness has four dimensions:
I Corporate – Each company operates within different bounds. These are determined by their
size, their budget and their ability to make organizational change. Within these bounds marketers
operate along the five factors described below.
II Competitive – Each company in a category operates within a similar framework as described
below. In an ideal world, marketers would have perfect information on how they act as well as
8
how their competitors act. In reality, in many categories have reasonably good information
through sources, such as, IRI or Nielsen. In many industries, competitive marketing information
is hard to come by.
III Customers/Consumers – Understanding and taking advantage of how customers make
purchasing decisions can help marketers improve their marketing effectiveness. Groups of
consumers act in similar ways leading to the need to segment them. Based on these segments,
they make choices based on how they value the attributes of a product and the brand, in return
for price paid for the product. Consumers build brand value through information. Information is
received through many sources, such as, advertising, word-of-mouth and in the (distribution)
channel often characterized with the purchase funnel, a McKinsey & Company concept. Lastly,
consumers consume and make purchase decisions in certain ways.
IV Exogenous Factors – There are many factors outside of our immediate control that can
impact the effectiveness of our marketing activities. These can include the weather, interest rates,
government regulations and many others. Understanding the impact these factors can have on
our consumers can help us to design programs that can take advantage of these factors or
mitigate the risk of these factors if they take place in the middle of our marketing campaigns.
9

1.3Company’s Vision & Mission.
1.31 Vision
A) Our commitment is to be a manufacturer, importer and distributor of suspension parts and
agricultural machine in accordance with annual sales of 1,000 million baht within 2013 under
Wild water and all SMA brands.
1.32 Mission
A) Emphasize on the production and import products which are appropriate cost, good quality
and worthwhile usage with customer requirement.
B) Develop R&D to be contemporary and be able to meet the customer requirement.
C) Increase the number of domestic and overseas distributors.
10

1.4 PRODUCT RANGE
1.41 DRAGON FRUIT
Dragon Fruit Flavor – Vitamin B,C and Zinc along with its Touraine content helps you to extend
the day.
11

1.42 LEMONADE
Lemonade Flavor – Multiple benefits of Vitamin A, C and B along with electrolytes. Works as a
perfect Hydrator.
12

1.43 TROPICAL CITTIC
Tropical Citrus Flavor – Tasty hydration with added benefits of Vitamin C and B along with
Guarana extracts and Caffeine to keep you alert.
13

1.5 SIZE OF ORGANISATION
The company has achieved highest ever total income of Rs 6 crores for the year 2011-2012 as
compared to previous year income of Rs 5crores, higher by 10%. The operating turnover is also
ever highest of Rs 3.65 crores as compared to rs 2.98 crores of the previous years, The profit
before tax is of Rs 2.5 crores for the year 2011-2012 as against Rs 2.3 crores in the previous
year. PBT for 2011-2012 is lower compared with 2010-11 mainly due to non –recurring income
of Rs 1.3 crores on settlement in a foreign project included in 2010-11 accounts.
The responsibility for the success of the world's fastest growing vitamin drink is shared by the
company's 9000 employees around the world. Today Wild water has annual sales of approx. 2
lakhs bottles in Delhi NCR.
14

1.6 ORGANISATIONAL STRUCTURE
GRAPH No.1.1
15
BOARD OF DIRECTORS
BUSINESS HEAD
MARKETING
SALES
ACCOUNTS
HUMAN RESOURCE
MEDIA
PUBLIC RELATION

1.7 Market Share & Position of the Company in the Industry.
Graph showing Energy Drink Market share
GRAPH-1.2
16
Red Bull76%
Cloud 96%
wild water3%
Power Horse8%
Rock Star4%
Burn1.4%
SoBe0.7% Amway
0.9%
Energy Drink Market Share(INDIA)

1.8 PRESENT LEADERSHIP
1.81 BOARD OF DIRECTORS
A) MR. ROHIT VERMA (DIRECTOR)
B) MR.STEVE VERMA (DIRECTOR)
C) MR.MOHIT VERMA (DIRECTOR)
1.82 BUSINESS HEAD
A) MR. SAJI K JOHN
1.83 MARKETING TEAM
A) MS. NEHA MARWAHA (BUSINESS DEVELOPMENT MANAGER)
B) MS. PAVNEET KAUR (BUSINESS DEVELOPMENT EXECUTIVE)
1.84 SALES TEAM
A) MR.SAURABH SHARMA (SALES MANAGER)
1.85 ACCOUNTS TEAM
A) MR. PIYUSH
B) MR.JITENDER
C) MR NEERAJ
1.86 HUMAN RESOURCE
A) MR. RAKESH (HUMAN RESOURCE MANAGER)
17

1.9 Sources of Data Collection
The information relevant for study was drawn from Primary data collected through survey
method, which alone was not sufficient. Hence Secondary data was collected to study
successfully.
1.91 Primary data-
It will be collected using a questionnaire. A well laid out questionnaire will be designed for this
purpose. Also personal interviews will be conducted with people in organization as well as
consumers and prospective buyers.
1.92 Secondary data-
This information will be obtained from secondary sources which include newspapers, magazines,
reliable websites, internal reports and other published sources
1.93 SAMPLE DESIGN
The research was carried out in various phases that constituted an approach of working from
whole to part. It included subsequent phases trying to go deeper into the user’s psyche and
develop a thorough understanding of what the user looks for while buying an energy drink. For
the customer satisfaction study a sample of 75 persons was chosen from the in Delhi city. The
sample was judgmental and methodology was convenient random sampling.
Size of Sample 75
Sampling technique Convenient Random Sampling method
Location from which samples were taken Delhi city
18
1.94 PLAN OF ANALYSIS
A) Raw Primary data has been collected with help of questionnaire. The raw data has been
tabulated with the help of table. From the tables, concept, analysis and inferences are drawn
which in turn was used for interpretation. Based on, these charts were prepared to better pictorial
understanding of the study.
B) From the set of inferences and interpretation, conclusion have been drawn which is followed
by suggestions, keeping the objectives in mind throughout the study.
19

2. SWOT Analysis
SWOT Analysis is a tool that identifies the strengths, weaknesses, opportunities and threats of an
organization. Specifically, SWOT is a basic, straightforward model that assesses what an
organization can and cannot do as well as its potential opportunities and threats. The method of
SWOT analysis is to take the information from an environmental analysis and separate it into
internal (strengths and weaknesses) and external issues (opportunities and threats). Once this is
completed, SWOT analysis determines what may assist the firm in accomplishing its
objectives, and what obstacles must be overcome or minimized to achieve desired results. The
SWOT analysis of the company is as follows:
2.1 Strengths & Weaknesses
2.11 Strengths
A Most popular energy drinks in the world in it’s category.
B Wild water represents a specific, edgy subculture, while still being consumed by a variety of
demographics.
C Three different versions (tropical citric, lemonade and dragon fruit) allow for variety without
spreading the brand too thin.
2.12 Weaknesses
A Not a patented drink product
20

2.2. Opportunities & Threats
2.21 Opportunities
A) Increase awareness of Wild water’s dominance in the vitamin drink market
B) Strengthen the relationship between Wild water’s target audiences.
C) Increase Wild water’s sales in specific markets such as the Dakotas, Tennessee & Ohio.
2.22 Threats
A Health risks associated with over consumption of tropical citric as contains a fixed percentage
of caffeine.
B Competition is increasing.
2.3. Some Best Practices followed by BELTEK CANADIAN WATER LIMITED in
different functional areas
2.31 Finance
A) BELTEK CANADIAN WATER LIMITED have recently introduced RTGS/NEFT facility
for making E-payments in secure way, through HDFC bank, to vendors having bank account
with any bank under which all payments are made only through electronic transfers by mapping
all vendor bank accounts to their vendor management systems.
B) Balance sheets prepared by the company are in accordance of Companies Act, 1956 as well as
Accounting standards issued by the institute of Chartered Accountants of India.
21

C) It monitors the preparation of cost records in accordance the cost Accounting Standards
issued by ICWAI.
2.32 Human Resource (HR)
A) The safety and health of employees and external stakeholders are embedded in the core
organizational values of the company.
B) It has endeavored to keep its employees fully aware of the HSE aspects and to meet this
objective; it provides regular training to employees, contract worker through internal as well as
external resources.
C) It ensures the implementation of safe work practices, and continual improvement in Safety
Management System in compliance with statutory rules and regulations.
D) Senior Management Development Centre (SMDC) exercise has been undertaken with an
objective of development of its senior level executives and preparing them for future leadership
positions.
2.33 Marketing
A) Free sampling and glass sampling are being conducted for promotion.
2.34 Information Technology (IT)
A) BELTEK CANADIAN WATER LTD has taken new IT initiatives to enhance productivity-
SAP based Ingredient Management System (IMS),Governance, Risk & Compliance (GRC) and
Reverse Auction modules have been implemented to enhance transparency, efficiency and
customer satisfaction.
22

B) It has implemented Electronic Document Management System for maintaining all the
important information and records of the company in digitized form.
C) Many initiatives such as Tender Monitoring System, e-QRP system, online written
examination in e-recruitment module, etc have been undertaken to ensure transparency in
systems & procedures.
D) The Business Information Systems department of this Company is certified with ISO
9001:2008 standard.
2.35 Production
A) BELTEK CANADIAN WATER LTD follows Total Quality Management in all the
processes, systems and functional areas.
B) It has implemented Tender Monitoring System to enhance & bring better transparency in the
procurement process.
2.36 Operations
A) With increase in demand, BELTEK CANADIAN WATER LTD is increasing its production
capacity.
2.37 Customer Relationship Management (CRM)
A) The company is committed to promote globally comparable levels of health, safety,
Environment Management System in the areas of its business operations with a focus on
improving harmony with environment through Sustainable Development.
23
2.38 Corporate Social Responsibility (CSR)
A) BELTEK CANADIAN WATER LTD contributes 0.5% of its company’s performance after
tax to CSR activities.
2.4. Variations/Deviations in practices followed by BELTEK CANADIAN
WATER LTD
2.41 As F.W.Taylor suggest that training should be given to employees from the very beginning
so they may achieve competence as early as possible, BELTEK CANADIAN WATER LTD also
emphasized on providing training at the very beginning
2.42 The company follows scientific training and development of workers so as to achieve
highest level of efficiency.
2.43 It has maintained close cooperation between management and labour to ensure that the
work is carried out in accordance with the principles which are developed.
2.44 BELTEK CANADIAN WATER LTD follows the principle of “Division of Work “which
states that a worker or group of workers is assigned a specialized task in order to increase
efficiency.
24

A. DATA COLLECTION
3.1. Marketing
3.11 Product Planning Process
A) Generate ideas= ideas come from competitors, current customers, and anyone who works
with you.
B) Screen ideas= ideas evolve at focus groups and brainstorming sessions
C) Develop a business plan/proposal= product is evaluated and proposal is written
D) Develop the product= new product idea begins to take physical shape and a prototype is
made.
E) Test the product= takes place after lab testing. test consumer response to the product through
focus groups, taste tests, etc.
F) Introduce the product= introduced to the consumers through advertising, live
demonstrations, coupons, give-away and other incentives
G) Evaluate acceptance= evaluate customer response after the product has been introduced and
on the market.
25

3.12 Pricing Policies/Strategies
WILD WATER pricing strategy is based on consumer’s perception of value. Vitamin water
prices are market determined. But WILD WATER never got involved in a price war with
Gatorade as it would have eaten the brand equity of WILD WATER as consumer perceive that
the basic price they pay for the brand like wild water is justified as it is more about the refreshing
experience rather than just a thirst quencher.
Wild water is thus competitively priced to its major competitors offering a better tasting product
than other brands at a competitive price. But this is due first to the pressure in the beverage
industry regarding pricing due to constant rise in the cost of transportation, ingredients and work
force. Moreover the partnership with aquafina impacts on its pricing strategy because of aquafina
urge to maintain low prices. So the company works hard to maintaining current prices by
reducing their operating costs and adapting its processes.
3.13 Channel Planning &Management
Channel planning is required to maximize the returns from the existing infrastructure and to
plan future investments and other changes that maintain or improve position by:
A) Implementation of Strategic plans
B) Acquisition/rationalization/rebuild/conversion
C) Improving decision making
D) Improving competitive advantage
E) Managing change
26

The journey of channel planning in BELTEK CANADIAN WATER LTD starts with Site
classification, competition assessment (no. of competitors in that area), Individual site
strategy depending on the kind of consumers coming in, proposal evaluation working on
financial, technical, marketing and economic feasibility of a proposed plan , network
optimization , performance measurement with regular and sudden audits.
3.14 Promotional Policies
A) CRM Policies
BELTEK CANADIAN WATER LTD main aim is to develop products to meet changing market
demands and specific customer requirements for their current and future business growth.
They have devised a customer suggestion scheme and redressal mechanism module to address
customer enquiries and grievances. Customers are given easy access to these tools on their
corporate website. Their customer satisfaction surveys help them to assess the level of their
customer’s satisfaction and their key expectations.
It organizes customer meets and felicitation events to further their relationship with their
customer’s .To improve customer satisfaction they have employed the latest technologies in their
beverages management .They address queries raised by customers through customer relationship
portals, satisfaction surveys and other means of engagement.
B) Advertisement Process
Their advertising and marketing initiatives are supported by product brochures, road-shows and
campaigns.
27
3.2 HRM
3.21 HR Planning
3.22 Recruitment, Selection Process
The company ensures that they acquire the right talent to fuel our growth and give them the right
exposure and opportunity for their overall development. Their efforts focus on recruitment from
some of India’s best academic institutions.
3.23 Training, Performance Appraisal & Recognition Systems
BELTEK CANADIAN WATER LTD ensures that they provide their employees an engaging
atmosphere through their welfare activities and internal communication.
It fulfils commitment towards employee development by providing adequate opportunities to
them to hone their technical and inter-personal skills.
Their annual performance review program, employee suggestion schemes, employee
engagement surveys and internal review meetings help them in identifying and responding to
their employees’ key concerns. They support these measures by on-going means of interaction
including internal magazines, newsletters and the intranet.
3.24 Industrial Relations, Welfare, Career Development & Grievance Handling
Policies
BELTEK CANADIAN WATER LTD has put efforts to effectively implement RTI Act at
BELTEK CANADIAN WATER LTD. In this regard, during the year, they provided 11 training
programs to 200 employees on the key elements and enforcement areas for this Act.
28

BELTEK CANADIAN WATER LTD endeavors to create an organization free from corruption
and is inclined towards upholding high ethical values. To this end, they have signed a MoU with
Transparency International (TI) in 2007 for ratification of Integrity Pact Programme in
consultation with the CVC to maintain and foster ethical and corruption free business
environment. This pact is also mandatorily signed by vendors / suppliers having high value
contracts. They have defined specific roles and responsibilities of the key departments in
BELTEK CANADIAN WATER LTD to address the grievances, monitor them, and ensure that
they are addressed in a timely and efficient manner. They are one of the few companies in India
to set up a focused Board committee to address grievances of all stakeholders through the
Stakeholders’ Grievance Redressal Committee. This committee is empowered to take decisions
on disputes referred by stakeholders and resolve them amicably.
To improve retention and satisfaction amongst the employees, they have taken consistent
investment efforts towards building adequate infrastructure and promoting welfare activities.
A grievance Redressal Committee consisting of senior officers including the Advisor-
Coordination & officer on special duties has been constituted to handle day to day labour
grievances in coordination with the contractors’ representative & the contractors’ workers for
prompt disposal & for maintenance of a harmonious work environment.
3.25 Safety Policies & Practices
They have stringent security arrangements to handle and manage any mishaps or untoward
incidents due to the increasing geo-political instability. They have also invested on trained
security staff to ensure seamless operations. In order to ensure greater transparency in all
aspects of the company, it has adopted a Whistle Blower Policy .This policy provides for
adequate safeguards against victimization of employees who avail of the mechanism.
29

3.3. Production & Operations
3.31 Production & Procurement Planning
A) BELTEK CANADIAN WATER LTD has appointed Independent External Monitors (IEM)
of high repute to lend transparency to their procurement procedures.
In order to enhance clarity and transparency in their procurement procedures, they have initiated
Procurement through reverse auction for high value procurement. They have formed a
transparent procedure for reverse auction, which was applied first to tenders involving plastic
procurement, necessitated by the problem of fluctuation in plastic prices.
The company has expansion plans for manufacturing more than 7500 cases of wild water in the
country and it is very ambitious to go in a very big way for expending its networks. The
Company is going to invest more than Rs. 30 crores in next five years to install new machinery
for production.
3.32 Supply chain Management such as Vendor Development, Logistics, Inventory
Management
Supply Chain Management of BELTEK CANADIAN WATER LTD include BELTEK
CANADIAN WATER LTD has adopted a Ingredient Management System to handle
multiple sources of supply and delivery of ingredients in a liquid form and provide a
seamless interface between shippers, customers, transporters and suppliers. At BELTEK
CANADIAN WATER LTD, they have deployed a Bill Watch System to improve
processing of vendor bills, increase transparency for vendors during tracking of payment,
and enhance trust through independent nature of the system involved. Similarly, they have
also upgraded their File Management System on similar lines to track the movement of files
30

within BELTEK CANADIAN WATER LTD. They promote vigilance awareness through
their internal magazine, ‘awareness’, which provides information on proactive vigilance and
describes several successful case studies. This is supported by appropriate measures to
boost awareness of major vendors towards the need for proactive vigilance and ethics. They
have an Operation and Maintenance Policy, which outlines the objective, targets,
philosophy and guidelines for maintenance across their operations. This policy focuses on
increasing process efficiency and decreasing downtime to ensure optimum use of resources.
3.33 Quality Assurance & Quality Control
All the machinery and manufacturing plant in BELTEK CANADIAN WATER LTD are ISO
9001, ISO 14001 and OHSAS 18001 certified. We have designed an Integrated Management
System (IMS) based on systemic requirements of ISO 9001:2008, ISO 14001:2004 and OHSAS
18001:2007 for all our processes, activities, products and services across locations. These
systems enable us to effectively control and manage our performance.
3.34 Maintenance Practices
To have a focused approach on HSE issues, they have constituted a separate HSE sub-committee
of Directors at the Board level to closely monitor the performance and emergency preparedness
of our operations.
31

3.4 FINANCE
3.41 BALANCE SHEET AS AT 31st MARCH 2012
Statement: View:
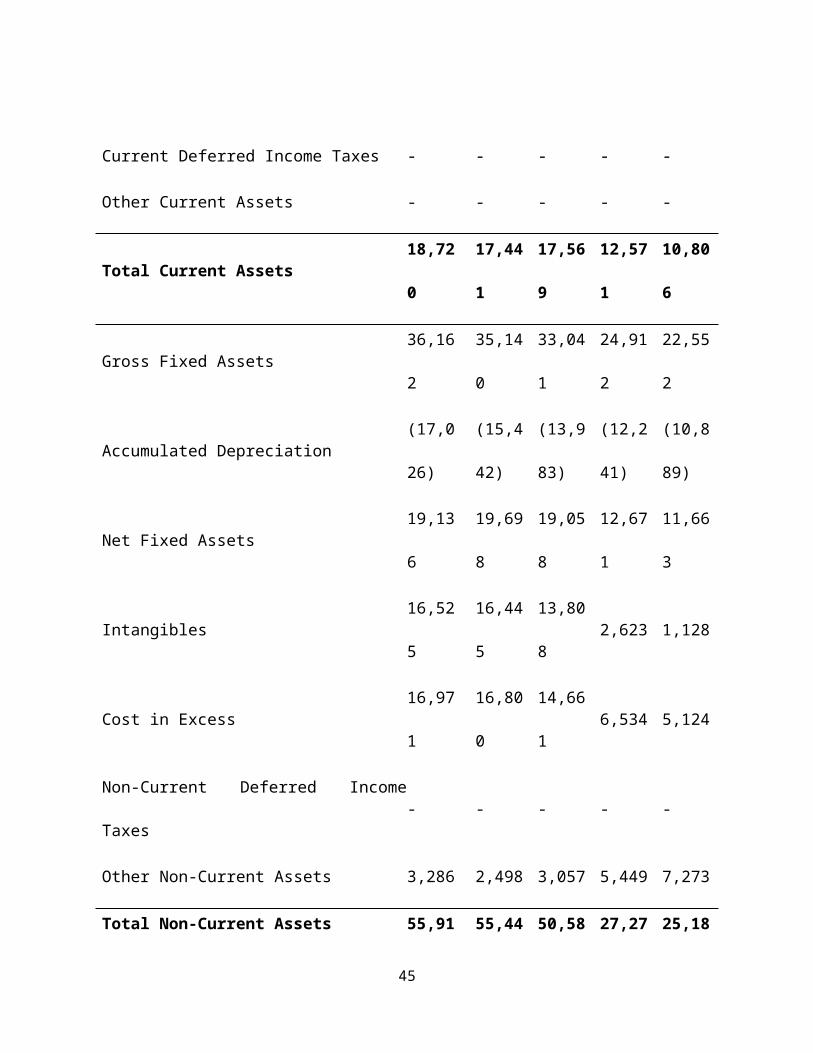
Assets [+] in Millions of Dollars
12/2012 12/2011 12/2010 12/2009 12/2008
Cash and Equivalents 6,297 4,067 5,943 3,943 2,064
Restrict able Cash - - - - -
Marketable Securities 322 358 426 192 213
Receivables 7,041 6,912 6,323 4,624 4,683
Inventories 3,581 3,827 3,372 2,618 2,522
Prepaid Expenses 1,479 2,277 1,505 1,194 1,324
Current Deferred Income Taxes - - - - -
Other Current Assets - - - - -
Total Current Assets 18,720 17,441 17,569 12,571 10,806
Gross Fixed Assets 36,162 35,140 33,041 24,912 22,552
Accumulated Depreciation (17,026) (15,442) (13,983) (12,241) (10,889)
Net Fixed Assets 19,136 19,698 19,058 12,671 11,663
Intangibles 16,525 16,445 13,808 2,623 1,128
Cost in Excess 16,971 16,800 14,661 6,534 5,124
Non-Current Deferred Income Taxes - - - - -
Other Non-Current Assets 3,286 2,498 3,057 5,449 7,273
32

Total Non-Current Assets 55,918 55,441 50,584 27,277 25,188
Total Assets 74,638 72,882 68,153 39,848 35,994
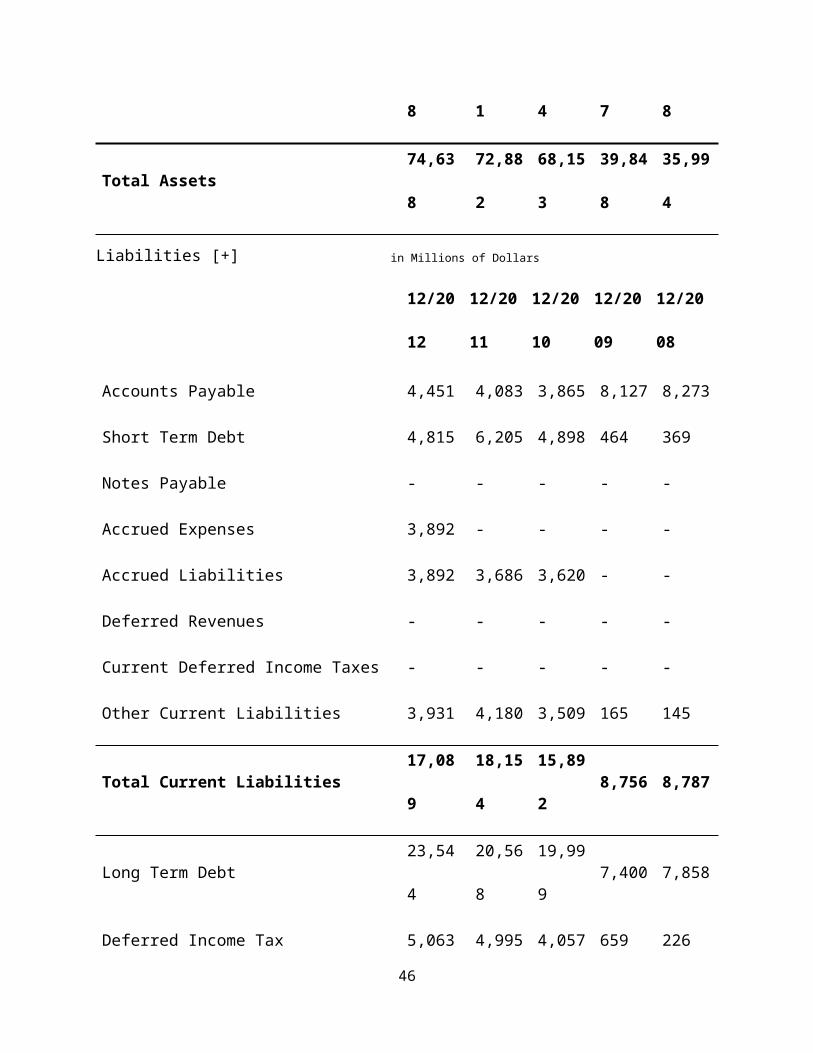
Liabilities [+] in Millions of Dollars
12/2012 12/2011 12/2010 12/2009 12/2008
Accounts Payable 4,451 4,083 3,865 8,127 8,273
Short Term Debt 4,815 6,205 4,898 464 369
Notes Payable - - - - -
Accrued Expenses 3,892 - - - -
Accrued Liabilities 3,892 3,686 3,620 - -
Deferred Revenues - - - - -
Current Deferred Income Taxes - - - - -
Other Current Liabilities 3,931 4,180 3,509 165 145
Total Current Liabilities 17,089 18,154 15,892 8,756 8,787
Long Term Debt 23,544 20,568 19,999 7,400 7,858
Deferred Income Tax 5,063 4,995 4,057 659 226
Other Non-Current Liabilities 6,461 8,109 6,579 5,487 6,541
Minority Interest 105 311 312 638 476
Capital Lease Obligations - - - - -
Preferred Securities of Subsidiary Trust - - - - -
Preferred Equity Outside Shareholders' Equity (123) - - - -
33
Total Non-Current Liabilities 35,091 33,983 30,947 14,184 15,101
Total Liabilities 52,180 52,137 46,839 22,940 23,888
Preferred Shareholder's Equity 41 41 41 41 41
Common Shareholder's Equity 22,417 20,704 21,273 16,867 12,065
Total Equity 22,458 20,745 21,314 16,908 12,106
Total Liabilities & Shareholder's Equity 74,638 72,882 68,153 39,848 35,994
3.42 PROFIT AND LOSS ACOUNT
34

2011 2010 2009
Net Revenue $66,504 $57,838 $43,232
Cost of sales 31,593 26,575 20,099
Selling, general and administrative expenses 25,145 22,814 15,026
Amortization of intangible assets 133 117 63
Operating Profit 9,633 8,332 8,044
Bottling equity income – 735 365
Interest expense (856 ) (903 ) (397 )
Interest income and other 57 68 67
Income before income taxes 8,834 8,232 8,079
Provision for income taxes 2,372 1,894 2,100
Net income 6,462 6,338 5,979
Less: Net income attributable to no controlling interests 19 18 33
Net Income Attributable to PepsiCo $6,443 $6,320 $5,946
Net Income Attributable to PepsiCo per Common Share
Basic $4.08 $3.97 $3.81
Diluted $4.03 $3.91 $3.77
Weighted-average common shares outstanding
Basic 1,576 1,590 1,558
35

Diluted 1,597 1,614 1,577
Cash dividends declared per common share $2.025 $1.89 $1.775
3.43 CASH FLOW STATEMENT
36

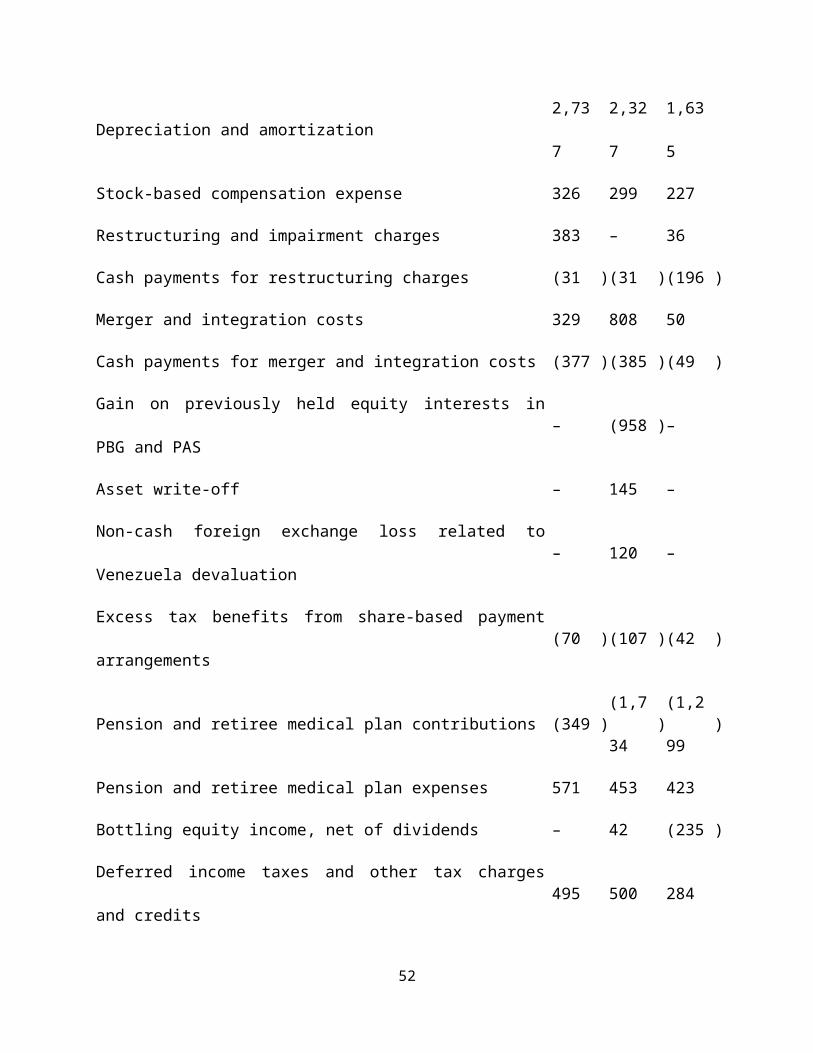
2011 2010 2009
Operating Activities
Net income $6,462 $6,338 $5,979
Depreciation and amortization 2,737 2,327 1,635
Stock-based compensation expense 326 299 227
Restructuring and impairment charges 383 – 36
Cash payments for restructuring charges (31 ) (31 ) (196 )
Merger and integration costs 329 808 50
Cash payments for merger and integration costs (377 ) (385 ) (49 )
Gain on previously held equity interests in PBG and PAS – (958 ) –
Asset write-off – 145 –
Non-cash foreign exchange loss related to Venezuela devaluation – 120 –
Excess tax benefits from share-based payment arrangements (70 ) (107 ) (42 )
Pension and retiree medical plan contributions (349 ) (1,734 ) (1,299 )
Pension and retiree medical plan expenses 571 453 423
Bottling equity income, net of dividends – 42 (235 )
Deferred income taxes and other tax charges and credits 495 500 284
Change in accounts and notes receivable (666 ) (268 ) 188
37

Change in inventories (331 ) 276 17
Change in prepaid expenses and other current assets (27 ) 144 (127 )
Change in accounts payable and other current liabilities 520 488 (133 )
Change in income taxes payable (340 ) 123 319
Other, net (688 ) (132 ) (281 )
Net Cash Provided by Operating Activities 8,944 8,448 6,796
Investing Activities
Capital spending (3,339 ) (3,253 ) (2,128 )
Sales of property, plant and equipment 84 81 58
Acquisitions of PBG and PAS, net of cash and cash equivalents
acquired– (2,833 ) –
Acquisition of manufacturing and distribution rights from DPSG – (900 ) –
Acquisition of WBD, net of cash and cash equivalents acquired (2,428 ) – –
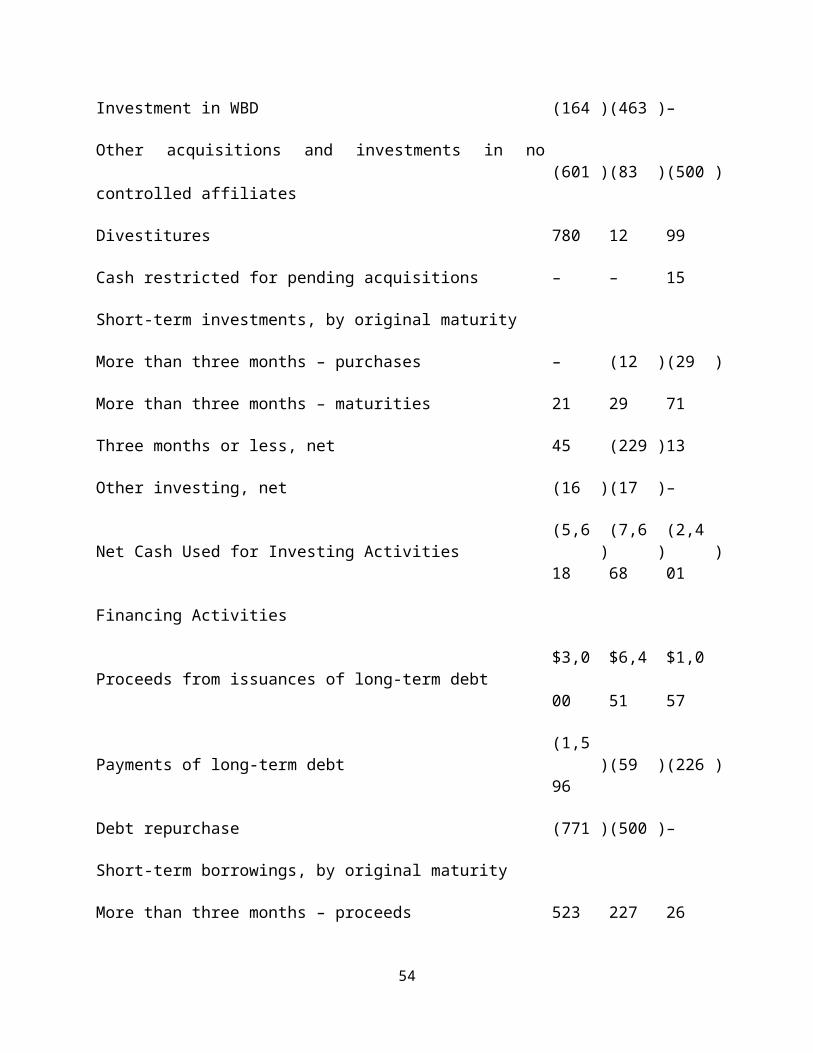
Investment in WBD (164 ) (463 ) –
Other acquisitions and investments in no controlled affiliates (601 ) (83 ) (500 )
Divestitures 780 12 99
Cash restricted for pending acquisitions – – 15
Short-term investments, by original maturity
More than three months – purchases – (12 ) (29 )
More than three months – maturities 21 29 71
Three months or less, net 45 (229 ) 13
Other investing, net (16 ) (17 ) –
38
Net Cash Used for Investing Activities (5,618 ) (7,668 ) (2,401 )
Financing Activities
Proceeds from issuances of long-term debt $3,000 $6,451 $1,057
Payments of long-term debt (1,596 ) (59 ) (226 )
Debt repurchase (771 ) (500 ) –
Short-term borrowings, by original maturity
More than three months – proceeds 523 227 26
More than three months – payments (559 ) (96 ) (81 )
Three months or less, net 339 2,351 (963 )
Cash dividends paid (3,157 ) (2,978 ) (2,732 )
Share repurchases – common (2,489 ) (4,978 ) –
Share repurchases – preferred (7 ) (5 ) (7 )
Proceeds from exercises of stock options 945 1,038 413
Excess tax benefits from share-based payment arrangements 70 107 42
Acquisition of no controlling interests (1,406 ) (159 ) –
Other financing (27 ) (13 ) (26 )
Net Cash (Used for)/Provided by Financing Activities (5,135 ) 1,386 (2,497 )
Effect of exchange rate changes on cash and cash equivalents (67 ) (166 ) (19 )
Net (Decrease)/Increase in Cash and Cash Equivalents (1,876 ) 2,000 1,879
Cash and Cash Equivalents, Beginning of Year 5,943 3,943 2,064
Cash and Cash Equivalents, End of Year $4,067 $5,943 $3,943
Non-cash activity:
39

Issuance of common stock and equity awards in connection with our
acquisitions of PBG and PAS, as reflected in investing and financing
activities
– $4,451 –
3.5 Use of IteS
The FMIS system consists of the following four main applications
3.51 Financial Accounting System (FAS)
This is the complete accounting software covering the whole range of accounting activities from
preparation of vouchers (for client billing, payments, receipts) and books of accounts to final
accounting statements, all through user friendly program modules called activity modules. The
system eliminates the need of remembering accounts codes, since these are stored in the system
directories. Whenever these codes are required for entry in the field boxes of any activity
module, they can be displayed and selected from drop down lists by clicking the drop down
arrow of the field box. Other information like client, party, project, employee codes etc. are also
stored in directories. It is essential to enter data in these directories before starting work in the
system and also to update these directories from time to time. The requirement of inputting data
in the activity modules is minimum since the programs contain all the standard formulae and
data for processing and generating required outputs. The financial data from the modules is
stored in a common centralized database which acts as the source for generating the desired
financial, costing and MIS reports. The FAS system also allows integration with other systems
such as payroll.
3.52 Project Accounting
40

This programme contains modules for preparation of project estimates for offers, project coding
and project costing. The project codes, sector codes, client codes and other details related to the
projects are stored in the project Master directory and used for generation of MIS reports.
3.53 Management Information System
The software uses the financial database of FAS and project accounting system to generate
periodical financial reports for the management on expenditure, income, outstanding, and
profitability.
3.54 Budget
Although listed last this fourth application contains the programs for the most important
managerial activity of compiling the company’s budget for income, expenditure and capital
assets. Beltek Canadian water limited has recently shifted from FMIS to ERP SAP.
3.55 ERP
Enterprise Resource Planning”. An integrated software solution used to manage a company’s
resources. Integrates all business functions, of the organization including HR, Finance, P&A,
purchasing, IT, Business functions of SBUs (BD, Contract securing and signing, project
planning, resource management, hiring of consultants/ sub-consultants, execution of project
milestones, approvals, deliverables, invoicing, receipts, client interactions, financial and physical
closure etc) and management of data.
Implementing an ERP system
Integrates all departments and functions across a company onto a single computer system that
can serve all those different departments' particular needs.ERP combines the various processes
41

and functions all together into a single, integrated software program that runs off a single
database so that the various departments can more easily share information and communicate
with each other.
B. DATA PRESENTATION
3.6Company Analysis of BELTEK CANADIAN WATER LTD
42

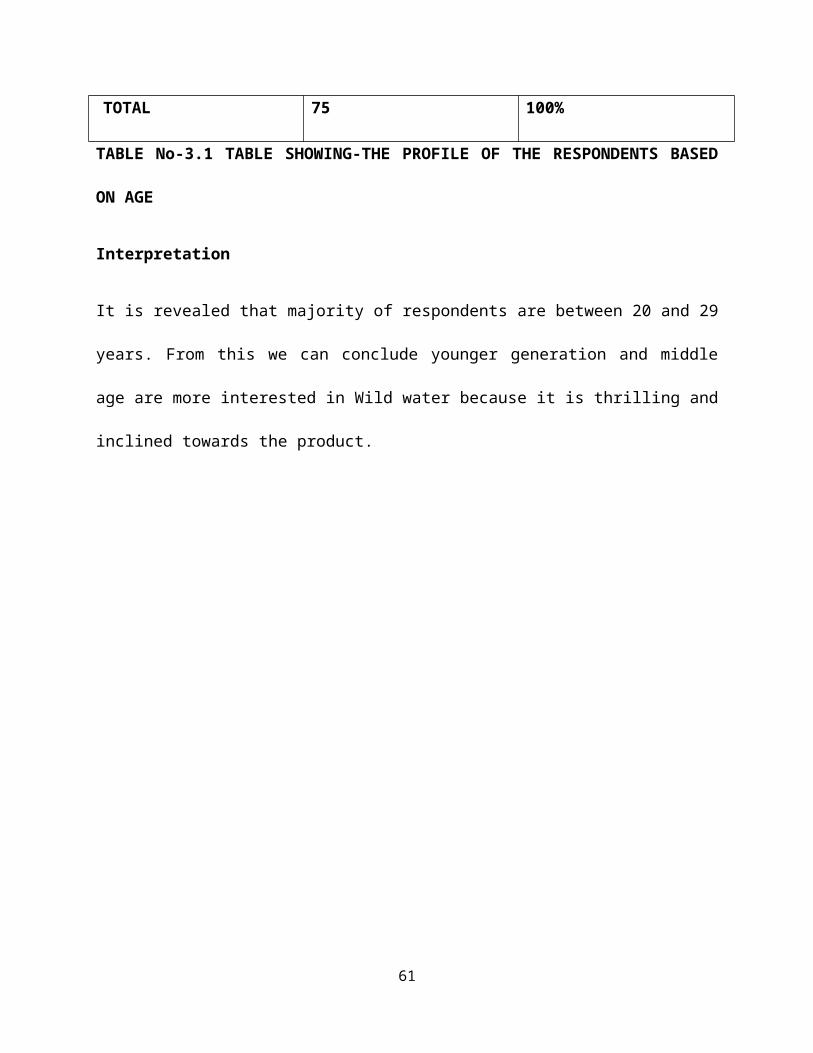
AGE NO. OF
RESPONDENTS
PERCENTAGE
20-24 30 45%
25-29 19 26%
30-34 14 18%
Above 35 12 11%
TOTAL 75 100%
TABLE No-3.1 TABLE SHOWING-THE PROFILE OF THE RESPONDENTS BASED
ON AGE
Interpretation
It is revealed that majority of respondents are between 20 and 29 years. From this we can
conclude younger generation and middle age are more interested in Wild water because it is
thrilling and inclined towards the product.
43

45%
26%
18%
11%
20-24
25-29
30-34
Above 35
GRAPH No-3.1 GRAPH SHOWING-THE PROFILE OF THE RESPONDENTS BASED
ON AGE
44
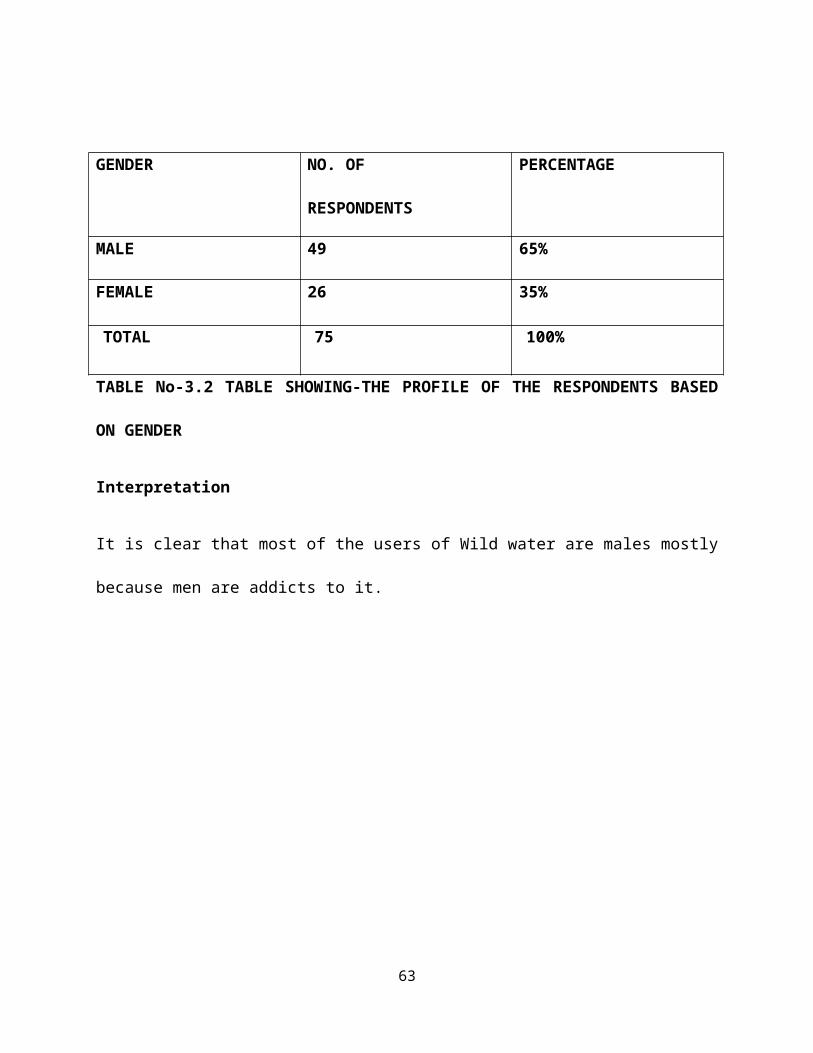
GENDER NO. OF
RESPONDENTS
PERCENTAGE
MALE 49 65%
FEMALE 26 35%
TOTAL 75 100%
TABLE No-3.2 TABLE SHOWING-THE PROFILE OF THE RESPONDENTS BASED
ON GENDER
Interpretation
It is clear that most of the users of Wild water are males mostly because men are addicts to it.
45
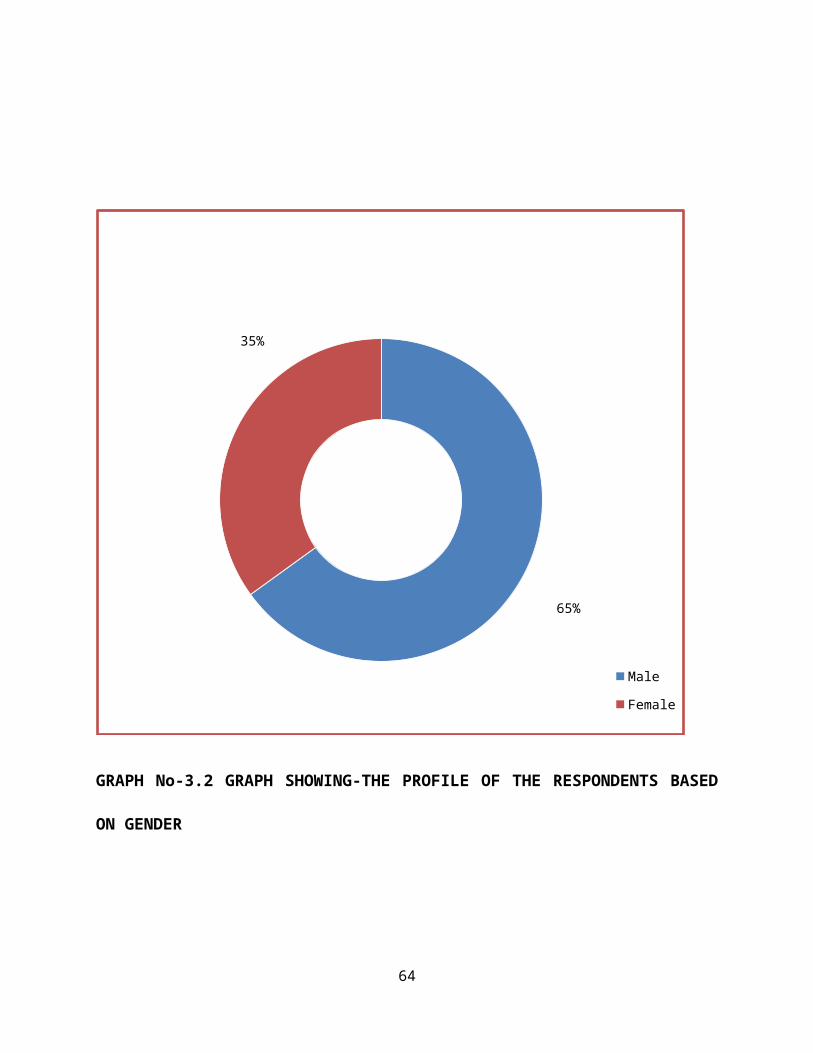
65%
35%
Male
Female
GRAPH No-3.2 GRAPH SHOWING-THE PROFILE OF THE RESPONDENTS BASED
ON GENDER
46

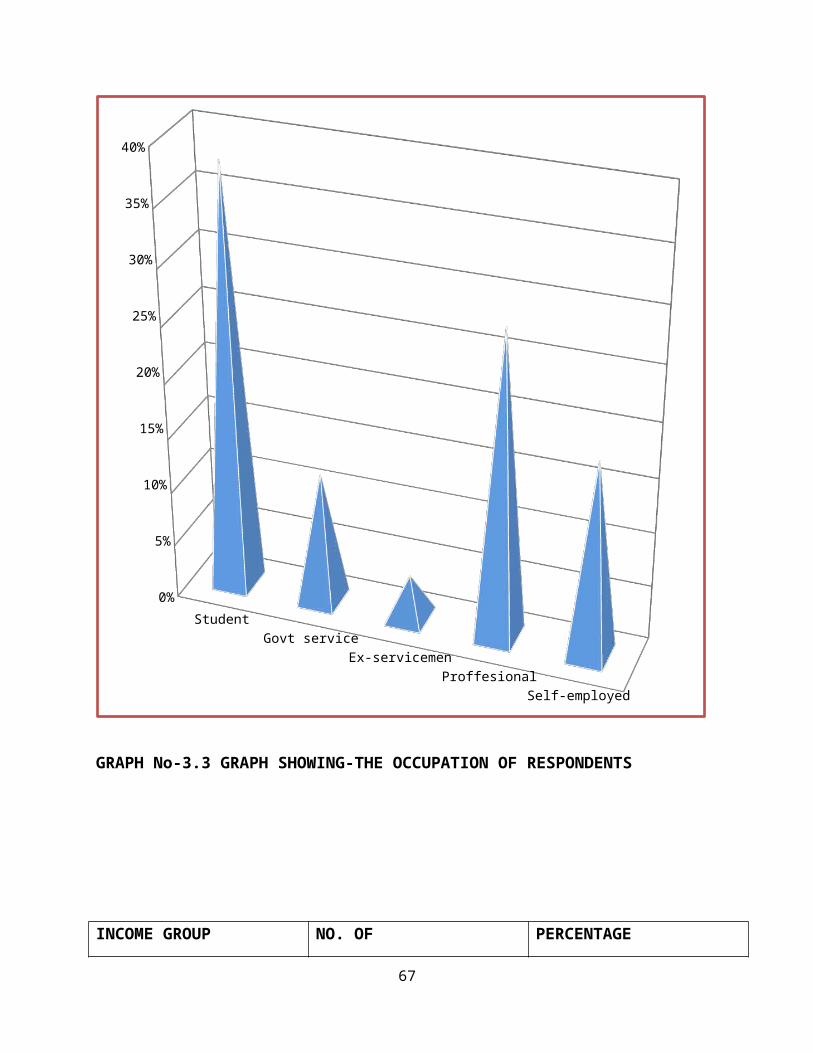
OCCUPATION NO.OF
RESPONDENTS
PERCENTAGE
STUDENT 29 38%
GOVERNMENT SERVICE 9 12%
EX-SERVICEMEN 3 4%
PROFESSIONAL 21 28%
SELF-EMPLOYED 13 18%
TOTAL 75 100%
TABLE No-3.3 TABLE SHOWING-THE OCCUPATION OF RESPONDENTS
Interpretation
It is clear that users are mostly Professional males, 20-35 years of age including some students
because it helps in focusing and staying awake.
47

Student Govt service Ex-servicemen Proffesional Self-employed
No. of Re-spondents
0.380000000000003
0.12 0.04 0.28 0.18
3%
8%
13%
18%
23%
28%
33%
38%
GRAPH No-3.3 GRAPH SHOWING-THE OCCUPATION OF RESPONDENTS
48

INCOME GROUP NO. OF
RESPONDENTS
PERCENTAGE
LESS THAN 1,20,000 39 52%
1,20,001-3,60,000 10 14%
3,60,001-7,20,000 14 18%
ABOVE 7,20,000 12 16%
TOTAL 75 100%
TABLENo-3.4 TABLE SHOWING-THE ANNUAL INCOME GROUP OF
PARTICIPANTS
Interpretation
It shows that Wild water is placing their products in the appropriate and reasonable price range
and the people of income bracket less than 1,20,000 can easily afford this product.
49

52%
14%
18% 16%
Less than 1,20,000
1,20,001-3,60,000
3,60,001-7,20,000
Above 7,20,000
GRAPH No-3.4 GRAPH SHOWING-THE ANNUAL INCOME GROUP OF
RESPONDENTS
50

TABLE SHOWING- THE RESPONDENTS INVOLVEMENT WITH ANY
EXTRACURRICULAR ACTIVITIES ON CAMPUS OR OUT OF OFFICE
YES/NO NO. OF RESPONDENTS PERCENTAGE OF
REPONDENTS
YES 23 30%
NO 52 70%
TOTAL 75 100%
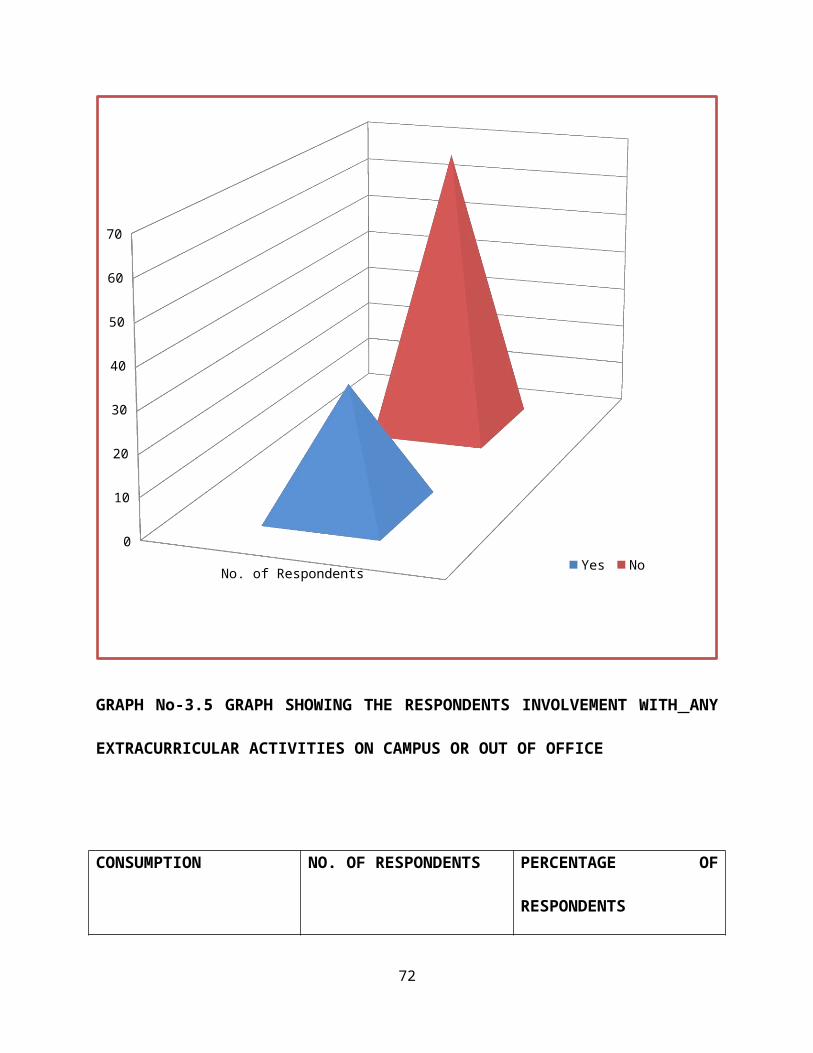
TABLE No-3.5 TABLE SHOWING- THE RESPONDENTS INVOLVEMENT WITH
ANY EXTRACURRICULAR ACTIVITIES ON CAMPUS OR OUT OF OFFICE
Interpretation
It clearly shows that majority of the respondents do not participate in any extracurricular
activities.
51
GRAPH SHOWING- THE RESPONDENTS INVOLVEMENT WITH ANY
EXTRACURRICULAR ACTIVITIES ON CAMPUS OR OUT OF OFFICE
No. of Respondents
0
10
20
30
40
50
60
70
Yes No
GRAPH No-3.5 GRAPH SHOWING THE RESPONDENTS INVOLVEMENT WITH
ANY EXTRACURRICULAR ACTIVITIES ON CAMPUS OR OUT OF OFFICE
52

CONSUMPTION NO. OF RESPONDENTS PERCENTAGE OF
RESPONDENTS
EVERYDAY 15 19%
2-3 DAYS A WEEK 20 27%
4-5 DAYS A WEEK 12 16%
ONCE A WEEK 7 10%
EVERY 2-3 WEEKS 9 12%
ONCE A MONTH 7 9%
LESS THAN ABOVE 5 7%
TOTAL 75 100%
TABLE No-3.6 TABLE SHOWING-THE RESPONDENTS CONSUMPTION OF WILD
WATER
Interpretation
It is clear that in customers there is a high regularity amongst consumption by customers in a
week.
GRAPH SHOWING-THE RESPONDENTS CONSUMPTION OF WILD WATER
53
Everyday 2-3 days a week
4-5 days a week
Once a week
Every 2-3 weeks
Once a month
Less than above
0
2
4
6
8
10
12
14
16
18
20
No. of Respondents
GRAPH No-3.6 GRAPH SHOWING-THE RESPONDENTS CONSUMPTION OF WILD
WATER
YES/NO NO. OF PERCENTAGE
54

RESPONDENTS
YES 47 62%
NO 28 38%
TOTAL 75 100%
TABLE No-3.7 TABLE SHOWING- THE INCREASE IN CONSUMPTION OF RED
BULL BY THE RESPONDENTS AFTER ADVERTISEMENTS
Interpretation
It is clear there is an increase in consumption of Wild Water after advertisements and hence this
marketing strategy has benefited.
GRAPH SHOWING-THE INCREASE IN CONSUMPTION OF WILD WATER BY THE
RESPONDENTS AFTER ADVERTISEMENTS
55

YES
NO
0%
10%
20%
30%
40%
50%
60%
70%
62%
38%
No. of Respondents
GRAPH No-3.7 GRAPH SHOWING-THE INCREASE IN CONSUMPTION OF WILD
WATER BY THE RESPONDENTS AFTER ADVERTISEMENTS
56
MEDIA NO. OF
RESPONDENTS
PERCENTAGE
MAGAZINES 24 32%
FRIENDS 19 25%
TV ADS 11 15%
WEBSITE/BLOGS 15 20%
OTHER SOURCES 6 8%
TOTAL 75 100%
TABLE No-3.8 TABLE SHOWING- THE SOURCE OF AWARENESS OF WILD
WATER
Interpretation
It clearly shows that magazines and friends create high awareness of Wild Water amongst
people.
57

magazines friends and relations
TV adds Website Other sources
Respondents 0.320000000000004
0.25 0.15 0.2 0.08
3%
8%
13%
18%
23%
28%
33%
GRAPH No-3.8 GRAPH SHOWING- THE SOURCE OF AWARENESS OF WILD
WATER
58

FACTORS NO. OF
RESPONDENTS
PERCENTAGE
RELIEVING FATIGUE 15 20%
FOR STAYING AWAKE 18 24%
DAILY ROUTINE 13 17%
INCREASE
CONCENTRATION
18 24%
HANGOVER REMEDY 11 15%
TOTAL 75 100%
TABLE No-3.9 TABLE SHOWING- THE FACTORS INFLUENCING TO BUY WILD
WATER
Interpretation
It is clear that there are majority of reasons supporting the consumption such as fatigue, for
staying up and to increase the level of concentration.
59

Relieving fatigue For staying awake Daily routine Increase concen-tration
Hangover remedy
No. of Re-spondents
15 18 13 18 11
1
3
5
7
9
11
13
15
17
19
GRAPH No-3.9 GRAPH SHOWING-THE FACTORS INFLUENCING TO BUY WILD
WATER
60
PLACE NO. OF
RESPONDENTS
PERCENTAGE
CONVINIENCE STORE 16 22%
SUPER MARKET 44 58%
DRUG STORE 6 8%
OTHERS 9 12%
TOTAL 75 100%
TABLE No-3.10 TABLE SHOWING-PURCHASING PLACE OF WILD WATER BY
RESPONDENTS
Interpretation
It is clear that super markets are on top of retailers in the sales of Red bull energy drink.
61

22%
58%
8%
12%
Convinient store
Super market
Drug store
Others
GRAPH No-3.10 GRAPH SHOWING- PURCHASING PLACE OF RED BULL BY
RESPONDENTS
62
FACTORS NO. OF RESPONDENTS PERCENTAGE
ENERGY 25 34%
PRICE 13 17%
TV COMMERCIALS 9 12%
ADS ON NEWSPAPER 4 6%
MARKETING CAMPAIGN 7 10%
PACKAGE 4 5%
BRAND 6 7%
TASTE 6 7%
WORD OF MOUTH 1 2%
TOTAL 75 100%
TABLE NO3.11 TABLE SHOWING- THE RESPONDENTS FACTORS INFLUENCING
TO CHOOSE WILD WATER
Interpretation
It is clear that the energy drink provides rejuvenation and replenishes energy into the people
consuming it.
63
0
5
10
15
20
25
25
13
9
4
7
46 6
1
No. of Respondents
GRAPHNO-3.11)GRAPHSHOWING- THE RESPONDENTS FACTORS INFLUENCING
TO CHOOSE WILD WATER
64

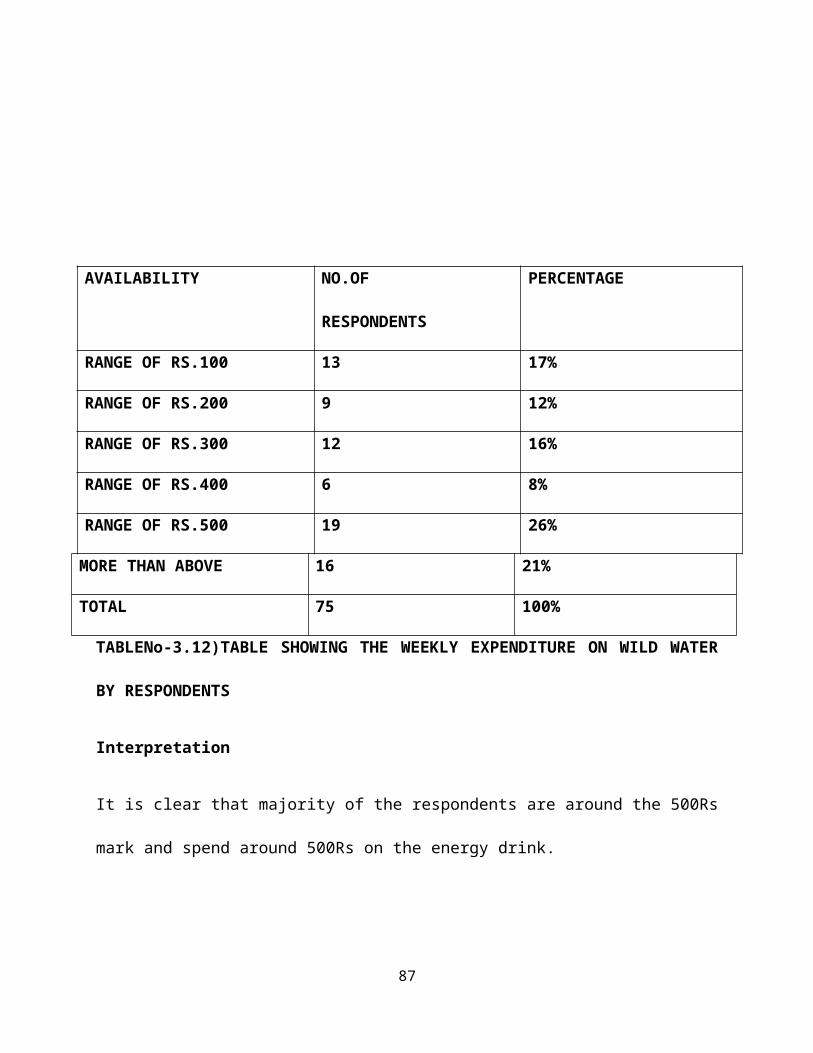
AVAILABILITY NO.OF
RESPONDENTS
PERCENTAGE
RANGE OF RS.100 13 17%
RANGE OF RS.200 9 12%
RANGE OF RS.300 12 16%
RANGE OF RS.400 6 8%
RANGE OF RS.500 19 26%
MORE THAN ABOVE 16 21%
TOTAL 75 100%
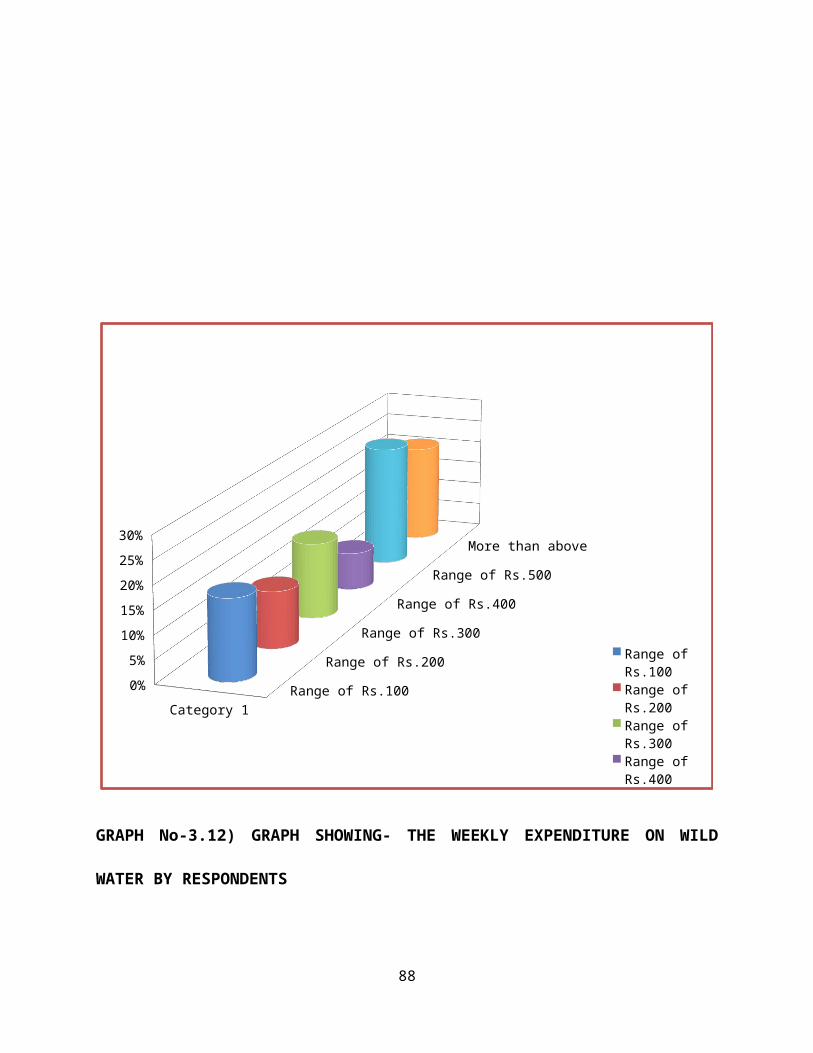
TABLENo-3.12)TABLE SHOWING THE WEEKLY EXPENDITURE ON WILD
WATER BY RESPONDENTS
Interpretation
It is clear that majority of the respondents are around the 500Rs mark and spend around 500Rs
on the energy drink.
65

Category 1
0%
5%
10%
15%
20%
25%
30%
Range of
Rs.100
Range of
Rs.300
Range of
Rs.500
Range of Rs.100
Range of Rs.200
Range of Rs.300
Range of Rs.400
Range of Rs.500
More than above
GRAPH No-3.12) GRAPH SHOWING- THE WEEKLY EXPENDITURE ON WILD
WATER BY RESPONDENTS
66
YES/NO NO. OF
RESPONDENTS
PERCENTAGE
YES 17 23%
NO 58 77%
TOTAL 75 100%
TABLE No-3.13) TABLE SHOWING-THE RESPONDENTS OPINION OF PREFERING
ANY OTHER ENERGY DRINK OVER WILD WATER
Interpretation
It is clear that red bull energy drink dominates the energy drink market and consumers prefer
WILD WATER over other energy drinks.
67

23%
77%Yes No
GRAPHNo-3.13) GRAPH SHOWING-THE RESPONDENTS OPINION OF PREFERING
ANY OTHER ENERGY DRINK OVER WILD WATER
68
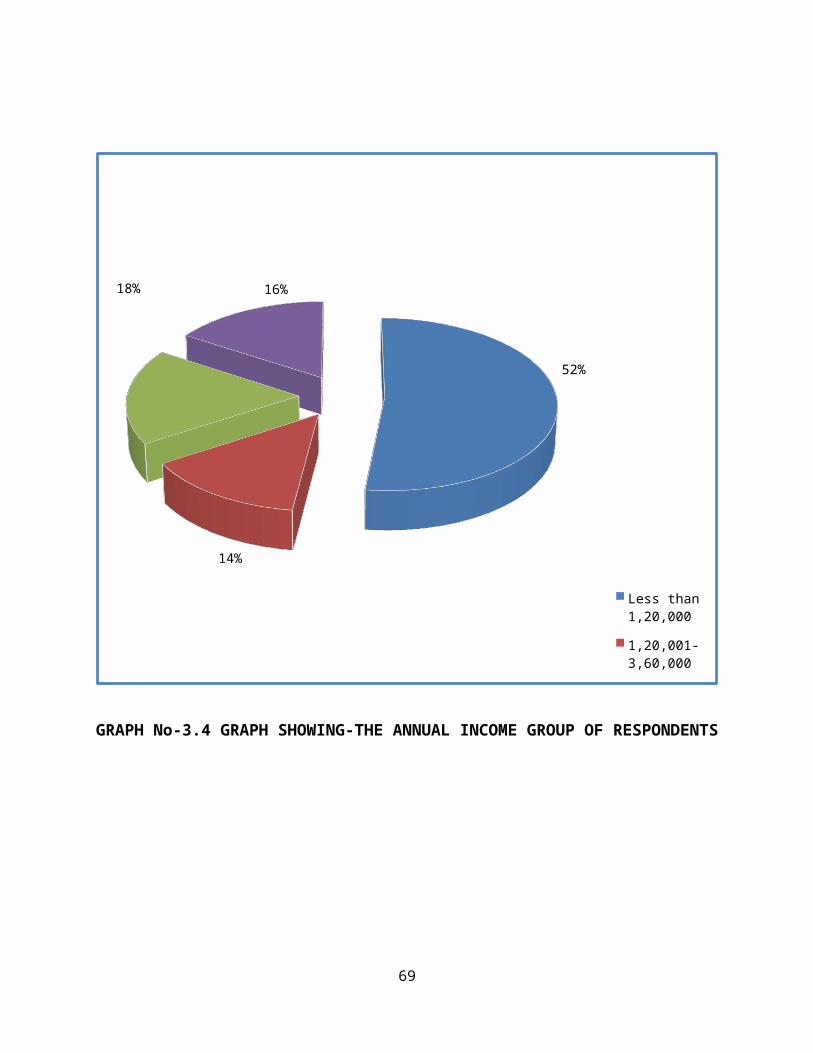
TABLE SHOWING- THE RESPONDENTS OPINION IF WILD WATER IS OVER
PRICED OR NOT
RATING NO. OF
RESPONDENTS
PERCENTAGE
YES 16 22%
NO 59 78%
TOTAL 75 100%
TABLENO-3.14)TABLE SHOWING-THE RESPONDENTS OPINION IF WILD WATER
IS OVER PRICED OR NOT
Interpretation
It is clear that majority of the respondents feel WILD WATER is money to worth product and
not over priced for the quality of the drink.
69

5
15
25
35
45
55
Yes
No
GRAPHNo-3.14)GRAPH SHOWING-THE RESPONDENTS OPINION IF WILD
WATER IS OVER PRICED OR NOT
70

YES/NO NO. OF RESPONDENTS PERCENTAGE
YES 13 18%
NO 62 82%
TOTAL 75 100%
TABLE No-3.15-A) TABLE SHOWING-THE OPINION OF THE RESPONDENTS OF
FACING DIFFICULTIES IN FINDING WILD WATER AND THEIR SATISFACTION
LEVEL WITH RESPECT TO AVAILABILITY OF WILD WATER
RESPONSE FOR
SATISFACTION
NO. OF RESPONDENTS PERCENTAGE
YES 64 85%
NO 11 15%
TOTAL 75 100%
TABLENo3.15-B) THE SATISFACTION LEVEL WITH RESPECT TO AVAILABILITY
OF WILD WATER
Interpretation
It is clear that there is ample availability of the drink in the market and not much difficulty to
access it.
71
GRAPH No-3.15-A) GRAPH SHOWING-THE OPINION OF THE RESPONDENTS OF
FACING DIFFICULTIES IN FINDING WILD WATER AND THEIR SATISFACTION
LEVEL WITH RESPECT TO AVAILABILITY OF WILD WATER
Point of Satisfaction
Yes85%
No15%
GRAPHNo3.15-B)THE SATISFACTION LEVEL WITH RESPECT TO AVAILABILITY
OF WILD WATER
72
Yes
No
0
10
20
30
40
50
60
70
13
62
No. of Respondents

4.1 CONSUMER SATISFACTION AND MARKETING EFFECTIVENESS OF WILD
WATER ENERGY DRINK
Following is the analysis of wild water energy drink on the basis of their strategy for fulfilling
the purpose of consumer satisfaction and effective marketing.
A) It is clear that 45% of the respondents are aged between 20 and 24, 26% between 25 and 29,
18% between 30 and 34 and only 11% aged above 35 years. so it shows that wild water fulfills
the requirement of the youth. It has been marketed in such a way that the target consumers are
youth.
B) From our research it is clear that 65% of respondents were male and female respondents
constituted just 35% of total responses. so it shows that wild water is more popular among male
consumers. Female consumers are not very fond of beverages as compared to male consumers
C) 38% of the respondents were students pursuing their graduation or post graduation studies
and 28% were professionals. 18% of the respondents were self employed, 4% were ex-
serviceman and 12% belonged to government services.
D) 52% of the respondents had an annual income of lesser than 1,20,000, 18% had income
between 3,60,001 and 7,20,000, 16% earned more than 7,20,000 per annum and 14% had income
between 120001 to 3,60,000.Here marketing effectiveness of wild water shows that it is being
consumed by all sections of the society
E) From the research it is clear that 30% of the respondents are involved in extracurricular
activities and 70% of them do not participate.
73

F) From the research it clearly shows that 19% of the respondents consume Wild Water
everyday, 27% of them 2-3 days a week, 16% of them 4-5 days a week, 10% once a week, 12%
every 2-3 weeks, 9% once a month and 7% less than above. In my research it was analyzed that
Wild Water is a healthy drink and people are more conscious about their health so it is being
consumed regularly by many respondents
G) it clearly analyzed that 62% of the respondents are affected by the advertisements and 38% of
them are not. Advertisement is another marketing strategy and if 62% are being affected it
proves that marketing of Wild Water is effective
H) The major promotional tool which is influencing the customers is Magazines and friends
which is around 32% and 25% respectively, after that the source of awareness among customers
is a mixed response where in 20% from website/blogs, 15% from TV ads and 8% from other
sources.
74

GRAPH NO-4.1(Energy Drink Market share (with sales and availability in retail shops)
NEW-DELHI
WILD
WATER Red Bull Cloud 9 Others
North 8 41 6 11
East 5 20 5 10
West 5 26 18 16
South 3 27 6 11
Central 9 49 5 17
Total/326 30 163 40 65
TABLE NO-4.1 Energy Drink Market share (with sales and availability in retail shops)
75
NorthEast
WestSouth
CentralTotal/326
0
20
40
60
80
100
120
140
160
180
85 5
3 930
41
20 26 2749
163
6 5 186 5
4011 10 16
11 17
65
Wild Water Red Bull Cloud 9 Others

From the above table it can be analyze that out of 326 retail shops, Red Bull has maximum sales
and availability (163 shops), followed by Cloud 9 (40 shops) and then Wild Water (30 shops)
(being in the introductory phase of its life cycle).
I) From the research it is clear that 20% of respondents buy wild water for relieving fatigue, 24%
of them for staying awake, 17% of them daily routine, 24% of them for increasing concentration
and 15% for hangover remedy.
J) In our research it is clear that 22% of the respondents buy Wild Water in nearby convenient
store, 58% of them in super market, 8% of them in drug store and 12% by other means. so it
shows the availability of wild water.
K) 34% of the respondentsprefer to buy their bike drink for energy, 17% of them for price, 12%
of them due to tv commercials, 6% from ads on newspapers, 10% due to marketing campaign,
5% from package, 7% each for brand and taste respectively and 2% due to word of mouth.
L) It is clear that 17% of the respondents spend Rs.100 on WILD WATER weekly, 12% of them
spend Rs.200, 16% of them spend Rs.300, 8% of them spend Rs.400, 26% of them spend Rs.500
and 21% of respondents spend above Rs.500.it shows that people are so fond of Wild Water and
they are being satisfied.
M) From the above table it is clear that 78% of the respondents felt Wild Water is not over
priced and 22% of them felt its cost is high.
76

Price Taste Brand Image Promotion0
5
10
15
20
25
30
13
28
24
10
No. of Respondents
GRAPH NO-4.2(Opinion about the WILD WATER supremacy over the competitors in the
Market)
FACTORS NO. OF
RESPONDENTS
PERCENTAGE
PRICE 13 18%
TASTE 28 37%
BRAND IMAGE 24 32%
PROMOTION 10 13%
TOTAL 75 100%
TABLE NO-4.2(Opinion about the WILD WATER supremacy over the competitors in the
Market)
77

From the above table it is clear that 18% of the respondents felt price as the answer, 37% of them
felt taste is the reason for the supremacy, 32% of them felt its brand image and 13% of them felt
promotion.
N) The research conducted shows that 82% of the respondents accept that there are no
difficulties in finding WILD WATER in market and 18% felt they have difficulties. Also the
satisfaction level is 85% of the respondents are extremely satisfied and 34% are not satisfied
with respect to availability of Wild Water.
4.2 Critical Analysis of Functional Departments:
Functional Analysis of the Company
It includes the Analysis of Different Functions of Beltek Canadian Water ltd. Such as Marketing,
HRM and IT enabled Services.
4.2 Conceptual Framework
4.21 Marketing
Marketing is the essence of all the types of Business Activities. In the absence of this function,
businessmen neither earn profits nor expand the business. So, it is necessary to analyze
Marketing Function of Beltek Canadian Water ltd.
A) In case of Marketing Mix of the company, company offers wide range of products to suit the
needs and demands of the customer taking in mind the age of customer. Company offers 4
products. These products are being designed for a particular segment of customers. All the
flavors are being created according to the need and demand of the customers like wild water do
not have preservatives, they have a very less amount of sugar, it is 100% natural.
78

B) Customer Relationship Management
Customer Relationship Management (CRM) is the process of building and maintaining profitable
relationships with customers by delivering superior customer value and customer satisfaction.
Tha cost of attracting new customers are rising so the company is building profitable long term
relationships with customers in order to retain and grow customers.
C) Advertisement Process
Company is using various types of advertisement campaigns to attract the prospective customers
and expanding their business. The medium like Newspaper, hoardings, posters in shopping malls
etc helps a lot to attract new customers and retain them.
4.22 Human Resource Management
Human Resource is the most crucial asset of the company. It is the management of employees
skills, knowledge abilities, talent, aptitude, creativity and ability.
A) Training
As far as Training is concerned, every new candidate that joins Beltek Canadian Water ltd goes
through a week of induction training. This training Program is called the NEO i.e. New
Employee Orientation. New Employee Orientation (NEO) The NEO program is conducted for
all the new joiners of Beltek Canadian Water ltd. It is basically a week program. The other
training programmes carried out by the company are HR training, Agency training, System
training and Operations training.
79

B) Recruitment and Selection
Recruitment process includes Both Internal and External Recruitment wherein Certain criteria is
to be followed by the company such as eligible candidate must be above 18 years of age, he must
pass 12th with at least 50% marks and a good command over English language.
As far as Selection is concerned, company adopts 4 stages: screening, psychometric test, career
seminar and final seminar. Recruitment and Selection is conducted by HR, Branch Manager and
Functional Head.
C) Safety Policies and Practices
Company laid down certain specified Rules and Regulations for safety policies and practices and
Company regularly follows it. Anyone found breaking the rules is given warning and if repeated
Again, he/she is terminated. Rules and Regulations are meant not only for agent advisors of the
company but also for other employees, no matter how higher positions are they placed.
D) Induction
It involves familiarization of the newly appointed employees to the work environment of the
company as well as to the fellow employees. Orientation programmes may also be in the form of
providing induction training to the new employees where they are familiarized with the work
environment and the fellow employees, the new employees are taught basic techniques or
methods to do the work for which they are recruited, etc.
80

4.23 Use of IT Enabled Services
Company uses various types of IT Services which helps them in reducing operational costs and
cater large market share. Such types of IT service are discussed as under:
A) Lotus 8.5
In this, Company upgraded its email infrastructure from Lotus Notes version 6 to Lotus Notes
version 8.5 with a centralized mail architecture which allowed for easier administration. It also
enabled quicker roll out of new features and functionalities for end users. This centralized
architecture allows for integrating mail messaging with other applications and communication
services leading to a unified communications and collaboration (UCC) infrastructure.
B) Use of Tablets
Company believes that Using ‘Tablets’ is the most Effective tool to save the time and effort of
the employees and lessen the conversion time of closing a meeting or inspection.
C) Interactive Voice Response (IVR)
IVR system implemented by the Company has significantly eased the manner in which
customers can access information about their products. The IVR is programmed to remember
certain basic menu options selected which significantly reduces the navigation time to access the
required information there by enabling a quicker interaction with the company for the customer.
81

5.1 Findings/Results
A) It is revealed that majority of respondents are between 20 and 29 years. From this we can
conclude younger generation and middle age are more interested in Wild Water because it is
thrilling and inclined towards the product.
B) It is clear that most of the users of Wild Water are males mostly because men are addicts to it.
C) It is clear that users are mostly Professional males, 20-35 years of age including some
students because it helps in focusing and staying awake.
D) It shows that Wild Water is placing their products in the appropriate and reasonable price
range and the people of income bracket less than 1, 20,000 can easily afford this product.
E) It clearly shows that majority of the respondents do not participate in any extracurricular
activities.
F) It is clear that in customers there is a high regularity amongst consumption by customers in a
week.
G) It is clear there is an increase in consumption of Wild Water after advertisements and hence
this marketing strategy has benefited.
H) It clearly shows that magazines and friends create high awareness of Wild Water amongst
people.
I) It is clear that there are majority of reasons supporting the consumption such as fatigue, for
staying up and to increase the level of concentration.
J) It is clear that super markets are on top of retailers in the sales of Wild Water energy drink.
82

K) It is clear that the energy drink provides rejuvenation and replenishes energy into the people
consuming it.
L) It is clear that majority of the respondents are around the 500Rs mark and spend around
500Rs on the energy drink.
M) It is clear that red bull energy drink dominates the energy drink market and consumers prefer
wild water over other energy drinks.
N) It is clear that majority of the respondents feel wild water is money to worth product and not
over priced for the quality of the drink.
O) It is clear that there is sample availability of the drink in the market and not much difficulty to
access it.
P) It is clear that wild water is chosen unanimously for its taste over other factors that support to
the strengths of the energy drink.
5.2 Lessons Learnt
My Internship in Beltek Canadian water ltd started on 17th June 2013.As per the program I have
to gain knowledge about the product its features and other things about the industry and
competitors. I grabbed the opportunity to meet different people from diverse backgrounds and
occupations to know about the response of this vitamin drink. I made regular visits to GOLD’S
GYM, COSTA COFFEE, AFFINITY, CINEMAX, TWENTY-FOUR SEVEN etc for collection
of data and analyzing the response of the drink and the availability of stock in various areas
around DELHI.I made around 60 visits in various outlets in a short span of 6 weeks internship.
83

The main contribution of an employee to its organization is to perform its responsibilities given
with 100% effort and honesty. My major contribution was to evaluate the position of the product,
conducting free sampling, analyzing the performance of promoters by surprise visits in outlets
and providing training to staff of outlets where Wild Water was present. For the goodwill of the
company I was always honest to tell all the facts and benefits of the product to the customer and
convince them for the right product that best suited them. Another task which I used to perform
from the office was searching of various events in the city like an art- exhibition, pool party,
celebrity visit to any place etc for the purpose of promotion of Wild water. I am very much
satisfied with the level of work, I have done for the company and I am also able to keep my
senior manager happy through my dedication, hard work, and performance. I and my seniors are
happy with my contribution to the organization.
84

5.3Suggestions
5.31 The company should come up with new, better and attractive flavors to attract all segments
of the market.
5.32 The company can come up with different beverages other than energy drinks and vitamin
water.
5.33 The company can reduce prices and introduce promotional campaigns so larger mass can
try the product.
5.34 Wild water lemonade is affiliated with caffeine industry, which might help them exploit
coffee industry.
5.35 The packaging should help retain the chillness of the drink without which it is tasteless.
85

QUESTIONNAIRE
This information is required for the successful completion of a project based on- ‘A Study on
Customer Satisfaction and Marketing Effectiveness of Red Bull energy drink, Bangalore.’ I
would appreciate all your help in generating the response to this questionnaire. Thank you.
RESPONDENT INFORMATION
Name:
1. Age:
2. Gender : Male Female
3. Occupation:
Student Government service
Professional Self employed other
4. Annual Income:
Less than 1, 20,000 1, 20,001-3, 60,000
3, 60,001-7, 20,000 Above 7, 20,000
5. Are you involved with any extracurricular activities on campus or out of office? Social events you participate in?
Yes No
6. Have you consumed an energy drink before?
Yes No
-If “yes” why? / If “No” why not?
Yes No
7. Have you tried the Energy Drink “Wild Water”?
Yes No
86
8. How often do you consume Wild Water?
Everyday 2-3 days a week 4-5 days a week
Once a week Every2-3 weeks Once a month
Less than above
9. Has marketing or advertising affected your consumption of Wild Water?
Yes No
10.Please specify your source of awareness of Wild Water?
Magazines TV Ads Friends
Website/blogs Other Sources (Please specify)
11.Why do you buy Wild Water?
For Relieving Fatigue For staying Awake
Daily Routine Increase Concentration
Hangover Remedy Others
87
12.Where do you usually buy Wild Water?
Convenience Store Supermarket Drug Store
Others
13.What are important factors to choose Wild Water? Please provide your top 3 answers.
Energy Price TV Commercial
Ads on newspaper/magazine Marketing Campaign
Package Brand
Taste Word of Mouth
14.How much do you usually spend on Wild Water per week?
Range of Rs.100 Range of Rs.200 Range of Rs.300
Range of Rs.400 Range of Rs.500 More than above
15.Would you prefer any other energy drink over Wild Water?
Yes No
If Yes why?
16.Do you think Wild Water is over priced?
Yes No
88

17.Have you ever faced difficulties in finding Wild Water?
Yes No
Are you satisfied with availability of Wild Water in market?
Extremely satisfied Not at all satisfied
18.What do you think is the Wild Water supremacy over its competitors in the market?
Price Taste Brand Image Promotion
19.Which company do you think has the highest market share in the energy drink segment?
Red Bull Wild Water
Cloud 9 Others
20.Any Suggestions
89

BIBLIOGRAPHY
Books Referred
Marketing Management, 13th edition - Philip Kotler.
Survey Research Method - Charles Babbie.
Magazines Referred
The Red Bulletin
Websites Referred
www.google.com
www.wiiings.com
www.drinkwildwater.com
www.wikipedia.com
90