Embed Size (px)
Citation preview
Widianto, K. Hairiah, W.S. Dewi, Hascaryo, D. Saputra, F.K. Aini, D. Suprayogo, N.Khasanah and M. van Noordwijk
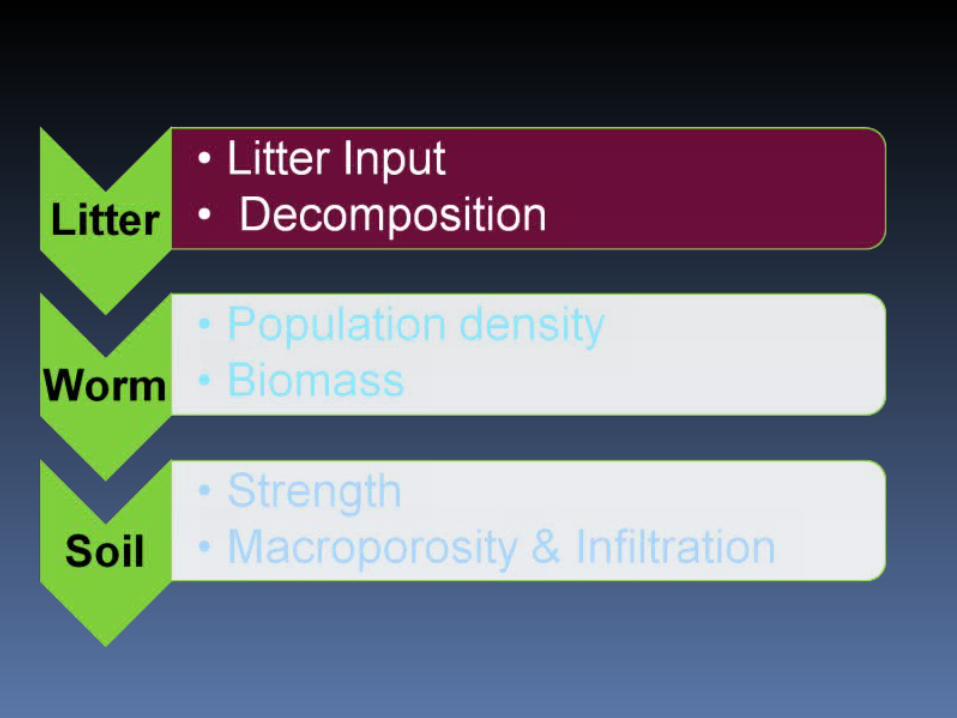
LLitter layer, population density of earthworm and soil macroporosity
UNIV. BRAWIJAYAUNIV. BRAWIJAYA
Land Cover in East Java (Malang)
Land Cover in Sumatra (West Lampung)
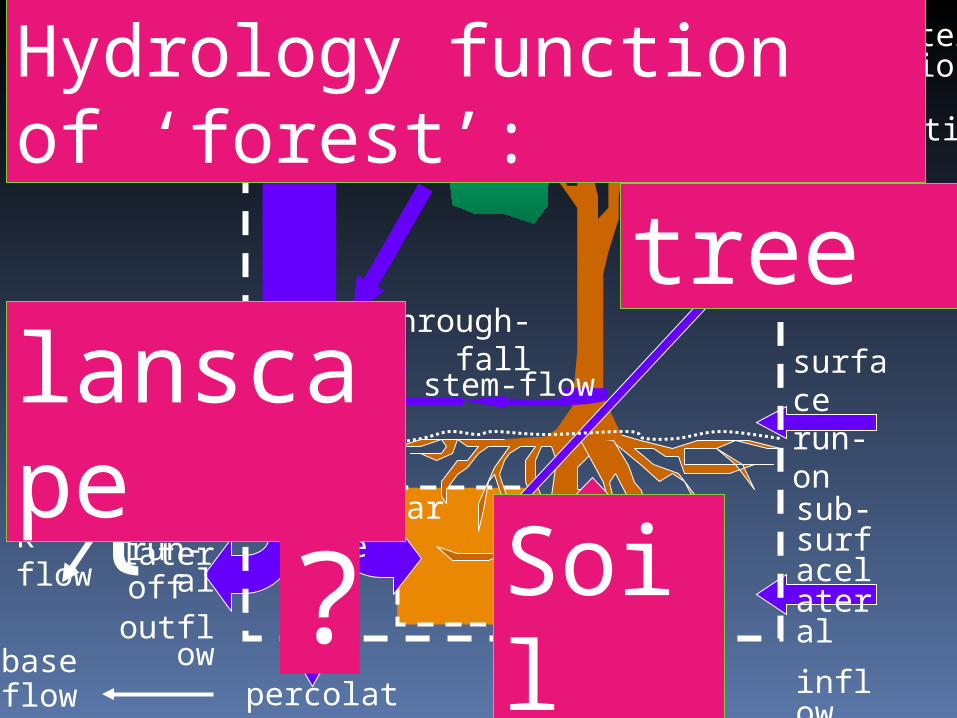
stem-flow
through-fall
rainfall cloudinterception
lateral
outflow
percolation
rechargeinfiltrasi
surfaceevaporation
transpiration
canopy waterevaporation
uptake
Quick flow
baseflow
{
surface run-on
sub-surfacelateral
inflow
surface run-off
Flow:
tree
Soil
Hydrology function of ‘forest’:
lanscape
?
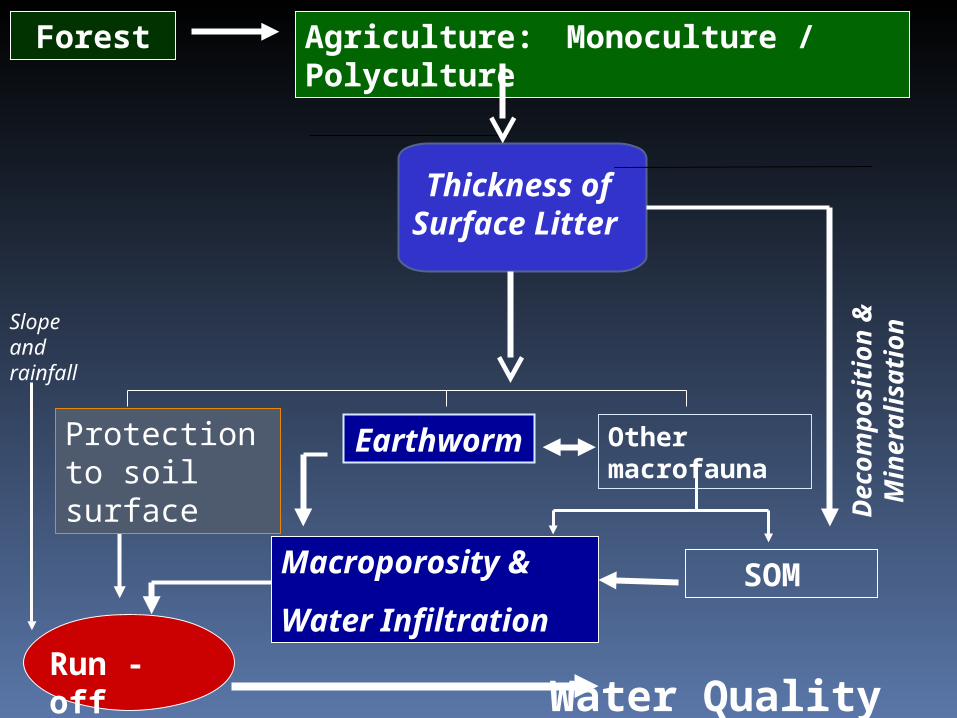
Forest Agriculture: Monoculture / Polyculture
De
co
mp
osi
tio
n &
M
ine
ralis
atio
n
Water QualityRun - off
Other macrofauna
Earthworm
SOM Macroporosity &
Water Infiltration
Thickness of Surface Litter
Slope and rainfall
Protection to soil surface
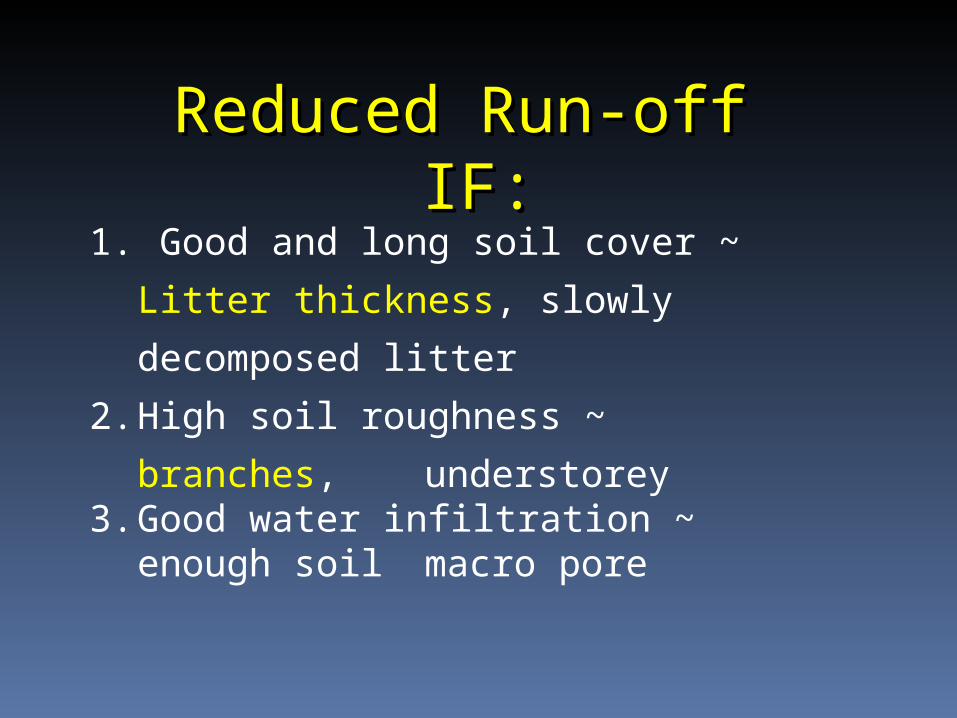
Reduced Run-off IF:Reduced Run-off IF:
1. Good and long soil cover ~ Litter
thickness, slowly decomposed litter
2. High soil roughness ~ branches,
understorey3. Good water infiltration ~ enough soil
macro pore
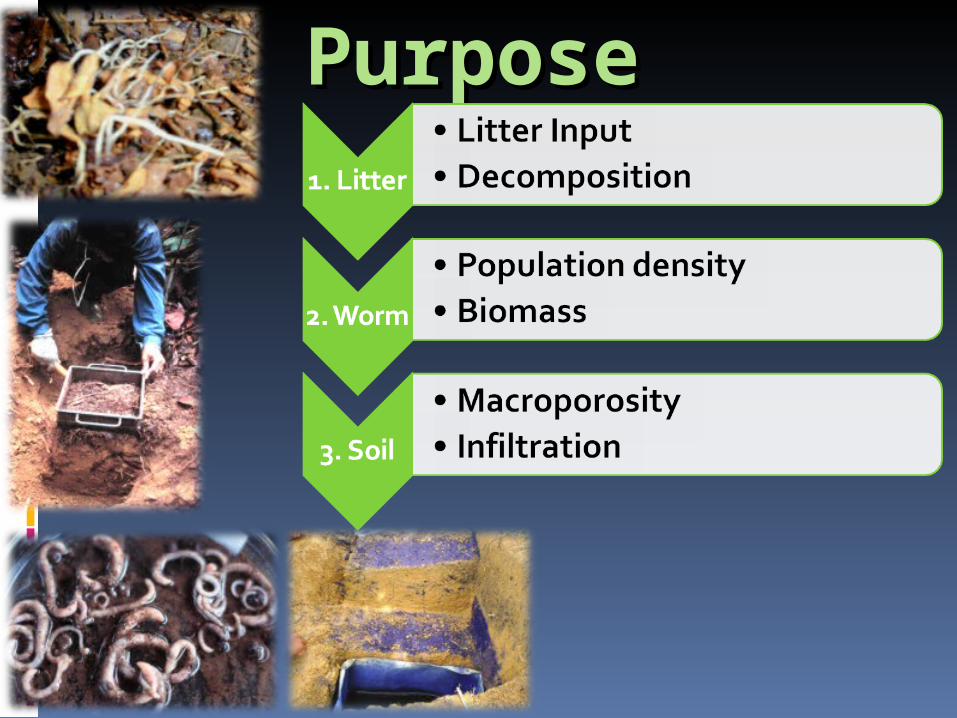
PurposePurpose
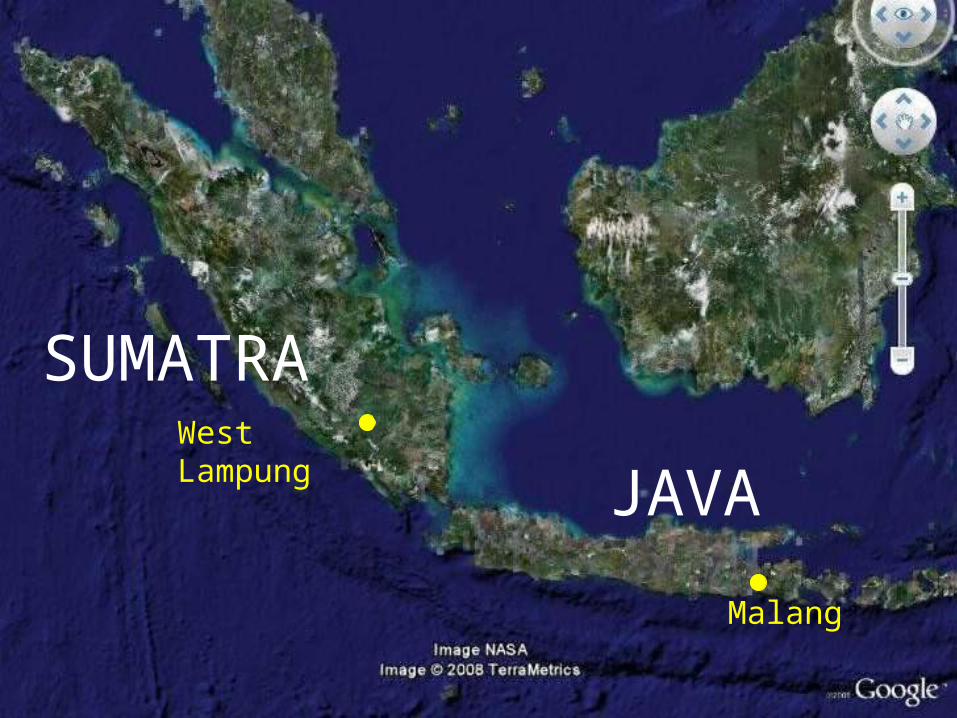
West Lampung
Malang
SUMATRA
JAVA
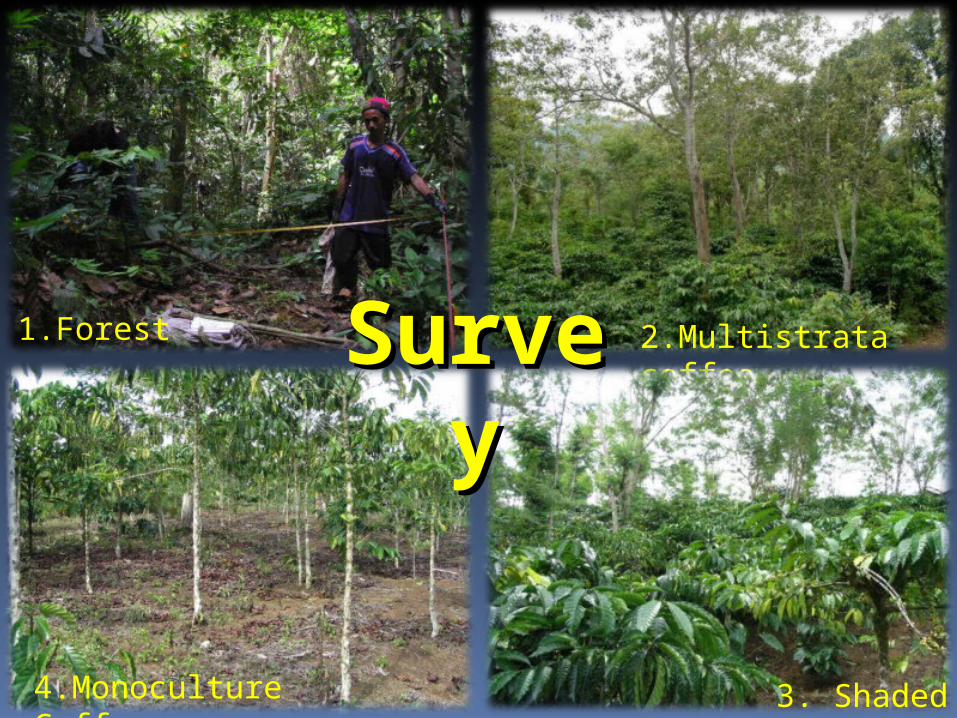
2.Multistrata coffee
3. Shaded coffee
1.Forest
4.Monoculture Coffee
SurveySurvey
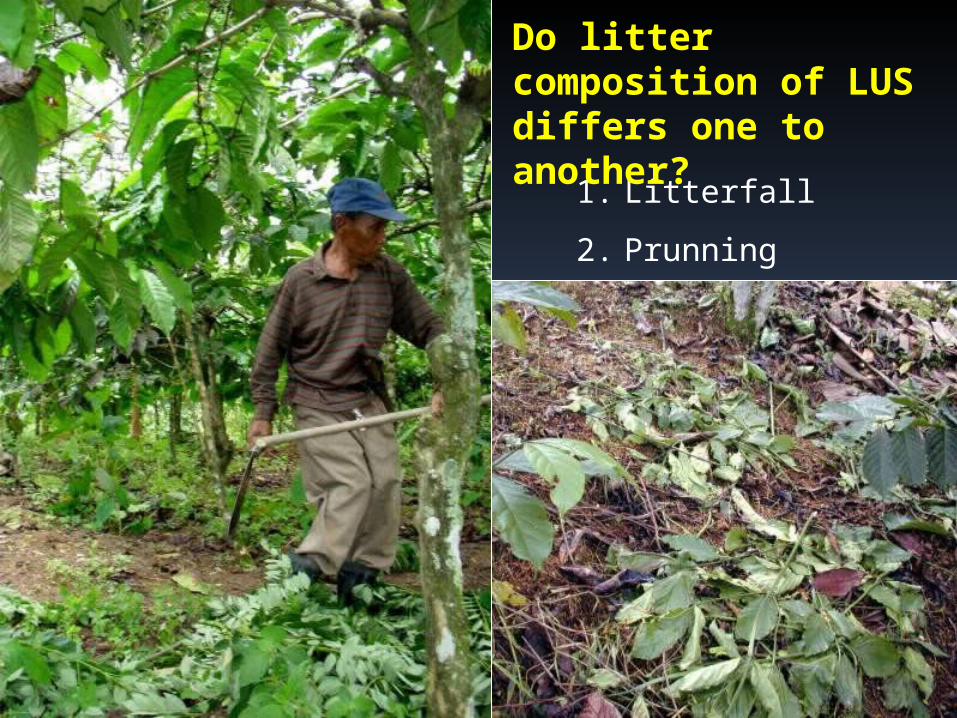
1. Litterfall
2. Prunning
Do litter composition of LUS differs one to another?
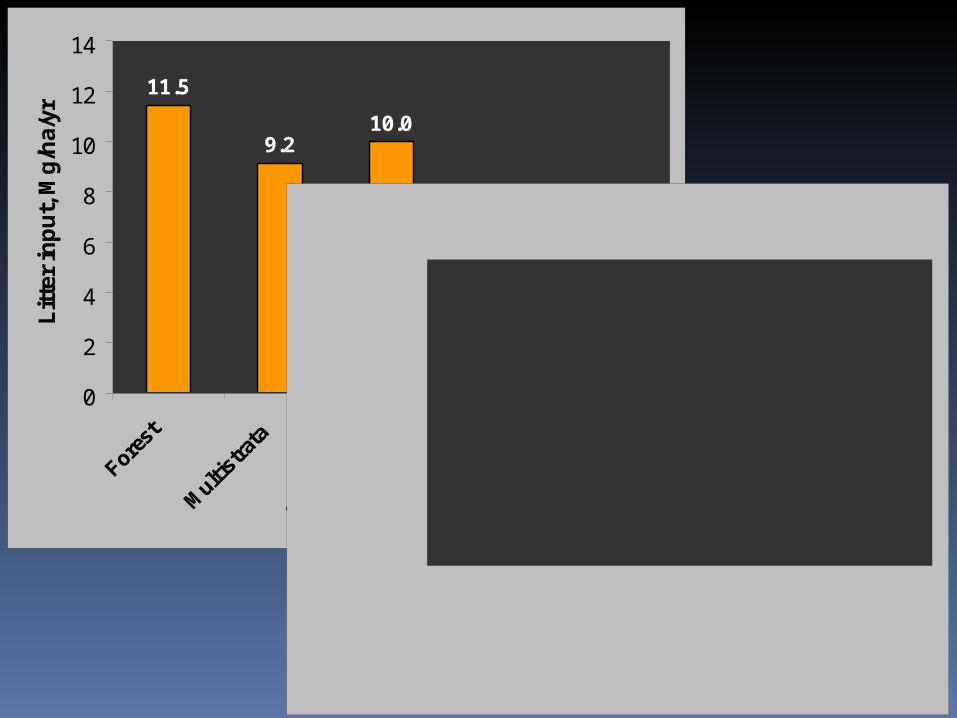
11.5
9.210.0
6.1
3.6
0
2
4
6
8
10
12
14
Fores
t
Mul
tistra
ta
Shaded
-Par
Shaded
-Glir
i
Coffee
Mono
Lit
ter
inp
ut,
Mg
/ha/
yr
0%
20%
40%
60%
80%
100%
Forest
Mult
istra
ta
Shade
d -Par
Shade
d -Glir
i
Coffe
e M
ono
Lit
ter
co
mp
os
itio
n
Branch Leaf Flower Fruit
Annual Litter Input in Sumatra
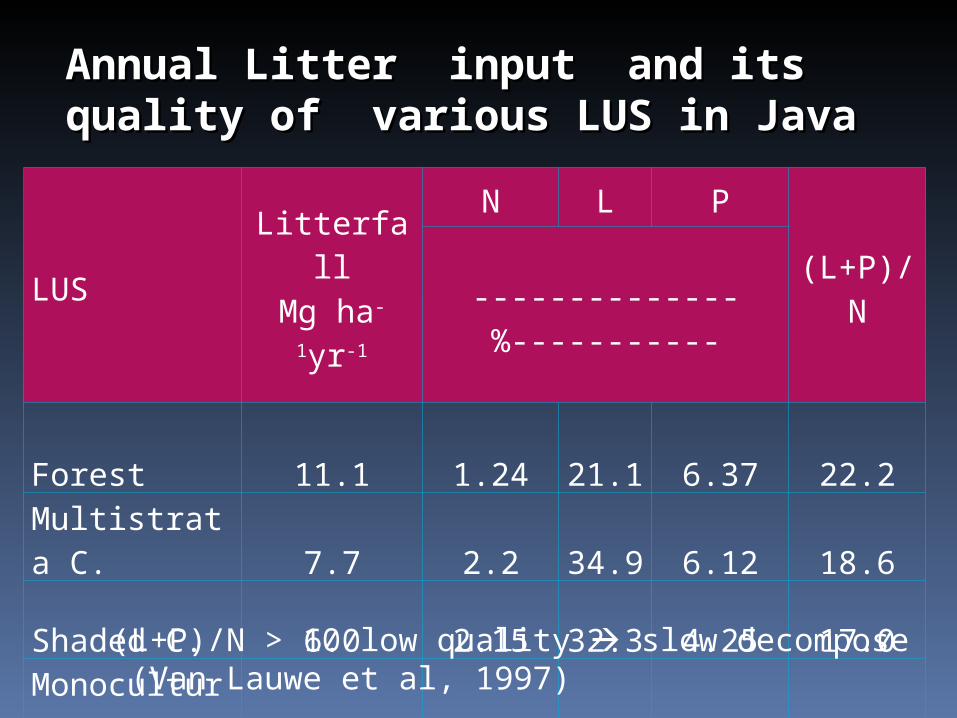
LUSLitterfall
Mg ha-1yr-1
N L P(L+P)/N
--------------%-----------
Forest 11.1 1.24 21.1 6.37 22.2
Multistrata C. 7.7 2.2 34.9 6.12 18.6
Shaded C. 6.0 2.15 32.3 4.25 17.0Monoculture C. 3.9 1.95 37.7 5.19 22.0
Annual Litter input and its quality of Annual Litter input and its quality of various LUS in Javavarious LUS in Java
(L+P)/N > 10 low quality slow decompose (Van Lauwe et al, 1997)
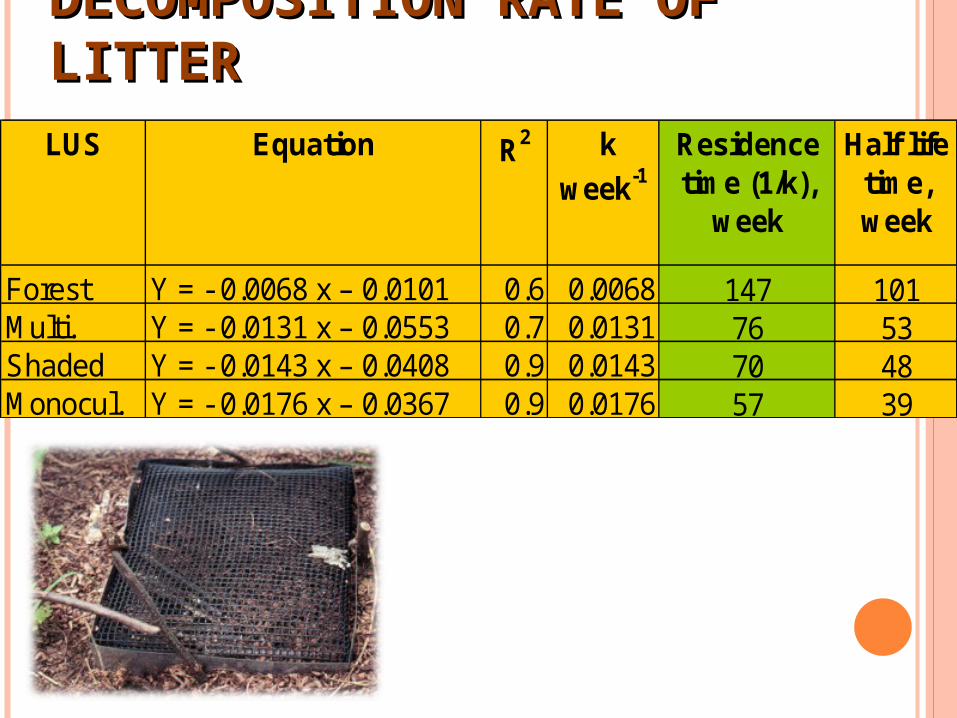
DECOMPOSITION RATE OF DECOMPOSITION RATE OF LITTERLITTERLUS Equation R2 k
week-1
Residence time (1/k),
week
Half life time, week
Forest Y = - 0.0068 x – 0.0101 0.6 0.0068 147 101Multi. Y = - 0.0131 x – 0.0553 0.7 0.0131 76 53Shaded Y = - 0.0143 x – 0.0408 0.9 0.0143 70 48Monocul. Y = - 0.0176 x – 0.0367 0.9 0.0176 57 39
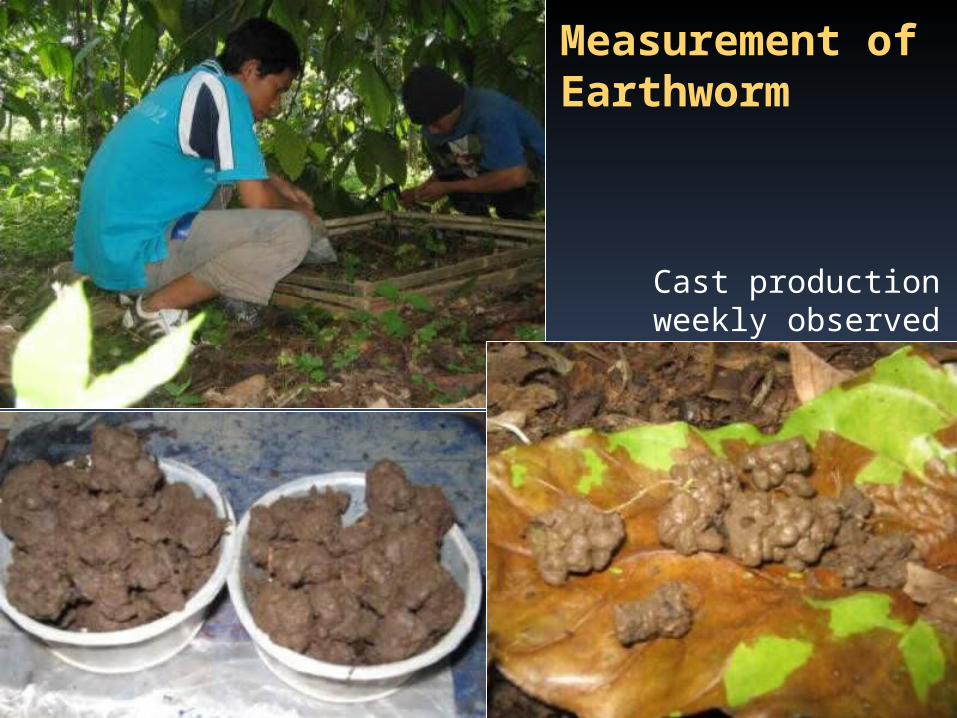
Cast production weekly observed
Measurement of Earthworm
Klitelum
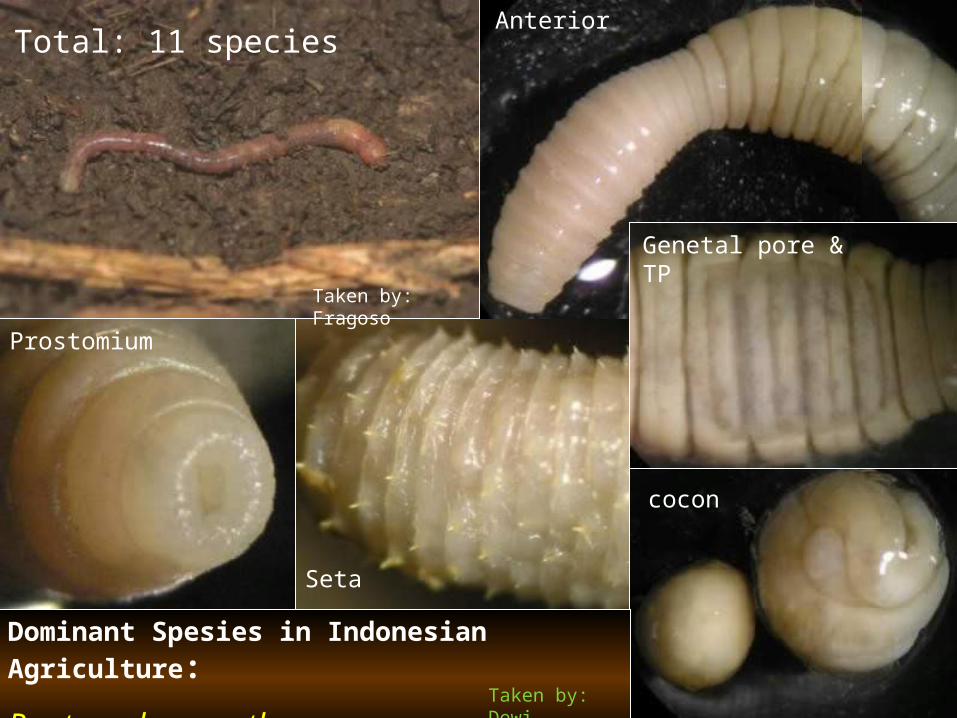
Dominant Spesies in Indonesian Agriculture:
Pontoscolex corethrurus
Prostomium
Seta
cocon
Genetal pore & TP
Anterior
Taken by: Dewi
Taken by: Fragoso
Total: 11 species
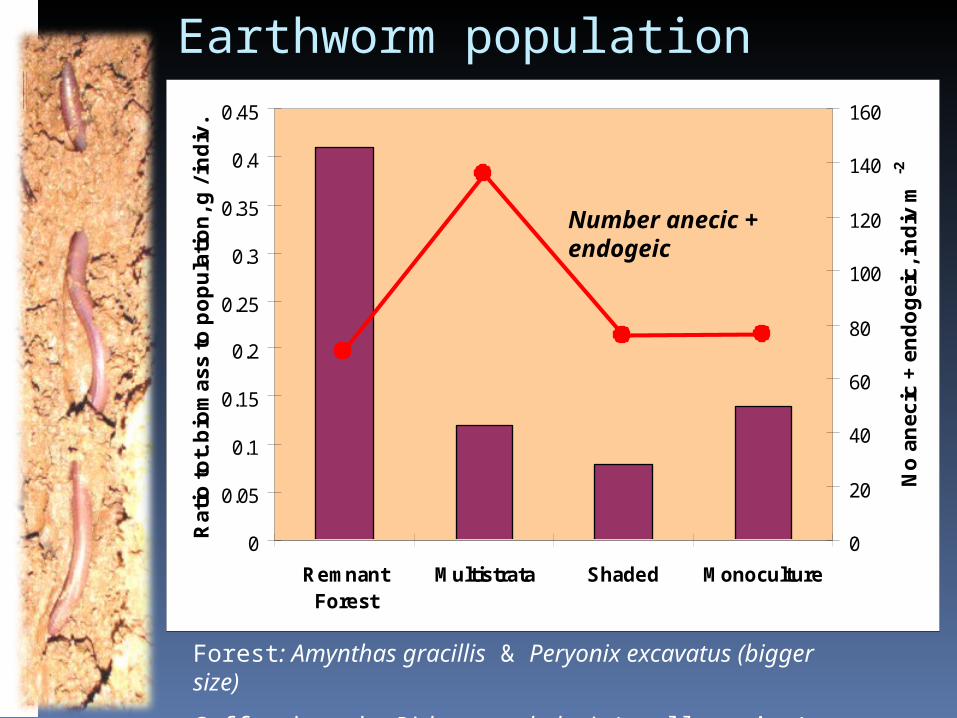
Earthworm population
0
0.05
0.1
0.15
0.2
0.25
0.3
0.35
0.4
0.45
RemnantForest
Multistrata Shaded Monoculture
Ra
tio
to
t. b
iom
as
s t
o p
op
ula
tio
n, g
/ in
div
.
0
20
40
60
80
100
120
140
160
No
an
ec
ic +
en
do
ge
ic, i
nd
iv m
-2
Number anecic + endogeic
Forest: Amynthas gracillis & Peryonix excavatus (bigger size)
Coffee based: Dichogaster bolaui (smaller size)
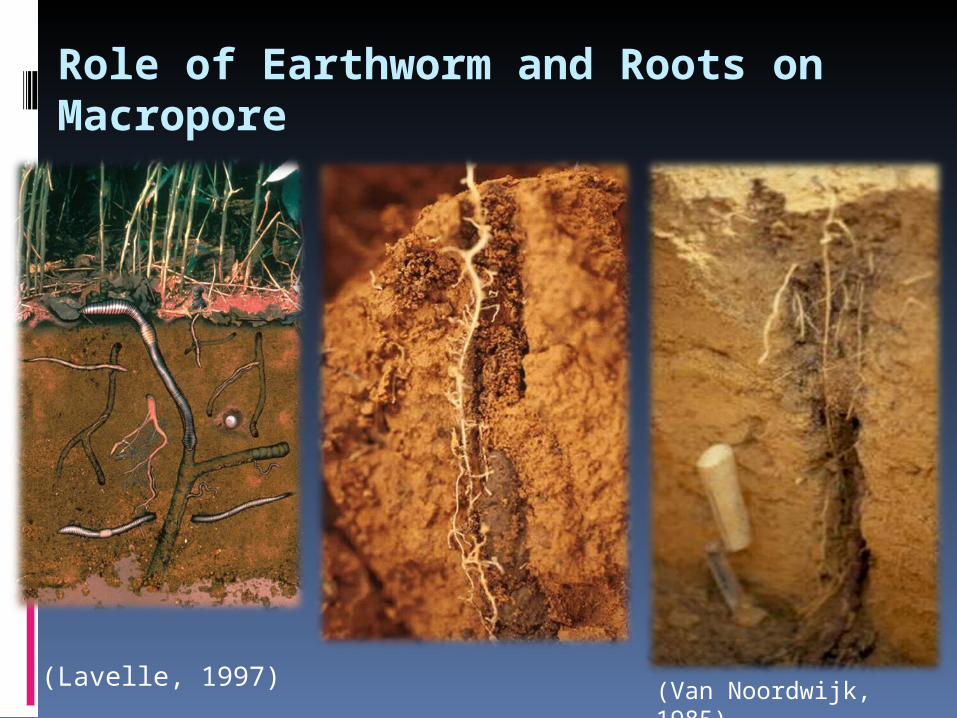
(Lavelle, 1997) (Van Noordwijk, 1985)
Role of Earthworm and Roots on Macropore
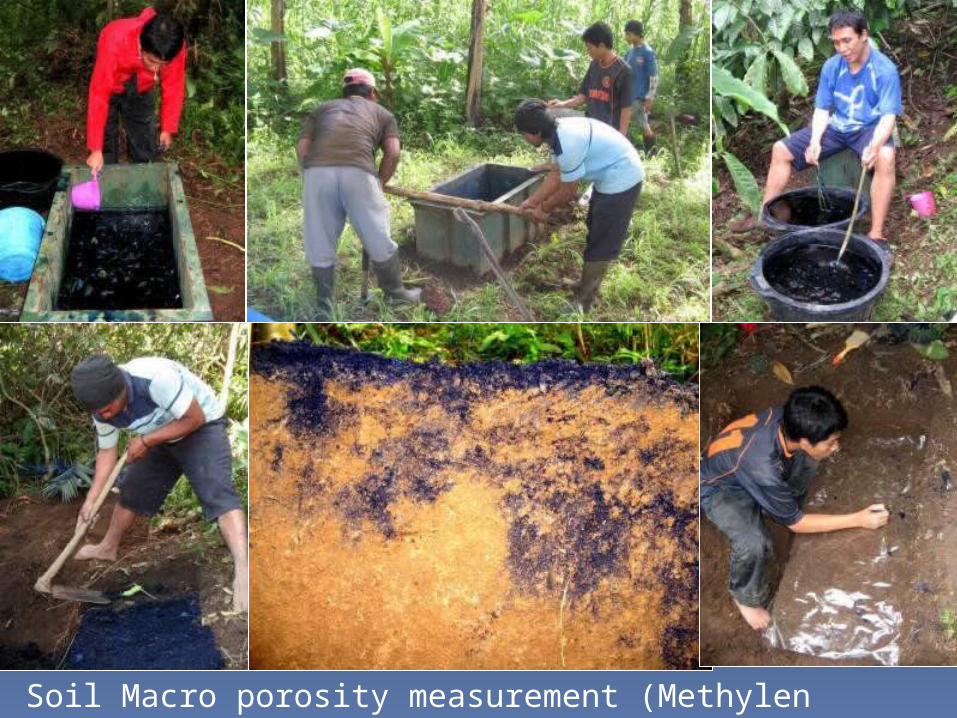
Soil Macro porosity measurement (Methylen Blue), Feb. 2008
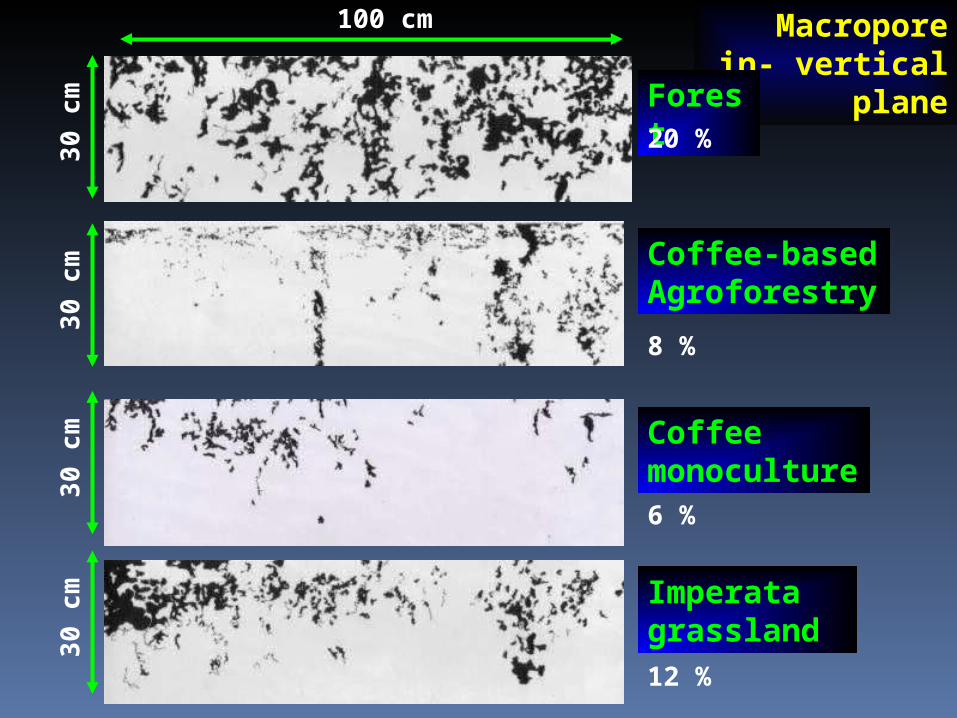
Macropore in- vertical plane
Coffee monoculture
Imperata grassland
Coffee-based Agroforestry
Forest
100 cm
30
cm
30
cm
30
cm
30
cm
20 %
8 %
6 %
12 %
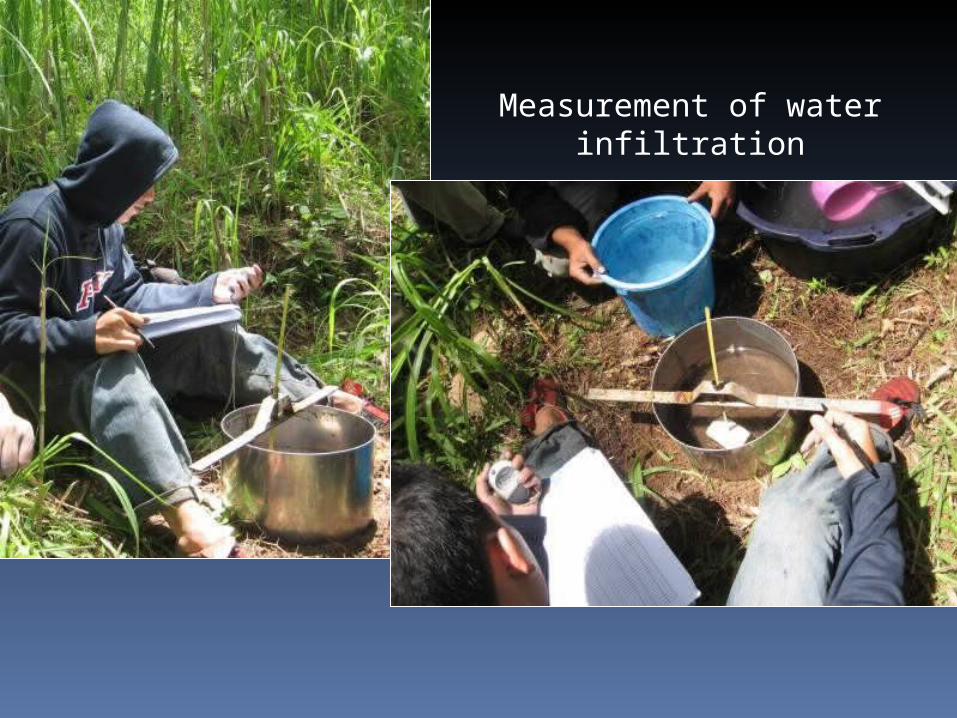
Measurement of water infiltration
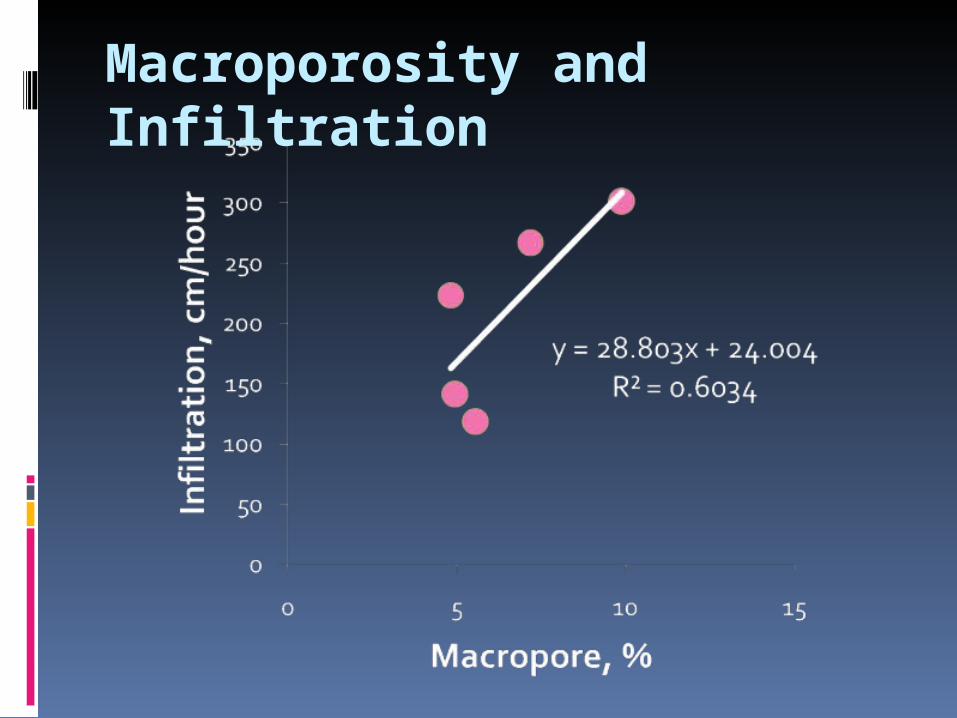
Macroporosity and Infiltration
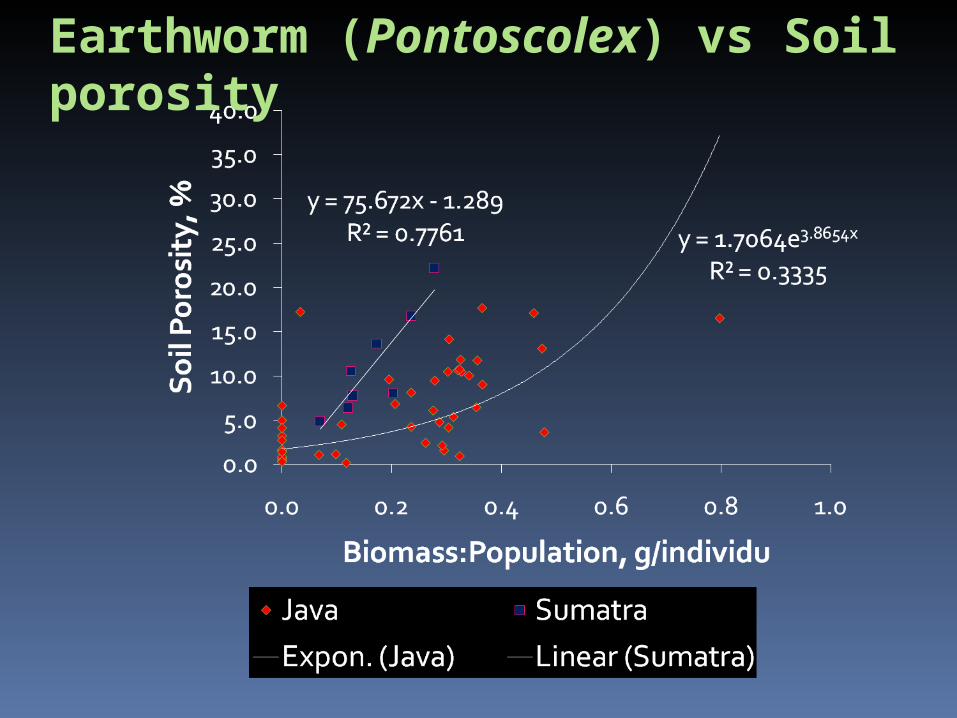
Earthworm (Pontoscolex) vs Soil porosity
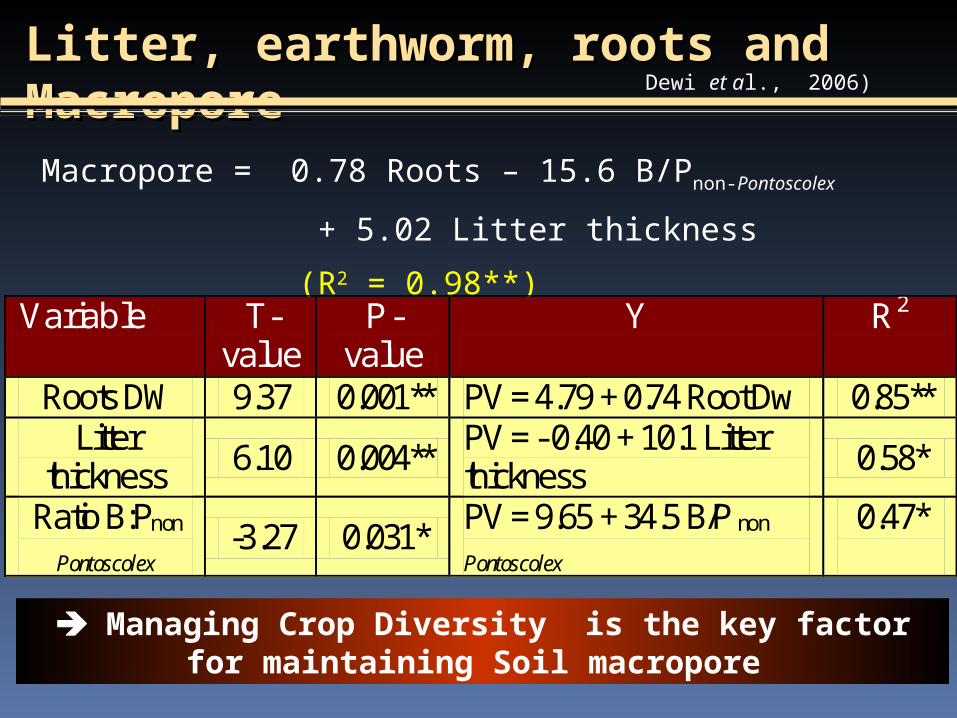
Macropore = 0.78 Roots – 15.6 B/Pnon-Pontoscolex + 5.02
Litter thickness (R2 = 0.98**)
Managing Crop Diversity is the key factor for maintaining Soil macropore
Variable T-value
P-value
Y R2
Roots DW 9.37 0.001** PV = 4.79 + 0.74 Root Dw 0.85** Litter
thickness 6.10 0.004** PV = - 0.40 + 10.1 Litter thickness 0.58*
Ratio B:Pnon
Pontoscolex -3.27 0.031* PV = 9.65 + 34.5 B/P non
Pontoscolex 0.47*
Litter, earthworm, roots and MacroporeLitter, earthworm, roots and MacroporeDewi et al., 2006)
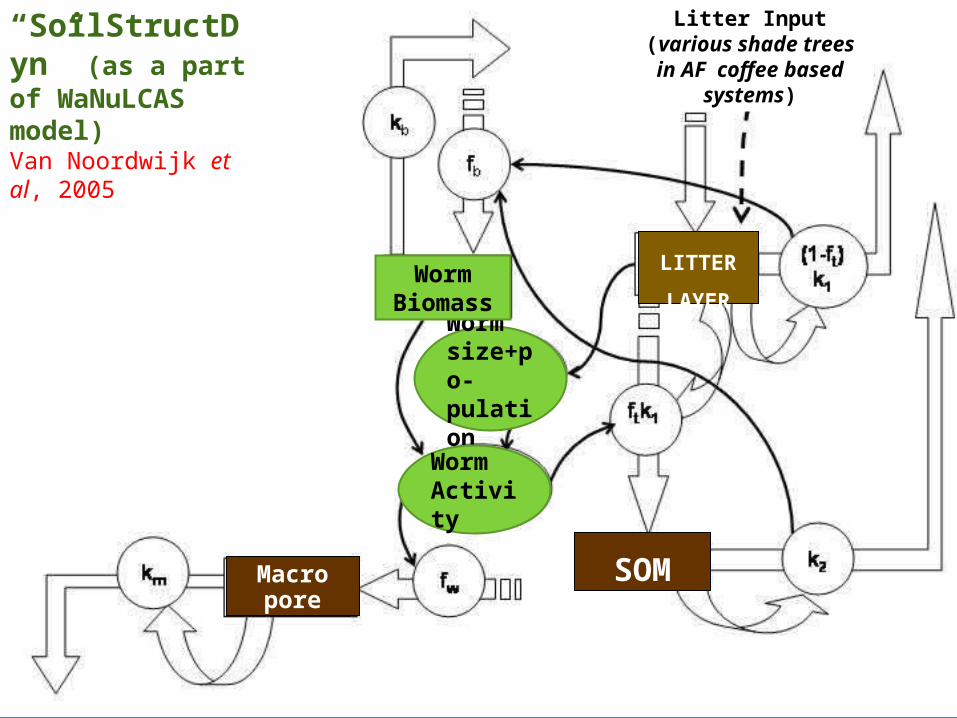
Worm size+po-pulation
Worm Biomass
SOM
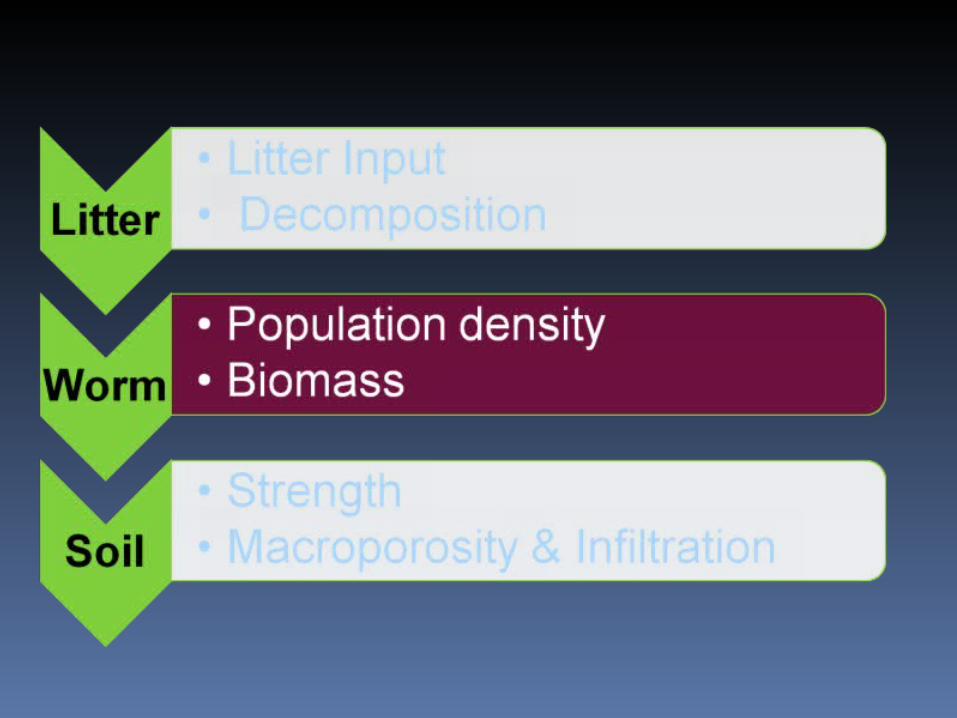
LITTER
LAYER
Litter Input (various shade trees in AF
coffee based systems)
Worm Activity
Macro pore
“SoilStructDyn” (as a part of WaNuLCAS model)Van Noordwijk et al, 2005
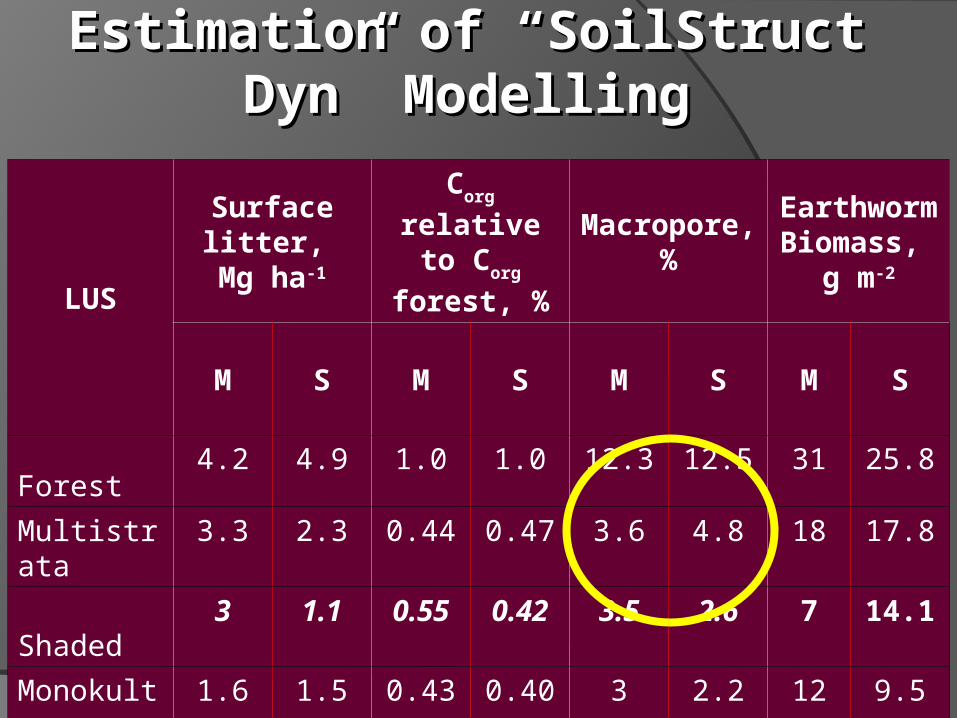
LUS
Surface litter,
Mg ha-1
Corg relative
to Corg forest,
%
Macropore, %
EarthwormBiomass,
g m-2
M S M S M S M S
Forest4.2 4.9 1.0 1.0 12.3 12.5 31 25.8
Multistrata3.3 2.3 0.44 0.47 3.6 4.8 18 17.8
Shaded3 1.1 0.55 0.42 3.5 2.6 7 14.1
Monokulture
1.6 1.5 0.43 0.40 3 2.2 12 9.5
Estimation of “SoilStruct Dyn” Estimation of “SoilStruct Dyn” ModellingModelling
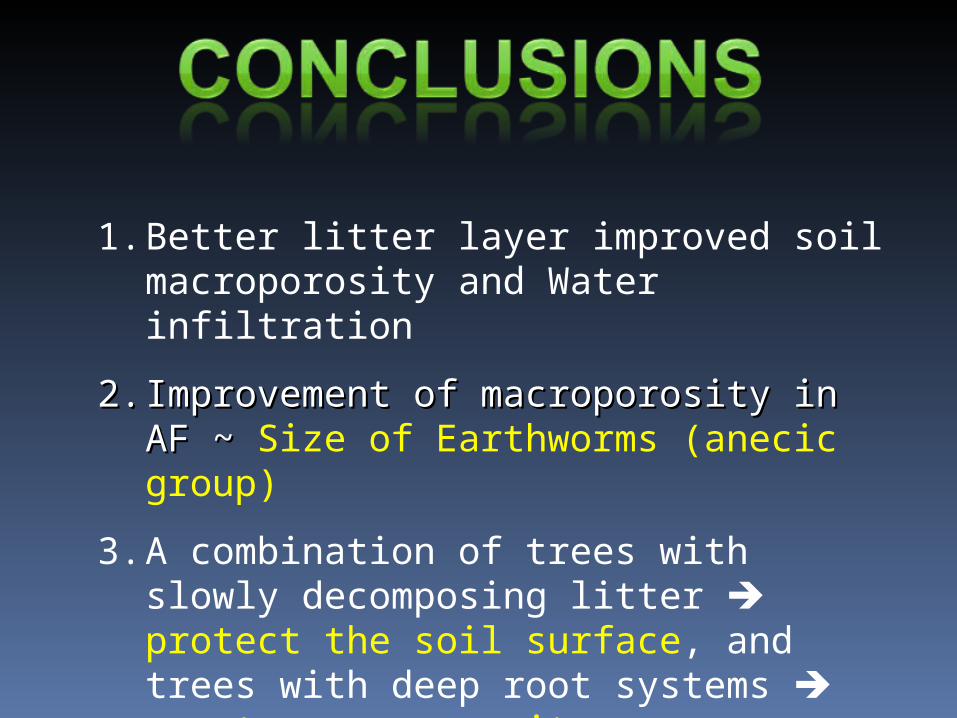
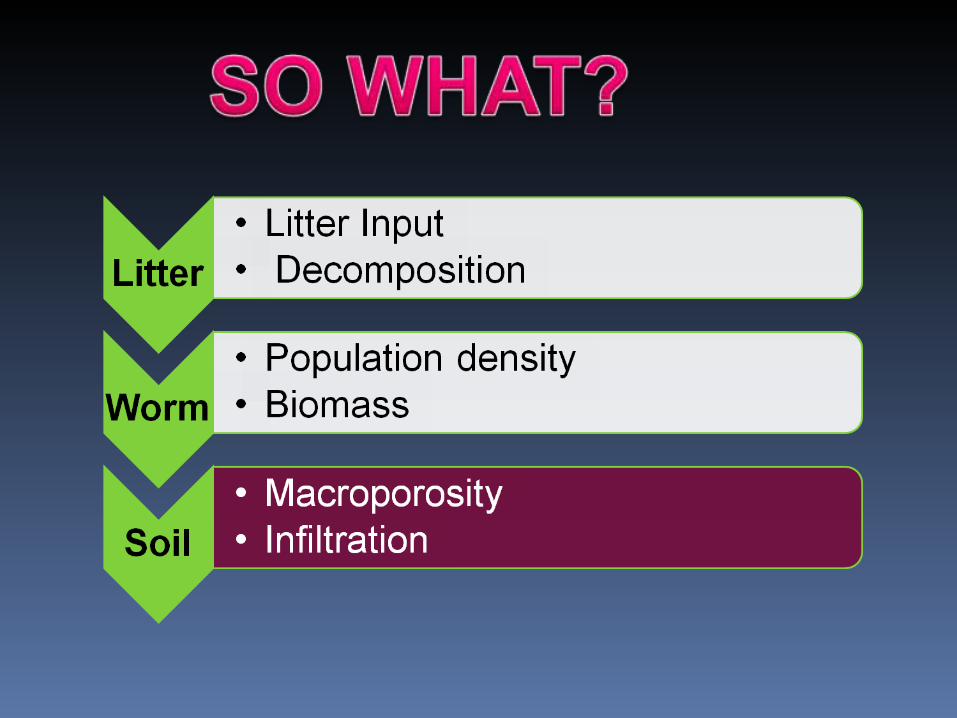
1. Better litter layer improved soil macroporosity and Water infiltration
2.2. Improvement of macroporosity in AF ~ Improvement of macroporosity in AF ~ Size of Earthworms (anecic group)
3. A combination of trees with slowly decomposing litter protect the soil surface, and trees with deep root systems create macroporosity
This activity was funded by ACIAR- ICRAF S.E. Asia, Ministry of Education (DIKTI- A2 Program) and CIFOR
- Tropical Forest and Climate Change Adaptation (TroFCCA) project