Embed Size (px)
Citation preview
WIDER Working Paper 2016/174
Agro-processing and horticultural exports from Africa
Emiko Fukase1 and Will Martin2
December 2016
1 World Bank, Washington DC, United States; 2 International Food Policy Research Institute, Washington DC, United States, corresponding author: [email protected].
This study has been prepared within the UNU-WIDER project on ‘Industries without smokestacks’, which is part of a larger research project on ‘Jobs, poverty, and structural change in Africa’.
Copyright © UNU-WIDER 2016
Information and requests: [email protected]
ISSN 1798-7237 ISBN 978-92-9256-218-2
Typescript prepared by Lesley Ellen.
The United Nations University World Institute for Development Economics Research provides economic analysis and policy advice with the aim of promoting sustainable and equitable development. The Institute began operations in 1985 in Helsinki, Finland, as the first research and training centre of the United Nations University. Today it is a unique blend of think tank, research institute, and UN agency—providing a range of services from policy advice to governments as well as freely available original research.
The Institute is funded through income from an endowment fund with additional contributions to its work programme from Denmark, Finland, Sweden, and the United Kingdom.
Katajanokanlaituri 6 B, 00160 Helsinki, Finland
The views expressed in this paper are those of the author(s), and do not necessarily reflect the views of the Institute or the United Nations University, nor the programme/project donors.
Abstract: Sub-Saharan African exports of horticultural and processed agricultural products are growing in line with the major shift towards these products in world markets. Continued growth in these exports may be vitally important for expanding returns from African agriculture and for increasing its overall exports. Policy reforms such as reductions in the tariff escalation facing Africa, improvements in the productivity of agricultural processing, and reductions in trade barriers within Africa and beyond would all further stimulate exports of processed agriculture. While essential, expansion of these exports should be regarded as complements to—rather than substitutes for—development of other dynamic export sectors.
Keywords: Africa, agro-processing, trade, horticulture JEL classification: F13, F17, F63, Q17
Acknowledgements: This work was undertaken as part of the UNU-WIDER project on ‘Industries without Smokestacks (IWSS)’. We would like to thank Richard Newfarmer, John Page, and Finn Tarp for guidance and suggestions; Jonathan Nelson and participants in Authors’ Workshop in Helsinki for useful comments. We are also grateful for support from the CGIAR Research Programme on Policies, Institutions, and Markets (PIM) led by the International Food Policy Research Institute (IFPRI).
1
1 Introduction
Agricultural exports from Sub-Saharan Africa (SSA)1 include a much larger share of bulk agricultural exports than is the norm on world markets where processed products have come to dominate. In looking at how Africa might move beyond traditional bulk exports and the resource-based exports which are also disproportionately important in Africa, a few questions appear to be key. Should African exports move into labour-intensive manufactures of the type that have dominated the export-led growth of Asian economies from Hong Kong, Korea, and Taiwan (China), through China, Bangladesh, Cambodia, and Vietnam (Page 2012; Newman et al. 2016b)? Should they pursue alternative approaches such as adding value to existing agricultural exports, or developing new high-value agricultural exports? Or should policy makers undertake strategies to encourage entrepreneurs to look everywhere for opportunities, recognizing that it will often be difficult to find successes, but that the rewards from identifying a highly successful export are very great (Hausmann and Rodrik 2003; Easterly and Reshef 2010)?
While it is well known that the share of the agricultural sector in an economy typically declines with economic growth, it is less known that the share of the agro-processing sectors in GDP tends to increase as local consumption shifts from raw, starchy staple foods to foods such as vegetables, fruits, and meats and as food consumed comes to embody more services (da Silva et al. 2009). We examine whether SSA is following this pattern and whether agricultural exports from Africa are moving from bulk products to processed and horticultural goods. Given SSA’s current income, is this an area in which Africa is lagging and potentially large gains can be made? Or are African exporters already acting to exploit potential gains?
Export growth is vitally important for a wide range of reasons, as it promotes economic growth, creates jobs (Fukase 2013), and is a source of the foreign exchange needed to import goods that cannot readily be produced locally. Domestic and international policies, however, influence both the level and the mix of products that are traded. In recent years, the ‘trade in tasks’ in the new wave of globalization (Baldwin 2006) appears to have been creating new opportunities for African countries to tap into export markets, as they enjoy a number of location-specific comparative advantages. How should African governments act to influence the development of non-traditional exports such as those from agro-processing operations, and/or high-value export crops such as horticultural products?
This paper analyses the principal features of agro-processing and horticultural exports from SSA and explores policy alternatives based on simulation analyses. We first provide a conceptual section focusing on changing patterns of processing and exports (section 2). We then turn to examine how the pattern of exports from Africa compares with the pattern in other regions (section 3). Following that, we examine the directions of trade in African agricultural exports and the patterns of protection facing, and imposed by, African countries (section 4). Next, we turn to simulation exercises to examine the impacts of potential reforms on exports of processed and horticultural exports from Africa (section 5). With this as background, we turn to consider the options for policy makers in Africa (section 6). The final section presents a brief conclusion (section 7).
1 The focus of this paper is SSA countries. Throughout the paper, we use the terms ‘SSA’ and ‘Africa’ interchangeably.
2
2 Changing patterns of processing and exports
Prior to the Industrial Revolution and the development of steam transport, international trade was very limited because of high transport and communication costs. Some very high value-to-weight items such as spices and gemstones were traded over long distances, but most foods and manufactures were produced locally. Basic production patterns and income levels were very similar across the world.
As noted by Baldwin (2006), the first wave of globalization frequently involved the production of raw materials in developing countries, with the processing of these products into final manufactured goods generally taking place through vertically integrated production processes in industrial countries. During this phase of industrialization, communications were not sufficiently well-developed to allow coordination of activities at a distance, and the capital needed for industrial development tended to be most readily available in the industrial countries. This pattern of industrialization appeared to generate many gains from learning-by-doing in the industrial countries and to contribute to a major divergence in income levels, with incomes in the industrial countries rising far above the levels in developing countries.
Developing countries, understandably, were unhappy with this model of industrial development and frequently tried to develop their own integrated industrial sectors, often by creating incentives to process the raw materials that they produced as suggested by Hamilton (Hamilton 1791). Unfortunately, this typically proved to be very difficult to achieve without excessive cost and loss to the producers of raw materials. Even where plans and prototypes of processing plants from other countries were available, it frequently proved difficult to operate them successfully (Hausmann and Rodrik 2003).
During this first phase of globalization, the initial processing stages needed to preserve, or to lower, the weight of raw material exports were established in producing areas. Activities of this type include: cotton ginning; processing coffee cherries into dry coffee beans; initial processing of tea; and slaughter of livestock. Some export-oriented processing activities going beyond this stage were undertaken in developing countries, such as the transformation of cotton into textiles in India and Pakistan, but these were the exception rather than the rule. Sometimes, these activities were artificially induced by imposing taxes or quantitative restrictions on exports of raw materials—frequently under the banner of ‘value adding’. A key problem with this approach is that—unless the activity can be performed efficiently in the country—the associated high processing costs reduce the amount available for payment to the producers of the raw material. This is both inefficient and inequitable when the suppliers of the raw material are small, low-income producers. Unfortunately, this problem was quite common when countries sought to increase the processing of their commodities—whether for export or, more commonly, for domestic consumption—because many processing activities were capital and skill intensive and difficult to undertake economically in countries very poorly endowed with capital and skilled workers.
In recent years, changes in the costs and allocation of factors have created new opportunities for developing countries in both industrial production and further processing of agricultural commodities. Lower transport and communication costs and increased mobility of people have made it possible for more parts of the production process to be conducted in different locations, depending upon the competitiveness of the particular activity in that location. Production of garments, for example, may involve: growing cotton in West Africa where agro-ecological conditions are particularly suited; making yarn and fabric (likely using blends of cotton and other fibres) in China; assembling garments
3
in Bangladesh; and enabling the transfer of information, such as the designs for clothes and the authorization of production samples, to take place over great distances. To exploit cost advantages created by these developments, firms from more advanced countries are increasingly willing to bring the capital and knowledge needed for successful production via foreign direct investment. This can obviate the very long process of learning otherwise needed to establish an entirely new export activity (Hausmann and Rodrik 2003).
This new approach to production has opened up opportunities for developing countries not available under the earlier approach to industrialization. Countries such as China, Vietnam, and Bangladesh have developed export-oriented manufacturing systems that are deeply engaged in this production system. Thailand has been very active in agro-processing, frequently using domestically produced products, but sometimes using imported inputs. This approach involves an important change in policy mindset from the traditional approach. In Eat Asia, it is a dynamic process—frequently termed the flying-geese model—where countries at the earliest stage of the development process undertake relatively simple activities handed down from the earlier industrializers, who move progressively up the ladder of skill and capital requirements.
This new form of industrialization has been associated with a dramatic change in the distribution of world income, with countries that have engaged in this process raising their average incomes and lowering poverty rapidly. Unhappiness about this approach to development appears to be emerging in high-income countries, based on perceptions about loss of manufacturing jobs to developing countries.
The unbundled approach to global value chains involves much greater transfer of materials than the traditional approach and hence is more demanding of logistics than traditional approaches. Issues such as low transport costs and smooth customs clearance become important for the organization of production. Once efficient logistics are in place, however, countries with suitable agro-ecological conditions can potentially produce high-value products, such as cut flowers and fresh vegetables, which formerly needed to be produced near their point of consumption. In this case, the logistics and trade facilitation are also vitally important, given the high costs of delay. African producers of products such as green beans, cut flowers, and fresh fruit appear to have seized some of these opportunities.
A recent advancement of economists’ approach in the analysis of exports involves a recognition of the diversity of experience by firms and with particular products. While trade theory did not explicitly consider firms until the 1990s, the availability of transaction-level data revealed striking heterogeneity of firms, with most exports accounted for by a surprisingly small share of firms. Further these firms tended to be more productive than non-exporting firms even when they began exporting—in contrast with the traditional model in which firms learned by doing in the very different business environment facing exporting firms. Only the most productive firms also tended to export multiple products and to multiple export markets. While these findings were originally established for industrial countries (e.g. Bernard and Jensen 1995), they were quickly confirmed for developing countries (Clerides et al. 1998) and subsequently for exports of processed agricultural products (Gopinath et al. 2007).
In Africa, considerable evidence has emerged that exporting firms are—as in other regions—more productive and pay higher wages than non-exporting firms (Bigsten et al. 2004; Van Biesebroeck 2005; Brambilla et al. 2015). However, there are also indications that firms continue to benefit from learning-by-doing after entering export markets (Bigsten et al. 2004; Mengistae and Pattillo 2004; Van Biesebroeck 2005; Newman et al. 2016a). Mengistae and Pattillo, in particular, find that the
4
productivity of exporting firms grows 10 per cent faster than that of non-exporting firms. A recent paper by Mulangu and Olarinde (2016) finds evidence of learning-by-doing, but no evidence of higher productivity firms selecting into exporting. It also concludes that the fixed costs associated with starting exports to African countries are lower than those to other markets—suggesting that intra-African exports may provide an opportunity for more firms to export, and to reap the productivity gains associated with exporting.
Another recent perspective on developing country exports has come from the realization that exports from most countries are dominated by a relatively small range of specific products (Hausmann and Rodrik 2003). This is the case for even very large countries such as China and India for which only one six-digit product (unrefined petroleum) appears on the list of top 25 exports (Dimaranan et al. 2007). Easterly and Reshef (2010) find that exports from several African countries are dominated by a small number of ‘big hits’ with large export shares.
Whether African exports are highly specialized or not has important implications for the volatility of export returns because highly concentrated export bundles are much more likely to be volatile than more diversified export bundles. Adding processed agricultural exports to an export bundle dominated by something else—such as resource exports—may reduce volatility. However, switching from exporting a raw product to exporting the same product in processed form might not lead to a substantial reduction in export volatility, if the price received for the processed product is heavily influenced by the price of the raw material. Diversifying from agricultural and resource products to manufactures seems likely to provide the largest gains from diversification.
Another factor influencing export outcomes is whether markets for particular products are expanding or contracting. When markets are growing, prices are more likely to be buoyant in order to provide an incentive for additional resources to flow into the sector. In shrinking markets, competition between suppliers—and particularly suppliers with large fixed investments in production—is more likely to put downward pressure on prices. With income growth, consumers are likely to move from purchasing raw agricultural products to consuming products with additional embedded services (da Silva 2009). For this reason, it seems more likely that markets for processed agricultural products will grow more rapidly than markets for raw products when incomes rise in consuming countries. Demand for horticultural products such as tropical fruits and fresh flowers is also likely to grow relatively rapidly as incomes rise, potentially making the exports of these products grow faster than staple agricultural products.
3 Global perspective on agricultural processing and horticultural exports
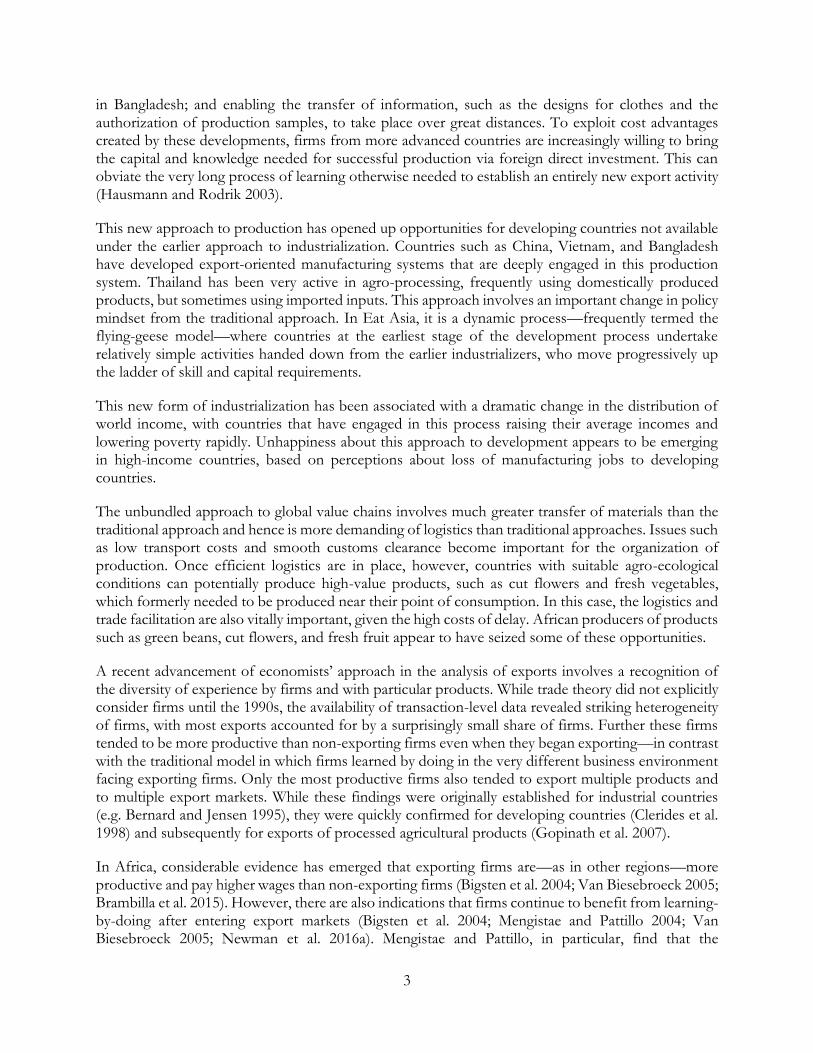
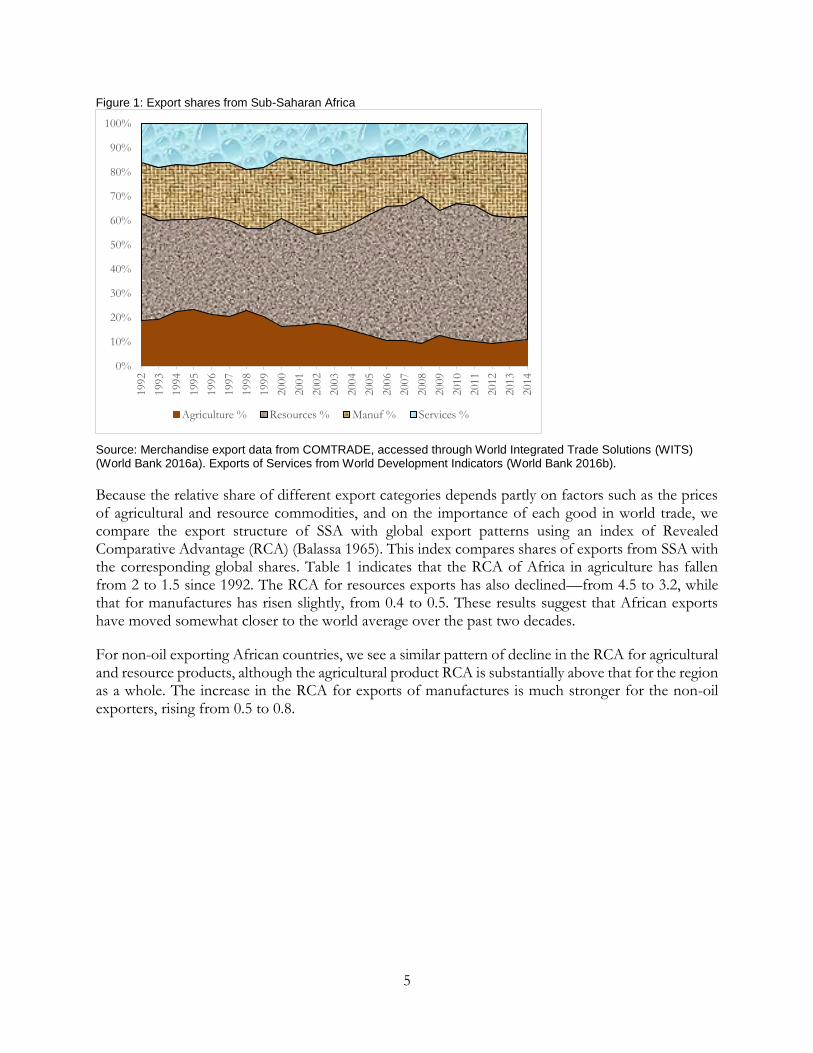
In this section, we first examine the evolution of exports from SSA and other regions. Figure 1 shows the composition of Africa’s exports of goods and services, divided into agriculture, resources, manufactures, and services. Figure 1 reveals the small share of agriculture in African exports at around 10 per cent which is lower than the 12 per cent accounted for by exports of non-factor services. This low share of agriculture in total exports suggests that the opportunities for expanding total exports by processing existing agricultural exports—some of which are already processed—are likely to be more limited than in the case when exports of unprocessed agricultural products account for a large proportion of total exports.
5
Figure 1: Export shares from Sub-Saharan Africa
Source: Merchandise export data from COMTRADE, accessed through World Integrated Trade Solutions (WITS) (World Bank 2016a). Exports of Services from World Development Indicators (World Bank 2016b).
Because the relative share of different export categories depends partly on factors such as the prices of agricultural and resource commodities, and on the importance of each good in world trade, we compare the export structure of SSA with global export patterns using an index of Revealed Comparative Advantage (RCA) (Balassa 1965). This index compares shares of exports from SSA with the corresponding global shares. Table 1 indicates that the RCA of Africa in agriculture has fallen from 2 to 1.5 since 1992. The RCA for resources exports has also declined—from 4.5 to 3.2, while that for manufactures has risen slightly, from 0.4 to 0.5. These results suggest that African exports have moved somewhat closer to the world average over the past two decades.
For non-oil exporting African countries, we see a similar pattern of decline in the RCA for agricultural and resource products, although the agricultural product RCA is substantially above that for the region as a whole. The increase in the RCA for exports of manufactures is much stronger for the non-oil exporters, rising from 0.5 to 0.8.
0%
10%
20%
30%
40%
50%
60%
70%
80%
90%
100%
1992
1993
1994
1995
1996
1997
1998
1999
2000
2001
2002
2003
2004
2005
2006
2007
2008
2009
2010
2011
2012
2013
2014
Agriculture % Resources % Manuf % Services %

6
Table 1: Revealed comparative advantage of African exports
SSA countries SSA without oil exporters
Agriculture Resources Manuf Services Agriculture Resources Manuf Services
1992 2.0 4.5 0.4 0.7 2.7 2.5 0.5 0.8 1995 2.5 4.2 0.4 0.8 3.2 2.3 0.5 0.8 2000 2.3 4.2 0.4 0.7 3.2 2.0 0.6 0.8 2005 1.9 3.6 0.4 0.7 2.9 1.6 0.7 0.8 2010 1.6 3.5 0.4 0.6 2.6 1.8 0.7 0.8 2014 1.5 3.2 0.5 0.6 2.3 1.5 0.8 0.7
Note: Countries are classified as oil exporters if the share of fuels exports relative to GDP is above 10 per cent.
Source: Merchandise export data from COMTRADE, accessed through World Integrated Trade Solutions (WITS) (World Bank 2016a). Exports of Services from World Development Indicators (World Bank 2016b).
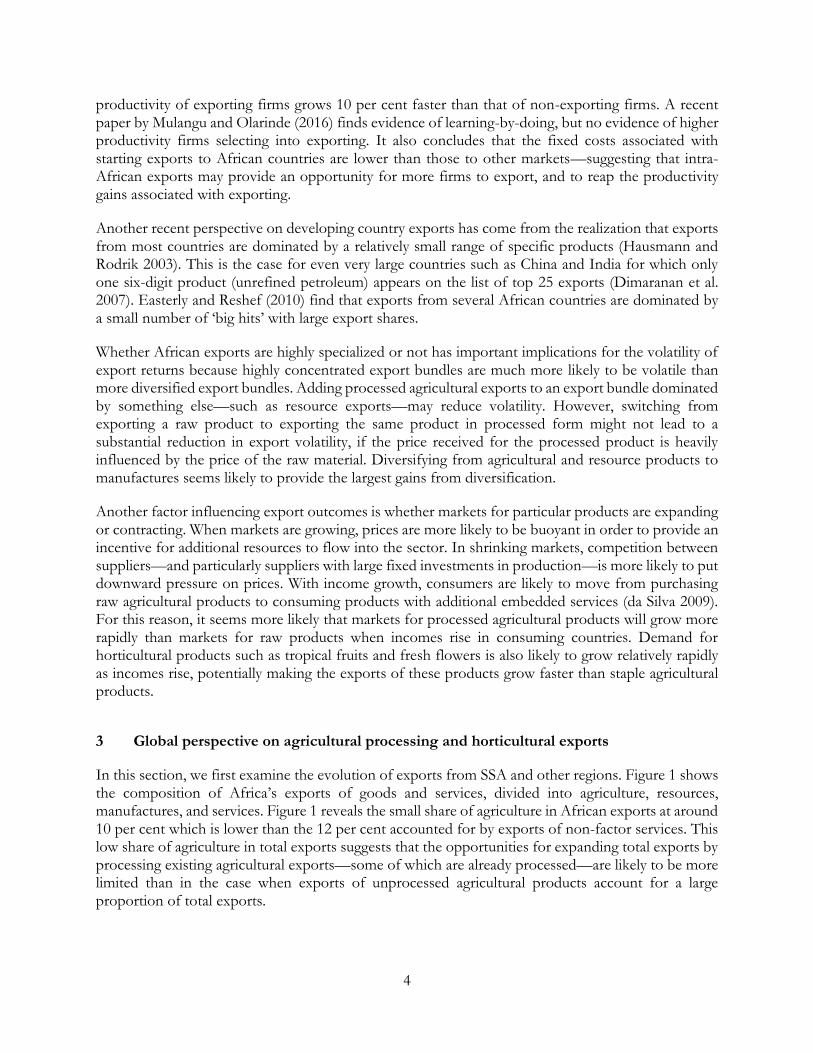
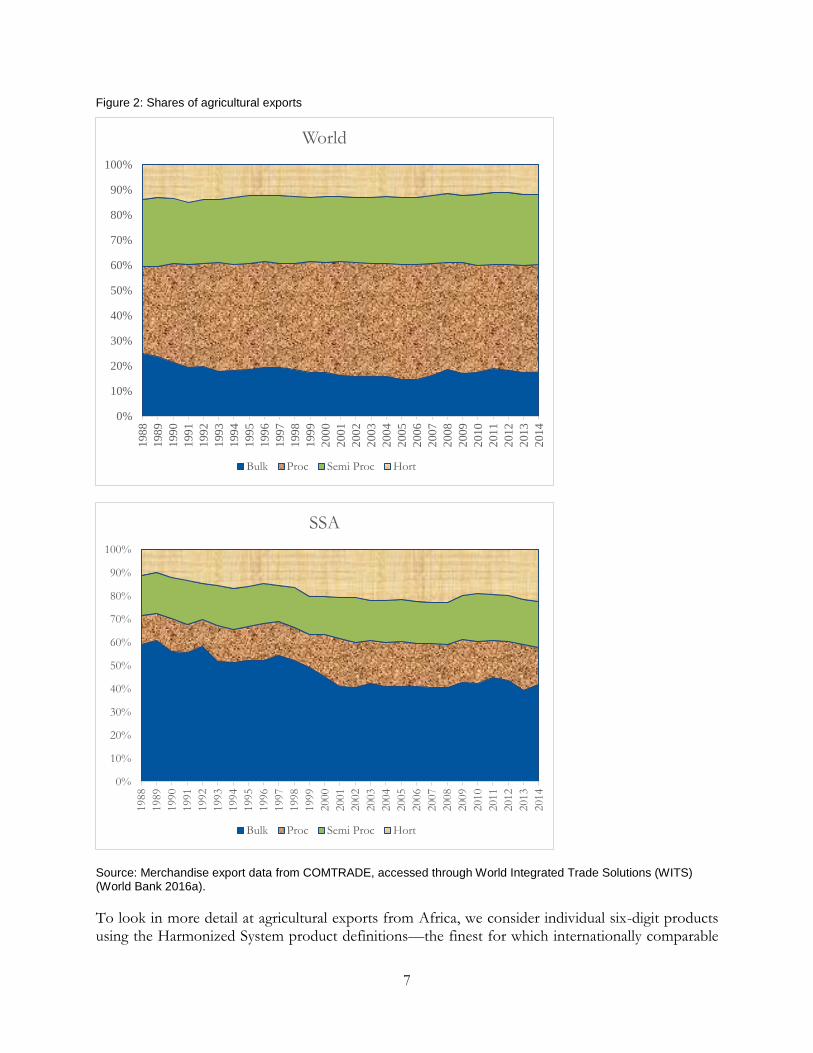
Between 1988 and 2014, world agricultural exports expanded from US$83.4 billion to US$1,532 billion while SSA’s agricultural exports increased from US$2.7 billion to US$44.3 billion (the UN COMTRADE System). As a result, SSA’s share in world agricultural exports declined from 3.3 per cent in 1988 to 2.9 per cent in 2014. We distinguish among agricultural products using the Regmi et al. (2005) definitions of bulk, semi-processed, and processed agricultural products, plus horticultural products. As noted by Liapis (2011: 12), bulk and horticultural products are tied strongly to geographic conditions, while semi-processed products such as sugar or cocoa products and processed products such as meat and chocolate are less geographically linked and could potentially be produced using inputs from other locations. With these definitions, we see a sharp difference between Africa and the world as a whole. As shown in Figure 2, for the world as a whole, bulk agricultural products account for a small and declining share of agricultural exports—decreasing from 25 per cent in 1988 to 17 per cent in 2014. By contrast, processed and semi-processed agricultural products accounted for almost three-quarters of global agricultural exports by 2015. Horticultural exports accounted for around 12 per cent of global agricultural exports in 2014.
For Africa, the corresponding patterns are quite different. The share of bulk agricultural exports also declined, but from around 60 per cent to 42 per cent in 2014, leaving these exports still as a large share of total agricultural exports. The share of processed and semi-processed agricultural products rose, but only to 35 per cent by 2015. The share of horticultural exports rose from around 10 per cent in 1988–89 to 22 per cent in 2014. It seems clear that African exporters are adjusting to the changes in the world markets, but doing it in a distinctively African way. In particular, the expansion of horticultural exports suggests that Africa has seized new opportunities, for instance, in becoming integrated into global agricultural value chains in flowers and horticultural crops (Minten et al. 2009; Page 2012).
7
Figure 2: Shares of agricultural exports
Source: Merchandise export data from COMTRADE, accessed through World Integrated Trade Solutions (WITS) (World Bank 2016a).
To look in more detail at agricultural exports from Africa, we consider individual six-digit products using the Harmonized System product definitions—the finest for which internationally comparable
0%
10%
20%
30%
40%
50%
60%
70%
80%
90%
100%
198
8
198
9
199
0
199
1
199
2
199
3
199
4
199
5
199
6
199
7
199
8
199
9
200
0
200
1
200
2
200
3
200
4
200
5
200
6
200
7
200
8
200
9
201
0
201
1
201
2
201
3
201
4
World
Bulk Proc Semi Proc Hort
0%
10%
20%
30%
40%
50%
60%
70%
80%
90%
100%
1988
1989
1990
1991
1992
1993
1994
1995
1996
1997
1998
1999
2000
2001
2002
2003
2004
2005
2006
2007
2008
2009
2010
2011
2012
2013
2014
SSA
Bulk Proc Semi Proc Hort
8
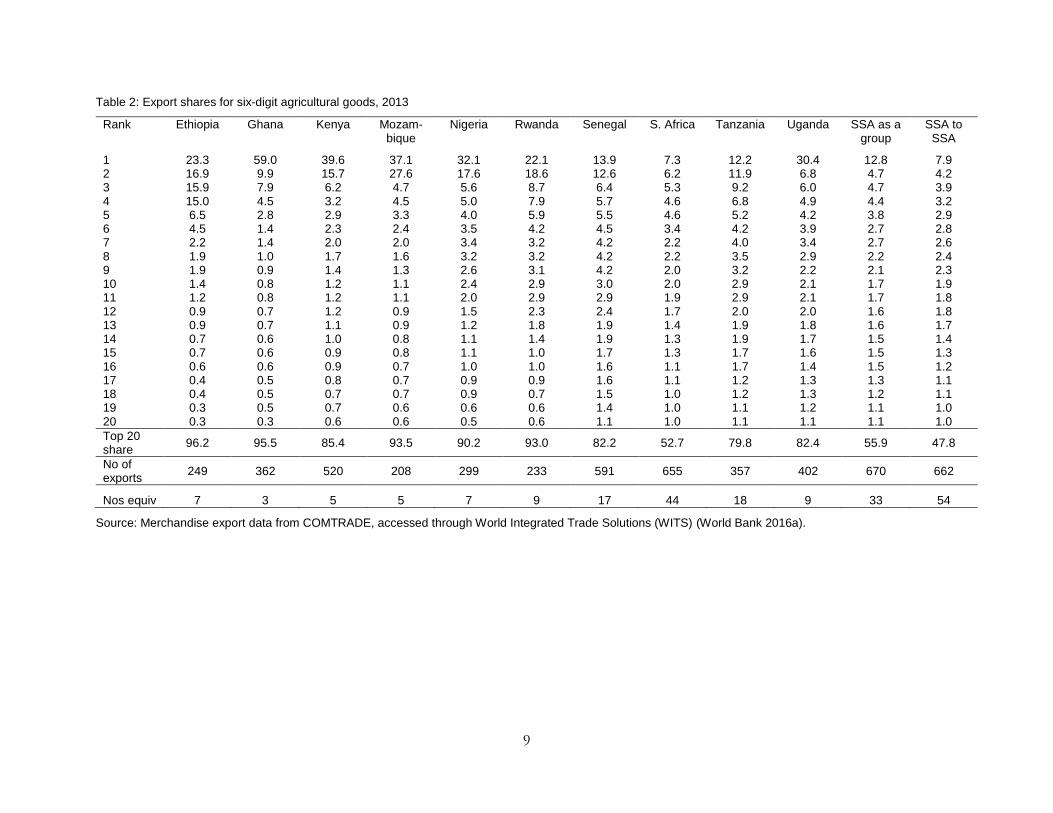
measures are available. In Table 2, we examine these products for ten focus countries and for SSA as a whole. The table shows the export value share for each of the top 20 agricultural exports, the share held by the top 20 products, the number of agricultural exports and the numbers equivalent of the Herfindahl Index for agricultural exports (Adelman 1969). This numbers-equivalent measure—
measured as 1
∑𝑆𝑖2 where Si is the share of each product in the total—shows the number of equally
distributed exports that would provide the same degree of diversification as the observed set of exports, assuming independent and identically distributed volatility for each commodity export.
9
Table 2: Export shares for six-digit agricultural goods, 2013
Rank Ethiopia Ghana Kenya Mozam-bique
Nigeria Rwanda Senegal S. Africa Tanzania Uganda SSA as a group
SSA to SSA
1 23.3 59.0 39.6 37.1 32.1 22.1 13.9 7.3 12.2 30.4 12.8 7.9 2 16.9 9.9 15.7 27.6 17.6 18.6 12.6 6.2 11.9 6.8 4.7 4.2 3 15.9 7.9 6.2 4.7 5.6 8.7 6.4 5.3 9.2 6.0 4.7 3.9 4 15.0 4.5 3.2 4.5 5.0 7.9 5.7 4.6 6.8 4.9 4.4 3.2 5 6.5 2.8 2.9 3.3 4.0 5.9 5.5 4.6 5.2 4.2 3.8 2.9 6 4.5 1.4 2.3 2.4 3.5 4.2 4.5 3.4 4.2 3.9 2.7 2.8 7 2.2 1.4 2.0 2.0 3.4 3.2 4.2 2.2 4.0 3.4 2.7 2.6 8 1.9 1.0 1.7 1.6 3.2 3.2 4.2 2.2 3.5 2.9 2.2 2.4 9 1.9 0.9 1.4 1.3 2.6 3.1 4.2 2.0 3.2 2.2 2.1 2.3 10 1.4 0.8 1.2 1.1 2.4 2.9 3.0 2.0 2.9 2.1 1.7 1.9 11 1.2 0.8 1.2 1.1 2.0 2.9 2.9 1.9 2.9 2.1 1.7 1.8 12 0.9 0.7 1.2 0.9 1.5 2.3 2.4 1.7 2.0 2.0 1.6 1.8 13 0.9 0.7 1.1 0.9 1.2 1.8 1.9 1.4 1.9 1.8 1.6 1.7 14 0.7 0.6 1.0 0.8 1.1 1.4 1.9 1.3 1.9 1.7 1.5 1.4 15 0.7 0.6 0.9 0.8 1.1 1.0 1.7 1.3 1.7 1.6 1.5 1.3 16 0.6 0.6 0.9 0.7 1.0 1.0 1.6 1.1 1.7 1.4 1.5 1.2 17 0.4 0.5 0.8 0.7 0.9 0.9 1.6 1.1 1.2 1.3 1.3 1.1 18 0.4 0.5 0.7 0.7 0.9 0.7 1.5 1.0 1.2 1.3 1.2 1.1 19 0.3 0.5 0.7 0.6 0.6 0.6 1.4 1.0 1.1 1.2 1.1 1.0 20 0.3 0.3 0.6 0.6 0.5 0.6 1.1 1.0 1.1 1.1 1.1 1.0
Top 20 share
96.2 95.5 85.4 93.5 90.2 93.0 82.2 52.7 79.8 82.4 55.9 47.8
No of exports
249 362 520 208 299 233 591 655 357 402 670 662
Nos equiv 7 3 5 5 7 9 17 44 18 9 33 54
Source: Merchandise export data from COMTRADE, accessed through World Integrated Trade Solutions (WITS) (World Bank 2016a).
10
Table 2 shows that agricultural exports from African countries tend to be highly concentrated, with the largest export having a very large share of total agricultural exports, and subsequent exports having much smaller shares.2 Consistent with this, the top 20 exports accounted for 80 per cent or more of export returns in each of our focus countries except South Africa, and over 90 per cent in five of our focus countries. While each country has what appears to be a large number of agricultural exports (between 208 and 655), the very large shares accounted for by the top products mean that these export baskets are much less diversified than they might at first appear. The numbers equivalent of the Herfindahl Index suggests that, for instance, the 362 agricultural exports from Ghana provide the export market diversification that would be provided by having just three equally distributed agricultural exports. The 520 and 208 agricultural exports from Kenya and Mozambique respectively provide little more diversification, being equivalent to only five identically distributed products. In contrast, the agricultural export baskets of Senegal, Tanzania, and South Africa are much more diversified, being equivalent to 17, 18, and 44 products respectively—numbers which should provide considerable diversification.
The last two columns of Table 2 show the results for SSA as a group for goods which went to the world and to SSA respectively. The exports which went to SSA turn out to be somewhat more diversified: SSA’s top 20 exports to the world and to the SSA accounted for 56 per cent and 48 per cent, while the corresponding indexes were 33 and 54 respectively. This may reflect the relatively low entry costs into exporting to SSA countries reported by Mulangu and Olarinde (2016). It may also reflect a tendency to re-export high-value processed agricultural items—often imported from outside Africa.
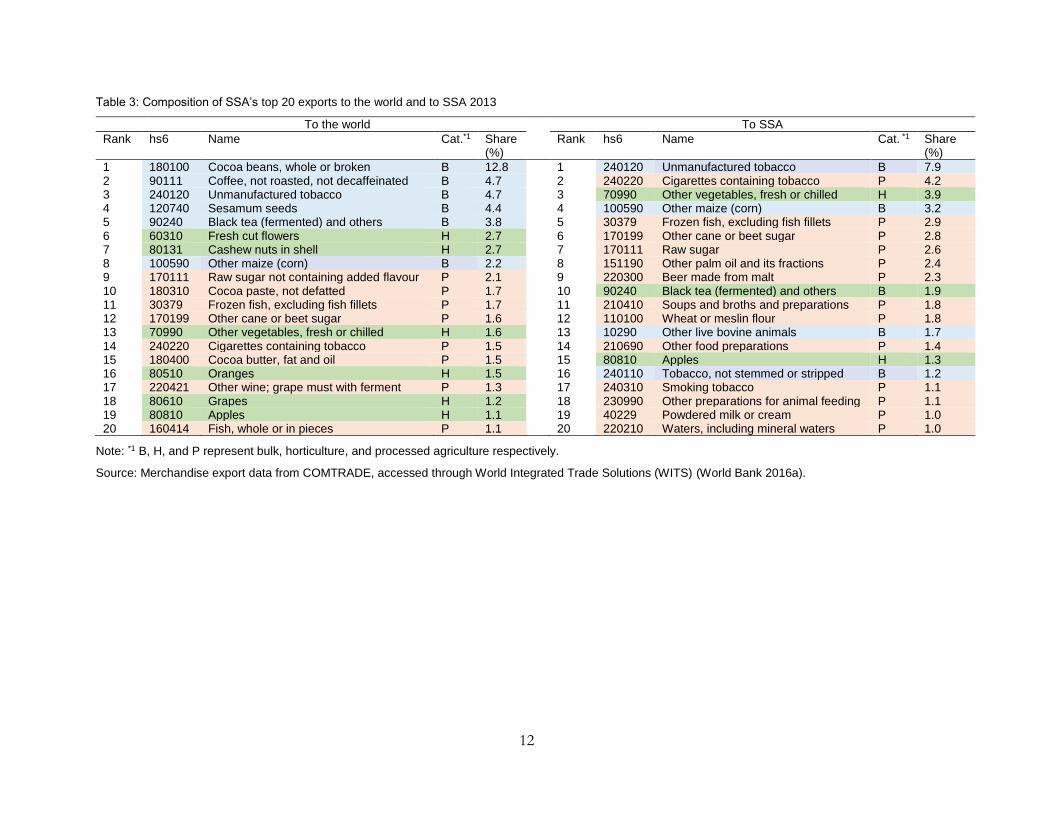
Table 3 shows the composition of SSA’s top 20 exports for SSA as a group to the world and to the SSA. Tables 3 also categorizes the SSA’s exports into bulk (B), horticulture (H), and processed agriculture (P), which are shaded in blue, green, and pink respectively. In terms of SSA’s exports to the world (first panel), the five top items are dominated by bulk exports such as cocoa beans, coffee, unmanufactured tobacco, sesamum seeds, and black tea. Fresh cut flowers and horticulture products such as cashew nuts and fresh fruit (including apples, oranges, and grapes) also made the list. Processed agricultural goods such as cocoa paste, cocoa butter, and frozen fish may reflect the availability of local raw materials.
The second panel of Table 3 reveals the quite different nature of the top 20 exports which were traded within SSA, with a disproportionately high share of processed goods including such items as cigarettes and tobacco, frozen fish, sugar, palm oil, beer, soup, flour, milk and cream, and mineral water. In value terms, nearly two-thirds of the agricultural products traded within SSA in 2013, were processed agricultural products.
Given the diversity of African countries, looking at SSA exports in total may well miss important details. Are, for instance, exports of horticultural products from just a few countries? Appendix Table A1 shows the composition of the top 20 exports for our ten focus countries. The importance of coffee, cocoa, and tea stands out at the country level: coffee (090111) was the most important agricultural export item for Ethiopia, Rwanda, and Uganda, and was the second and third in rank for
2 Following Easterly and Reshef (2010), we plotted the log of the rank for each export against the log of its export share
and confirmed that these distributions followed a power law, under which a small share of products accounts for a very large share of exports.
11
Tanzania and Kenya respectively; cocoa beans (180100) were the leading export for Ghana and Nigeria in 2013, while black tea (90240) was the most and second most important item for Kenya and Rwanda respectively.
Horticultural products appear to be important for a number of our focus countries. For instance, ‘other’ vegetables (70990) and fresh cut flowers (60310) were the second and third most important agricultural export goods for Ethiopia; fresh cut flowers (60310) were second most important for Kenya; and fresh fruit such as oranges (80510), apples (80810), and grapes (80610) were the second, fourth and fifth ranked items for South Africa. Cashew nuts (080131) were the most important export item for Tanzania and the second and fourth most important item for Ghana and Nigeria respectively. A variety of processed food items appears in the list including fish fillets, sugar, flour, vegetable oil, cigarettes, and alcoholic beverages.
The ‘big hits’ change from one period to the next (Easterly and Reshef 2010) and a question arises as to whether changes in the importance of agricultural exports are driven by new products. To answer the question, we follow Kehoe and Ruhl (2013) in constructing the set of least-exported agricultural goods which were originally either not exported or exported only in small quantities. Specifically, starting with the smallest amounts of exports including zero, we add products to the set until the sum of their export values reaches 2 per cent of total export value in the initial period (‘bottom 2 per cent’ items). To reduce the chance that a good is typically exported but not exported in any one year (Kehoe and Ruhl 2013) and to mitigate potential inaccuracy of the data reporting in the earlier years, we average each country’s exports for the three oldest years for which the data are available in the COMTRADE system.
Appendix Table A2 reports a set of items which were bottom 2 per cent in the oldest available years, but made the top 20 list in 2013 for our focus countries. Except for Rwanda, the item which appeared first in each list was either a horticultural or a processed agricultural product. For instance, while ‘other’ vegetables (70990) and fresh cut flowers (60310) were among the bottom 2 per cent items at the turn of the millennium in Ethiopia, they became the country’s second and third largest export goods in 2013. Similarly, while bananas (80300) and almonds (80212) were among the bottom 2 per cent goods for Mozambique, they became Mozambique’s fifth and ninth most important agricultural exports in 2013. The leading emerging processed goods include such products as palm kernel or babassu oil (151329) in Ghana, cigarettes (240220) and cocoa paste (180310) in Nigeria, oil cake (230630) in Tanzania, and sugar (170199) in Uganda. The emerging bulk products include oil seeds such as soya beans (120100) in Ethiopia, sesamum seeds (120740) in Ghana, and other oil seeds (120799) in Tanzania and Nigeria, perhaps reflecting rising demand for vegetable oils and animal feeds. For South Africa, in contrast, none of the top 20 agricultural export items in 2013 came from the bottom 2 per cent in earlier years.
12
Table 3: Composition of SSA’s top 20 exports to the world and to SSA 2013
To the world To SSA
Rank hs6 Name Cat.*1 Share (%)
Rank hs6 Name Cat. *1 Share
(%)
1 180100 Cocoa beans, whole or broken B 12.8 1 240120 Unmanufactured tobacco B 7.9 2 90111 Coffee, not roasted, not decaffeinated B 4.7
2 240220 Cigarettes containing tobacco P 4.2
3 240120 Unmanufactured tobacco B 4.7
3 70990 Other vegetables, fresh or chilled H 3.9 4 120740 Sesamum seeds B 4.4
4 100590 Other maize (corn) B 3.2
5 90240 Black tea (fermented) and others B 3.8
5 30379 Frozen fish, excluding fish fillets P 2.9 6 60310 Fresh cut flowers H 2.7
6 170199 Other cane or beet sugar P 2.8
7 80131 Cashew nuts in shell H 2.7
7 170111 Raw sugar P 2.6 8 100590 Other maize (corn) B 2.2
8 151190 Other palm oil and its fractions P 2.4
9 170111 Raw sugar not containing added flavour P 2.1
9 220300 Beer made from malt P 2.3 10 180310 Cocoa paste, not defatted P 1.7
10 90240 Black tea (fermented) and others B 1.9
11 30379 Frozen fish, excluding fish fillets P 1.7
11 210410 Soups and broths and preparations P 1.8 12 170199 Other cane or beet sugar P 1.6
12 110100 Wheat or meslin flour P 1.8
13 70990 Other vegetables, fresh or chilled H 1.6
13 10290 Other live bovine animals B 1.7 14 240220 Cigarettes containing tobacco P 1.5
14 210690 Other food preparations P 1.4
15 180400 Cocoa butter, fat and oil P 1.5
15 80810 Apples H 1.3 16 80510 Oranges H 1.5
16 240110 Tobacco, not stemmed or stripped B 1.2
17 220421 Other wine; grape must with ferment P 1.3
17 240310 Smoking tobacco P 1.1 18 80610 Grapes H 1.2
18 230990 Other preparations for animal feeding P 1.1
19 80810 Apples H 1.1
19 40229 Powdered milk or cream P 1.0 20 160414 Fish, whole or in pieces P 1.1
20 220210 Waters, including mineral waters P 1.0
Note: *1 B, H, and P represent bulk, horticulture, and processed agriculture respectively.
Source: Merchandise export data from COMTRADE, accessed through World Integrated Trade Solutions (WITS) (World Bank 2016a).
13
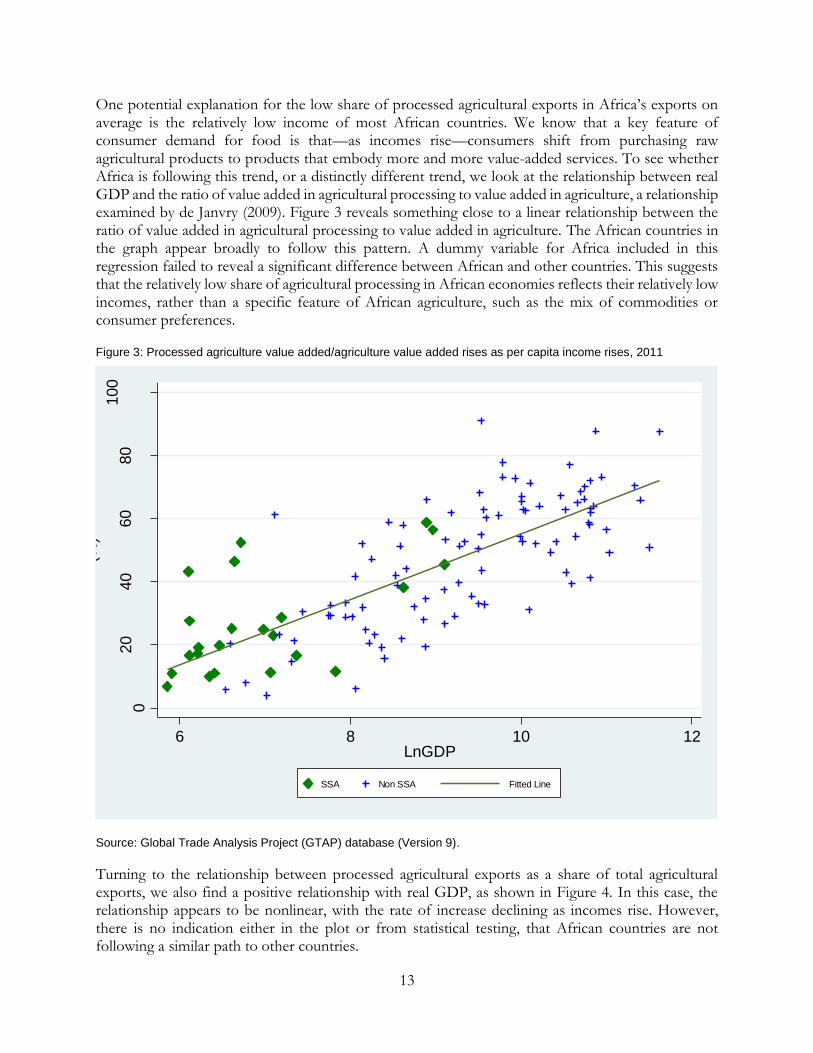
One potential explanation for the low share of processed agricultural exports in Africa’s exports on average is the relatively low income of most African countries. We know that a key feature of consumer demand for food is that—as incomes rise—consumers shift from purchasing raw agricultural products to products that embody more and more value-added services. To see whether Africa is following this trend, or a distinctly different trend, we look at the relationship between real GDP and the ratio of value added in agricultural processing to value added in agriculture, a relationship examined by de Janvry (2009). Figure 3 reveals something close to a linear relationship between the ratio of value added in agricultural processing to value added in agriculture. The African countries in the graph appear broadly to follow this pattern. A dummy variable for Africa included in this regression failed to reveal a significant difference between African and other countries. This suggests that the relatively low share of agricultural processing in African economies reflects their relatively low incomes, rather than a specific feature of African agriculture, such as the mix of commodities or consumer preferences.
Figure 3: Processed agriculture value added/agriculture value added rises as per capita income rises, 2011
Source: Global Trade Analysis Project (GTAP) database (Version 9).
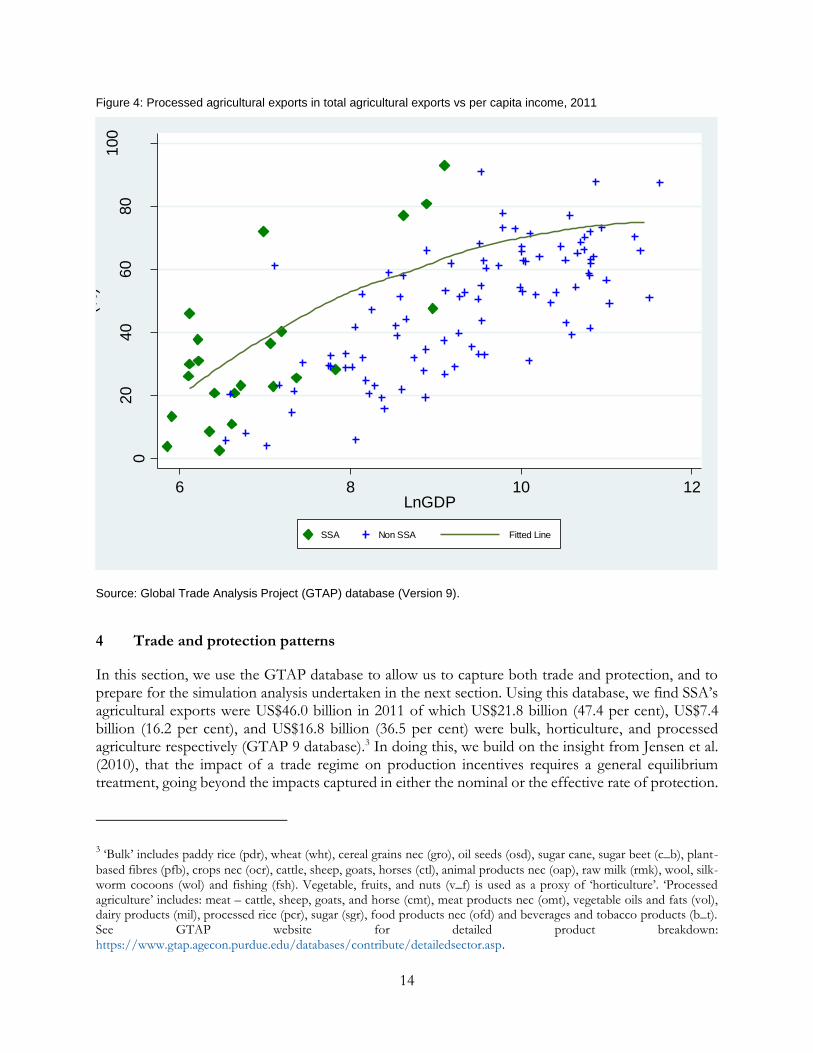
Turning to the relationship between processed agricultural exports as a share of total agricultural exports, we also find a positive relationship with real GDP, as shown in Figure 4. In this case, the relationship appears to be nonlinear, with the rate of increase declining as incomes rise. However, there is no indication either in the plot or from statistical testing, that African countries are not following a similar path to other countries.
020
40
60
80
100
(%)
6 8 10 12LnGDP
SSA Non SSA Fitted Line
14
Figure 4: Processed agricultural exports in total agricultural exports vs per capita income, 2011
Source: Global Trade Analysis Project (GTAP) database (Version 9).
4 Trade and protection patterns
In this section, we use the GTAP database to allow us to capture both trade and protection, and to prepare for the simulation analysis undertaken in the next section. Using this database, we find SSA’s agricultural exports were US$46.0 billion in 2011 of which US$21.8 billion (47.4 per cent), US$7.4 billion (16.2 per cent), and US$16.8 billion (36.5 per cent) were bulk, horticulture, and processed agriculture respectively (GTAP 9 database).3 In doing this, we build on the insight from Jensen et al. (2010), that the impact of a trade regime on production incentives requires a general equilibrium treatment, going beyond the impacts captured in either the nominal or the effective rate of protection.
3 ‘Bulk’ includes paddy rice (pdr), wheat (wht), cereal grains nec (gro), oil seeds (osd), sugar cane, sugar beet (c_b), plant-
based fibres (pfb), crops nec (ocr), cattle, sheep, goats, horses (ctl), animal products nec (oap), raw milk (rmk), wool, silk-worm cocoons (wol) and fishing (fsh). Vegetable, fruits, and nuts (v_f) is used as a proxy of ‘horticulture’. ‘Processed agriculture’ includes: meat – cattle, sheep, goats, and horse (cmt), meat products nec (omt), vegetable oils and fats (vol), dairy products (mil), processed rice (pcr), sugar (sgr), food products nec (ofd) and beverages and tobacco products (b_t). See GTAP website for detailed product breakdown: https://www.gtap.agecon.purdue.edu/databases/contribute/detailedsector.asp.
020
40
60
80
100
(%)
6 8 10 12LnGDP
SSA Non SSA Fitted Line
15
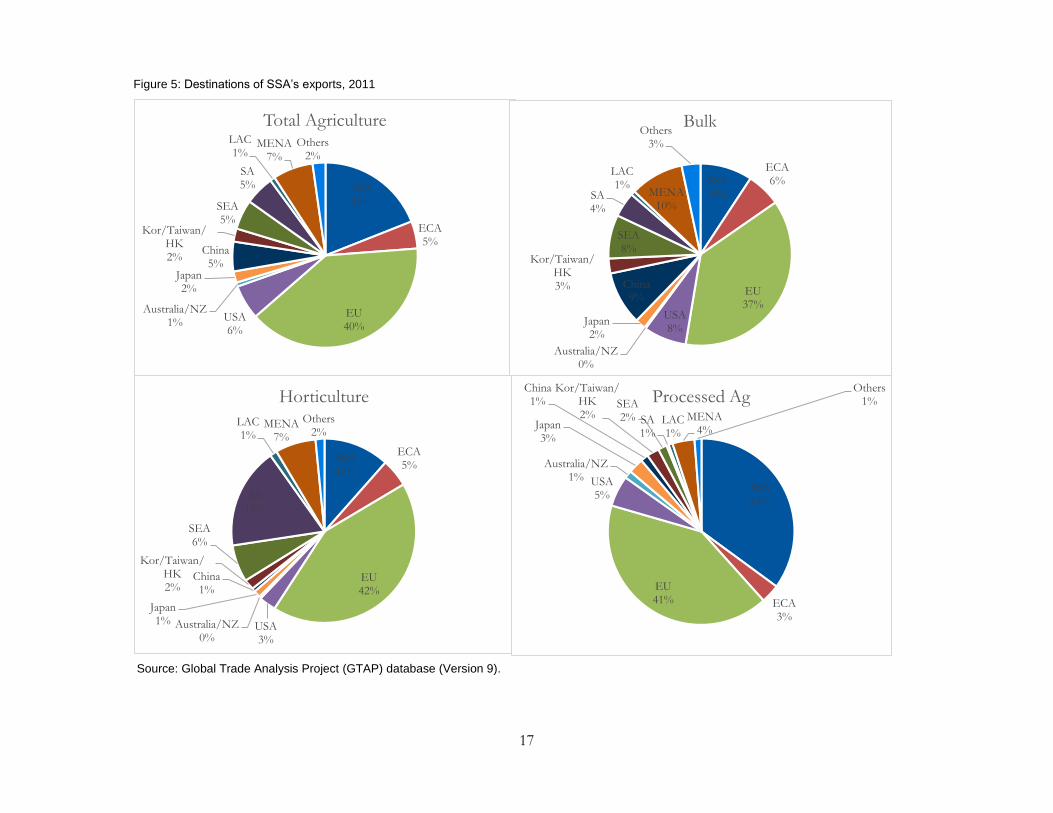
Figure 5 shows the destinations of SSA’s exports for total, bulk, horticulture, and processed agriculture. This shows that the EU was the largest destination for SSA’s exports, taking 39.6 per cent of SSA’s exports (37.3 per cent, 42.4 per cent, and 41.3 per cent of bulk, horticulture, and processed agriculture respectively). 19.0 per cent of SSA’s exports went to SSA, with processed agriculture disproportionately accounting for 34.9 per cent of SSA’s total processed agriculture exports. The EU and SSA combined accounted for about three-quarters of SSA’s processed agriculture exports while its exports of bulk agriculture were more geographically dispersed. The South Asia region absorbed 17.7 per cent of SSA’s horticultural exports.
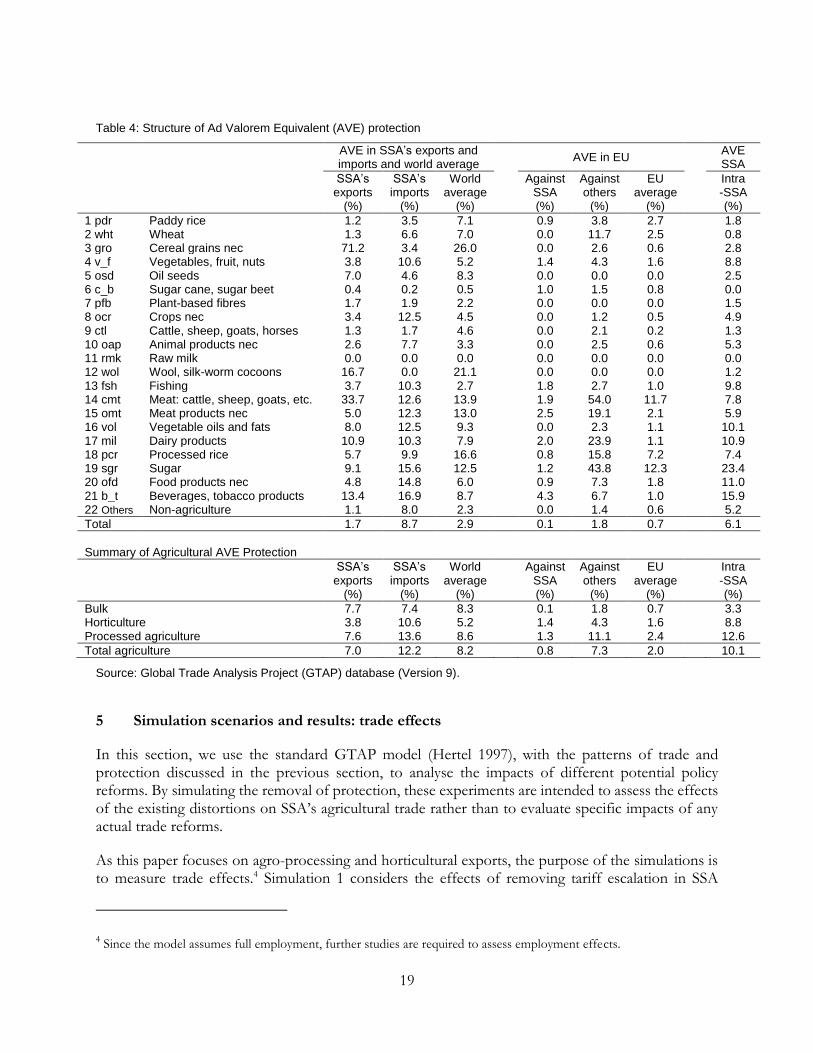
Columns 1–3 of Table 4 show the Ad Valorem Equivalent (AVE) protection (Guimbard et al. 2012) that SSA’s exports face, the AVE that SSA imposes against its imports, and the world AVE for the purpose of comparison. The last four rows show the summary of AVE for agricultural goods. SSA’s agricultural exports face 7.0 per cent of AVE in its export market (7.7 per cent, 3.8 per cent, 7.6 per cent for its bulk, horticulture, and processed agriculture exports respectively) which were slightly lower than the world average of 8.2 per cent (8.3 per cent, 5.2 per cent, and 8.6 per cent for bulk, horticulture, and processed agriculture respectively), perhaps reflecting its preferential access to certain developed countries including the EU and the United States. The SSA’s own AVE against its agricultural imports of 12.2 per cent was about 50 per cent higher than the world average.
Columns 4–6 of Table 4 show the AVE that SSA faces in the EU market, the AVE that the EU imposes against its imports other than SSA and EU, and the EU’s average AVE respectively. SSA enjoys preferential access to the EU market. Its preferential rate for agriculture of 0.8 per cent on average is substantially lower than the rate the EU imposes against its suppliers other than SSA and the EU itself (7.3 per cent). In particular, SSA appears to benefit from the lower preferential rates for its processed agricultural goods (1.3 per cent on average) relative to the AVE the EU imposes against other suppliers (11.1 per cent on average). The preference margins appear to be especially large for such products as meat (1.9 per cent vs. 54.0 per cent), dairy products (2.0 per cent vs. 23.9 per cent), and sugar (1.2 per cent vs. 43.8 per cent).
In its export markets, SSA faces tariff escalation within many value chains: paddy rice (1.2 per cent) vs. processed rice (5.7 per cent); oil seeds (7.0 per cent) vs. vegetable oils and fats (8.0 per cent); sugar cane and sugar beet (0.4 per cent) vs. sugar (9.1 per cent); raw milk (0.0 per cent) vs. dairy products (10.9 per cent); and cattle, sheep, goats, horses (1.3 per cent) vs. animal products n.e.c. (2.6 per cent), cattle, sheep, goat and horse meat (33.7 per cent) and other meat products (5.0 per cent) (column 1 of Tale 4). SSA’s own AVE against its imports (column 2), intra-SSA AVE (last column) and world AVE (third column) also demonstrate similar tariff escalation.
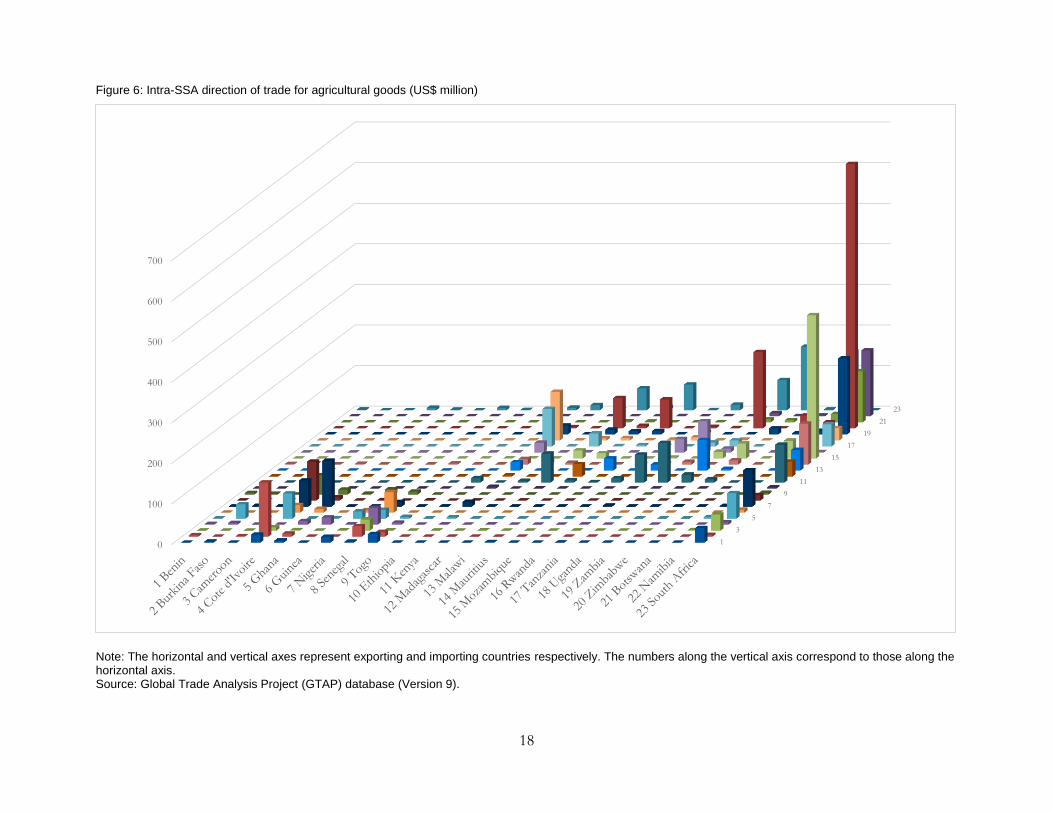
In 2011, about one-fifth of SSA’s agricultural exports took place within SSA. Figure 6 visualizes intra-SSA trade for agricultural goods. The horizontal and vertical axes represent exporting and importing countries respectively. The south-west corner represents the trade within Economic Community of West African States (ECOWAS); the north-east corner represents trade for the Southern African Development Community (SADC); and the countries belonging to the Common Market for Eastern and Southern Africa (COMESA) tend to be in between. Several countries are members of both the COMESA and the SADC. We observe that the agricultural trade in SSA tends to occur in the same regions. The ECOWAS and the COMESA/SADC countries rarely trade with each other for their agricultural goods (except for South Africa, which exports agricultural goods to some ECOWAS countries). The last column of Table 4 reports the AVE for intra-SSA trade. Despite the presence of a number of trade blocs within Africa, AVE protection for agricultural goods within SSA remains

16
relatively high at 10.1 per cent (higher than the world average AVE of 8.2 per cent), with an especially high AVE for processed agriculture, at 12.6 per cent.
17
Figure 5: Destinations of SSA’s exports, 2011
Source: Global Trade Analysis Project (GTAP) database (Version 9).
SSA19%
ECA5%
EU40%
USA6%
Australia/NZ1%
Japan2%
China5%
Kor/Taiwan/HK2%
SEA5%
SA5%
LAC1%
MENA7%
Others2%
Total Agriculture
SSA9%
ECA6%
EU37%
USA8%
Australia/NZ0%
Japan2%
China9%
Kor/Taiwan/HK3%
SEA8%
SA4%
LAC1%
MENA10%
Others3%
Bulk
SSA12%
ECA5%
EU42%
USA3%
Australia/NZ0%
Japan1%
China1%
Kor/Taiwan/HK2%
SEA6%
SA18%
LAC1%
MENA7%
Others2%
Horticulture
SSA35%
ECA3%
EU41%
USA5%
Australia/NZ1%
Japan3%
China1%
Kor/Taiwan/HK2%
SEA2% SA
1%LAC1%
MENA4%
Others1%Processed Ag
18
Figure 6: Intra-SSA direction of trade for agricultural goods (US$ million)
Note: The horizontal and vertical axes represent exporting and importing countries respectively. The numbers along the vertical axis correspond to those along the horizontal axis. Source: Global Trade Analysis Project (GTAP) database (Version 9).
1
3
5
7
9
11
13
15
17
19
21
23
0
100
200
300
400
500
600
700
19
Table 4: Structure of Ad Valorem Equivalent (AVE) protection
AVE in SSA’s exports and imports and world average
AVE in EU
AVE SSA
SSA’s exports
(%)
SSA’s imports
(%)
World average
(%)
Against
SSA (%)
Against others
(%)
EU average
(%)
Intra -SSA (%)
1 pdr Paddy rice 1.2 3.5 7.1
0.9 3.8 2.7 1.8 2 wht Wheat 1.3 6.6 7.0
0.0 11.7 2.5 0.8
3 gro Cereal grains nec 71.2 3.4 26.0
0.0 2.6 0.6 2.8 4 v_f Vegetables, fruit, nuts 3.8 10.6 5.2
1.4 4.3 1.6 8.8
5 osd Oil seeds 7.0 4.6 8.3
0.0 0.0 0.0 2.5 6 c_b Sugar cane, sugar beet 0.4 0.2 0.5
1.0 1.5 0.8 0.0
7 pfb Plant-based fibres 1.7 1.9 2.2
0.0 0.0 0.0 1.5 8 ocr Crops nec 3.4 12.5 4.5
0.0 1.2 0.5 4.9
9 ctl Cattle, sheep, goats, horses 1.3 1.7 4.6
0.0 2.1 0.2 1.3 10 oap Animal products nec 2.6 7.7 3.3
0.0 2.5 0.6 5.3
11 rmk Raw milk 0.0 0.0 0.0
0.0 0.0 0.0 0.0 12 wol Wool, silk-worm cocoons 16.7 0.0 21.1
0.0 0.0 0.0 1.2
13 fsh Fishing 3.7 10.3 2.7
1.8 2.7 1.0 9.8 14 cmt Meat: cattle, sheep, goats, etc. 33.7 12.6 13.9
1.9 54.0 11.7 7.8
15 omt Meat products nec 5.0 12.3 13.0
2.5 19.1 2.1 5.9 16 vol Vegetable oils and fats 8.0 12.5 9.3
0.0 2.3 1.1 10.1
17 mil Dairy products 10.9 10.3 7.9
2.0 23.9 1.1 10.9 18 pcr Processed rice 5.7 9.9 16.6
0.8 15.8 7.2 7.4
19 sgr Sugar 9.1 15.6 12.5
1.2 43.8 12.3 23.4 20 ofd Food products nec 4.8 14.8 6.0
0.9 7.3 1.8 11.0
21 b_t Beverages, tobacco products 13.4 16.9 8.7
4.3 6.7 1.0 15.9 22 Others Non-agriculture 1.1 8.0 2.3
0.0 1.4 0.6 5.2
Total
1.7 8.7 2.9
0.1 1.8 0.7 6.1
Summary of Agricultural AVE Protection
SSA’s exports
(%)
SSA’s imports
(%)
World average
(%)
Against
SSA (%)
Against others
(%)
EU average
(%)
Intra -SSA (%)
Bulk 7.7 7.4 8.3 0.1 1.8 0.7 3.3 Horticulture 3.8 10.6 5.2 1.4 4.3 1.6 8.8 Processed agriculture 7.6 13.6 8.6 1.3 11.1 2.4 12.6
Total agriculture 7.0 12.2 8.2 0.8 7.3 2.0 10.1
Source: Global Trade Analysis Project (GTAP) database (Version 9).
5 Simulation scenarios and results: trade effects
In this section, we use the standard GTAP model (Hertel 1997), with the patterns of trade and protection discussed in the previous section, to analyse the impacts of different potential policy reforms. By simulating the removal of protection, these experiments are intended to assess the effects of the existing distortions on SSA’s agricultural trade rather than to evaluate specific impacts of any actual trade reforms.
As this paper focuses on agro-processing and horticultural exports, the purpose of the simulations is to measure trade effects.4 Simulation 1 considers the effects of removing tariff escalation in SSA
4 Since the model assumes full employment, further studies are required to assess employment effects.
20
partner countries. Simulation 2 focuses on the loss of preferences in the EU. Simulation 3 considers agricultural trade reform within major trading blocs in Africa. Simulation 4 considers the impact of higher productivity in agricultural processing in Africa. Finally, Simulation 5 considers the impacts of SSA countries removing all AVE protection, including protection of manufacturing and resources goods, against all its trading partners.
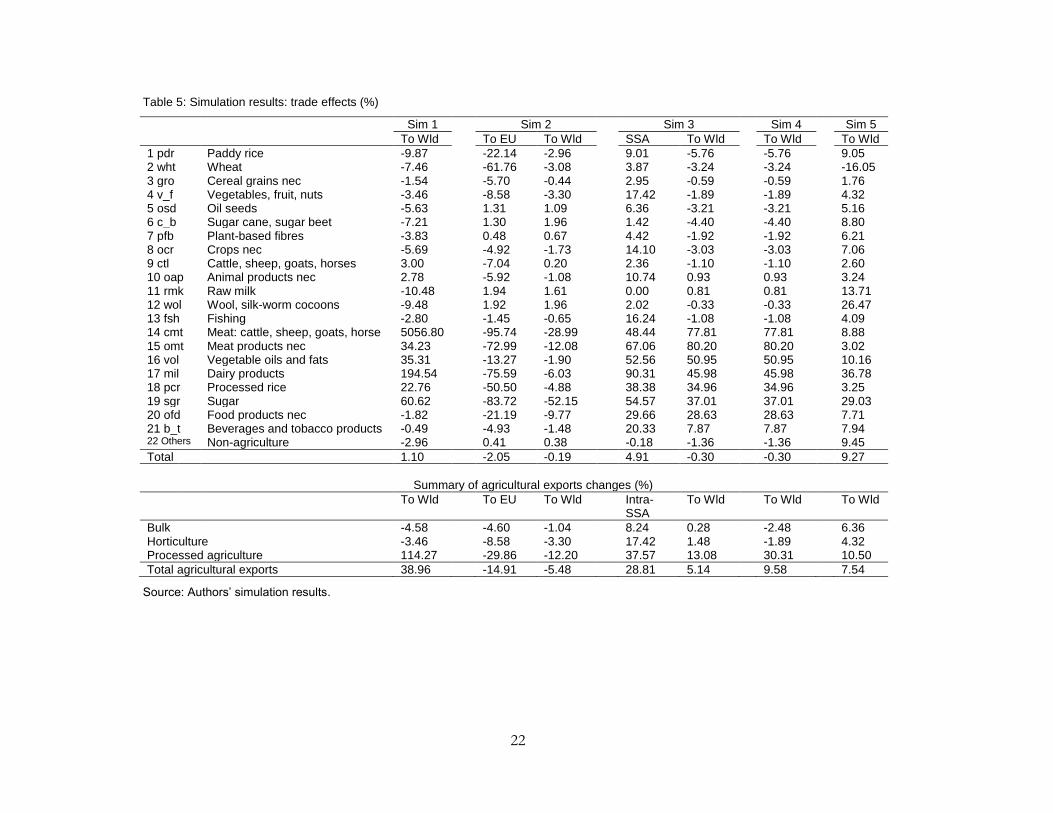
Column 1 of Table 5 shows the simulation result from elimination of tariff escalation by SSA’s partner countries, reducing their AVE protection for processed goods to the levels of unprocessed goods in the same value chain identified above (e.g. lowering the AVE rate of processed rice to the level of paddy rice) (Simulation 1). SSA’s exports of processed goods increase by 114.3 per cent while its bulk and horticulture exports decrease slightly by 4.6 per cent and 3.5 per cent respectively. Overall, SSA’s agricultural exports would increase by 39.0 per cent.5 These results show that tariff escalation in external markets poses substantial barriers for SSA’s exports of processed agricultural products. While SSA receives duty-free access from some partners such as the EU (and it is likely that the preferential access creates incentives for processing in SSA), there appears to remain scope to increase agro-processing exports further resulting from the removal of tariff escalation by other trading partners. The dramatic increase in exports of processed agriculture from SSA under Simulation 1 suggests that the provisions in the Doha Agenda proposals on reducing tariff escalation (WTO 2008: 18) may have very favourable effects on exports of processed agricultural products from Africa. They make a case for policy makers focusing on this issue in future trade negotiations.
Simulation 2 explores what happens if the SSA loses its preferential access to the EU market for its agricultural goods, with the EU increasing AVE protection against SSA from the preferential rates to those that the EU imposes against other suppliers (columns 2–3 of Table 5). SSA’s agricultural exports to the EU would decrease by 14.9 per cent which would lead to a reduction of its overall agricultural exports by 5.5 per cent. As the EU’s AVE protection for processed agriculture against non-preferential suppliers is especially high, the loss of preferences would result in a sharp reduction in SSA’s exports of processed agricultural products—by 29.9 per cent to the EU, and by 12.2 per cent to the world.
Simulation 3 investigates the impacts of ECOWAS, COMESA, and SADC countries reducing their AVE agricultural protection against each other to zero within their regional arrangements (columns 4–5). The simulation is partly motivated by the potential for regional agricultural trade to contribute to food security by enhancing the resilience of Africa’s food supply system (Badiane et al. 2013). The result shows that the agricultural liberalization within these trade blocs combined would lead to the expansion of intra-SSA agricultural trade by 28.8 per cent while SSA’s total agricultural exports to the world would increase by 5.1 per cent. The results of this simulation reflect the effects of removing agricultural barriers in general, and the tariff escalation within these barriers, and hence result in more rapid growth in exports of processed agricultural products than in total agricultural exports (37.6 per cent and 13.1 per cent increase in processed agricultural exports to SSA and to the world respectively). They illustrate the extent to which protection within Africa discourages export of all agricultural items.
5 The 5,056.8 per cent increase in the exports of cattle, sheep, goat, and horse meat (cmt) appears to reflect initially very
high AVE protection imposed by some partner countries (e.g. Norway) against SSA’s exports of this category.
21
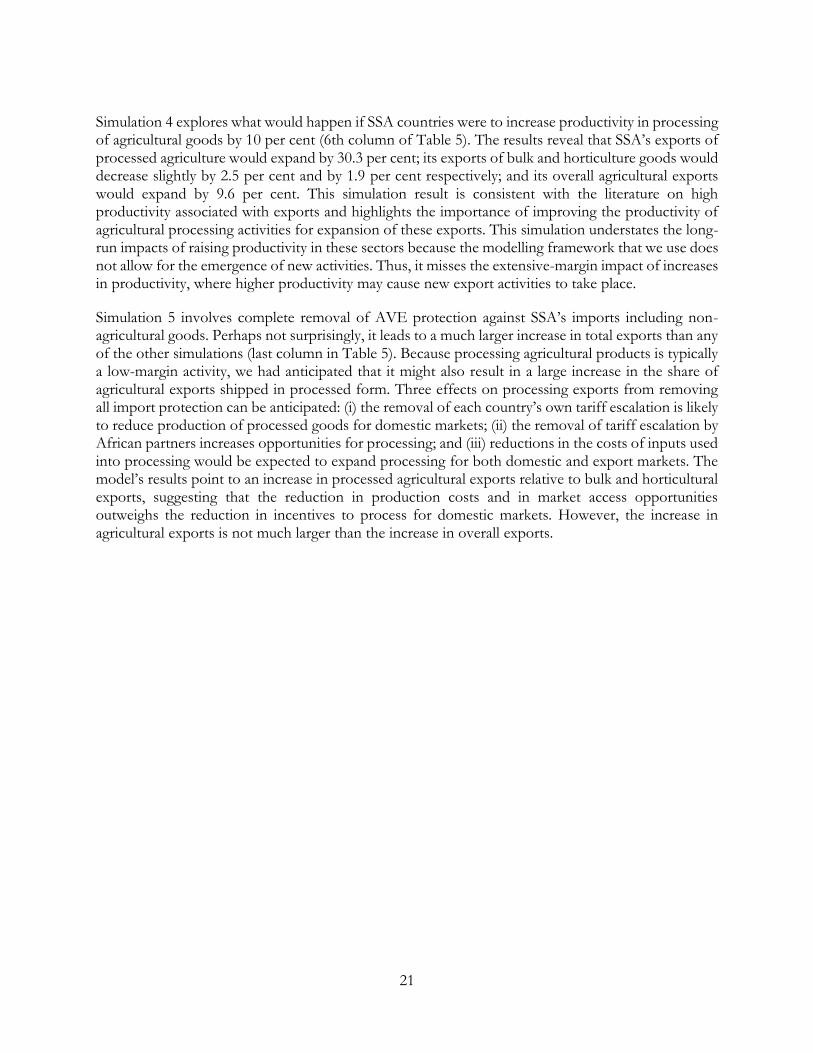
Simulation 4 explores what would happen if SSA countries were to increase productivity in processing of agricultural goods by 10 per cent (6th column of Table 5). The results reveal that SSA’s exports of processed agriculture would expand by 30.3 per cent; its exports of bulk and horticulture goods would decrease slightly by 2.5 per cent and by 1.9 per cent respectively; and its overall agricultural exports would expand by 9.6 per cent. This simulation result is consistent with the literature on high productivity associated with exports and highlights the importance of improving the productivity of agricultural processing activities for expansion of these exports. This simulation understates the long-run impacts of raising productivity in these sectors because the modelling framework that we use does not allow for the emergence of new activities. Thus, it misses the extensive-margin impact of increases in productivity, where higher productivity may cause new export activities to take place.
Simulation 5 involves complete removal of AVE protection against SSA’s imports including non-agricultural goods. Perhaps not surprisingly, it leads to a much larger increase in total exports than any of the other simulations (last column in Table 5). Because processing agricultural products is typically a low-margin activity, we had anticipated that it might also result in a large increase in the share of agricultural exports shipped in processed form. Three effects on processing exports from removing all import protection can be anticipated: (i) the removal of each country’s own tariff escalation is likely to reduce production of processed goods for domestic markets; (ii) the removal of tariff escalation by African partners increases opportunities for processing; and (iii) reductions in the costs of inputs used into processing would be expected to expand processing for both domestic and export markets. The model’s results point to an increase in processed agricultural exports relative to bulk and horticultural exports, suggesting that the reduction in production costs and in market access opportunities outweighs the reduction in incentives to process for domestic markets. However, the increase in agricultural exports is not much larger than the increase in overall exports.
22
Table 5: Simulation results: trade effects (%)
Sim 1 Sim 2 Sim 3 Sim 4 Sim 5 To Wld
To EU To Wld
SSA To Wld To Wld To Wld
1 pdr Paddy rice -9.87
-22.14 -2.96
9.01 -5.76 -5.76 9.05 2 wht Wheat -7.46
-61.76 -3.08
3.87 -3.24 -3.24 -16.05
3 gro Cereal grains nec -1.54
-5.70 -0.44
2.95 -0.59 -0.59 1.76 4 v_f Vegetables, fruit, nuts -3.46
-8.58 -3.30
17.42 -1.89 -1.89 4.32
5 osd Oil seeds -5.63
1.31 1.09
6.36 -3.21 -3.21 5.16 6 c_b Sugar cane, sugar beet -7.21
1.30 1.96
1.42 -4.40 -4.40 8.80
7 pfb Plant-based fibres -3.83
0.48 0.67
4.42 -1.92 -1.92 6.21 8 ocr Crops nec -5.69
-4.92 -1.73
14.10 -3.03 -3.03 7.06
9 ctl Cattle, sheep, goats, horses 3.00
-7.04 0.20
2.36 -1.10 -1.10 2.60 10 oap Animal products nec 2.78
-5.92 -1.08
10.74 0.93 0.93 3.24
11 rmk Raw milk -10.48
1.94 1.61
0.00 0.81 0.81 13.71 12 wol Wool, silk-worm cocoons -9.48
1.92 1.96
2.02 -0.33 -0.33 26.47
13 fsh Fishing -2.80
-1.45 -0.65
16.24 -1.08 -1.08 4.09 14 cmt Meat: cattle, sheep, goats, horse 5056.80
-95.74 -28.99
48.44 77.81 77.81 8.88
15 omt Meat products nec 34.23
-72.99 -12.08
67.06 80.20 80.20 3.02 16 vol Vegetable oils and fats 35.31
-13.27 -1.90
52.56 50.95 50.95 10.16
17 mil Dairy products 194.54
-75.59 -6.03
90.31 45.98 45.98 36.78 18 pcr Processed rice 22.76
-50.50 -4.88
38.38 34.96 34.96 3.25
19 sgr Sugar 60.62
-83.72 -52.15
54.57 37.01 37.01 29.03 20 ofd Food products nec -1.82
-21.19 -9.77
29.66 28.63 28.63 7.71
21 b_t Beverages and tobacco products -0.49
-4.93 -1.48
20.33 7.87 7.87 7.94 22 Others Non-agriculture -2.96
0.41 0.38
-0.18 -1.36 -1.36 9.45
Total
1.10
-2.05 -0.19
4.91 -0.30 -0.30 9.27
Summary of agricultural exports changes (%)
To Wld
To EU To Wld
Intra- SSA
To Wld To Wld To Wld
Bulk -4.58
-4.60 -1.04
8.24 0.28 -2.48 6.36 Horticulture -3.46
-8.58 -3.30
17.42 1.48 -1.89 4.32
Processed agriculture 114.27
-29.86 -12.20
37.57 13.08 30.31 10.50
Total agricultural exports 38.96
-14.91 -5.48
28.81 5.14 9.58 7.54
Source: Authors’ simulation results.
23
6 Policy questions
The decision on whether or not to export a raw agricultural product should still be based solely on the economics of the value-adding process. If, for instance, coffee may be exported in fresh or roasted form, the decision on whether to undertake the roasting stage should depend only on the costs and returns associated with undertaking that stage. The ‘great unbundling’ (Baldwin 2006) means, however, that other countries may well have become competitors for the bean-producing country in roasting the coffee. Naïve calculations that consider only the value of the roasted beans relative to the value of the raw beans—without considering the costs of the processing phase—are insufficient as a basis for deciding whether to undertake the processing phase in the producing country.
In general, it seems sensible for policy makers to delegate to producing and processing firms the decisions about whether to undertake particular stages of production, and to focus on providing an enabling environment in which producers may be able to take advantage of those opportunities that generate positive value added. Only producing firms are likely to have the information needed to assess whether it will pay them to undertake additional processing. However, in the ‘unbundled’ trade system, it is now much more important for governments to keep channels of communication open in order to identify when particular constraints that might be relaxed are preventing the emergence of particular processing stages in the country. If there are, for example, high tariffs on inputs needed in the production process, this may turn out to make it uneconomic to process the good domestically even though doing so would add value at world prices. Or costs associated with customs clearance and domestic transport may make it uneconomic for firms to process the good. In this situation, governments face important policy choices. Can they, and should they, reduce some of these costs to enable firms to undertake processing operations that would be economically worthwhile?
Vulnerability to excess costs is particularly acute for processing activities because these activities frequently operate on small margins relative to, say, production of a traditional export. Traditional exports such as coffee frequently embody an especially large share of rents that can be dissipated—particularly in the short term—without the activity shutting down. Consider, for example, the decision on whether to export live cattle or chilled, boxed, deboned beef. The livestock herder is likely to be cash poor and willing to sell cattle even if the price is quite far below the expected level and to be little affected by distortions in input markets. By contrast, the returns from slaughtering, boning, and packing beef are likely to be quite small relative to the cost of the animal and the needed intermediate inputs. If, for example, the beef from a US$100 animal is valued at US$150 on the world market and intermediate inputs and labour costs account for US$35 of the US$50, increases in the cost of intermediate inputs or labour could easily wipe out the needed returns from processing and either block the emergence of this activity or cause it to shut down.
If we find that high tariffs and other charges on intermediate inputs result in negative value added (at market prices) in at least some processing activities, the disincentive to undertaking these activities may result in economically desirable processing not being undertaken. If the government wishes, it may deal with these problems either by reforming its tariffs and customs regimes, or by specific export-focused policy responses such as providing duty exemptions on intermediates used in the production of exports. Responses of this type would not require negotiations with trading partners.
24
Another potential cause of failure to undertake desirable processing actions arises from distortions imposed by trading partners. A key challenge for processing in developing countries comes from tariff escalation in importing markets. In this situation, the tariff in the importing market is low on raw materials, higher on intermediates, and highest on final consumer goods. This policy option creates—and typically is intended to create—incentives to undertake processing in the importing country and to discourage processing in the exporting country. Such incentives could be countered by the exporting country, but this action would surely be difficult to undertake successfully. However, information on the extent of such tariff escalation is likely to be useful background for tariff negotiations.
The impact of tariff escalation is likely to be turned on its head when considering exporters which have access to effective preferences for raw and processed products. If we assume that processing a good adds 20 per cent to its initial value, then a tariff margin of 20 per cent between the raw and the processed form of a product creates a 100 per cent effective rate of protection on the processing activity. Under a non-discriminatory tariff regime, this assistance is provided to processors in the importing country. If this tariff applies against imports of most producers but some small producers receive a tariff preference, the 20 per cent effective rate of protection may be available to processors in the exporting market. Comparison of the mix of processing in preference and non-preference receiving exporters may provide some indication of the effectiveness of the preference regime in creating incentives for additional processing in exporting countries.
Developing new exports from Africa is both vitally important and very challenging. Some of the barriers that have been identified—such as geography and landlocked status (Freund and Rocha 2011) need to be addressed by adequate policy reforms and associated investments. For instance, in examining the effect of trade times on Africa’s exports of new products, Freund and Rocha (2011) report that reducing inland transit times significantly boosts exports (especially for time-sensitive agricultural exports) and suggest the importance of investments on inland transportation and infrastructure.
The stylized fact emerging from the recent literature on exporting firms that a small number of highly productive firms generally dominate exporting activities (Bernard et al. 2007) would seem to allay the concerns expressed by Hausmann and Rodrik (2003) that firms investing in costly discovery of successful exports lose the returns from export success through entry of copycat firms. In this situation, it seems possible, and perhaps vital to create a situation which stimulates firms to invest in discovery of new opportunities. Approaches to creating incentives for innovative exports by providing protection to sales on the domestic market appear to have little applicability in Africa. Large domestic markets for these products only rarely exist, and even if they do, are likely to become saturated relatively rapidly, leaving innovators with low returns on their investment. While export subsidies for developing countries are only loosely constrained by WTO rules (Creskoff and Walkenhorst 2009)—and are almost unconstrained for LDCs and countries with incomes below US$1000—the fiscal costs of such export subsidies are likely to be very high. Fiscal problems are likely to arise with the third policy option considered by Hausmann and Rodrik (2003: 630)—the provision of grants and subsidies to chosen firms. If these subsidies are large enough to make a difference, they are likely to be very costly. Further, Farole (2011: 173) finds that these incentives are associated with poorer performance in African economic zones.
25
By contrast, the approach of providing a relatively level playing field on which exporters can experiment in order to identify successful exports seems promising. One approach to providing an environment for experimentation is to allow exporters to access intermediate inputs for use in production of exports at world prices. In China, duty exemptions were a central feature of its economic reforms, allowing exporters to use imported materials and to increase processed exports in a wide range of labour-intensive activities (Ianchovichina 2004). Other successful exporters of industrial goods, for instance, Cambodia, Mauritius, Tunisia, and Vietnam, also established a ‘free trade regime for exporters’ through a variety of mechanisms such as tariff exemptions, duty drawbacks, and rebates of indirect taxes (Newman et al. 2016a).
A duty exemption or duty drawback system reduces the burden imposed by a country’s own protection regime and decreases the inefficiency associated with the country’s trade regime by eliminating the negative effective rates of protection resulting from exporters having to pay import duties on their intermediate inputs while receiving no protection on their outputs. Given the low margins inherent in many processing activities, this problem of negative protection can frequently explain the absence of many highly productive export activities. Duty exemptions, under which duties are waived on imported inputs subject to subsequent verification of their incorporation in exports, are strongly preferred by exporters to duty drawbacks where duties must be paid and are—in principle—refunded on export of the final good. A related export facilitation mechanism needed in countries applying a Value Added Tax (VAT) is a refund of the VAT paid on intermediate inputs used in the production of exports. This is an inherent feature of any destination VAT and not a special export processing incentive. It, like a duty exemption arrangement, is fully consistent with WTO rules on subsidies (Creskoff and Walkenhorst 2009).
Duty exemptions and VAT refund mechanisms are frequently part of more comprehensive export promotion mechanisms such as Special Economic Zones (SEZ) (Farole 2011). SEZs typically involve other features such as improved infrastructure, and a different regulatory environment from the rest of the economy. Frequently, this environment is designed to attract foreign direct investment. Collier and Page (2009) point to strong advantages if they are located in geographically favoured regions near infrastructure. Farole (2011: Chapter 8) finds that African zones have encountered difficulties in a number of areas, including: unreliability of power supply relative to Asian zones; slow customs procedures; and wage rates that are high relative to labour productivity.
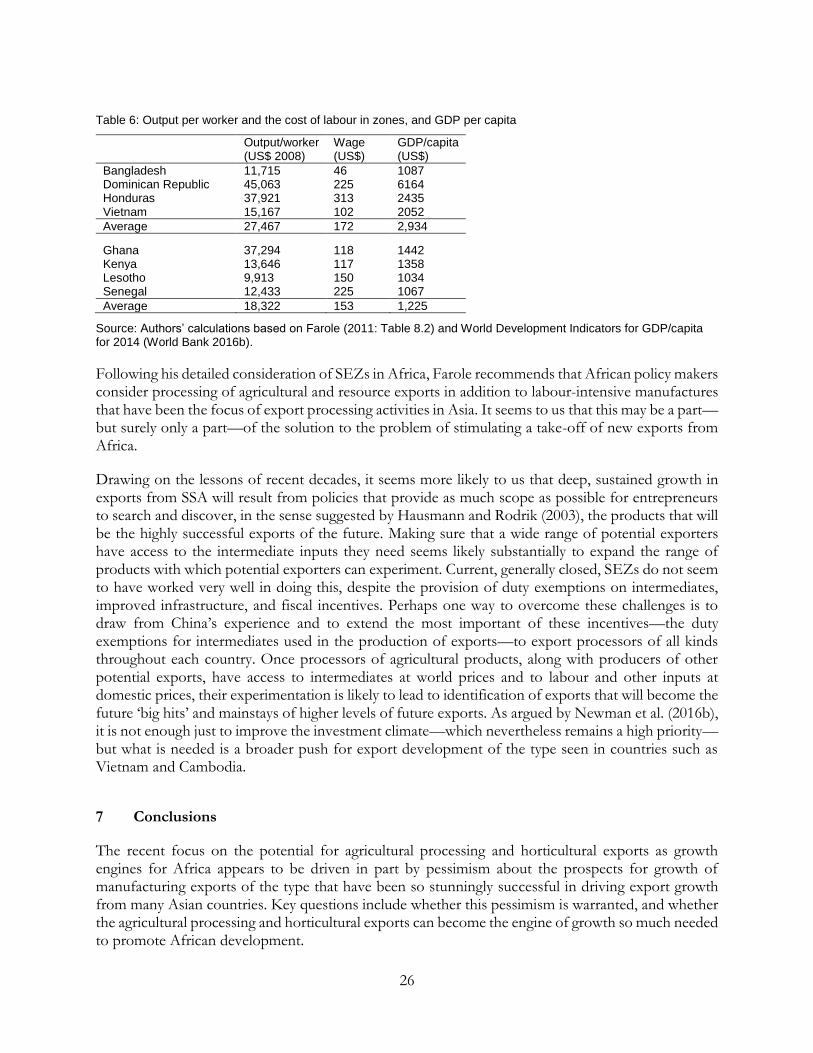
The high wage rates relative to productivity seem surprising given the very low incomes prevailing in much of SSA. This may reflect some sort of insider–outsider distinction that results in relatively high wage rates and high output per firm for a relatively small volume of output and level of employment. Using Farole’s (2011: Table 8.2) numbers on output per person in the zones and adding 2014 GDP per person, Table 6 shows that wage rates in the African SEZs are almost 90 per cent of wage rates in his four comparator countries, even though GDP per capita, and, hence, likely the opportunity cost of labour to the zone, is only 42 per cent of the level in the comparator countries. The difference is even more stark with the two highly successful Asian comparators—Bangladesh and Vietnam—where wages average less than half the African rate even though national incomes are higher.
26
Table 6: Output per worker and the cost of labour in zones, and GDP per capita
Output/worker (US$ 2008)
Wage (US$)
GDP/capita (US$)
Bangladesh 11,715 46 1087 Dominican Republic 45,063 225 6164 Honduras 37,921 313 2435 Vietnam 15,167 102 2052
Average 27,467 172 2,934 Ghana 37,294 118 1442 Kenya 13,646 117 1358 Lesotho 9,913 150 1034 Senegal 12,433 225 1067
Average 18,322 153 1,225
Source: Authors’ calculations based on Farole (2011: Table 8.2) and World Development Indicators for GDP/capita for 2014 (World Bank 2016b).
Following his detailed consideration of SEZs in Africa, Farole recommends that African policy makers consider processing of agricultural and resource exports in addition to labour-intensive manufactures that have been the focus of export processing activities in Asia. It seems to us that this may be a part—but surely only a part—of the solution to the problem of stimulating a take-off of new exports from Africa.
Drawing on the lessons of recent decades, it seems more likely to us that deep, sustained growth in exports from SSA will result from policies that provide as much scope as possible for entrepreneurs to search and discover, in the sense suggested by Hausmann and Rodrik (2003), the products that will be the highly successful exports of the future. Making sure that a wide range of potential exporters have access to the intermediate inputs they need seems likely substantially to expand the range of products with which potential exporters can experiment. Current, generally closed, SEZs do not seem to have worked very well in doing this, despite the provision of duty exemptions on intermediates, improved infrastructure, and fiscal incentives. Perhaps one way to overcome these challenges is to draw from China’s experience and to extend the most important of these incentives—the duty exemptions for intermediates used in the production of exports—to export processors of all kinds throughout each country. Once processors of agricultural products, along with producers of other potential exports, have access to intermediates at world prices and to labour and other inputs at domestic prices, their experimentation is likely to lead to identification of exports that will become the future ‘big hits’ and mainstays of higher levels of future exports. As argued by Newman et al. (2016b), it is not enough just to improve the investment climate—which nevertheless remains a high priority—but what is needed is a broader push for export development of the type seen in countries such as Vietnam and Cambodia.
7 Conclusions
The recent focus on the potential for agricultural processing and horticultural exports as growth engines for Africa appears to be driven in part by pessimism about the prospects for growth of manufacturing exports of the type that have been so stunningly successful in driving export growth from many Asian countries. Key questions include whether this pessimism is warranted, and whether the agricultural processing and horticultural exports can become the engine of growth so much needed to promote African development.
27
New developments in economics have given us new insights into the growth of exports that are highly relevant for analysis of this question. We now know that exports of any country tend to be dominated by a relatively small number of products, often exported to a relatively small number of markets (Easterly and Reshef 2009, 2010), and frequently by a small number of highly productive firms. This reduces the concerns that have been expressed by authors such as Hausmann and Rodrik (2003) about the risk that innovators will not be able to recoup their fixed costs of discovery because of excessive entry of imitators.
When we look at the pattern of exports from African countries, we find that the share of agricultural exports has declined to around 10 per cent of the total, somewhat less than the 12 per cent of exports accounted for by non-factor services. This is a very small share on which to build if the goal is to stimulate dramatic growth in exports through exports of horticultural or processed agricultural products. Within agricultural exports, the share of traditional, bulk agricultural exports has fallen sharply, from 60 to 42 per cent, although this is now twice the share of these exports in global trade. Where Africa does stand out is in the share of horticultural products in total exports—over 22 per cent of agricultural exports in 2014 as against 12 per cent for the world as a whole.
The relatively low—but rising—share of processed agricultural exports from Africa may reflect the relatively low incomes in African countries. When we plot the share of value added of processed agriculture relative to total agriculture in Africa against real incomes, we find no need for an Africa-specific explanation. Most of the observations are distributed around a rising trend. When we look at the share of exports, African exports of processed products relative to total agricultural exports also seem to follow the same broad relationship as other countries, in this case a quadratic response to income growth.
Simulation analysis is used to examine the response of processed agricultural exports from Africa to changes in protection rates and productivity growth in processing. The results suggest that tariff escalation in export markets has powerful impacts. Cutting protection on processed agricultural products in export markets would substantially increase exports of processed products from Africa. Cutting agricultural protection within main African trade blocs and extending liberalization to all the trading partners and to all the goods would similarly increase exports of processed agricultural products.
Our overall assessment is that increased exports of processed agricultural products could be a worthwhile contributor to an overall upturn in African agricultural exports. Horticultural products could also contribute to such a turnaround. However, our view is that policy makers should think much more broadly, in a way that the export promotion strategy for these products is consistent with the development of other export-oriented goods and services. For instance, a promising way to encourage a surge in agro-processing and horticultural exports would be to reduce the cost of intermediate inputs generally. Reducing this disadvantage for exports—ideally by reducing protection, but perhaps initially by ensuring that all exporters have access to intermediates at world prices—is likely to stimulate growth in a wide range of exports as entrepreneurs discover what exports best use the country’s skills and resources.
28
References
Adelman, M. (1969). ‘Comment on the “H” Concentration Measure as a Numbers-equivalent’. Review of Economics and Statistics, 51(1): 99–101.
Badiane, O., T. Makombe, and G. Bahiigwa (2013). ‘Promoting Agricultural Trade to Enhance Resilience in Africa’. ReSAKSS Annual Trends and Outlook Report 2013. Washington, DC: International Food Policy Research Institute (IFPRI).
Balassa, B. (1965). ‘Trade Liberalization and “Revealed” Comparative Advantage’. The Manchester School, 33(2): 99–123.
Baldwin, R.E. (2006). Globalization: The Great Unbundling(s). Helsinki: Economic Council of Finland.
Bernard, A., and J. Jensen (1995). ‘Exporters, Jobs, and Wages in U.S. Manufacturing: 1976–1987’. Brookings Papers on Economic Activity, 1995: 67–119.
Bernard, A., J.B. Jensen, S. Redding, and P. Schott (2007). ‘Firms in International Trade’. Journal of Economic Perspectives, 21(3): 105–30.
Bigsten, A., P. Collier, S. Dercon, M. Fafchamps, B. Gauthier, J. Gunning, A. Oduro, R. Oostendorp, C. Pattillo, M. Söderbom, F. Teal, and A. Zeufack (2004). ‘Do African Manufacturing Firms Learn from Exporting?’ Journal of Development Studies, 40(3): 115–41.
Brambilla, I., N. Depetris Chauvin, and G. Porto (2015). ‘Wage and Employment Gains from Exports: Evidence from Developing Countries’. CEPII Working Paper 2015–28. Paris: CEPII.
Clerides, S., S. Lach, and J. Tybout (1998). ‘Is Learning by Exporting Important? Micro-Dynamic Evidence from Colombia, Mexico, and Morocco’. Quarterly Journal of Economics, 113(3): 903–47.
Collier, P., and J. Page (2009). ‘Breaking In and Moving Up: New Industrial Challenges for the Bottom Billion and the Middle-Income Countries’. Vienna: UNIDO.
Creskoff, S., and P. Walkenhorst (2009). ‘Implications of WTO Disciplines for Special Economic Zones in Developing Countries’. World Bank Policy Research Working Paper 4892. Washington, DC: World Bank.
da Silva, C., D. Baker, A. Shepherd, C. Jenane, and S. Miranda-da-Cruz, S. (eds.) (2009). Agro-Industries for Development. Rome: FAO.
de Janvry, A. (2009). ‘Agriculture for Development—Implications for Agro-industries’. In C. da Silva, D. Baker, A. Shepherd, C. Jenane, and S. Miranda-da-Cruz (eds), Agro-Industries for Development. Rome: FAO.
Dimaranan, B., E. Ianchovichina, and W. Martin (2007). ‘Competing with Giants: Who Wins, Who Loses?’ In L.A. Winters, and S. Yusuf (eds), Dancing with Giants: China, India and the Global Economy. Washington, DC and Singapore: World Bank and Institute of Policy Studies.
Easterly, W., and A. Reshef (2009). ‘Big Hits in Manufacturing Exports and Development’. Mimeo. New York, NY: New York University.
Easterly, W., and A. Reshef (2010). ‘African Export Successes: Surprises, Stylized Facts, and Explanation’. In D. Weil, S. Edwards, and S. Johnson (eds), African Successes: Modernization and Development. NBER Working Paper 16597, Cambridge, MA: National Bureau of Economic Research.
29
Farole, T. (2011). Special Economic Zones in Africa: Comparing Performance and Learning from Global Experience. Washington, DC: World Bank.
Freund, C., and N. Rocha (2011). ‘What Constrains Africa’s Exports?’. World Bank Economic Review, 25(3): 361–86.
Fukase, E. (2013). ‘Export Liberalization, Job Creation, and the Skill Premium: Evidence from the US–Vietnam Bilateral Trade Agreement (BTA)’. World Development, 41: 317–37.
Gopinath, M., I. Sheldon, and R. Echeverria (2007). Firm Heterogeneity and International Trade: Implications for Agricultural and Food Industries. IATRC Trade Policy Issues Paper 5, St Paul, MN: International Agricultural Trade Research Consortium.
GTAP (Global Trade Analysis Project) ‘GTAP Database Version 9’. Available at: https://www.gtap.agecon.purdue.edu/databases/v9/
Guimbard, H., S. Jean, M. Mimouni, and X. Pichot (2012). ‘MAcMap-HS6 2007, an Exhaustive and Consistent Measure of Applied Protection in 2007’. International Economics, 130: 99–121.
Hamilton, A. (1791). ‘Report on Manufactures.’ In S. McKee (ed), Papers on Public Credit, Commerce, and Finance by Alexander Hamilton. New York: Columbia University Press.
Hausmann, R., and D. Rodrik (2003). ‘Economic Development as Self-Discovery’. Journal of Development Economics, 72: 603– 33.
Hertel, T.W. (ed.) (1997). Global Trade Analysis: Modeling and Applications. Cambridge: Cambridge University Press.
Ianchovichina, E. (2004). ‘Trade Policy Analysis in the Presence of Duty Drawbacks’. Journal of Policy Modeling, 26(3): 353–71.
Jensen, F., S. Robinson, and F. Tarp (2010). ‘Measuring Agricultural Policy Bias: General Equilibrium Analysis of Fifteen Developing Countries’. American Journal of Agricultural Economics, 92(4): 1136–48.
Kehoe, T.J., and K. Ruhl (2013). ‘How Important is the New Goods Margin in International Trade?’. Journal of Political Economy, 121(2): 358–92.
Liapis, P. (2011). Changing Patterns of Trade in Processed Agricultural Products. Food, Agriculture and Fisheries Papers, No. 47. OECD Publishing. Available at: http://dx.doi.org/10.1787/5kgc3mq19s6d-en
Mengistae, T., and C. Pattillo (2004). ‘Export Orientation and Productivity in Sub-Saharan Africa’. IMF Staff Papers, 51: 327–53.
Minten, B., L. Randrianarison, and J.F. Swinnen (2009). ‘Global Retail Chains and Poor Farmers: Evidence from Madagascar’. World Development, 37(11): 1728–41.
Mulangu, F., and L. Olarinde (2016). ‘Decision to Export among Ghanaian Manufacturing Firms: Does Export Destination Influence the Entry Sunk Cost?’. AGRODEP Working Paper 0025, April. Washington, DC: International Food Policy Research Institute (IFPRI).
Newman, C., J. Page, J. Rand, and A. Shimeles (2016a). Made in Africa: Learning to Compete in Industry. Washington, DC: Brookings Institution Press.
30
Newman, C., J. Page, J. Rand, A. Shimeles, M. Söderbom, and F. Tarp (eds.) (2016b). Manufacturing Transformation: Comparative Studies of Industrial Development in Africa and Emerging Asia. Oxford: Oxford University Press.
Page, J. (2012). ‘Can Africa Industrialize?’ Journal of African Economies, AERC Supplement 2: 86–125.
Regmi, A., M. Gehlhar, J. Wainio, T. Vollrath, P. Johnston, and N. Kathuria (2005). Market Access for High-Value Foods. USDA Agricultural Economic Report 840, February. Washington, DC: USDA.
Van Biesebroeck, J. (2005). ‘Exporting Raises Productivity in Sub-Saharan African Manufacturing Firms’. Journal of International Economics, 67: 373–391
World Bank (2016a). ‘World Integrated Trade Solution (WITS)’. Available at: http://wits.worldbank.org/ (accessed June 2016).
World Bank (2016b). ‘World Development Indicators’. Available at: http://data.worldbank.org/data-catalog/world-development-indicators (accessed June 2016).
WTO (2008). ‘Revised Draft Modalities for Agriculture’. Committee on Agriculture, Special Session TN/AG/W/4/Rev.4, 6 December.
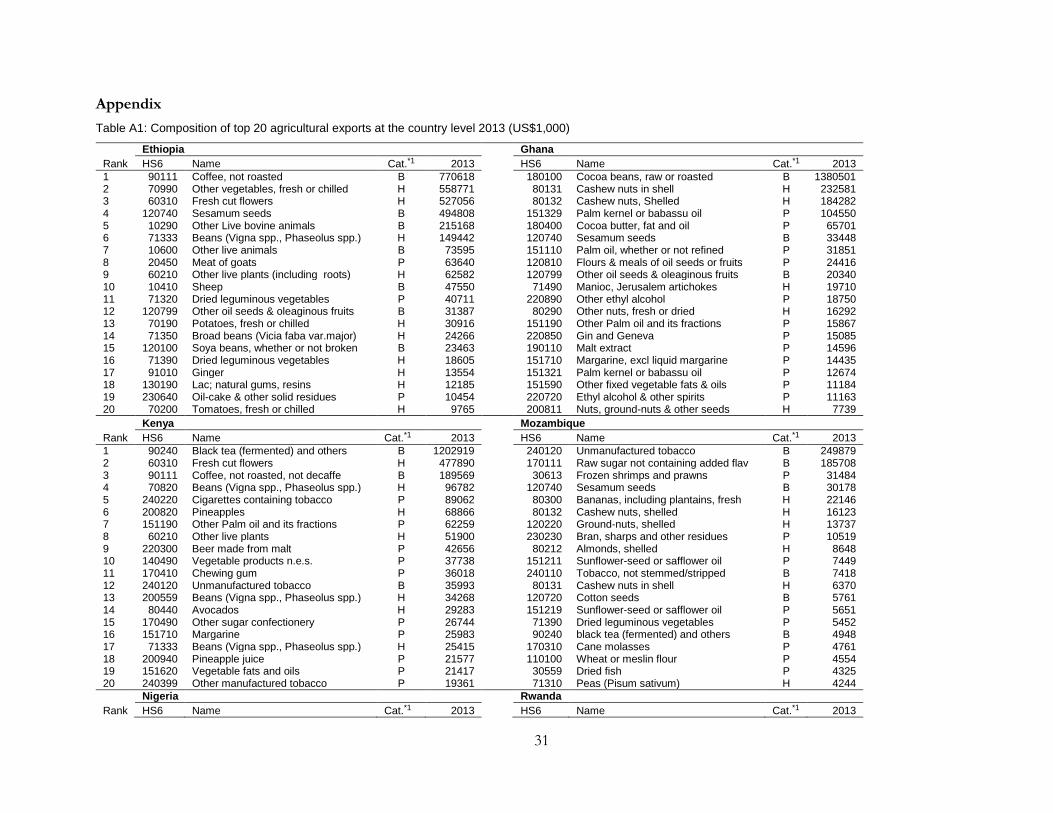
31
Appendix
Table A1: Composition of top 20 agricultural exports at the country level 2013 (US$1,000)
Ethiopia Ghana
Rank HS6 Name Cat.*1 2013 HS6 Name Cat.*1 2013
1 90111 Coffee, not roasted B 770618 180100 Cocoa beans, raw or roasted B 1380501 2 70990 Other vegetables, fresh or chilled H 558771 80131 Cashew nuts in shell H 232581 3 60310 Fresh cut flowers H 527056 80132 Cashew nuts, Shelled H 184282 4 120740 Sesamum seeds B 494808 151329 Palm kernel or babassu oil P 104550 5 10290 Other Live bovine animals B 215168 180400 Cocoa butter, fat and oil P 65701 6 71333 Beans (Vigna spp., Phaseolus spp.) H 149442 120740 Sesamum seeds B 33448 7 10600 Other live animals B 73595 151110 Palm oil, whether or not refined P 31851 8 20450 Meat of goats P 63640 120810 Flours & meals of oil seeds or fruits P 24416 9 60210 Other live plants (including roots) H 62582 120799 Other oil seeds & oleaginous fruits B 20340 10 10410 Sheep B 47550 71490 Manioc, Jerusalem artichokes H 19710 11 71320 Dried leguminous vegetables P 40711 220890 Other ethyl alcohol P 18750 12 120799 Other oil seeds & oleaginous fruits B 31387 80290 Other nuts, fresh or dried H 16292 13 70190 Potatoes, fresh or chilled H 30916 151190 Other Palm oil and its fractions P 15867 14 71350 Broad beans (Vicia faba var.major) H 24266 220850 Gin and Geneva P 15085 15 120100 Soya beans, whether or not broken B 23463 190110 Malt extract P 14596 16 71390 Dried leguminous vegetables H 18605 151710 Margarine, excl liquid margarine P 14435 17 91010 Ginger H 13554 151321 Palm kernel or babassu oil P 12674 18 130190 Lac; natural gums, resins H 12185 151590 Other fixed vegetable fats & oils P 11184 19 230640 Oil-cake & other solid residues P 10454 220720 Ethyl alcohol & other spirits P 11163 20 70200 Tomatoes, fresh or chilled H 9765 200811 Nuts, ground-nuts & other seeds H 7739 Kenya Mozambique
Rank HS6 Name Cat.*1 2013 HS6 Name Cat.*1 2013
1 90240 Black tea (fermented) and others B 1202919 240120 Unmanufactured tobacco B 249879 2 60310 Fresh cut flowers H 477890 170111 Raw sugar not containing added flav B 185708 3 90111 Coffee, not roasted, not decaffe B 189569 30613 Frozen shrimps and prawns P 31484 4 70820 Beans (Vigna spp., Phaseolus spp.) H 96782 120740 Sesamum seeds B 30178 5 240220 Cigarettes containing tobacco P 89062 80300 Bananas, including plantains, fresh H 22146 6 200820 Pineapples H 68866 80132 Cashew nuts, shelled H 16123 7 151190 Other Palm oil and its fractions P 62259 120220 Ground-nuts, shelled H 13737 8 60210 Other live plants H 51900 230230 Bran, sharps and other residues P 10519 9 220300 Beer made from malt P 42656 80212 Almonds, shelled H 8648 10 140490 Vegetable products n.e.s. P 37738 151211 Sunflower-seed or safflower oil P 7449 11 170410 Chewing gum P 36018 240110 Tobacco, not stemmed/stripped B 7418 12 240120 Unmanufactured tobacco B 35993 80131 Cashew nuts in shell H 6370 13 200559 Beans (Vigna spp., Phaseolus spp.) H 34268 120720 Cotton seeds B 5761 14 80440 Avocados H 29283 151219 Sunflower-seed or safflower oil P 5651 15 170490 Other sugar confectionery P 26744 71390 Dried leguminous vegetables P 5452 16 151710 Margarine P 25983 90240 black tea (fermented) and others B 4948 17 71333 Beans (Vigna spp., Phaseolus spp.) H 25415 170310 Cane molasses P 4761 18 200940 Pineapple juice P 21577 110100 Wheat or meslin flour P 4554 19 151620 Vegetable fats and oils P 21417 30559 Dried fish P 4325 20 240399 Other manufactured tobacco P 19361 71310 Peas (Pisum sativum) H 4244
Nigeria Rwanda
Rank HS6 Name Cat.*1 2013 HS6 Name Cat.*1 2013
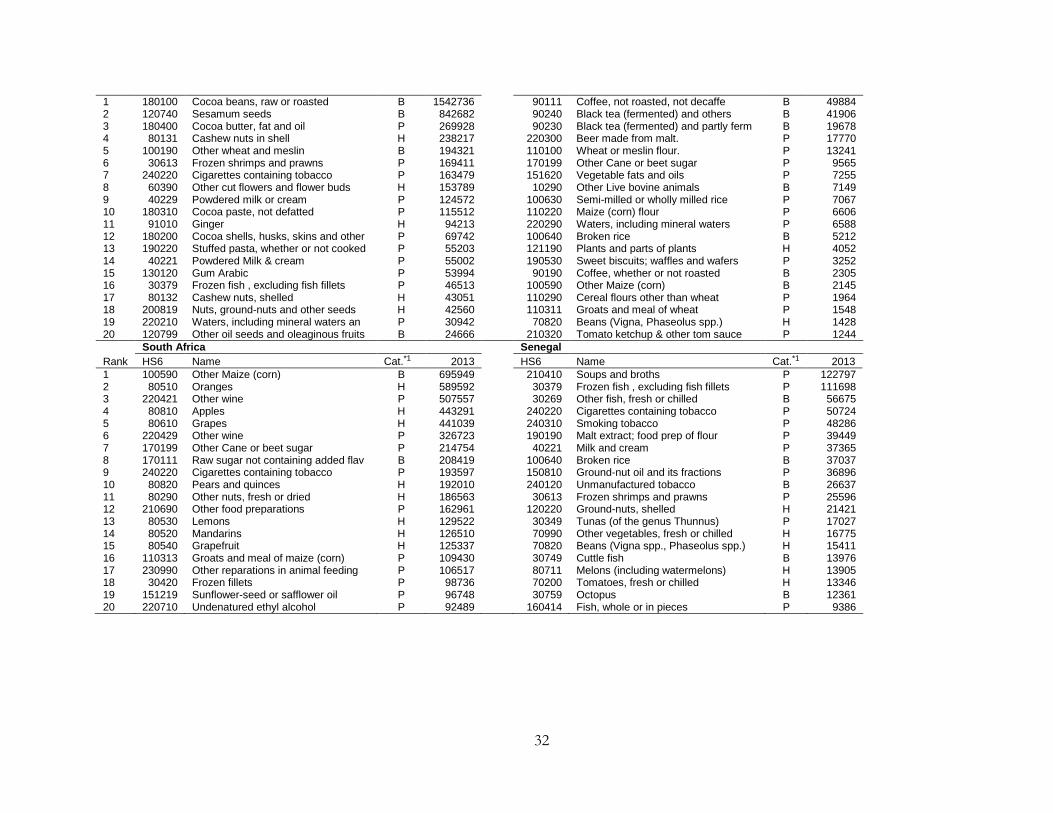
32
1 180100 Cocoa beans, raw or roasted B 1542736 90111 Coffee, not roasted, not decaffe B 49884 2 120740 Sesamum seeds B 842682 90240 Black tea (fermented) and others B 41906 3 180400 Cocoa butter, fat and oil P 269928 90230 Black tea (fermented) and partly ferm B 19678 4 80131 Cashew nuts in shell H 238217 220300 Beer made from malt. P 17770 5 100190 Other wheat and meslin B 194321 110100 Wheat or meslin flour. P 13241 6 30613 Frozen shrimps and prawns P 169411 170199 Other Cane or beet sugar P 9565 7 240220 Cigarettes containing tobacco P 163479 151620 Vegetable fats and oils P 7255 8 60390 Other cut flowers and flower buds H 153789 10290 Other Live bovine animals B 7149 9 40229 Powdered milk or cream P 124572 100630 Semi-milled or wholly milled rice P 7067 10 180310 Cocoa paste, not defatted P 115512 110220 Maize (corn) flour P 6606 11 91010 Ginger H 94213 220290 Waters, including mineral waters P 6588 12 180200 Cocoa shells, husks, skins and other P 69742 100640 Broken rice B 5212 13 190220 Stuffed pasta, whether or not cooked P 55203 121190 Plants and parts of plants H 4052 14 40221 Powdered Milk & cream P 55002 190530 Sweet biscuits; waffles and wafers P 3252 15 130120 Gum Arabic P 53994 90190 Coffee, whether or not roasted B 2305 16 30379 Frozen fish , excluding fish fillets P 46513 100590 Other Maize (corn) B 2145 17 80132 Cashew nuts, shelled H 43051 110290 Cereal flours other than wheat P 1964 18 200819 Nuts, ground-nuts and other seeds H 42560 110311 Groats and meal of wheat P 1548 19 220210 Waters, including mineral waters an P 30942 70820 Beans (Vigna, Phaseolus spp.) H 1428 20 120799 Other oil seeds and oleaginous fruits B 24666 210320 Tomato ketchup & other tom sauce P 1244
South Africa Senegal
Rank HS6 Name Cat.*1 2013 HS6 Name Cat.*1 2013
1 100590 Other Maize (corn) B 695949 210410 Soups and broths P 122797 2 80510 Oranges H 589592 30379 Frozen fish , excluding fish fillets P 111698 3 220421 Other wine P 507557 30269 Other fish, fresh or chilled B 56675 4 80810 Apples H 443291 240220 Cigarettes containing tobacco P 50724 5 80610 Grapes H 441039 240310 Smoking tobacco P 48286 6 220429 Other wine P 326723 190190 Malt extract; food prep of flour P 39449 7 170199 Other Cane or beet sugar P 214754 40221 Milk and cream P 37365 8 170111 Raw sugar not containing added flav B 208419 100640 Broken rice B 37037 9 240220 Cigarettes containing tobacco P 193597 150810 Ground-nut oil and its fractions P 36896 10 80820 Pears and quinces H 192010 240120 Unmanufactured tobacco B 26637 11 80290 Other nuts, fresh or dried H 186563 30613 Frozen shrimps and prawns P 25596 12 210690 Other food preparations P 162961 120220 Ground-nuts, shelled H 21421 13 80530 Lemons H 129522 30349 Tunas (of the genus Thunnus) P 17027 14 80520 Mandarins H 126510 70990 Other vegetables, fresh or chilled H 16775 15 80540 Grapefruit H 125337 70820 Beans (Vigna spp., Phaseolus spp.) H 15411 16 110313 Groats and meal of maize (corn) P 109430 30749 Cuttle fish B 13976 17 230990 Other reparations in animal feeding P 106517 80711 Melons (including watermelons) H 13905 18 30420 Frozen fillets P 98736 70200 Tomatoes, fresh or chilled H 13346 19 151219 Sunflower-seed or safflower oil P 96748 30759 Octopus B 12361 20 220710 Undenatured ethyl alcohol P 92489 160414 Fish, whole or in pieces P 9386
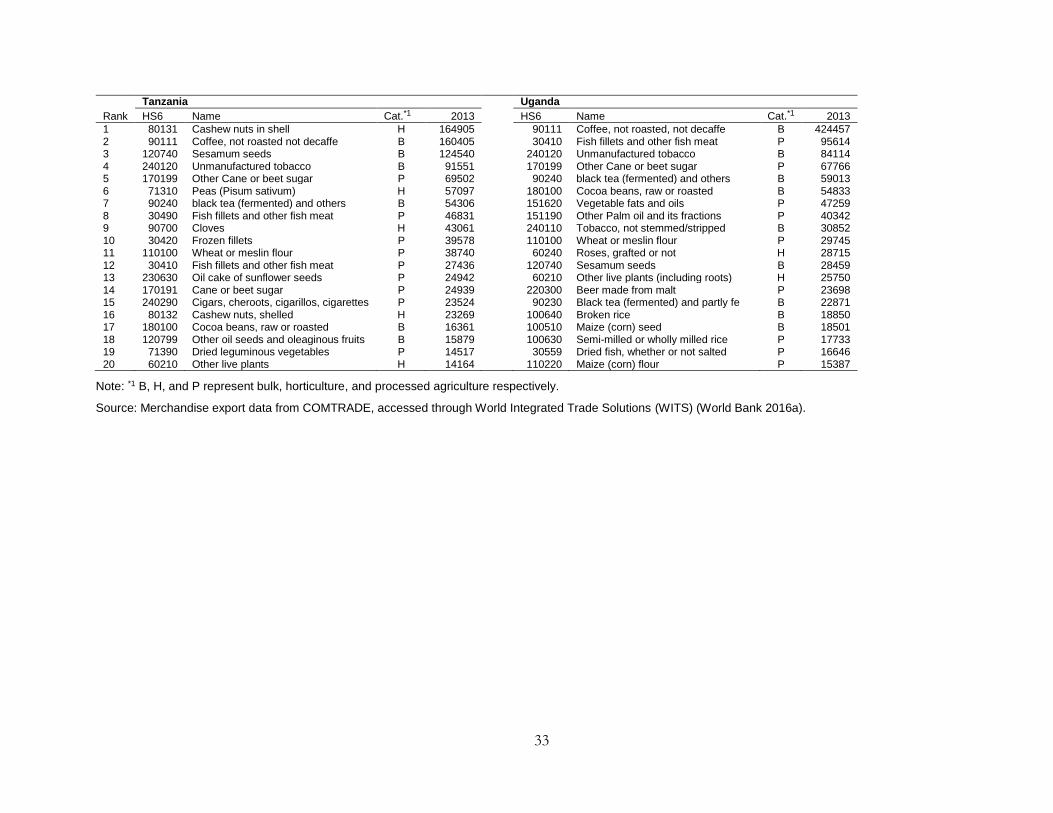
33
Tanzania Uganda
Rank HS6 Name Cat.*1 2013 HS6 Name Cat.*1 2013
1 80131 Cashew nuts in shell H 164905 90111 Coffee, not roasted, not decaffe B 424457 2 90111 Coffee, not roasted not decaffe B 160405 30410 Fish fillets and other fish meat P 95614 3 120740 Sesamum seeds B 124540 240120 Unmanufactured tobacco B 84114 4 240120 Unmanufactured tobacco B 91551 170199 Other Cane or beet sugar P 67766 5 170199 Other Cane or beet sugar P 69502 90240 black tea (fermented) and others B 59013 6 71310 Peas (Pisum sativum) H 57097 180100 Cocoa beans, raw or roasted B 54833 7 90240 black tea (fermented) and others B 54306 151620 Vegetable fats and oils P 47259 8 30490 Fish fillets and other fish meat P 46831 151190 Other Palm oil and its fractions P 40342 9 90700 Cloves H 43061 240110 Tobacco, not stemmed/stripped B 30852 10 30420 Frozen fillets P 39578 110100 Wheat or meslin flour P 29745 11 110100 Wheat or meslin flour P 38740 60240 Roses, grafted or not H 28715 12 30410 Fish fillets and other fish meat P 27436 120740 Sesamum seeds B 28459 13 230630 Oil cake of sunflower seeds P 24942 60210 Other live plants (including roots) H 25750 14 170191 Cane or beet sugar P 24939 220300 Beer made from malt P 23698 15 240290 Cigars, cheroots, cigarillos, cigarettes P 23524 90230 Black tea (fermented) and partly fe B 22871 16 80132 Cashew nuts, shelled H 23269 100640 Broken rice B 18850 17 180100 Cocoa beans, raw or roasted B 16361 100510 Maize (corn) seed B 18501 18 120799 Other oil seeds and oleaginous fruits B 15879 100630 Semi-milled or wholly milled rice P 17733 19 71390 Dried leguminous vegetables P 14517 30559 Dried fish, whether or not salted P 16646 20 60210 Other live plants H 14164 110220 Maize (corn) flour P 15387
Note: *1 B, H, and P represent bulk, horticulture, and processed agriculture respectively.
Source: Merchandise export data from COMTRADE, accessed through World Integrated Trade Solutions (WITS) (World Bank 2016a).
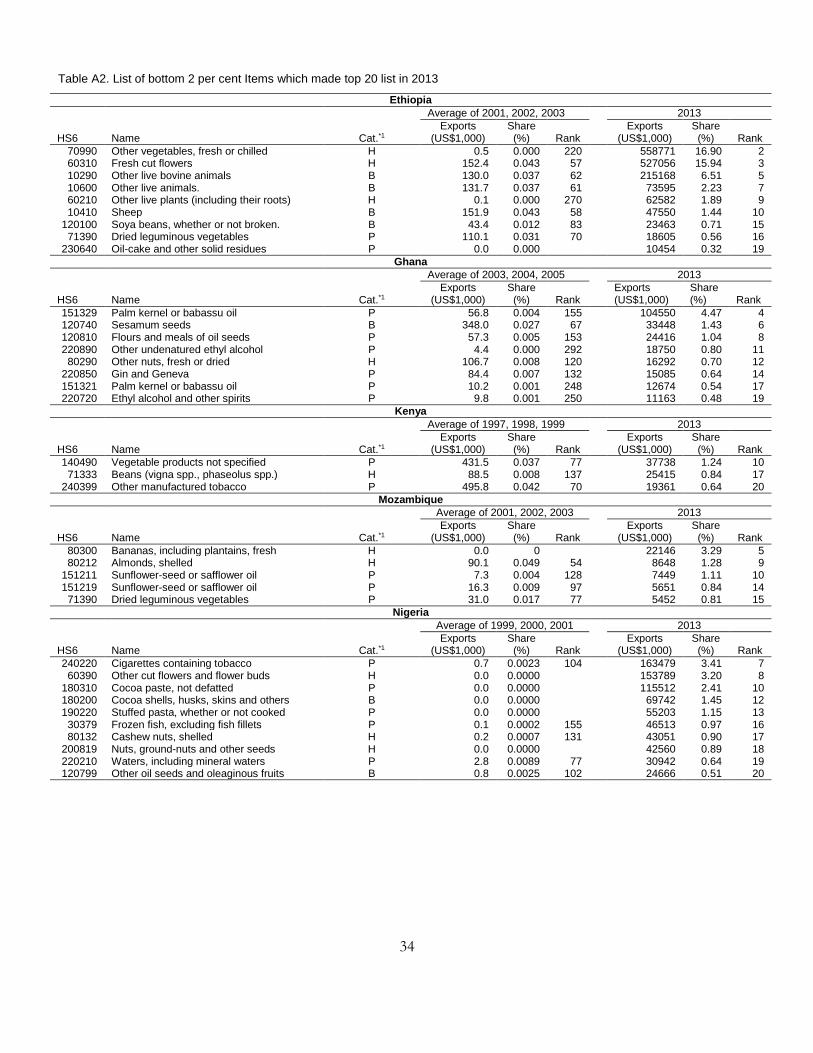
34
Table A2. List of bottom 2 per cent Items which made top 20 list in 2013
Ethiopia
Average of 2001, 2002, 2003 2013
Exports Share Exports Share
HS6 Name Cat.*1 (US$1,000) (%) Rank (US$1,000) (%) Rank
70990 Other vegetables, fresh or chilled H 0.5 0.000 220 558771 16.90 2 60310 Fresh cut flowers H 152.4 0.043 57 527056 15.94 3 10290 Other live bovine animals B 130.0 0.037 62 215168 6.51 5 10600 Other live animals. B 131.7 0.037 61 73595 2.23 7 60210 Other live plants (including their roots) H 0.1 0.000 270 62582 1.89 9 10410 Sheep B 151.9 0.043 58 47550 1.44 10
120100 Soya beans, whether or not broken. B 43.4 0.012 83 23463 0.71 15 71390 Dried leguminous vegetables P 110.1 0.031 70 18605 0.56 16
230640 Oil-cake and other solid residues P 0.0 0.000 10454 0.32 19
Ghana
Average of 2003, 2004, 2005 2013
Exports Share Exports Share
HS6 Name Cat.*1 (US$1,000) (%) Rank (US$1,000) (%) Rank
151329 Palm kernel or babassu oil P 56.8 0.004 155 104550 4.47 4 120740 Sesamum seeds B 348.0 0.027 67 33448 1.43 6 120810 Flours and meals of oil seeds P 57.3 0.005 153 24416 1.04 8 220890 Other undenatured ethyl alcohol P 4.4 0.000 292 18750 0.80 11 80290 Other nuts, fresh or dried H 106.7 0.008 120 16292 0.70 12
220850 Gin and Geneva P 84.4 0.007 132 15085 0.64 14 151321 Palm kernel or babassu oil P 10.2 0.001 248 12674 0.54 17 220720 Ethyl alcohol and other spirits P 9.8 0.001 250 11163 0.48 19
Kenya
Average of 1997, 1998, 1999 2013
Exports Share Exports Share
HS6 Name Cat.*1 (US$1,000) (%) Rank (US$1,000) (%) Rank
140490 Vegetable products not specified P 431.5 0.037 77 37738 1.24 10 71333 Beans (vigna spp., phaseolus spp.) H 88.5 0.008 137 25415 0.84 17
240399 Other manufactured tobacco P 495.8 0.042 70 19361 0.64 20
Mozambique
Average of 2001, 2002, 2003 2013
Exports Share Exports Share
HS6 Name Cat.*1 (US$1,000) (%) Rank (US$1,000) (%) Rank
80300 Bananas, including plantains, fresh H 0.0 0 22146 3.29 5 80212 Almonds, shelled H 90.1 0.049 54 8648 1.28 9
151211 Sunflower-seed or safflower oil P 7.3 0.004 128 7449 1.11 10 151219 Sunflower-seed or safflower oil P 16.3 0.009 97 5651 0.84 14 71390 Dried leguminous vegetables P 31.0 0.017 77 5452 0.81 15
Nigeria
Average of 1999, 2000, 2001 2013
Exports Share Exports Share
HS6 Name Cat.*1 (US$1,000) (%) Rank (US$1,000) (%) Rank
240220 Cigarettes containing tobacco P 0.7 0.0023 104 163479 3.41 7 60390 Other cut flowers and flower buds H 0.0 0.0000 153789 3.20 8
180310 Cocoa paste, not defatted P 0.0 0.0000 115512 2.41 10 180200 Cocoa shells, husks, skins and others B 0.0 0.0000 69742 1.45 12 190220 Stuffed pasta, whether or not cooked P 0.0 0.0000 55203 1.15 13 30379 Frozen fish, excluding fish fillets P 0.1 0.0002 155 46513 0.97 16 80132 Cashew nuts, shelled H 0.2 0.0007 131 43051 0.90 17
200819 Nuts, ground-nuts and other seeds H 0.0 0.0000 42560 0.89 18 220210 Waters, including mineral waters P 2.8 0.0089 77 30942 0.64 19 120799 Other oil seeds and oleaginous fruits B 0.8 0.0025 102 24666 0.51 20
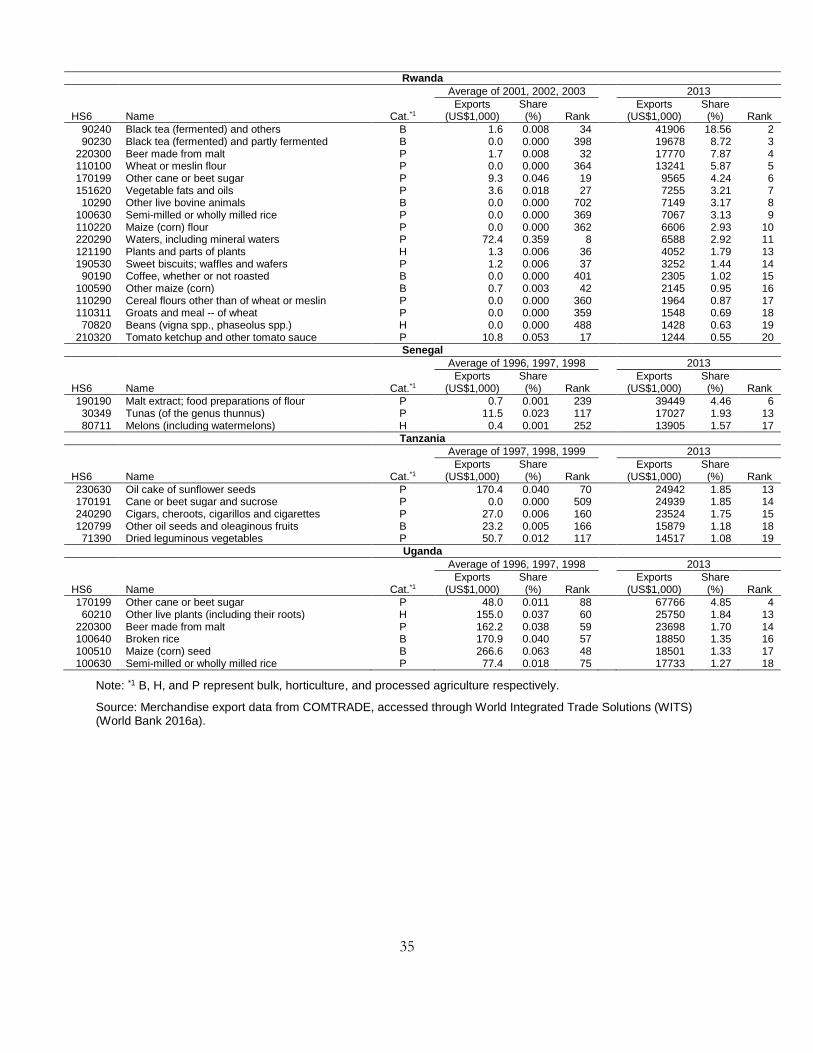
35
Rwanda
Average of 2001, 2002, 2003 2013
Exports Share Exports Share
HS6 Name Cat.*1 (US$1,000) (%) Rank (US$1,000) (%) Rank
90240 Black tea (fermented) and others B 1.6 0.008 34 41906 18.56 2 90230 Black tea (fermented) and partly fermented B 0.0 0.000 398 19678 8.72 3
220300 Beer made from malt P 1.7 0.008 32 17770 7.87 4 110100 Wheat or meslin flour P 0.0 0.000 364 13241 5.87 5 170199 Other cane or beet sugar P 9.3 0.046 19 9565 4.24 6 151620 Vegetable fats and oils P 3.6 0.018 27 7255 3.21 7 10290 Other live bovine animals B 0.0 0.000 702 7149 3.17 8
100630 Semi-milled or wholly milled rice P 0.0 0.000 369 7067 3.13 9 110220 Maize (corn) flour P 0.0 0.000 362 6606 2.93 10 220290 Waters, including mineral waters P 72.4 0.359 8 6588 2.92 11 121190 Plants and parts of plants H 1.3 0.006 36 4052 1.79 13 190530 Sweet biscuits; waffles and wafers P 1.2 0.006 37 3252 1.44 14 90190 Coffee, whether or not roasted B 0.0 0.000 401 2305 1.02 15
100590 Other maize (corn) B 0.7 0.003 42 2145 0.95 16 110290 Cereal flours other than of wheat or meslin P 0.0 0.000 360 1964 0.87 17 110311 Groats and meal -- of wheat P 0.0 0.000 359 1548 0.69 18 70820 Beans (vigna spp., phaseolus spp.) H 0.0 0.000 488 1428 0.63 19
210320 Tomato ketchup and other tomato sauce P 10.8 0.053 17 1244 0.55 20
Senegal
Average of 1996, 1997, 1998 2013
Exports Share Exports Share
HS6 Name Cat.*1 (US$1,000) (%) Rank (US$1,000) (%) Rank
190190 Malt extract; food preparations of flour P 0.7 0.001 239 39449 4.46 6 30349 Tunas (of the genus thunnus) P 11.5 0.023 117 17027 1.93 13 80711 Melons (including watermelons) H 0.4 0.001 252 13905 1.57 17
Tanzania
Average of 1997, 1998, 1999 2013
Exports Share Exports Share
HS6 Name Cat.*1 (US$1,000) (%) Rank (US$1,000) (%) Rank
230630 Oil cake of sunflower seeds P 170.4 0.040 70 24942 1.85 13 170191 Cane or beet sugar and sucrose P 0.0 0.000 509 24939 1.85 14 240290 Cigars, cheroots, cigarillos and cigarettes P 27.0 0.006 160 23524 1.75 15 120799 Other oil seeds and oleaginous fruits B 23.2 0.005 166 15879 1.18 18 71390 Dried leguminous vegetables P 50.7 0.012 117 14517 1.08 19
Uganda
Average of 1996, 1997, 1998 2013
Exports Share Exports Share
HS6 Name Cat.*1 (US$1,000) (%) Rank (US$1,000) (%) Rank
170199 Other cane or beet sugar P 48.0 0.011 88 67766 4.85 4 60210 Other live plants (including their roots) H 155.0 0.037 60 25750 1.84 13
220300 Beer made from malt P 162.2 0.038 59 23698 1.70 14 100640 Broken rice B 170.9 0.040 57 18850 1.35 16 100510 Maize (corn) seed B 266.6 0.063 48 18501 1.33 17 100630 Semi-milled or wholly milled rice P 77.4 0.018 75 17733 1.27 18
Note: *1 B, H, and P represent bulk, horticulture, and processed agriculture respectively.
Source: Merchandise export data from COMTRADE, accessed through World Integrated Trade Solutions (WITS) (World Bank 2016a).