Embed Size (px)
Citation preview

WIDER Working Paper 2015/088
Land issues in Vietnam 2006–14
Markets, property rights, and investment
Thomas Markussen*
September 2015

*University of Copenhagen, Denmark; [email protected]
This study has been prepared within the UNU-WIDER project ‘Structural transformation and inclusive growth in Vietnam’, directed by Finn Tarp.
Copyright © UNU-WIDER 2015
ISSN 1798-7237 ISBN 978-92-9230-977-0
Typescript prepared by Anna-Mari Vesterinen at UNU-WIDER.
UNU-WIDER gratefully acknowledges the financial contributions to the research programme from the governments of Denmark, Finland, Sweden, and the United Kingdom.
The World Institute for Development Economics Research (WIDER) was established by the United Nations University (UNU) as its first research and training centre and started work in Helsinki, Finland in 1985. The Institute undertakes applied research and policy analysis on structural changes affecting the developing and transitional economies, provides a forum for the advocacy of policies leading to robust, equitable and environmentally sustainable growth, and promotes capacity strengthening and training in the field of economic and social policy-making. Work is carried out by staff researchers and visiting scholars in Helsinki and through networks of collaborating scholars and institutions around the world.
UNU-WIDER, Katajanokanlaituri 6 B, 00160 Helsinki, Finland, wider.unu.edu
The views expressed in this publication are those of the author(s). Publication does not imply endorsement by the Institute or the United Nations University, nor by the programme/project sponsors, of any of the views expressed.
Abstract: This paper uses five waves of the Vietnam Access to Resources Household Survey (VARHS) to analyse land issues in Viet Nam from a number of different angles. The VARHS provides panel data at plot as well as household level and I use this rich data set to present descriptive results on landlessness, land fragmentation, land market activities, and land property rights. I use plot level, fixed effects regressions to investigate the effects of land titles (Land Use Certificates) on household investment. Results show that land titling has a strong and statistically significant effect on household investment in irrigation, although this effect is only present in upland areas.
Keywords: land, land fragmentation, land markets, property rights, investment, Viet Nam JEL classification: O12, O53, P26, Q15
Acknowledgements: I am grateful for inputs from Carol Newman, Finn Tarp, Ulrik Beck, and seminar participants in Hanoi.
1
1 Introduction
In Viet Nam, the transfer of agricultural land use rights from collectives to individual households in 1988 was a key element of the Doi Moi reforms. In 1993, private land property rights were further strengthened as a massive programme of systematic land titling was initiated and land holders gained the rights to sell, rent, exchange, mortgage, and bequest their plots. These developments are often credited as an important driver of rural economic growth in Viet Nam (for example, Pingali and Xuan 1992; Rozelle and Swinnen 2004; Deininger and Jin 2008; Do and Iyer 2008; Newman et al. 2015). On the other hand, the literature also documents that household land property rights are far from complete and not always well protected. For example, Markussen et al. (2011) point out that many households face binding restrictions on crop choice, Anderson and Davidsen (2011) show that land titling is perceived to be severely affected by corruption, and Markussen and Tarp (2014) show that the risk of government land expropriation is significant and depends on whether or not a household has informal ties with local government officials. Khai et al. (2013) document that while land market transactions seem to increase efficiency as well as equity of land use, land markets are still very thin in many areas of Viet Nam.
This paper exploits the Viet Nam Access to Resources Household Survey (VARHS) to investigate land issues in Viet Nam from different angles. The VARHS is a panel survey, conducted in the rural areas of 12 provinces in Vietnam every second year from 2006 to 2014.1 The survey re-interviewed households sampled for the 2002 and 2004 waves of the Vietnam Household Living Standards Survey (VHLSS). In later years, additional households have been added to keep the sample representative. The present paper builds mainly on the panel of households present from 2006 through 2014 (2,162 households), although I sometimes report results based on the extended sample, which is (approximately) representative of the current population in each year. See CIEM et al. (2013) for further details on the sampling methodology of VARHS. The VARHS includes a highly detailed land module. In contrast with most other large-scale economic surveys, it collects panel data not only at the household but also at the land plot level. This is highly useful in some of the analyses I conduct.
The paper first considers access to agricultural land by reporting the share of landless rural households (Section 2).2 It then turns to analysing issues of farm size and land fragmentation (Section 3), land sales and rental markets (Section 4), and property rights to land (Section 5). While the first five sections are mainly descriptive, Section 6 presents fixed effects regressions at the plot level to determine the causal effect of land titles on agricultural investment. This section demonstrates a significant and strong effect of land titling on household investment in irrigation. Remarkably, this effect is only present in upland regions, where titling is least prevalent. The policy implication is that titling should be expanded in the highlands. Section 7 concludes.
2 Landlessness
I first consider landlessness, a phenomenon often associated with poverty and vulnerability in developing countries. Households that neither own nor operate any agricultural land are defined
1 The sampled provinces are, by region: Red River Delta: ex-Ha Tay; North-east: Lao Cai, Phu Tho; North-west: Lai
Chau, Dien Bien; North Central Coast: Nghe Anh; South Central Coast: Quang Nam, Khanh Hoa; Central Highlands: Dak Lak, Dak Nong, Lam Dong; Mekong River Delta: Long An.
2 Other overviews of land issues in Viet Nam include Kerkvliet (2006); Brandt (2006); and Marshet al. (2006).

2
as ‘landless’. Figure 1 shows the prevalence of landlessness over time and in five different regions. The figure shows that landlessness in the 2006–14 VARHS panel is low (around 8 per cent in 2014) and relatively stable over time.3 There is significant variation across regions. Landlessness is highest in the Mekong River Delta and, in 2014, the Central Coast (12–18 per cent) and lowest in the Red River Delta and the North (around 3–6 per cent). There is a tendency towards convergence over time, driven by a moderate increase in landlessness in the northern parts of Viet Nam and a moderate drop in the Southern and Central Lowlands. The increase in landlessness in the Red River Delta might be driven by improving off-farm opportunities in and around Hanoi.
Figure 1: Landlessness, by region
Note: N = 2,162.4 Only households that neither own nor operate any agricultural land are defined as landless.
Source: Author’s calculations based on VARHS 2006-2014.
Figure 2 shows landlessness by income quintile. Since a comprehensive measure of income could not be computed for 2006, results for that year are not included (VARHS collects highly detailed and comprehensive data on household income, but some categories of income were measured in less detail in 2006 than in later years). The figure shows clear and stable differences across income groups, but not in the direction one might expect. Landlessness is highest in the richest quintile (around 12 per cent) and lowest in the poorest quintile (around 5 per cent). Hence, landlessness is not generally associated with poverty in Viet Nam. This is of course partly explained by the patterns revealed in Figure 1: landlessness is most prevalent in the Southern and Central Lowlands, which are also relatively rich regions. However, the positive association between landlessness and income is present within each region, except the Central Highlands, where there is no clear correlation between income and landlessness (results not shown). Therefore, results are consistent with the findings in Ravallion and van de Walle (2008), who argue that households in Viet Nam typically do not become landless because they are exposed to
3 Using the full, representative VARHS sample, landlessness in 2014 is 11 per cent (the same as in 2008). Hence,
with the full sample, the slight downward trend in the panel sample between 2008 and 2014, is not present.
4 Observed in each year, i.e. there are 5 x 2,162 = 10,810 observations.
0
2
4
6
8
10
12
14
16
18
20
2006 2008 2010 2012 2014
Per
cen
t la
nd
less
Red River Delta
North
Central Coast
Central Highlands
Mekong River Delta
All

3
negative, economic shocks, but rather sell their land in order to take up new opportunities in the growing non-farm economy.
Figure 2: Landlessness, by income quintile
Note: N = 2,162 households. Only households that neither own nor operate any agricultural land are defined as landless.
Source: Author’s calculations based on VARHS 2008-2014.
The background for low levels of landlessness and the absent correlation between landlessness and poverty is of course the highly egalitarian land reforms initiated in 1988, which in turn were premised on the collectivization of agriculture after the communist revolution (Ravallion and van de Walle 2004, 2006). Equality of the agricultural land distribution is arguably one of the most important, positive aspects of the Communist legacy in Viet Nam.
3 Farm size and land fragmentation
An implication of egalitarianism in land distribution, combined with high, rural population density, is that Vietnamese farms are small. In addition, they tend to be divided into many, separate plots, especially in the North (see Markussen et al. 2013). This section considers developments in farm size and land fragmentation between 2006 and 2014. Figure 3 shows median farm size (defined as operated agricultural area) by region. Even though the land distribution is equal, compared to most other countries, there are still a few high outliers that affect results on mean landholdings significantly. This is why I present medians rather than means (trends are very similar if means are used, although levels are significantly higher). The figure documents that farms are much bigger in the Central Highlands than in other regions and significantly larger in southern than in northern areas. The latter difference (between north and south) has long historical roots. A part of the background is of course the longer period of communist rule in the north, which meant that agricultural collectivization was much more comprehensive in the north than in the south. This in turn led to a more egalitarian, post-Doi Moi land distribution in the north. In the south, many households simply continued to farm the land they had farmed before the communist takeover. The north–south differences go back even longer than communism, though. Since pre-colonial times, population density was significantly higher in the Red River Delta than in the Mekong River Delta, meaning that landholdings per household were significantly lower in Red River Delta (Gourou 1936; Popkin 1979).
0
2
4
6
8
10
12
14
16
2008 2010 2012 2014
Per
cen
t la
nd
less
Richest quintile
Second-richest
Middle
Second-poorest
Poorest quintile

4
Figure 3: Farm size, by region
Note: N = 1,953 households in 2006 (slightly less in later years). Farm size is defined as operated rather than owned area (i.e. plots rented in are included and plots rented out are excluded). Only households operating agricultural land are included.
Source: Author’s calculations based on VARHS 2006-2014.
The figure shows a moderate decrease in median farm size over time (from around 3,700 m2 to around 3,250 m2 significant at the 1 per cent level in a median regression).5 While farms in the VARHS panel are getting smaller in most regions, they are actually growing in the Central Highlands, implying a tendency towards interregional divergence, since farms in the Central Highlands were already higher than in other regions in 2006.
Figure 4 shows median farm size by income quintile. The results show that farms are biggest in the poorest quintile. Among the four richest quintiles, there is no strong association between income and farm size. This again shows that there is no straightforward association between poverty and access to land in Viet Nam. It is of course important to remember that the figure does not account for the quality of land. As discussed, land in the highlands is often of lower quality than in the lowlands. The incidence of poverty is also significantly higher in the mountains than in the plains. Another key factor behind the results, however, is the importance of the rural non-farm economy. Most households have other sources of income than agriculture and non-farm employment is often more remunerative than farming.
5 The decrease in median farm size is somewhat stronger when the full, representative VARHS sample is used (from
3,700 m2 in 2600 to 3,050 m2 in 2014).
0
2000
4000
6000
8000
10000
12000
14000
16000
2006 2008 2010 2012 2014
Med
ian
op
era
ted
farm
are
a,
sqm
.
Red River Delta
North
Central Coast
Central Highlands
Mekong River Delta
All

5
Figure 4: Farm size, by income quintile
Note: N = 1,876 households in 2008 (slight deviations from this in later years). Farm size is defined as operated rather than owned area (i.e. plots rented in are included and plots rented out are excluded). Only households operating agricultural land are included.
Source: Author’s calculations based on VARHS 2008-2014.
While Figures 3 and 4 can be said to consider ‘inter-farm land fragmentation’ (the division of land between many, relatively small farms), Figure 5 considers ‘intra-farm fragmentation’ (the division of each farm into separate plots). The figure shows the average number of agricultural plots operated by farming households. Intra-farm land fragmentation is potentially problematic because it prevents the use of large-scale machinery and uses land resources for boundary demarcation and labour resources for travelling between plots. On the other hand, fragmentation may reduce household exposure to risk, for example because natural hazards such as floods and pests are likely to affect only some plots in a fragmented farm, but potentially hits all land in a consolidated farm. The Government of Viet Nam has aimed to reduce land fragmentation by implementing land consolidation programmes in many communes, especially northern areas. These programmes aim to consolidate land holdings by facilitating plot exchanges between households. Figure 5 suggests that these programmes may have had some effect. The mean number of plots operated has dropped from 5.8 in 2006 to 4.1 in 2014, with the sharpest decrease recorded in the Red River Delta (from 6.6 to 4.0). An alternative interpretation is that because the panel households are getting older, they operate fewer plots (i.e. rent fewer plots in, rent more plots out, and pass more plots on to younger relatives). However, there is also a significant decline in the number of plots owned (rather than operated), from 5.7 in 2006 to 4.1 in 2014. The rate of giving plots away (for example as bequests) is stable over time (4.4 per cent of households gave at least one plot away during the two years before the 2006 survey; the equivalent number for the 2014 survey is 4.3 per cent). Hence, the results do suggest that intra-farm land consolidation is taking place. There is certainly no trend in the direction of ever more fragmented farms over the period considered here.
0
500
1000
1500
2000
2500
3000
3500
4000
4500
5000
2008 2010 2012 2014
Med
ian
op
era
ted
farm
are
a,
sqm
.
Richest quintile
Second-richest
Middle
Second-poorest
Poorest quintile

6
Figure 5: Number of plots operated, by region
Note: N = 1,953 households in 2006 (slightly less in later years). Only households operating agricultural land are included.
Source: Author’s calculations based on VARHS 2006-2014.
If farms are being consolidated, plots should be getting bigger. Figure 6 tests whether this is the case by presenting median plot size by region and over time (again, results on means are quite strongly affected by outliers). The median plot size does indeed increase from 500 m2 in 2006 to 625 m2 in 2014 (an increase of 25 per cent, highly statistically significant), driven by increases of 22–24 per cent in the Red River Delta and the North. To be sure, these are moderate changes and plots remain extremely small (the median plot is about 1/16 of a hectare), but the positive trend is nonetheless interesting.
Figure 6: Plot size, by region
Note: N = 10,007 plots in 2006 (somewhat less in later years). Only operated plots included.
Source: Author’s calculations based on VARHS 2006-2014.
0
1
2
3
4
5
6
7
8
2006 2008 2010 2012 2014
Mean
nu
mb
er
of
plo
ts o
pera
ted
per
farm
ing
hh
Red River Delta
North
Central Coast
Central Highlands
Mekong River Delta
All
0
500
1000
1500
2000
2500
3000
3500
2006 2008 2010 2012 2014
Med
ian
plo
t si
ze,
sqm
.
Red River Delta
North
Central Coast
Central Highlands
All
Mekong River Delta

7
In sum, while there is little evidence of inter-farm land consolidation (if anything, farms are getting a bit smaller), there is evidence of moderate progress towards intra-farm consolidation.
4 Land markets
In a dynamic economy such as the Vietnamese, where new economic opportunities constantly arise, it is of high importance that land can be shifted between different users without excessive friction. Therefore, well-functioning land markets are essential. This section considers participation rates in land sales and rental markets.
In contrast with China, agricultural land sales markets are legal in Viet Nam. Legality is not a sufficient condition for activity, however. As documented in Khai et al. (2013), land market sales have played a relatively minor role for land allocation in large parts of Viet Nam, particularly in the North. On aggregate, only about 8 per cent of plots operated by households have been acquired through purchase (63 per cent have been given by the state, 15 per cent were received as inheritance, and 13 per cent were cleared by households). In the North, only about 2.5 per cent of plots were acquired through the market (compared with 11 per cent in the Southern Lowlands and 46 per cent in the Central Highlands). Part of the reason for low levels of activity in the land market is the relatively high degree of efficiency that characterized the administrative land allocation implemented after 1988 (Ravallion and van de Walle 2004). In addition, however, land sales have until recently been subject to a virtual taboo in large parts of Northern Viet Nam, where land sales markets never existed in the past, even before the rise of communism (Popkin 1979).
Figures 7 and 8 show the share of households that purchased (Figure 7) or sold (Figure 8) agricultural land during the two years prior to each survey round, by region. Results document clearly that land sales markets are much more active in the Central Highlands than in any other region. The Central Highlands differ from other regions in the sense that recent decades have seen massive, inward migration and changes in agricultural activities. The massive increase in coffee production is the most important of these changes. Therefore, land allocation is much more dynamic in the Central Highlands than elsewhere, as migrants and other residents attempt to adapt land holdings to changing circumstances. Figures 7 and 8 also show that participation rates in land sales markets tend to be higher in the Mekong River Delta than in northern and central areas, although activity levels are much lower in the Mekong River Delta than in the Central Highlands.

8
Figure 7: Land purchases in the last two years, by region
Note: N = 2,025 households in 2006 (slightly less in later years). Only land-owning households included.
Source: Author’s calculations based on VARHS 2006-2014.
Overall, activity levels are largely stable over time. Sharp increases in activity levels are recoded in the Central Highlands in 2008 (purchases) and 2014 (sales). The reasons behind these specific developments are unclear.
Figure 8: Land sales in the last two years, by region
Note: N = 2,162 households.
Source: Author’s calculations based on VARHS 2006-2014.
Figures 9 and 10 present activity levels in land sales markets by income quintile. Results show clearly that the richest households are most active on the supply as well as the demand side of the market. Hence, there is no evidence that land sales markets increase inequality, in the sense of transferring land from the poor to the rich. However, it is a concern that markets mainly serve the better-off part of the population, leaving many poorer households excluded. In terms of land sales, there is a tendency towards convergence between income groups over time, but no such
0
2
4
6
8
10
12
14
16
2006 2008 2010 2012 2014
Per
cen
t o
f h
h w
ho
bo
ug
ht
lan
d i
n l
ast
tw
o y
ears
Red River Delta
North
Central Coast
Central Highlands
Mekong River Delta
All
0
2
4
6
8
10
12
2006 2008 2010 2012 2014
Per
cen
t o
f h
h w
ho
so
ld l
an
d i
n l
ast
tw
o y
ears
Red River Delta
North
Central Coast
Central Highlands
Mekong River Delta
All

9
trend is apparent in the case of land purchases. Comparing with Figure 1, I note that there is no correlation between increases in land sales activity and increases in landlessness (i.e. the regions where landlessness increased—North and Red River Delta—did not experience an increase in land sales). So, increasing market activity does not necessarily go hand-in-hand with increased landlessness.
Figure 9: Land purchases in the last two years, by income quintile
Note: N = 1,938 households in 2008 (slightly more in later years). Only land-owning households included.
Source: Author’s calculations based on VARHS 2008-2014.
Figure 10: Land sales in the last two years, by income quintile
Note: N = 2,162 households.
Source: Author’s calculations based on VARHS 2008-2014.
I now turn to considering the land rental market. Figures 11 and 12 show, respectively, the share of households renting land in and out, by region. Results show that the regional pattern is quite different for rental than for sales markets. The most active region is the Red River Delta,
0
1
2
3
4
5
6
2008 2010 2012 2014
Per
cen
t o
f h
h w
ho
bo
ug
ht
lan
d i
n l
ast
tw
o y
ears
Richest quintile
Second-richest
Middle
Second-poorest
Poorest quintile
0
0.5
1
1.5
2
2.5
3
3.5
4
4.5
5
2008 2010 2012 2014
Per
cen
t o
f h
h w
ho
so
ld l
an
d i
n l
ast
tw
o
years
Richest quintile
Second-richest
Middle
Second-poorest
Poorest quintile
10
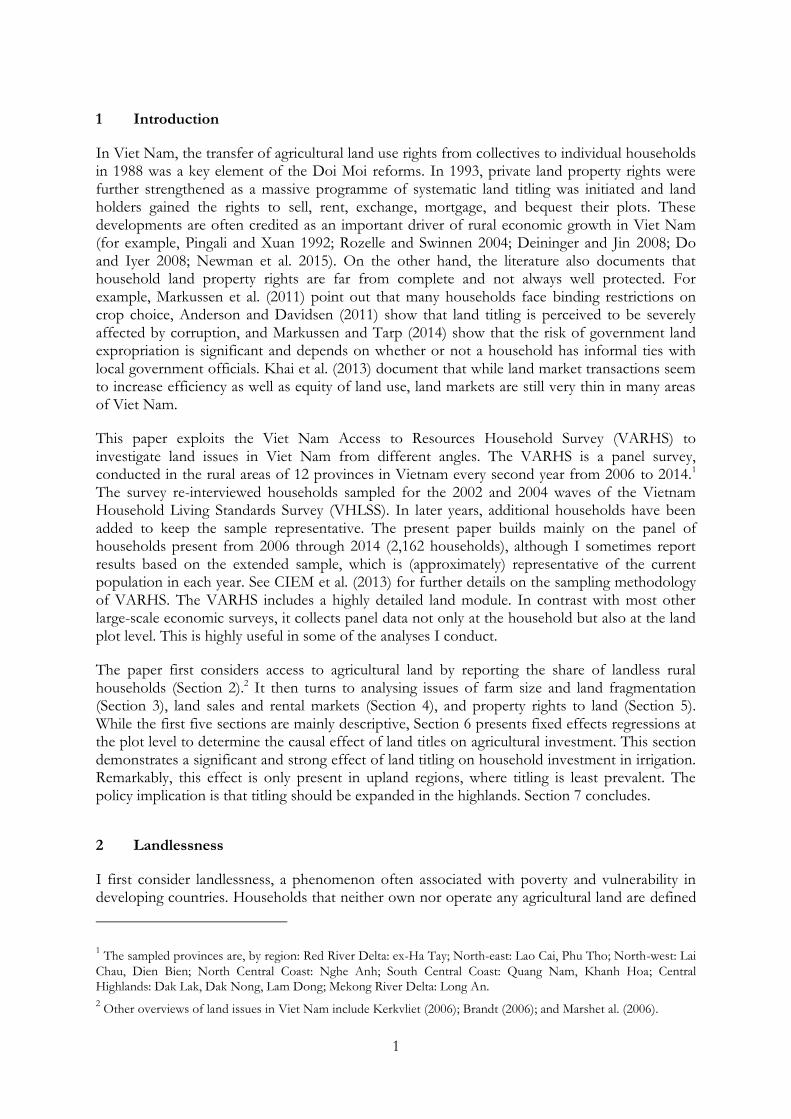
followed by the Central Coast. The North is the least active region in the case of renting in, while the Central Highlands are least active in terms of renting out.6 Hence, in the Red River Delta low activity of land sales markets are to a large extent compensated for by high activity in rental markets. In the North, however, this is not the case.
Figure 11: Share of households renting land, by region
Note: N = 1,953 households in 2006 (slightly less in later years). Only households operating agricultural land included.
Source: Author’s calculations based on VARHS 2006-2014.
Figure 12: Share of households renting land out, by region
Note: N = 2,015 households in 2006 (slightly less in later years). Only land-owning households included.
Source: Author’s calculations based on VARHS 2006-2014.
6 Rates of renting in and out may differ for several reasons. First, the same landlord may rent out to several tenants,
and vice-versa. Second, landlords may not be households, but rather commune authorities or corporate entities, which are not captured by the survey.
0
5
10
15
20
25
30
35
40
2006 2008 2010 2012 2014
Per
cen
t o
f h
h r
en
tin
g l
an
d
Red River Delta
North
Central Coast
Central Highlands
Mekong River Delta
All
0
5
10
15
20
25
30
2006 2008 2010 2012 2014
Per
cen
t o
f h
h r
en
tin
g l
an
d o
ut
Red River Delta
North
Central Coast
Central Highlands
Mekong River Delta
All
11
There are clear time trends: the share of households renting land in is decreasing, while the share renting land out is increasing. These opposite trends are likely to result from the ageing of panel households. Rental activities are strongly correlated with age of the household head (younger households rent land in, older households rent out). However, the upward trend in renting out (10 percentage points) is markedly stronger than the downward trend in renting in (3 percentage points), suggesting that overall activity levels in land rental markets have increased. Indeed, the share of households involved in land rentals on at least one side of the market increased from 28 per cent in 2006 to 34 per cent in 2014 (a highly statistically significant change).
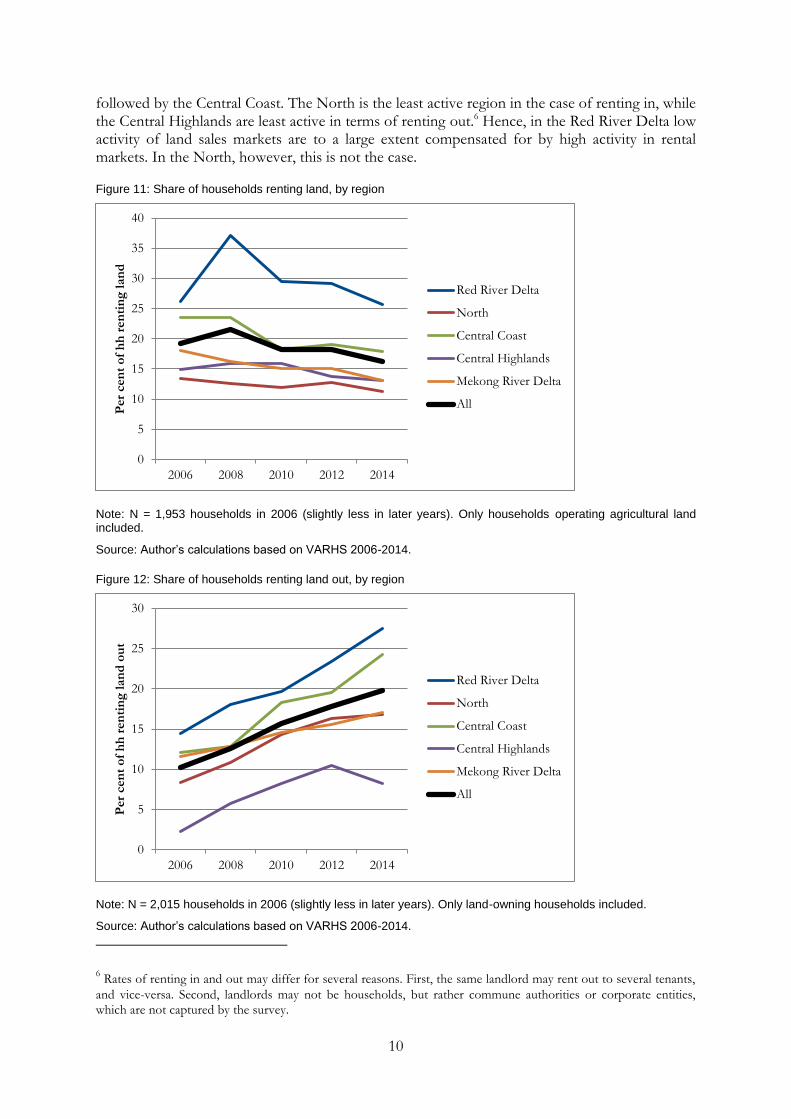
Figure 13: Share of households renting land, by income quintile
Note: N = 1,876 households in 2008 (slightly deviations from this in later years). Only households operating agricultural land included.
Source: Author’s calculations based on VARHS 2008-2014.
Figure 14: Share of households renting land out, by income quintile
Note: N = 1,938 households in 2008 (slightly more in later years). Only land-owning households included.
Source: Author’s calculations based on VARHS 2008-2014.
0
5
10
15
20
25
30
2008 2010 2012 2014
Per
cen
t o
f h
h r
en
tin
g l
an
d
Richest quintile
Second-richest
Middle
Second-poorest
Poorest quintile
0
5
10
15
20
25
30
35
2008 2010 2012 2014
Per
cen
t o
f h
h r
en
tin
g l
an
d o
ut
Richest quintile
Second-richest
Middle
Second-poorest
Poorest quintile

12
Figures 13 and 14 show rental market participation by income quintile. Results are quite interesting. There is no clear correlation between income and participation rates on the demand side (Figure 13). The poorest and the richest quintiles are the two least active groups, with the three middle quintiles all being somewhat more active. On the supply side (Figure 14), however, there is a very clear tendency towards higher participation among richer households. This suggests that land rental markets are ‘progressive’ in the sense of transferring land from rich to poor households. These findings are consistent with the results reported in Deininger and Jin (2008) and in Khai et al. (2013). Differences across income groups are stable over time.
5 Property rights
As discussed in the introduction, the 1993 Land Law endowed landholders with a rather comprehensive set of land rights. Land continues formally to be owned by the state (‘the People’, states the law), but land users gained 20 years’ use rights for plots designated for annual crops land and 50 years for perennial crops land. These rights were guaranteed through the issuance of Land Use Certificates (LUCs), which also imply the rights to sell, rent, mortgage, exchange, and bequest a plot of land. Land rights have been gradually strengthened and clarified through various revisions of Land Law. The 2013 Land Law (in effect from 2014) extends the duration of use rights to 50 years for all types of land. While formal protection of tenure security and transfer rights is fairly strong, Markussen and Tarp (2014) show that de facto property rights are not complete. The actual risk of losing land against the will of the household is significant in many areas. Also, while transfer rights are extensive, Markussen et al. (2011) show that rights to determine use of the land, e.g., which crops to grow, are in many cases quite limited. This section considers formal property rights (LUCs) as well as de facto tenure security (risk of being expelled) and crop choice restrictions.
Figure 15 shows the share of land plots held with a LUC. Only plots owned by households are included, i.e. rented plots are excluded. Purely residential plots are also excluded. Results show that land titling is comprehensive (covering around 80 per cent of plots) but not complete, and that the share of plots titled is approximately stable over the period studied. The pattern of overall stability is the result of different, opposing forces. On the one hand, titling efforts are ongoing, although much less vigorously than in the 1990s (cf. Do and Iyer 2008). On the other hand, plots may cease to be titled if they change hands through sale or inheritance and title documents are not updated. An obvious barrier to registration of land transactions (and thereby titling) is the presence of informal fees in the land administration system. Anderson and Davidsen (2011) show that corruption is perceived to be widespread in the public land administration. Also, plots obtained by clearing the forest are often not titled. Only 42 per cent of plots obtained through forest clearing are titled. Among plots cleared in the last five years, only 13 per cent are held with a LUC. This probably explains the downward trend in titling in the Northern Uplands, where forest clearing is most prevalent. There is important, interregional variation in land titling. Titling is most prevalent in the Mekong River Delta, where almost all plots are held with a LUC. Titling is least prevalent in the Central Highlands. There is significant heterogeneity within the North. Titling is very widespread in Phu Tho, a relatively rich, mostly lowland province. In the remote, highland provinces of Dien Bien and Lai Chau, on the other hand, only 41 and 46 per cent of plots, respectively, are titled.

13
Figure 15: Land Use Certificates, by region
Note: N = 9,910 plots in 2006 (slightly less in later years). Only plots owned by households included (i.e. plots rented in are excluded).
Source: Author’s calculations based on VARHS 2006-2014.
Figure 16 shows land titling by income quintile of the plot owner. There is a clear and stable income gradient in land titling, the prevalence of LUCs being significantly lower in the poorest quintiles than in the richest. This is of course partly explained by the interregional pattern described above: LUCs are least common in the Northern Uplands, which is also the poorest region. Whether weak property rights is a causal factor behind low income is not clear from these analyses (although the results presented below suggest that it might be), but it is in any case a cause for concern that the poorest segments of the population have the weakest, formal protection of property rights.
Figure 16: Land Use Certificates, by income quintile
Note: N = 9,422 plots in 2008 (somewhat less in later years). Only plots owned by households included (i.e. plots rented in are excluded).
Source: Author’s calculations based on VARHS 2006-2014.
0
10
20
30
40
50
60
70
80
90
100
2006 2008 2010 2012 2014
Per
cen
t o
f p
lots
wit
h L
UC
Red River Delta
North
Central Coast
Central Highlands
Mekong River Delta
All
0
10
20
30
40
50
60
70
80
90
2006 2008 2010 2012
Per
cen
t o
f p
lots
wit
h L
UC
Richest quintile
Second-richest
Middle
Second-poorest
Poorest quintile
14
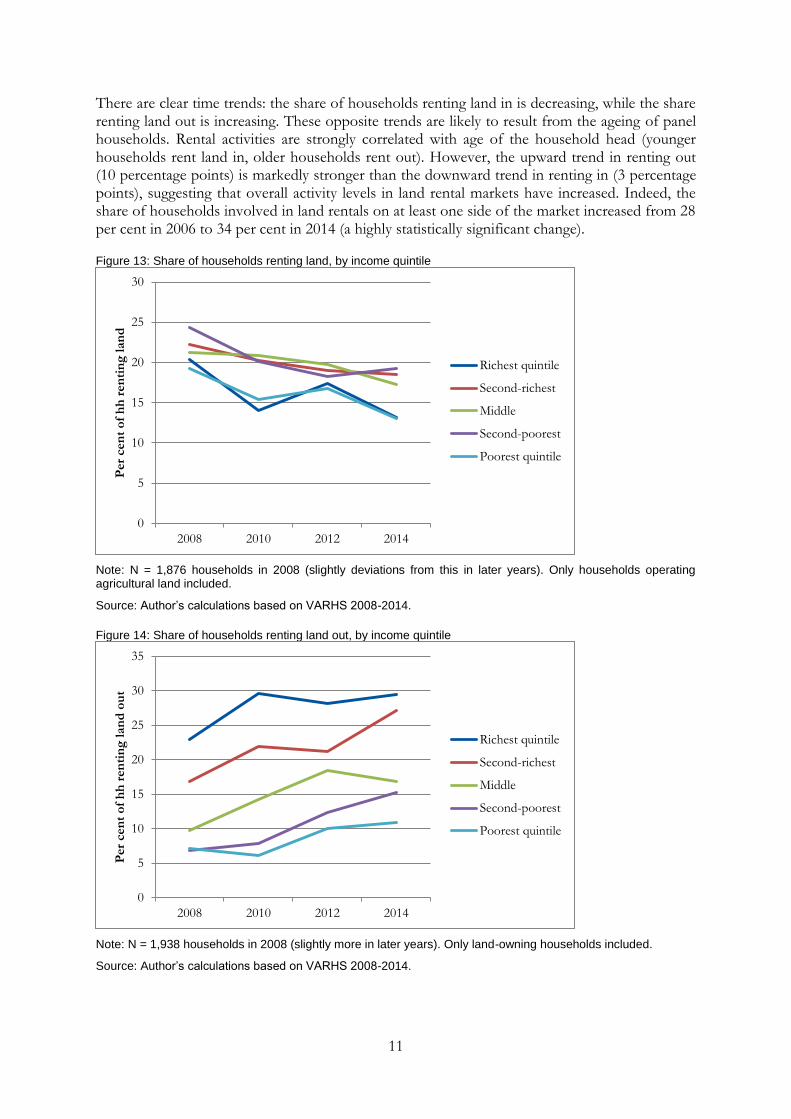
I now turn to investigating actual, rather than formal, tenure security. Figure 17 shows the share of households who lost a plot of land against their will (i.e. were expelled) during the two years prior to each survey round. In the vast majority of cases (around 97 per cent), households were expelled by the state, rather than private individuals or corporations. Hence, state land expropriation is by far the most important source of tenure insecurity. The figure shows that the rate of expulsions has dropped from around 5 per cent in 2006 to around 3 per cent in 2014. This is positive, but I note that 3 per cent is not an insignificant level of risk. A household facing a risk of expropriation equal to 3 per cent over a two-year period runs approximately a 26 per cent risk of having a plot expropriated over the next 20 years. This level of risk is likely to be taken into account in, for example, household decisions about land-related investment.
Also, trends in land expropriation are very different across regions. While a drop in expropriations was recorded in the Red River and Mekong River deltas, increases took place in the North and the Central Highlands. Hence tenure insecurity appears to be rising in the poorest regions.
Figure 17: The share of households expelled from land in the last two years, by region
Note: N = 2,162 households.
Source: Author’s calculations based on VARHS 2006-2014.
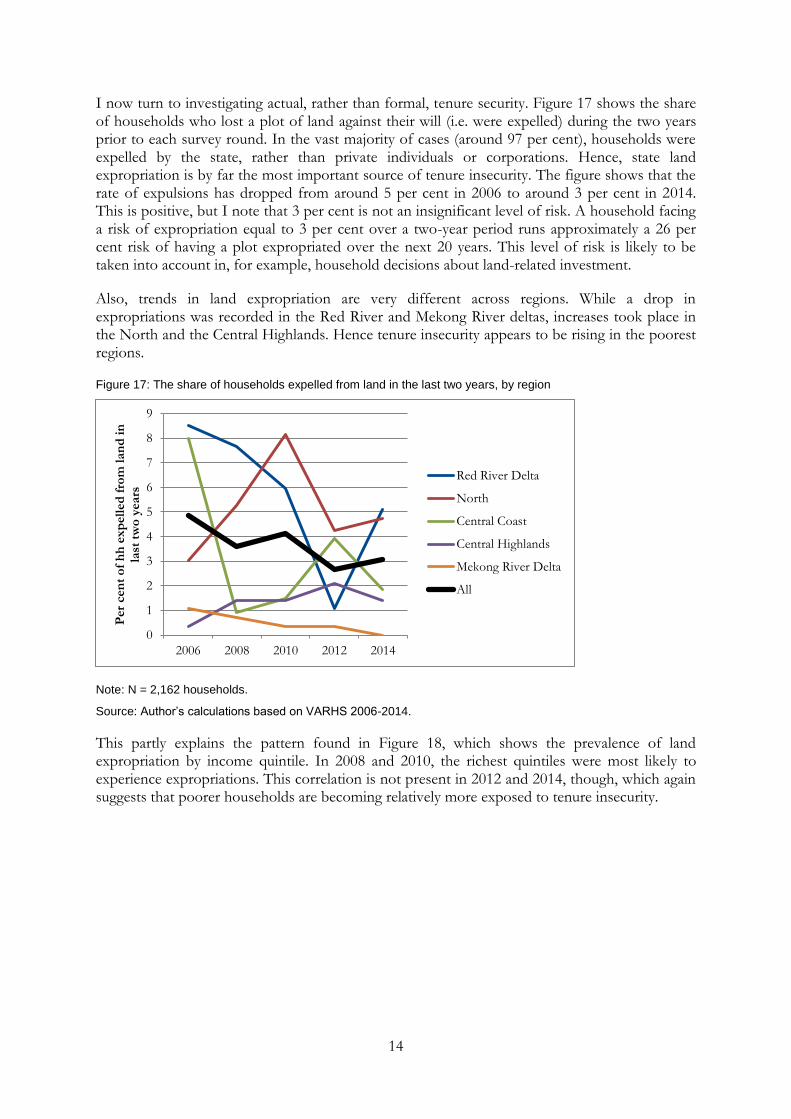
This partly explains the pattern found in Figure 18, which shows the prevalence of land expropriation by income quintile. In 2008 and 2010, the richest quintiles were most likely to experience expropriations. This correlation is not present in 2012 and 2014, though, which again suggests that poorer households are becoming relatively more exposed to tenure insecurity.
0
1
2
3
4
5
6
7
8
9
2006 2008 2010 2012 2014
Per
cen
t o
f h
h e
xp
ell
ed
fro
m l
an
d i
n
last
tw
o y
ears
Red River Delta
North
Central Coast
Central Highlands
Mekong River Delta
All

15
Figure 18: The share of households expelled from land in the last two years, by income quintile
Note: N = 2,162 households.
Source: Author’s calculations based on VARHS 2008-2014.
The discussion about property rights has so far focused on tenure security and transfer rights, as is common in the literature on land rights. Another aspect of land rights, which is important in Viet Nam and other communist and post-communist countries, is the right to determine how to use the land (cf. Markussen et al. 2011). In particular, Vietnamese Land Use Plans compel a large number of farmers to grow rice on their plots. The main motivation for this policy is food security. Markussen et al. (2011); Kompas et al. (2012); and Giesecke et al. (2013) argue that in the current context of large rice surpluses, the efficiency cost of restrictions may provide a strong rationale for abandoning the strict land use planning regime.
Figure 19 shows the prevalence of crop choice restrictions over time.7 Between 2006 and 2014, the share of plots with restricted crop choice drops from 53 to 44 per cent, but the trend is not monotonous (there were more restrictions in 2012 than in 2008). There are very significant differences across regions. Most strikingly, restrictions are much more prevalent in the Red River Delta (65 per cent) than in the Mekong River Delta (15 per cent), in spite of the fact that both these regions are well suited for rice cultivation.8 This may reflect the longer history of communism in the North, making production planning a more accepted and customized policy tool in that part of the country. Note that restrictions are also more common in the Northern than in the Central Highlands. In particular, while growth of the coffee sector in the Central Highlands has undoubtedly been a policy goal, this goal has not been pursued through the use of crop choice restrictions.
7 Results for 2010 are not presented due to suspected data errors. The 2010 results show sharply lower prevalence of
restrictions (32 per cent) than in 2008 (45 per cent) and 2012 (49 per cent).
8 It should be noted that each of these regions is represented by only one province (ex-Ha Tay and Long An,
respectively). It is possible that the prevalence of restrictions is different in other delta provinces.
0
1
2
3
4
5
6
7
2008 2010 2012 2014
Per
cen
t o
f h
h e
xp
ell
ed
fro
m l
an
d i
n
last
tw
o y
ears
Richest quintile
Second-richest
Middle
Second-poorest
Poorest quintile

16
Figure 19: Crop choice restrictions, by region
Note: N = 10,619 plots in 2006 (somewhat less in later years).
Source: Author’s calculations based on VARHS 2006-2014.
6 Effects of land titles on agricultural investment
The previous section documented that while a large share of plots are held with a land use certificate (‘titled’), titling is not complete, and varies significantly across regions. Actual tenure insecurity is not insignificant and rights to determine land use are often restricted. This section analyses the effects of variation in land rights. In particular, I investigate whether stronger property rights increase agricultural investment, focusing on two of the most important types of investment in Vietnamese farming, namely irrigation and perennial crops.
A large literature investigates the effects of land property rights on agricultural investment.9 These papers generally struggle to deal with an important identification problem, namely the potential effect of unobserved plot characteristics, which affect property rights (e.g. land titling) as well as investment. For example, households may own plots in the plains as well as in the hills. Land measurement, border demarcation, and dispute resolution may be easier in the plains than in the hills, and a systematic titling programme, such as the programme implemented in Viet Nam from 1994 onward, might tend to focus foremost on titling plots in the plains. At the same time, investment may differ systematically between the plains and the hills. For example, it might be more feasible to invest in irrigation in the plains. Of course, one can try to control for the factors that drive property rights and investment, but this endeavour is likely to be only partly successful. For example, we might measure slope of the land and distance from the family home, and this will capture some of the variation between the plains and the hills, but at the same time it cannot be ruled out that a particular plot in the hills is flat and close to the family home, or that a plot in the plains is sloped and far from the home. In addition to using control variables, one might attempt to solve identification problems through instrumental variables methods, as for
9 See e.g., Feder and Onchan (1987); Besley (1995); Alston et al. (1996); Braselle et al. (2002); Jacoby et al. (2002);
Carter and Olinto (2003); Jacoby and Mansuri (2008); Do and Iyer (2008); Markussen (2008); Hornbeck (2010).
0
10
20
30
40
50
60
70
80
2006 2008 2012 2014
Per
cen
t o
f p
lots
wit
h c
rop
ch
oic
e
rest
ricti
on
s
Red River Delta
North
Central Coast
Central Highlands
Mekong River Delta
All
17
example in Besley (1995) and Markussen (2008). As discussed in Markussen (2008), the validity of the instruments used for land property rights (for example, mode of plot acquisition) is in most cases uncertain.
The VARHS data set offers unusual opportunities to deal with these issues because the survey collects panel data not only at the household, but also at the plot level. This allows us to track individual plots and see, for example, whether changes in property rights are associated with changes in investment. Newman et al. (2015) exploit the plot panel to investigate the effects of LUCs on rice yields. They are particularly interested in analysing effects of having both the husband’s and the wife’s names written into the LUC. They find that LUCs do indeed increase productivity and that this effect is not diminished by having two rather than one name in the LUC. (If husbands and wives have different objectives, shared property rights might have lowered investment and productivity relative to having only one person as the property rights holder. There was no evidence that this was the case.) The present analysis investigates one of the channels through which property rights may affect rice yields, namely investment in irrigation.
Given the prevalence of rice production in Vietnamese agriculture, the importance of irrigation infrastructure is beyond dispute. In 2014, 73 per cent of agricultural plots recorded in VARHS were irrigated (up from 68 per cent in 2006). Investment in irrigation is conducted by the government as well as by individual farmers and includes, for example, investment in reservoirs, canals, wells, dykes, and other water conservation infrastructure. I also consider investment in perennial crops. Since a number of years typically pass between planting and the first harvest of, say, coffee or mangoes, there is an important element of investment in the choice of perennial rather than annual crops. Households with high tenure security and access to credit are more likely to plant perennial crops than others. Formalized property rights may improve access to credit as well as tenure security because a land title facilitates the process of using land as collateral for loans. In 2014, 18 per cent of plots in VARHS were planted with perennial crops, up from 15 per cent in 2006.
I estimate plot level regressions models of the following type:
1 2 3
k
pt pt pt pt p t ptI LUC RESTRIC L
where k
ptI is an indicator for the presence of investment good k on plot p in year t. LUC is an
indicator for the plot being held with a land use certificate. This is the main variable of interest. RESTRIC is an indicator for crop choice restrictions. This is mainly included as a control variable. Restrictions may affect investment, for example, because authorities are more likely to invest in irrigation for restricted plots than for other plots. Also, restrictions and titling could be correlated, for example, if systematic titling efforts are directed towards restricted plots. This could be the case if titling is viewed as a way to compensate households for being subject to restrictions, or simply because authorities are more aware of the existence of restricted plots (which are covered by official land use plans) than other plots. L is a measure of household labour resources (the number of working age household members, with working age defined as 15–65 years). A higher labour force makes it more feasible to conduct investment projects and may also increase the likelihood that households seek land titles, given that the title application
process requires certain amounts of time and skills. p is a plot fixed effect, equivalent to
including a dummy variable for each plot in the data set. t is a year fixed effect, which captures
general trends in investment, as for example those arising from variation in national and
international crop prices. pt is an error term. I allow errors to be correlated within communes

18
(the primary sampling unit of VARHS) but not across. Only owned and operated agricultural plots are included. Some plots are recorded with different areas in different years. This may reflect recording errors, or it may reflect real changes, as when a plot is expanded by clearing the forest, or by merging it with another plot. I exclude all plots with recorded changes in area in order to avoid endogeneity problems. For example, if a titled plot is merged with a non-titled plot, the household may report that the initially titled plot is not titled anymore. It may also change its report about the investment status of the plot (e.g. if one of the merged plots has perennial crops while the other does not).
Table 1: Property rights and agricultural investment, plot level regressions
Dependent variable:
Plot irrigated Plot planted with perennial crops
Plot has soil and water conservation infrastructure
Plot irrigated from canals
Plot irrigated from well
Plot irrigated from spring, stream or lake
(1) (2) (3) (4) (5) (6)
LUC 0.064*** 0.0003 0.049** 0.030* 0.006 0.028*
(0.018) (0.006) (0.019) (0.016) (0.006) (0.015)
Crop choice Restricted
0.124*** -0.022*** 0.124*** 0.139*** -0.003 -0.012
(0.012) (0.005) (0.013) (0.016) (0.004) (0.011)
Working age HH members, log
0.040** -0.007 0.012 0.029 -0.003 0.014
(0.017) (0.010) (0.018) (0.019) (0.008) (0.016)
Plot fixed effects Yes Yes Yes Yes Yes Yes
Year fixed effects Yes Yes Yes Yes Yes Yes
Observations 30,125 29,409 30,001 30,125 30,125 30,125
Notes: Level of analysis: Plot. Linear probability models. Standard errors in brackets. Standard errors adjusted for commune level clustering. Only plots with constant area included. *** p<0.01, ** p<0.05, * p<0.1.
Source: Author’s calculations based on VARHS 2006-2014.
Table 1 presents results of estimating the model above. All models contain plot as well as year fixed effects. The first two regressions are models for a plot being, respectively, irrigated and planted with perennial crops. Results show a strong and statistically significant effect of LUCs on irrigation. Plots are more than six percentage points more likely to be irrigated after they are titled than before. In contrast, there is no effect of LUCs on perennial crops, contrary to the findings in Do and Iyer (2008). One somewhat speculative explanation for this negative finding is that perennial crops may function as a substitute for land titles. Trees and bushes are a visible and costly type of investment and may in themselves strengthen a household’s claim to a plot of land, thus reducing the demand for an LUC (Besley 1995; Braselle et al. 2002). Crop choice restrictions have a positive effect on irrigation and a negative effect on perennial crops. This is not surprising since restrictions typically compel the household to grow rice. Labour resources have a positive effect on investment in irrigation but no effect on perennial crops. The reason for the latter result might be that perennial crops often require less labour (after planting) than annual crops. Hence, the incentive to plant perennial crops might be highest in households with scarce labour resources.
Regressions 3–6 further investigate the effect of LUCs on irrigation. A major concern is the potential importance of government investment in irrigation and the possibility that public irrigation investment might be correlated with titling. The government mainly invests in canal infrastructure that brings water to plots. Households, on the other hand, mainly conduct on-plot
19
investment in wells, dykes, flattening, etc. The data set contains an indicator for a plot having ‘soil and water conservation infrastructure’. Since this reflects investment on the plot, it is likely to be driven mainly by household activities. Regression 3 shows that plots are 5 percentage points more likely to have soil and water conservation infrastructure after titling than before (a statistically significant effect). This suggests that the effect of titling is not driven by government investment activities. Regressions 4 to 6 provide further support for this view. These regressions model the presence of irrigation from three different types of sources: a) canals; b) wells; and c) springs, streams, or lakes. Only the first type of irrigation is likely to be substantially driven by government investment. Indeed, LUCs do have a significant, positive effect on irrigation from canals. This may partly reflect government investment. However, LUCs also have a positive, significant effect on irrigation from springs, streams, or lakes. This is much more likely to be driven by household investment in water conservation infrastructure.10 Overall, the results support the view that stronger land property rights, in the form of land titles, increase agricultural investment by households.
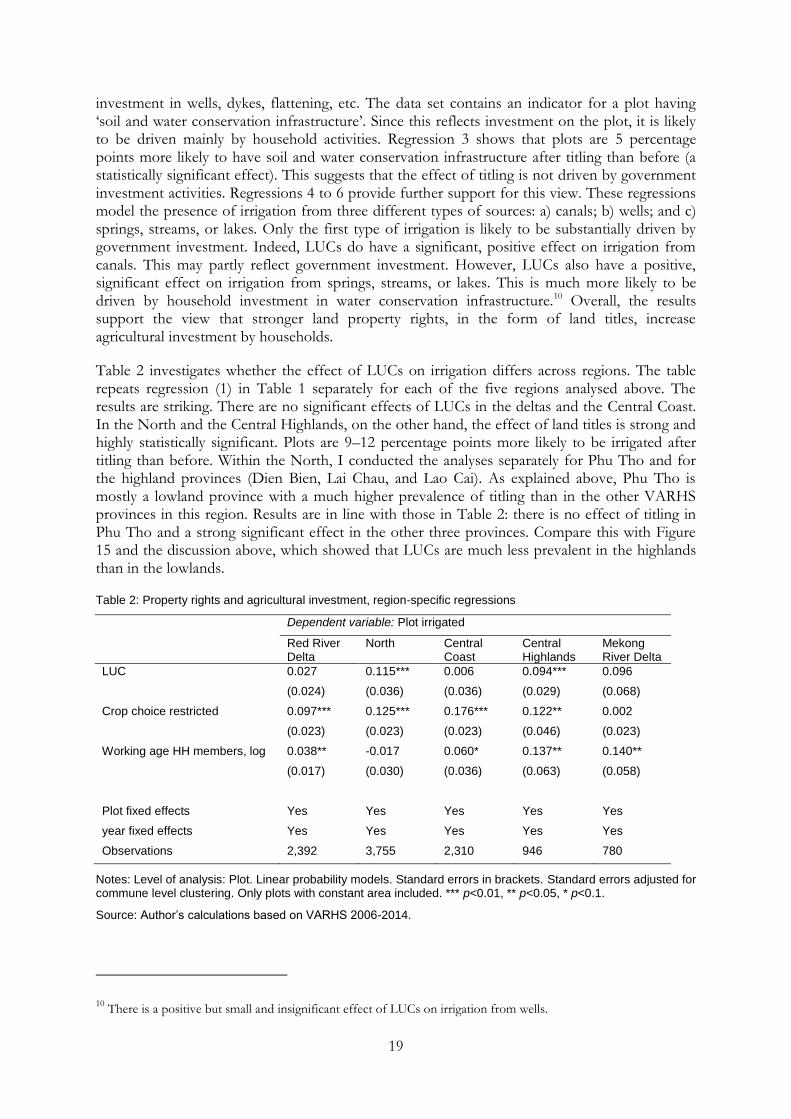
Table 2 investigates whether the effect of LUCs on irrigation differs across regions. The table repeats regression (1) in Table 1 separately for each of the five regions analysed above. The results are striking. There are no significant effects of LUCs in the deltas and the Central Coast. In the North and the Central Highlands, on the other hand, the effect of land titles is strong and highly statistically significant. Plots are 9–12 percentage points more likely to be irrigated after titling than before. Within the North, I conducted the analyses separately for Phu Tho and for the highland provinces (Dien Bien, Lai Chau, and Lao Cai). As explained above, Phu Tho is mostly a lowland province with a much higher prevalence of titling than in the other VARHS provinces in this region. Results are in line with those in Table 2: there is no effect of titling in Phu Tho and a strong significant effect in the other three provinces. Compare this with Figure 15 and the discussion above, which showed that LUCs are much less prevalent in the highlands than in the lowlands.
Table 2: Property rights and agricultural investment, region-specific regressions
Dependent variable: Plot irrigated
Red River Delta
North Central Coast
Central Highlands
Mekong River Delta
LUC 0.027 0.115*** 0.006 0.094*** 0.096
(0.024) (0.036) (0.036) (0.029) (0.068)
Crop choice restricted 0.097*** 0.125*** 0.176*** 0.122** 0.002
(0.023) (0.023) (0.023) (0.046) (0.023)
Working age HH members, log 0.038** -0.017 0.060* 0.137** 0.140**
(0.017) (0.030) (0.036) (0.063) (0.058)
Plot fixed effects Yes Yes Yes Yes Yes
year fixed effects Yes Yes Yes Yes Yes
Observations 2,392 3,755 2,310 946 780
Notes: Level of analysis: Plot. Linear probability models. Standard errors in brackets. Standard errors adjusted for commune level clustering. Only plots with constant area included. *** p<0.01, ** p<0.05, * p<0.1.
Source: Author’s calculations based on VARHS 2006-2014.
10 There is a positive but small and insignificant effect of LUCs on irrigation from wells.
20
In other words, titling matters exactly where it is least common. This provides a strong case for expanding titling programmes in the uplands. Of course, concerns for equity only make the case stronger: the uplands are poorer than the lowlands, and the result presented here (combined with those in Newman et al. 2015) suggest that titling is a way to increase productivity and therefore household income.
What explains the interregional variation in the effect of LUCs? One might suspect that the absence of a statistically significant effect in the lowlands is due to lack of variation on the dependent variable, i.e. that almost all plots are already irrigated. This is not the case. Even in the lowlands only around 80 per cent of plots are irrigated. A more likely reason is that property rights are more contested in the hills, implying that the protection offered by titles is more important. For example, many plots in the uplands are acquired by clearing forest land, which in many cases is communally owned. Hence, disputes about rightful ownership may easily arise. In contrast, land clearing is almost entirely absent in the lowlands.
7 Conclusions
This paper has investigated a number of topics related to agricultural land. First, I showed that landlessness among the VARHS panel households is low (around 8 per cent) and stable. Landlessness is highest in the richest income quintile and lowest in the poorest quintile, supporting the view advanced by Ravallion and van de Walle (2008) that Vietnamese households typically do not become landless as a result of adverse, economic shocks, but rather as part of a strategy aimed at exploiting new opportunities in the non-farm economy. Second, I show that the median farm size is small (around one-third of a hectare—one-fifth of a hectare in the Red River Delta), with a slight decline over time. Hence, there is no evidence of ‘inter-farm’ land consolidation (that is, no evidence of small farms being merged into larger ones). On the other hand, I find some evidence that ‘intra-farm’ consolidation is taking place. The mean number of plots operated dropped from 5.8 in 2006 to 4.1 in 2014, and there was a moderate increase in median plot size. This is consistent with the view that land consolidation programmes are to some extent effective in terms of merging small land plots into larger ones. Plots remain very small, though (the median plot is 625 m2, 1/16 of a hectare).
Next, I consider land markets. I show that land sales markets are more active in the Central Highlands than in any other region by orders of magnitude. The likely reason is the high level of migration into these areas, combined with the rapid changes in economic circumstances, related for example to the coffee boom, in these provinces. The richest households are more active than poorer households on the demand as well as the supply side of the land sales market. Hence, these markets mainly serve the better-off part of the population. Land rental markets are different. On the supply side, the richer households are much more likely to participate than poorer households. On the demand side, there is no such correlation. This implies that land rental markets transfer land from rich to poor households. The interregional distribution of rental market participation is also very different from the distribution of sales market activity. Rental markets are most active in the Red River Delta and least active in the North and the Central Highlands. While activity levels in land sales markets are approximately constant over time, participation rates in rental markets appear to be increasing. The share of households involved in land rental markets increased from 28 per cent in 2006 to 34 per cent in 2014.
Finally, I investigate property rights to agricultural land. I find that about 80 per cent of plots are held with a LUC (referred to here as a title) and that this share is approximately constant over the period of study. There is substantial, interregional variation in land titling. In the Northern Uplands (North excluding Phu Tho province), about 45 per cent of plots are not titled, while the

21
corresponding share in the Mekong River Delta is only about 2 per cent. Richer households are significantly more likely to hold titled plots than poorer households.
I find that the risk of government land expropriation has dropped over the period of study but remains substantial (about 3 per cent over a two-year period). There is significant interregional heterogeneity. The risk of being expelled from a plot of land has actually increased in the North and the Central Highlands. I also consider rights to choose what to use a plot for. I find that on 45 per cent of agricultural plots, households are not free to decide which crops to grow. In the vast majority of cases, households are compelled to grow rice. Crop choice is much more likely to be restricted in the Red River Delta than in other regions, including the Mekong River Delta.
I use fixed effects regressions at the plot level to investigate the effects of LUCs on agricultural investment. While I find no evidence that LUCs increase investment in perennial crops, results indicate that LUCs have a substantial, positive effect on private household investment in irrigation. Remarkably, this effect is much stronger in the uplands than in the lowlands. This is paradoxical because titling efforts have been disproportionately focused on the lowlands. These findings provide a strong rationale for expanding land titling programmes in the Northern uplands and Central Highlands.
References
Alston, L.J., G.D. Libecap, and R. Schneider (1996). ‘The Determinants and Impact of Property Rights: Land Titles on the Brazilian Frontier’. Journal of Law, Economics and Organization, 12(1): 25–61.
Anderson, J., and S. Davidsen (2011). Recognizing and Reducing Corruption Risks in Land Management in Viet Nam. Hanoi: National Political Publishing House (Su That).
Besley, T. (1995). ‘Property Rights and Investment Incentives: Theory and Evidence from Ghana’. Journal of Political Economy, 103(5): 903–37.
Brandt, L. (2006). ‘Land Access, Land Markets and their Distributional Implications in Rural Viet Nam’. Summary report. Mimeo. University of Toronto.
Braselle, A.S., F. Gaspart, and J.-P. Platteau (2002). ‘Land Tenure Security and Investment Incentives: Puzzling Evidence from Burkina Faso’. Journal of Development Economics, 67: 373–418.
Carter, M., and P. Olinto (2003). ‘Getting Institutions “Right” for whom? Credit Constraints and the Impact of Property Rights on the Quantity and Composition of Investment’. American Journal of Agricultural Economics, 85(1): 173–86.
CIEM, ILSSA, IPSARD, and University of Copenhagen (2013). ‘Characteristics of the Vietnamese Rural Economy. Evidence from a 2012 Rural Household Survey in 12 Provinces of Vietnam’. Hanoi: Central Institute for Economic Management.
Deininger, K., and S. Jin (2008). ‘Land Sales and Rental Markets in Transition. Evidence from Rural Viet Nam’. Oxford Bulletin of Economics and Statistics, 70(1): 67–101.
Do, Q.T., and L. Iyer (2008). ‘Land Titling and Rural Transition in Viet Nam’. Economic Development and Cultural Change, 56(3): 531–79.
Feder, G., and T. Onchan (1987). ‘Land Ownership Security and Farm Investment in Thailand’. American Journal of Agricultural Economics, 69: 311–20.
Giesecke, J.A., N.H. Tran, E.L. Corong, and S. Jaffee (2013). ‘Rice Land Designation Policy in Viet Nam and the Implications of Policy Reform for Food Security and Economic Welfare’. Journal of Development Studies, 49(9): 1202–18.
Gourou, P., (1936). Les Paysans du Delta Tonkinois. Paris: Mouton & Co, and Maison Des Science de L’Homme.

22
Hornbeck, R. (2010). ‘Barbed Wire: Property Rights and Agricultural Development’. Quarterly Journal of Economics, 125(2): 767–810.
Jacoby, H., G. Li, and S. Rozelle (2002). ‘Hazards of Expropriation: Tenure Insecurity and Investment in Rural China’. American Economic Review, 92(5): 1420–47.
Jacoby, H., and G. Mansuri (2008). ‘Land Tenancy and Non-Contractible Investment in Rural Pakistan’. Review of Economic Studies, 73(3): 763–88.
Kerkvliet, B.T. (2006). ‘Agricultural Land in Viet Nam: Markets Tempered by Family, Community and Socialist Practices’. Journal of Agrarian Change, 6(3): 285–305.
Khai, L.D., T. Markussen, S. McCoy, and F. Tarp (2013). ‘Access to Land. Market- and Non-Market Land Transactions in Rural Viet Nam’. In S. Holden., K. Otsuka, and K. Deininger (eds), Land Tenure Reform in Asia and Africa—Assessing Impacts on Poverty and Natural Resource Management. Basingstoke: Palgrave Macmillan.
Kompas, T., T.N. Che, H.T.M. Nguyen, and H.Q. Nguyen (2012). ‘Productivity, Net Returns, and Efficiency: Land and Market Reform in Vietnamese Rice Production’. Land Economics, 88: 478–95.
Markussen, T. (2008). ‘Property Rights, Productivity and Common Property Resources. Insights from Rural Cambodia’. World Development, 36(11): 2277–96.
Markussen, T., F. Tarp, and K. Van den Broeck (2011). ‘The Forgotten Property Rights: Evidence on Land Use Rights in Viet Nam’. World Development, 39(5): 839–50.
Markussen, T., D.H. Thiep, N.D.A. Tuan, and F. Tarp (2013). ‘Inter- and Intra-Farm Land Fragmentation in Viet Nam’. CIEM Working Paper. Hanoi: Central Institute for Economic Management.
Markussen, T., and F. Tarp (2014). ‘Political Connections and Land-Related Investment in Rural Viet Nam’. Journal of Development Economics, 110: 191–302.
Marsh, S.P., T.G. MacAulay, P.V. Hung (2006). ‘Agricultural Development and Land Policy in Vietnam’. Canberra: ACIAR.
Newman, C., F. Tarp, and K. van den Broeck (2015). ‘Property Rights and Productivity: The Case of Joint Land Titling in Viet Nam’. Land Economics, 91(1): 91–105.
Pingali, P., and V.T. Xuan (1992). ‘Viet Nam: Decollectivization and Rice Productivity Growth’. Economic Development and Cultural Change, 40(4): 697–718.
Popkin, S.L. (1979). The Rational Peasant. The Political Economy of Rural Society in Viet Nam. Berkeley, CA: University of California Press.
Ravallion, M., and D. van de Walle (2004). ’Breaking up the Collective Farms. Welfare Outcomes of Viet Nam’s Massive Land Privatization’. Economics of Transition, 12: 201–36.
Ravallion, M., and D. van de Walle (2006). ’Land Reallocation in an Agrarian Transition. Economic Journal, 116: 924–42.
Ravallion, M., and D. van de Walle (2008). ‘Does Rising Landlessness Signal Success or Failure for Viet Nam’s Agrarian Transition?’ Journal of Development Economics, 87: 191–209.
Rozelle, S., and J.F.M. Swinnen (2004). ‘Success and Failure of Reform: Insights from the Transition of Agriculture’. Journal of Economic Literature, 42: 404–56.