Embed Size (px)
Citation preview
WIDER Working Paper 2015/064
Economic transformation and the diversification of livelihoods in rural Viet Nam
Carol Newman and Christina Kinghan*
August 2015

* Both authors Department of Economics, Trinity College Dublin, Ireland; corresponding author: [email protected]
This study has been prepared within the UNU-WIDER project ‘Structural transformation and inclusive growth in Vietnam’, directed by Finn Tarp.
Copyright © UNU-WIDER 2015
ISSN 1798-7237 ISBN 978-92-9230-953-4
Typescript prepared by Leslie O’Brien for UNU-WIDER.
UNU-WIDER gratefully acknowledges the financial contributions to the research programme from the governments of Denmark, Finland, Sweden, and the United Kingdom.
The World Institute for Development Economics Research (WIDER) was established by the United Nations University (UNU) as its first research and training centre and started work in Helsinki, Finland in 1985. The Institute undertakes applied research and policy analysis on structural changes affecting the developing and transitional economies, provides a forum for the advocacy of policies leading to robust, equitable and environmentally sustainable growth, and promotes capacity strengthening and training in the field of economic and social policy-making. Work is carried out by staff researchers and visiting scholars in Helsinki and through networks of collaborating scholars and institutions around the world.
UNU-WIDER, Katajanokanlaituri 6 B, 00160 Helsinki, Finland, wider.unu.edu
The views expressed in this publication are those of the author(s). Publication does not imply endorsement by the Institute or the United Nations University, nor by the programme/project sponsors, of any of the views expressed.
Abstract:
Diversification of household activities away from agriculture is a key characteristic of economic development. We examine the extent of diversification among Vietnamese households, from agriculture into waged employment and entrepreneurship and whether this diversification is welfare enhancing. We also examine the factors determining this transition from agriculture. Using four waves of panel data on a large sample of households surveyed between 2008 and 2014, we find that diversification is, on average, welfare enhancing and that the most beneficial form of diversification is into household enterprises. The decision to diversify is primarily motivated by income, especially for low-income households.
Keywords: diversification, structural transformation, entrepreneurship, household welfare, Vietnam JEL classification: D13, O12, O13

1
1 Introduction
The diversification of economic activity away from the agricultural sector is a key characteristic of economic development. Understanding the outcomes from diversification in addition to the determinants that prompt households to diversify is of great importance to policy makers. Of particular importance is a consideration of whether diversification increases income inequality and the potential impact of this on society.
This paper examines the extent to which rural Vietnamese households have, in recent times, diversified away from own-farm agriculture, into waged employment and entrepreneurial activities, and the impact of this diversification on welfare outcomes. We also examine whether the welfare outcomes for households who participate in more than one type of economic activity, are superior to those who remain specialized in agriculture. Our analysis uses the Vietnam Access to Resources Household Survey (VARHS), which covers a representative sample of 2,181 rural households in 12 provinces of Viet Nam.1 VARHS collects data on all aspects of rural life including detailed information on the economic activities of households and associated welfare outcomes. The same households are surveyed every two years between 2008 and 2014 and so the sample spans a crucial period of economic transformation in Viet Nam.
The impact of diversification into non-farm activities on rural households has been well documented. Overall, the literature in this area concludes that, while diversification is positively correlated with income and wealth (Economica Viet Nam 2013), it also has the potential to increase inequality, as households with favourable initial characteristics and conditions may disproportionately benefit. This highlights the potential for a dichotomous outcome from non-farm activity, where poorer households partake in low-return activities and wealthier households undertake high-return activities. Differing outcomes from participating in non-farm activities can also be observed when diversification is as a result of ‘push’ factors such as shocks, risk reduction, and survival. These broad conclusions motivate the analysis of diversification undertaken in this paper and are elaborated upon below.
Imai et al. (2015) observe significantly higher per capita consumption, as a proxy for poverty reduction, for households participating in the non-farm sector in both Viet Nam and India. Access to non-farm work also decreased vulnerability to shocks, reducing risk. However, effects were significantly higher for households participating in skilled employment compared to those working in unskilled/manual positions. Hoang et al. (2014), suggest that diversification can act as a strong tool for poverty alleviation in Viet Nam. They find that an additional member of the household, working in a non-farm activity, decreases the probability of poverty by 7-12 per cent and can increase household expenditure by up to 14 per cent over a two-year period. Furthermore, their results indicate that a reduction in hours worked on the farm due to non-farm work does not lead to a reduction in income earned from agricultural activities. Bezu et al. (2012), also find a strong positive relationship between a household’s non-farm income share and its subsequent expenditure growth, for both poor and well-off households in Ethiopia. Yet, relatively wealthier households benefitted more from off-farm activity than poorer households did.
Similarly, Lanjouw et al. (2013) found that non-farm diversification in India not only led to increased incomes and reductions in poverty, but that it was also instrumental in breaking down
1 Data are available from the Central Institute for Economic Management, Hanoi, Viet Nam (see http://www.ciem.org.vn/).
2
barriers to economic mobility among the poorest segments of society. Coupled with diversification, however, they highlighted rising income inequality at village level and the potential impact this inequality may have on social cohesiveness. Birthal et al. (2014) stated that poorer households tended to diversify into low-return activities and that this diversification had an unequalizing effect on the income distribution, but a positive impact on household income for rural households in India. A report undertaken by the Development Analysis Network (2003), found that while non-farm employment was important for job creation in Viet Nam, it significantly widened the non-farm income gap between rich and poor, hence contributing to social inequality. This research emphasizes both the positives from diversification but also the potential for growing income inequality among rural households.
Regarding the determinants of diversification into non-farm activity, Olugbire et al. (2012) consider the household characteristics associated with participation in non-farm employment and entrepreneurship in Nigeria. They conclude that education, gender, land, and household size are key determinants of participation in non-farm waged employment, whereas value of assets, access to credit, social capital, household, and land size are important determinants of non-farm entrepreneurship. Similarly, Ackah (2013) finds land size, education past primary level, and gender are important determinants of diversification in Ghana, with females more likely to be engaged in non-farm work. Education past secondary school is of particular importance for stable waged employment. Benedikter et al. (2013) also note a correlation between enterprise size and owner education. They find that level of savings, prior work experience, and family relations/inheritance were key factors in establishing a non-farm enterprise in the Mekong Delta, Viet Nam. Micevska (2008) emphasizes the importance of education for diversification, finding that individuals with higher education levels tend to diversify into high-return non-farm activities, with low-return activities pursued by those with limited education levels. This in turn influences the level of income generated by diversification. Overall, this indicates that resource-poor, less educated households may face significant barriers to entry into non-farm activity.
Giesbert and Schindler (2012) examine welfare dynamics among rural households in Mozambique. They find that drought has a negative impact on a household’s asset accumulation, but households in which at least one member has regular non-farm work experience less adverse asset growth from a drought than those without non-farm wage opportunities—suggesting that income diversification has a positive impact in the aftermath of an exogenous shock. Looking at the impact of shocks on diversification in Ethiopia, Porter (2012) finds that households who increase non-crop income as a result of rainfall shocks can effectively cancel out the negative impact on crop income. Bezu and Barrett (2012) also conclude that shocks reducing agricultural income can trigger transition into high-return non-farm activities, with shocks to wealth resulting in transition into low-return non-farm activities. At a broader level, Haggblade et al. (2010) highlight the importance of agricultural development in determining whether diversification will be primarily as a result of ‘pull’ factors into high-return activities or ‘push’ factors into low-return activities. They posit that this is the result of linkages between agriculture and diversification. Positive linkages include rising incomes stimulating demand for products and services, increased productivity freeing up labour for non-farm work, and demand for seeds and fertilizers, all of which stimulate a productive non-farm sector. In contrast, where the agricultural sector is stagnant or declining, yet population growth is increasing, linkages such as low labour productivity, rising landlessness, and limited household purchasing power will induce diversification into low-return activities.
In summary, the literature suggests that diversification into non-farm activities by rural households has a positive impact on overall household incomes/expenditures. However, the impact of diversification on the income distribution and ensuing inequalities between households is less clear. Differing returns are evident for households based on their individual characteristics,
3
which may determine whether they diversify into high- or low-return activities. Whether diversification is in response to a shock and hence prompted by ‘push’ factors or due to favourable endowments possessed by a household can lead to heterogeneous welfare outcomes from non-farm activity. This is of great importance to policy makers—facilitating and indeed encouraging diversification of household incomes should result in improved welfare outcomes, yet this may be at the cost of rising inequalities and divisions in society.
The rest of the paper proceeds as follows. Section 2 describes the pattern of diversification of rural households in Viet Nam while Section 3 documents the transition from specialized agriculture into other activities. Section 4 presents an empirical analysis of the impact of diversification on welfare and of the factors that determine the transition from agriculture. Section 5 concludes with a discussion of the key findings and recommendations for both policy and future research in this area.
2 Description of non-farm activities of households
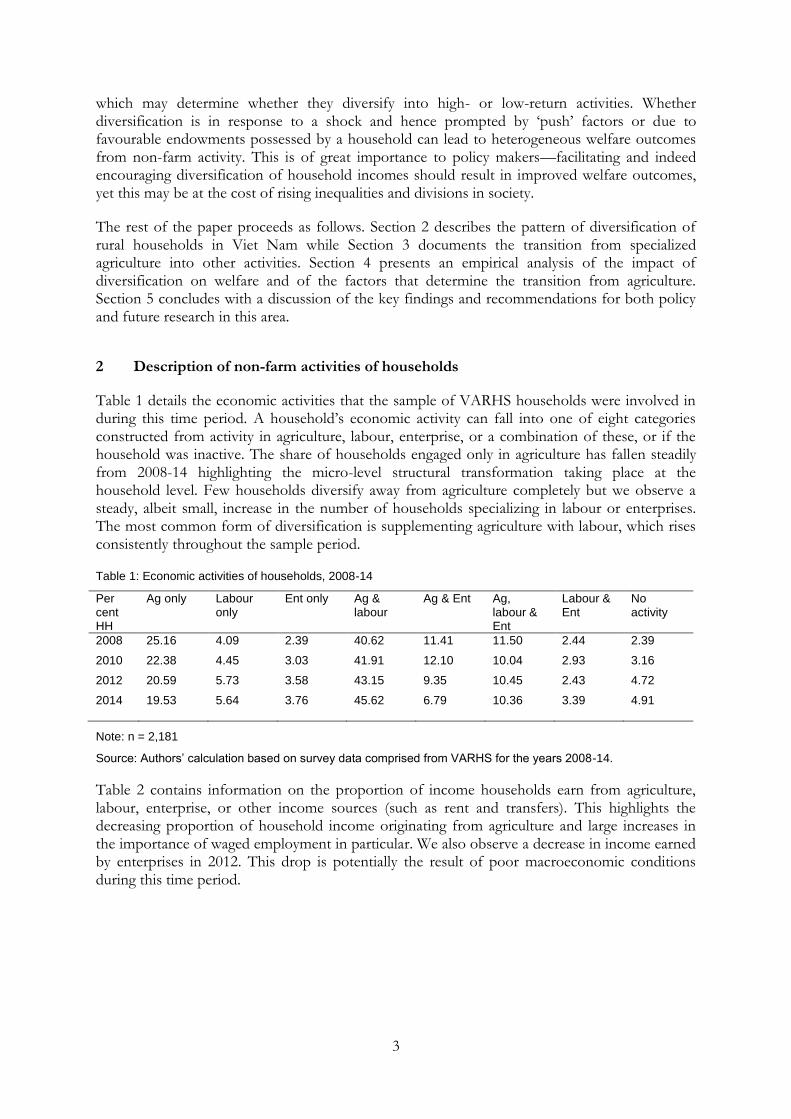
Table 1 details the economic activities that the sample of VARHS households were involved in during this time period. A household’s economic activity can fall into one of eight categories constructed from activity in agriculture, labour, enterprise, or a combination of these, or if the household was inactive. The share of households engaged only in agriculture has fallen steadily from 2008-14 highlighting the micro-level structural transformation taking place at the household level. Few households diversify away from agriculture completely but we observe a steady, albeit small, increase in the number of households specializing in labour or enterprises. The most common form of diversification is supplementing agriculture with labour, which rises consistently throughout the sample period.
Table 1: Economic activities of households, 2008-14
Per cent HH
Ag only Labour only
Ent only Ag & labour
Ag & Ent Ag, labour & Ent
Labour & Ent
No activity
2008 25.16 4.09 2.39 40.62 11.41 11.50 2.44 2.39
2010 22.38 4.45 3.03 41.91 12.10 10.04 2.93 3.16
2012 20.59 5.73 3.58 43.15 9.35 10.45 2.43 4.72
2014 19.53 5.64 3.76 45.62 6.79 10.36 3.39 4.91
Note: n = 2,181
Source: Authors’ calculation based on survey data comprised from VARHS for the years 2008-14.
Table 2 contains information on the proportion of income households earn from agriculture, labour, enterprise, or other income sources (such as rent and transfers). This highlights the decreasing proportion of household income originating from agriculture and large increases in the importance of waged employment in particular. We also observe a decrease in income earned by enterprises in 2012. This drop is potentially the result of poor macroeconomic conditions during this time period.
4
Table 2: Proportion of income earned from different economic activities, 2008-14
Per cent HH
Agriculture Labour Enterprise Other
2008 34.76 28.15 12.63 24.36
2010 23.36 31.26 13.67 31.66
2012 23.00 32.92 3.85 40.11
2014 23.80 44.35 12.28 19.54
Note: n = 2,181
Source: Authors’ calculation based on survey data comprised from VARHS for the years 2008-14.
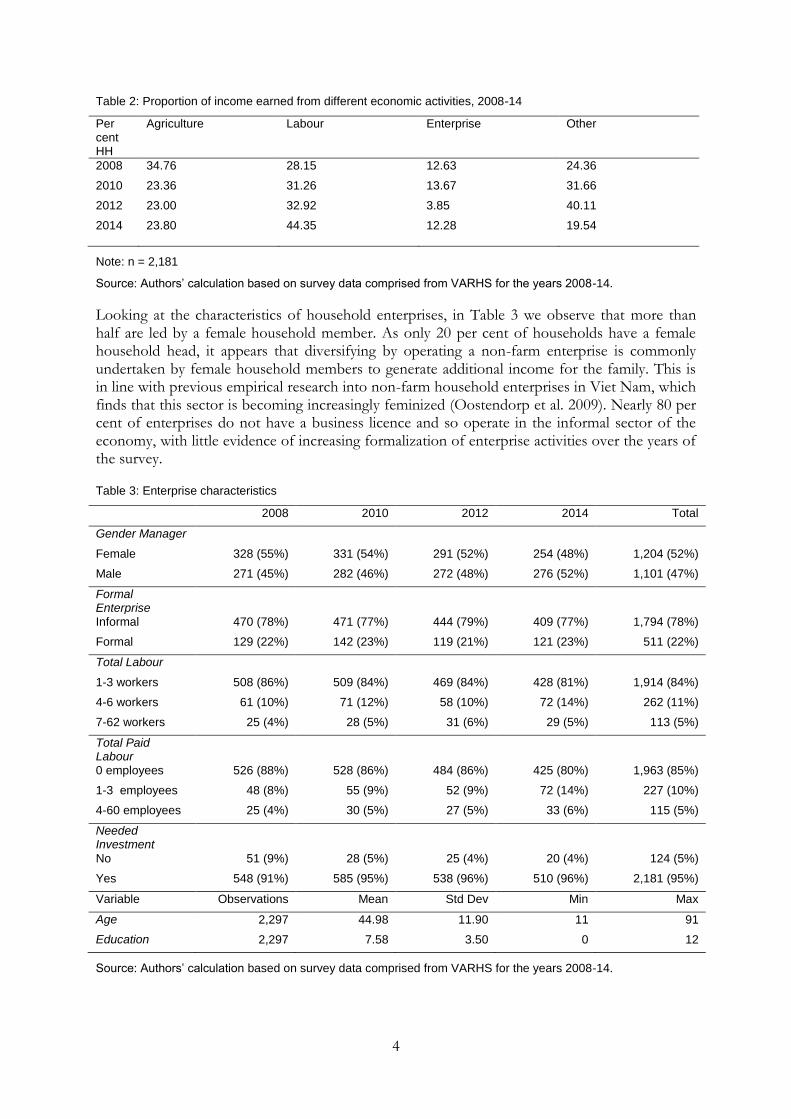
Looking at the characteristics of household enterprises, in Table 3 we observe that more than half are led by a female household member. As only 20 per cent of households have a female household head, it appears that diversifying by operating a non-farm enterprise is commonly undertaken by female household members to generate additional income for the family. This is in line with previous empirical research into non-farm household enterprises in Viet Nam, which finds that this sector is becoming increasingly feminized (Oostendorp et al. 2009). Nearly 80 per cent of enterprises do not have a business licence and so operate in the informal sector of the economy, with little evidence of increasing formalization of enterprise activities over the years of the survey.
Table 3: Enterprise characteristics
2008 2010 2012 2014 Total
Gender Manager
Female 328 (55%) 331 (54%) 291 (52%) 254 (48%) 1,204 (52%)
Male 271 (45%) 282 (46%) 272 (48%) 276 (52%) 1,101 (47%)
Formal Enterprise
Informal 470 (78%) 471 (77%) 444 (79%) 409 (77%) 1,794 (78%)
Formal 129 (22%) 142 (23%) 119 (21%) 121 (23%) 511 (22%)
Total Labour
1-3 workers 508 (86%) 509 (84%) 469 (84%) 428 (81%) 1,914 (84%)
4-6 workers 61 (10%) 71 (12%) 58 (10%) 72 (14%) 262 (11%)
7-62 workers 25 (4%) 28 (5%) 31 (6%) 29 (5%) 113 (5%)
Total Paid Labour
0 employees 526 (88%) 528 (86%) 484 (86%) 425 (80%) 1,963 (85%)
1-3 employees 48 (8%) 55 (9%) 52 (9%) 72 (14%) 227 (10%)
4-60 employees 25 (4%) 30 (5%) 27 (5%) 33 (6%) 115 (5%)
Needed Investment
No 51 (9%) 28 (5%) 25 (4%) 20 (4%) 124 (5%)
Yes 548 (91%) 585 (95%) 538 (96%) 510 (96%) 2,181 (95%)
Variable Observations Mean Std Dev Min Max
Age 2,297 44.98 11.90 11 91
Education 2,297 7.58 3.50 0 12
Source: Authors’ calculation based on survey data comprised from VARHS for the years 2008-14.
5
More than 80 per cent of household enterprises are operated by one to three individuals, with a further 10 per cent having four to six workers. Only 5 per cent have more than seven people working in the enterprise. We can also look at how many of these individuals receive a wage for their work. Approximately 85 per cent of enterprises do not pay a wage to those working in the enterprise, 10 per cent of enterprises pay a wage to between one and three employees and only 5 per cent of enterprises pay a salary to more than four workers. These descriptive statistics are in line with the findings that diversification into non-farm activity is more likely to be undertaken by low-income households and often in response to a shock. While welfare enhancing, the vast majority of enterprises tend to be operated informally and on a low scale, as a basic means for households to generate additional income. However, almost all households were required to invest in the enterprise in order to start doing business, with more than 90 per cent of households stating that an initial investment was needed to diversify into this activity.
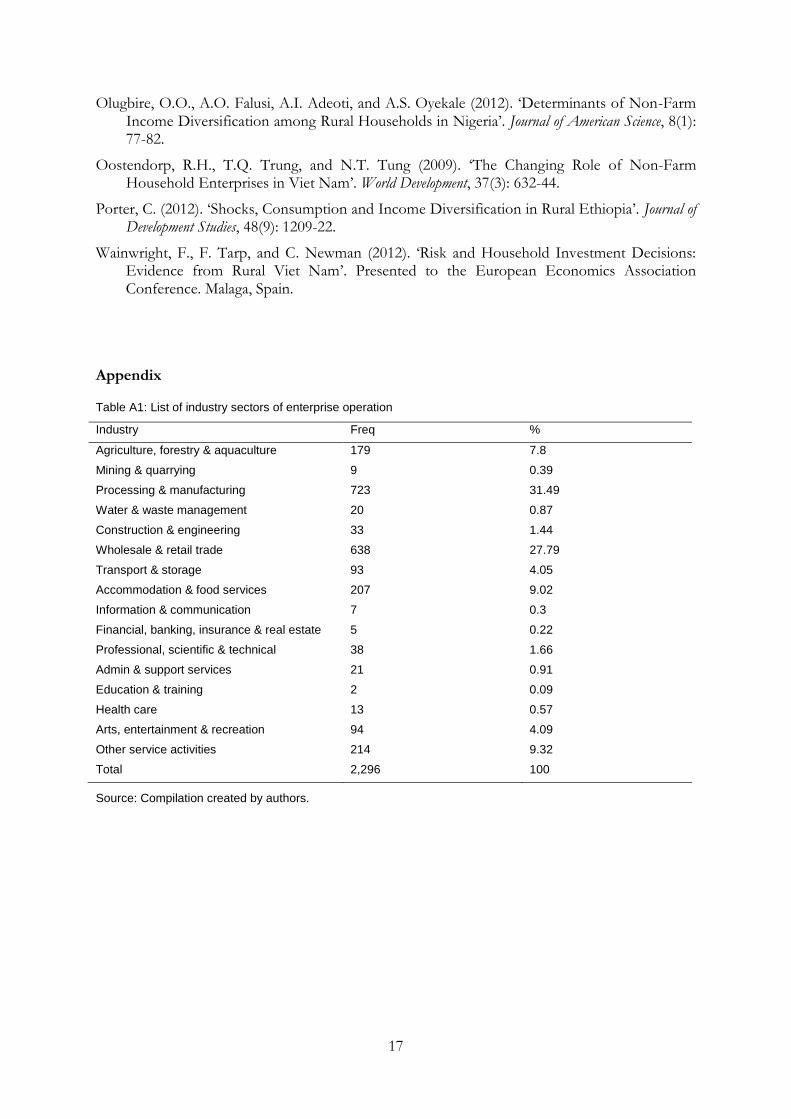
The age and education of enterprise managers are also important when examining the key characteristics of these household enterprises. The average age of an enterprise manager is 45, with a wide disparity in ages, ranging from 11 to 91 years old. On average, enterprise managers have completed eight years of schooling. Finally, the most popular industries were processing and manufacturing (30 per cent), wholesale and retail trade (28 per cent) and accommodation and food services (9 per cent). A full list of the industry sectors is given in Table A1 of the Appendix.
Regarding external employment, Table 4 shows an increase both in households with a member working externally and the number of individuals working externally, over the years of the survey. The number of households that do not have any kind of external employment fell from 41 per cent in 2008 to 35 per cent in 2014 and the number of households with three household members working externally increased from 7 per cent to 9 per cent. However, while a large number of households have members working externally, less than half of these households have at least one member working with a formal labour contract. This indicates that the kind of employment undertaken by diversifying households may be informal.

6
Table 4: External employment descriptive statistics
2008 2010 2012 2014 Total
Members working
0 900 (41%)
894 (41%)
833 (38%)
761 (35%)
3,388 (39%)
1 604 (28%)
620 (29%)
648 (30%)
594 27%)
2,466 (28%)
2 458 (21%)
417 (19%)
475 (22%)
546 (25%)
1,896 (22%)
3 142 (7%)
161 (7%)
153 (7%)
184 (9%)
640 (7%)
4-10 70 (3%)
85 (4%)
68 (3%)
91 (4%)
314 (4%)
Labour contract
No 793 (62%)
830 (65%)
813 (60%)
837 (59%)
3,273 (62%)
Yes 481 (38%)
453 (35%)
531 (40%)
578 (41%)
2,043 (38%)
Member employed by:
Individual/household
No 363 (28%)
366 (29%)
436 (32%)
451 (32%)
1,616 (30%)
Yes 911 (72%)
917 (71%)
908 (68%)
964 (68%)
3,700 (70%)
Government/state ent
No 974 (76%)
980 (76%)
1,016 (76%) 1,069 (76%) 4,039 (76%)
Yes 300 (24%)
303 (24%)
328 (24%)
346 (24%)
1,277 (24%)
Vietnamese private firm
No 1,098 (86%)
1,111 (87%) 1,081 (80%) 1,094 (77%) 4,384 (82%)
Yes 176 (14%)
172 (13%)
263 (20%)
321 (23%)
932 (18%)
Location employment:
Within commune
No 524 (41%)
489 (38%)
466 (35%)
443 (31%)
1,922 (36%)
Yes 757 (59%)
798 (62%)
882 (65%)
977 (69%)
3,414 (64%)
Another commune in district
No 982 (77%)
938 (73%)
955 (71%)
1,048 (74%)
3,923 (74%)
Yes 292 (23%)
345 (27%)
389 (29%)
367 (26%)
1,393 (26%)
Outside district
No 786 (62%)
910 (71%)
1,024 (76%) 1,016 (72%) 3,736 (70%)
Yes 488 (38%)
373 (29%)
320 (24%)
399 (28%)
1,580 (30%)
Source: Authors’ calculation based on survey data comprised from VARHS for the years 2008-14.
We see further evidence of this when we examine who household members are employed by. Approximately 70 per cent of the households engaged in external employment, state that this employment is with another individual or household, compared to 25 per cent with a member employed by a government or state enterprise and less than 20 per cent employed by a private Vietnamese firm. In terms of the location for these activities, employment is widely dispersed. Around 60 per cent of households have a household member working within the commune, 25
7
per cent working in another commune within the district, and 30 per cent working outside the district. Finally, the most popular sectors for external employment are construction and engineering (24 per cent), processing and manufacturing (19 per cent) and agriculture, forestry, and aquaculture (17 per cent). A full list of industry sectors is given in Table A2 in the Appendix.
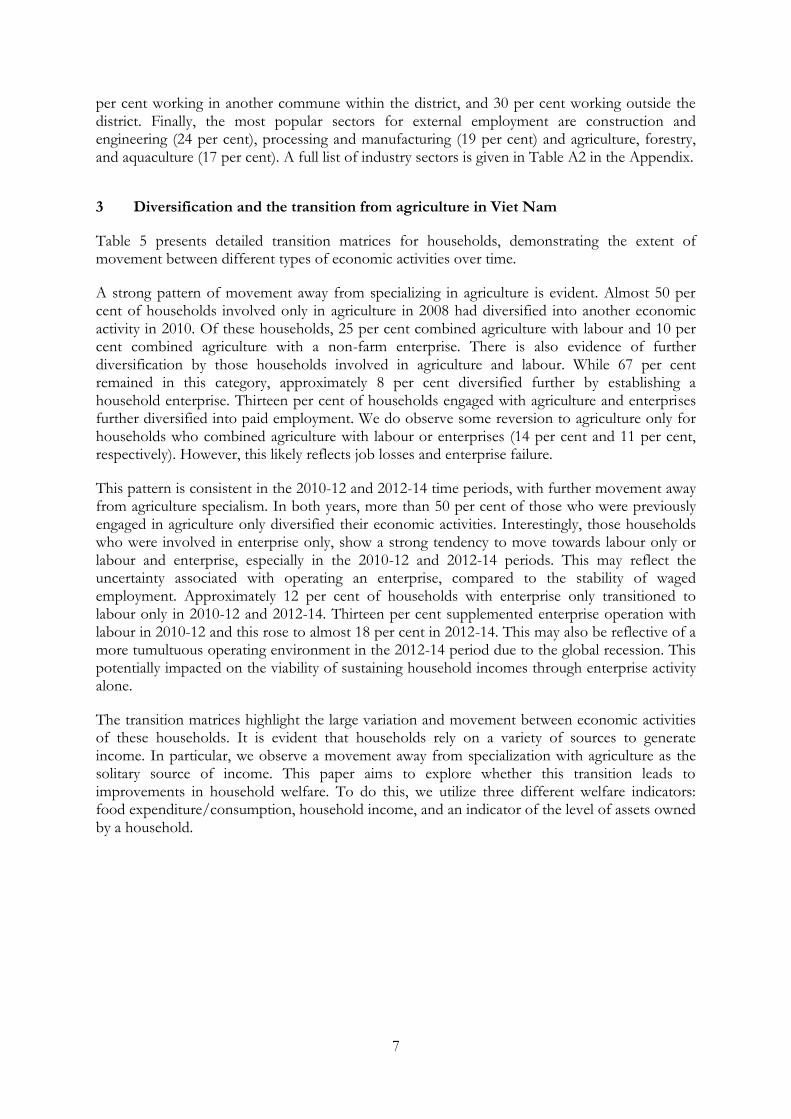
3 Diversification and the transition from agriculture in Viet Nam
Table 5 presents detailed transition matrices for households, demonstrating the extent of movement between different types of economic activities over time.
A strong pattern of movement away from specializing in agriculture is evident. Almost 50 per cent of households involved only in agriculture in 2008 had diversified into another economic activity in 2010. Of these households, 25 per cent combined agriculture with labour and 10 per cent combined agriculture with a non-farm enterprise. There is also evidence of further diversification by those households involved in agriculture and labour. While 67 per cent remained in this category, approximately 8 per cent diversified further by establishing a household enterprise. Thirteen per cent of households engaged with agriculture and enterprises further diversified into paid employment. We do observe some reversion to agriculture only for households who combined agriculture with labour or enterprises (14 per cent and 11 per cent, respectively). However, this likely reflects job losses and enterprise failure.
This pattern is consistent in the 2010-12 and 2012-14 time periods, with further movement away from agriculture specialism. In both years, more than 50 per cent of those who were previously engaged in agriculture only diversified their economic activities. Interestingly, those households who were involved in enterprise only, show a strong tendency to move towards labour only or labour and enterprise, especially in the 2010-12 and 2012-14 periods. This may reflect the uncertainty associated with operating an enterprise, compared to the stability of waged employment. Approximately 12 per cent of households with enterprise only transitioned to labour only in 2010-12 and 2012-14. Thirteen per cent supplemented enterprise operation with labour in 2010-12 and this rose to almost 18 per cent in 2012-14. This may also be reflective of a more tumultuous operating environment in the 2012-14 period due to the global recession. This potentially impacted on the viability of sustaining household incomes through enterprise activity alone.
The transition matrices highlight the large variation and movement between economic activities of these households. It is evident that households rely on a variety of sources to generate income. In particular, we observe a movement away from specialization with agriculture as the solitary source of income. This paper aims to explore whether this transition leads to improvements in household welfare. To do this, we utilize three different welfare indicators: food expenditure/consumption, household income, and an indicator of the level of assets owned by a household.
8
Table 5: Economic activity transition matrices, 2008-14
2008-10 Ag only Labour only
Ent only Ag & Labour
Ag & Ent Ag, Labour &
Ent
Labour & Ent
No activity
Ag only 52.83 0.37 0.00 25.41 10.05 7.68 0.00 3.66
Labour only 3.37 48.31 4.49 21.35 1.12 2.25 13.48 5.62
Ent only 0.00 0.00 53.85 5.77 13.46 5.77 13.46 7.69
Ag & labour 14.49 3.26 0.11 67.08 5.51 7.75 0.67 1.12
Ag & ent 11.29 1.21 6.85 20.16 45.97 12.50 0.81 1.21
Ag, labour & ent 8.40 3.20 2.00 39.60 13.20 28.40 4.40 0.80
Labour & ent 0.00 16.98 15.09 7.55 9.43 0.00 47.17 3.77
No activity 34.62 5.77 5.77 5.77 0.00 1.92 1.92 44.23
2010-12 Ag only Labour only
Ent only Ag & Labour
Ag & Ent Ag, Labour &
Ent
Labour & Ent
No activity
Ag only 48.16 2.46 0.41 31.76 6.56 3.28 0.20 7.17
Labour only 4.12 52.58 2.06 27.84 3.09 2.06 4.12 4.12
Ent only 3.03 12.12 54.55 1.52 6.06 6.06 12.12 4.55
Ag & labour 13.35 3.61 0.98 68.38 4.92 7.00 0.33 1.42
Ag & ent 18.18 0.00 4.17 18.94 35.23 21.21 0.76 1.52
Ag, labour & ent 10.96 2.28 0.91 35.16 11.42 36.53 1.83 0.91
Labour & ent 0.00 15.63 20.31 4.69 1.56 6.25 48.44 3.13
No activity 20.29 8.70 4.35 4.35 1.45 2.90 0.00 57.97
2012-14 Ag only Labour only
Ent only Ag & Labour
Ag & Ent Ag, Labour &
Ent
Labour & Ent
No activity
Ag only 48.33 1.34 0.89 33.85 5.12 4.45 0.22 5.79
Labour only 5.60 48.00 4.80 20.00 0.00 6.40 8.80 6.40
Ent only 0.00 11.54 47.44 5.13 5.13 5.13 17.95 7.69
Ag & labour 14.35 2.87 0.21 71.94 2.44 6.70 0.64 0.85
Ag & ent 14.22 0.49 6.86 23.04 30.39 23.04 1.47 0.49
Ag, labour & ent 6.14 0.44 2.63 37.72 14.47 32.89 4.82 0.88
Labour & ent 0.00 5.66 20.75 1.89 5.66 15.09 50.94 0.00
No activity 23.30 15.53 1.94 2.91 0.00 0.97 0.97 54.37
Note: n = 2,181
Source: Authors’ calculation based on survey data comprised from VARHS for the years 2008-14.
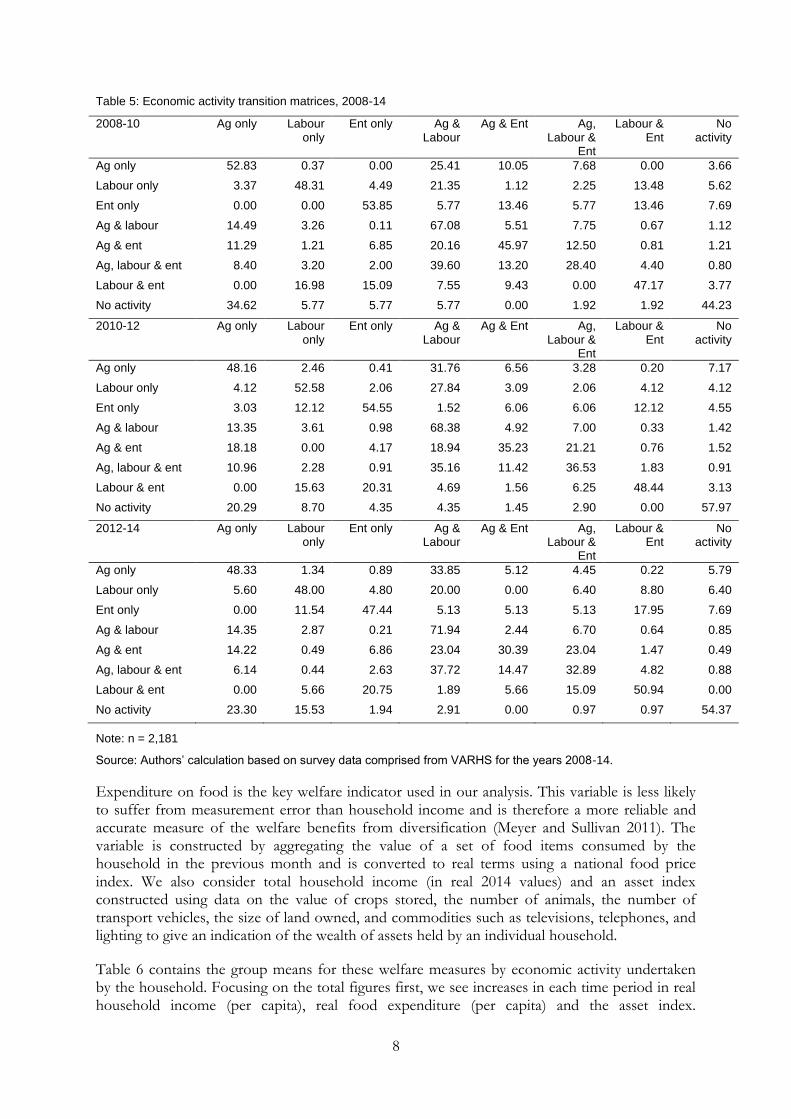
Expenditure on food is the key welfare indicator used in our analysis. This variable is less likely to suffer from measurement error than household income and is therefore a more reliable and accurate measure of the welfare benefits from diversification (Meyer and Sullivan 2011). The variable is constructed by aggregating the value of a set of food items consumed by the household in the previous month and is converted to real terms using a national food price index. We also consider total household income (in real 2014 values) and an asset index constructed using data on the value of crops stored, the number of animals, the number of transport vehicles, the size of land owned, and commodities such as televisions, telephones, and lighting to give an indication of the wealth of assets held by an individual household.
Table 6 contains the group means for these welfare measures by economic activity undertaken by the household. Focusing on the total figures first, we see increases in each time period in real household income (per capita), real food expenditure (per capita) and the asset index.
9
Disaggregating by economic activity, it is evident that average income is highest for households specializing in enterprise activity only in each year. Household’s specializing in agriculture, however, have the lowest income levels, below average for the group as a whole. It appears on first glance, therefore, that any kind of diversification leads to income improvements compared to remaining in agriculture only. Operating an enterprise is also positively correlated with high levels of food expenditure.
Table 6: Welfare measures, 2008-14
Real income per capita Real food expenditure per capita Asset index
2008
Ag only 956 237 -0.276
Labour only 1,752 382 -0.202
Ent only 2,769 491 -0.324
Ag & labour 1,117 298 0.152
Ag & Ent 2,027 397 0.270
Ag, labour & ent 1,503 341 0.426
Labour & ent 1,745 415 0.081
Total 1,318 311 0.037
2010
Ag only 1,223 312 -0.113
Labour only 2,139 377 -0.090
Ent only 3,400 504 -0.132
Ag & labour 1,369 321 0.290
Ag & ent 2,173 388 0.421
Ag, labour & ent 2,014 400 0.702
Labour & ent 2,531 419 0.398
Total 1,649 349 0.195
2012
Ag only 1,627 407 0.097
Labour only 2,484 615 0.127
Ent only 4,100 653 0.147
Ag & labour 1,586 415 0.448
Ag & ent 2,185 449 0.531
Ag, labour & ent 1,935 445 0.663
Labour & ent 2,755 550 0.626
Total 1,890 448 0.316
2014
Ag only 1,829 413 0.121
Labour only 2,394 506 0.176
Ent only 4,541 681 0.223
Ag & labour 1,742 422 0.435
Ag & ent 2,544 498 0.704
Ag, labour & ent 2,476 498 0.746
Labour & ent 3,092 531 0.748
Total 2,082 455 0.345
Note: n = 2,181
Source: Authors’ calculation based on survey data comprised from VARHS for the years 2008-14.
10
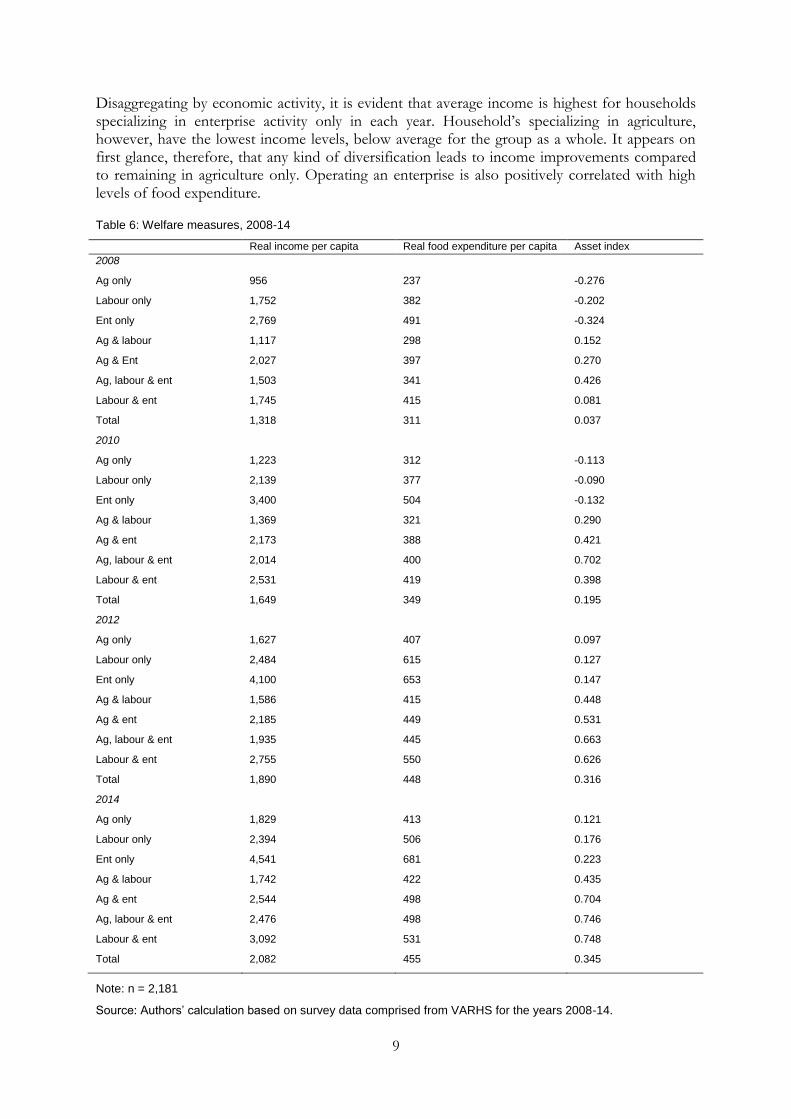
Average food expenditure (real per capita) is highest in each time period for households in either enterprise only or enterprise and labour categories. Households with labour only also have higher than average food expenditure, particularly in the later years. Again this highlights the welfare benefits of movement away from agriculture only. The asset index presents a slightly different view, consistently highest for households involved in agriculture, labour, and enterprise, and negative for households engaged in enterprise only in 2008 and 2010. This can be explained by the composition of this index, which includes assets such as land size, animals, and machinery. These are not necessarily important for successful functioning of an enterprise or external waged employment. The asset index for all groups is positive in the 2012 and 2014 time periods, yet highest still for households engaged in agriculture, labour, and enterprise. The transition to a positive coefficient over time for households engaged in labour and enterprise only may reflect a build-up of assets over time due to the positive impacts of this work on household welfare.
Overall, these descriptive statistics highlight the potential welfare-enhancing outcomes of non-farm diversification. However, these relationships will be formally examined in the ensuing empirical analysis in section 4.
4 Empirical analysis
In this section we explore further the impact of diversification on household welfare. Identifying a causal relationship between income diversification is complicated by the possibility that households may self-select into more productive activities. In other words, richer or wealthier households may choose to diversify rather than diversification in itself leading to higher levels of income or wealth. Any econometric model used to identify the effect of diversification on welfare must therefore control for all factors, observed or otherwise, that impact on both the welfare of the household and their decision to diversify their income sources.
Using the balanced panel of data from VARHS for the 2008-14 period allows us to control for self-selection in two ways. First, with the inclusion of household fixed effects, all time invariant characteristics of households are controlled for in the analysis including the households’ initial wealth and income levels. Second, the availability of lags allows past values of income and wealth to be controlled for in the analysis. As such, the impact of both long-term and transitory changes in income and wealth on welfare will be controlled for, allowing us to isolate the specific impact of diversification. We focus on consumption as our outcome measure of interest and control for household fixed effects, past income, and wealth to address the self-selection problem. The model we estimate is as follows:
ittiitititititit eWealthIncomeC 15141321 XβXβSβ
The key variables of interest are the sources of income of households. They are included in the
vector itS in the form of dummy variable indicators of the various categories described above
with households that are involved in agriculture only (i.e. specialized agriculture) forming the
base category. The vector itX includes time varying household characteristics, namely household
size, household size squared, whether the household head is female, age of the household head, age squared, the education level of the household head, the number of children in the household, whether the household is of Kinh ethnicity, whether the head of household is born in the commune, and whether the household is classified as poor by the authorities. Current period wealth is also included as a control variable within this vector. An additional complication with this specification is the need to control for current period income of households, which is
11
collinear with the sources of income and with the other control variables. If we assume that the generation of income is a dynamic process, in that past values will determine future values, the
lag of income and the lag of other time varying household characteristics (included in 1itX)
should serve as adequate controls. The model includes household fixed effects, iα , and time
dummies, tτ ; ite is the statistical noise term. Summary statistics for each of the variables
included in the analysis are presented in Table A3 in the Appendix.
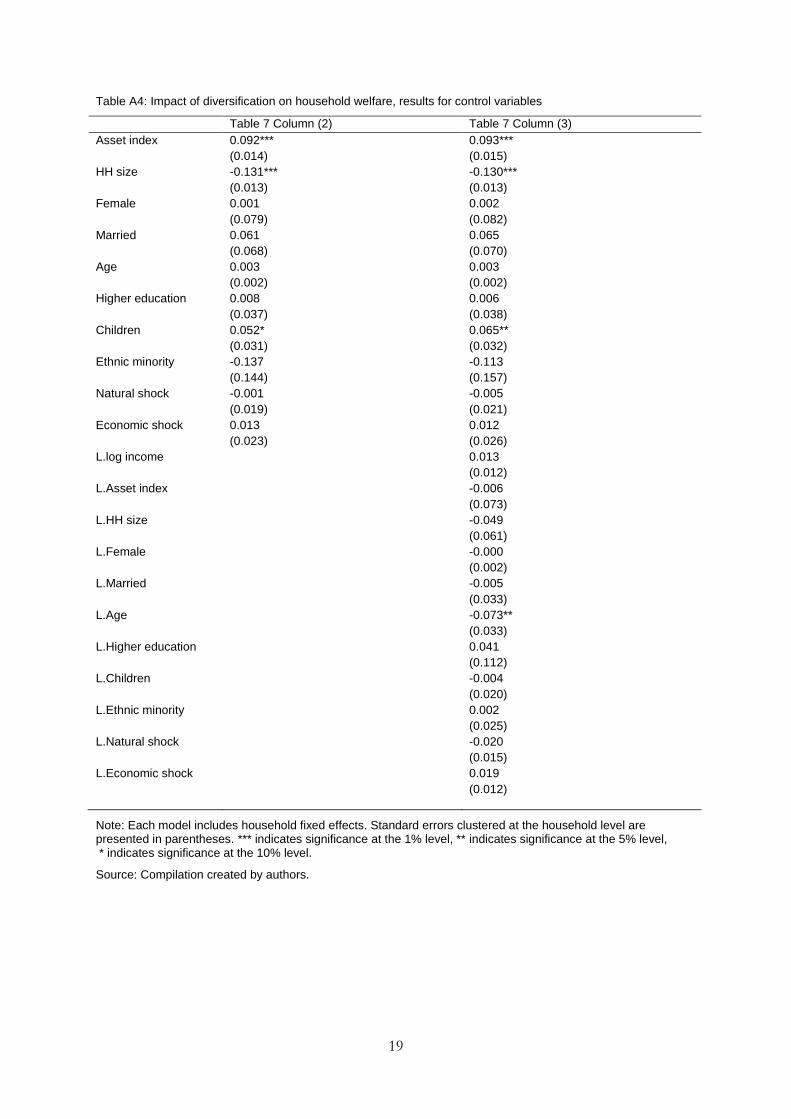
The results for the key variables of interest are presented in Table 7.2 Table A4 of the Appendix details the full set of results for all of the explanatory variables. The dependent variable is the log of real consumption per capita. Making the per capita adjustment is particularly important in this model given that diversification and food consumption will be related to the size of the household. We also include household size to control for the fact that there may be economies of scale associated with food consumption in larger households. A log transformation is used to reduce the impact of outliers and for ease of interpretation of the parameter estimates.
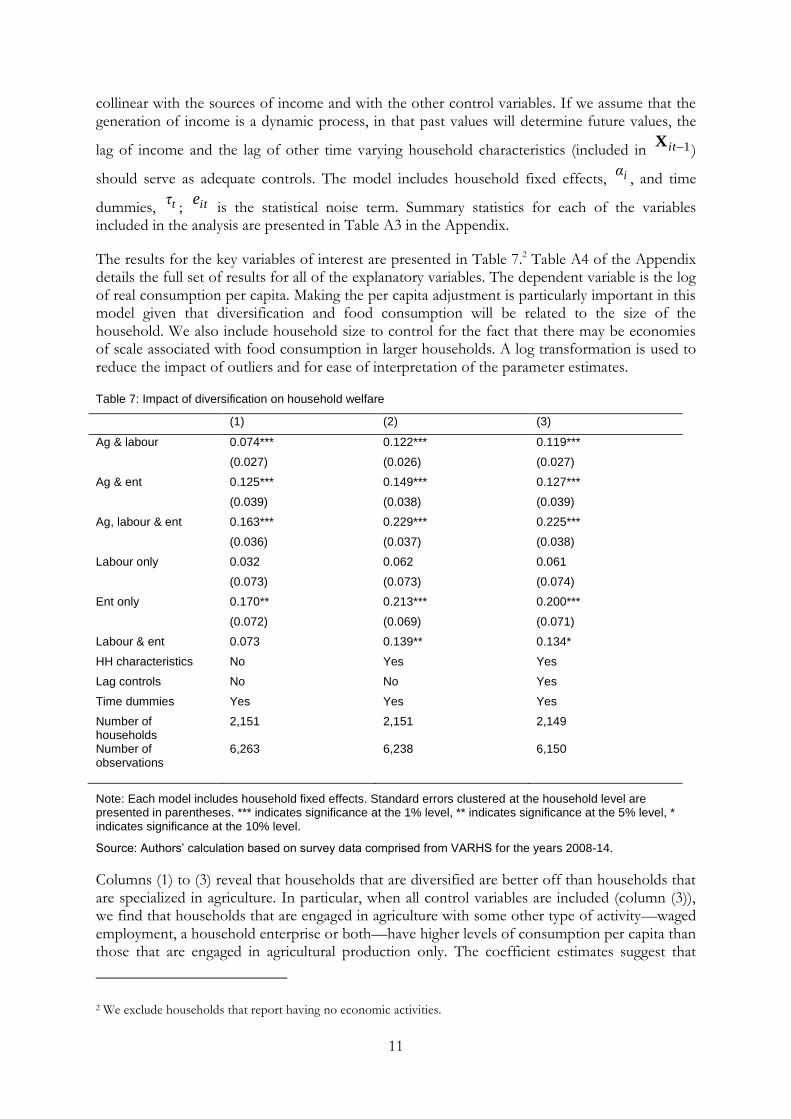
Table 7: Impact of diversification on household welfare
(1) (2) (3)
Ag & labour 0.074*** 0.122*** 0.119***
(0.027) (0.026) (0.027)
Ag & ent 0.125*** 0.149*** 0.127***
(0.039) (0.038) (0.039)
Ag, labour & ent 0.163*** 0.229*** 0.225***
(0.036) (0.037) (0.038)
Labour only 0.032 0.062 0.061
(0.073) (0.073) (0.074)
Ent only 0.170** 0.213*** 0.200***
(0.072) (0.069) (0.071)
Labour & ent 0.073 0.139** 0.134*
HH characteristics No Yes Yes
Lag controls No No Yes
Time dummies Yes Yes Yes
Number of households
2,151 2,151 2,149
Number of observations
6,263 6,238 6,150
Note: Each model includes household fixed effects. Standard errors clustered at the household level are presented in parentheses. *** indicates significance at the 1% level, ** indicates significance at the 5% level, * indicates significance at the 10% level.
Source: Authors’ calculation based on survey data comprised from VARHS for the years 2008-14.
Columns (1) to (3) reveal that households that are diversified are better off than households that are specialized in agriculture. In particular, when all control variables are included (column (3)), we find that households that are engaged in agriculture with some other type of activity—waged employment, a household enterprise or both—have higher levels of consumption per capita than those that are engaged in agricultural production only. The coefficient estimates suggest that
2 We exclude households that report having no economic activities.
12
compared with households that are fully specialized in agricultural production, the fully diversified households do the best with consumption levels per capita that are 22 per cent higher than households specialized in agriculture, followed by households that are engaged in agriculture and enterprise activities with consumption levels per capita that are almost 13 per cent higher, while households engaged in agriculture and waged employment have consumption levels per capita that are almost 12 per cent higher.
Households with an enterprise are also better off in welfare terms than households that are specialized in agriculture. Households that concentrate solely on household enterprise activities have consumption levels per capita that are almost 20 per cent higher than those that are specialized in agriculture. Households with an enterprise and waged employment also have higher consumption levels but this difference is only marginally statistically significant.
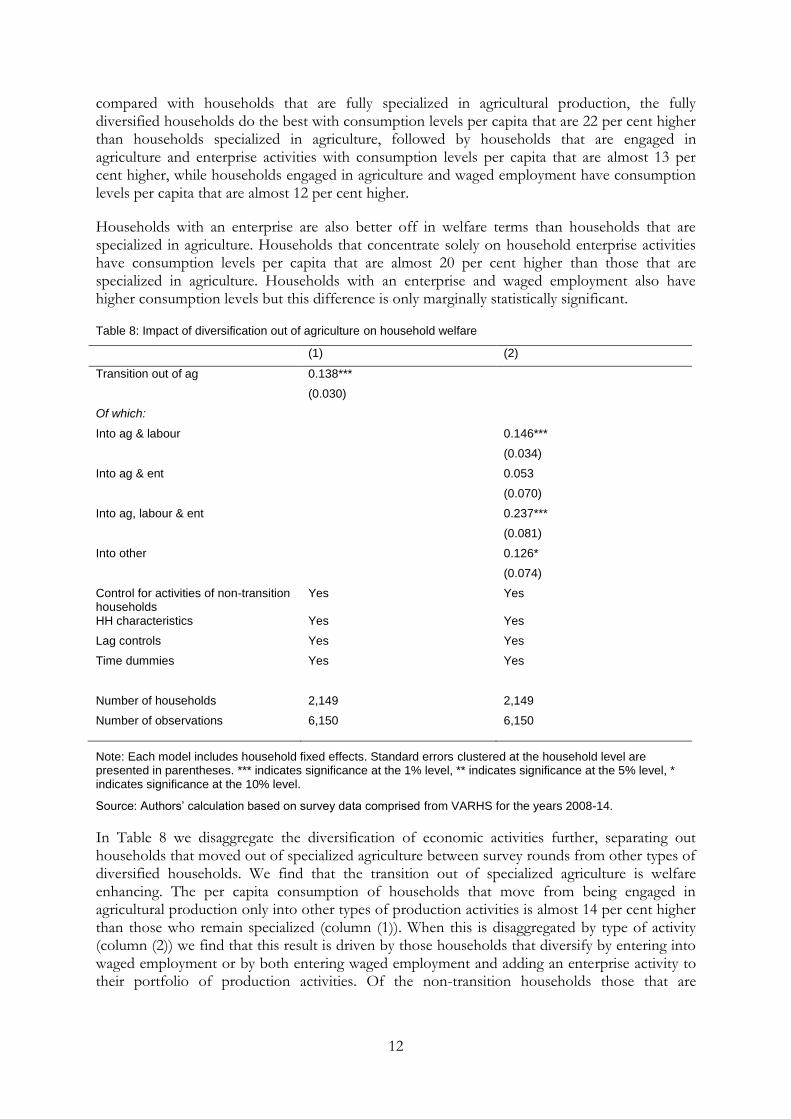
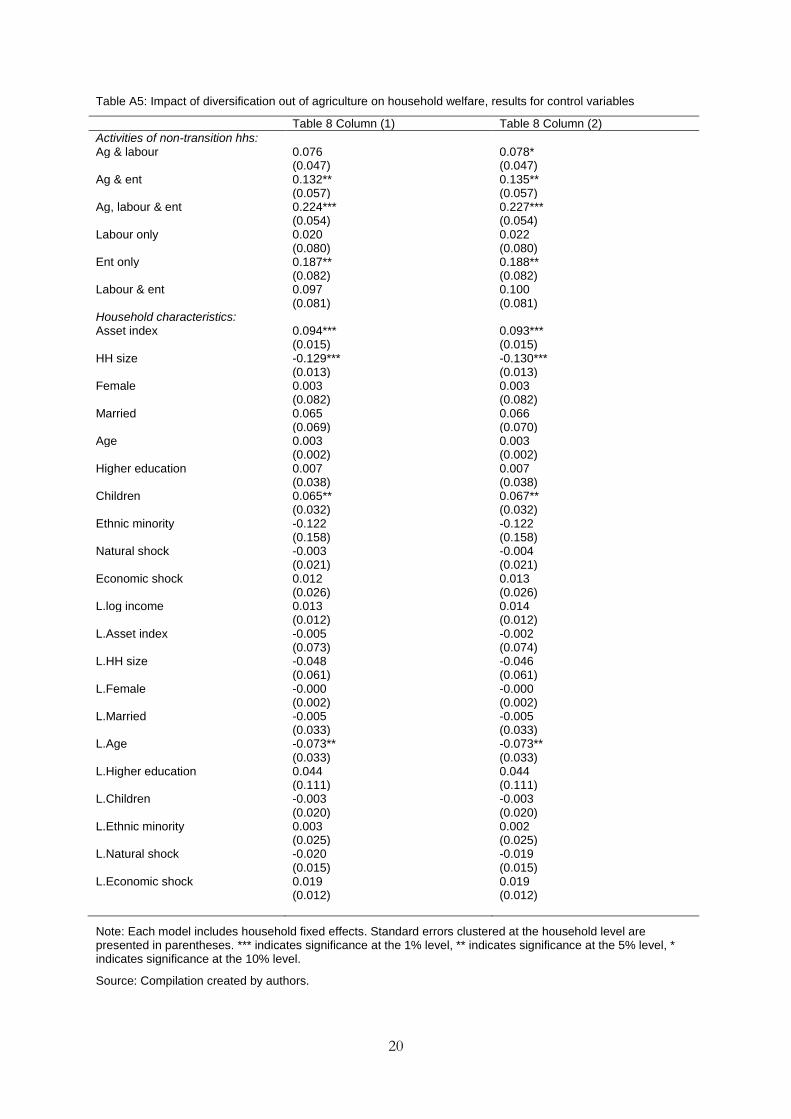
Table 8: Impact of diversification out of agriculture on household welfare
(1) (2)
Transition out of ag 0.138***
(0.030)
Of which:
Into ag & labour 0.146***
(0.034)
Into ag & ent 0.053
(0.070)
Into ag, labour & ent 0.237***
(0.081)
Into other 0.126*
(0.074)
Control for activities of non-transition households
Yes Yes
HH characteristics Yes Yes
Lag controls Yes Yes
Time dummies Yes Yes
Number of households 2,149 2,149
Number of observations 6,150 6,150
Note: Each model includes household fixed effects. Standard errors clustered at the household level are presented in parentheses. *** indicates significance at the 1% level, ** indicates significance at the 5% level, * indicates significance at the 10% level.
Source: Authors’ calculation based on survey data comprised from VARHS for the years 2008-14.
In Table 8 we disaggregate the diversification of economic activities further, separating out households that moved out of specialized agriculture between survey rounds from other types of diversified households. We find that the transition out of specialized agriculture is welfare enhancing. The per capita consumption of households that move from being engaged in agricultural production only into other types of production activities is almost 14 per cent higher than those who remain specialized (column (1)). When this is disaggregated by type of activity (column (2)) we find that this result is driven by those households that diversify by entering into waged employment or by both entering waged employment and adding an enterprise activity to their portfolio of production activities. Of the non-transition households those that are

13
diversified also perform better, particularly those that are involved in both labour and enterprise activities.
We now turn our attention to exploring the characteristics of households that transition out of agriculture. The dependent variable in this analysis takes a value of one if a household moved from specialized agricultural production to some other combination of economic activities and zero otherwise. As explanatory factors, we include the full set of time varying household characteristics, but at a lag so that we are considering the impact of past values of each characteristic on the decision to transition out of agriculture. A drawback of using a household fixed effects approach in this case is that it factors out all time invariant household characteristics, observed and unobserved. It is in fact many of the time invariant characteristics, such as the ethnicity or gender of the household head, that are of most interest in determining what characteristics impact on the decision to diversify. As such, we estimate the model using a random effects estimator but control for time invariant characteristics by including the household specific means of the time varying characteristics (the so-called Chamberlain-Mundlak adjustment).
The results are presented in Table 9. Column (1) reveals that higher income households are less likely to transition out of agriculture. This suggests that diversification in the Vietnamese case is not driven by higher income levels. All types of income shocks (natural and economic) are positively related to the probability of transitioning out of specialized agriculture. This suggests that diversification into other activities might be a mechanism that households use to cope with shocks that affect agricultural production (see Wainwright et al. (2012) for a full analysis of the role of diversification in helping households to manage risks using the VARHS data). We do not find any evidence that the wealth of the household is a determining factor. The key motivation appears to be income related (lower incomes) and income shocks (losses to income).
There is no evidence that the characteristics of the household head are important in determining the transition out of agriculture with the exception of ethnicity. We find that even when income differences are controlled for, ethnic minority households are more likely to transition out of agriculture. The proportion of ethnic minorities involved in specialized agriculture fell from around one-half in 2008 to only one-quarter in 2014. It should be noted that a greater proportion of ethnic minorities remain in specialized agriculture in 2014 compared with Kinh households.
14
Table 9: Determinants of the transition out of agriculture
(1) Transitioned out of ag
(2) Diversified into labour & ag
(3) Diversified into enterprise & ag
(4) Diversified into labour, enterprise & ag
(4) Diversified into other activities (no ag)
Lag log(income) -0.029*** -0.025 0.004 -0.039*** 0.055***
(0.008) (0.017) (0.019) (0.015) (0.020)
Lag asset index 0.001 0.007 -0.008 -0.001 0.004
(0.007) (0.016) (0.016) (0.013) (0.018)
Lag HH size -0.021*** -0.035*** 0.002 -0.017 0.052***
(0.006) (0.013) (0.013) (0.012) (0.015)
Lag femalea -0.005 0.068 0.002 -0.048 -0.071
(0.018) (0.053) (0.046) (0.037) (0.053)
Lag marrieda -0.007 0.029 -0.009 -0.039 -0.060
(0.019) (0.051) (0.040) (0.035) (0.056)
Lag agea 0.001 -0.002 0.000 -0.001* 0.002*
(0.001) (0.001) (0.001) (0.001) (0.001)
Lag higher eda 0.012 -0.006 0.007 0.021 0.032
(0.014) (0.040) (0.026) (0.025) (0.039)
Lag children -0.009 0.020 0.018 -0.005 -0.012
(0.018) (0.034) (0.028) (0.036) (0.046)
Lag ethnic minority 0.151*** -0.022 0.038 -0.024 0.026
(0.019) (0.045) (0.026) (0.022) (0.036)
Natural shock 0.028*** 0.001 -0.023 0.015 -0.001
(0.010) (0.025) (0.018) (0.018) (0.024)
Economic shock 0.027** 0.004 0.031 -0.049*** 0.020
(0.011) (0.026) (0.024) (0.018) (0.030)
Time dummies Yes Yes Yes Yes Yes
Household specific means
Yes Yes Yes Yes Yes
Number of households
2,150 630 630 630 630
Number of observations
6,174 1,098 1,098 1,098 1,098
Notes: aRefers to characteristic of the head of household. Each model is estimated using a random effects
estimator. Standard errors clustered at the household level are presented in parentheses. *** indicates significance at the 1% level, ** indicates significance at the 5% level, * indicates significance at the 10% level.
Source: Authors’ calculation based on survey data comprised from VARHS for the years 2008-14.
Before exploring the pattern of diversification further, we consider briefly the characteristics of the households who remain specialized in agriculture. Performing a similar analysis to that presented in Table 9, we find that older households and ethnic minorities are significantly more likely to remain specialized (results not shown). This implies, as suggested above, that while ethnic minority households are more likely to transition out of agriculture they are still more likely than Kinh households to remain specialized. We also find that households that remain specialized are less likely to suffer from natural and economic shocks, providing further evidence that diversification appears to be a push factor for vulnerable households. There is no evidence to suggest that remaining specialized is associated with income, wealth, or other household characteristics.
15
To explore this further we consider whether there are certain household characteristics associated with moving from agriculture into different types of activities. Conditioning on households that transition out of agriculture, we explore the factors that determine diversification into labour (column (2)), household enterprises (column (3)), and labour with a household enterprise (column (4)). In each of these cases some agricultural activities are kept on by the households. In column (5) we consider the factors that determine the full transition out of agriculture into other activities.
The main driving factors behind which activities households that transition engage in, are income related. Lower income households are more likely to transition into waged employment, while income does not appear to be a factor in making the transition to a household enterprise. Higher income households are more likely to make the full transition out of agriculture into other activities. Overall, it is clear that the income levels of households is the main determinant of the transition from specialized agriculture and the types of activities that households transition into.
5 Conclusions
In this paper we documented the extent to which structural transformation is observed at the microeconomic level through household-level income diversification. The VARHS data confirm the macroeconomic story. We observe a significant shift in the allocation of labour from agriculture towards operating a household enterprise and engaging in waged labour outside the home.
We find that diversified households have higher per capita consumption measures than non-diversified households do. In particular, households with an enterprise tend to have higher welfare (by about 20 per cent). We also examined the welfare impact of the transition out of agriculture. Controlling for household characteristics, initial income and wealth, we find that households that moved from specialized agriculture between 2008 and 2014 experienced welfare gains of the order of 13 per cent. Those that transitioned into waged labour experienced gains of around 15 per cent, while those that transitioned into both waged labour and a household enterprise experienced gains of around 23 per cent.
In the final part of our analysis we explore what factors drive the decision of households to transition out of agriculture. We find that the decision is primarily income related. Low-income households are more likely to make the transition as are households that have experienced income shocks. Also of note is the fact that ethnic minority households are much more likely to transition out of specialized agriculture. Only the richest households, however, completely abandon agricultural production.
While agriculture remains the main source of income and employment for the vast majority of rural Vietnamese, our results strongly confirm that diversification is happening on a large scale in Viet Nam. This process will continue and is likely to accelerate. Our core finding is that diversification has been, on average, welfare improving. While the most beneficial form of diversification is into a household enterprise, there are many other factors that determine the success or otherwise of entrepreneurial activities in rural settings (Kinghan and Newman 2015). These include access to finance, education, market access, and others. Future research is needed to understand the relative importance of these factors in cultivating enterprises. Diversification into waged employment is also an important source of welfare gain in our analysis, leading to welfare improvements of around 15 per cent. As such, close attention should be paid to job creation, particularly in rural areas, for those leaving agricultural production.
16
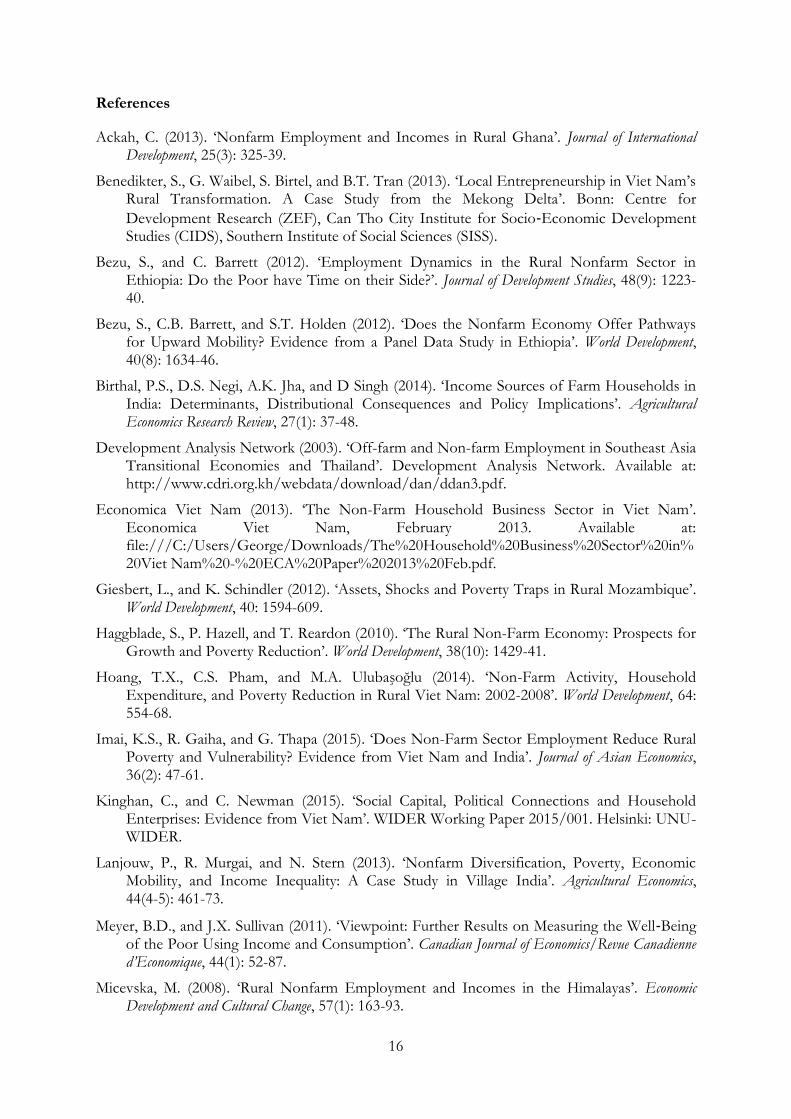
References
Ackah, C. (2013). ‘Nonfarm Employment and Incomes in Rural Ghana’. Journal of International Development, 25(3): 325-39.
Benedikter, S., G. Waibel, S. Birtel, and B.T. Tran (2013). ‘Local Entrepreneurship in Viet Nam’s Rural Transformation. A Case Study from the Mekong Delta’. Bonn: Centre for
Development Research (ZEF), Can Tho City Institute for Socio‐Economic Development Studies (CIDS), Southern Institute of Social Sciences (SISS).
Bezu, S., and C. Barrett (2012). ‘Employment Dynamics in the Rural Nonfarm Sector in Ethiopia: Do the Poor have Time on their Side?’. Journal of Development Studies, 48(9): 1223-40.
Bezu, S., C.B. Barrett, and S.T. Holden (2012). ‘Does the Nonfarm Economy Offer Pathways for Upward Mobility? Evidence from a Panel Data Study in Ethiopia’. World Development, 40(8): 1634-46.
Birthal, P.S., D.S. Negi, A.K. Jha, and D Singh (2014). ‘Income Sources of Farm Households in India: Determinants, Distributional Consequences and Policy Implications’. Agricultural Economics Research Review, 27(1): 37-48.
Development Analysis Network (2003). ‘Off-farm and Non-farm Employment in Southeast Asia Transitional Economies and Thailand’. Development Analysis Network. Available at: http://www.cdri.org.kh/webdata/download/dan/ddan3.pdf.
Economica Viet Nam (2013). ‘The Non-Farm Household Business Sector in Viet Nam’. Economica Viet Nam, February 2013. Available at: file:///C:/Users/George/Downloads/The%20Household%20Business%20Sector%20in%20Viet Nam%20-%20ECA%20Paper%202013%20Feb.pdf.
Giesbert, L., and K. Schindler (2012). ‘Assets, Shocks and Poverty Traps in Rural Mozambique’. World Development, 40: 1594-609.
Haggblade, S., P. Hazell, and T. Reardon (2010). ‘The Rural Non-Farm Economy: Prospects for Growth and Poverty Reduction’. World Development, 38(10): 1429-41.
Hoang, T.X., C.S. Pham, and M.A. Ulubaşoğlu (2014). ‘Non-Farm Activity, Household Expenditure, and Poverty Reduction in Rural Viet Nam: 2002-2008’. World Development, 64: 554-68.
Imai, K.S., R. Gaiha, and G. Thapa (2015). ‘Does Non-Farm Sector Employment Reduce Rural Poverty and Vulnerability? Evidence from Viet Nam and India’. Journal of Asian Economics, 36(2): 47-61.
Kinghan, C., and C. Newman (2015). ‘Social Capital, Political Connections and Household Enterprises: Evidence from Viet Nam’. WIDER Working Paper 2015/001. Helsinki: UNU-WIDER.
Lanjouw, P., R. Murgai, and N. Stern (2013). ‘Nonfarm Diversification, Poverty, Economic Mobility, and Income Inequality: A Case Study in Village India’. Agricultural Economics, 44(4-5): 461-73.
Meyer, B.D., and J.X. Sullivan (2011). ‘Viewpoint: Further Results on Measuring the Well‐Being of the Poor Using Income and Consumption’. Canadian Journal of Economics/Revue Canadienne d’Economique, 44(1): 52-87.
Micevska, M. (2008). ‘Rural Nonfarm Employment and Incomes in the Himalayas’. Economic Development and Cultural Change, 57(1): 163-93.
17
Olugbire, O.O., A.O. Falusi, A.I. Adeoti, and A.S. Oyekale (2012). ‘Determinants of Non-Farm Income Diversification among Rural Households in Nigeria’. Journal of American Science, 8(1): 77-82.
Oostendorp, R.H., T.Q. Trung, and N.T. Tung (2009). ‘The Changing Role of Non-Farm Household Enterprises in Viet Nam’. World Development, 37(3): 632-44.
Porter, C. (2012). ‘Shocks, Consumption and Income Diversification in Rural Ethiopia’. Journal of Development Studies, 48(9): 1209-22.
Wainwright, F., F. Tarp, and C. Newman (2012). ‘Risk and Household Investment Decisions: Evidence from Rural Viet Nam’. Presented to the European Economics Association Conference. Malaga, Spain.
Appendix
Table A1: List of industry sectors of enterprise operation
Industry Freq %
Agriculture, forestry & aquaculture 179 7.8
Mining & quarrying 9 0.39
Processing & manufacturing 723 31.49
Water & waste management 20 0.87
Construction & engineering 33 1.44
Wholesale & retail trade 638 27.79
Transport & storage 93 4.05
Accommodation & food services 207 9.02
Information & communication 7 0.3
Financial, banking, insurance & real estate 5 0.22
Professional, scientific & technical 38 1.66
Admin & support services 21 0.91
Education & training 2 0.09
Health care 13 0.57
Arts, entertainment & recreation 94 4.09
Other service activities 214 9.32
Total 2,296 100
Source: Compilation created by authors.

18
Table A2: List of industry sectors of external employment
Industry Freq %
Agriculture, forestry & aquaculture 915 17.23
Mining & quarrying 52 0.98
Processing & manufacturing 998 18.79
Water & waste management 11 0.21
Construction & engineering 1,274 23.98
Wholesale & retail trade 127 2.39
Transport & storage 162 3.05
Accommodation & food services 123 2.32
Information & communication 40 0.75
Financial, banking, insurance & real estate 35 0.66
Professional, scientific & technical 75 1.41
Admin & support services 84 1.58
Education & training 290 5.46
Political organizations 484 9.11
Health care 132 2.48
Arts entertainment & recreation 38 0.72
Other service activities 472 8.89
Total 5,312 100
Source: Compilation created by authors.
Table A3: Summary statistics
2008 2010 2012 2014
Mean Std Dev Mean Std Dev Mean Std Dev Mean Std Dev
Log food exp p.c. 5.43 0.89 5.63 0.73 5.90 0.71 5.82 0.69
Log income 10.75 0.87 10.91 0.90 11.05 0.85 11.13 0.87
Asset index 0.04 1.08 0.19 1.09 0.32 1.08 0.35 1.08
HH size 4.56 1.77 4.34 1.73 4.23 1.79 4.14 1.80
Female 0.21 0.41 0.21 0.41 0.22 0.41 0.24 0.43
Married 0.82 0.38 0.82 0.39 0.79 0.41 0.78 0.41
Age 40.24 11.84 41.89 12.46 43.23 13.09 45.62 13.21
Higher education 0.16 0.37 0.19 0.39 0.18 0.39 0.21 0.41
Children 0.49 0.50 0.53 0.50 0.49 0.50 0.47 0.50
Ethnic minority 0.21 0.40 0.20 0.40 0.20 0.40 0.20 0.40
Natural shock 0.43 0.50 0.43 0.49 0.32 0.47 0.24 0.43
Economic shock 0.23 0.42 0.17 0.37 0.19 0.39 0.14 0.34
Source: Compilation created by authors.
19
Table A4: Impact of diversification on household welfare, results for control variables
Table 7 Column (2) Table 7 Column (3)
Asset index 0.092*** 0.093***
(0.014) (0.015)
HH size -0.131*** -0.130***
(0.013) (0.013)
Female 0.001 0.002
(0.079) (0.082)
Married 0.061 0.065
(0.068) (0.070)
Age 0.003 0.003
(0.002) (0.002)
Higher education 0.008 0.006
(0.037) (0.038)
Children 0.052* 0.065**
(0.031) (0.032)
Ethnic minority -0.137 -0.113
(0.144) (0.157)
Natural shock -0.001 -0.005
(0.019) (0.021)
Economic shock 0.013 0.012
(0.023) (0.026)
L.log income 0.013
(0.012)
L.Asset index -0.006
(0.073)
L.HH size -0.049
(0.061)
L.Female -0.000
(0.002)
L.Married -0.005
(0.033)
L.Age -0.073**
(0.033)
L.Higher education 0.041
(0.112)
L.Children -0.004
(0.020)
L.Ethnic minority 0.002
(0.025)
L.Natural shock -0.020
(0.015)
L.Economic shock 0.019
(0.012)
Note: Each model includes household fixed effects. Standard errors clustered at the household level are presented in parentheses. *** indicates significance at the 1% level, ** indicates significance at the 5% level, * indicates significance at the 10% level.
Source: Compilation created by authors.
20
Table A5: Impact of diversification out of agriculture on household welfare, results for control variables
Table 8 Column (1) Table 8 Column (2)
Activities of non-transition hhs: Ag & labour 0.076 0.078* (0.047) (0.047) Ag & ent 0.132** 0.135** (0.057) (0.057) Ag, labour & ent 0.224*** 0.227*** (0.054) (0.054) Labour only 0.020 0.022 (0.080) (0.080) Ent only 0.187** 0.188** (0.082) (0.082) Labour & ent 0.097 0.100 (0.081) (0.081) Household characteristics: Asset index 0.094*** 0.093*** (0.015) (0.015) HH size -0.129*** -0.130*** (0.013) (0.013) Female 0.003 0.003 (0.082) (0.082) Married 0.065 0.066 (0.069) (0.070) Age 0.003 0.003 (0.002) (0.002) Higher education 0.007 0.007 (0.038) (0.038) Children 0.065** 0.067** (0.032) (0.032) Ethnic minority -0.122 -0.122 (0.158) (0.158) Natural shock -0.003 -0.004 (0.021) (0.021) Economic shock 0.012 0.013 (0.026) (0.026) L.log income 0.013 0.014 (0.012) (0.012) L.Asset index -0.005 -0.002 (0.073) (0.074) L.HH size -0.048 -0.046 (0.061) (0.061) L.Female -0.000 -0.000 (0.002) (0.002) L.Married -0.005 -0.005 (0.033) (0.033) L.Age -0.073** -0.073** (0.033) (0.033) L.Higher education 0.044 0.044 (0.111) (0.111) L.Children -0.003 -0.003 (0.020) (0.020) L.Ethnic minority 0.003 0.002 (0.025) (0.025) L.Natural shock -0.020 -0.019 (0.015) (0.015) L.Economic shock 0.019 0.019 (0.012) (0.012)
Note: Each model includes household fixed effects. Standard errors clustered at the household level are presented in parentheses. *** indicates significance at the 1% level, ** indicates significance at the 5% level, * indicates significance at the 10% level.
Source: Compilation created by authors.