Embed Size (px)
Citation preview
World Institute for Development Economics Research wider.unu.edu
WIDER Working Paper 2014/049
Can the context mediate macro-policy outcomes? Contextual differences in the returns to Bolsa Familia in Brazil Nadia von Jacobi* February 2014
*Human Development, Capability and Poverty International Research Centre for LabExpo (IUSS, Pavia) and University of Pavia: [email protected]
This study has been prepared within the UNU-WIDER project ‘New Directions in Development Economics’.
Copyright © UNU-WIDER 2014
ISSN 1798-7237 ISBN 978-92-9230-770-7
Typescript prepared by the author.
UNU-WIDER gratefully acknowledges the financial contributions to the research programme from the governments of Denmark, Finland, Sweden, and the United Kingdom.
The World Institute for Development Economics Research (WIDER) was established by the United Nations University (UNU) as its first research and training centre and started work in Helsinki, Finland in 1985. The Institute undertakes applied research and policy analysis on structural changes affecting the developing and transitional economies, provides a forum for the advocacy of policies leading to robust, equitable and environmentally sustainable growth, and promotes capacity strengthening and training in the field of economic, and social policy-making. Work is carried out by staff researchers and visiting scholars in Helsinki and through networks of collaborating scholars and institutions around the world.
UNU-WIDER, Katajanokanlaituri 6 B, 00160 Helsinki, Finland, wider.unu.edu
The views expressed in this publication are those of the author(s). Publication does not imply endorsement by the Institute or the United Nations University, nor by the programme/project sponsors, of any of the views expressed.
Local institutional and structural (meso) factors can play a role in mediating the returns to a macro-social policy. I focus on the Brazilian cash-transfer-programme Bolsa Familia and check how contextual features influence the returns to transfers. Building on Amartya Sen’s work, I assess the return to the policy in terms of non-monetary achievement indicators in the dimensions of education, health and employment quality. I use the extensive CadÚnico of the Brazilian Ministry for Social Development comprising all beneficiaries of Bolsa Familia, and a meso-level dataset containing information on economic structure, socio-demographic and institutional characteristics of Brazil’s 5565 municipalities in a random coefficients (multilevel) model. First results confirm that a number of contextual factors play a role in increasing the conversion of transfers into human development.
Keywords: conditional cash transfer, meso, institutions, Amartya Sen, conversion factors, Brazil JEL classification: I32, I38, D63, O43 Acknowledgement: I would like to thank UNU-WIDER (Helsinki) for hosting me as PhD
intern and for providing an excellent working environment. Among the entire staff at UNU-WIDER, I would like to specially thank Miguel Niño-Zarazúa for helpful comments, disussions and additional supervision, James Thurlow, Tony Addison, Augustin Fosu and Finn Tarp for
particularly helpful comments and discussions, Lisa Winkler for kind support. Affectionate thanks also go to fellow visiting scholars and students with which I had long discussions and trouble-shooting: Serena Masino, Seife Dendir, Romuald Somlanare Kinda, Maty Konte and Sowmya Dhanaraj. I would further like to thank the Brazilian Ministry for Social Development (MDS) for sharing interest in my research project and for entrusting me with their administrative data. I am highly endebted to Armando Amorim Simões and Luiz Marcelo Videro Vieira Santos for assisting me in the bureaucratic procedures and for extremely relevant hints, discussions and comments. Analyzing the CadÚnico dataset would not have been possible withouth having access to the CCS facility at Tulane University. I would like to thank CIPR and Tulane for remote access. In particular, I am thankful to Ludovico Feoli, Nora Lustig, Claudiney Pereira, Otávio Bartalotti and Sean Higgins for support and precious discussions during my two visiting periods in New Orleans. Special thanks go to Enrica Chiappero-Martinetti, Giovanni Andrea Cornia and Alice Sindzingre for important support and intellectual exchange.
1 INTRODUCTION:MESO-FACTORS AS POLICY MEDIATORS
Meso as Lying between the Policy and the Beneficiaries Develop-ment policy — or social policy in general — attempts to reduce poverty andto alleviate the multidimensional deprivations that disadvantaged people insociety face. Policies designed at the macro/country level that target a mul-titude of individuals or families at the micro level can not ex ante foreseein which subnational realities the policy will obtain the desired results andwhere not. The macro policy incentives and inputs insert within a multi-tude of di↵erent local contexts, in which own mechanisms and dynamics areat play. So while the policy-stimulus may be designed to be unified for allrealities of the country, its interaction with the local context can producediversified results.
In this study, I define the context as a web of interrelatedmeso-conditionswithin which the individual is embedded. The term “meso” is broadlyused in natural sciences and has an intuitive meaning within social sciences,namely to be “in the middle”.1 The context is therefore identified at a levellying between macro and micro phenomena. In my study, the context playsthe role of the mediator between an impulse defined at the macro level (thepolicy) and the result (welfare returns) defined at the micro or individuallevel. In such a framework, the context is necessarily defined and charac-terized at the meso level.2 I identify the context at the municipality level,which is the lowest level of governance in Brazil.
Macro, Meso and Micro Studies Within Development Economics,Stewart (1987[76]) and Addison et al. (1990[1]) have traced the foundationson how meso-factors can deploy a complementary role to macroeconomicpolicies. Stewart focusses on meso policies, which are “concerned with im-proving the impact of a given macro variable on the allocation of resourcesand/or the distribution of income so as better to achieve (macro) priorities”(page 158, parentheses added). The World Bank study by Addison et al.,on the other hand outlines the meso more generally as the “link betweenthe macro economy and the micro economy” and as comprising “markets(both product and factor, formal and informal); and infrastructure, this con-sisting of economic infrastructure (roads, communications, irrigation) andsocial infrastructure (health and education services)” (1990:1[1]).
Both works recognize the importance of local intervention (Stewart) or of
1Mesos is derived from ancient Greek, just as macros and micros, and refers precisely
to “in the middle”.2“Meso” therefore refers to the level of i) analysis at which the context can be located
conceptually and to that of ii) aggregation of data that characterize the context. Sucha level can practically refer to regions, governorates, provinces, municipalities or othersub–national geographical aggregation types.
1
institutional and non-strictly economic factors (Addison et al.) in chanellingthe macro-stimulus to the target population at the micro level. The factorsidentified are deemed to be important in terms of their complementarity tothe macroeconomic policy analyzed.3 With the ambition to further unfoldmechanisms of policy transmission I therefore embrace the logic of thesepioneering works.
The CCT as Macro Social Policy Conditional Cash-Transfer (CCT)programmes have earned extensive attention in the last decade: their appli-cation is wide-ranging throughout di↵erent countries and continents.4 Theyhave increasingly been used in Latin America and the Caribbean in the last15 years. The CCT design has consolidated as one of the preferential tools forpoverty reduction policy. According to CEPAL (Cecchini and Madariaga,2011[14]), 18 countries of the region were applying a CCT programme in2011, benefiting more than 25 million families or approximately 113 millionpeople. The incidence of CCT benefits within the region is thought to reach19% of the total population, at a cost of about 0.4% of regional GDP.
In Brazil, the attention to CCTs has been particularly strong. Extraor-dinarily high inequality levels and persistent poverty despite of a diversifiedeconomy have been a stable component of the country’s national profile.5
CCT programmes are particularly promising for the reduction of inequalitywhen they have wide reach within the targeted poor population: their userepresents a major step forward to link extremely poor segments of societyto a public and more comprehensive social-protection system. In this view,the Brazilian CCT Bolsa Familia (BF) has been introduced to accomplishhigher levels of equality in terms of access to education and health services.It is expected to deploy a major role in breaking chronic poverty where itperpetuates in a cycle of low education, poor health and ecomic fragility.
Research Question: which Contextual Features Lead to Higheror Lower Returns to a CCT Policy? Which contextual factors mat-ter for the conversion of Bolsa Familia transfers into human developmentachievements? The quest to identify relevant meso-factors is tightly linkedto the notion of complementarity: there where local characteristics produce
3Both works concentrate on the macroeconomic policy mix used during structuraladjustment. The major goal of these studies is the deconstruction of the one-fits-allorthodox macroeconomic policy-disourse. Yet in highlighting structural particularitiesthat violate the predominant assumptions of policy-transmission they provide a base formore detailed empirical work.
4Conditional-Cash-Transfer (CCT) programmes are a specific tool of social policy inwhich a transfer component is combined with conditionalities that require the beneficiariesto comply with specific commitments. The type of commitments typically requested inresponse to the transfer aim at increasing the human capacities of the beneficiaries (suchas education or health).
5See for example Barros et. al, 2001[7]; Amorim Simoes, 2012[66].
2
improved conversion of the programme inputs, we face institutional or struc-tural factors that deploy a complementary role to the macro-policy providingthe transfers. Identifying these meso-factors is relevant, as they can serve asbest practices or as bench-marks for other localities in which similar featurescan be found.
To which extent and through which mechanisms the context actuallyplays a role is a research question that touches upon a variety of literatures,including those concentrating on “poverty traps”6 and those focussing oninstitutions and development or more in general, the factor endowmentsliterature.7 These approaches however tend to be either purely micro ormacro: the e↵ort of this study is to bring a group of research questions tothe meso level and to link them with the more general problem of policy-transmission. Despite of few rather general references to a meso level ofanalysis, there is su�cient room for theory and empirical experimentationof relevance and functioning of meso factors for development and povertyalleviation.
2 BACKGROUND: BOLSA FAMILIA AND ON-GOING RESEARCH
Structure and Programme Theory of Bolsa Familia Bolsa Familia isa transfer programme that builds upon and combines previous cash transferexperiences (Bolsa Escola, Bolsa Alimentacao, Cartao Alimentacao, AuxılioGas). The current format of Bolsa Familia resulted from the national scalingup of local experiences.8 The design of the programme distinguishes betweena basic transfer, and a variable transfer component. The basic transfer isguaranteed to the extreme poor, while the variable transfer depends on thedemographic characteristics of the household.9
6Among others, see for example Barrett et. al, 2001[5]; Azariadis and Stachurski,2005[4]; Sachs, 2005[57]; Barrett and Carter, 2006[13]; Bowles et al., 2006[11]; Sindzingre,2007[67]
7See for example Diamond, 1997[20]; Gallup et al, 1999[26]; Sachs et al, 2001[58]; Sachs,2003[56]; Easterly and Levine, 2003[21].
8Starting from circumscribed experiences in Brasilia, Campinas and Riberao Preto in1995, cash transfer programmes spread widely throughout di↵erent governmental levelsin Brazil between 1997 and 1998 (Soares, 2012[74]) until being scaled up to the nationallevel in 2003 when di↵erent programmes that were running in parallel were combined.
9Transfers for the extremely poor entail 70 Reais for anyone living with a per capitaincome of up to 70 Reais. Eligibility criteria are not formally indexed to the inflationrate, but have been adjusted in this sense: extremely poor were identified as those withper capita income below 50 Reais from 2003 to 2006, below 60 Reais from 2006 to 2009and below 70 Reais since 2009 (Osorio and Ferreira de Souza, 2013[44]). The variablecomponent foresees a transfer of 32 Reais for each child below 16 years of age and for eachpregnant or breastfeeding woman. 38 Reais are transferred for children between 16 and17 years old for families with a per capita income above 70 Reais monthly. Values areupdated to April 2013, Ministerio do Desenvolvimento Social e Combate Fome (MDS)
3
One of the reasons why Bolsa Familia has earned so much attention byresearch is its overall size: it is so far one of the largest CCT-programmesin the world, with a distribution of approximately 7.6 billion US dollars peryear to approximately 13.8 million households which implies approximately45 million people or 24% of the entire Brazilian population.10 A secondnoteworthy characteristic of the programme is its relatively low incidenceon overall GDP – about 0.5% (The Economist, 2010[33]).
The Role of Bolsa Familia in Altering the Brazilian Poverty and In-equality Landscape Depending on the methodology and the time frameused, di↵erent studies find that Bolsa Familia accounts for 12% to 31% ofthe recent decrease in the Gini index (Soares, 2012[74], reviewing existingliterature). The neat targeting guarantees that Bolsa Familia has had a pro-gressive e↵ect on income distribution ever since its launch and afterwards.Findings are mixed regarding the increase or decrease of progressivity afterlater expansions.11 In terms of impact on poverty, Bolsa Familia is under-stood to have significantly reduced intensity and severity of poverty, whilethe small size of its transfers seems not to be enough to e↵ectively lift manybeneficiaries above the poverty line, unless they are already quite close toit. Therefore, headcount indexes of poverty do not display great changesbetween 1999 and 2009 (only 8% improvement) while the poverty gap index(PGI) improved by 18% and the squared poverty gap index (SPG) by 22%(Soares, 2012[74]).12
In terms of non-monetary dimensions of well-being, evidence seems to bemixed. Most studies find positive e↵ects on enrolment, a decrease in drop-out rates and in child labour (Glewwe and Kassour, 2010[27]; Ferro et al.[24];Silveira Neto, 2010[41]; Chitolina et al., 2012[17]), in line with internationalevidence of CCT-programme e↵ects (Saavedra and Garcia, 2012[55]). Interms of cognitive skills, Santarrosa (2011[60]) finds limited e↵ects: BolsaFamilia seems to increase attendency rates but complementary policies areneeded yet to improve public school quality. Simoes (2012[66]) finds thattransfer size and length of participation in Bolsa Familia have positive e↵ectson school test scores. His analysis confirms however that beneficiaries are
www.mds.gov.br/bolsafamilia/beneficios10Values of beneficiariey families are updated to May, 2013 (MDS). Other estimates are
derived by the author.11Ferreira de Souza (2012[75]) finds that the Bolsa Familia became more progressive
through time while Soares, 2009[72]; 2012[74] detects that the incidence coe�cient slightlydecreases (from �59, 8 to �50, 1 in the second expansion of 2006 that enlarged the reachto 11.2 million beneficiaries.
12Impacts of Bolsa Familia on the Headcount Ratio are thought to increase much morenow with the introduction of Brazil Carinhoso (PBC) as families get the amount of moneythat separates them from the extreme poverty line. This also implies that some peopleshould get less through this mechanism, namely those that were already rather close tothe extreme poverty line (see Osorio and De Souza, 2013[44] for details).
4
still mostly attending lower quality schools.For health outcomes, results tend to be positive: Reis (2010[50]) for
example finds positive associations between receiving cash transfer and childhealth indicators. Still, the literature seems to show that Bolsa Familia alonecan not achieve significant health and nutritional outcomes, but that supply-side improvements in health care are necessary complements (Soares et al.,2010[69]; Rasella et al., 2013[47]).
With regards to employment, studies have mainly focussed on the ef-fect of transfers on work supply. They try to assess, whether the transferof cash is associated to reduced labour market participation. Results aremixed: some find no e↵ect on labour market participation among adults,apart from a marginal decrease in the number of hours worked (Teixeira,2010[79]). Others report a positive e↵ect on the employment probability ofthe mother (Chitolina et al., 2012[17]) or of both, mother and father (Ferroet al., 2010[24]; Machado et al., 2011[38]). Heterogeneous responses seem tobe likely for diverse employment status of workers, and level of the transferreceived (Teixeira, 2010[79]). Machado et al. (2011[38]) find positive e↵ectson employment quality through a reduction in informality and increasedearning levels.
Going Beyond the Existing Literature Despite of a rather positive,general analysis of the impacts of Bolsa Familia on poverty and inequality13
some research has pointed out how Bolsa Familia tends to have an urbanbias (Fiszbein and Schady, 2009[25]; Higgins, 2012[31]) or how other fiscaldispositions of Brazil outweigh the overall inequality-reducing e↵ect of itsCCT (see Silveira, 2008; Higgins and Pereira, 2013[32]).
• What most of the studies focusing on the impact of Bolsa Familia havein common is to monitor changes on the hand of monetary measures(income, GDP growth rates).14 In my study, I propose the use ofnon-monetary indicators, in particular a group of composite measuresthat take into account individual achievements in the dimensions ofeducation, employment and health.
13For an overview of the Bolsa Familia programme, see Amorim Simoes (2012[66]),Soares (2012[74]) or Videro Vieira Santos (2010[81]). For studies that point out the role ofBolsa Familia in reducing historically choronic inequality and poverty in Brazil see amongothers Ferreira, Leite and Litchfield, 2006[23]; Kakwani, Neri and Son, 2006[35]; Soares etal. 2006[70]; Barros, Carvalho and Franco, 2007[8]; Oliveira et al., 2007[43]; Osorio et al.,2007[73]; Resende and Oliveira, 2008[51]; Haddad, 2008[29]; Tavares, 2008[78]; Helfand,Rocha and Vinhais, 2009[30]; Soares and Satyro, 2009[71]; Videro Vieira Santos, 2010[81];Birdsall, Lustig and McLeod, 2011[10]; Lignani et al. 2011; Ferreira de Souza, 2012[75];Higgins, 2012[31].
14Exceptions are governmental reports as the AIBF — Avaliacao de Impacto do pro-grama Bolsa Familia — which focus on health and education specific indicators that derivefrom the conditionalities of the programme.
5
• Apart from the distinction between rural and urban areas, I propose toconsider other characteristics that might make the local context moreor less conducive to greater returns to the Bolsa Familia transfers.
• Typically, studies use the Pesquisa Nacional por Amostra de Domicılios(PNAD) or the Pesquisa de Orcamentos Familiares (POF) for theirdata analysis.15 Both surveys share a sampling structure that is rec-ognized to under-represent agglomerates with less than 100 000 inhab-itants. As my study intends to focus on sub-national di↵erences, andat a rather disaggregated level, I use the full record of beneficiaries— the CadUnico — which allows to include all types of contexts ofBrazil.16
• Unlike the Mexican Progresa/Oportunidades experience, in which thephasing in has allowed to use randomized control trials for the studyof its impact, Bolsa Familia has tried to have a universal reach fromits start. The study of impacts of Bolsa Familia usually lacks a reliablecontrol group and further often has to rely on (a) coarse measures ofthe monetary input (PNAD) (b) lack of repeated and comparable data(POF, AIBF). My analysis does not consider any control group butinstead focusses on di↵erences within the population of beneficiaries: Itry to identify the role that contextual factors play in explaining them.
3 MUNICIPALITIES AND BOLSA FAMILIA
The role of municipalities for Bolsa Familia is crucial, first of all becausethe design of the Brazilian CCT has emerged from municipal experimenta-tion and activism (Lindert et al., 2007[37]; Sugiyama, 2012[77]; Barrientos,2013[6]). Secondly, the implementation of the programme depends on mu-
15Both datasets have received much credit from the international research communitybut present some drawbacks for analyzing the impact of Bolsa Familia: in PNAD, apartfrom the 2001, 2004 and 2006 CCT supplements to the survey, there is no specific variableon the amount of benefits received by the family. Most studies recur to the decompositionof the more general voice “other income” of the income source variable, which also includesdividends from stocks, interest payments and old-age non contributory benefits. For someexemplary studies using PNAD data to analyze impacts of Bolsa Familia on inequalityand poverty see IPEA, 2006; Kakwani, Neri and Son, 2006; Higgins, 2012[31]. POF on theother hand has a dedicated variable but is collected only every five years.
16Soares, Medeiros and Osorio (IPR-UNDP, 2006) outline the di↵erences between PNADand administrative records of the CadUnico, showing that due to the complex samplestructure of the PNAD, it cannot capture phenomena well that are very concentrated in aspecific geographic area. They confirm that absolute values of the administrative recordscannot be reproduced using PNAD data, while the household survey is able to replicatedistribution of beneficiaries and their characteristics in relative terms (but only for a veryaggregated geographical subdivision of the country, namely the five macro-regions).
6
nicipal commitment and e�ciency.17
Within the literature, studies that consider subregional levels in theiranalysis have mostly focussed on urban-rural di↵erences in the impacts ofBolsa Familia (see e.g. Higgins, 2012[31]; de Brauw et al., 2013[12]). Thosethat consider the municipality level have so far concentrated on their e�-ciency in implementing Bolsa Familia (de Janvry et al., 2006[19]), on elec-toral behaviour (Barrientos, 2013[6]) or on health care quality (Rasella etal., 2013[47]). The need to better understand which local circumstancesmake the policy a better vehicle for improved living conditions is widelyrecognized, however (among others Rawlings and Rubio, 2005[49]; Lindertet al., 2007[37]; Barrientos, 2013[6]). In what follows, I outline the under-lying hypotheses that I test by including contextual characteristics into myanalysis. The aim is to identify which complementary features measured atthe municipality level can contribute in increasing the conversion of BolsaFamilia inputs into human development achievements.
Di↵erent Abilities in Improving Citizenship If Bolsa Familia hassucceeded in providing more citizenship and opportunities to the vulnerablefamilies in Brazil, this has not only happened through the implicit mech-anisms of (i) securing a minimum income and of (ii) breaking the inter-generational chronic poverty cycle through the accumulation of human cap-ital. Together with the monetary transfer comes an “inauguration of specialrelations between the state and a particular segment of its citizenry, which— intentionally and unintentionally — a↵ect perceptions of rights, respon-sibilities and citizenship” (Roberts, 2012[53]).
For the beneficiaries of Bolsa Familia, this implies being prioritized forother complementary services in their municipality, as foreseen by the pro-gramme (Lindert et al., 2007[37]). Therefore, a first crucial di↵erence interms of outcomes could be due to the extent of implementation of comple-mentary social programmes within the municipality.18 A second di↵erenceamong municipalities may arise from the extent to which the prioritizationof beneficiaries is actually implemented. The translation of the policy inputinto greater achievements can further depend on a series of characteristicsof the context, as follows.
Di↵erences in Institutional Quality Why should institutional qual-ity a↵ect the conversion of Bolsa Familia into human development achieve-
17Among others, see De Janvry et al., 2006[19]; Lindert et al., 2007[37]. For a detailedreview of the role of municipalities in the implementation of Bolsa Familia, see Lindert etal., 2007[37] or Soares, 2012[74].
18Rasella et al.[47] run a cross-sectional analysis on all municipalities and confirm thatthe quality of implementation of complementary health programmes (PSF – programaSaude da Familia or Family Health programme, FHP) plays a role in decreasing childhoodmortality, especially jointly with Bolsa Familia.
7
ments? Institutions provide reasons and resources — or else put — motiva-tions and opportunities: “The varying scopes and modes of institutionaliza-tion a↵ect what collectivities are motivated to do and what they are able todo. (...) Institutions define basic rights and duties, shape or regulate howadvantages, burdens, and life-chances are allocated in society (...)” (Marchand Olsen, 2006:7[39]). One first aspect of institutional quality could there-fore be how redistributive local institutions and their policies are. Therewhere targeting of actions focusses more on vulnerable groups, opportuni-ties are reshu✏ed to the advantage of Bolsa Familia beneficiaries.
A second, crucial aspect is the ability of local institutions to provideopportunities to their citizens. Within the macro-development discourse,this ability has been studied as state e↵ectiveness (among others, see Besleyand Persson, 2011[9]; Pritchett, 2012[45]) or as state capability (e.g. Sarker,2006[61]). State e↵ectiveness is usually considered greater where more directtaxes are being collected, and where legal capacities (separation of powers)are better developed. State capability under the New Public Managementperspective refers to public management elements such as “administrativesystems governing policy-making and budgeting, basic service provision, andeconomic regulation (...)” (Trebilcock and Mota Prado, 2011[80] quotingSarker, 2006). Especially within a decentralized country like Brazil, localdi↵erences in the competence, rigour and e↵ectiveness of local administra-tions can be big.
Di↵erences in Economic Texture Apart from their role in increasinghuman capital investment, conditional cash transfer programmes play animportant role in lifting income levels of beneficiaries. In contexts in whichthe share of poor people is high, the policy can be expected to be similar to apositive liquidity shock.19 The Keynesian multiplier e↵ect would expect thisadditional liquidity inflow to translate into increased demand, investmentand – consequently — employment opportunities.20
For many rural and remote realities, in which the monetarization of theeconomy is limited (for example in the Amazon), the liquidity inflow canbe expected to make a huge di↵erence: “In lagging regions, inflows of socialprotection resources can stimulate local markets and contribute to economicvibrancy” (Addison et al. 2008[2]).
The question that arises naturally is: for which goods or services is themoney spent? Does the liquidity inflow translate into a higher demand forlocal goods? This could imply an increase of local production and — pos-sibly — of jobs. On the other hand, if the additional liquidity is directed
19I am thankful to James Thurlow from UNU-WIDER for very helpful discussions onthis topic.
20As the beneficiaries are very poor, their consumption propensity is supposed to bevery high. Further, the amount transferred is rather low, therefore investments could beminimal.
8
towards goods and services that are produced outside of the own munici-pality, we might not detect any benefits in terms of employment creation orupgrading. The local economic texture is therefore expected to play a rolein the conversion of Bolsa Familia inputs into higher employment quality.
Social Heterogeneity Apart from the quality of formal institutions, theinstitutional literature has often stressed the implicit role that informalnorms play (among many others, see North, 1990[42]). These are recog-nized to influence not only the emergence of institutions, but also their aimsand quality, and further the degree of enforcement that they achieve. Onthe background of informal norms, a series of other social factors must beconsidered, such as tradition, history, geography and cultural anthropology.One of the features that has received attention is the degree of heterogeneitypresent within the society.21 More homogeneous societies are thought to bemore prone to request public goods from their governments.
More homogeneous societies are further expected to succeed in the cre-ation and adaptation of functioning institutions, which require some sort ofconsensus among di↵erent social groups:
The political costs of trying to disturb the status quo are fargreater where the struggle involves many actors with diversepreferences rather than only a few with homogeneous preferences(Rhodes et al., 2006[52]).
My major hypothesis with regards to social heterogeneity is that sub-stantial di↵erences among citizens inhibit their willingness to collectivelydeliberate, and therefore the success in achieving a local consensus. Thisshould have negative implications for the overall institutional quality andthe provision of public goods within the context.22
The Presence of Natural Resources Natural resources are either seenas “curse” for an economy when they trigger a Dutch Disease23 or as better
21Usually, heterogeneity is conceived in ethnic terms. See manifold works using theEthno-linguistic Fractionalization Index, for example by Alesina or La Ferrara.
22The concept of social heterogeneity is not identical to social capital: “Social capitalincludes shared norms and mutual trust, which facilitate coordination and cooperationfor mutual benefit” (Sampson, 2006:136 quoting Putnam, 1993[59]). Social heterogeneityis somehow a preceeding condition for the emergence of social capital in the sense thatthe shared norms and mutual trust implied by social capital arise more easily in contextsthat are less heterogeneous. In addition to some social homogeneity, social capital usuallyfurther requires a “resource stock of neighborhood organizations and the linkages withother organizations, both within and outside the community” (Moreno↵ et al, 2001[40]).
23The expression is used to identify situations in which the export of natural resourcesappreciated the real exchange rate through an increased demand for local currency.
9
starting point for economic development when they introduce advantages inlabour market specialization and subsequent institutional development.24
In Brazil, a sophisticated redistributive system25 compensates munici-palities and states within which petroleum or other mineral resources areextracted. The system is meant to (i) remunerate those territories in whichthe resources are extracted (ii) compensate those territories through whichthe resources are transported (iii) compensate those territories that are closeto production sites and that are socially or environmentally negatively af-fected by the extraction (iv) redistribute part of the national revenues to allmunicipalities, irrespective of whether they are producers or not.
The system is complex and a change to the redistributing mechanism inlight of the discovery of new, substantial, sources of petroleum are underdiscussion. In 2010, the system guaranteed that producing municipalitiesreceived more transfers from the Federal Union than municipalities thatwere only indirectly involved (pass-through). A similar financial mechanismis in place for water and for mineral resources, which allows to identify thosemunicipalities that have greater abundance in any of these natural resources.
The main hypothesis that I test in the empirical part is whether thepresence of natural resources has any positive e↵ect on human developmentoutcomes. A positive e↵ect could be directly linked to a greater amount ofresources available for public spending. On the other hand, the presenceof natural resources can also have indirect e↵ects on development throughan experience factor: municipalities that have to manage the production ofnatural resources (collection of revenues, controls of larger instrastructuralwork, supervision of standards) might benefit from a technical upgradingof their administration, which can also spill-over into other public activi-ties. Natural resources might further a↵ect the labour market through thecreation of jobs, but this e↵ect might be reduced where capital-intensivestrategies are pursued, as typical in the extractive sector.
Spending, Public Goods and Collective Preferences I include somemeasures of spending on social sectors and on public goods into the anal-ysis. They can be regarded a proxy for collective preferences, if we as-sume that democratically elected local governments implement collectivepreferences. Apart from spending levels, which can be proportionally higherwhere deprivations are widespread, I also control for the presence of “cul-
24See for example Engerman and Sokolo↵, 2002[22], who trace the mechanism throughwhich natural resource endowment can influence institutional quality through time.
25The Confederacao Nacional dos Municıpios outlines how the revenues of petroleum aredistributed among producing, distributing and non-producing municipalities. All mineralresources are considered to be property of the Brazilian state, but producing municipalitiesand states are compensated by the Federal Union through special transfers. On average,the Federal Union keeps 39,4% of revenues, and transfers 33,8% back to the producerstates and 26,8% to the producer municipalities. See CNM, 2010:20.
10
tural equipment”, which I identify with structures/facilities that promotethe acquisition of knowledge and information through a generalized accessto it. I interpret information and knowledge as public goods and thereforesee cultural equipment as strategic locations for their distribution.26
4 METHODOLOGY
4.1 Analytical Framing
For measuring human development achievements, I refer to the Capabil-ity Approach as introduced by Amartya Sen (1985[62], 1987[65], 1999[63],2009[64]). His framework identifies progress with the expansion of opportu-nities to choose a way of life the individual “has reason to value”.27 Devel-opment is therefore not what one does, or has, or is but the improvement inwhat one can choose to do, to be or to have. What one ultimately choosesis called a functioning or achievement.28
Sen’s conceptual framework does not only provide guidelines for evalua-tive measures (dependent variables) but can also serve as point of departurefor framing the role of explanatory factors (independent variables). Accord-ing to the framework, there might be resources that are at disposal of theindividual: endowments, which are goods and resources the individual isinitially endowed with.29 Cash-transfers such as Bolsa Familia can be in-terpreted as additional endowments that are being provided to beneficiariesthrough the public policy.
Apart from considering the resources at disposal, Sen stresses the rel-evance of the ability to transform these resources into desired outcomes.In transforming endowments (inputs) into achievements (outputs), a con-version function (technology) is used by the individual. The conversion
26Public goods are redistributive in their nature, as they facilitate the access to oppor-tunities on behalf of poorer segments of the society. Therefore, I expect the presence ofpublic goods and of spending on public goods to be associated to relatively higher levelsof human development among the beneficiaries of Bolsa Familia.
27For an introduction and better understanding of the capability approach, see A. Sen(among others 1985[62], 1987[65], 1999[63], 2009[64]); Comim et al(2008[18]); Robeyns(2003[54]); Kuklys (2005[36]).
28Functionings are “the various things a person may value doing or being” (Sen,1999[63]), which can be specific activities and states of being, such as being healthy,having a secure job, being educated or moving about freely. The notion of capabilities isa derived notion (Kuklys, 2005:10[36]) as it refers to the pool of potential functionings anindividual has access to. Capabilities thereby relate to the notion of substantive freedoms:they refer to the range of life choices an individual can opt from when ultimately choosingthe life she/he wants.
29Sen refers to commodities in earlier work, e.g. 1985[62].
11
Endowments*(goods*and*resources)*
Individual*
Contextual*
Conversion**Factors*
*
Capability*Set*of**
Func>onings**
CHOICE* Achieved*Func>onings*
*
Individual;*Family*
Contextual*
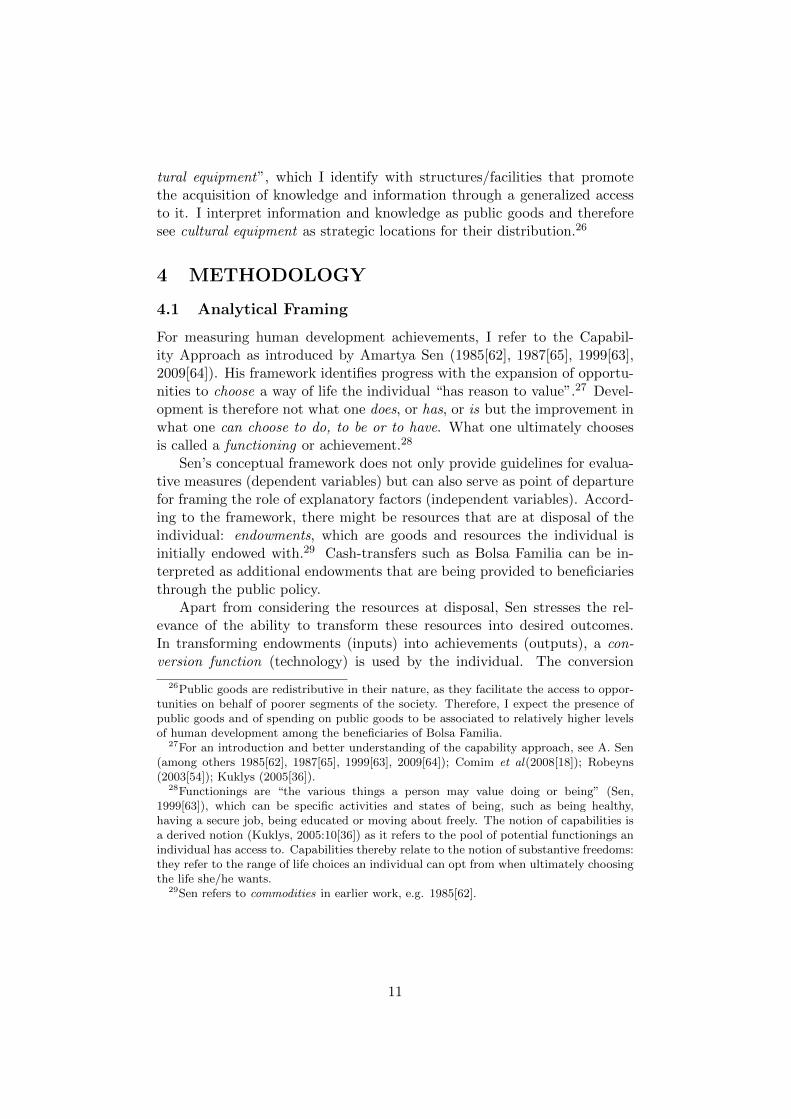
Figure 1: The Capability framework. Source: Author’s elaboration.
function is an element of the capability function:30
Qi(Xi) = {bi | bi = fi(c(xi) | zi, zs, ze)} (1)
where Qi(Xi) is the capability set, defined over the potential functioningsbi that result from the endowments xi and the conversion function fi whichtransforms the endowments into potential functionings and is constrainedby conversion factors such as zi, zs, ze. The subscripts i,s ,e of the conversionfactors stand for — respectively — individual, environmental and socialcharacteristics.31
Within the conversion function, therefore, a number of characteristics(conversion factors) combine to jointly determine the degree of “e�ciency”(conversion rate) with which resources are converted into achievements. Theconversion factors “act as technical constraints and determine the conver-sion rate” (Chiappero–Martinetti and Salardi, 2008:7[16]) of the single in-dividual.
The common understanding behind conversion factors can be syntheti-cally summarized as follows: it is not su�cient to just consider the resourcesan individual is endowed with. It is also to which extent the individual canmake use of these endowments to achieve personal satisfaction and humandevelopment, that matters. The framework is synthesized in figure 1. In theanalysis that follows, I focus on the influence that contextual factors haveon the conversion rates of Bolsa Familia beneficiaries.
30The capability set can be interpreted as the “individual space of potential function-ings” (Sen, 1985:11[62]; Chiappero–Martinetti and Salardi, 2008:5[16]).
31All authors treating the conversion function specify that the model should not implya unique mechanism of conversion for all individuals, but that the individual conversionfunction fi 2 F , where F is the set of all possible conversion functions. For detailed treat-ment of the conversion function see Sen (1985:11[62]), Kuklys (2005:11[36]), Chiappero–Martinetti and Salardi (2008:5[16]).
12
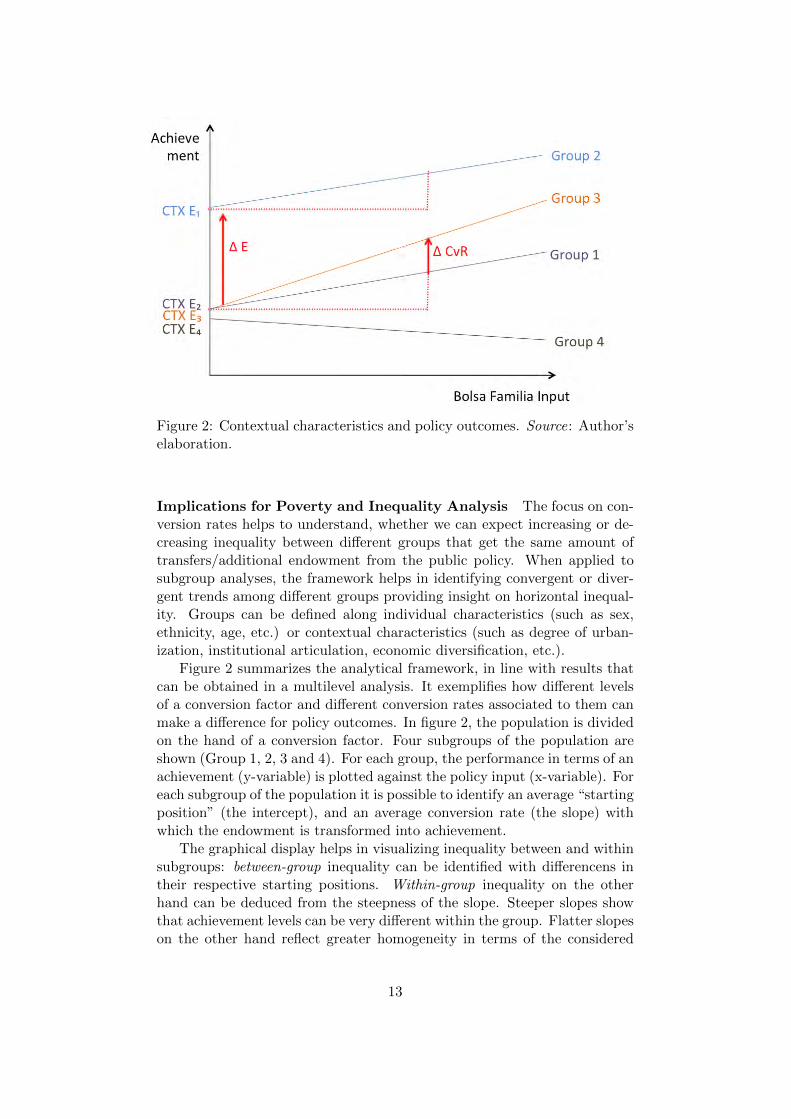
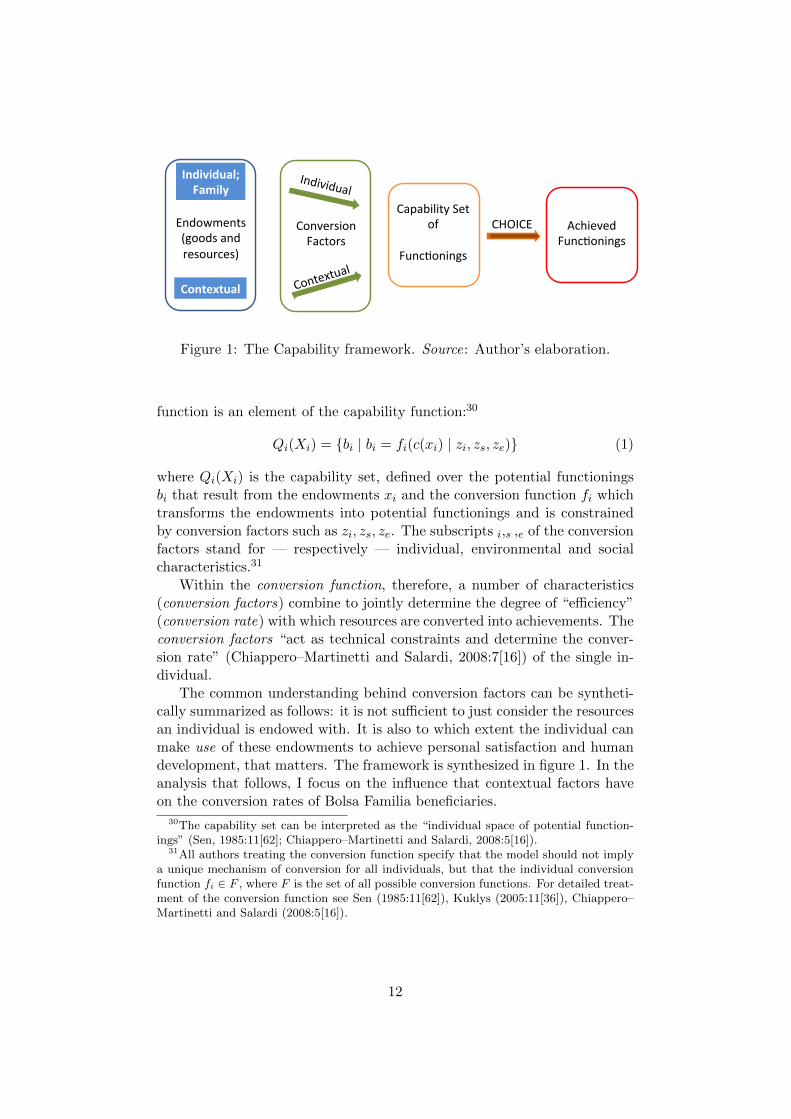
Figure 2: Contextual characteristics and policy outcomes. Source: Author’selaboration.
Implications for Poverty and Inequality Analysis The focus on con-version rates helps to understand, whether we can expect increasing or de-creasing inequality between di↵erent groups that get the same amount oftransfers/additional endowment from the public policy. When applied tosubgroup analyses, the framework helps in identifying convergent or diver-gent trends among di↵erent groups providing insight on horizontal inequal-ity. Groups can be defined along individual characteristics (such as sex,ethnicity, age, etc.) or contextual characteristics (such as degree of urban-ization, institutional articulation, economic diversification, etc.).
Figure 2 summarizes the analytical framework, in line with results thatcan be obtained in a multilevel analysis. It exemplifies how di↵erent levelsof a conversion factor and di↵erent conversion rates associated to them canmake a di↵erence for policy outcomes. In figure 2, the population is dividedon the hand of a conversion factor. Four subgroups of the population areshown (Group 1, 2, 3 and 4). For each group, the performance in terms of anachievement (y-variable) is plotted against the policy input (x-variable). Foreach subgroup of the population it is possible to identify an average “startingposition” (the intercept), and an average conversion rate (the slope) withwhich the endowment is transformed into achievement.
The graphical display helps in visualizing inequality between and withinsubgroups: between-group inequality can be identified with di↵erencens intheir respective starting positions. Within-group inequality on the otherhand can be deduced from the steepness of the slope. Steeper slopes showthat achievement levels can be very di↵erent within the group. Flatter slopeson the other hand reflect greater homogeneity in terms of the considered
13
achievement.By interpreting the slopes as conversion rates, figure 2 also helps in vi-
sualizing inequality dynamics: it is easy to see that group 1 and 2 haveidentical conversion rates, but because group 2 starts from a higher inter-cept it is not converging with group 1 in terms of achievement. Group 3, onthe other hand starts from lower endowments than Group 2 but has higherconversion rates, it is therefore “catching up” and contributing to the re-duction in overall inequality. Group 4 is an example of subgroup for whichthe policy input is not relevant. In comparison to the other groups, we canactually detect divergence, which might increase overall inequality. Group4 appears to be marginalized, and what is worse: the policy is not able tochange this condition.
4.2 Data
4.2.1 The Universe of Bolsa Familia Beneficiaries:Using the CadUnico
The use of the CadUnico dataset described in this section represents one ofthe most innovative contributions of my study. At the individual level (ofa two-level model) I use the administrative data of the Brazilian Ministryfor Development, which comprise the Unified Record for Social programmes(CadUnico) and the Benefit Payment System (Folha de Pagamento do pro-grama Bolsa Familia).32 The Unified Record serves as systematic tool toidentify and characterize the socio-economic conditions of low-income fami-lies.33 Families with per capita income below half the minimum wage thatwant to apply for social programmes have to first register in the CadUnico.34
The CadUnico exists since 2001 but became fully e↵ective with the cre-ation of the Social Development Ministry (Ministerio do DesenvolvimentoSocial e Combate a Fome).35 It has played a crucial role for the unification
32The information contained in CadUnico is collected by the municipal agents of BolsaFamilia — preferably through household interviews (Simoes, 2012[66]) — throughout thecountry and is then checked and consolidated by the Caixa Federal, a federal bank whichmanages the national information system. The Caixa Economica Federal receives andprocesses information which is then passed on to the SENARC (Secretarıa Nacional de
Renda de Cidadania) of the MDS. In operational terms, the Caixa Economica implementsmost steps of Bolsa Familia. For a detailed – though skeptical – description of the role ofCaixa Economica Federal within the Bolsa Familia programme see Soares (2012[74]) whoalso provides details on the data collection process of CadUnico.
33Translated from the o�cial site of the MDS. Seehttp://www.mds.gov.br/bolsafamilia/cadastrounico
34Families will be accepted in the CadUnico if their total family income does not exceedthree minimum wages, regardless of household size.
35The relevant laws determining the functioning of the CadUnico are the following:Decreto n 6.135/07, pelas Portarias n 177, 16th of June 2011, n 274, 10th of October2011, Instrues Normativas n 1 e n 2, 26th of August 2011, and as Instrues Normativas n3 e n 4, 14th of October 2011
14
of previous di↵erent CCT-programmes and is at the heart of the e�ciencywith which the programme has been able to target and to monitor such alarge scale amount of beneficiaries (Soares, 2012[74]).
The CadUnico datasets provide a unique opportunity to observe the uni-verse of vulnerable households in Brazil. Although clearly not representativeof the overall Brazilian population, the CadUnico has an implicit advantagein comparison to other household surveys when it comes to studying povertyand vulnerability: by not relying on PNAD’s sampling structure, it includeshouseholds belonging to very small, rural, remote realities which are chron-ically underrepresented in the standard surveys.
Using the CadUnico for research is not an easy task, first of all becauseof its size. The extract of August 2010 that I use contains over 26 millionobservations at the household level (Domicılio dataset), and over 99 millionobservations at the individual level (Pessoa dataset).36 The analysis ofthese datasets therefore requires powerful computational systems and — alot of time and patience. I use the facilities of the Center for ComputationalScience at Tulane University to analyze the CadUnico dataset.37
How reliable is the information of CadUnico really? There are somedrawbacks which mainly have to do with the law regulating its constantupdate.38 I have extensively checked and controlled the dataset and do notfind inconsistencies that make the data unreliable. I get to the conclusionthat it is unlikely for a municipal social worker to interview a household andto only fill out one, random question of the questionnaire — even more sobecause the number of variables collected is rather limited. According to myanalysis, the updating mechanisms work well, when they are implemented.
A di↵erent issue is the general e↵ort of the municipalities to update theinformation at all: the amount of transfers received by the municipalitydepends on the number of beneficiaries (also requires municipality e↵ort inidentifying beneficiaries) and on the number of beneficiaries being updatedwithin the 24 months timeframe. I find that rates of updating are higher inpoorer states, whereas more wealthy states tend to put less e↵ort in updatingtheir CadUnico information.39
In my econometric analysis I restrict the pool of data to those obser-vations that have been updated within the last 24 months, although this
36Values refer to the extract of August, 2010, which is the one I use for my analysis37For more information on the center see http://wiki.ccs.tulane.edu.38According to the Decree 6.135/07, an observation in the CadUnico is regarded as
updated if i) the information is valid ii) the change in any of the following information isbeing recorded at least every 24 months: address, familiy income, inclusion or exclusionof member of the family, inclusion of an identification document, legal responsible of thehousehold, the code of the school the child/children is/are attending, the school grade thechild/children is/are attending. Strictly speaking, the dataset does therefore not guaranteethat all these variables are equally updated.
39According to my view this is directly linked to the dependency of poorer municipalitiesfrom the transfers received.
15
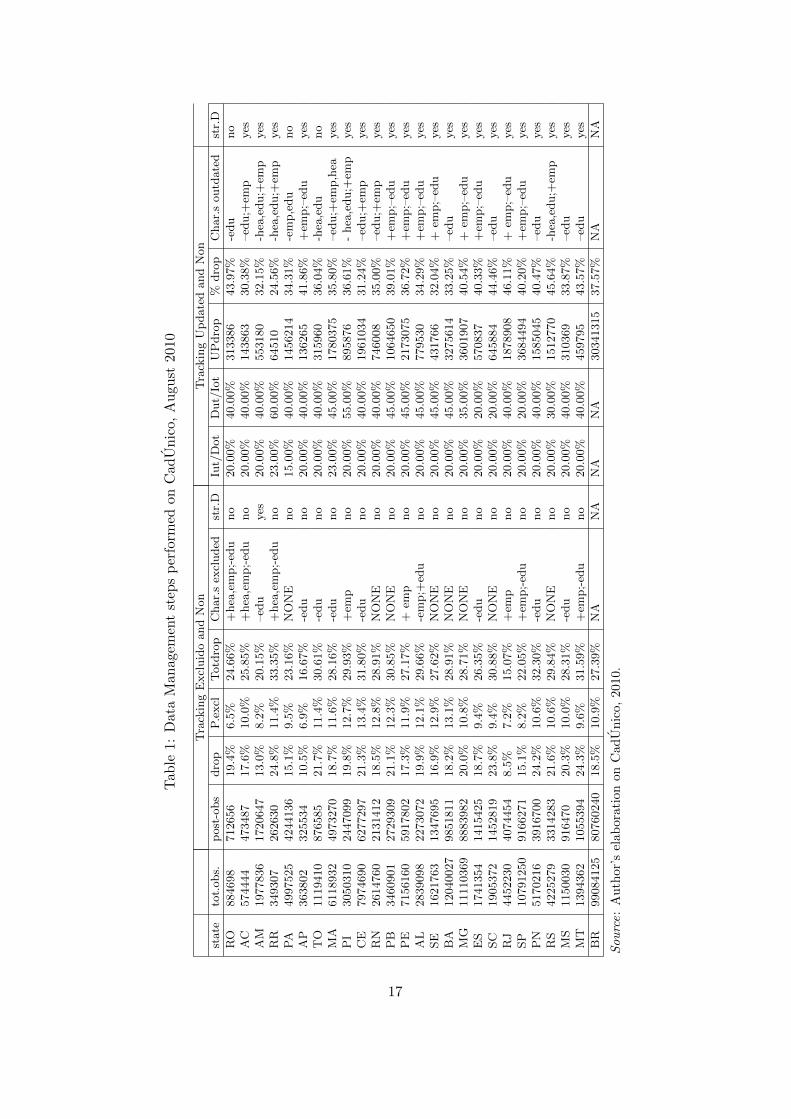
implies loosing big portions of the sample (between 24% and 46% depend-ing on the state — see table 1). Individuals that are not updated tend tohave slightly higher employment achievements, which hints that it is slightlyolder individuals that are not tracked as consistently as younger ones thathave been included more recently.
Table 140 and 241 summarize the features of the CadUnico dataset ofAugust 2010. As can be seen, the dataset is consistent in terms of transfersreceived by families that are registered as enrolled into a social programme,with inconsistencies ranging between 0.5% and 1.2% depending on state (seetable 2).42
Out of the initial 99 084 125 individuals registered in the CadUnico,18.5% are currently not enrolled in any social programme because not elegi-ble (at all or anymore) or because death occurred in the meantime. Withinenrolled households there are individuals that are beneficiaries (e.g. chil-dren and pregnant or breast-feeding mothers) and individuals that are not(e.g. fathers or other household members). Within eligible households, only10.9% of family members are not elegible.
In my extract of the CadUnico, 72.6% of all registered individuals arebeneficiaries of Bolsa Familia, or 71 946 076 individuals as of August, 2010(own calculation, CadUnico). Among the individuals pertaining to elegi-ble households, 62.4% report updated information on their socio-economicliving conditions. As I restrict my analysis to updated records, the num-ber of individuals included into my empirical investigation amounts to 50418 935 (50.5 million) when including non-beneficiaries within beneficiaryhouseholds, and to 41 604 761 (41.6 million) when only considering directbeneficiaries.
40The table reports the total initial observations found in the dataset (pessoas); the num-ber of individuals remaining in the dataset after dropping those that are not participatingin the Bolsa Familia programme (post-obsdrop); the % of observations thereby excluded;the % of individuals who are excluded from the programme despite of living in a householdthat is receiving Bolsa Familia transfer (P.excl); the total % of observations that are notdirect beneficiaries of Bolsa Familia (Totdrop); the salient characteristics of individualsexcluded from the programme (Char.s excluded) and whether the di↵erence between themand the beneficiaries can be regarded as structural (str.D); the % of individuals that areupdated although they are part of a HH that has not been updated (Iut/Dot); the % ofindividuals whose HH is updated, but their own information is outdated (Dut/Iot); the% of observations dropped because of the update-restriction (UPdrop); the salient char-acteristics of outdated individuals (Char.s outdated) and whether they are structurallydi↵erent from updated individuals (str.D).
41The table reports the initial number of observations, the final number of observations,the number of cases in which a HH that is o�cially not participating in Bolsa Familia isnethertheless receiving a monetary transfer according to the Folha de Pagamentos; the %of incoherent cases.
42An inconsistency is here intended as a family receiving Bolsa Familia benefit althoughit figures as not enrolled into any social programme.
16
Tab
le1:
DataMan
agem
entstep
sperform
edon
Cad
Unico,
Augu
st20
10
TrackingExcluidoan
dNon
TrackingUpdated
andNon
state
tot.ob
s.post-ob
sdrop
P.excl
Totdrop
Char.s
excluded
str.D
Iut/Dot
Dut/Iot
UPdrop
%drop
Char.s
outdated
str.D
RO
8846
9871
2656
19.4%
6.5%
24.66%
+hea,emp;-ed
uno
20.00%
40.00%
3133
8643
.97%
-edu
no
AC
5744
4447
3487
17.6%
10.0%
25.85%
+hea,emp;-ed
uno
20.00%
40.00%
1438
6330
.38%
–edu;+
emp
yes
AM
1977
836
1720
647
13.0%
8.2%
20.15%
–edu
yes
20.00%
40.00%
5531
8032
.15%
-hea,edu;+
emp
yes
RR
3493
0726
2630
24.8%
11.4%
33.35%
+hea,emp;-ed
uno
23.00%
60.00%
6451
024
.56%
-hea,edu;+
emp
yes
PA
4997
525
4244
136
15.1%
9.5%
23.16%
NONE
no
15.00%
40.00%
1456
214
34.31%
-emp,edu
no
AP
3638
0232
5534
10.5%
6.9%
16.67%
-edu
no
20.00%
40.00%
1362
6541
.86%
+em
p;–ed
uyes
TO
1119
410
8765
8521
.7%
11.4%
30.61%
-edu
no
20.00%
40.00%
3159
6036
.04%
-hea,edu
no
MA
6118
932
4973
270
18.7%
11.6%
28.16%
-edu
no
23.00%
45.00%
1780
375
35.80%
–edu;+
emp,hea
yes
PI
3050
310
2447
099
19.8%
12.7%
29.93%
+em
pno
20.00%
55.00%
8958
7636
.61%
-hea,edu;+
emp
yes
CE
7974
690
6277
297
21.3%
13.4%
31.80%
-edu
no
20.00%
40.00%
1961
034
31.24%
–edu;+
emp
yes
RN
2614
760
2131
412
18.5%
12.8%
28.91%
NONE
no
20.00%
40.00%
7460
0835
.00%
–edu;+
emp
yes
PB
3460
901
2729
309
21.1%
12.3%
30.85%
NONE
no
20.00%
45.00%
1064
650
39.01%
+em
p;–ed
uyes
PE
7156
160
5917
802
17.3%
11.9%
27.17%
+em
pno
20.00%
45.00%
2173
075
36.72%
+em
p;–ed
uyes
AL
2839
098
2273
072
19.9%
12.1%
29.66%
-emp;+
edu
no
20.00%
45.00%
7795
3034
.29%
+em
p;–ed
uyes
SE
1621
763
1347
695
16.9%
12.9%
27.62%
NONE
no
20.00%
45.00%
4317
6632
.04%
+em
p;–ed
uyes
BA
1204
0027
9851
811
18.2%
13.1%
28.91%
NONE
no
20.00%
45.00%
3275
614
33.25%
–edu
yes
MG
1111
0369
8883
982
20.0%
10.8%
28.71%
NONE
no
20.00%
35.00%
3601
907
40.54%
+em
p;–ed
uyes
ES
1741
354
1415
425
18.7%
9.4%
26.35%
-edu
no
20.00%
20.00%
5708
3740
.33%
+em
p;–ed
uyes
SC
1905
372
1452
819
23.8%
9.4%
30.88%
NONE
no
20.00%
20.00%
6458
8444
.46%
–edu
yes
RJ
4452
230
4074
454
8.5%
7.2%
15.07%
+em
pno
20.00%
40.00%
1878
908
46.11%
+em
p;–ed
uyes
SP
1079
1250
9166
271
15.1%
8.2%
22.05%
+em
p;-ed
uno
20.00%
20.00%
3684
494
40.20%
+em
p;–ed
uyes
PN
5170
216
3916
700
24.2%
10.6%
32.30%
-edu
no
20.00%
40.00%
1585
045
40.47%
–edu
yes
RS
4225
279
3314
283
21.6%
10.6%
29.84%
NONE
no
20.00%
30.00%
1512
770
45.64%
-hea,edu;+
emp
yes
MS
1150
030
9164
7020
.3%
10.0%
28.31%
-edu
no
20.00%
40.00%
3103
6933
.87%
–edu
yes
MT
1394
362
1055
394
24.3%
9.6%
31.59%
+em
p;-ed
uno
20.00%
40.00%
4597
9543
.57%
–edu
yes
BR
9908
4125
8076
0240
18.5%
10.9%
27.39%
NA
NA
NA
NA
3034
1315
37.57%
NA
NA
Sou
rce:Author’s
elab
orationon
Cad
Unico,
2010.
17
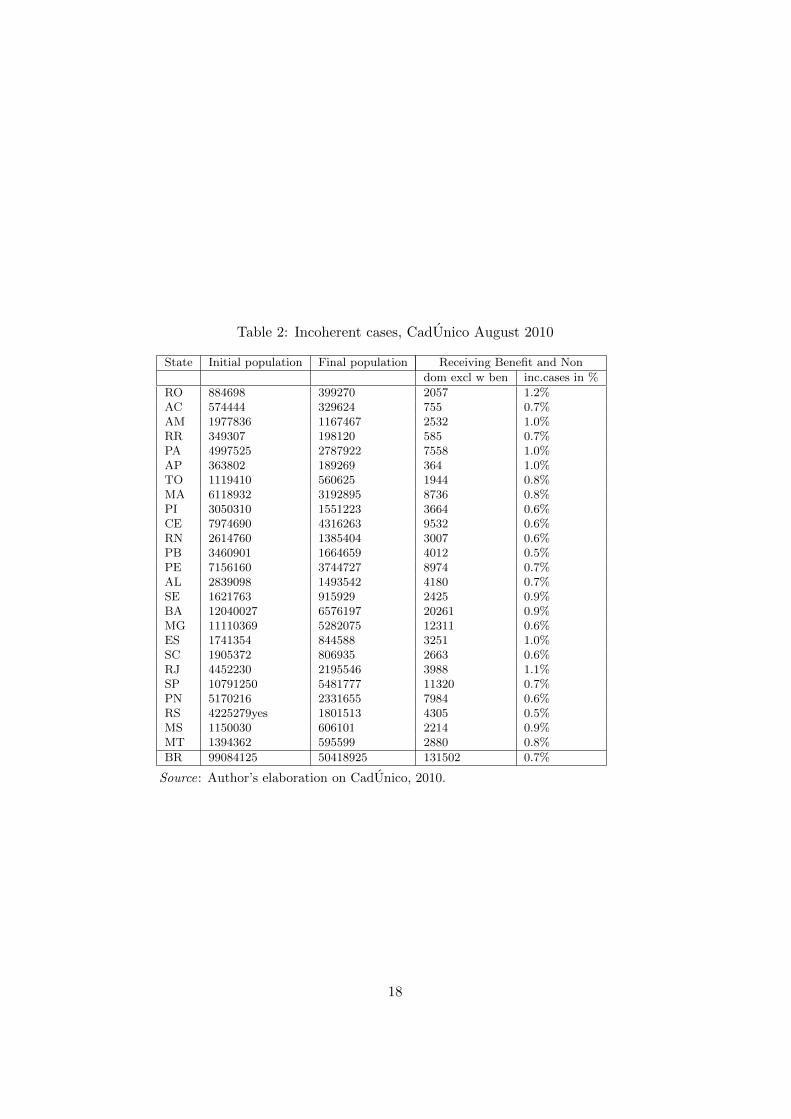
Table 2: Incoherent cases, CadUnico August 2010
State Initial population Final population Receiving Benefit and Nondom excl w ben inc.cases in %
RO 884698 399270 2057 1.2%AC 574444 329624 755 0.7%AM 1977836 1167467 2532 1.0%RR 349307 198120 585 0.7%PA 4997525 2787922 7558 1.0%AP 363802 189269 364 1.0%TO 1119410 560625 1944 0.8%MA 6118932 3192895 8736 0.8%PI 3050310 1551223 3664 0.6%CE 7974690 4316263 9532 0.6%RN 2614760 1385404 3007 0.6%PB 3460901 1664659 4012 0.5%PE 7156160 3744727 8974 0.7%AL 2839098 1493542 4180 0.7%SE 1621763 915929 2425 0.9%BA 12040027 6576197 20261 0.9%MG 11110369 5282075 12311 0.6%ES 1741354 844588 3251 1.0%SC 1905372 806935 2663 0.6%RJ 4452230 2195546 3988 1.1%SP 10791250 5481777 11320 0.7%PN 5170216 2331655 7984 0.6%RS 4225279yes 1801513 4305 0.5%MS 1150030 606101 2214 0.9%MT 1394362 595599 2880 0.8%BR 99084125 50418925 131502 0.7%
Source: Author’s elaboration on CadUnico, 2010.
18
4.2.2 Capitalizing Brazils Data Abundancy: the Meso-level Dataset
At the meso-level, I construct a dataset that combines publicly availablemeasures of demographics, economic performance, labour market structure,institutional organization, productivity, local public finance and other char-acteristics of the context, defined at the municipality level.
All data refer to the year 2010, in some cases to 2009. The data sourcesthat I use comprise the latest census available CENSO 2010 (IBGE ), FAZEN-DADATA which comprise all public accounts of each municipality,43 IPEA-DATA which provides information on agricultural productivity, GDP percapita, export values and their recent growth rates. Further, I include thevariables collected by a municipality survey — the PERFIL DOS MUNICI-PIOS (IBGE) which provides details on local institutions, their activity,organization and internal structure. The resulting Meso-level Dataset com-prises geographic, economic, institutional and social variables that covermany di↵erent features of the context for all municipalities of Brazil.
The accuracy and tidiness with which these datasets are put at disposalof the public allows to adopt an exploratory approach in which innovativemeasures of institutional quality can be constructed.44
4.3 Dependent Variables
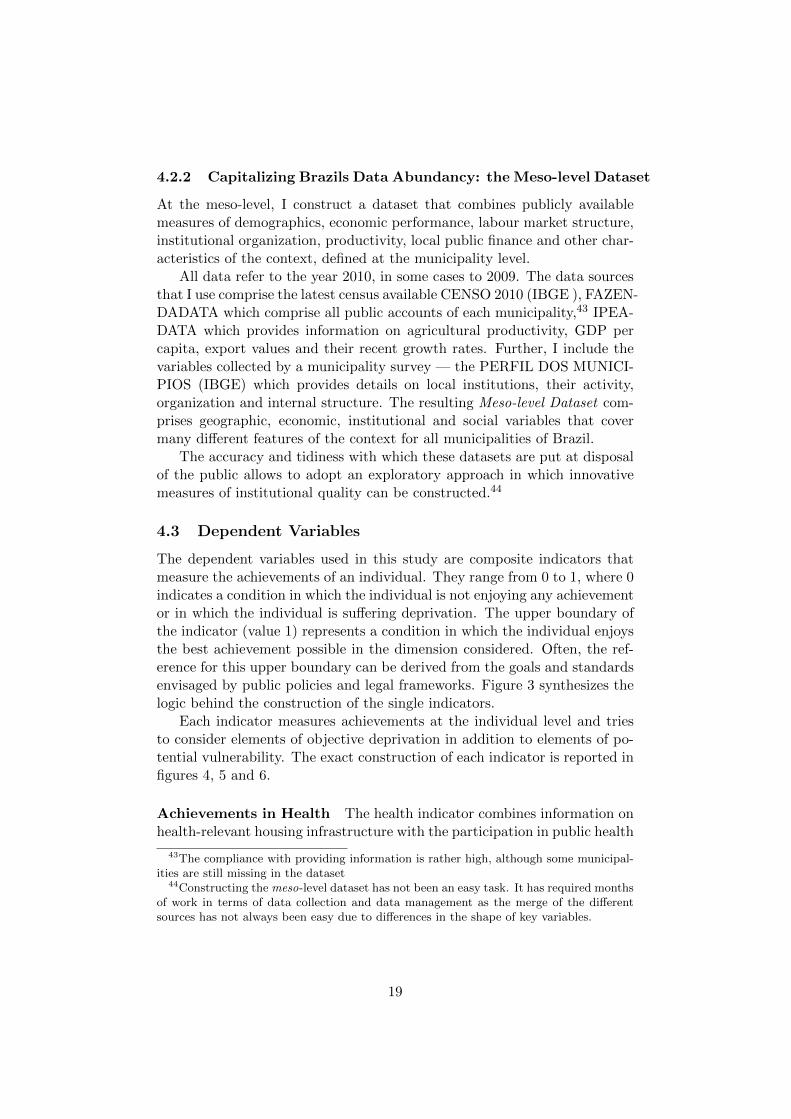
The dependent variables used in this study are composite indicators thatmeasure the achievements of an individual. They range from 0 to 1, where 0indicates a condition in which the individual is not enjoying any achievementor in which the individual is su↵ering deprivation. The upper boundary ofthe indicator (value 1) represents a condition in which the individual enjoysthe best achievement possible in the dimension considered. Often, the ref-erence for this upper boundary can be derived from the goals and standardsenvisaged by public policies and legal frameworks. Figure 3 synthesizes thelogic behind the construction of the single indicators.
Each indicator measures achievements at the individual level and triesto consider elements of objective deprivation in addition to elements of po-tential vulnerability. The exact construction of each indicator is reported infigures 4, 5 and 6.
Achievements in Health The health indicator combines information onhealth-relevant housing infrastructure with the participation in public health
43The compliance with providing information is rather high, although some municipal-ities are still missing in the dataset
44Constructing the meso-level dataset has not been an easy task. It has required monthsof work in terms of data collection and data management as the merge of the di↵erentsources has not always been easy due to di↵erences in the shape of key variables.
19
Full$achievement$
No$achievement$0$ 1$
Achievement*
How the individual situation is
How potentially vulnerable the individual is
Expected*distribu3on*of*final*indicator*
Presence*of*objec3ve*depriva3on*0$ Absence*of*objec3ve*
depriva3on*1$
Factors*of*vulnerability*are*recognizable*0$ Factors*of*vulnerability*
are*not*recognizable*1$
Defined*along*a*con$nuum*
Figure 3: Conceptual Structure of Achievement Indicators. Source: Au-thor’s elaboration.
programmes45 and the presence of chronic disabilities, such as being blind,deaf, mute, or being chronically subject to other physical or mental prob-lems.
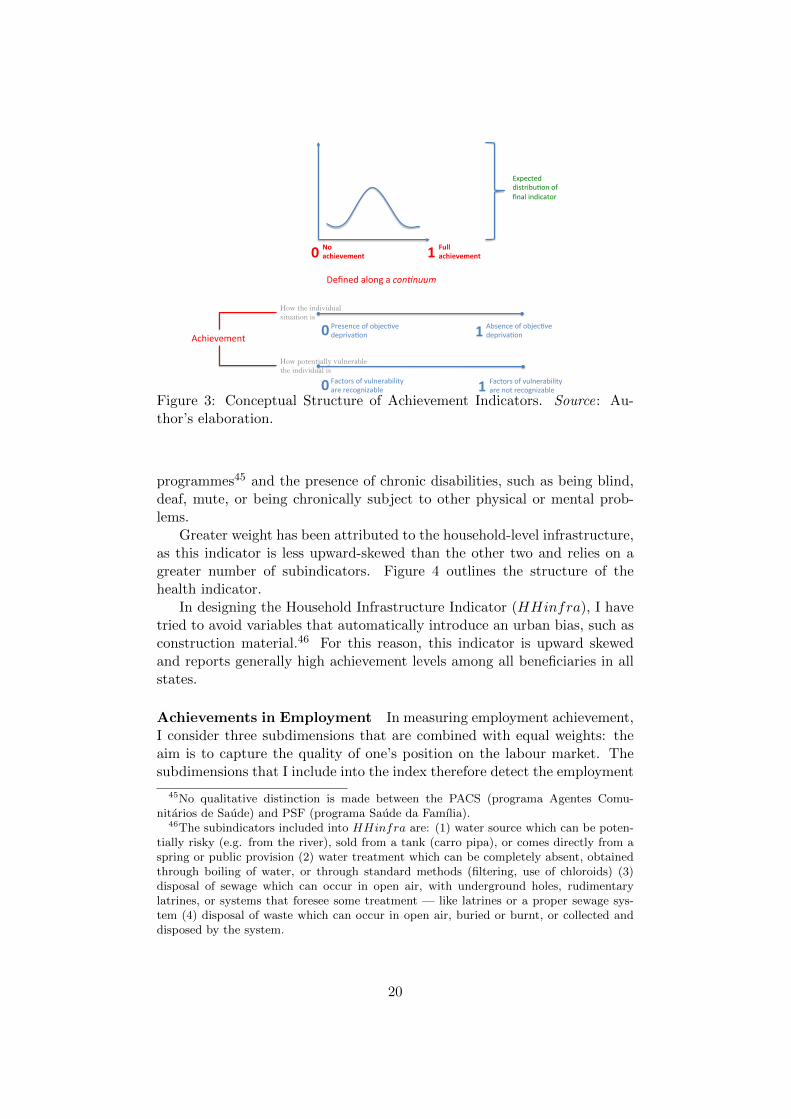
Greater weight has been attributed to the household-level infrastructure,as this indicator is less upward-skewed than the other two and relies on agreater number of subindicators. Figure 4 outlines the structure of thehealth indicator.
In designing the Household Infrastructure Indicator (HHinfra), I havetried to avoid variables that automatically introduce an urban bias, such asconstruction material.46 For this reason, this indicator is upward skewedand reports generally high achievement levels among all beneficiaries in allstates.
Achievements in Employment In measuring employment achievement,I consider three subdimensions that are combined with equal weights: theaim is to capture the quality of one’s position on the labour market. Thesubdimensions that I include into the index therefore detect the employment
45No qualitative distinction is made between the PACS (programa Agentes Comu-nitarios de Saude) and PSF (programa Saude da Famılia).
46The subindicators included into HHinfra are: (1) water source which can be poten-tially risky (e.g. from the river), sold from a tank (carro pipa), or comes directly from aspring or public provision (2) water treatment which can be completely absent, obtainedthrough boiling of water, or through standard methods (filtering, use of chloroids) (3)disposal of sewage which can occur in open air, with underground holes, rudimentarylatrines, or systems that foresee some treatment — like latrines or a proper sewage sys-tem (4) disposal of waste which can occur in open air, buried or burnt, or collected anddisposed by the system.
20
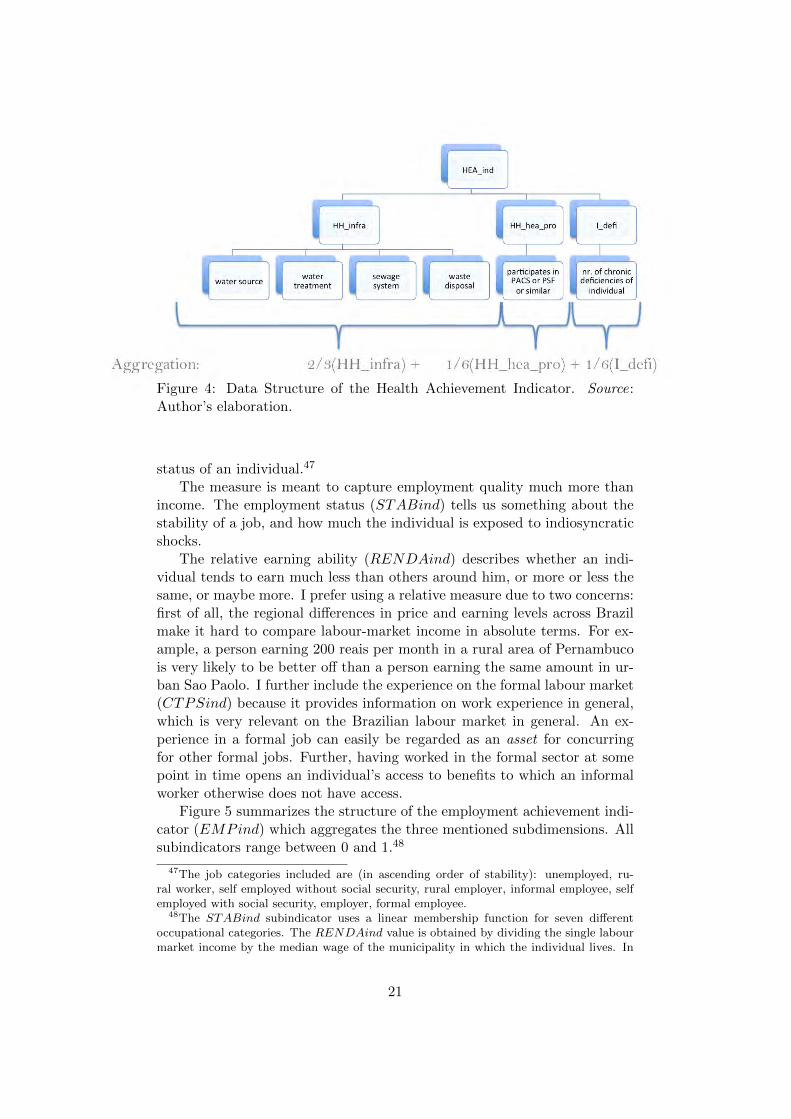
Figure 4: Data Structure of the Health Achievement Indicator. Source:Author’s elaboration.
status of an individual.47
The measure is meant to capture employment quality much more thanincome. The employment status (STABind) tells us something about thestability of a job, and how much the individual is exposed to indiosyncraticshocks.
The relative earning ability (RENDAind) describes whether an indi-vidual tends to earn much less than others around him, or more or less thesame, or maybe more. I prefer using a relative measure due to two concerns:first of all, the regional di↵erences in price and earning levels across Brazilmake it hard to compare labour-market income in absolute terms. For ex-ample, a person earning 200 reais per month in a rural area of Pernambucois very likely to be better o↵ than a person earning the same amount in ur-ban Sao Paolo. I further include the experience on the formal labour market(CTPSind) because it provides information on work experience in general,which is very relevant on the Brazilian labour market in general. An ex-perience in a formal job can easily be regarded as an asset for concurringfor other formal jobs. Further, having worked in the formal sector at somepoint in time opens an individual’s access to benefits to which an informalworker otherwise does not have access.
Figure 5 summarizes the structure of the employment achievement indi-cator (EMPind) which aggregates the three mentioned subdimensions. Allsubindicators range between 0 and 1.48
47The job categories included are (in ascending order of stability): unemployed, ru-ral worker, self employed without social security, rural employer, informal employee, selfemployed with social security, employer, formal employee.
48The STABind subindicator uses a linear membership function for seven di↵erentoccupational categories. The RENDAind value is obtained by dividing the single labourmarket income by the median wage of the municipality in which the individual lives. In
21
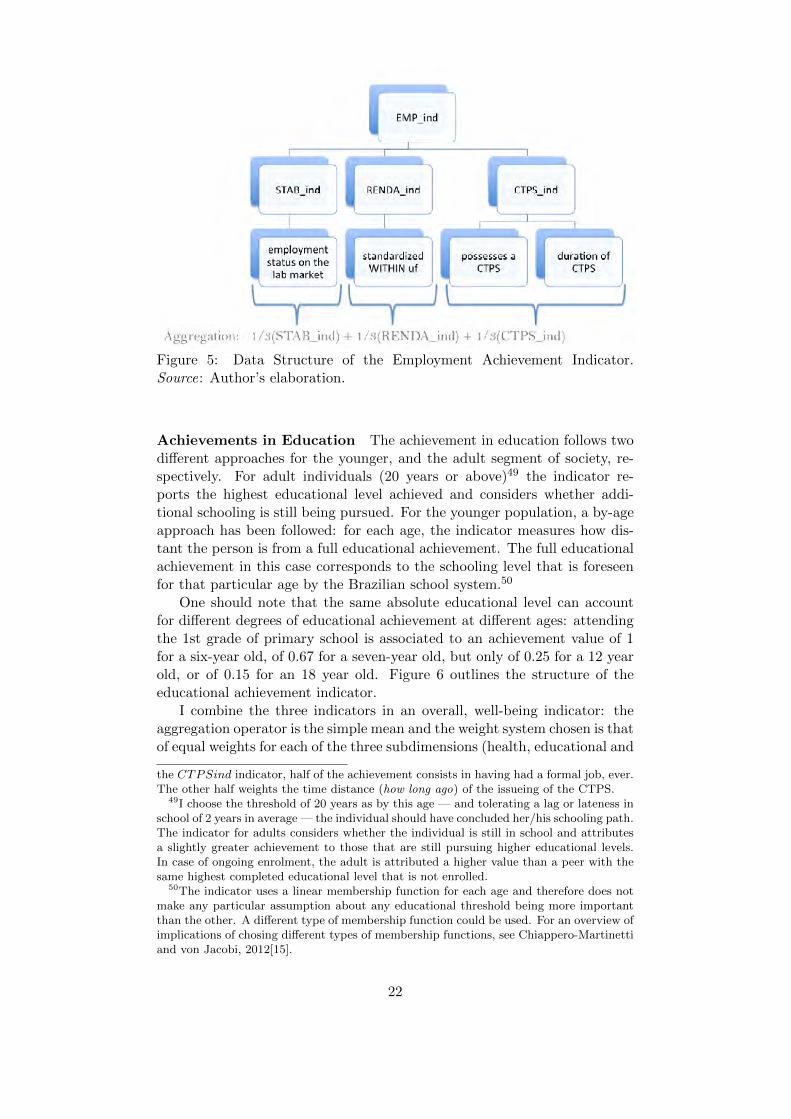
Figure 5: Data Structure of the Employment Achievement Indicator.Source: Author’s elaboration.
Achievements in Education The achievement in education follows twodi↵erent approaches for the younger, and the adult segment of society, re-spectively. For adult individuals (20 years or above)49 the indicator re-ports the highest educational level achieved and considers whether addi-tional schooling is still being pursued. For the younger population, a by-ageapproach has been followed: for each age, the indicator measures how dis-tant the person is from a full educational achievement. The full educationalachievement in this case corresponds to the schooling level that is foreseenfor that particular age by the Brazilian school system.50
One should note that the same absolute educational level can accountfor di↵erent degrees of educational achievement at di↵erent ages: attendingthe 1st grade of primary school is associated to an achievement value of 1for a six-year old, of 0.67 for a seven-year old, but only of 0.25 for a 12 yearold, or of 0.15 for an 18 year old. Figure 6 outlines the structure of theeducational achievement indicator.
I combine the three indicators in an overall, well-being indicator: theaggregation operator is the simple mean and the weight system chosen is thatof equal weights for each of the three subdimensions (health, educational and
the CTPSind indicator, half of the achievement consists in having had a formal job, ever.The other half weights the time distance (how long ago) of the issueing of the CTPS.
49I choose the threshold of 20 years as by this age — and tolerating a lag or lateness inschool of 2 years in average — the individual should have concluded her/his schooling path.The indicator for adults considers whether the individual is still in school and attributesa slightly greater achievement to those that are still pursuing higher educational levels.In case of ongoing enrolment, the adult is attributed a higher value than a peer with thesame highest completed educational level that is not enrolled.
50The indicator uses a linear membership function for each age and therefore does notmake any particular assumption about any educational threshold being more importantthan the other. A di↵erent type of membership function could be used. For an overview ofimplications of chosing di↵erent types of membership functions, see Chiappero-Martinettiand von Jacobi, 2012[15].
22
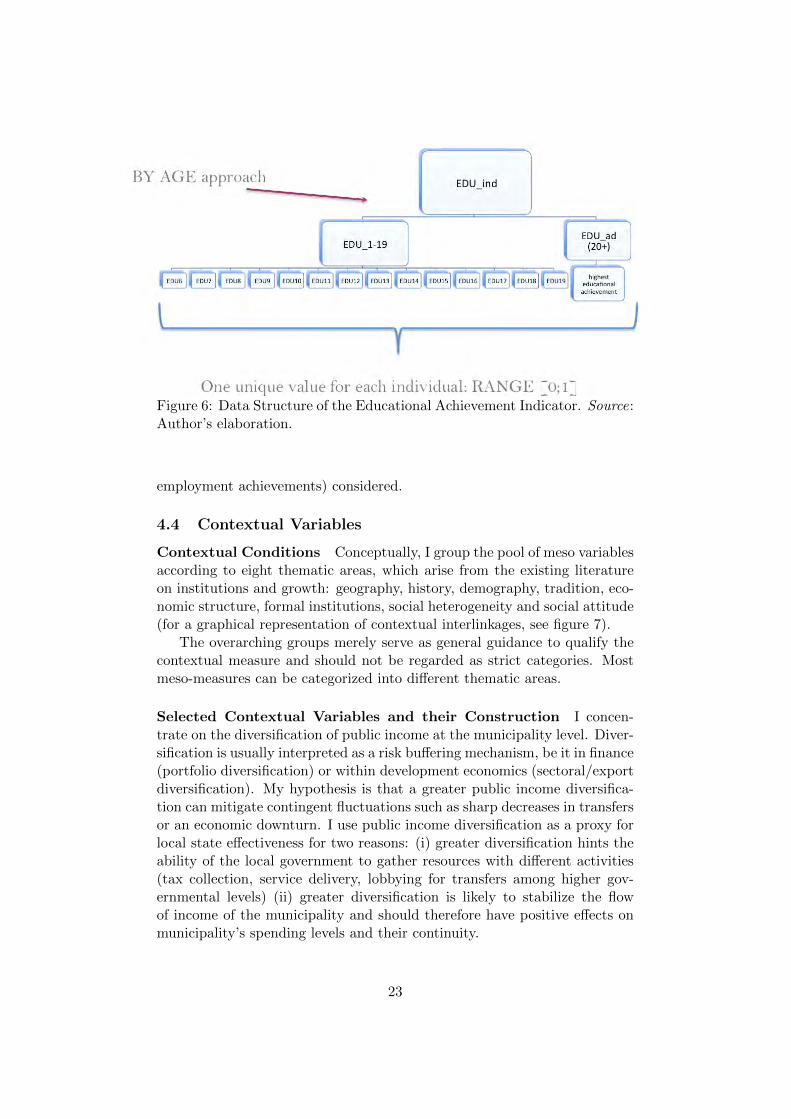
Figure 6: Data Structure of the Educational Achievement Indicator. Source:Author’s elaboration.
employment achievements) considered.
4.4 Contextual Variables
Contextual Conditions Conceptually, I group the pool of meso variablesaccording to eight thematic areas, which arise from the existing literatureon institutions and growth: geography, history, demography, tradition, eco-nomic structure, formal institutions, social heterogeneity and social attitude(for a graphical representation of contextual interlinkages, see figure 7).
The overarching groups merely serve as general guidance to qualify thecontextual measure and should not be regarded as strict categories. Mostmeso-measures can be categorized into di↵erent thematic areas.
Selected Contextual Variables and their Construction I concen-trate on the diversification of public income at the municipality level. Diver-sification is usually interpreted as a risk bu↵ering mechanism, be it in finance(portfolio diversification) or within development economics (sectoral/exportdiversification). My hypothesis is that a greater public income diversifica-tion can mitigate contingent fluctuations such as sharp decreases in transfersor an economic downturn. I use public income diversification as a proxy forlocal state e↵ectiveness for two reasons: (i) greater diversification hints theability of the local government to gather resources with di↵erent activities(tax collection, service delivery, lobbying for transfers among higher gov-ernmental levels) (ii) greater diversification is likely to stabilize the flowof income of the municipality and should therefore have positive e↵ects onmunicipality’s spending levels and their continuity.
23
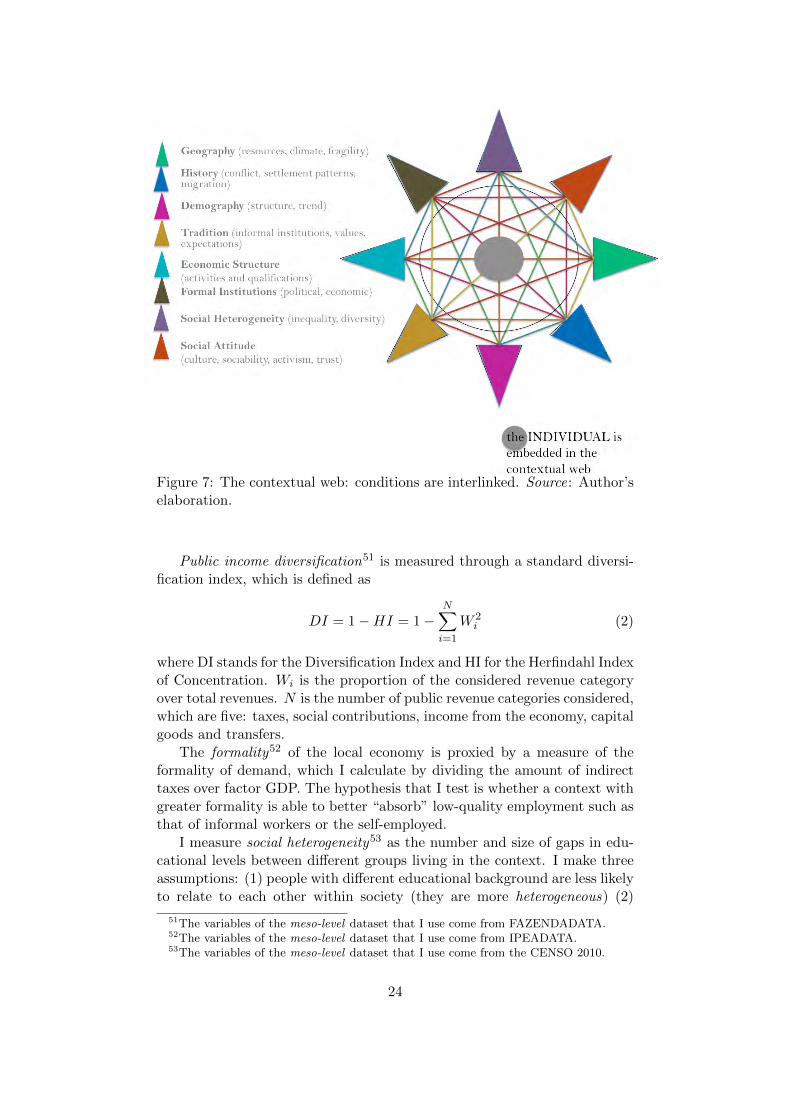
Figure 7: The contextual web: conditions are interlinked. Source: Author’selaboration.
Public income diversification51 is measured through a standard diversi-fication index, which is defined as
DI = 1�HI = 1�NX
i=1
W 2i (2)
where DI stands for the Diversification Index and HI for the Herfindahl Indexof Concentration. Wi is the proportion of the considered revenue categoryover total revenues. N is the number of public revenue categories considered,which are five: taxes, social contributions, income from the economy, capitalgoods and transfers.
The formality52 of the local economy is proxied by a measure of theformality of demand, which I calculate by dividing the amount of indirecttaxes over factor GDP. The hypothesis that I test is whether a context withgreater formality is able to better “absorb” low-quality employment such asthat of informal workers or the self-employed.
I measure social heterogeneity53 as the number and size of gaps in edu-cational levels between di↵erent groups living in the context. I make threeassumptions: (1) people with di↵erent educational background are less likelyto relate to each other within society (they are more heterogeneous) (2)
51The variables of the meso-level dataset that I use come from FAZENDADATA.52The variables of the meso-level dataset that I use come from IPEADATA.53The variables of the meso-level dataset that I use come from the CENSO 2010.
24
groups with di↵erent average educational background tend to relate lesswith each other (3) the share of illiterates within a group can proxy educa-tional background of the group.54
My synthetic measure, which I call the likeliness of missing communi-cation is constructed by following a network approach: The adult popula-tion of each municipality is grouped along two characteristics which I deemsalient for educational di↵erences: ethinicity and age. The dataset that Iuse allows for the distinction between five di↵erent ethnicities55 and threedi↵erent age groups.56 Each group assumes the role of a node57 within thenetwork. The di↵erence between shares of illiterates in the group proxies theeducational distance between the two groups and represents the likeliness ofmissing communication between them.58 I compute the distances betweenall pairwise combinations of groups and make a sum of the gaps.
To check for the presence of natural resources, I control for the transfersthat the municipalities receive from the state or the Federal Union throughthe redistributive system (see previous section).59 For each of the followingresources — water, mineral resources and petroleum — I check whether themunicipality receives one type of transfer only or more types of transfers.60
My indicator of cultural equipment counts the presence in the munici-pality of any of the following: libraries, museums, theatres, cultural centres,cinemas, movie rentals, stadiums, sport infrastructure, internet points, sec-ondary schools, shopping centres, music stores, book stores, radio AM, radioFM, community radio, TV channel, leisure clubs and associations.
For social spending, I construct a measure of spending on public goodsthat includes spending on urban planning, environmental management, sci-ence and technology, culture, public security and transport.61
54This hypothesis implies isomorphism of educational di↵erences and likeliness of com-munication/interaction.
55As in the Censo, 2010: branco, preto, pardo, amarelo, indio.5615-24 years, 25-39 years, 40-49 years.57In network analysis, nodes (or vertices) are units which are connected to each other
by edges.58Potentially, the contextual communication network can therefore have 15 nodes. The
exact amount of nodes clearly depends on the ethnic diversification in the context. Allthree age groups are always present in each municipality, but some ethnic groups might bepresent in some municipalities and absent in others. Consequently, also the number of pos-sible connections (gaps) can vary: for the 5565 municipalities, the number of connectionsvaries between 23 and 150.
59The variables of the meso-level dataset that I use come from FAZENDADATA.60Those that only receive one type of transfer benefit from the general distribution of
revenues from natural resources, whereas those that receive more than one type of transfercan be identified as municipalities that are directly involved in the extraction of naturalresources.
61Public security only includes civil security and excludes any military spending. Theoriginal categories from the public accounts dataset are: urbanizmo, gestao ambiental,
ciencia e tecnologia, cultura, seguranca publica, transporte.
25
4.5 A Random Coe�cients Model
A tool that is typically used when di↵erences between contexts are takeninto account are “fixed-e↵ect models”. There are two drawbacks for usingthese models to investigate the framework that I propose: first of all, the useof fixed e↵ects is reasonable when the number of contexts is small. Secondly,fixed e↵ects allow to detect di↵erences in starting positions (intercepts) only.They “lump” the contextual e↵ect together into the fixed e↵ect, or theconstant. Yet, as I plan to detect di↵erent conversion rates, I also need thecoe�cients of explanatory variables to vary. Further, by synthesizing thecontextual e↵ect in the constant term, fixed e↵ects do not allow to explainwhich contextual features are driving the e↵ect.
Mixed e↵ect models62 on the other hand allow the inclusion of contextualcovariates and provide exactly the type of estimates that the frameworkrequires: di↵erences in starting levels (random intercepts) and in conversionrates (random slopes). The choice of multilevel analysis is justified by thefocus that these models pose on the role of clustering: they presume datastructures that are nested. Multilevel models are designed to study latentfactors whose precise content can be explained by including more and moreexplanatory variables.
For the empirical analysis of this study I use a random coe�cients model- or multilevel model (Snijders and Bosker, 1999[68]; Hox, 2002[34]; Rau-denbush and Byrk, 2002[48]) with two levels in which: level 1 comprisesindividuals with the index i = 1, ...., nj within the municipality j and level2 refers to the context (municipality) in which the individual lives, carryingthe index j = 1, ...., J .
The specification I choose is a two-level random intercept random slopemodel which allows to capture di↵erences in “starting levels” — in line withmore standard fixed e↵ects analyses that detect a context-specific intercept— and in conversions. The first level model assumes the form of:
Yij = �0j + �1jXij + ✏ij (3)
where the dependent variable Yij of individual i nested in context j isa quasi-quantitative indicator with range [0 : 1] measuring the achievementin well-being or in any of its sub-dimensions (education, health or employ-ment).
Relation (3) shows that, for each context j, the individual achievementis explained by the average outcome in context j, a vector of individualcharacteristics X plus an individual error term that is i.i.d in the senseof ✏ij ⇠ N(0,�2). As it is likely that a common e↵ect among individualsbelonging to the same context is present, a context-level error term is addedto the specification of the intercept and the slope:
62Also known as Random coe�cients models, or as Multilevel models.
26
�0j = �00 + u0j (4)
�1j = �10 + u1j (5)
For each context j, the intercept (4) and the slope (5) are defined byan average outcome for the entire population, �00 and �10 respectively, anda context-specific error term; u0j for the intercept and u1j for the slope,where both context-level errors are i.i.d in the sense of uj ⇠ N(0,�2) andorthogonal to the individual error term ✏ij .63 In order to better specify theways in which the context can influence individual achievements, I introducea vector of covariates defined at the second level: W . Any covariate definedat level 2 can change the context-specific parameters �0j and �1j in thefollowing way:
�0j = �00 + �01Wj + u0j (6)
�1j = �10 + �11Wj + u1j (7)
where �01Wj captures the mean di↵erence in the intercept that is dueto the contextual explanatory factor W , and, similarly, �11Wj identifiesthe mean di↵erence in slope due to factor W . The new, complete randomintercept, random slope multilevel model is obtained by combining equations(3), (6) and (7):
Yij = �00 + �01Wj + �10Xij + �11WjXij + u0j + u1jXij + ✏ij (8)
The parameters that are of particular interest for this study are thosein which context-specific covariates, Wj , are at play: for example, the wayin which a certain contextual characteristic shapes the average interceptof the context �01Wj can give an important insight as to which contexts(and due to which features) provide a better starting position for individualachievements. The cross-level interaction term �11WjXij on the other handtells us something about how the contextual conversion factor a↵ects theaverage conversion rate of the beneficiaries living in that context.
4.6 Estimation Strategy
In order to detect in which contexts Bolsa Familia seems to work best, Iproceed in the following way. After investigating the CadUnico dataset interms of poverty and inequality statistics, I compute a multilevel modelwith individual and contextual covariates for each of the three subindicatorsof well-being, and for the composite well-being indicator. The two BolsaFamilia input variables that I include into the model are i) the per capita
63This does not imply that the error term of the intercept has the same variance as theerror term of the slope.
27
amount transferred and ii) the length of participation in the programme(expressed in years). Where model fitting does not decrease, I also includean interactive term between i) and ii) — BFpcapLength.
I test whether a random intercept or a random slope specification is moreadequate, and consistently find better fitting with the random slopes model.Therefore, only the results of the random slope model are presented.64
As this study focusses on contextual characteristics, I do not explic-itly aim at identifying individual characteristics that determine well-beingachievements. However, a number of individual-level control variables havebeen included into the model.
In the choice of contextual characteristics to include in the analysis, Ibuild upon an extensive exploration of the meso dataset. Without goinginto the methodological details at this point,the factors selected tend to bevery relevant for the context in overall. I use network analysis and quantileregressions to detect which contextual features are i) most interlinked withother contextual features ii) dominant in relative terms.65 When insertingcontextual covariates into the multilevel model I pay attention to possiblecollinearities.
Due to the extensive size of the CadUnico dataset, I specify the fourmodels on one state, Minas Gerais, which is usually considered to be themost representative state of Brazil as it resembles characteristics of all dif-ferent parts of the country. I run the same model specifications on eachsingle state and try to identify i) which contexts tend to provide better orworse starting positions for achievements ii) whether the conversion of BolsaFamilia input to achievements is di↵erent in di↵erent contexts. I find thatthe model fitting is not equally good throughout di↵erent states.
In a second stage analysis, I add cross-level interaction terms to themodel in order to detect the exact e↵ect that particular contextual charac-teristics have on the conversion ability of Bolsa Familia beneficiaries. Thisprovides a first insight on linear contextual e↵ects. The last stage of theanalysis computes model predictions for subgroups of contextual character-istics, e.g. categories of urbanization levels, or quintiles of the distribution
64As the computation of the R2 is not straightforward in multilevel analysis, I report aproxy statistics, interpretable as the percentage of explained variance. This can only becalculated on the random intercept specification, which has slightly lower fitting in termsof AIC, BIC and deviance - these are commonly used in random coe�cients models (seefor example Snijders and Bosker, 1999[68], Albright and Marinova, 2010[3], Rabe-Heskethand Skrondal, 2012[46]).
65The concept of dominance is derived from ecology: Symbiotic relationships betweentwo organisms can be classified as being mutual — both organisms benefit in the same way,commensalist — one organism benefits from the other, while the other neither benefitsnor is a↵ected, parasitic — one organism benefits from the other, while the other is beingharmed. The contextual factors identified as dominant are those that behave as commen-
salists over other contextual features. Briefly, the logic behind this conceptual frameworkis to transfer ecological knowledge to the investigation of institutional interlinkages andevolution.
28
of a contextual factor. The graphical analysis resulting from this last stageallows to detect non-linear influences of contextual characteristics on conver-sion rates. It also provides an insight on relative convergence and catching-upphenomena.
5 RESULTS
5.1 Inequality and Poverty Profile of Bolsa Familia Benefi-ciaries
When analyzing the data of the CadUnico, it is quite obvious that BolsaFamilia has reduced inequalities. The gini index of income without theBolsa Familia transfer, and the gini of income including the transfer arequite di↵erent. Inequality among the beneficiaries drops drastically once weinclude the monetary transfer into household income. Inequality does notonly decrease within the state, but also across the di↵erent Brazilian states,hinting that — at least for the beneficiaries — regional di↵erences basicallydisappear.
A similar trend can be observed when looking at education. As in manyother developing countries, the recent wave of education-focussed policieshas produced a huge gap between older generations, which still tend tohave rather high illiteracy rates and the younger groups in society. Theyounger the individual, the higher the probability that she/he will be en-rolled to school, and the higher the average educational achievement ob-tained. This is also true for Brazil, and the CadUnico data confirm it:educational achievements are generally lower among older people and theyincrease within younger generations.
Measures of educational inequality, therefore, mainly capture this gener-ational gap throughout the country. The educational achievements of oldergenerations (say those antecedent to the introduction of Bolsa Familia) standfor previous deprivations and inequalities. These are indeed rather di↵er-ent across di↵erent states. On the other hand, we notice that inter-statedi↵erences among the younger generations are barely noticeable. My in-terpretation is that Bolsa Familia is already closing a huge structural gapthat determined regional di↵erences within the country for decades (andcenturies). This is very promising for a continued decrease of inequality inthe future.
To better understand the profile of beneficiaries that are present in theCadUnico dataset, I construct poverty and inequality measures for each ofthe achievement indicators. Table 3 reports the median value, the PGI, SPGand gini index for each of the achievement indicators constructed (EDUind,EMPind, HEAind and WBind). As can easily be seen, health is the di-mension in which least inequality among beneficiaries can be detected. Thiscan be explained by i) the relative homogeneity of the population recorded
29
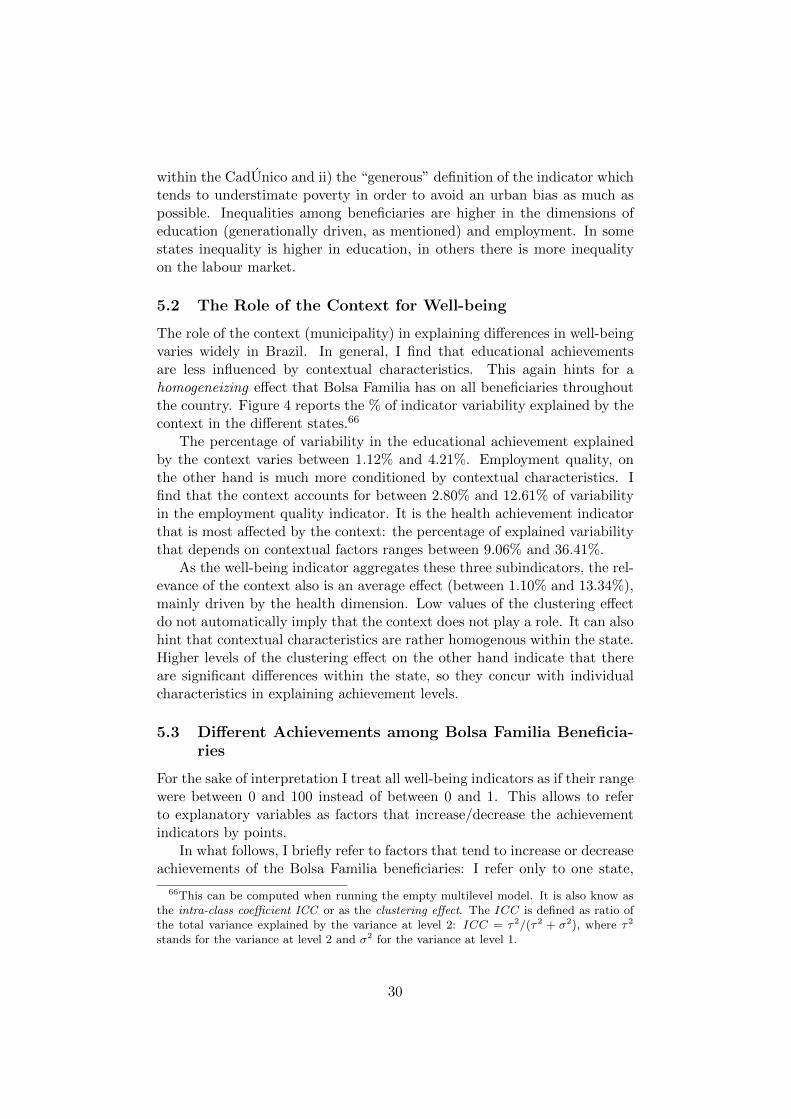
within the CadUnico and ii) the “generous” definition of the indicator whichtends to understimate poverty in order to avoid an urban bias as much aspossible. Inequalities among beneficiaries are higher in the dimensions ofeducation (generationally driven, as mentioned) and employment. In somestates inequality is higher in education, in others there is more inequalityon the labour market.
5.2 The Role of the Context for Well-being
The role of the context (municipality) in explaining di↵erences in well-beingvaries widely in Brazil. In general, I find that educational achievementsare less influenced by contextual characteristics. This again hints for ahomogeneizing e↵ect that Bolsa Familia has on all beneficiaries throughoutthe country. Figure 4 reports the % of indicator variability explained by thecontext in the di↵erent states.66
The percentage of variability in the educational achievement explainedby the context varies between 1.12% and 4.21%. Employment quality, onthe other hand is much more conditioned by contextual characteristics. Ifind that the context accounts for between 2.80% and 12.61% of variabilityin the employment quality indicator. It is the health achievement indicatorthat is most a↵ected by the context: the percentage of explained variabilitythat depends on contextual factors ranges between 9.06% and 36.41%.
As the well-being indicator aggregates these three subindicators, the rel-evance of the context also is an average e↵ect (between 1.10% and 13.34%),mainly driven by the health dimension. Low values of the clustering e↵ectdo not automatically imply that the context does not play a role. It can alsohint that contextual characteristics are rather homogenous within the state.Higher levels of the clustering e↵ect on the other hand indicate that thereare significant di↵erences within the state, so they concur with individualcharacteristics in explaining achievement levels.
5.3 Di↵erent Achievements among Bolsa Familia Beneficia-ries
For the sake of interpretation I treat all well-being indicators as if their rangewere between 0 and 100 instead of between 0 and 1. This allows to referto explanatory variables as factors that increase/decrease the achievementindicators by points.
In what follows, I briefly refer to factors that tend to increase or decreaseachievements of the Bolsa Familia beneficiaries: I refer only to one state,
66This can be computed when running the empty multilevel model. It is also know asthe intra-class coe�cient ICC or as the clustering e↵ect. The ICC is defined as ratio ofthe total variance explained by the variance at level 2: ICC = ⌧2/(⌧2 + �2), where ⌧2
stands for the variance at level 2 and �2 for the variance at level 1.
30
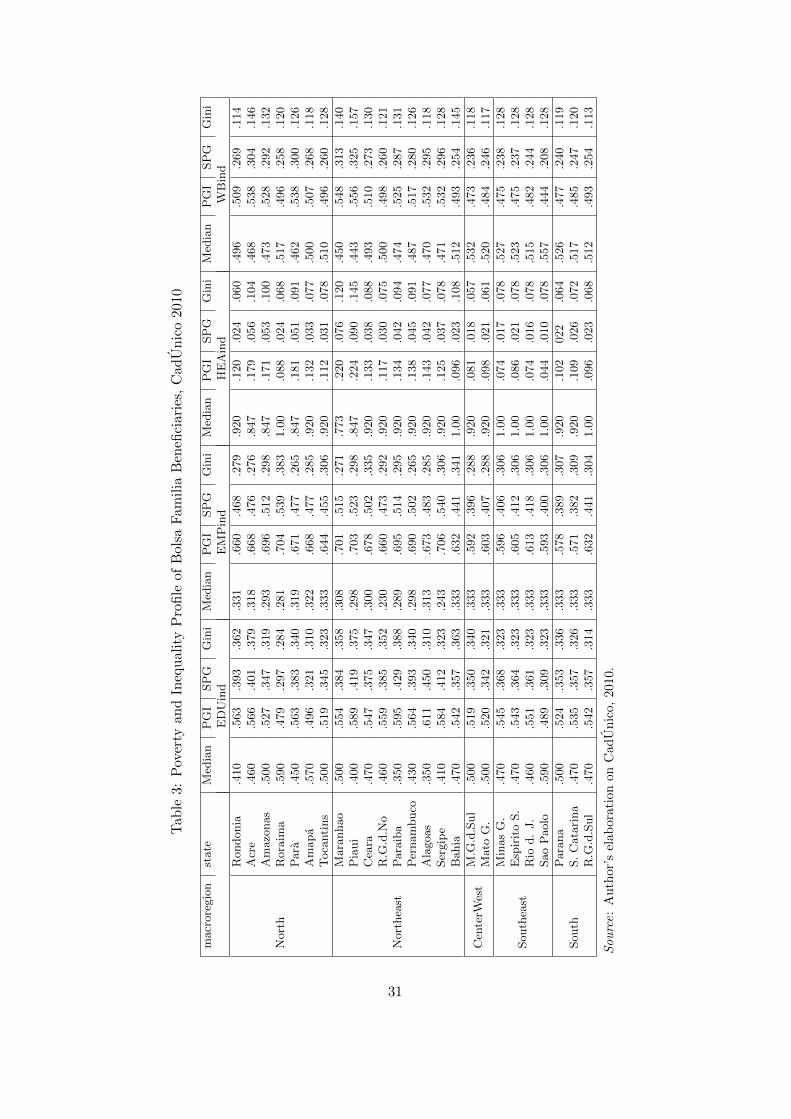
Tab
le3:
Poverty
andInequalityProfile
ofBolsa
Fam
ilia
Ben
eficiaries,
Cad
Unico20
10
macroregion
state
Med
ian
PGI
SPG
Gini
Med
ian
PGI
SPG
Gini
Med
ian
PGI
SPG
Gini
Med
ian
PGI
SPG
Gini
EDUind
EMPind
HEAind
WBind
North
Ron
don
ia.410
.563
.393
.362
.331
.660
.468
.279
.920
.120
.024
.060
.496
.509
.269
.114
Acre
.460
.566
.401
.379
.318
.668
.476
.276
.847
.179
.056
.104
.468
.538
.304
.146
Amazon
as.500
.527
.347
.319
.293
.696
.512
.298
.847
.171
.053
.100
.473
.528
.292
.132
Roraima
.590
.479
.297
.284
.281
.704
.539
.383
1.00
.088
.024
.068
.517
.496
.258
.120
Para
.450
.563
.383
.340
.319
.671
.477
.265
.847
.181
.051
.091
.462
.538
.300
.126
Amap
a.570
.496
.321
.310
.322
.668
.477
.285
.920
.132
.033
.077
.500
.507
.268
.118
Tocantins
.500
.519
.345
.323
.333
.644
.455
.306
.920
.112
.031
.078
.510
.496
.260
.128
Northeast
Maran
hao
.500
.554
.384
.358
.308
.701
.515
.271
.773
.220
.076
.120
.450
.548
.313
.140
Piaui
.400
.589
.419
.375
.298
.703
.523
.298
.847
.224
.090
.145
.443
.556
.325
.157
Ceara
.470
.547
.375
.347
.300
.678
.502
.335
.920
.133
.038
.088
.493
.510
.273
.130
R.G
.d.N
o.460
.559
.385
.352
.230
.660
.473
.292
.920
.117
.030
.075
.500
.498
.260
.121
Paraiba
.350
.595
.429
.388
.289
.695
.514
.295
.920
.134
.042
.094
.474
.525
.287
.131
Pernam
buco
.430
.564
.393
.340
.298
.690
.502
.265
.920
.138
.045
.091
.487
.517
.280
.126
Alago
as.350
.611
.450
.310
.313
.673
.483
.285
.920
.143
.042
.077
.470
.532
.295
.118
Sergipe
.410
.584
.412
.323
.243
.706
.540
.306
.920
.125
.037
.078
.471
.532
.296
.128
Bah
ia.470
.542
.357
.363
.333
.632
.441
.341
1.00
.096
.023
.108
.512
.493
.254
.145
CenterW
est
M.G
.d.Sul
.500
.519
.350
.340
.333
.592
.396
.288
.920
.081
.018
.057
.532
.473
.236
.118
MatoG.
.500
.520
.342
.321
.333
.603
.407
.288
.920
.098
.021
.061
.520
.484
.246
.117
Sou
theast
Minas
G.
.470
.545
.368
.323
.333
.596
.406
.306
1.00
.074
.017
.078
.527
.475
.238
.128
EspiritoS.
.470
.543
.364
.323
.333
.605
.412
.306
1.00
.086
.021
.078
.523
.475
.237
.128
Rio
d.J.
.460
.551
.361
.323
.333
.613
.418
.306
1.00
.074
.016
.078
.515
.482
.244
.128
Sao
Pao
lo.590
.489
.309
.323
.333
.593
.400
.306
1.00
.044
.010
.078
.557
.444
.208
.128
Sou
thParan
a.500
.524
.353
.336
.333
.578
.389
.307
.920
.102
022
.064
.526
.477
.240
.119
S.Catarina
.470
.535
.357
.326
.333
.571
.382
.309
.920
.109
.026
.072
.517
.485
.247
.120
R.G
.d.Sul
.470
.542
.357
.314
.333
.632
.441
.304
1.00
.096
.023
.068
.512
.493
.254
.113
Sou
rce:Author’s
elab
orationon
Cad
Unico,
2010.
31
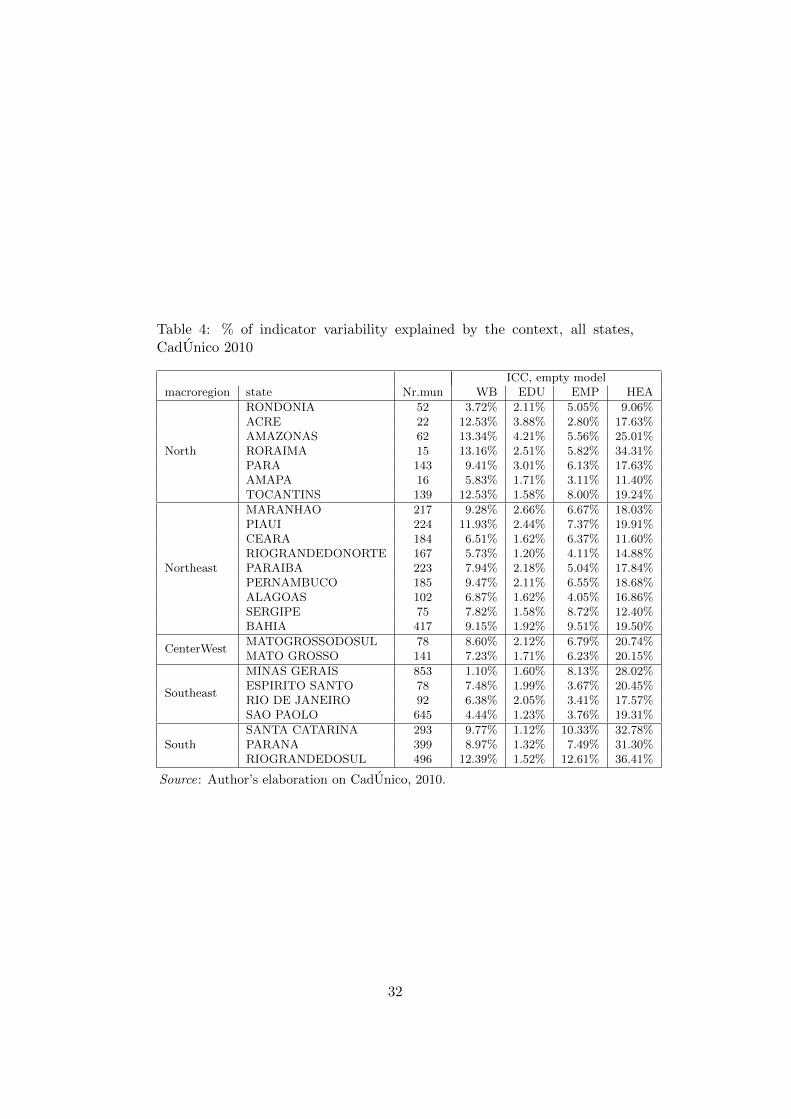
Table 4: % of indicator variability explained by the context, all states,CadUnico 2010
ICC, empty modelmacroregion state Nr.mun WB EDU EMP HEA
North
RONDONIA 52 3.72% 2.11% 5.05% 9.06%ACRE 22 12.53% 3.88% 2.80% 17.63%AMAZONAS 62 13.34% 4.21% 5.56% 25.01%RORAIMA 15 13.16% 2.51% 5.82% 34.31%PARA 143 9.41% 3.01% 6.13% 17.63%AMAPA 16 5.83% 1.71% 3.11% 11.40%TOCANTINS 139 12.53% 1.58% 8.00% 19.24%
Northeast
MARANHAO 217 9.28% 2.66% 6.67% 18.03%PIAUI 224 11.93% 2.44% 7.37% 19.91%CEARA 184 6.51% 1.62% 6.37% 11.60%RIOGRANDEDONORTE 167 5.73% 1.20% 4.11% 14.88%PARAIBA 223 7.94% 2.18% 5.04% 17.84%PERNAMBUCO 185 9.47% 2.11% 6.55% 18.68%ALAGOAS 102 6.87% 1.62% 4.05% 16.86%SERGIPE 75 7.82% 1.58% 8.72% 12.40%BAHIA 417 9.15% 1.92% 9.51% 19.50%
CenterWestMATOGROSSODOSUL 78 8.60% 2.12% 6.79% 20.74%MATO GROSSO 141 7.23% 1.71% 6.23% 20.15%
Southeast
MINAS GERAIS 853 1.10% 1.60% 8.13% 28.02%ESPIRITO SANTO 78 7.48% 1.99% 3.67% 20.45%RIO DE JANEIRO 92 6.38% 2.05% 3.41% 17.57%SAO PAOLO 645 4.44% 1.23% 3.76% 19.31%
SouthSANTA CATARINA 293 9.77% 1.12% 10.33% 32.78%PARANA 399 8.97% 1.32% 7.49% 31.30%RIOGRANDEDOSUL 496 12.39% 1.52% 12.61% 36.41%
Source: Author’s elaboration on CadUnico, 2010.
32
Minas Gerais in the macroregion Southeast as an example. Tables 6, 7, 8and 9 in the Annex summarize the results obtained in the random slopemultilevel model.
I find that age increases achievements in employment and is associatedto lower levels in educational achievement, as expected.67 Women tend tohave slightly higher health (1 point) and educational (2 points) achievementsbut much lower employment quality (11 points). Living in an urban areatends to increase employment quality (by 3 points) and health achievements(by 16 points). It has little (positive) e↵ect on educational achievements.Income associates positively with all achievement indicators.68
The achievement indicators themselves also work as explanatory vari-ables. One point increase in the educational achievement indicator is asso-ciated to a lower employment quality indicator (likely to be driven by age).A one point increase in the health indicator is associated to higher employ-ment quality (by ca. 3 points) and to higher educational achievement (by12 points).
In terms of contextual explanatory factors, I find that the proactive pro-motion of employment and enterprises on the local labour market is signifi-cant and has a positive e↵ect. A more formal economy increases individualemployment quality as expected. The local employment rate itself (formaland informal), displays a negative sign, which can be interpreted in thefollowing way: even when employment levels are higher, the type of jobsavailable to the most vulnerable people (such as the beneficiaries of BolsaFamilia) tend to have low quality (e.g. informal jobs or self-employment).69
Social heterogeneity, here proxied by the likeliness of missing comunication,has a negative e↵ect on employment, as expected: more fragmented/diversesocieties are a↵ected by lower employment quality.
5.4 Coe�cients of the Bolsa Familia Input
When analyzing the results of the random coe�cients estimation, it is pos-sible to observe positive, negative and insignificant coe�cients for the BolsaFamilia inputs.
Two di↵erent e↵ects might be at play in determining the signs of theBolsa Familia input coe�cients: on one hand, there is the programme place-ment e↵ect which transfers higher amounts of money to families with greaterdeprivations. The basic transfer (70Reais) that extremely poor families re-ceive is directly dependent on the amount of per capita income of the family.Lower income is associated to lower well-being achievements, too. The percapita amount of money transferred tends to reflect this programme place-
67In the employment model I include a dummy for being an adult instead of the con-tinuous variable age.
68I include the log of household per capita income into the model.69The coe�cient is significant at the 5% level.
33
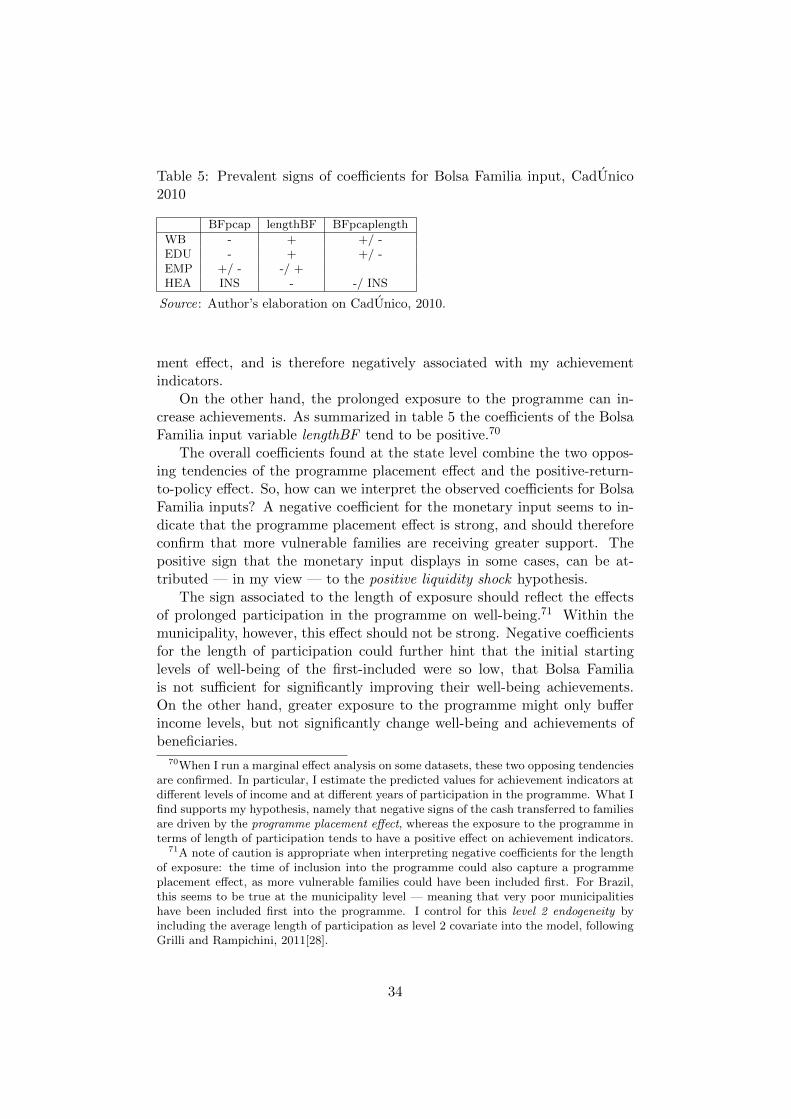
Table 5: Prevalent signs of coe�cients for Bolsa Familia input, CadUnico2010
BFpcap lengthBF BFpcaplengthWB - + +/ -EDU - + +/ -EMP +/ - -/ +HEA INS - -/ INS
Source: Author’s elaboration on CadUnico, 2010.
ment e↵ect, and is therefore negatively associated with my achievementindicators.
On the other hand, the prolonged exposure to the programme can in-crease achievements. As summarized in table 5 the coe�cients of the BolsaFamilia input variable lengthBF tend to be positive.70
The overall coe�cients found at the state level combine the two oppos-ing tendencies of the programme placement e↵ect and the positive-return-to-policy e↵ect. So, how can we interpret the observed coe�cients for BolsaFamilia inputs? A negative coe�cient for the monetary input seems to in-dicate that the programme placement e↵ect is strong, and should thereforeconfirm that more vulnerable families are receiving greater support. Thepositive sign that the monetary input displays in some cases, can be at-tributed — in my view — to the positive liquidity shock hypothesis.
The sign associated to the length of exposure should reflect the e↵ectsof prolonged participation in the programme on well-being.71 Within themunicipality, however, this e↵ect should not be strong. Negative coe�cientsfor the length of participation could further hint that the initial startinglevels of well-being of the first-included were so low, that Bolsa Familiais not su�cient for significantly improving their well-being achievements.On the other hand, greater exposure to the programme might only bu↵erincome levels, but not significantly change well-being and achievements ofbeneficiaries.
70When I run a marginal e↵ect analysis on some datasets, these two opposing tendenciesare confirmed. In particular, I estimate the predicted values for achievement indicators atdi↵erent levels of income and at di↵erent years of participation in the programme. What Ifind supports my hypothesis, namely that negative signs of the cash transferred to familiesare driven by the programme placement e↵ect, whereas the exposure to the programme interms of length of participation tends to have a positive e↵ect on achievement indicators.
71A note of caution is appropriate when interpreting negative coe�cients for the lengthof exposure: the time of inclusion into the programme could also capture a programmeplacement e↵ect, as more vulnerable families could have been included first. For Brazil,this seems to be true at the municipality level — meaning that very poor municipalitieshave been included first into the programme. I control for this level 2 endogeneity byincluding the average length of participation as level 2 covariate into the model, followingGrilli and Rampichini, 2011[28].
34
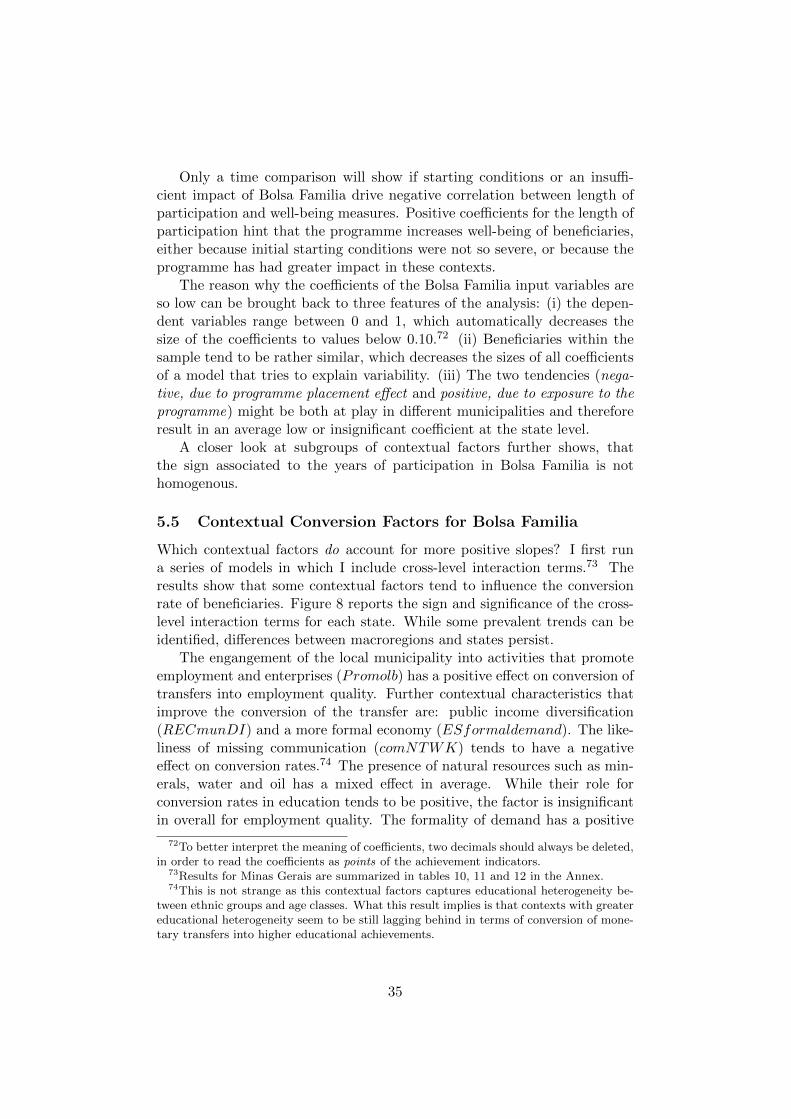
Only a time comparison will show if starting conditions or an insu�-cient impact of Bolsa Familia drive negative correlation between length ofparticipation and well-being measures. Positive coe�cients for the length ofparticipation hint that the programme increases well-being of beneficiaries,either because initial starting conditions were not so severe, or because theprogramme has had greater impact in these contexts.
The reason why the coe�cients of the Bolsa Familia input variables areso low can be brought back to three features of the analysis: (i) the depen-dent variables range between 0 and 1, which automatically decreases thesize of the coe�cients to values below 0.10.72 (ii) Beneficiaries within thesample tend to be rather similar, which decreases the sizes of all coe�cientsof a model that tries to explain variability. (iii) The two tendencies (nega-tive, due to programme placement e↵ect and positive, due to exposure to theprogramme) might be both at play in di↵erent municipalities and thereforeresult in an average low or insignificant coe�cient at the state level.
A closer look at subgroups of contextual factors further shows, thatthe sign associated to the years of participation in Bolsa Familia is nothomogenous.
5.5 Contextual Conversion Factors for Bolsa Familia
Which contextual factors do account for more positive slopes? I first runa series of models in which I include cross-level interaction terms.73 Theresults show that some contextual factors tend to influence the conversionrate of beneficiaries. Figure 8 reports the sign and significance of the cross-level interaction terms for each state. While some prevalent trends can beidentified, di↵erences between macroregions and states persist.
The engangement of the local municipality into activities that promoteemployment and enterprises (Promolb) has a positive e↵ect on conversion oftransfers into employment quality. Further contextual characteristics thatimprove the conversion of the transfer are: public income diversification(RECmunDI) and a more formal economy (ESformaldemand). The like-liness of missing communication (comNTWK) tends to have a negativee↵ect on conversion rates.74 The presence of natural resources such as min-erals, water and oil has a mixed e↵ect in average. While their role forconversion rates in education tends to be positive, the factor is insignificantin overall for employment quality. The formality of demand has a positive
72To better interpret the meaning of coe�cients, two decimals should always be deleted,in order to read the coe�cients as points of the achievement indicators.
73Results for Minas Gerais are summarized in tables 10, 11 and 12 in the Annex.74This is not strange as this contextual factors captures educational heterogeneity be-
tween ethnic groups and age classes. What this result implies is that contexts with greatereducational heterogeneity seem to be still lagging behind in terms of conversion of mone-tary transfers into higher educational achievements.
35
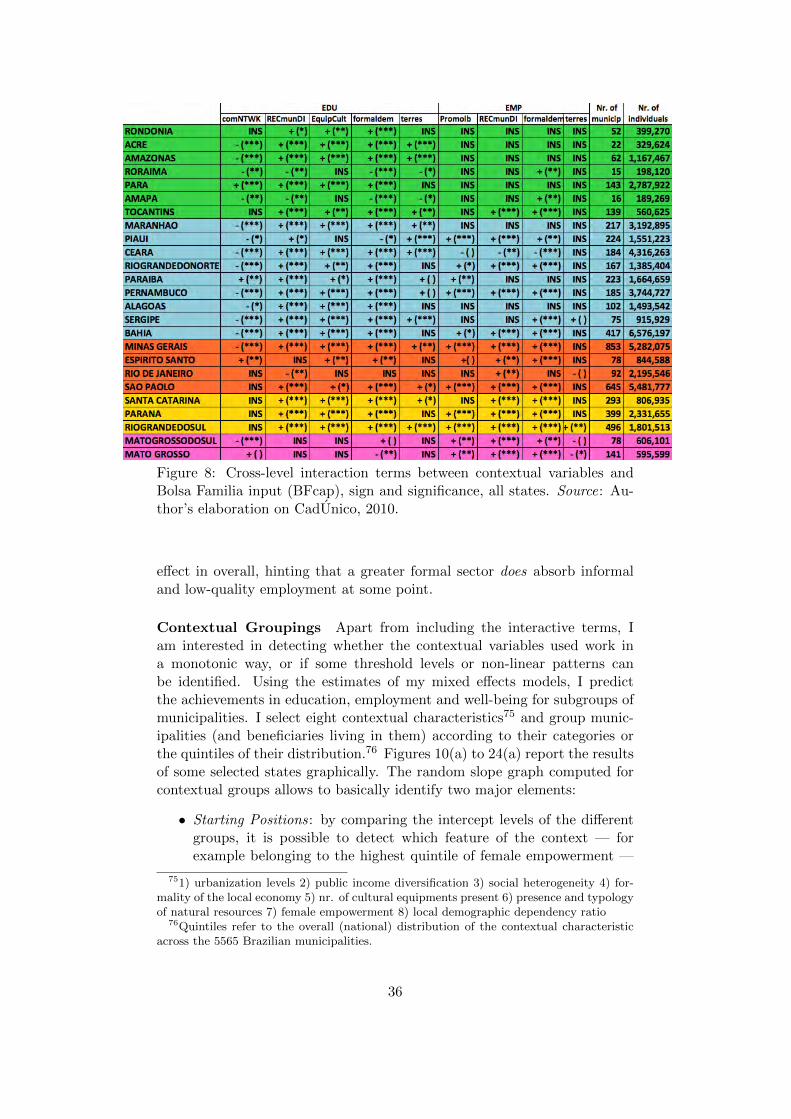
Figure 8: Cross-level interaction terms between contextual variables andBolsa Familia input (BFcap), sign and significance, all states. Source: Au-thor’s elaboration on CadUnico, 2010.
e↵ect in overall, hinting that a greater formal sector does absorb informaland low-quality employment at some point.
Contextual Groupings Apart from including the interactive terms, Iam interested in detecting whether the contextual variables used work ina monotonic way, or if some threshold levels or non-linear patterns canbe identified. Using the estimates of my mixed e↵ects models, I predictthe achievements in education, employment and well-being for subgroups ofmunicipalities. I select eight contextual characteristics75 and group munic-ipalities (and beneficiaries living in them) according to their categories orthe quintiles of their distribution.76 Figures 10(a) to 24(a) report the resultsof some selected states graphically. The random slope graph computed forcontextual groups allows to basically identify two major elements:
• Starting Positions : by comparing the intercept levels of the di↵erentgroups, it is possible to detect which feature of the context — forexample belonging to the highest quintile of female empowerment —
751) urbanization levels 2) public income diversification 3) social heterogeneity 4) for-mality of the local economy 5) nr. of cultural equipments present 6) presence and typologyof natural resources 7) female empowerment 8) local demographic dependency ratio
76Quintiles refer to the overall (national) distribution of the contextual characteristicacross the 5565 Brazilian municipalities.
36
provides higher average levels for the well-being of Bolsa Familia ben-eficiaries, in other words: better starting positions for those who wantto attain higher achievements. How widespread the distribution ofintercepts is, further allows us to identify between inequalities acrossmunicipalities in the same state. Where intercepts are more dispersed,we are detecting contextual characteristics that reflect big structuraldisparities within the single states.
• “Catch-Upers”: slopes can be read as the rate at which the policyhas been converted into well-being. Where groups of contexts startfrom lower starting positions and a positive slope can be seen, we areidentifying convergence in the sense that a longer exposure to the pro-gramme seems to help to “grow out” of the structural disadvantage.Steeper slopes hint higher rates of return to the policy and greaterwithin inequality between long-term participants and new beneficia-ries.
In what follows I briefly summarize the salient results of the graphical anal-ysis of contextual conversion factors.77
The graphical analysis shows that conversion rates di↵er between con-texts and states but that some trends of catching-up can be observed. Re-turns to the policy tend to be higher in less urbanized areas in the North andin the Northeast, but are detectable in medium-sized cities from the Centerto the South, and even in some big cities in the South. There is catching-upacross the country, especially in (more vulnerable) contexts with less formaleconomies, greater social heterogeneity, little cultural equipment, reducedfemale empowerment and with low public income diversification.78
With regards to the presence of natural resources, results di↵er widelybetween macroregions and states. Catching up can be recorded for munici-palities without any resources but also for municipalities where all resources(water, minerals, petroleum) are present. The single most relevant resourcefor positive conversion seems to be petroleum, but not everywhere. Depen-dency ratios seem not to be a too relevant factor, but conversion tends tobe higher in contexts with higher dependency ratios.79
While positive conversion into educational achievements and well-beingare more common, conversion into higher employment quality is rare in theNorth and becomes more common when shifting to the South: high pub-lic income diversification (5th quintile) is a contextual feature that seems tofacilitate conversion into employment quality. Realities with lower public in-come diversification are still catching up in the Southern part of the country,
77The analysis has been implemented for the subdimensions of education and employ-ment, and for the aggregate well-being indicator.
78This seems to be true for the second or third quintile of public income diversification,and not for the lowest one/s — hinting a threshold level.
79This implies a greater liquidity input as the benefit increases with family size.
37
however. High levels of female empowerment tend to be associated to betterconversion, not only in education and well-being, but also in employmentquality. In the Northern part of the country, contexts with little culturalequipment do not succeed in catching up in employment quality, althoughtheir trend in education and well-being is positive. In the Southern part, onthe other hand, catching up in employment quality is occuring even wherecultural equipment is very reduced.
6 CONCLUDING REMARKS
My analysis indicates that the context (municipal characteristics) plays arole for well-being in Brazil. In particular, I find that the context makesthe biggest di↵erence for health achievements, and is able to explain somevariability in the employment quality of beneficiaries. The context has leaste↵ect on educational achievements, which hints that the implementation ofBolsa Familia is rather homogenous throughout the country and is closingimportant structural gaps that have marked regional di↵erences throughoutdecades.
In the attempt to identify contextual characteristics that make a dif-ference for the conversion of Bolsa Familia input into human developmentachievements, I find that my model has better fitting for some states thanothers. Among the contextual factors that seem to improve conversion ratesfor employment, I identify the diversification of public income (quality offormal institution), the promotion of entrepreneurship (active policy) andthe formality of the local economy (economic structure). For an improvedconversion of Bolsa Familia into educational achievements, I find that thepresence of cultural equipment, formality of the economy and public incomediversification have a positive e↵ect. Social heterogeneity worsens the con-version. The presence of natural resources tends to have a positive e↵ectfor the conversion in education, but has no significant e↵ect on employmentapart from few exceptions.
In a further investigation, I have grouped beneficiaries and contexts ac-cording to municipal characteristics, and have found that the contextuale↵ect varies at di↵erent levels of the contextual variable analyzed — elseput, is not linear. This analysis of non monotonic influences of the contextshows that there are consistently lower returns in big cities which seemsto suggest that the e↵ectiveness of Bolsa Familia for the urban poor is re-duced, possibly because price di↵erentials between urban and rural areasare so big that the transfer amount is simply not big enough in urban areasto make a di↵erence (as suggested for example by Higgins, 2012[31]). Theonly exception among mega-cities seems to be Rio de Janeiro, where theparticipation in Bolsa Familia is being converted into higher achievements.Diversifying the transfer between urban and rural areas might have unde-
38
sired consequences, such as increasing migration. Still — and possibly —the programme implementation in highly urbanized areas should be comple-mented with additional support, whether of monetary or more service-basednature.
Apart from this limitation, I find that the rate of catching-up of thoserealities that have historically and structurally been lagging behind is im-portant. In general terms for the country, conversion rates of beneficiariestend to be higher in contexts that have higher poverty rates, less formaleconomies, greater social heterogeneity and little cultural infrastructure.This hints that the programme is playing an important role in closing struc-tural gaps. This is most probably happening through the provision of newopportunities and incentives there where starting positions are historicallylower. While this is remarkably true for achievements in education andwell-being, the trend is less widespread for achievements in employment.Conversion of the participation in Bolsa Familia into higher employmentquality is mainly happening at small urbanization levels, and more so inthe Center, Southeast and the South. In more informal economies, withlittle infrastructure, less monetarization and little public income diversifica-tion, positive conversion into employment is likely to be driven by a positiveliquidity shock e↵ect.
In addition to the good news of more vulnerable contexts catching upin terms of achievements, some contextual characteristics matter in partic-ular: public income diversification seems to provide greater opportunitiesto convert the exposure to the programme into higher employment quality,especially at higher levels of diversification (fourth and fifth quintile). Thisis true for all of the five macroregions, and seems to hint that local state ca-pacity is crucial to consolidate the policy e↵ort implemented by the FederalUnion. Support and integrative policies that increase technical know-howand management skills of local administrations should remain high on theBrazilian agenda.
Higher levels of female empowerment also significantly improve the con-version rates throughout the country in education, employment and well-being. The e↵ect on employment is more common in the Southern part ofthe country, though. Despite of some catching-up among those contexts inwhich average female empowerment is low, the programme tends to deliverhigher rates of return in those contexts, in which women are more empow-ered. This seems to suggest that supportive policies for promoting femaleempowerment might significantly increase the rates of return to Bolsa Fa-milia.
Municipalities where natural resources are present seem to have a com-parative advantage for the conversion of Bolsa Familia into achievements.Especially the presence of petroleum is associated to higher conversion rates,probably because of greater amounts of funds available for education andother complementary public policies. Having petroleum, or all three nat-
39
ural resources considered (water, petroleum and minerals) is associated tobetter conversion in education, well-being and employment. In few cases,municipalities without any resources also have positive conversion rates ineducation (Acre, Bahia), employment (Mato Grosso, Sao Paolo and RioGrande do Sul) and well-being (Acre, Bahia and Parana).80
These findings require further testing in particular the comparison acrosstime should eliminate doubts about the e↵ect of Bolsa Familia. In futureanalyses, I would like to run additional regressions to identify the linearand non-linear patterns with which contextual characteristics a↵ect startingpositions (intercepts obtained from the multilevel estimates) and conversionrates (slopes obtained from the multilevel estimates). It could further beinteresting to detect the exact threshold levels of public income diversifica-tion and of female empowerment at which the positive e↵ects on conversionrates start.81
In a final remark I would like to suggest minor improvements to the dataquality of the CadUnico dataset: namely a change to the Decree 6.135/07,which is currently regulating the collection of information present in thesingle registry. According to my view, a change from the current rule thatany of a group of variables needs to be updated in order for the observationto result as updated, to a more restrictive implementation — that all of thecrucial variables have to be updated in order for the observation to resultas updated in general — is needed.
Such a change would reassure researchers that investigate the datasetsand could most probably trigger a greater use of this extensive data source.The Ministry of Social Development would directly benefit from advancedresearch on the dataset in terms of informational detail for complementarypolicies to the actual social policy package. It is unlikely that such a changewould have drastical implications for the costs and burdens of data collec-tion, as the number of variables collected is limited and the dataset alreadyseems to perform pretty well in this sense. However a change in the decreewould swipe away doubts about the quality of the CadUnico for researchpurpose and would therefore make it a more important informational re-source for future social policy designs.
80The recent change in the redistributive system that will guarantee greater compensa-tion to non-producing municipalities therefore seems to be appropriate in order to facilitatethe catching-up process of context that are not endowed with natural resources.
81Furthermore, a sub-group analysis could provide greater detail as to which contextualfeatures are relevant for the conversion of whom, and whether some groups tend to bemarginalized in certain contexts more than others.
40
References
[1] Tony Addison et al.Making adjustment work for the poor: a frameworkfor policy reform in Africa. Tech. rep. World Bank, 1990.
[2] Tony Addison et al. The Chronic Poverty Report 2008/09: EscapingPoverty Traps. 2008.
[3] Jeremy J Albright and Dani M Marinova. “Estimating multilevel mod-els using SPSS, Stata, SAS, and R”. In: Information Technology Ser-vices, Indiana University (http://www. indiana. edu/˜ statmath/stat/all/hlm/)(2010).
[4] Costas Azariadis and John Stachurski. “Poverty traps”. In: Handbookof economic growth 1 (2005), pp. 295–384.
[5] Christopher B Barrett, Mesfin Bezuneh, and Abdillahi Aboud. “In-come diversification, poverty traps and policy shocks in Cote dIvoireand Kenya”. In: Food Policy 26.4 (2001), pp. 367–384.
[6] Armando Barrientos. “The rise of social assistance in Brazil”. In: De-velopment and Change (2013).
[7] Ricardo Paes de Barros, Ricardo Henriques, and Rosane Mendonca.A estabilidade inaceitavel: desigualdade e pobreza no Brasil. Vol. 800.Ipea, 2001.
[8] Ricardo Paes de Barros et al. A queda recente da desigualdade de rendano Brasil. Vol. 1258. Ipea, 2007.
[9] Timothy Besley and Torsten Persson. Pillars of prosperity: The po-litical economics of development clusters. Princeton University Press,2011.
[10] Nancy Birdsall, Nora Lustig, and Darryl McLeod. “Declining inequal-ity in Latin America: some economics, some politics”. In: Center forGlobal Development Working Paper 251 (2011).
[11] Samuel Bowles, Steven N Durlauf, and Karla Ho↵. Poverty traps.Princeton University Press, 2006.
[12] Alan de Brauw et al. “The Impact of Bolsa Famlia onWomens Decision-Making Power”. In: World Development 0 (2013), pp. –. issn: 0305-750X. doi: http://dx.doi.org/10.1016/j.worlddev.2013.02.003.url: http://www.sciencedirect.com/science/article/pii/S0305750X13000491.
[13] Michael R Carter and Christopher B Barrett. “The economics of povertytraps and persistent poverty: An asset-based approach”. In: The Jour-nal of Development Studies 42.2 (2006), pp. 178–199.
41
[14] Simone Cecchini and Aldo Madariaga. Programas de transferenciascondicionadas: balance de la experiencia reciente en America Latina yel Caribe. Naciones Unidas, comision Economica para America Latinay el Caribe, CEPAL, 2011.
[15] Enrica Chiappero Martinetti and Nadia von Jacobi. “Light and Shadeof Multidimensional Indexes: How Methodological Choices Impact onEmpirical Results”. In: Quality of life in Italy: Research and Reflec-tions. Social Indicators Research Series 48. Springer Science+BusinessMedia, 2012. Chap. 5.
[16] Enrica Chiappero-Martinetti and Paola Salardi. Well-being processand conversion factors: an estimation. Working Paper Series 3. HumanDevelopment, Capability and Poverty International Research Centre,2008. url: http://www.iusspavia.it/centri.php?id=20&sez=4.
[17] Lia Chitolina, Miguel Nathan Foguel, and Naercio Menezes-Filho.“The Impact of the Expansion of the Bolsa Famılia Program on theTime Allocation of Youths and Labor Supply of Adults”. In: (2012).
[18] Flavio Comim, Rie Tsutsumi, and Angels Varea. “Choosing sustain-able consumption: a capability perspective on indicators”. In: Journalof International Development 19.4 (2007), pp. 493–509. url: http://ideas.repec.org/a/wly/jintdv/v19y2007i4p493-509.html.
[19] Alain De Janvry, Frederico Finan, and Elisabeth Sadoulet. “Evaluat-ing Brazils Bolsa Escola program: Impact on schooling and municipalroles”. In: University of California, Berkeley (2006).
[20] Jared Diamond. Guns, Germs and Steel: The Fates of Human Soci-eties. New York and London: W.W. Norton and Company, 1997.
[21] William Easterly and Ross Levine. “Tropics, germs, and crops: how en-dowments influence economic development”. In: Journal of MonetaryEconomics 50.1 (2003), pp. 3–39.
[22] Stanley L. Engerman and Keneth L. Sokolo↵. “Factor Endowments,Inequality, and Paths of Development among New World Economies”.In: Economia 3.1 (2002), pp. 41–109.
[23] Francisco Ferreira, Phillippe Leite, and Julie A Litchfield. “The riseand fall of Brazilian inequality, 1981-2004”. In: World Bank PolicyResearch Working Paper 3867 (2006).
[24] Andrea R Ferro, Ana Lucia Kassouf, and Deborah Levison. “The im-pact of conditional cash transfer programs on household work decisionsin Brazil”. In: Research in Labor Economics 31 (2010), pp. 193–218.
[25] Ariel Fiszbein, Norbert Rudiger Schady, and Francisco HG Ferreira.Conditional cash transfers: reducing present and future poverty. WorldBank Publications, 2009.
42
[26] John Luke Gallup, Je↵rey Sachs, and Andrew D. Mellinger. “Geogra-phy and Economic Development”. In: International Regional ScienceReview 22.2 (1999), pp. 179–232.
[27] Paul Glewwe and Ana Lucia Kassouf. The Impact of the Bolsa Es-cola/Familia Conditional Cash Transfer Program on enrollment, dropout rates and grade promotion in Brazil. Tech. rep. 2010.
[28] Leonardo Grilli and Carla Rampichini. “The role of sample clustermeans in multilevel models: A view on endogeneity and measurementerror issues.” In: Methodology: European Journal of Research Methodsfor the Behavioral and Social Sciences 7.4 (2011), p. 121.
[29] Monica A Haddad. “Bolsa Famılia and the needy: is allocation con-tributing to equity in Brazil?” In: Journal of International Develop-ment 20.5 (2008), pp. 654–669.
[30] Steven M Helfand, Rudi Rocha, and Henrique EF Vinhais. “Pobreza edesigualdade de renda no Brasil rural: uma analise da queda recente”.In: Pesquisa e planejamento economico 39.1 (2009), pp. 59–80.
[31] Sean Higgins. “The Impact of Bolsa Famılia on Poverty: Does BrazilsConditional Cash Transfer Program Have a Rural Bias?” In: Journalof Politics and Society 23.1 (2012), pp. 88–125.
[32] Sean Higgins and Claudiney Pereira. “The e↵ects of Brazils high tax-ation and social spending on the distribution of household income”.In: Public Finance Review, forthcoming (2013).
[33] How to get children out of jobs and into school: the limits of Brazilsmuch admired and emulated anti- poverty programme. 2010. url: http://www.economist.com/node/16690887/print.
[34] Joop Hox. Multilevel Analysis: Techniques and Applications. Taylor &Francis, 2002.
[35] Nanak Kakwani, Marcelo Cortes Neri, and Hyun H Son. Pro-poorgrowth and social programmes in Brazil. Fundacao Getulio Vargas,2006.
[36] Wiebke Kuklys. Amartya Sen’s Capability Approach: Theoretical In-sights and Empirical Applications. Berlin Heidelberg New York: Springer,2005.
[37] Kathy Lindert et al. “The nuts and bolts of Brazils Bolsa Famıliaprogram: implementing conditional cash transfers in a decentralizedcontext”. In: Washington, DC, World Bank. SP Discussion Paper 709(2007).
[38] Ana Flavia Machado et al. Bolsa Familia as Seen Through the Lens ofthe Decent Work Agenda. Tech. rep. One Pager, International PolicyCentre for Inclusive Growth.
43
[39] James G. March and Johan P. Olsen. “The New Institutionalism”. In:Oxford Handbook of Political Institutions. Ed. by S. Binder, R. Rhodes,and B. Rockman. Oxford, UK: Oxford University Press, 2006. Chap. 1.
[40] Je↵rey D. Moreno↵, Robert J. Sampson, and Stephen W. Rauden-bush. “Neighborhood Inequality, Collective E�cacy, and the SpatialDynamics of Urban Violence”. In: Criminology 39.3 (2001), pp. 517–558. issn: 1745-9125. doi: 10.1111/j.1745-9125.2001.tb00932.x.url: http://dx.doi.org/10.1111/j.1745-9125.2001.tb00932.x.
[41] Raul da Mota Silveira Neto. “Impacto do programa bolsa famıliasobre a frequencia a escola: estimativas a partir de informacoes dapesquisa nacional por amostra de domicılio (PNAD)”. In: GovernoFederal (2010), p. 53.
[42] Douglass C. North. Institutions, Institutional Change, and EconomicPerformance. Cambridge: Cambridge University Press, 1990.
[43] AMHC Oliveira et al. “Primeiros resultados da analise da linha de baseda Pesquisa de Avaliacao de Impacto do Programa Bolsa Familia”.In: Vaitsman J, Paes-Sousa R, organizadores. Avaliacao de polıticase programas do MDS: resultados 2 (2007).
[44] Rafael Guerreiro Osorio and Pedro HG Ferreira de Souza. Bolsa Famıliaafter Brasil Carinhoso: an Analysis of the Potential for Reducing Ex-treme Poverty. Tech. rep. International Policy Centre for InclusiveGrowth, 2013.
[45] Lant Pritchett. “Folk and the Formula - Pathways to Capable States”.2012. url: http://www.youtube.com/watch?v=eItoIlv1lvo.
[46] Sophia Rabe-Hesketh and Anders Skrondal. Multilevel and longitudi-nal modelling using Stata. STATA press, Third Edition, 2012.
[47] Davide Rasella et al. “E↵ect of a conditional cash transfer programmeon childhood mortality: a nationwide analysis of Brazilian municipal-ities”. In: The Lancet (2013).
[48] S.W. Raudenbush and A.S. Bryk. Hierarchical Linear Models. Thou-sand Oaks, Calif.: Sage, 2002.
[49] Laura B. Rawlings and Gloria M. Rubio. “Evaluating the Impact ofConditional Cash Transfer Programs”. In: The World Bank ResearchObserver 20.1 (2005), pp. 29–55. doi: 10.1093/wbro/lki001. eprint:http://wbro.oxfordjournals.org/content/20/1/29.full.pdf+
html. url: http://wbro.oxfordjournals.org/content/20/1/29.abstract.
[50] Mauricio Reis. “Cash transfer programs and child health in Brazil”.In: Economics Letters 108.1 (2010), pp. 22 –25. issn: 0165-1765. doi:http://dx.doi.org/10.1016/j.econlet.2010.04.009. url: http://www.sciencedirect.com/science/article/pii/S0165176510001266.
44
[51] Anne Caroline Costa Resende and Ana Maria Hermeto Camilo deOliveira. “Avaliando resultados de um programa de transferencia derenda: o impacto do bolsa-escola sobre os gastos das famılias brasileiras”.In: Estudos Economicos (Sao Paulo) 38.2 (2008), pp. 235–265.
[52] R. A. W. Rhodes, Sarah Binder, and Bert A. Rockman, eds. The Ox-ford Handbook of Political Institutions. Oxford, UK: Oxford UniversityPress, 2006.
[53] Bryan Roberts. From Universalism to Targeting and Back Again: Con-ditional Cash Transfers and the Development of Social Citizenship.Tech. rep. International Policy Centre for Inclusive Growth, 2012.
[54] Ingrid Robeyns. “Valuing Freedoms: Sen’s Capability Approach andPoverty Reduction”. In: Economics and Philosophy 19.02 (2003), pp. 371–377. url: http://ideas.repec.org/a/cup/ecnphi/v19y2003i02p371-377_23.html.
[55] Juan Esteban Saavedra and Sandra Garcıa. Impacts of ConditionalCash Transfer Programs on Educational Outcomes in Developing Coun-tries: A Meta-analysis. Tech. rep. Working Paper no. WR-921-1, RANDCorporation, February, 2012.
[56] Je↵rey Sachs. “Institutions matter but not for everything”. In: Financeand Development (2003), pp. 38–41.
[57] Je↵rey Sachs. The end of poverty: How we can make it happen in ourlifetime. Penguin UK, 2005.
[58] Je↵rey Sachs, Andrew D. Mellinger, and John Luke Gallup. “TheGeography of Poverty and Wealth”. In: Scientific American (2001),pp. 71–5.
[59] Robert J. Sampson. “How does community context matter? Socialmechanisms and the explanation of crime rates”. In: The Explanationof Crime: Context, Mechanisms, and Development. Ed. by Robert J.Sampson and P. Wikstroem. Cambridge University Press, 2006.
[60] Rogerio Bianchi Santarrosa. “Impacto das transferencias condicionadasde renda sobre a proficiencia dos alunos do ensino fundamental noBrasil”. In: (2011).
[61] Abu Elias Sarker. “New public management in developing countries:an analysis of success and failure with particular reference to Sin-gapore and Bangladesh”. In: International Journal of Public SectorManagement 19.2 (2006), pp. 180–203.
[62] Amartya Sen. Commodities and capabilities. Professor Doctor P. Hen-nipman lectures in economics. Amsterdam: North-Holland, 1985. url:http://gso.gbv.de/DB=2.1/CMD?ACT=SRCHA\&SRT=YOP\&IKT=
1016\&TRM=ppn+024877905\&sourceid=fbw_bibsonomy.
45
[63] Amartya Sen. Development as Freedom. Oxford, UK: Oxford Univer-sity Press, 1999.
[64] Amartya Sen. The idea of justice. London, UK: Allen Lane, 2009.
[65] Amartya Sen. The Standard of Living Cambridge. Cambridge: Cam-bridge University Press, 1987.
[66] Armando Amorim Simoes. “The contribution of Bolsa Familia to theeducational achievement of economically disadvantaged children inBrazil”. University of Sussex, 2012.
[67] Alice Sindzingre. “Poverty traps: a perspective from development eco-nomics”. In: Paris, University Paris 10 (2007), pp. 2007–26.
[68] T.A. Snijders and R.J. Bosker. Multilevel analysis: An introduction tobasic and advanced multilevel modeling. London: Sage, 1999.
[69] Fabio Veras Soares, Rafael Perez Ribas, and Rafael Guerreiro Osorio.“Evaluating the Impact of Brazil’s Bolsa Famılia: Cash Transfer Pro-grams in Comparative Perspective”. In: Latin American Research Re-view 45.2 (2010), pp. 173–190.
[70] Fabio Veras Soares et al. Programas de transferencia de renda noBrasil: impactos sobre a desigualdade. 1228. IPEA, Instituto de PesquisaEconomica Aplicada, 2006.
[71] Sergei Soares and Natalia Satyro. O programa bolsa famılia: desenhoinstitucional, impactos e possibilidades futuras. Ipea Brasılia, 2009.
[72] Sergei Soares et al. “Conditional cash transfers in Brazil, Chile andMexico: impacts upon inequality”. In: Estudios economicos 1 (2009),pp. 207–224.
[73] Sergei Soares et al. Programas de transferencia condicionada de rendano Brasil, Chile e Mexico: impactos sobre a desigualdade. 1293. IPEA,Instituto de Pesquisa Economica Aplicada, 2007.
[74] Sergei Suarez Dillon Soares. Bolsa Famılia, its design, its impacts andpossibilities for the future. Tech. rep. Working Paper, InternationalPolicy Centre for Inclusive Growth, 2012.
[75] Pedro HG de Souza. Poverty, inequality and social policies in Brazil,1995-2009. Tech. rep. Working Paper, International Policy Centre forInclusive Growth, 2012.
[76] Frances Stewart et al. “Alternative macro policies, meso policies, andvulnerable groups”. In:Adjusment with a Human FACE. Vol. 1. Claren-don Press, 1987.
[77] Natasha Borges Sugiyama. Di↵usion of Good Government: Social Sec-tor Reforms in Brazil. South Bend: University of Notre Dame Press,2012.
46
[78] Priscilla Albuquerque Tavares. “Efeito do Programa Bolsa Famılia so-bre a oferta de trabalho das maes”. In: ENCONTRO NACIONAL DEECONOMIA 36 (2008).
[79] Clarissa Gondim Teixeira. A heterogeneity analysis of the Bolsa FamıliaProgramme e↵ect on men and women’s work supply. Tech. rep. Work-ing Paper, International Policy Centre for Inclusive Growth, 2010.
[80] Michael J Trebilcock and Mariana Mota Prado. What makes poorcountries poor?: institutional determinants of development. EdwardElgar Publishing, 2011.
[81] L.M. Videro Vieira Santos. Bolsa Familia Programme: Economic andSocial Impacts under the Perspective of the Capabilities Approach.Tech. rep. University of London, 2010.
47
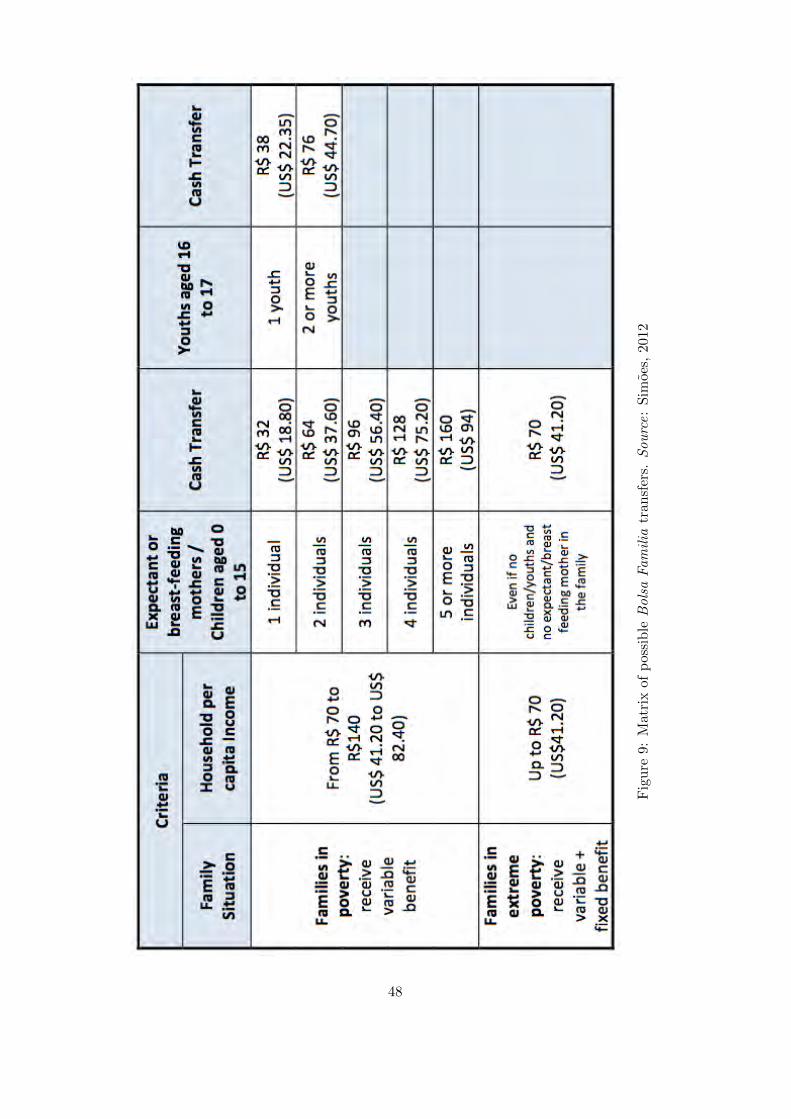
Figure
9:Matrixof
possible
Bolsa
Fam
ilia
tran
sfers.
Sou
rce:Sim
oes,
2012
48
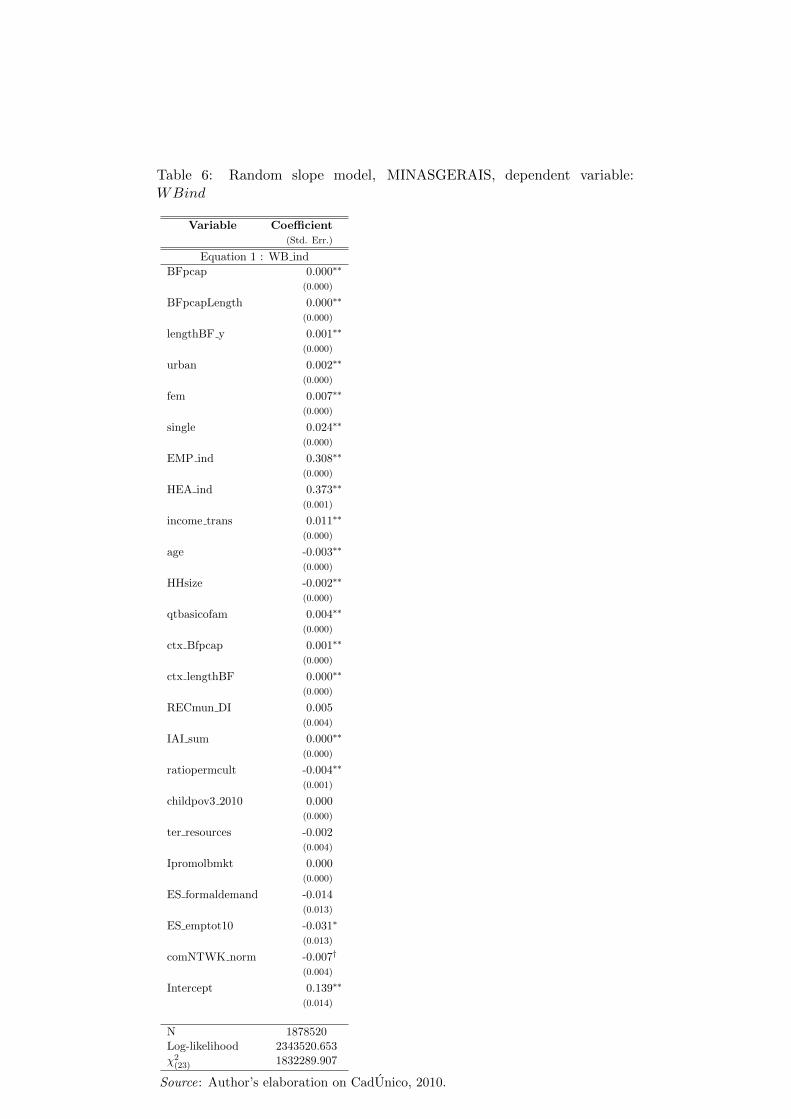
Table 6: Random slope model, MINASGERAIS, dependent variable:WBind
Variable Coe�cient(Std. Err.)
Equation 1 : WB indBFpcap 0.000⇤⇤
(0.000)
BFpcapLength 0.000⇤⇤
(0.000)
lengthBF y 0.001⇤⇤
(0.000)
urban 0.002⇤⇤
(0.000)
fem 0.007⇤⇤
(0.000)
single 0.024⇤⇤
(0.000)
EMP ind 0.308⇤⇤
(0.000)
HEA ind 0.373⇤⇤
(0.001)
income trans 0.011⇤⇤
(0.000)
age -0.003⇤⇤
(0.000)
HHsize -0.002⇤⇤
(0.000)
qtbasicofam 0.004⇤⇤
(0.000)
ctx Bfpcap 0.001⇤⇤
(0.000)
ctx lengthBF 0.000⇤⇤
(0.000)
RECmun DI 0.005(0.004)
IAI sum 0.000⇤⇤
(0.000)
ratiopermcult -0.004⇤⇤
(0.001)
childpov3 2010 0.000(0.000)
ter resources -0.002(0.004)
Ipromolbmkt 0.000(0.000)
ES formaldemand -0.014(0.013)
ES emptot10 -0.031⇤
(0.013)
comNTWK norm -0.007†
(0.004)
Intercept 0.139⇤⇤
(0.014)
N 1878520Log-likelihood 2343520.653�2(23) 1832289.907
Source: Author’s elaboration on CadUnico, 2010.
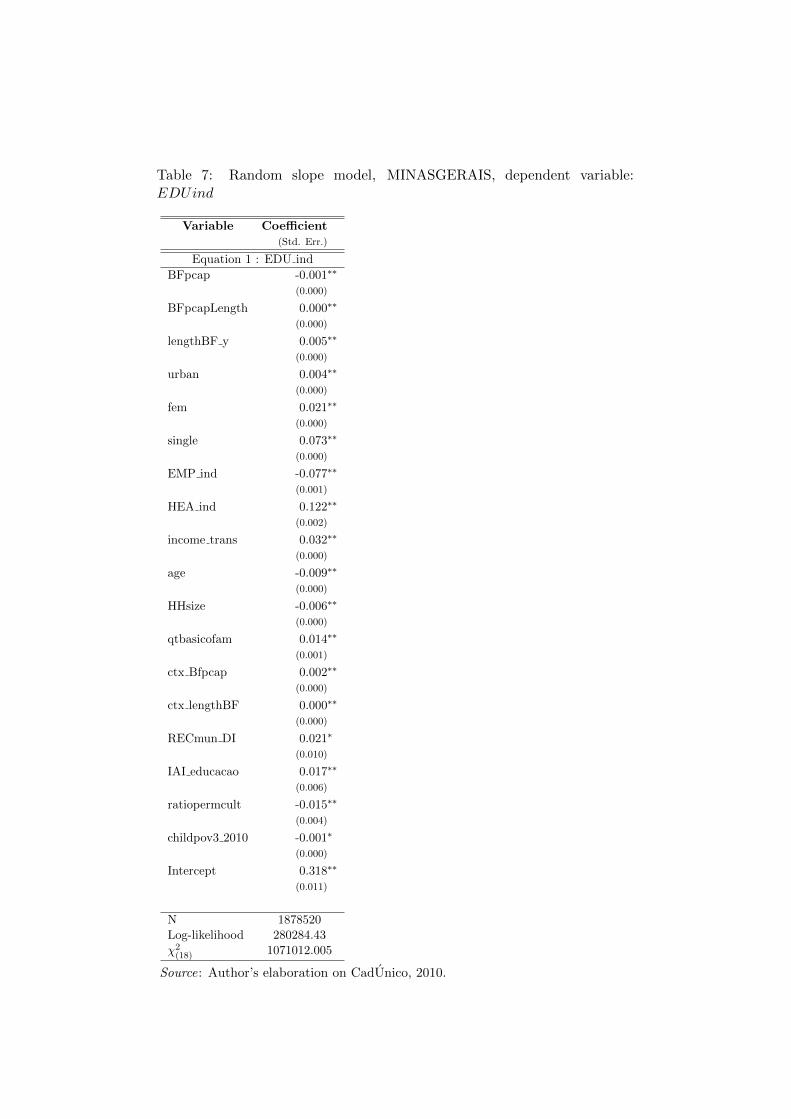
Table 7: Random slope model, MINASGERAIS, dependent variable:EDUind
Variable Coe�cient(Std. Err.)
Equation 1 : EDU indBFpcap -0.001⇤⇤
(0.000)
BFpcapLength 0.000⇤⇤
(0.000)
lengthBF y 0.005⇤⇤
(0.000)
urban 0.004⇤⇤
(0.000)
fem 0.021⇤⇤
(0.000)
single 0.073⇤⇤
(0.000)
EMP ind -0.077⇤⇤
(0.001)
HEA ind 0.122⇤⇤
(0.002)
income trans 0.032⇤⇤
(0.000)
age -0.009⇤⇤
(0.000)
HHsize -0.006⇤⇤
(0.000)
qtbasicofam 0.014⇤⇤
(0.001)
ctx Bfpcap 0.002⇤⇤
(0.000)
ctx lengthBF 0.000⇤⇤
(0.000)
RECmun DI 0.021⇤
(0.010)
IAI educacao 0.017⇤⇤
(0.006)
ratiopermcult -0.015⇤⇤
(0.004)
childpov3 2010 -0.001⇤
(0.000)
Intercept 0.318⇤⇤
(0.011)
N 1878520Log-likelihood 280284.43�2(18) 1071012.005
Source: Author’s elaboration on CadUnico, 2010.
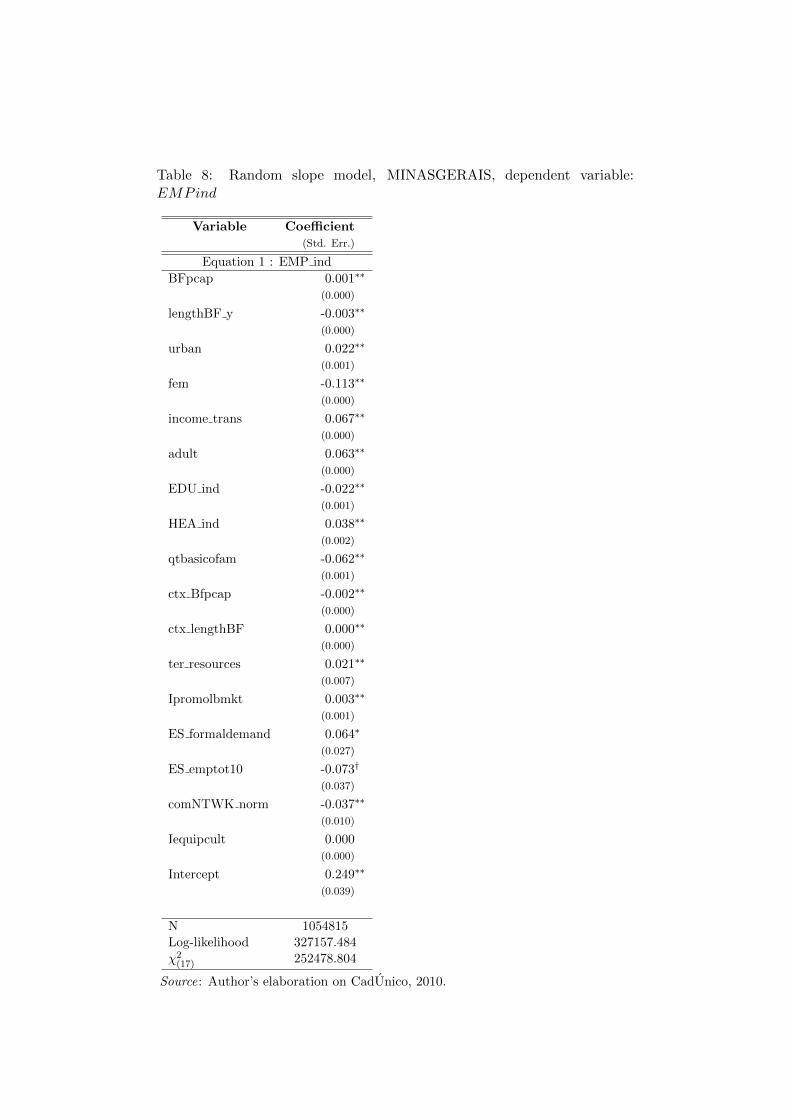
Table 8: Random slope model, MINASGERAIS, dependent variable:EMPind
Variable Coe�cient(Std. Err.)
Equation 1 : EMP indBFpcap 0.001⇤⇤
(0.000)
lengthBF y -0.003⇤⇤
(0.000)
urban 0.022⇤⇤
(0.001)
fem -0.113⇤⇤
(0.000)
income trans 0.067⇤⇤
(0.000)
adult 0.063⇤⇤
(0.000)
EDU ind -0.022⇤⇤
(0.001)
HEA ind 0.038⇤⇤
(0.002)
qtbasicofam -0.062⇤⇤
(0.001)
ctx Bfpcap -0.002⇤⇤
(0.000)
ctx lengthBF 0.000⇤⇤
(0.000)
ter resources 0.021⇤⇤
(0.007)
Ipromolbmkt 0.003⇤⇤
(0.001)
ES formaldemand 0.064⇤
(0.027)
ES emptot10 -0.073†
(0.037)
comNTWK norm -0.037⇤⇤
(0.010)
Iequipcult 0.000(0.000)
Intercept 0.249⇤⇤
(0.039)
N 1054815Log-likelihood 327157.484�2(17) 252478.804
Source: Author’s elaboration on CadUnico, 2010.
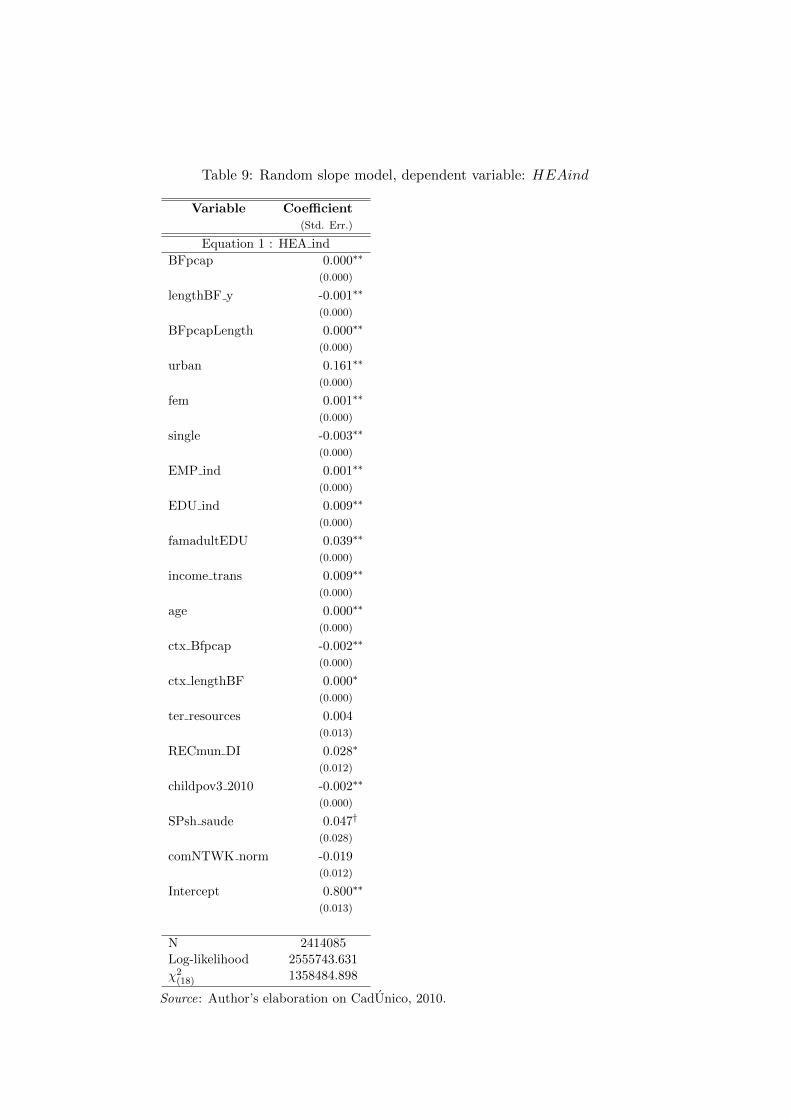
Table 9: Random slope model, dependent variable: HEAind
Variable Coe�cient(Std. Err.)
Equation 1 : HEA indBFpcap 0.000⇤⇤
(0.000)
lengthBF y -0.001⇤⇤
(0.000)
BFpcapLength 0.000⇤⇤
(0.000)
urban 0.161⇤⇤
(0.000)
fem 0.001⇤⇤
(0.000)
single -0.003⇤⇤
(0.000)
EMP ind 0.001⇤⇤
(0.000)
EDU ind 0.009⇤⇤
(0.000)
famadultEDU 0.039⇤⇤
(0.000)
income trans 0.009⇤⇤
(0.000)
age 0.000⇤⇤
(0.000)
ctx Bfpcap -0.002⇤⇤
(0.000)
ctx lengthBF 0.000⇤
(0.000)
ter resources 0.004(0.013)
RECmun DI 0.028⇤
(0.012)
childpov3 2010 -0.002⇤⇤
(0.000)
SPsh saude 0.047†
(0.028)
comNTWK norm -0.019(0.012)
Intercept 0.800⇤⇤
(0.013)
N 2414085Log-likelihood 2555743.631�2(18) 1358484.898
Source: Author’s elaboration on CadUnico, 2010.

Table 10: RSmodel with cross-level interaction, MINASGERAIS, dependentvariable: EMPind
Variable Coe�cient(Std. Err.)
Equation 1 : EMP indBFpcap 0.001⇤⇤
(0.000)
lengthBF y -0.003⇤⇤
(0.000)
BFpcapPromoLBMK 0.000⇤⇤
(0.000)
urban 0.027⇤⇤
(0.000)
fem -0.113⇤⇤
(0.000)
income trans 0.067⇤⇤
(0.000)
adult 0.071⇤⇤
(0.000)
qtbasicofam -0.061⇤⇤
(0.001)
ctx Bfpcap -0.002⇤⇤
(0.000)
ctx lengthBF 0.000⇤⇤
(0.000)
ter resources 0.032⇤⇤
(0.011)
Ipromolbmkt -0.001(0.001)
ES formaldemand 0.058⇤
(0.028)
ES emptot10 -0.082⇤
(0.038)
comNTWK norm -0.034⇤⇤
(0.010)
RECmun DI 0.005(0.011)
Intercept 0.283⇤⇤
(0.040)
N 1148416Log-likelihood 348463.13�2(16) 277226.451
Source: Author’s elaboration on CadUnico, 2010.
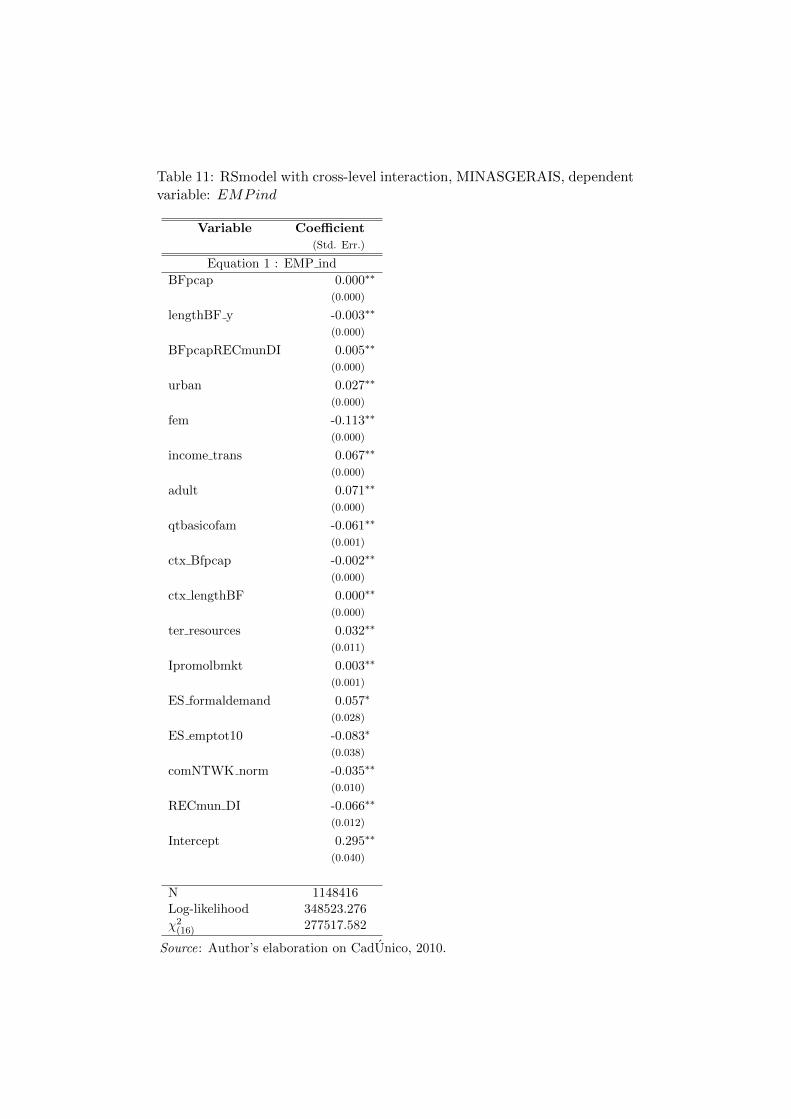
Table 11: RSmodel with cross-level interaction, MINASGERAIS, dependentvariable: EMPind
Variable Coe�cient(Std. Err.)
Equation 1 : EMP indBFpcap 0.000⇤⇤
(0.000)
lengthBF y -0.003⇤⇤
(0.000)
BFpcapRECmunDI 0.005⇤⇤
(0.000)
urban 0.027⇤⇤
(0.000)
fem -0.113⇤⇤
(0.000)
income trans 0.067⇤⇤
(0.000)
adult 0.071⇤⇤
(0.000)
qtbasicofam -0.061⇤⇤
(0.001)
ctx Bfpcap -0.002⇤⇤
(0.000)
ctx lengthBF 0.000⇤⇤
(0.000)
ter resources 0.032⇤⇤
(0.011)
Ipromolbmkt 0.003⇤⇤
(0.001)
ES formaldemand 0.057⇤
(0.028)
ES emptot10 -0.083⇤
(0.038)
comNTWK norm -0.035⇤⇤
(0.010)
RECmun DI -0.066⇤⇤
(0.012)
Intercept 0.295⇤⇤
(0.040)
N 1148416Log-likelihood 348523.276�2(16) 277517.582
Source: Author’s elaboration on CadUnico, 2010.
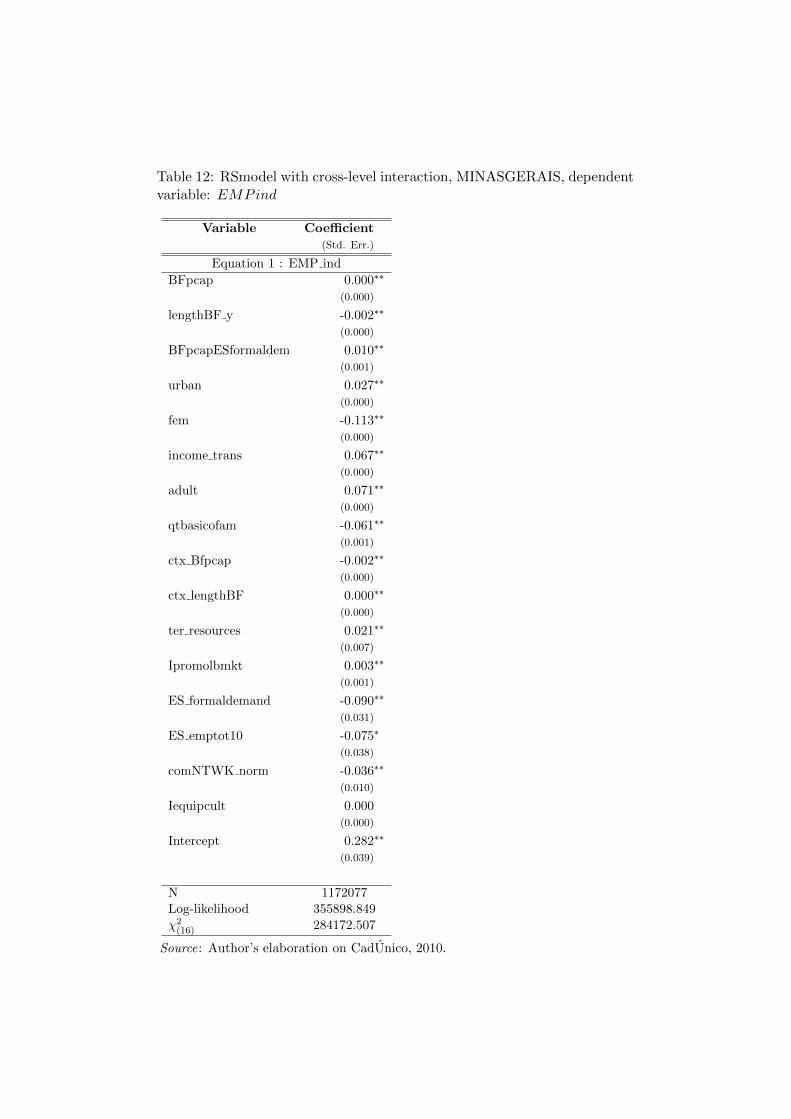
Table 12: RSmodel with cross-level interaction, MINASGERAIS, dependentvariable: EMPind
Variable Coe�cient(Std. Err.)
Equation 1 : EMP indBFpcap 0.000⇤⇤
(0.000)
lengthBF y -0.002⇤⇤
(0.000)
BFpcapESformaldem 0.010⇤⇤
(0.001)
urban 0.027⇤⇤
(0.000)
fem -0.113⇤⇤
(0.000)
income trans 0.067⇤⇤
(0.000)
adult 0.071⇤⇤
(0.000)
qtbasicofam -0.061⇤⇤
(0.001)
ctx Bfpcap -0.002⇤⇤
(0.000)
ctx lengthBF 0.000⇤⇤
(0.000)
ter resources 0.021⇤⇤
(0.007)
Ipromolbmkt 0.003⇤⇤
(0.001)
ES formaldemand -0.090⇤⇤
(0.031)
ES emptot10 -0.075⇤
(0.038)
comNTWK norm -0.036⇤⇤
(0.010)
Iequipcult 0.000(0.000)
Intercept 0.282⇤⇤
(0.039)
N 1172077Log-likelihood 355898.849�2(16) 284172.507
Source: Author’s elaboration on CadUnico, 2010.
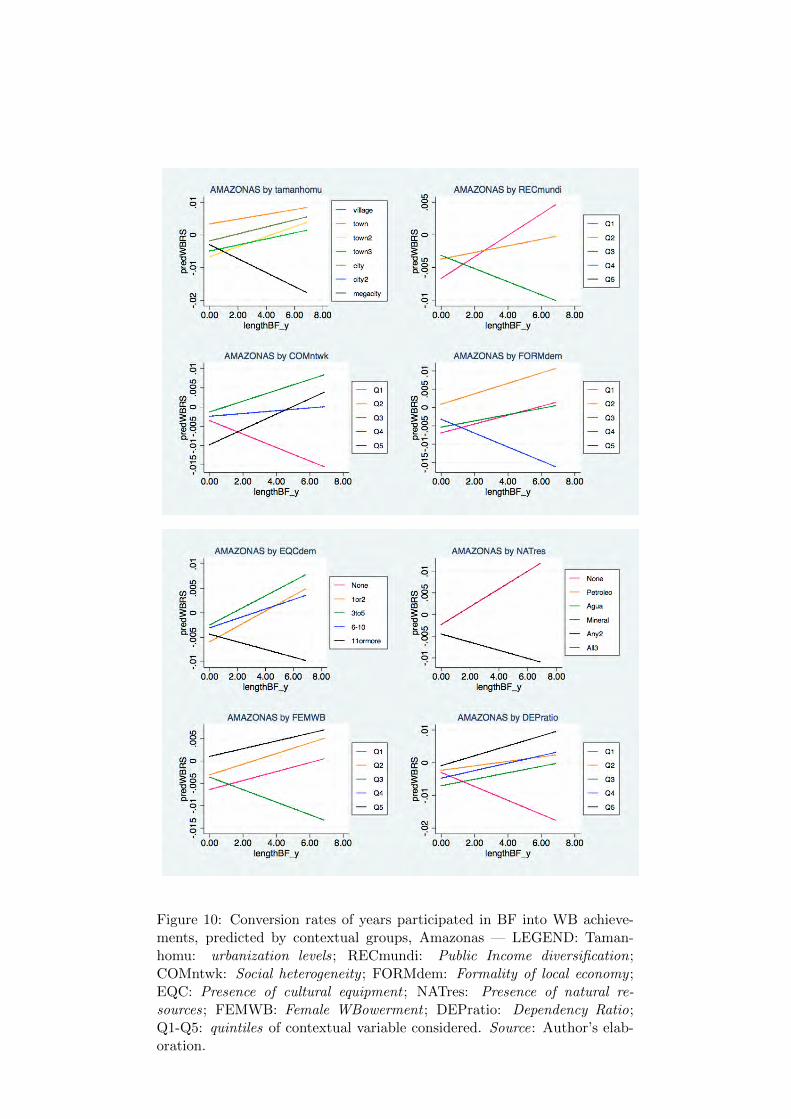
Figure 10: Conversion rates of years participated in BF into WB achieve-ments, predicted by contextual groups, Amazonas — LEGEND: Taman-homu: urbanization levels; RECmundi: Public Income diversification;COMntwk: Social heterogeneity ; FORMdem: Formality of local economy ;EQC: Presence of cultural equipment ; NATres: Presence of natural re-sources; FEMWB: Female WBowerment ; DEPratio: Dependency Ratio;Q1-Q5: quintiles of contextual variable considered. Source: Author’s elab-oration.
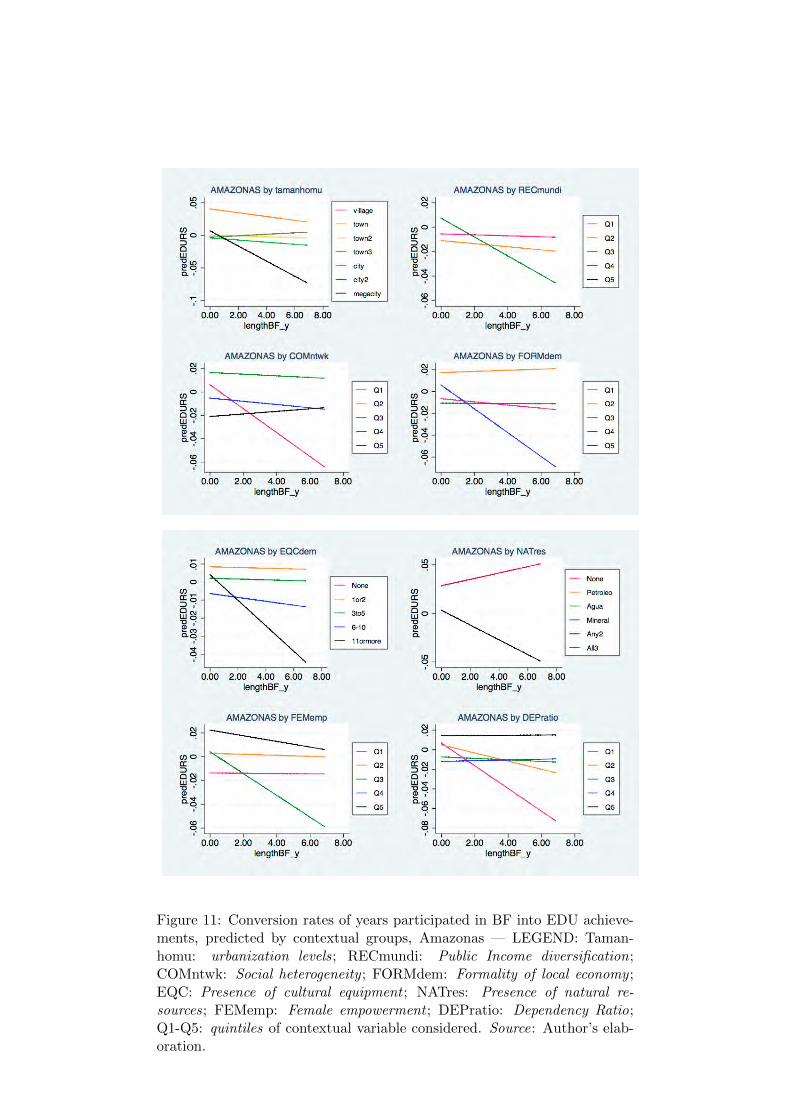
Figure 11: Conversion rates of years participated in BF into EDU achieve-ments, predicted by contextual groups, Amazonas — LEGEND: Taman-homu: urbanization levels; RECmundi: Public Income diversification;COMntwk: Social heterogeneity ; FORMdem: Formality of local economy ;EQC: Presence of cultural equipment ; NATres: Presence of natural re-sources; FEMemp: Female empowerment ; DEPratio: Dependency Ratio;Q1-Q5: quintiles of contextual variable considered. Source: Author’s elab-oration.
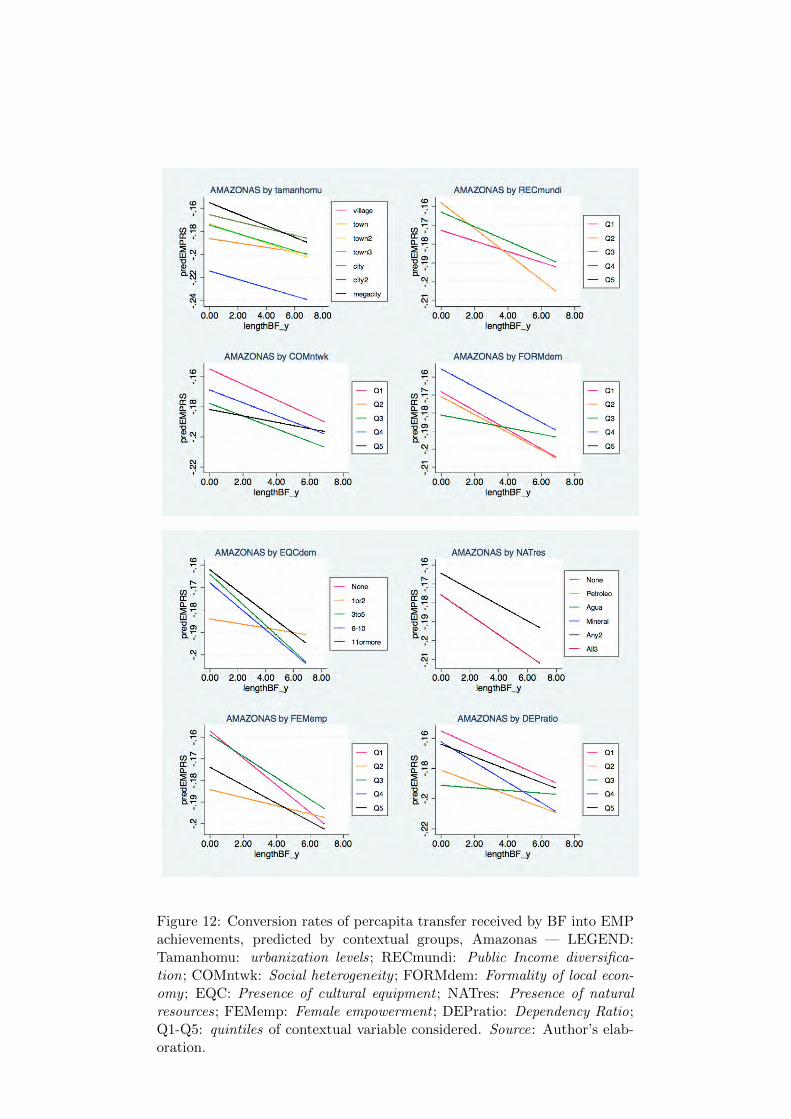
Figure 12: Conversion rates of percapita transfer received by BF into EMPachievements, predicted by contextual groups, Amazonas — LEGEND:Tamanhomu: urbanization levels; RECmundi: Public Income diversifica-tion; COMntwk: Social heterogeneity ; FORMdem: Formality of local econ-omy ; EQC: Presence of cultural equipment ; NATres: Presence of naturalresources; FEMemp: Female empowerment ; DEPratio: Dependency Ratio;Q1-Q5: quintiles of contextual variable considered. Source: Author’s elab-oration.
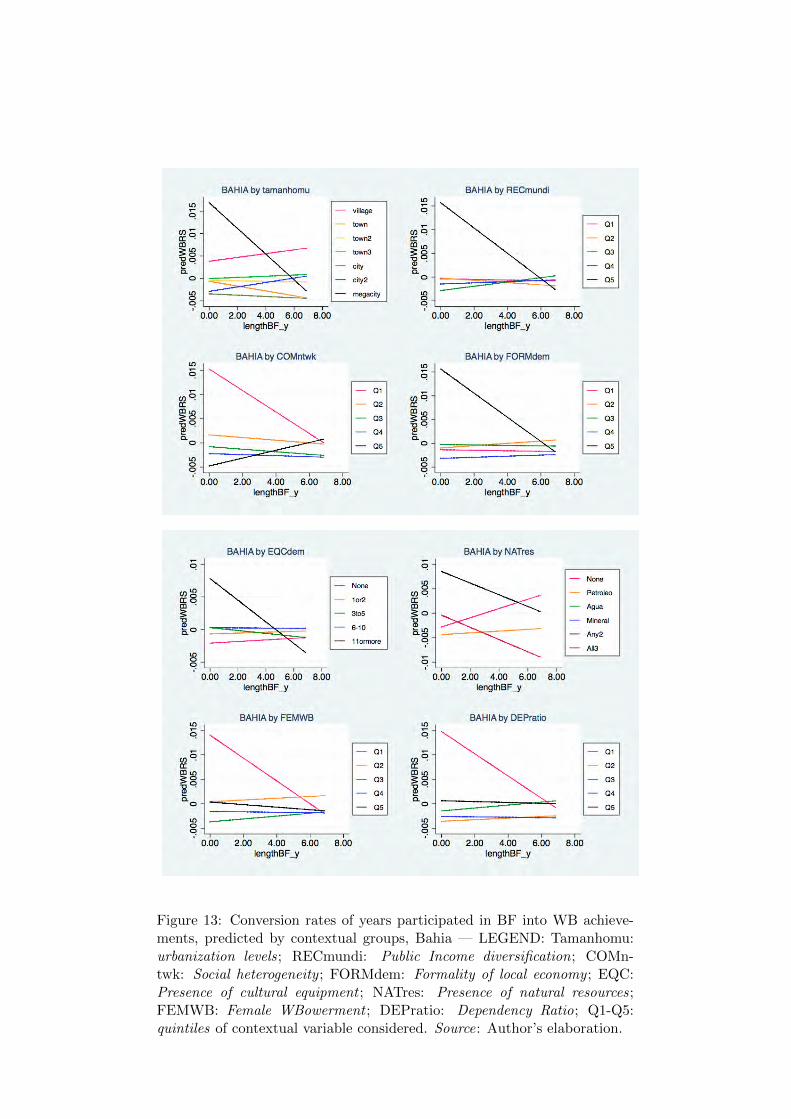
Figure 13: Conversion rates of years participated in BF into WB achieve-ments, predicted by contextual groups, Bahia — LEGEND: Tamanhomu:urbanization levels; RECmundi: Public Income diversification; COMn-twk: Social heterogeneity ; FORMdem: Formality of local economy ; EQC:Presence of cultural equipment ; NATres: Presence of natural resources;FEMWB: Female WBowerment ; DEPratio: Dependency Ratio; Q1-Q5:quintiles of contextual variable considered. Source: Author’s elaboration.
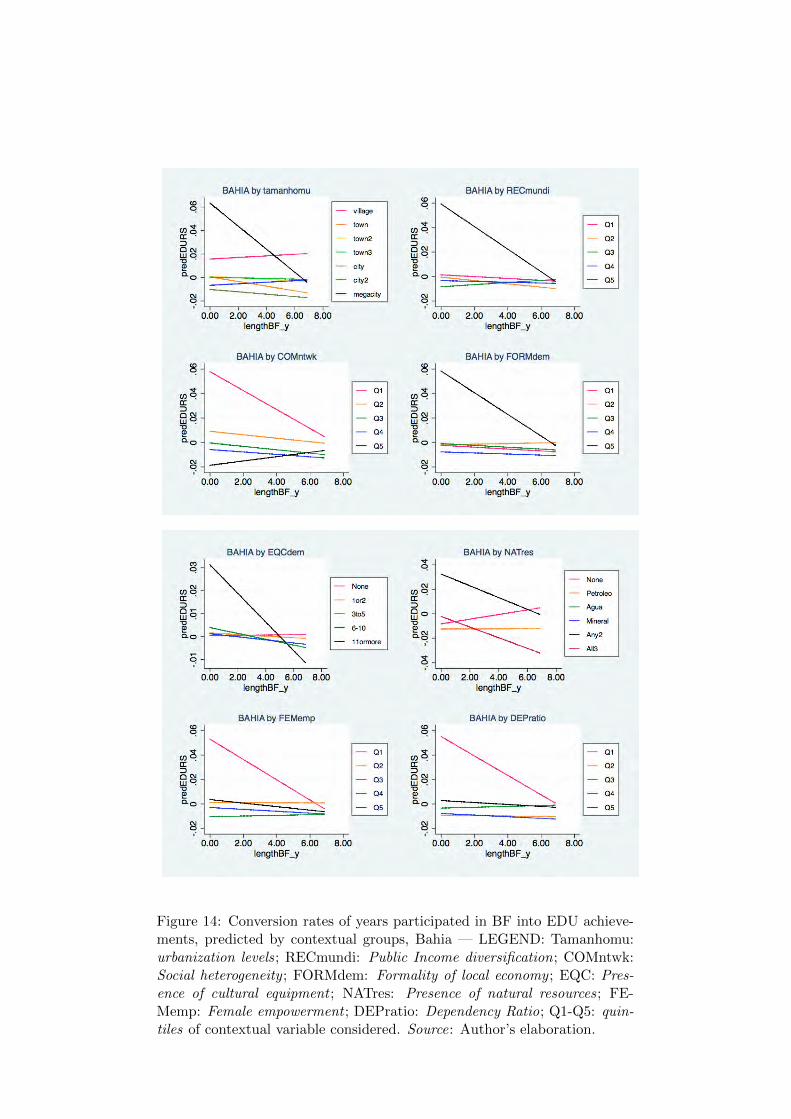
Figure 14: Conversion rates of years participated in BF into EDU achieve-ments, predicted by contextual groups, Bahia — LEGEND: Tamanhomu:urbanization levels; RECmundi: Public Income diversification; COMntwk:Social heterogeneity ; FORMdem: Formality of local economy ; EQC: Pres-ence of cultural equipment ; NATres: Presence of natural resources; FE-Memp: Female empowerment ; DEPratio: Dependency Ratio; Q1-Q5: quin-tiles of contextual variable considered. Source: Author’s elaboration.
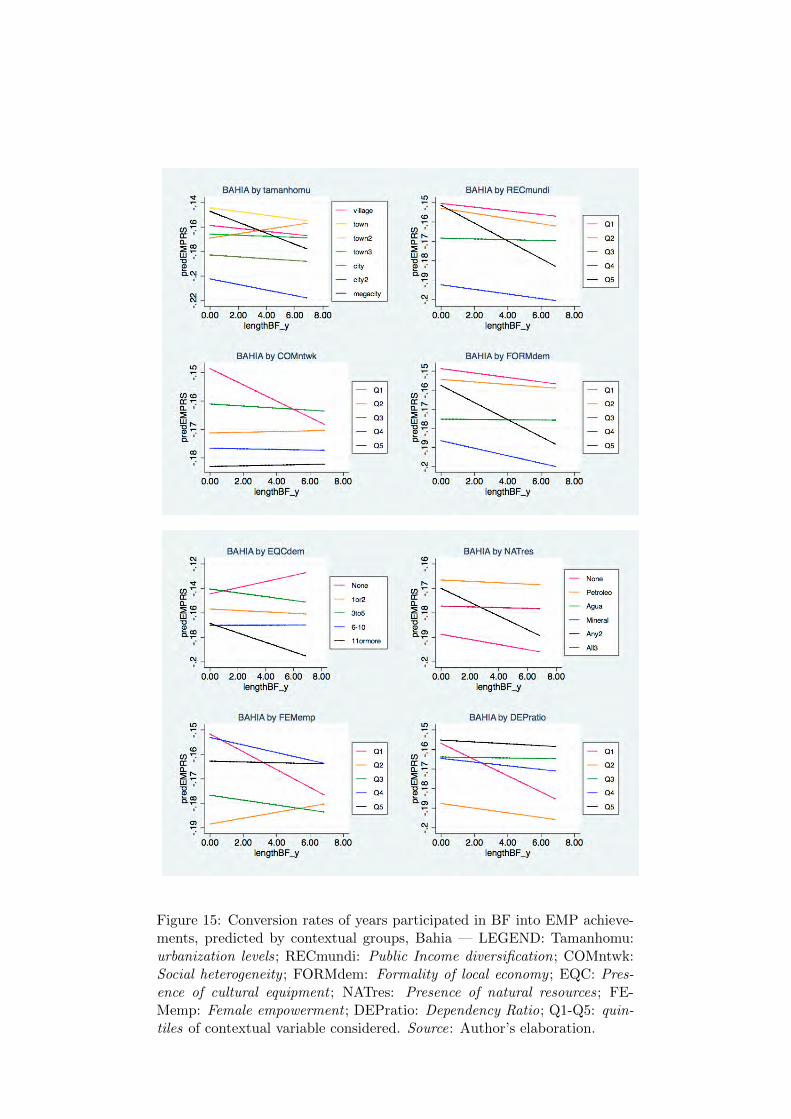
Figure 15: Conversion rates of years participated in BF into EMP achieve-ments, predicted by contextual groups, Bahia — LEGEND: Tamanhomu:urbanization levels; RECmundi: Public Income diversification; COMntwk:Social heterogeneity ; FORMdem: Formality of local economy ; EQC: Pres-ence of cultural equipment ; NATres: Presence of natural resources; FE-Memp: Female empowerment ; DEPratio: Dependency Ratio; Q1-Q5: quin-tiles of contextual variable considered. Source: Author’s elaboration.
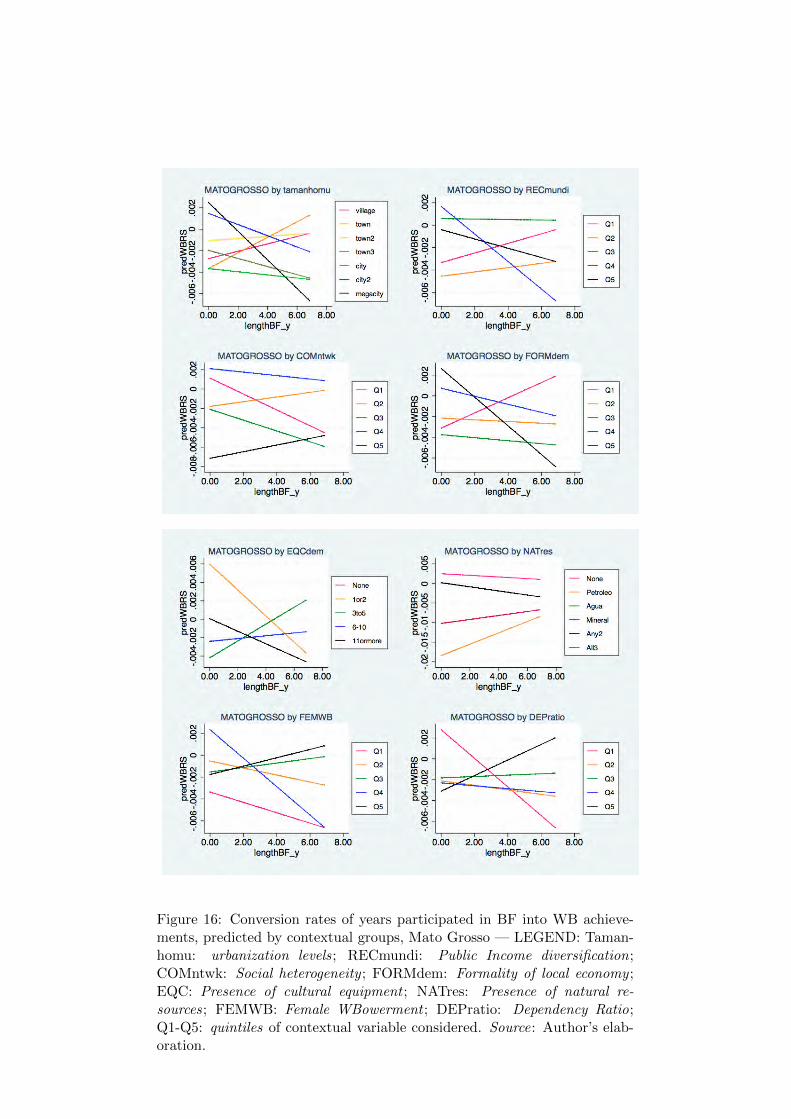
Figure 16: Conversion rates of years participated in BF into WB achieve-ments, predicted by contextual groups, Mato Grosso — LEGEND: Taman-homu: urbanization levels; RECmundi: Public Income diversification;COMntwk: Social heterogeneity ; FORMdem: Formality of local economy ;EQC: Presence of cultural equipment ; NATres: Presence of natural re-sources; FEMWB: Female WBowerment ; DEPratio: Dependency Ratio;Q1-Q5: quintiles of contextual variable considered. Source: Author’s elab-oration.
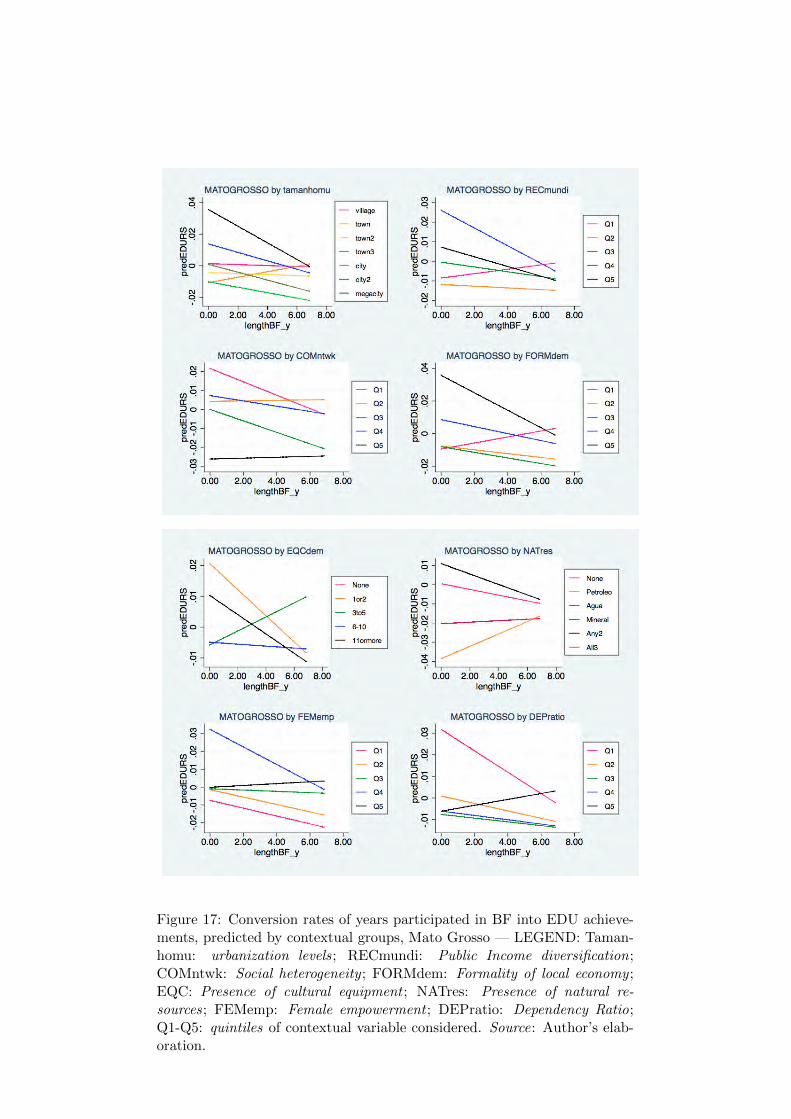
Figure 17: Conversion rates of years participated in BF into EDU achieve-ments, predicted by contextual groups, Mato Grosso — LEGEND: Taman-homu: urbanization levels; RECmundi: Public Income diversification;COMntwk: Social heterogeneity ; FORMdem: Formality of local economy ;EQC: Presence of cultural equipment ; NATres: Presence of natural re-sources; FEMemp: Female empowerment ; DEPratio: Dependency Ratio;Q1-Q5: quintiles of contextual variable considered. Source: Author’s elab-oration.
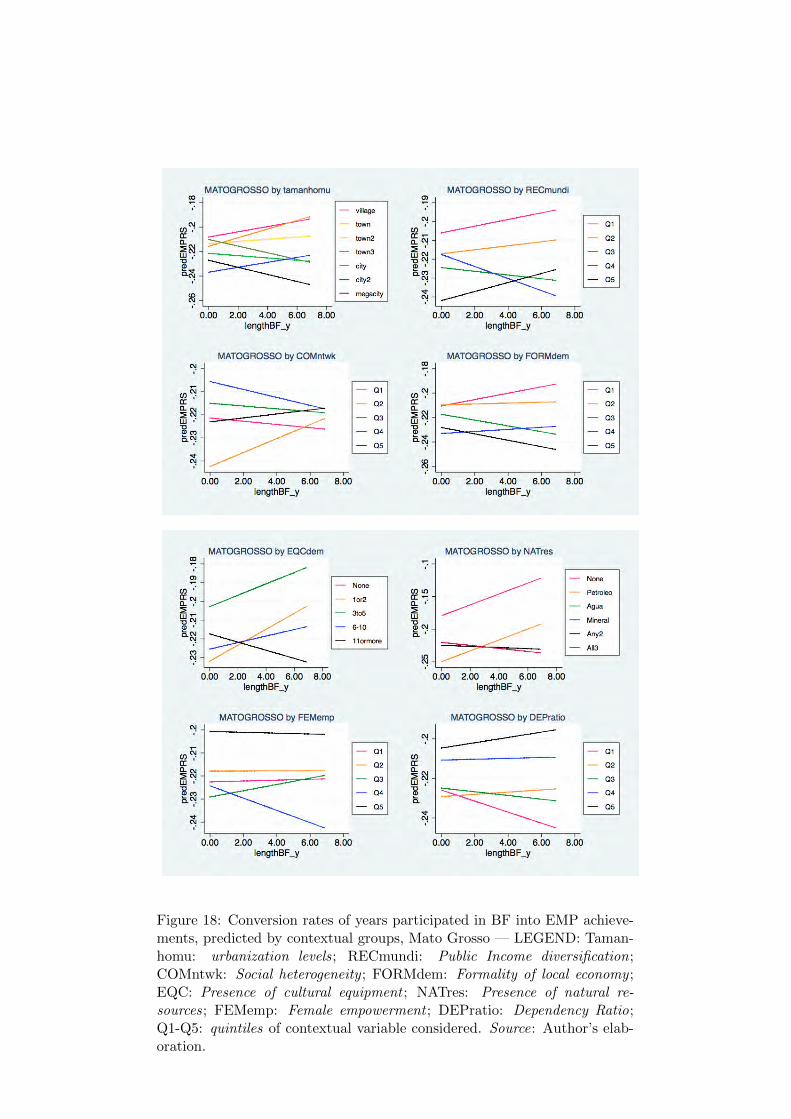
Figure 18: Conversion rates of years participated in BF into EMP achieve-ments, predicted by contextual groups, Mato Grosso — LEGEND: Taman-homu: urbanization levels; RECmundi: Public Income diversification;COMntwk: Social heterogeneity ; FORMdem: Formality of local economy ;EQC: Presence of cultural equipment ; NATres: Presence of natural re-sources; FEMemp: Female empowerment ; DEPratio: Dependency Ratio;Q1-Q5: quintiles of contextual variable considered. Source: Author’s elab-oration.
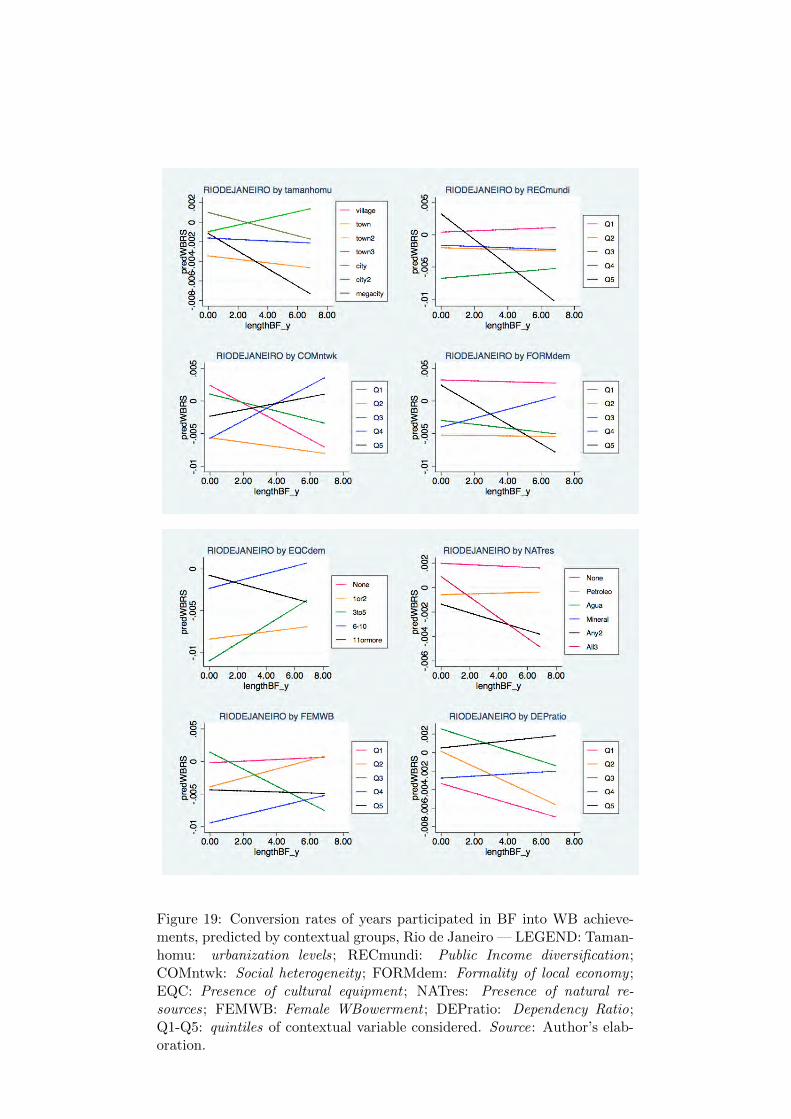
Figure 19: Conversion rates of years participated in BF into WB achieve-ments, predicted by contextual groups, Rio de Janeiro — LEGEND: Taman-homu: urbanization levels; RECmundi: Public Income diversification;COMntwk: Social heterogeneity ; FORMdem: Formality of local economy ;EQC: Presence of cultural equipment ; NATres: Presence of natural re-sources; FEMWB: Female WBowerment ; DEPratio: Dependency Ratio;Q1-Q5: quintiles of contextual variable considered. Source: Author’s elab-oration.
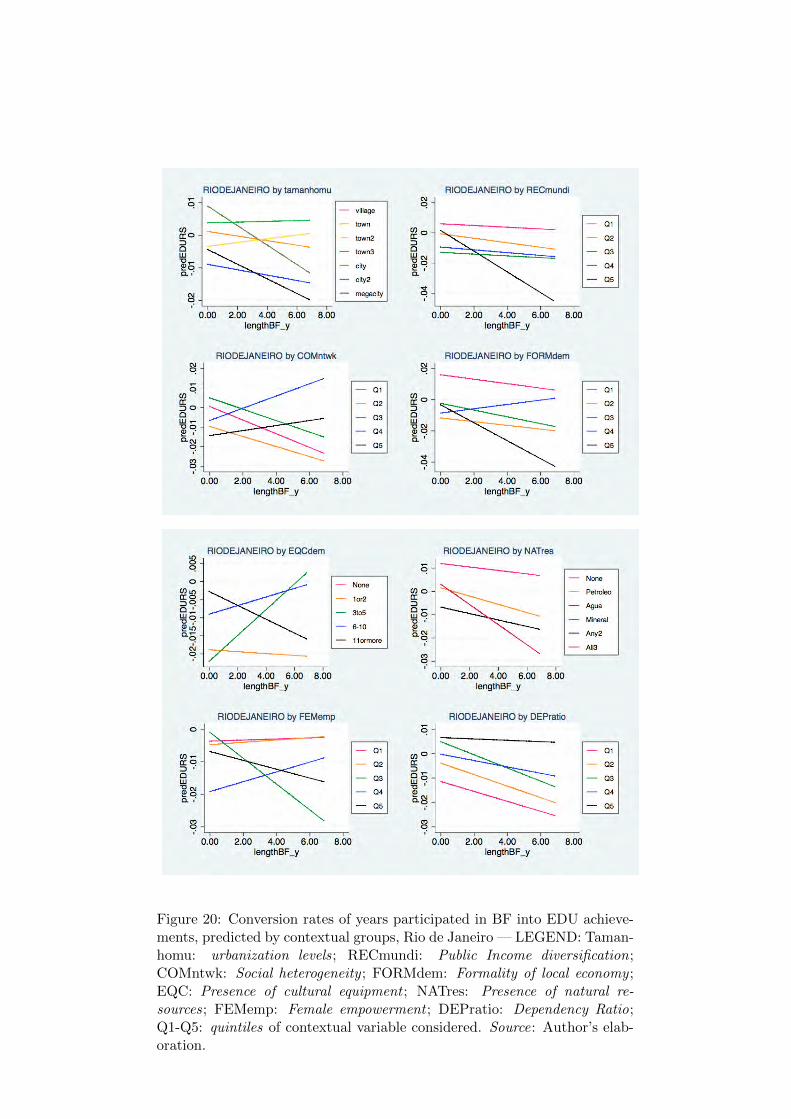
Figure 20: Conversion rates of years participated in BF into EDU achieve-ments, predicted by contextual groups, Rio de Janeiro — LEGEND: Taman-homu: urbanization levels; RECmundi: Public Income diversification;COMntwk: Social heterogeneity ; FORMdem: Formality of local economy ;EQC: Presence of cultural equipment ; NATres: Presence of natural re-sources; FEMemp: Female empowerment ; DEPratio: Dependency Ratio;Q1-Q5: quintiles of contextual variable considered. Source: Author’s elab-oration.
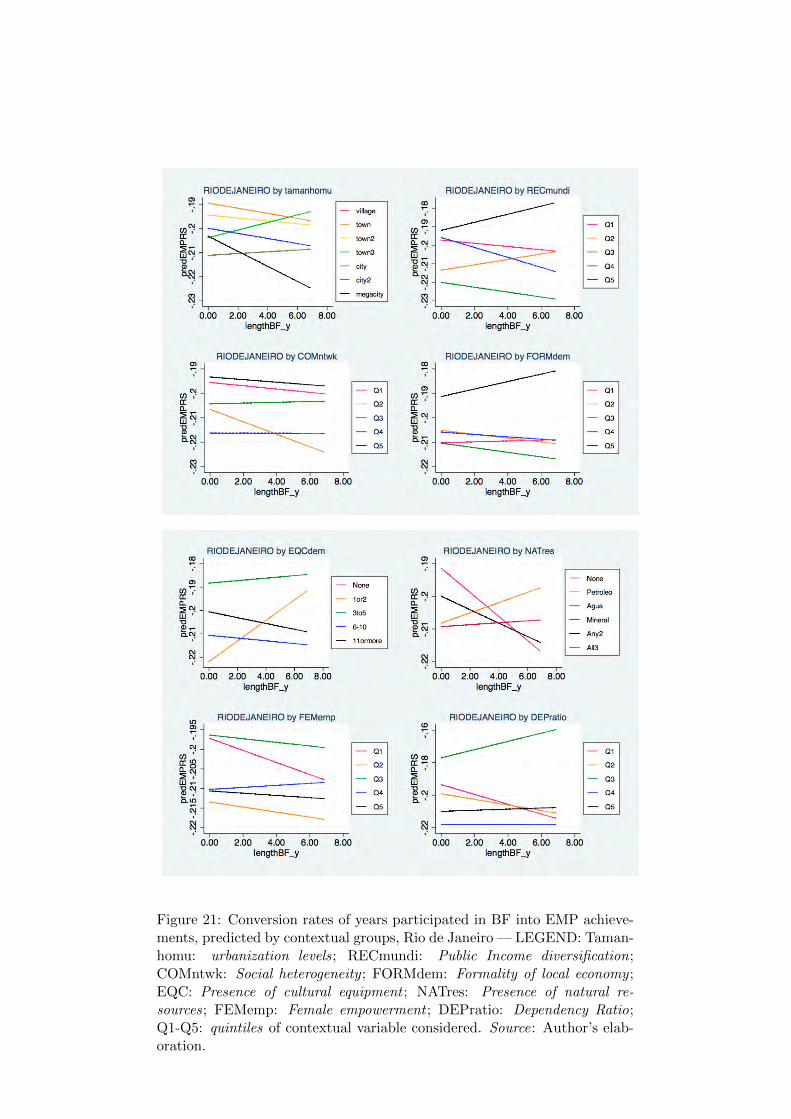
Figure 21: Conversion rates of years participated in BF into EMP achieve-ments, predicted by contextual groups, Rio de Janeiro — LEGEND: Taman-homu: urbanization levels; RECmundi: Public Income diversification;COMntwk: Social heterogeneity ; FORMdem: Formality of local economy ;EQC: Presence of cultural equipment ; NATres: Presence of natural re-sources; FEMemp: Female empowerment ; DEPratio: Dependency Ratio;Q1-Q5: quintiles of contextual variable considered. Source: Author’s elab-oration.
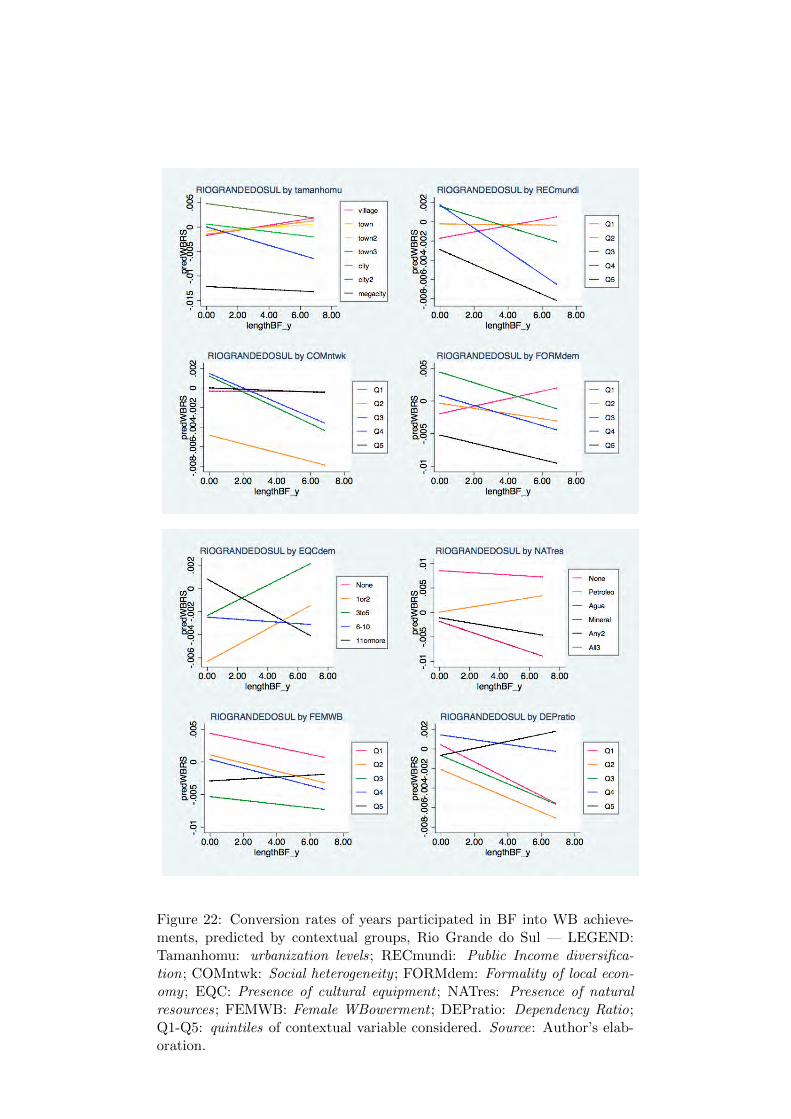
Figure 22: Conversion rates of years participated in BF into WB achieve-ments, predicted by contextual groups, Rio Grande do Sul — LEGEND:Tamanhomu: urbanization levels; RECmundi: Public Income diversifica-tion; COMntwk: Social heterogeneity ; FORMdem: Formality of local econ-omy ; EQC: Presence of cultural equipment ; NATres: Presence of naturalresources; FEMWB: Female WBowerment ; DEPratio: Dependency Ratio;Q1-Q5: quintiles of contextual variable considered. Source: Author’s elab-oration.
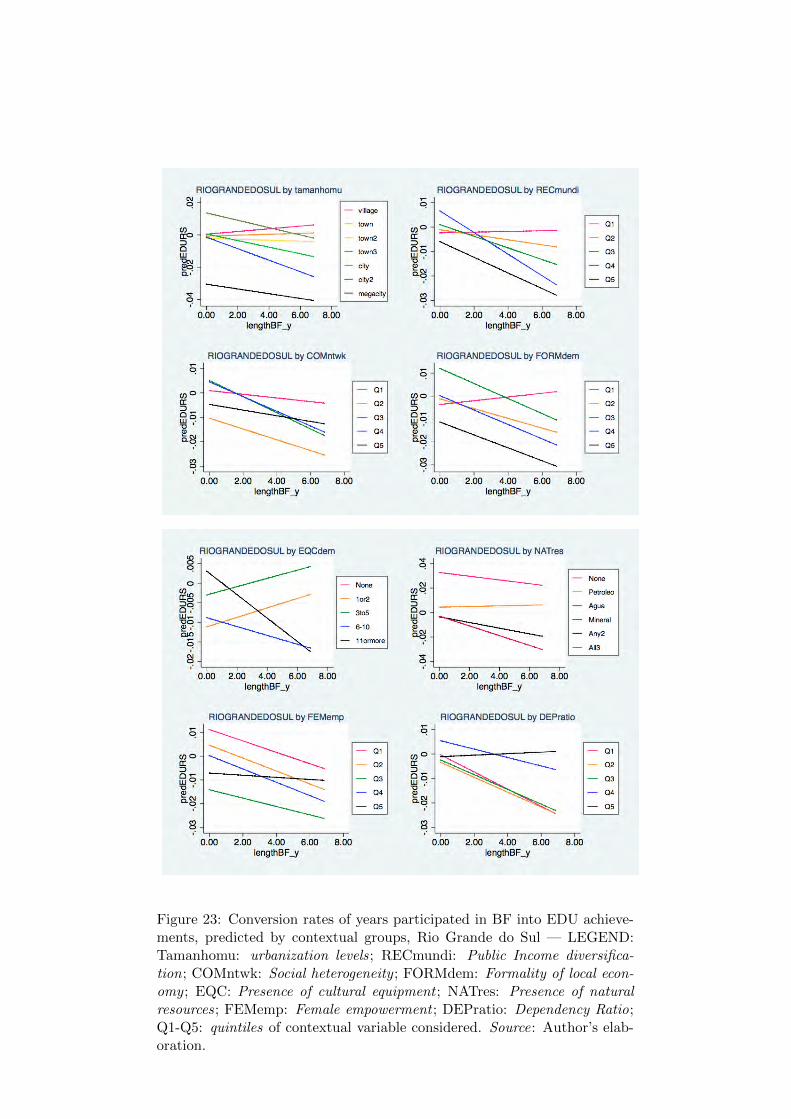
Figure 23: Conversion rates of years participated in BF into EDU achieve-ments, predicted by contextual groups, Rio Grande do Sul — LEGEND:Tamanhomu: urbanization levels; RECmundi: Public Income diversifica-tion; COMntwk: Social heterogeneity ; FORMdem: Formality of local econ-omy ; EQC: Presence of cultural equipment ; NATres: Presence of naturalresources; FEMemp: Female empowerment ; DEPratio: Dependency Ratio;Q1-Q5: quintiles of contextual variable considered. Source: Author’s elab-oration.
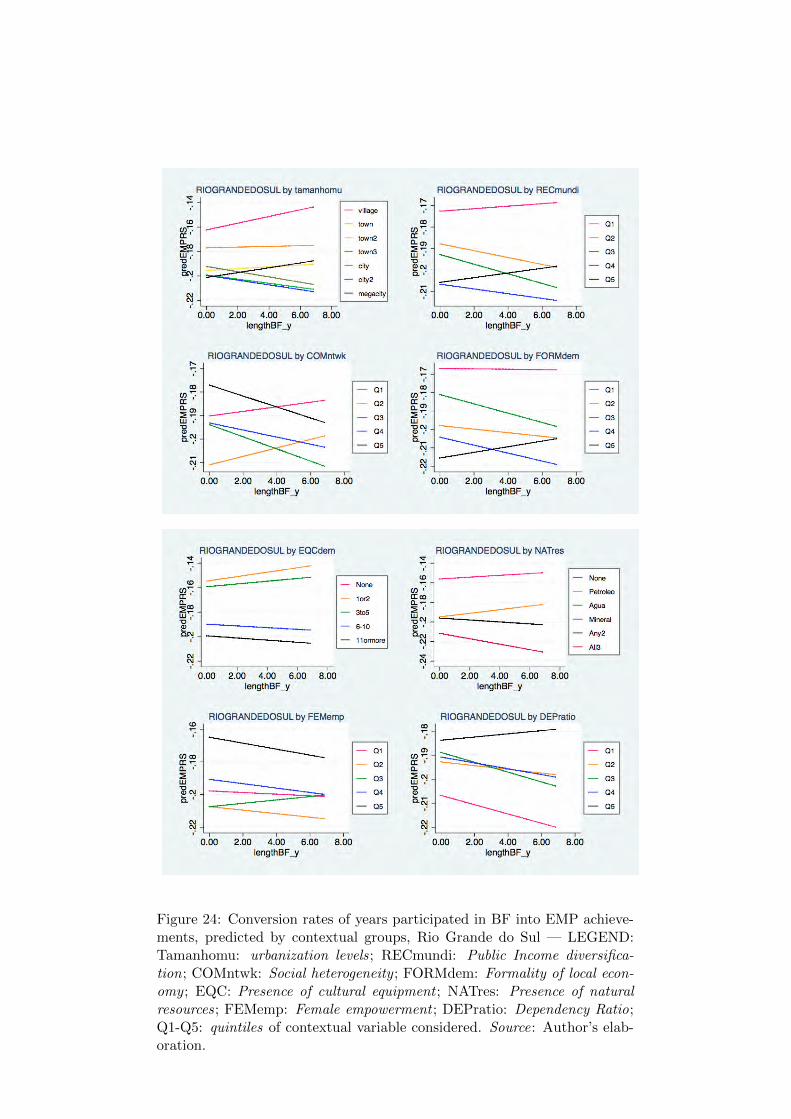
Figure 24: Conversion rates of years participated in BF into EMP achieve-ments, predicted by contextual groups, Rio Grande do Sul — LEGEND:Tamanhomu: urbanization levels; RECmundi: Public Income diversifica-tion; COMntwk: Social heterogeneity ; FORMdem: Formality of local econ-omy ; EQC: Presence of cultural equipment ; NATres: Presence of naturalresources; FEMemp: Female empowerment ; DEPratio: Dependency Ratio;Q1-Q5: quintiles of contextual variable considered. Source: Author’s elab-oration.