Embed Size (px)
Citation preview
Widening economic inequality in minnesota Causes Effects and a Proposal for Estimating Its Impact in Policymaking
By Jay Coggins Thomas Legg and Dane Smith August 2013
I IntroductIon and summary
Economic inequality in Minnesota and the United States by every measure continues to widen Those at the top pull away as middle-class income stagnates
The ldquoOccupyrdquo movement that began in 2011 brought attention to this pivotal issue in ways that would have been hard to foresee even a few years ago Dedicated websites such as inequalityorg now make available a great deal of inequality-related information The issue has become an important focus of policy and political debate in our state and nation
But what do we mean by ldquoeconomic inequalityrdquo What has caused recent increases in inequality Does rising inequality threaten growth and prosperity And how might we ameliorate it or arrest its further growth This paper attempts to answer those questions and proposes a bold new concept for assessing overall economic impact on future policymaking in Minnesota which could then be a model for other states
Inequality can be measured in several ways some based on income and others on wealth Different measures can give different pictures of the degree of inequality in a society Our first aim is to explain several of the broadest measures and what they show over time and across the landscape for Minnesota and the United States
In Sections II and III below we explore trends in three standard categories of inequality measures top income shares poverty and the Gini coefficient
ldquoWe are the 99 Percentrdquo is the defining slogan of the movement that has focused on the significant divergence of the top 1 from everyone else This motto has a strong and statistically valid underpinning The share of income going to the top 1 in America has risen dramatically over the past three decades By this measure in recent years inequality has reached historically high levels As incomes have stagnated through the rest of the income distribution the incomes of the wealthiest 1 have shot skyward In 2010 as the economy began to rebound 93 of the increase in aggregate household income was captured by the richest 1 of families
Meanwhile long-established poverty measures tell us about the bottom of the income distribution For a family of two adults and two children the household income level that determines whether they live in poverty was computed at $22811 in 2011 That year the number of Americans living below this cutoff (the dollar amount varies according to family size and makeup) reached 462 million (thatrsquos 150) up from 33 million in 2001 The sheer scale of economic disadvantage in the worldrsquos richest nation can be difficult to comprehend
The Gini coefficient is an overall measure of inequality It varies from zero (in a society where everyone has exactly the same income) to one (if one person receives the entirety of a societyrsquos income) Both extremes are of course implausible but the measure captures the level of income dispersion In the US this measure has risen inexorably over the past three decades reaching a new high of 477 in 2011 As the economy has grown in the recent past and those at the top have received the lionrsquos share of the gains worsening inequality
A crucial and often overlooked fact about inequality is that it varies widely over the geographical landscape One systematic tendency stands out inequality tends to be greatest where median incomes are lowest (See Aug 1 2012 report by the Pew Research Center) Maps in Section III illustrate this pattern states with high median incomes tend to be the most equal while the poorest states are the most unequal
Widening economic inequality in minnesota
Growth amp Justice 2
There are those who recognize growing inequality but conclude that it is not a major concern Inequality is an unavoidable part of a modern economy and a free society they say and public policy or governmental action to arrest it would only harm overall economic performance In Section IV we marshal evidence challenging the notion that citizens believe income disparity to be unimportant They perceive inequality to be lower than it is and wish it to be lower still
If inequality is high and rising perhaps the most important questions of all have to do with causation In Section V we consider broad factors commonly cited One view is that globalization and technical change reduce opportunities for the least educated workers and increase the economic opportunities of the most educated According to this view income inequality will inevitably continue to increase Another view however is that intentional public policy over the last 35 years has disproportionately benefitted those at the top of the income ladder According to this view recent increases in inequality were not inevitable and could be reversed by changes in public policy that favor the 99
We conclude that globalization and other market factors would have increased inequality absent public policies to counteract those forces But we also conclude that public policy choices have not only failed to counteract those forces but have directly and substantially contributed to increasing inequality poverty and income concentration at the top
An important goal of this report is to tell this story in greater detail to explain the evidence and the many ways of thinking about it And we want to emphasize that the fact of high and rising inequality in America is not controversial among the experts who study these things Itrsquos accepted reality
Finally in Section VI we propose a specific step to help policymakers understand the impact that proposed policies would have on inequality We recommend a measure of policy impact on inequality the Economic Inequality Impact Assessment (EIIA) which would accompany all economically significant legislation in the State We note parallels to the Environmental Impact Statement used throughout our regulatory realm since the early 1970s to ensure that new proposals and projects do not impose undue burdens upon our environmental and natural resources
II trends overvIew InequalIty In mInnesota and the us Is hIgh and growIng
The issue of economic inequality in the US is contentious Some believe fervently that it constitutes an existential threat to the American way of life Others see it as an unavoidable indeed a desirable part of our economy Still others when faced with claims that inequality is at historic highs and that American inequality outstrips that in other affluent western nations simply refuse to believe the evidence
Letrsquos look first at the most widely accepted statistical indicators
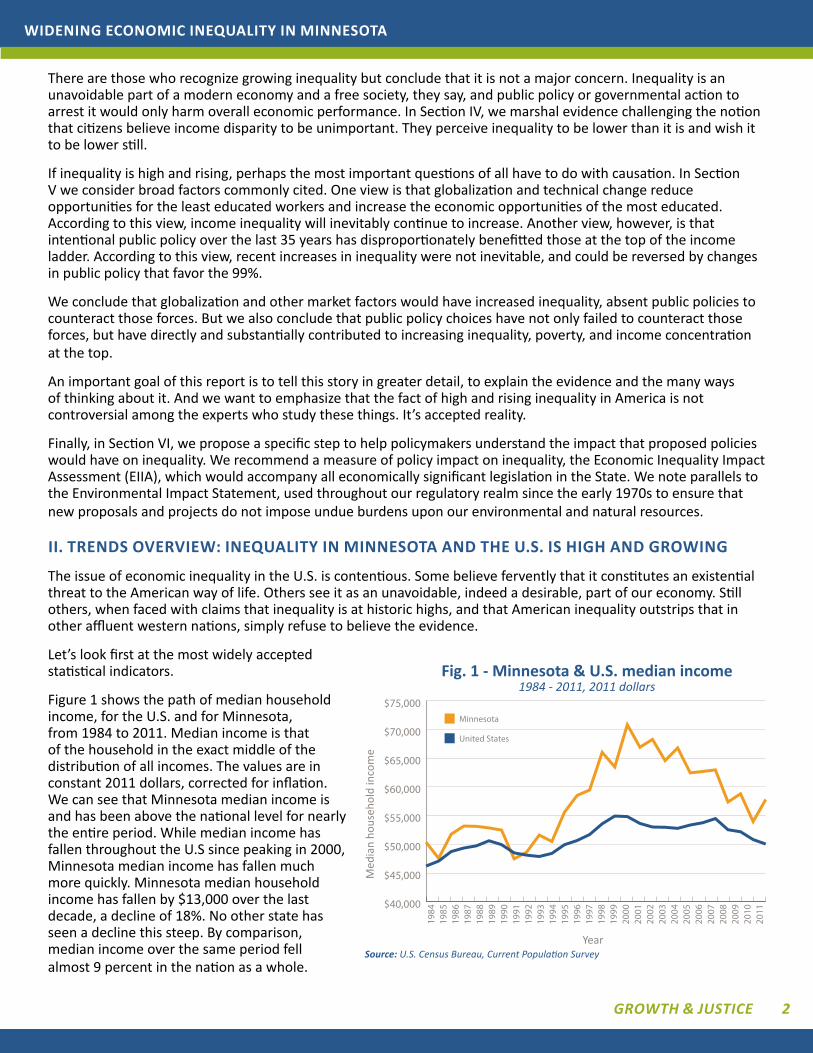
Figure 1 shows the path of median household income for the US and for Minnesota from 1984 to 2011 Median income is that of the household in the exact middle of the distribution of all incomes The values are in constant 2011 dollars corrected for inflation We can see that Minnesota median income is and has been above the national level for nearly the entire period While median income has fallen throughout the US since peaking in 2000 Minnesota median income has fallen much more quickly Minnesota median household income has fallen by $13000 over the last decade a decline of 18 No other state has seen a decline this steep By comparison median income over the same period fell almost 9 percent in the nation as a whole
$40000
$45000
$50000
$55000
$60000
$65000
$70000
$75000
United States
Minnesota
1984
1994
1993
1992
1991
1990
1989
1988
1987
1986
1985
2004
2003
2002
2001
2000
1999
1998
1997
1996
1995
2011
2010
2009
2008
2007
2006
2005
Year
Med
ian
hous
ehol
d in
com
e
Fig 1 - minnesota amp us median income1984 - 2011 2011 dollars
source US Census Bureau Current Population Survey
Widening economic inequality in minnesota
Growth amp Justice 3
The entire US distribution of income can be depicted in a histogram as in Figure 2 There the horizontal axis shows annual gross income ranging from zero to $500000 The vertical axis shows the number of ldquotaxpaying unitsrdquo (that is anyone who filed a 1040 form with the IRS) whose 2011 income fell in each $10000 increment
We see that 18 million taxpayers reported income below $10000 in 2011 Another 23 million reported income between $10000 and $20000 And so on The median income level which splits the population of 160 million taxpayers in half (80 million below and 80 million above) is $42327 (note that households are defined differently than ldquotaxpaying unitsrdquo)
Only five percent of taxpayers (thatrsquos 8 million) came in with income above $195000 One percent (thatrsquos 16 million) had income above $500000 The taller bar at the far right represents these 16 million whose income is high enough to make them tumble off the chart
How wide would the chart need to be in order to find room for the highest level of income gained in 2012 by any one individual That person is David Tepper the founder of Appaloosa Management a hedge fund Tepperrsquos income for the year stood at $22 billion
On the printed page the $500000 mark on our chart is just about 6 inches from the zero mark Tepperrsquos $22 billion is 4400 times as far along the horizontal axis This means that in order to find room for him the chart would need to be 2200 feet wide Thatrsquos nearly half a mile Meanwhile 80 million American taxpayers reside in the first frac34 of an inch
This is income inequality
0
5
10
15
20
25
gt50049
047
045
043
041
039
037
035
033
031
029
027
025
023
021
019
017
015
013
011
09070503010
20 50 80 90 95 99
Median income $42327
Top 2012 income$22 billion
(David Tepper)
Figure 2 Distribution of US income 2011
Num
ber o
f tax
uni
ts m
illio
ns
Income increments US tax units $1000s
source Center for Budget and Policy Priorities
Widening economic inequality in minnesota
Growth amp Justice 4
Three other principal methods for measuring inequality are the share of income going to the richest the Gini coefficient and the poverty ratemdashan arbitrary federal government standard below which families are judged to be unable to provide for basic needs The first of these measures places emphasis on the top of the income distribution the last on the bottom The Gini coefficient is based upon the entire distribution from top to bottom
First the top income share If incomes were entirely equal across households the top 1 would receive 1 of the income Of course incomes are not equal and one would not expect them to be But just how unequal are they Economist Emmanuel Saez and his collaborators proprietors of the World Top Incomes Database1 have compiled a unique set of historical income and tax data from US income-tax returns running back to 1913
Their numbers in Figure 3 show that the share of income going to the richest 1 of US households recently reached 24 a level last seen in 1928 ahead of the stock-market crash of 1929 Inequality measured by top income shares roared upward during the roaring twenties then fell again along with the stock market at the end of that decade The Second World War drove top shares down still further through the 1940s Over the ensuing three decades the rate remained relatively low hovering around 10 In about 1980 it began a long and inexorable climb ascending once again to the 24 mark in 2007 The recession of 2008-09 drove the top share back down but the number has turned upward once again since 2010
1 The collaborators are Thomas Piketty Anthony Atkinson and Facundo Alvaredo That database can be accessed at g-mondparisschoolofeconomicseutopincomes
0
5
10
15
20
25
30
1913
1916
1925
1922
1919
1928
1931
1934
1937
1940
1943
2000
1997
1994
1991
1988
1985
1982
1979
1976
1973
1970
1967
1964
1961
1958
1955
1952
1949
1946
2009
2006
2003
Fig 3 US top 1 income shares including capital gains
Top
1 in
com
e sh
are
US
Yearsource World Top Incomes Database
Widening economic inequality in minnesota
Growth amp Justice 5
Incomes for the entire country have risen in the past several decades but the gains have been uneven Those at the top have seen their income rise handsomely while everyone else has seen little gain Figure 4 shows the breakdown The blue curve represents the poorest 20 of households whose incomes rose by about 40 in inflation-adjusted dollars during the 30-year period Thatrsquos about 1 per year The orange curve represents households between the 20th and the 80th percentiles Their incomes rose a little less than the bottom quintile by about 36 in total The gray curve represents households between the 80th and 99th percentiles Their incomes rose by about 60 even after dropping dramatically during 2008 and 2009
The striking curve is the top curve in green It represents the income trajectory of the top 1 whose incomes grew by 300 through 2007 before dropping dramatically during the recent downturn As noted below the top 1 has garnered most of the increased household income since 2009
The economy continues to sputter but in 2010 (the most recent year for which we have data) US aggregate household income began once again to march upward In a recent study Emanuel Saez dug into the distribution of this increase across income groups His findings are startling average family income grew by 23 between 2009 and 2010 but fully 93 of this increase was captured by the richest 1 of households The remaining 99 were left to scramble for the other 7 These numbers translate into an increase of 116 for the top 1 and an average increase of 02 for everyone else2
The Gini coefficient devised in 1912 by the Italian economist Corrado Gini measures the level of inequality for an entire income distribution It ranges from zero (if every household has the same income) to one (if one household has all of the income) A bigger Gini means higher inequality
The Gini coefficient is the oil tanker of inequality measures It doesnrsquot change very fast over time even if top income shares are rising quickly Changes in the Gini that appear to be small which might be said of the numbers described here represent fairly hefty increases in inequality
2 The fact that only the richest households experienced a significant gain in income yet the average income rose quite a lot illustrates an important point about average and median Median represents the middle of a distribution There are equal numbers of households to the right and to the left of the median Average income is total national income divided by the number of households If Bill Gatesrsquo income were to double it would have a noticeable effect on average income but the median income would be unchanged For this reason economists usually use the median rather than the average to describe the center of the income distribution
-50
0
50
100
150
200
250
300
350
1979
1980
1983
1982
1981
1991
1990
1989
1988
1987
1986
1985
1984
2002
2001
2000
1999
1998
1997
1996
1995
1994
1993
1992
2007
2006
2005
2004
2003
2009
2008
0 - 20
21 - 80
Top 1
81 - 99
Income percenles
G
row
th in
afte
r-tax
inco
me
Yearsource Congressional Budget Office
Fig 4 Growth in after tax income by income category 1979-2009
Widening economic inequality in minnesota
Growth amp Justice 6
Figure 5 compares Gini coefficients for the US and Minnesota for each of the last four decennial censuses (State-level Ginis are not available every year) Though inequality is lower in Minnesota than in the US both numbers have been rising steadily for at least the past four decades We will see in Section IV that the Gini for both the US and for Minnesota exceeds the number found in most other rich industrialized countries
Poverty rates convey yet another picture of inequality As the economy waxes and wanes the number of people living below the poverty line also waxes and wanes What does it mean to be in poverty Each year the Census Bureau publishes a table of income thresholds depending on the size and demographic make-up of a household that determine whether a given family is living in poverty In 2011 the poverty threshold for a family of two adults and two children was $22811 If such a family has total income below this level all four members adults and children alike are judged to be living in poverty The threshold for a single adult aged less than 65 was $11702
The income level marking the bottom of the top quintile precisely 80 along the income distribution is $100065 A person living in such a family or one that lies even further up the income scale might face some difficulty in imagining what it must be like to get by on only $22811 How exactly does a family pay the rent put food on the table buy gas for the drive to work and buy health coverage and clothes for the four members of the household Too often for one or more categories one doesnrsquot
In 2011 an all-time high of 462 million Americans lived below the poverty line This translates into 150 of all citizens a rate last touched in 1993 Figure 6 shows the evolution of the poverty rate since 1995 in the US and in Minnesota Both have been marching upward since 2000 Minnesotans do not reside in poverty at the same rate as do Americans more generally but even here the rate has lately crept above 10 The number of Minnesotans living in poverty now exceeds half a million These numbers represent a tremendous amount of aggregate misery and anxiety across the state
Pove
rty
rate
Yearsource US Census Bureau
Fig 6 Poverty rates US amp MN 1995 - 2010
4
6
8
10
12
14
16
18
2002
2001
2000
1999
1998
1997
1996
1995
2007
2006
2005
2004
2003
2009
2008
US
MN
2010
Gini
coe
ffici
ent
034
036
038
040
042
044
046
048
2009199919891979
MN
US
Yearsource US Census Bureau
Fig 5 Gini Coefficients US and Minnesota
Widening economic inequality in minnesota
Growth amp Justice 7
III InequalIty Is hIghest where Income Is lowest
Whenever the rising tide of inequality is decried there doubtless will be plenty of respondents who express a firm and abiding disbelief in the numbers Just as there are many who deny the science indicating global climate change so there are many who deny the evidence indicating that inequality is on the rise
Many theories have been advanced to explain this resistance to accept the evidence One likely possibility is that a great many Americans and a great many Minnesotans live in places where income is high and inequality is low The importance of this empirical fact can hardly be overstated inequality tends to be highest where income is lowest
Minnesotarsquos suburban metro counties for instance rank at or near the top of the list with respect to median income They rank at or near the bottom of the list with respect to the Gini coefficient and the poverty rate People who live in these counties may have little or no first-hand experience with inequality or with widespread poverty Convincing them to believe in something their eyes rarely see can be a challenge
It should not be surprising that inequality varies across the landscape Aggregate numbers whether for all of the US or all of Minnesota mask important variability within the relevant population And the pattern is consistent The upper left map in Figure 7 shows median income by state across the 48 contiguous US states The light gray color represents the lowest median income level The upper right map shows Gini coefficients The orange represents the highest level of inequality The lower map shows the poverty rate by state with orange indicating a higher poverty rate The correlation is imperfect but still striking Many of the lowest-income states are to be found in the south where inequality and poverty rates both tend to be high
Gini Coefficient
Fig 7 Median income Gini coefficient and poverty rate 2011 US states
source US Census Bureau
lt $456000 gt $59500$47500 - $52000$45600 - $47500 $52000 - $59500 lt 0432 gt 04690453 - 04670432 - 0453 0467 - 0469
85 - 118 162 - 219123 - 142118 - 123 142 - 162
median Income
Poverty Rate
Widening economic inequality in minnesota
Growth amp Justice 8
Figure 8 shows the relationship between state-level median income and the Gini coefficient in a scatter plot The line represents the general relationship between income and inequality Its downward slope tells us that inequality tends to be lowest where income is highest
Median household income has risen little over the last 30 years and has actually fallen since 2000 Minnesota compares favorably to the US as a whole but the advantage is slipping Our median household income remains higher and our inequality and poverty rates are lower than average but much of that favorable relative standing has disappeared since 2000 Our income is declining and inequality is rising absolutely and relative to other states Over the last 10 years we have fallen from 9th lowest Gini to 13th Our poverty rate has worsened from the 3rd lowest to 11th lowest
Iv Income InequalIty IncreasIngly becomes a publIc concern and economIc threat
The evidence is clear that inequality in America is rising The question of whether rising inequality is a cause for concern though is more contentious There are those who see it as a grave threat Others see it as a sign of a healthy and vigorous capitalist economy Some inequality is essential in producing opportunities and incentives for individuals to create new products to invest in innovative ideas and to work hard The economy as a whole is more productive and aggregate wealth is higher when innovation is vigorous and capital is put to its most valuable use The incentive to ldquoget richrdquo helps drive initiative and innovation
Accepting a life of grinding penury for large portions of the populace is offensive to empathetic and humane sensibilities and has been throughout human history But the acceleration of inequality trends in recent years is provoking important questions about the effect on growth itself Is economic growth threatened by inequality Does high inequality cause the economy as a whole to produce less for all
Median household income
Gini
coe
ffici
ent
Fig 8 Income and Gini Coefficients US States (2011)
source US Census Bureau
$35000 $40000 $45000 $50000 $55000 $60000 $65000 $70000
040
041
042
043
044
045
046
047
048
049
050
051
MN
US
High inequality
Low inequality
Widening economic inequality in minnesota
Growth amp Justice 9
These crucial questions occupy us in this section In particular we ask whether there is a level of inequality above which the positive incentives to contribute to economic performance are more than offset by the social costs And if so have we yet reached or exceeded that level
Some think that continued growth in inequality will continue to benefit society In this view economic growth is now hampered by public policies that overly limit the economic rewards to investment and effort In this view taxes and costly regulatory burdens to innovation investment and hard work need to be reduced Witness recent calls for lower top tax rates elimination of the Environmental Protection Agency and efforts to pass ldquoright to workrdquo laws
Others believe that increases in income inequality over the last thirty years are creating social harm sufficient to more than offset any benefits of additional economic growth Some go further providing evidence that current levels of inequality are actually reducing growth
We support the latter view that income inequality has crossed a threshold that threatens overall growth and that it is an issue of great importance In this section we present facts which establish the relative public ignorance about inequality discuss its actual damage to economic growth and provide some explanation of the cause-and-effect dynamics
perceived Actual and Desired Inequality
Inequality is an important issue if Americans believe it is an important issue In a study published in 2011 economists Michael Norton and Dan Ariely asked a random sample of 5522 Americans to rank three alternative distributions of wealth for a society3 The three distributions were as depicted in Figure 9 The first in 9a is the actual distribution of wealth in the US The richest 20 of American households hold 84 of total wealth and the poorest 20 of households hold 01 The third in 9c is a hypothetical distribution in which each fifth of the population has the same level of wealth This represents perfect equality The middle distribution 9b is a hypothetical intermediate wealth distribution There the richest 20 hold 36 of the wealth and the poorest 20 hold 11
Respondents to the online survey were asked to imagine that they might be a member of a given society but that their own place in the society would be determined by chance Which society would they rather inhabit They were provided an opportunity to choose from the three societies depicted in Figure 9 (without being told that 9a was the actual distribution of wealth in the US) Norton and Ariely discovered that for their respondents the least desirable alternative is the actual US distribution depicted in 9a The top choice for desired actual distribution was the intermediate distribution (9b) with 47 making it their first choice The equal distribution (9c) was next with 43 choosing it The actual US wealth distribution (9a) came last with only 10 choosing it
3 Wealth is different from income Also called net worth wealth is the value of all assets less the value of all debts owed Wealth is more concentrated than is income among the richest households
Top 20
Boom 20
Middle 204th 20
2nd 2084
1184
0201
Fig 9a US wealth distribution
Top 20
Boom 20
Middle 204th 20
2nd 20
2020
20
2020
Fig 9c Equal wealth distribution
Top 20
Boom 20
Middle 204th 20
2nd 2018
11 15
21
36 18
Fig 9b Intermediate wealth distribution
Widening economic inequality in minnesota
Growth amp Justice 10
Norton and Ariely then asked two further questions The first asked respondents to specify the level of wealth inequality that they believe exists in the US The second asked them to specify the level of wealth that they would like to see in the US Figure 10 taken from Norton and Arielyrsquos published study shows the results of these questions The first bar shows the actual US wealth distribution The second shows the average of respondentsrsquo estimates of the US wealth distribution The third shows the average of respondentsrsquo ideal US wealth distribution
Two main lessons may be drawn from these results The first is that people appear to underestimate dramatically the level of wealth inequality in the US economy The average person believes that the richest quintile holds about 57 of wealth when the actual share is 84 Second people wish that wealth inequality were even lower than they believe it to be The average person feels that the richest quintile should hold about 32 of wealth
Norton and Ariely confirm our belief that most favor some inequality Most would prefer less inequality than they think exists and would prefer far less than actually exists Our point is that most Americans think current inequality is excessive and likely would feel stronger about that if they knew the actual facts
Inequality and Growth
As we have posited earlier a certain amount of inequality is inevitable and most economists would agree that some is essential for healthy and vigorous economic growth As inequality increases though the marginal benefit to output from additional inequality logically declines Has inequality risen to a point where the marginal effects on output are actually negative That is is inequality now so high that recent widening has caused lower GDP than we would have had with the lower levels of inequality of the middle of the last century (a period of consistently high growth)
Ramaprasad Rajaram of the University of Georgia believes so In his 2010 PhD dissertation Poverty Income Inequality and Economic Growth in US Counties A Spatial Analysis he considers the effects of income inequality and poverty on economic growth He relates per capita income growth to poverty rates and overall income inequality (Gini coefficients) in 3072 US counties using data from the 1980 (1979 data) and 2000 (1999 data) US Census He assesses the relationship of poverty in 1979 to growth from 1979 to 1999 and finds that counties with lower poverty rates in 1979 grew on average significantly more quickly during the next 20 years He similarly found that counties with less overall income inequality in 1979 grew on average significantly more quickly than those with higher income inequality in 1979
He then went a step further looking at actual growth from 1979 to 1999 as a predictor of 1999 poverty and inequality measures He found that counties that grew more quickly from 1979 through 1999 had lower poverty rates and overall inequality at the end of the period Finally he split the counties into ldquorichrdquo and ldquopoorrdquo to see whether the effects differed He found little difference
Actual
Estimated
Preferred
Top 20 Second 20 Fourth 20 Bottom 20Middle 20
0 10 20 30 40 50 60 70 80 90 100
Percent of wealth owned
Fig 10 Actual estimated and preferred US wealth distributions
Widening economic inequality in minnesota
Growth amp Justice 11
His results tell a compelling story Those areas with less inequality and poverty today all else equal can expect higher future growth in future per capita income In the future those that actually experienced the highest growth are likely to have lower poverty and overall inequality In summary those that grow quickly are likely to be the ones that start with lower inequality The resulting high growth in turn has a dampening effect on future increases in inequality This is a virtuous cycle in which if all share in growing prosperity prosperity grows more rapidly
Inequality and Demand for Goods and Services
US consumers have driven the growth of the US economy at least since World War II Personal consumption has been about 70 of Gross Domestic Product (GDP) Through at least 1979 this consumption was driven by a broad and growing middle class and growing income widely shared across the income distribution Continued long-term growth likely will continue to depend on growing consumption If personal consumption is to remain at 70 of GDP it must grow at the same rate as GDP
As household income increases consumption increases along with it This has the effect of increasing the demand for the goods and services that give rise to the additional income Poor households spend nearly all their increases in income while middle income households spend most of the increases Those at the top spend a smaller proportion of additional income
When incomes at the top are growing much more quickly than those in the middle and the bottom of the distribution consumption naturally declines as a share of GDP In 2010 a year of weak economic recovery 93 of the growth in income went to the top 1 of households As a result this apportionment of additional personal income generated less additional demand for goods and services This perverse braking effect might be viewed as a downward spiral a vicious circle Slowing economic growth leads to increased inequality which then leads to even slower growthIn summary most Americans wish for less inequality than we have even while they underestimate the degree of current inequality Higher inequality inevitably produces lower growth because the wealthy spend less of their income than those less wealthy As income goes increasingly to the wealthy demand for goods and services is less than optimum Growth is constrained as inequality increases beyond a level that encourages growth
v causes oF InequalIty
Why exactly have poverty rates and income inequality increased so dramatically since 1980 Was it unavoidable What of the future How might we prevent further widening or even reverse the trend
Some observers explain our rising inequality as the inevitable result of advancing technology with its attendant rewards for the skilled workers who are able to perform high-tech jobs Others explain it as the inevitable result of increasing globalization in the world economy These two factors are certainly implicated Both have helped to increase global output and global incomes but both have also imposed costs on some people in some places Both have also shoveled generous rewards to a favored few Those bearing the highest costs have been the middle and lower classes in the developed world Those favored include those with capital and those who are highly educated in fields that allow them to take full advantage of globalization and technological advances
Globalization and technological advances generally benefit the same segments of society Globalization has made both production and capital more mobile without equivalent increases in labor mobility Businesses now face fewer legal and institutional impediments to movement of capital goods and services in and out of countries
Advances in technology have reduced the costs of moving goods and services from one country to another For example some accounting firms have American clientsrsquo tax returns prepared in India That is possible only because of recent changes in communications technology and institutions that allow exports of the services from India and import of those services to the US without expensive trade restrictions Here the shareholders of the accounting firm gain through lower costs while less work is available for American tax preparers Further downward pressure is exerted on the wages of the remaining tax preparers
Endless examples of ldquooutsourcingrdquo job loss and downward pressure on working-class Americans have become the staple of economic conversation for three decades Taken together and across the economy these examples create
Widening economic inequality in minnesota
Growth amp Justice 12
conditions that have increased inequality and poverty in the US Was this inevitable Is it necessary that poverty and inequality must increase as a result of technological changes and globalization
We do not believe so Public policies could have largely or completely mitigated the effects of technological changes and globalization Further we believe that government policies enacted over the last thirty years have not only failed to mitigate the effects but have independently increased poverty and inequality In short we are hopeful about the possibility of policy action mitigating inequality And we believe past and future increases in inequality and poverty are not inescapable and can be reversed
First let us look at the experiences of some other industrialized democratic countries They have faced the same forces of globalization and technological change Yet inequality and poverty in many of those countries has not changed appreciably
As noted earlier much of the growth in incomes in the US has been captured by those with incomes in the top 1 Figure 11 shows the path of top 1 income shares for the US Japan Australia and France all from 1913 to 20094 The message from this international comparison is that rising inequality is neither inevitable nor is it necessary for an economy to perform well Alone among the four rich countries shown the US has seen a dramatic rise in the top income share
Overall inequality as measured by the Gini coefficient (Figure 12) similarly demonstrates that the US is more unequal than other high income countries France Canada and Norway represent the other developed countries and have substantially lower inequality than the US In fact these countries have Gini coefficients not seen in the US since the 1970s Note that these are estimates made by The World Bank and differ somewhat from those for the US as estimated by the US Census Bureau
4 These data are different from those in Figure 3 in that income from capital gains is excluded in Figure 11 The source database includes information on capital gains income for the US but not for the other countries
0
5
10
15
20
25
1915
1920
1935
1930
1925
1945
1955
1980
1985
1950
1940
2000
1960
1965
1970
1975
1995
1990
2005
2010
Australia - Atkinson amp Leigh (2007)Japan - Moriquchi amp Saez (2010)
United States - Pikey amp Saez (2007) France - Pikey (2001 2007) Landais (2007)
Fig 11 Top 1 income shares for the United States Australia France amp Japan 1913 - 20011
Year
Inco
me
shar
e
source World Top Incomes Database
00
010
020
030
040
050
060
Norway Canada France India UnitedStates
China Brazil
0415
055
0408
03270368
0326
0258
Fig 12 Gini coefficients for selected countries
source The World Bank
Widening economic inequality in minnesota
Growth amp Justice 13
Figure 13 from the Organization for Economic Cooperation and Development (OECD) shows poverty rates in the mid-2000rsquos for selected OECD countries We stand near the top In the figure each bar represents the percentage of a countryrsquos population living in households with less than 50 of that countryrsquos median income According to this measure the US has the third-highest poverty rate in the OECD at 173 Americarsquos 2010 median income was $49445 We can say then that 173 of all US households had income that year below $24722 Note that the poverty rate as measured by the OECD is higher than reported by the US Census Bureau That agency defines poverty differently than the OECD
Other high income countries have faced globalization and technological changes without a rapid proportional rise in incomes at the top dramatic increases in overall inequality or similar levels of poverty Our neighbor Canada reports median family income of $69860 in 2010 While the definition used by Statistics Canada may differ from that of our Census Bureau it seems reasonable to conclude that Canadian household income is at least comparable to that in the US Canada now has lower unemployment and growth rates similar to ours Canada is doing at least as well as we are economically without our high levels of inequality and poverty
We conclude that recent and future increases in inequality are not inevitable and that we could reduce inequality in the future
vI a proposal For a new polIcy evaluatIon tool the ldquoeconomIc InequalIty Impact assessmentrdquo
In the late 1960s as awareness spread about the threat posed by pollution of all kinds to property and especially to human health policymakers in the United States began to adopt laws appropriations and regulations designed to reduce or remediate environmental damages
Many of the laws and regulations simply required reductions in pollutants and emissions or banned the use of the worst toxins such as DDT But one of the most important provisions was the introduction of requirements to estimate in advance the environmental impact from pending development projects or policies The Environmental Impact Statement or EIS became a useful and accepted policy development tool
We believe growing inequality represents a similar threat to our societyrsquos long-term well-being A further concentration of income and wealth in fewer and fewer households and the accompanying rise in poverty and the decline of middle-income economic stability compels policymakers at all levels to conduct a more systematic assessment of economic inequality impact before they make decisions that could further exacerbate inequality We propose that all economically significant legislation and new state regulations in Minnesota should be subjected to an analysis that measures the policyrsquos impact on economic inequality
The experience with environmental impact measurement is encouraging In a 1994 paper noted environmental law professor William H Rodgers Jr included the EIS in his list of the seven most influential or effective US
0
5
10
15
20
25
Denmark Sweden OECD UnitedKingdom
Canada UnitedStates
Mexico
173
21
114111 113
84
61
Fig 13 Poverty rates at 50 or less of median income for selected OECD countries
source Organization for Economic Cooperation and Development (OECD)
Widening economic inequality in minnesota
Growth amp Justice 14
environmental laws The EIS was part of the National Environmental Policy Act of 1969 (NEPA) and requires federal agencies to prepare an EIS to accompany any agency action that has a significant effect on the human environment Rodgers noted that environmental impact statements were ldquoreplicated in rapid fashion throughout the United States and around the worldrdquo and have become ldquothe most frequently copied and most frequently cited of all US domestic environmental lawsrdquo 5
Legislators and other policymakers in Minnesota could develop an Economic Inequality Impact Assessment (EIIA) for all major policies that are likely to have a measurable effect on income or wealth distribution (This specific title and acronym used hereafter is the creation of the authors of this report we hope to popularize the concept but are not adamant about how it is labeled or the specifics of its implementation)
Minnesota already has a reputation among the states for distinctive high-quality economic measurement tools The Price of Government measurement and the biennial Tax Incidence Study both launched in the 1990s and updated regularly provide uniquely detailed perspective on the overall size of state-and-local government as a percent of income (Price of Government) and how the taxes for that public investment is paid by economic strata (Tax Incidence Study) These tools have greatly enabled quantitative analysis of relative fairness and equality
Legislative and executive branch staffers are familiar with the concept of projecting the costs and benefits of potential policy When legislators advance bills that directly or indirectly create a cost for state or local governments they must seek fiscal notes which calculate the costs of the proposed legislation
Support for measuring projected inequality particularly as it relates to poverty has come in recent years from a growing national coalition of community and philanthropic efforts and Minnesota has been a leader in this effort
The Washington DC based Center for Law and Social Policy (CLASP) published a summary of federal and state efforts that align with a CLASP initiative for Poverty Impact Projections (PIP) The PIP concept as described in that 2011 CLASP report could be easily applied to a broader Economic Inequality Impact Assessment
As stated in the CLASP study ldquoGetting a clearer prognosis of the potential impact of a pending policy is valuable not just for elected officials who need to vote on bills but also for other policymakers and community stakeholders who need to make planning and implementation decisionsrdquo 6
Minnesota is one of the few states highlighted in the CLASP report as having done the most to advance the concept of poverty impact projections noting that just such a mechanism was a key recommendation of the Legislative Commission to End Poverty in Minnesota by 2020 Along with many other local groups particularly the nonprofit organization A Minnesota Without Poverty we encourage efforts toward establishing a poverty impact projection but submit that a broader top-to-bottom evaluation of policy in the form of an Economic Inequality Impact Assessment would be even more valuable
5 Rodgers Jr W H (1994) The Seven Statutory Wonders of US Environmental Law Origins and Morphology Loyola of Los Angeles Law Review 1009-1022 Available at httpdigital commonslmuedullrvol27iss315
6 Levin-Epstein J amp Sanes M (August 2011) At the Forefront Poverty Impact Projections Washington DC CLASP
Widening economic inequality in minnesota
Growth amp Justice 15 2324 University Ave W Suite 120 A Saint Paul MN 55114 wwwgrowthandjusticeorg
Smart Investments Practical Solutions Broader Prosperity
We do not offer here a precise formula for an EIIA But our conversations and interviews with state tax and budget experts suggest the following in regard to practical design and implementation of an EIIA for Minnesota
bull The EIIA could be housed in the Minnesota Management and Budget agency within the office of the State Economist The agency commissioner could appoint an advisory group of economic experts to assist in designing an EIIA process and methodology
bull An EIIA for tax bills could begin in the Revenue Department using more detailed projections about the impact of various tax proposals on the Suits index and other measurements of tax incidence
bull An EIIA could initially calculate the estimated direction of the effect on inequality measures rather than predict specific numerical outcomes An EIIA likely would need to have a de minimis threshold as do fiscal notes in the state budget process so that not every bill or proposal coming before a committee would need to be assessed
bull Scores of specific policy proposals aimed at reducing inequalitymdashinvestment in early childhood education higher minimum wages elimination of high-income tax cuts and breaksmdashare proposed every year by national and state policymakers In many cases the effects on reducing inequality are obvious intuitively But how much more valuable would it be for policymakers to have more precise information about the relative impacts of such proposals
Better economic information will help policymakers navigate toward a more equitable and sustainable economy and society Establishment of an Economic Inequality Impact Assessment would be a valuable addition to the policymaking toolbox
about the authors
Jay Coggins is an associate professor with the Department of Applied Economics at the University of Minnesota and a policy fellow for Growth amp Justice
thomas legg is a senior lecturer at the University of Minnesotarsquos Carlson School of Management and a policy fellow for Growth amp Justice
dane smith is the president of Growth amp Justice
Widening economic inequality in minnesota
Growth amp Justice 2
There are those who recognize growing inequality but conclude that it is not a major concern Inequality is an unavoidable part of a modern economy and a free society they say and public policy or governmental action to arrest it would only harm overall economic performance In Section IV we marshal evidence challenging the notion that citizens believe income disparity to be unimportant They perceive inequality to be lower than it is and wish it to be lower still
If inequality is high and rising perhaps the most important questions of all have to do with causation In Section V we consider broad factors commonly cited One view is that globalization and technical change reduce opportunities for the least educated workers and increase the economic opportunities of the most educated According to this view income inequality will inevitably continue to increase Another view however is that intentional public policy over the last 35 years has disproportionately benefitted those at the top of the income ladder According to this view recent increases in inequality were not inevitable and could be reversed by changes in public policy that favor the 99
We conclude that globalization and other market factors would have increased inequality absent public policies to counteract those forces But we also conclude that public policy choices have not only failed to counteract those forces but have directly and substantially contributed to increasing inequality poverty and income concentration at the top
An important goal of this report is to tell this story in greater detail to explain the evidence and the many ways of thinking about it And we want to emphasize that the fact of high and rising inequality in America is not controversial among the experts who study these things Itrsquos accepted reality
Finally in Section VI we propose a specific step to help policymakers understand the impact that proposed policies would have on inequality We recommend a measure of policy impact on inequality the Economic Inequality Impact Assessment (EIIA) which would accompany all economically significant legislation in the State We note parallels to the Environmental Impact Statement used throughout our regulatory realm since the early 1970s to ensure that new proposals and projects do not impose undue burdens upon our environmental and natural resources
II trends overvIew InequalIty In mInnesota and the us Is hIgh and growIng
The issue of economic inequality in the US is contentious Some believe fervently that it constitutes an existential threat to the American way of life Others see it as an unavoidable indeed a desirable part of our economy Still others when faced with claims that inequality is at historic highs and that American inequality outstrips that in other affluent western nations simply refuse to believe the evidence
Letrsquos look first at the most widely accepted statistical indicators
Figure 1 shows the path of median household income for the US and for Minnesota from 1984 to 2011 Median income is that of the household in the exact middle of the distribution of all incomes The values are in constant 2011 dollars corrected for inflation We can see that Minnesota median income is and has been above the national level for nearly the entire period While median income has fallen throughout the US since peaking in 2000 Minnesota median income has fallen much more quickly Minnesota median household income has fallen by $13000 over the last decade a decline of 18 No other state has seen a decline this steep By comparison median income over the same period fell almost 9 percent in the nation as a whole
$40000
$45000
$50000
$55000
$60000
$65000
$70000
$75000
United States
Minnesota
1984
1994
1993
1992
1991
1990
1989
1988
1987
1986
1985
2004
2003
2002
2001
2000
1999
1998
1997
1996
1995
2011
2010
2009
2008
2007
2006
2005
Year
Med
ian
hous
ehol
d in
com
e
Fig 1 - minnesota amp us median income1984 - 2011 2011 dollars
source US Census Bureau Current Population Survey
Widening economic inequality in minnesota
Growth amp Justice 3
The entire US distribution of income can be depicted in a histogram as in Figure 2 There the horizontal axis shows annual gross income ranging from zero to $500000 The vertical axis shows the number of ldquotaxpaying unitsrdquo (that is anyone who filed a 1040 form with the IRS) whose 2011 income fell in each $10000 increment
We see that 18 million taxpayers reported income below $10000 in 2011 Another 23 million reported income between $10000 and $20000 And so on The median income level which splits the population of 160 million taxpayers in half (80 million below and 80 million above) is $42327 (note that households are defined differently than ldquotaxpaying unitsrdquo)
Only five percent of taxpayers (thatrsquos 8 million) came in with income above $195000 One percent (thatrsquos 16 million) had income above $500000 The taller bar at the far right represents these 16 million whose income is high enough to make them tumble off the chart
How wide would the chart need to be in order to find room for the highest level of income gained in 2012 by any one individual That person is David Tepper the founder of Appaloosa Management a hedge fund Tepperrsquos income for the year stood at $22 billion
On the printed page the $500000 mark on our chart is just about 6 inches from the zero mark Tepperrsquos $22 billion is 4400 times as far along the horizontal axis This means that in order to find room for him the chart would need to be 2200 feet wide Thatrsquos nearly half a mile Meanwhile 80 million American taxpayers reside in the first frac34 of an inch
This is income inequality
0
5
10
15
20
25
gt50049
047
045
043
041
039
037
035
033
031
029
027
025
023
021
019
017
015
013
011
09070503010
20 50 80 90 95 99
Median income $42327
Top 2012 income$22 billion
(David Tepper)
Figure 2 Distribution of US income 2011
Num
ber o
f tax
uni
ts m
illio
ns
Income increments US tax units $1000s
source Center for Budget and Policy Priorities
Widening economic inequality in minnesota
Growth amp Justice 4
Three other principal methods for measuring inequality are the share of income going to the richest the Gini coefficient and the poverty ratemdashan arbitrary federal government standard below which families are judged to be unable to provide for basic needs The first of these measures places emphasis on the top of the income distribution the last on the bottom The Gini coefficient is based upon the entire distribution from top to bottom
First the top income share If incomes were entirely equal across households the top 1 would receive 1 of the income Of course incomes are not equal and one would not expect them to be But just how unequal are they Economist Emmanuel Saez and his collaborators proprietors of the World Top Incomes Database1 have compiled a unique set of historical income and tax data from US income-tax returns running back to 1913
Their numbers in Figure 3 show that the share of income going to the richest 1 of US households recently reached 24 a level last seen in 1928 ahead of the stock-market crash of 1929 Inequality measured by top income shares roared upward during the roaring twenties then fell again along with the stock market at the end of that decade The Second World War drove top shares down still further through the 1940s Over the ensuing three decades the rate remained relatively low hovering around 10 In about 1980 it began a long and inexorable climb ascending once again to the 24 mark in 2007 The recession of 2008-09 drove the top share back down but the number has turned upward once again since 2010
1 The collaborators are Thomas Piketty Anthony Atkinson and Facundo Alvaredo That database can be accessed at g-mondparisschoolofeconomicseutopincomes
0
5
10
15
20
25
30
1913
1916
1925
1922
1919
1928
1931
1934
1937
1940
1943
2000
1997
1994
1991
1988
1985
1982
1979
1976
1973
1970
1967
1964
1961
1958
1955
1952
1949
1946
2009
2006
2003
Fig 3 US top 1 income shares including capital gains
Top
1 in
com
e sh
are
US
Yearsource World Top Incomes Database
Widening economic inequality in minnesota
Growth amp Justice 5
Incomes for the entire country have risen in the past several decades but the gains have been uneven Those at the top have seen their income rise handsomely while everyone else has seen little gain Figure 4 shows the breakdown The blue curve represents the poorest 20 of households whose incomes rose by about 40 in inflation-adjusted dollars during the 30-year period Thatrsquos about 1 per year The orange curve represents households between the 20th and the 80th percentiles Their incomes rose a little less than the bottom quintile by about 36 in total The gray curve represents households between the 80th and 99th percentiles Their incomes rose by about 60 even after dropping dramatically during 2008 and 2009
The striking curve is the top curve in green It represents the income trajectory of the top 1 whose incomes grew by 300 through 2007 before dropping dramatically during the recent downturn As noted below the top 1 has garnered most of the increased household income since 2009
The economy continues to sputter but in 2010 (the most recent year for which we have data) US aggregate household income began once again to march upward In a recent study Emanuel Saez dug into the distribution of this increase across income groups His findings are startling average family income grew by 23 between 2009 and 2010 but fully 93 of this increase was captured by the richest 1 of households The remaining 99 were left to scramble for the other 7 These numbers translate into an increase of 116 for the top 1 and an average increase of 02 for everyone else2
The Gini coefficient devised in 1912 by the Italian economist Corrado Gini measures the level of inequality for an entire income distribution It ranges from zero (if every household has the same income) to one (if one household has all of the income) A bigger Gini means higher inequality
The Gini coefficient is the oil tanker of inequality measures It doesnrsquot change very fast over time even if top income shares are rising quickly Changes in the Gini that appear to be small which might be said of the numbers described here represent fairly hefty increases in inequality
2 The fact that only the richest households experienced a significant gain in income yet the average income rose quite a lot illustrates an important point about average and median Median represents the middle of a distribution There are equal numbers of households to the right and to the left of the median Average income is total national income divided by the number of households If Bill Gatesrsquo income were to double it would have a noticeable effect on average income but the median income would be unchanged For this reason economists usually use the median rather than the average to describe the center of the income distribution
-50
0
50
100
150
200
250
300
350
1979
1980
1983
1982
1981
1991
1990
1989
1988
1987
1986
1985
1984
2002
2001
2000
1999
1998
1997
1996
1995
1994
1993
1992
2007
2006
2005
2004
2003
2009
2008
0 - 20
21 - 80
Top 1
81 - 99
Income percenles
G
row
th in
afte
r-tax
inco
me
Yearsource Congressional Budget Office
Fig 4 Growth in after tax income by income category 1979-2009
Widening economic inequality in minnesota
Growth amp Justice 6
Figure 5 compares Gini coefficients for the US and Minnesota for each of the last four decennial censuses (State-level Ginis are not available every year) Though inequality is lower in Minnesota than in the US both numbers have been rising steadily for at least the past four decades We will see in Section IV that the Gini for both the US and for Minnesota exceeds the number found in most other rich industrialized countries
Poverty rates convey yet another picture of inequality As the economy waxes and wanes the number of people living below the poverty line also waxes and wanes What does it mean to be in poverty Each year the Census Bureau publishes a table of income thresholds depending on the size and demographic make-up of a household that determine whether a given family is living in poverty In 2011 the poverty threshold for a family of two adults and two children was $22811 If such a family has total income below this level all four members adults and children alike are judged to be living in poverty The threshold for a single adult aged less than 65 was $11702
The income level marking the bottom of the top quintile precisely 80 along the income distribution is $100065 A person living in such a family or one that lies even further up the income scale might face some difficulty in imagining what it must be like to get by on only $22811 How exactly does a family pay the rent put food on the table buy gas for the drive to work and buy health coverage and clothes for the four members of the household Too often for one or more categories one doesnrsquot
In 2011 an all-time high of 462 million Americans lived below the poverty line This translates into 150 of all citizens a rate last touched in 1993 Figure 6 shows the evolution of the poverty rate since 1995 in the US and in Minnesota Both have been marching upward since 2000 Minnesotans do not reside in poverty at the same rate as do Americans more generally but even here the rate has lately crept above 10 The number of Minnesotans living in poverty now exceeds half a million These numbers represent a tremendous amount of aggregate misery and anxiety across the state
Pove
rty
rate
Yearsource US Census Bureau
Fig 6 Poverty rates US amp MN 1995 - 2010
4
6
8
10
12
14
16
18
2002
2001
2000
1999
1998
1997
1996
1995
2007
2006
2005
2004
2003
2009
2008
US
MN
2010
Gini
coe
ffici
ent
034
036
038
040
042
044
046
048
2009199919891979
MN
US
Yearsource US Census Bureau
Fig 5 Gini Coefficients US and Minnesota
Widening economic inequality in minnesota
Growth amp Justice 7
III InequalIty Is hIghest where Income Is lowest
Whenever the rising tide of inequality is decried there doubtless will be plenty of respondents who express a firm and abiding disbelief in the numbers Just as there are many who deny the science indicating global climate change so there are many who deny the evidence indicating that inequality is on the rise
Many theories have been advanced to explain this resistance to accept the evidence One likely possibility is that a great many Americans and a great many Minnesotans live in places where income is high and inequality is low The importance of this empirical fact can hardly be overstated inequality tends to be highest where income is lowest
Minnesotarsquos suburban metro counties for instance rank at or near the top of the list with respect to median income They rank at or near the bottom of the list with respect to the Gini coefficient and the poverty rate People who live in these counties may have little or no first-hand experience with inequality or with widespread poverty Convincing them to believe in something their eyes rarely see can be a challenge
It should not be surprising that inequality varies across the landscape Aggregate numbers whether for all of the US or all of Minnesota mask important variability within the relevant population And the pattern is consistent The upper left map in Figure 7 shows median income by state across the 48 contiguous US states The light gray color represents the lowest median income level The upper right map shows Gini coefficients The orange represents the highest level of inequality The lower map shows the poverty rate by state with orange indicating a higher poverty rate The correlation is imperfect but still striking Many of the lowest-income states are to be found in the south where inequality and poverty rates both tend to be high
Gini Coefficient
Fig 7 Median income Gini coefficient and poverty rate 2011 US states
source US Census Bureau
lt $456000 gt $59500$47500 - $52000$45600 - $47500 $52000 - $59500 lt 0432 gt 04690453 - 04670432 - 0453 0467 - 0469
85 - 118 162 - 219123 - 142118 - 123 142 - 162
median Income
Poverty Rate
Widening economic inequality in minnesota
Growth amp Justice 8
Figure 8 shows the relationship between state-level median income and the Gini coefficient in a scatter plot The line represents the general relationship between income and inequality Its downward slope tells us that inequality tends to be lowest where income is highest
Median household income has risen little over the last 30 years and has actually fallen since 2000 Minnesota compares favorably to the US as a whole but the advantage is slipping Our median household income remains higher and our inequality and poverty rates are lower than average but much of that favorable relative standing has disappeared since 2000 Our income is declining and inequality is rising absolutely and relative to other states Over the last 10 years we have fallen from 9th lowest Gini to 13th Our poverty rate has worsened from the 3rd lowest to 11th lowest
Iv Income InequalIty IncreasIngly becomes a publIc concern and economIc threat
The evidence is clear that inequality in America is rising The question of whether rising inequality is a cause for concern though is more contentious There are those who see it as a grave threat Others see it as a sign of a healthy and vigorous capitalist economy Some inequality is essential in producing opportunities and incentives for individuals to create new products to invest in innovative ideas and to work hard The economy as a whole is more productive and aggregate wealth is higher when innovation is vigorous and capital is put to its most valuable use The incentive to ldquoget richrdquo helps drive initiative and innovation
Accepting a life of grinding penury for large portions of the populace is offensive to empathetic and humane sensibilities and has been throughout human history But the acceleration of inequality trends in recent years is provoking important questions about the effect on growth itself Is economic growth threatened by inequality Does high inequality cause the economy as a whole to produce less for all
Median household income
Gini
coe
ffici
ent
Fig 8 Income and Gini Coefficients US States (2011)
source US Census Bureau
$35000 $40000 $45000 $50000 $55000 $60000 $65000 $70000
040
041
042
043
044
045
046
047
048
049
050
051
MN
US
High inequality
Low inequality
Widening economic inequality in minnesota
Growth amp Justice 9
These crucial questions occupy us in this section In particular we ask whether there is a level of inequality above which the positive incentives to contribute to economic performance are more than offset by the social costs And if so have we yet reached or exceeded that level
Some think that continued growth in inequality will continue to benefit society In this view economic growth is now hampered by public policies that overly limit the economic rewards to investment and effort In this view taxes and costly regulatory burdens to innovation investment and hard work need to be reduced Witness recent calls for lower top tax rates elimination of the Environmental Protection Agency and efforts to pass ldquoright to workrdquo laws
Others believe that increases in income inequality over the last thirty years are creating social harm sufficient to more than offset any benefits of additional economic growth Some go further providing evidence that current levels of inequality are actually reducing growth
We support the latter view that income inequality has crossed a threshold that threatens overall growth and that it is an issue of great importance In this section we present facts which establish the relative public ignorance about inequality discuss its actual damage to economic growth and provide some explanation of the cause-and-effect dynamics
perceived Actual and Desired Inequality
Inequality is an important issue if Americans believe it is an important issue In a study published in 2011 economists Michael Norton and Dan Ariely asked a random sample of 5522 Americans to rank three alternative distributions of wealth for a society3 The three distributions were as depicted in Figure 9 The first in 9a is the actual distribution of wealth in the US The richest 20 of American households hold 84 of total wealth and the poorest 20 of households hold 01 The third in 9c is a hypothetical distribution in which each fifth of the population has the same level of wealth This represents perfect equality The middle distribution 9b is a hypothetical intermediate wealth distribution There the richest 20 hold 36 of the wealth and the poorest 20 hold 11
Respondents to the online survey were asked to imagine that they might be a member of a given society but that their own place in the society would be determined by chance Which society would they rather inhabit They were provided an opportunity to choose from the three societies depicted in Figure 9 (without being told that 9a was the actual distribution of wealth in the US) Norton and Ariely discovered that for their respondents the least desirable alternative is the actual US distribution depicted in 9a The top choice for desired actual distribution was the intermediate distribution (9b) with 47 making it their first choice The equal distribution (9c) was next with 43 choosing it The actual US wealth distribution (9a) came last with only 10 choosing it
3 Wealth is different from income Also called net worth wealth is the value of all assets less the value of all debts owed Wealth is more concentrated than is income among the richest households
Top 20
Boom 20
Middle 204th 20
2nd 2084
1184
0201
Fig 9a US wealth distribution
Top 20
Boom 20
Middle 204th 20
2nd 20
2020
20
2020
Fig 9c Equal wealth distribution
Top 20
Boom 20
Middle 204th 20
2nd 2018
11 15
21
36 18
Fig 9b Intermediate wealth distribution
Widening economic inequality in minnesota
Growth amp Justice 10
Norton and Ariely then asked two further questions The first asked respondents to specify the level of wealth inequality that they believe exists in the US The second asked them to specify the level of wealth that they would like to see in the US Figure 10 taken from Norton and Arielyrsquos published study shows the results of these questions The first bar shows the actual US wealth distribution The second shows the average of respondentsrsquo estimates of the US wealth distribution The third shows the average of respondentsrsquo ideal US wealth distribution
Two main lessons may be drawn from these results The first is that people appear to underestimate dramatically the level of wealth inequality in the US economy The average person believes that the richest quintile holds about 57 of wealth when the actual share is 84 Second people wish that wealth inequality were even lower than they believe it to be The average person feels that the richest quintile should hold about 32 of wealth
Norton and Ariely confirm our belief that most favor some inequality Most would prefer less inequality than they think exists and would prefer far less than actually exists Our point is that most Americans think current inequality is excessive and likely would feel stronger about that if they knew the actual facts
Inequality and Growth
As we have posited earlier a certain amount of inequality is inevitable and most economists would agree that some is essential for healthy and vigorous economic growth As inequality increases though the marginal benefit to output from additional inequality logically declines Has inequality risen to a point where the marginal effects on output are actually negative That is is inequality now so high that recent widening has caused lower GDP than we would have had with the lower levels of inequality of the middle of the last century (a period of consistently high growth)
Ramaprasad Rajaram of the University of Georgia believes so In his 2010 PhD dissertation Poverty Income Inequality and Economic Growth in US Counties A Spatial Analysis he considers the effects of income inequality and poverty on economic growth He relates per capita income growth to poverty rates and overall income inequality (Gini coefficients) in 3072 US counties using data from the 1980 (1979 data) and 2000 (1999 data) US Census He assesses the relationship of poverty in 1979 to growth from 1979 to 1999 and finds that counties with lower poverty rates in 1979 grew on average significantly more quickly during the next 20 years He similarly found that counties with less overall income inequality in 1979 grew on average significantly more quickly than those with higher income inequality in 1979
He then went a step further looking at actual growth from 1979 to 1999 as a predictor of 1999 poverty and inequality measures He found that counties that grew more quickly from 1979 through 1999 had lower poverty rates and overall inequality at the end of the period Finally he split the counties into ldquorichrdquo and ldquopoorrdquo to see whether the effects differed He found little difference
Actual
Estimated
Preferred
Top 20 Second 20 Fourth 20 Bottom 20Middle 20
0 10 20 30 40 50 60 70 80 90 100
Percent of wealth owned
Fig 10 Actual estimated and preferred US wealth distributions
Widening economic inequality in minnesota
Growth amp Justice 11
His results tell a compelling story Those areas with less inequality and poverty today all else equal can expect higher future growth in future per capita income In the future those that actually experienced the highest growth are likely to have lower poverty and overall inequality In summary those that grow quickly are likely to be the ones that start with lower inequality The resulting high growth in turn has a dampening effect on future increases in inequality This is a virtuous cycle in which if all share in growing prosperity prosperity grows more rapidly
Inequality and Demand for Goods and Services
US consumers have driven the growth of the US economy at least since World War II Personal consumption has been about 70 of Gross Domestic Product (GDP) Through at least 1979 this consumption was driven by a broad and growing middle class and growing income widely shared across the income distribution Continued long-term growth likely will continue to depend on growing consumption If personal consumption is to remain at 70 of GDP it must grow at the same rate as GDP
As household income increases consumption increases along with it This has the effect of increasing the demand for the goods and services that give rise to the additional income Poor households spend nearly all their increases in income while middle income households spend most of the increases Those at the top spend a smaller proportion of additional income
When incomes at the top are growing much more quickly than those in the middle and the bottom of the distribution consumption naturally declines as a share of GDP In 2010 a year of weak economic recovery 93 of the growth in income went to the top 1 of households As a result this apportionment of additional personal income generated less additional demand for goods and services This perverse braking effect might be viewed as a downward spiral a vicious circle Slowing economic growth leads to increased inequality which then leads to even slower growthIn summary most Americans wish for less inequality than we have even while they underestimate the degree of current inequality Higher inequality inevitably produces lower growth because the wealthy spend less of their income than those less wealthy As income goes increasingly to the wealthy demand for goods and services is less than optimum Growth is constrained as inequality increases beyond a level that encourages growth
v causes oF InequalIty
Why exactly have poverty rates and income inequality increased so dramatically since 1980 Was it unavoidable What of the future How might we prevent further widening or even reverse the trend
Some observers explain our rising inequality as the inevitable result of advancing technology with its attendant rewards for the skilled workers who are able to perform high-tech jobs Others explain it as the inevitable result of increasing globalization in the world economy These two factors are certainly implicated Both have helped to increase global output and global incomes but both have also imposed costs on some people in some places Both have also shoveled generous rewards to a favored few Those bearing the highest costs have been the middle and lower classes in the developed world Those favored include those with capital and those who are highly educated in fields that allow them to take full advantage of globalization and technological advances
Globalization and technological advances generally benefit the same segments of society Globalization has made both production and capital more mobile without equivalent increases in labor mobility Businesses now face fewer legal and institutional impediments to movement of capital goods and services in and out of countries
Advances in technology have reduced the costs of moving goods and services from one country to another For example some accounting firms have American clientsrsquo tax returns prepared in India That is possible only because of recent changes in communications technology and institutions that allow exports of the services from India and import of those services to the US without expensive trade restrictions Here the shareholders of the accounting firm gain through lower costs while less work is available for American tax preparers Further downward pressure is exerted on the wages of the remaining tax preparers
Endless examples of ldquooutsourcingrdquo job loss and downward pressure on working-class Americans have become the staple of economic conversation for three decades Taken together and across the economy these examples create
Widening economic inequality in minnesota
Growth amp Justice 12
conditions that have increased inequality and poverty in the US Was this inevitable Is it necessary that poverty and inequality must increase as a result of technological changes and globalization
We do not believe so Public policies could have largely or completely mitigated the effects of technological changes and globalization Further we believe that government policies enacted over the last thirty years have not only failed to mitigate the effects but have independently increased poverty and inequality In short we are hopeful about the possibility of policy action mitigating inequality And we believe past and future increases in inequality and poverty are not inescapable and can be reversed
First let us look at the experiences of some other industrialized democratic countries They have faced the same forces of globalization and technological change Yet inequality and poverty in many of those countries has not changed appreciably
As noted earlier much of the growth in incomes in the US has been captured by those with incomes in the top 1 Figure 11 shows the path of top 1 income shares for the US Japan Australia and France all from 1913 to 20094 The message from this international comparison is that rising inequality is neither inevitable nor is it necessary for an economy to perform well Alone among the four rich countries shown the US has seen a dramatic rise in the top income share
Overall inequality as measured by the Gini coefficient (Figure 12) similarly demonstrates that the US is more unequal than other high income countries France Canada and Norway represent the other developed countries and have substantially lower inequality than the US In fact these countries have Gini coefficients not seen in the US since the 1970s Note that these are estimates made by The World Bank and differ somewhat from those for the US as estimated by the US Census Bureau
4 These data are different from those in Figure 3 in that income from capital gains is excluded in Figure 11 The source database includes information on capital gains income for the US but not for the other countries
0
5
10
15
20
25
1915
1920
1935
1930
1925
1945
1955
1980
1985
1950
1940
2000
1960
1965
1970
1975
1995
1990
2005
2010
Australia - Atkinson amp Leigh (2007)Japan - Moriquchi amp Saez (2010)
United States - Pikey amp Saez (2007) France - Pikey (2001 2007) Landais (2007)
Fig 11 Top 1 income shares for the United States Australia France amp Japan 1913 - 20011
Year
Inco
me
shar
e
source World Top Incomes Database
00
010
020
030
040
050
060
Norway Canada France India UnitedStates
China Brazil
0415
055
0408
03270368
0326
0258
Fig 12 Gini coefficients for selected countries
source The World Bank
Widening economic inequality in minnesota
Growth amp Justice 13
Figure 13 from the Organization for Economic Cooperation and Development (OECD) shows poverty rates in the mid-2000rsquos for selected OECD countries We stand near the top In the figure each bar represents the percentage of a countryrsquos population living in households with less than 50 of that countryrsquos median income According to this measure the US has the third-highest poverty rate in the OECD at 173 Americarsquos 2010 median income was $49445 We can say then that 173 of all US households had income that year below $24722 Note that the poverty rate as measured by the OECD is higher than reported by the US Census Bureau That agency defines poverty differently than the OECD
Other high income countries have faced globalization and technological changes without a rapid proportional rise in incomes at the top dramatic increases in overall inequality or similar levels of poverty Our neighbor Canada reports median family income of $69860 in 2010 While the definition used by Statistics Canada may differ from that of our Census Bureau it seems reasonable to conclude that Canadian household income is at least comparable to that in the US Canada now has lower unemployment and growth rates similar to ours Canada is doing at least as well as we are economically without our high levels of inequality and poverty
We conclude that recent and future increases in inequality are not inevitable and that we could reduce inequality in the future
vI a proposal For a new polIcy evaluatIon tool the ldquoeconomIc InequalIty Impact assessmentrdquo
In the late 1960s as awareness spread about the threat posed by pollution of all kinds to property and especially to human health policymakers in the United States began to adopt laws appropriations and regulations designed to reduce or remediate environmental damages
Many of the laws and regulations simply required reductions in pollutants and emissions or banned the use of the worst toxins such as DDT But one of the most important provisions was the introduction of requirements to estimate in advance the environmental impact from pending development projects or policies The Environmental Impact Statement or EIS became a useful and accepted policy development tool
We believe growing inequality represents a similar threat to our societyrsquos long-term well-being A further concentration of income and wealth in fewer and fewer households and the accompanying rise in poverty and the decline of middle-income economic stability compels policymakers at all levels to conduct a more systematic assessment of economic inequality impact before they make decisions that could further exacerbate inequality We propose that all economically significant legislation and new state regulations in Minnesota should be subjected to an analysis that measures the policyrsquos impact on economic inequality
The experience with environmental impact measurement is encouraging In a 1994 paper noted environmental law professor William H Rodgers Jr included the EIS in his list of the seven most influential or effective US
0
5
10
15
20
25
Denmark Sweden OECD UnitedKingdom
Canada UnitedStates
Mexico
173
21
114111 113
84
61
Fig 13 Poverty rates at 50 or less of median income for selected OECD countries
source Organization for Economic Cooperation and Development (OECD)
Widening economic inequality in minnesota
Growth amp Justice 14
environmental laws The EIS was part of the National Environmental Policy Act of 1969 (NEPA) and requires federal agencies to prepare an EIS to accompany any agency action that has a significant effect on the human environment Rodgers noted that environmental impact statements were ldquoreplicated in rapid fashion throughout the United States and around the worldrdquo and have become ldquothe most frequently copied and most frequently cited of all US domestic environmental lawsrdquo 5
Legislators and other policymakers in Minnesota could develop an Economic Inequality Impact Assessment (EIIA) for all major policies that are likely to have a measurable effect on income or wealth distribution (This specific title and acronym used hereafter is the creation of the authors of this report we hope to popularize the concept but are not adamant about how it is labeled or the specifics of its implementation)
Minnesota already has a reputation among the states for distinctive high-quality economic measurement tools The Price of Government measurement and the biennial Tax Incidence Study both launched in the 1990s and updated regularly provide uniquely detailed perspective on the overall size of state-and-local government as a percent of income (Price of Government) and how the taxes for that public investment is paid by economic strata (Tax Incidence Study) These tools have greatly enabled quantitative analysis of relative fairness and equality
Legislative and executive branch staffers are familiar with the concept of projecting the costs and benefits of potential policy When legislators advance bills that directly or indirectly create a cost for state or local governments they must seek fiscal notes which calculate the costs of the proposed legislation
Support for measuring projected inequality particularly as it relates to poverty has come in recent years from a growing national coalition of community and philanthropic efforts and Minnesota has been a leader in this effort
The Washington DC based Center for Law and Social Policy (CLASP) published a summary of federal and state efforts that align with a CLASP initiative for Poverty Impact Projections (PIP) The PIP concept as described in that 2011 CLASP report could be easily applied to a broader Economic Inequality Impact Assessment
As stated in the CLASP study ldquoGetting a clearer prognosis of the potential impact of a pending policy is valuable not just for elected officials who need to vote on bills but also for other policymakers and community stakeholders who need to make planning and implementation decisionsrdquo 6
Minnesota is one of the few states highlighted in the CLASP report as having done the most to advance the concept of poverty impact projections noting that just such a mechanism was a key recommendation of the Legislative Commission to End Poverty in Minnesota by 2020 Along with many other local groups particularly the nonprofit organization A Minnesota Without Poverty we encourage efforts toward establishing a poverty impact projection but submit that a broader top-to-bottom evaluation of policy in the form of an Economic Inequality Impact Assessment would be even more valuable
5 Rodgers Jr W H (1994) The Seven Statutory Wonders of US Environmental Law Origins and Morphology Loyola of Los Angeles Law Review 1009-1022 Available at httpdigital commonslmuedullrvol27iss315
6 Levin-Epstein J amp Sanes M (August 2011) At the Forefront Poverty Impact Projections Washington DC CLASP
Widening economic inequality in minnesota
Growth amp Justice 15 2324 University Ave W Suite 120 A Saint Paul MN 55114 wwwgrowthandjusticeorg
Smart Investments Practical Solutions Broader Prosperity
We do not offer here a precise formula for an EIIA But our conversations and interviews with state tax and budget experts suggest the following in regard to practical design and implementation of an EIIA for Minnesota
bull The EIIA could be housed in the Minnesota Management and Budget agency within the office of the State Economist The agency commissioner could appoint an advisory group of economic experts to assist in designing an EIIA process and methodology
bull An EIIA for tax bills could begin in the Revenue Department using more detailed projections about the impact of various tax proposals on the Suits index and other measurements of tax incidence
bull An EIIA could initially calculate the estimated direction of the effect on inequality measures rather than predict specific numerical outcomes An EIIA likely would need to have a de minimis threshold as do fiscal notes in the state budget process so that not every bill or proposal coming before a committee would need to be assessed
bull Scores of specific policy proposals aimed at reducing inequalitymdashinvestment in early childhood education higher minimum wages elimination of high-income tax cuts and breaksmdashare proposed every year by national and state policymakers In many cases the effects on reducing inequality are obvious intuitively But how much more valuable would it be for policymakers to have more precise information about the relative impacts of such proposals
Better economic information will help policymakers navigate toward a more equitable and sustainable economy and society Establishment of an Economic Inequality Impact Assessment would be a valuable addition to the policymaking toolbox
about the authors
Jay Coggins is an associate professor with the Department of Applied Economics at the University of Minnesota and a policy fellow for Growth amp Justice
thomas legg is a senior lecturer at the University of Minnesotarsquos Carlson School of Management and a policy fellow for Growth amp Justice
dane smith is the president of Growth amp Justice
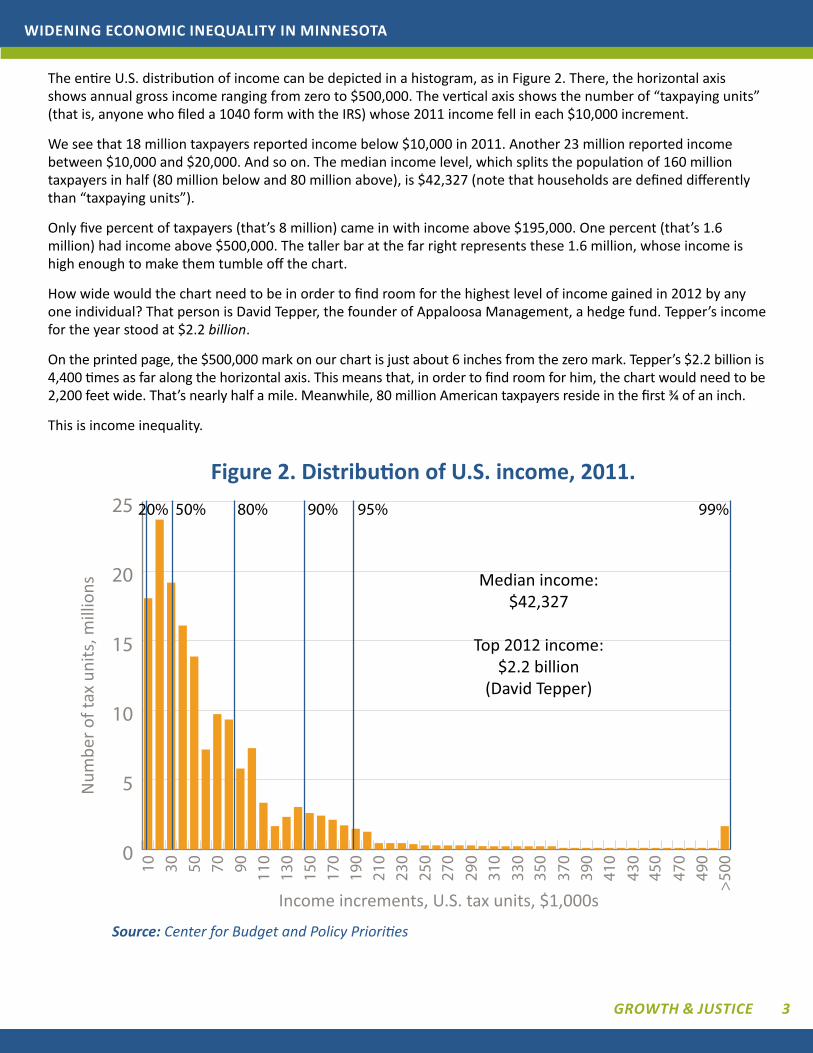
Widening economic inequality in minnesota
Growth amp Justice 3
The entire US distribution of income can be depicted in a histogram as in Figure 2 There the horizontal axis shows annual gross income ranging from zero to $500000 The vertical axis shows the number of ldquotaxpaying unitsrdquo (that is anyone who filed a 1040 form with the IRS) whose 2011 income fell in each $10000 increment
We see that 18 million taxpayers reported income below $10000 in 2011 Another 23 million reported income between $10000 and $20000 And so on The median income level which splits the population of 160 million taxpayers in half (80 million below and 80 million above) is $42327 (note that households are defined differently than ldquotaxpaying unitsrdquo)
Only five percent of taxpayers (thatrsquos 8 million) came in with income above $195000 One percent (thatrsquos 16 million) had income above $500000 The taller bar at the far right represents these 16 million whose income is high enough to make them tumble off the chart
How wide would the chart need to be in order to find room for the highest level of income gained in 2012 by any one individual That person is David Tepper the founder of Appaloosa Management a hedge fund Tepperrsquos income for the year stood at $22 billion
On the printed page the $500000 mark on our chart is just about 6 inches from the zero mark Tepperrsquos $22 billion is 4400 times as far along the horizontal axis This means that in order to find room for him the chart would need to be 2200 feet wide Thatrsquos nearly half a mile Meanwhile 80 million American taxpayers reside in the first frac34 of an inch
This is income inequality
0
5
10
15
20
25
gt50049
047
045
043
041
039
037
035
033
031
029
027
025
023
021
019
017
015
013
011
09070503010
20 50 80 90 95 99
Median income $42327
Top 2012 income$22 billion
(David Tepper)
Figure 2 Distribution of US income 2011
Num
ber o
f tax
uni
ts m
illio
ns
Income increments US tax units $1000s
source Center for Budget and Policy Priorities
Widening economic inequality in minnesota
Growth amp Justice 4
Three other principal methods for measuring inequality are the share of income going to the richest the Gini coefficient and the poverty ratemdashan arbitrary federal government standard below which families are judged to be unable to provide for basic needs The first of these measures places emphasis on the top of the income distribution the last on the bottom The Gini coefficient is based upon the entire distribution from top to bottom
First the top income share If incomes were entirely equal across households the top 1 would receive 1 of the income Of course incomes are not equal and one would not expect them to be But just how unequal are they Economist Emmanuel Saez and his collaborators proprietors of the World Top Incomes Database1 have compiled a unique set of historical income and tax data from US income-tax returns running back to 1913
Their numbers in Figure 3 show that the share of income going to the richest 1 of US households recently reached 24 a level last seen in 1928 ahead of the stock-market crash of 1929 Inequality measured by top income shares roared upward during the roaring twenties then fell again along with the stock market at the end of that decade The Second World War drove top shares down still further through the 1940s Over the ensuing three decades the rate remained relatively low hovering around 10 In about 1980 it began a long and inexorable climb ascending once again to the 24 mark in 2007 The recession of 2008-09 drove the top share back down but the number has turned upward once again since 2010
1 The collaborators are Thomas Piketty Anthony Atkinson and Facundo Alvaredo That database can be accessed at g-mondparisschoolofeconomicseutopincomes
0
5
10
15
20
25
30
1913
1916
1925
1922
1919
1928
1931
1934
1937
1940
1943
2000
1997
1994
1991
1988
1985
1982
1979
1976
1973
1970
1967
1964
1961
1958
1955
1952
1949
1946
2009
2006
2003
Fig 3 US top 1 income shares including capital gains
Top
1 in
com
e sh
are
US
Yearsource World Top Incomes Database
Widening economic inequality in minnesota
Growth amp Justice 5
Incomes for the entire country have risen in the past several decades but the gains have been uneven Those at the top have seen their income rise handsomely while everyone else has seen little gain Figure 4 shows the breakdown The blue curve represents the poorest 20 of households whose incomes rose by about 40 in inflation-adjusted dollars during the 30-year period Thatrsquos about 1 per year The orange curve represents households between the 20th and the 80th percentiles Their incomes rose a little less than the bottom quintile by about 36 in total The gray curve represents households between the 80th and 99th percentiles Their incomes rose by about 60 even after dropping dramatically during 2008 and 2009
The striking curve is the top curve in green It represents the income trajectory of the top 1 whose incomes grew by 300 through 2007 before dropping dramatically during the recent downturn As noted below the top 1 has garnered most of the increased household income since 2009
The economy continues to sputter but in 2010 (the most recent year for which we have data) US aggregate household income began once again to march upward In a recent study Emanuel Saez dug into the distribution of this increase across income groups His findings are startling average family income grew by 23 between 2009 and 2010 but fully 93 of this increase was captured by the richest 1 of households The remaining 99 were left to scramble for the other 7 These numbers translate into an increase of 116 for the top 1 and an average increase of 02 for everyone else2
The Gini coefficient devised in 1912 by the Italian economist Corrado Gini measures the level of inequality for an entire income distribution It ranges from zero (if every household has the same income) to one (if one household has all of the income) A bigger Gini means higher inequality
The Gini coefficient is the oil tanker of inequality measures It doesnrsquot change very fast over time even if top income shares are rising quickly Changes in the Gini that appear to be small which might be said of the numbers described here represent fairly hefty increases in inequality
2 The fact that only the richest households experienced a significant gain in income yet the average income rose quite a lot illustrates an important point about average and median Median represents the middle of a distribution There are equal numbers of households to the right and to the left of the median Average income is total national income divided by the number of households If Bill Gatesrsquo income were to double it would have a noticeable effect on average income but the median income would be unchanged For this reason economists usually use the median rather than the average to describe the center of the income distribution
-50
0
50
100
150
200
250
300
350
1979
1980
1983
1982
1981
1991
1990
1989
1988
1987
1986
1985
1984
2002
2001
2000
1999
1998
1997
1996
1995
1994
1993
1992
2007
2006
2005
2004
2003
2009
2008
0 - 20
21 - 80
Top 1
81 - 99
Income percenles
G
row
th in
afte
r-tax
inco
me
Yearsource Congressional Budget Office
Fig 4 Growth in after tax income by income category 1979-2009
Widening economic inequality in minnesota
Growth amp Justice 6
Figure 5 compares Gini coefficients for the US and Minnesota for each of the last four decennial censuses (State-level Ginis are not available every year) Though inequality is lower in Minnesota than in the US both numbers have been rising steadily for at least the past four decades We will see in Section IV that the Gini for both the US and for Minnesota exceeds the number found in most other rich industrialized countries
Poverty rates convey yet another picture of inequality As the economy waxes and wanes the number of people living below the poverty line also waxes and wanes What does it mean to be in poverty Each year the Census Bureau publishes a table of income thresholds depending on the size and demographic make-up of a household that determine whether a given family is living in poverty In 2011 the poverty threshold for a family of two adults and two children was $22811 If such a family has total income below this level all four members adults and children alike are judged to be living in poverty The threshold for a single adult aged less than 65 was $11702
The income level marking the bottom of the top quintile precisely 80 along the income distribution is $100065 A person living in such a family or one that lies even further up the income scale might face some difficulty in imagining what it must be like to get by on only $22811 How exactly does a family pay the rent put food on the table buy gas for the drive to work and buy health coverage and clothes for the four members of the household Too often for one or more categories one doesnrsquot
In 2011 an all-time high of 462 million Americans lived below the poverty line This translates into 150 of all citizens a rate last touched in 1993 Figure 6 shows the evolution of the poverty rate since 1995 in the US and in Minnesota Both have been marching upward since 2000 Minnesotans do not reside in poverty at the same rate as do Americans more generally but even here the rate has lately crept above 10 The number of Minnesotans living in poverty now exceeds half a million These numbers represent a tremendous amount of aggregate misery and anxiety across the state
Pove
rty
rate
Yearsource US Census Bureau
Fig 6 Poverty rates US amp MN 1995 - 2010
4
6
8
10
12
14
16
18
2002
2001
2000
1999
1998
1997
1996
1995
2007
2006
2005
2004
2003
2009
2008
US
MN
2010
Gini
coe
ffici
ent
034
036
038
040
042
044
046
048
2009199919891979
MN
US
Yearsource US Census Bureau
Fig 5 Gini Coefficients US and Minnesota
Widening economic inequality in minnesota
Growth amp Justice 7
III InequalIty Is hIghest where Income Is lowest
Whenever the rising tide of inequality is decried there doubtless will be plenty of respondents who express a firm and abiding disbelief in the numbers Just as there are many who deny the science indicating global climate change so there are many who deny the evidence indicating that inequality is on the rise
Many theories have been advanced to explain this resistance to accept the evidence One likely possibility is that a great many Americans and a great many Minnesotans live in places where income is high and inequality is low The importance of this empirical fact can hardly be overstated inequality tends to be highest where income is lowest
Minnesotarsquos suburban metro counties for instance rank at or near the top of the list with respect to median income They rank at or near the bottom of the list with respect to the Gini coefficient and the poverty rate People who live in these counties may have little or no first-hand experience with inequality or with widespread poverty Convincing them to believe in something their eyes rarely see can be a challenge
It should not be surprising that inequality varies across the landscape Aggregate numbers whether for all of the US or all of Minnesota mask important variability within the relevant population And the pattern is consistent The upper left map in Figure 7 shows median income by state across the 48 contiguous US states The light gray color represents the lowest median income level The upper right map shows Gini coefficients The orange represents the highest level of inequality The lower map shows the poverty rate by state with orange indicating a higher poverty rate The correlation is imperfect but still striking Many of the lowest-income states are to be found in the south where inequality and poverty rates both tend to be high
Gini Coefficient
Fig 7 Median income Gini coefficient and poverty rate 2011 US states
source US Census Bureau
lt $456000 gt $59500$47500 - $52000$45600 - $47500 $52000 - $59500 lt 0432 gt 04690453 - 04670432 - 0453 0467 - 0469
85 - 118 162 - 219123 - 142118 - 123 142 - 162
median Income
Poverty Rate
Widening economic inequality in minnesota
Growth amp Justice 8
Figure 8 shows the relationship between state-level median income and the Gini coefficient in a scatter plot The line represents the general relationship between income and inequality Its downward slope tells us that inequality tends to be lowest where income is highest
Median household income has risen little over the last 30 years and has actually fallen since 2000 Minnesota compares favorably to the US as a whole but the advantage is slipping Our median household income remains higher and our inequality and poverty rates are lower than average but much of that favorable relative standing has disappeared since 2000 Our income is declining and inequality is rising absolutely and relative to other states Over the last 10 years we have fallen from 9th lowest Gini to 13th Our poverty rate has worsened from the 3rd lowest to 11th lowest
Iv Income InequalIty IncreasIngly becomes a publIc concern and economIc threat
The evidence is clear that inequality in America is rising The question of whether rising inequality is a cause for concern though is more contentious There are those who see it as a grave threat Others see it as a sign of a healthy and vigorous capitalist economy Some inequality is essential in producing opportunities and incentives for individuals to create new products to invest in innovative ideas and to work hard The economy as a whole is more productive and aggregate wealth is higher when innovation is vigorous and capital is put to its most valuable use The incentive to ldquoget richrdquo helps drive initiative and innovation
Accepting a life of grinding penury for large portions of the populace is offensive to empathetic and humane sensibilities and has been throughout human history But the acceleration of inequality trends in recent years is provoking important questions about the effect on growth itself Is economic growth threatened by inequality Does high inequality cause the economy as a whole to produce less for all
Median household income
Gini
coe
ffici
ent
Fig 8 Income and Gini Coefficients US States (2011)
source US Census Bureau
$35000 $40000 $45000 $50000 $55000 $60000 $65000 $70000
040
041
042
043
044
045
046
047
048
049
050
051
MN
US
High inequality
Low inequality
Widening economic inequality in minnesota
Growth amp Justice 9
These crucial questions occupy us in this section In particular we ask whether there is a level of inequality above which the positive incentives to contribute to economic performance are more than offset by the social costs And if so have we yet reached or exceeded that level
Some think that continued growth in inequality will continue to benefit society In this view economic growth is now hampered by public policies that overly limit the economic rewards to investment and effort In this view taxes and costly regulatory burdens to innovation investment and hard work need to be reduced Witness recent calls for lower top tax rates elimination of the Environmental Protection Agency and efforts to pass ldquoright to workrdquo laws
Others believe that increases in income inequality over the last thirty years are creating social harm sufficient to more than offset any benefits of additional economic growth Some go further providing evidence that current levels of inequality are actually reducing growth
We support the latter view that income inequality has crossed a threshold that threatens overall growth and that it is an issue of great importance In this section we present facts which establish the relative public ignorance about inequality discuss its actual damage to economic growth and provide some explanation of the cause-and-effect dynamics
perceived Actual and Desired Inequality
Inequality is an important issue if Americans believe it is an important issue In a study published in 2011 economists Michael Norton and Dan Ariely asked a random sample of 5522 Americans to rank three alternative distributions of wealth for a society3 The three distributions were as depicted in Figure 9 The first in 9a is the actual distribution of wealth in the US The richest 20 of American households hold 84 of total wealth and the poorest 20 of households hold 01 The third in 9c is a hypothetical distribution in which each fifth of the population has the same level of wealth This represents perfect equality The middle distribution 9b is a hypothetical intermediate wealth distribution There the richest 20 hold 36 of the wealth and the poorest 20 hold 11
Respondents to the online survey were asked to imagine that they might be a member of a given society but that their own place in the society would be determined by chance Which society would they rather inhabit They were provided an opportunity to choose from the three societies depicted in Figure 9 (without being told that 9a was the actual distribution of wealth in the US) Norton and Ariely discovered that for their respondents the least desirable alternative is the actual US distribution depicted in 9a The top choice for desired actual distribution was the intermediate distribution (9b) with 47 making it their first choice The equal distribution (9c) was next with 43 choosing it The actual US wealth distribution (9a) came last with only 10 choosing it
3 Wealth is different from income Also called net worth wealth is the value of all assets less the value of all debts owed Wealth is more concentrated than is income among the richest households
Top 20
Boom 20
Middle 204th 20
2nd 2084
1184
0201
Fig 9a US wealth distribution
Top 20
Boom 20
Middle 204th 20
2nd 20
2020
20
2020
Fig 9c Equal wealth distribution
Top 20
Boom 20
Middle 204th 20
2nd 2018
11 15
21
36 18
Fig 9b Intermediate wealth distribution
Widening economic inequality in minnesota
Growth amp Justice 10
Norton and Ariely then asked two further questions The first asked respondents to specify the level of wealth inequality that they believe exists in the US The second asked them to specify the level of wealth that they would like to see in the US Figure 10 taken from Norton and Arielyrsquos published study shows the results of these questions The first bar shows the actual US wealth distribution The second shows the average of respondentsrsquo estimates of the US wealth distribution The third shows the average of respondentsrsquo ideal US wealth distribution
Two main lessons may be drawn from these results The first is that people appear to underestimate dramatically the level of wealth inequality in the US economy The average person believes that the richest quintile holds about 57 of wealth when the actual share is 84 Second people wish that wealth inequality were even lower than they believe it to be The average person feels that the richest quintile should hold about 32 of wealth
Norton and Ariely confirm our belief that most favor some inequality Most would prefer less inequality than they think exists and would prefer far less than actually exists Our point is that most Americans think current inequality is excessive and likely would feel stronger about that if they knew the actual facts
Inequality and Growth
As we have posited earlier a certain amount of inequality is inevitable and most economists would agree that some is essential for healthy and vigorous economic growth As inequality increases though the marginal benefit to output from additional inequality logically declines Has inequality risen to a point where the marginal effects on output are actually negative That is is inequality now so high that recent widening has caused lower GDP than we would have had with the lower levels of inequality of the middle of the last century (a period of consistently high growth)
Ramaprasad Rajaram of the University of Georgia believes so In his 2010 PhD dissertation Poverty Income Inequality and Economic Growth in US Counties A Spatial Analysis he considers the effects of income inequality and poverty on economic growth He relates per capita income growth to poverty rates and overall income inequality (Gini coefficients) in 3072 US counties using data from the 1980 (1979 data) and 2000 (1999 data) US Census He assesses the relationship of poverty in 1979 to growth from 1979 to 1999 and finds that counties with lower poverty rates in 1979 grew on average significantly more quickly during the next 20 years He similarly found that counties with less overall income inequality in 1979 grew on average significantly more quickly than those with higher income inequality in 1979
He then went a step further looking at actual growth from 1979 to 1999 as a predictor of 1999 poverty and inequality measures He found that counties that grew more quickly from 1979 through 1999 had lower poverty rates and overall inequality at the end of the period Finally he split the counties into ldquorichrdquo and ldquopoorrdquo to see whether the effects differed He found little difference
Actual
Estimated
Preferred
Top 20 Second 20 Fourth 20 Bottom 20Middle 20
0 10 20 30 40 50 60 70 80 90 100
Percent of wealth owned
Fig 10 Actual estimated and preferred US wealth distributions
Widening economic inequality in minnesota
Growth amp Justice 11
His results tell a compelling story Those areas with less inequality and poverty today all else equal can expect higher future growth in future per capita income In the future those that actually experienced the highest growth are likely to have lower poverty and overall inequality In summary those that grow quickly are likely to be the ones that start with lower inequality The resulting high growth in turn has a dampening effect on future increases in inequality This is a virtuous cycle in which if all share in growing prosperity prosperity grows more rapidly
Inequality and Demand for Goods and Services
US consumers have driven the growth of the US economy at least since World War II Personal consumption has been about 70 of Gross Domestic Product (GDP) Through at least 1979 this consumption was driven by a broad and growing middle class and growing income widely shared across the income distribution Continued long-term growth likely will continue to depend on growing consumption If personal consumption is to remain at 70 of GDP it must grow at the same rate as GDP
As household income increases consumption increases along with it This has the effect of increasing the demand for the goods and services that give rise to the additional income Poor households spend nearly all their increases in income while middle income households spend most of the increases Those at the top spend a smaller proportion of additional income
When incomes at the top are growing much more quickly than those in the middle and the bottom of the distribution consumption naturally declines as a share of GDP In 2010 a year of weak economic recovery 93 of the growth in income went to the top 1 of households As a result this apportionment of additional personal income generated less additional demand for goods and services This perverse braking effect might be viewed as a downward spiral a vicious circle Slowing economic growth leads to increased inequality which then leads to even slower growthIn summary most Americans wish for less inequality than we have even while they underestimate the degree of current inequality Higher inequality inevitably produces lower growth because the wealthy spend less of their income than those less wealthy As income goes increasingly to the wealthy demand for goods and services is less than optimum Growth is constrained as inequality increases beyond a level that encourages growth
v causes oF InequalIty
Why exactly have poverty rates and income inequality increased so dramatically since 1980 Was it unavoidable What of the future How might we prevent further widening or even reverse the trend
Some observers explain our rising inequality as the inevitable result of advancing technology with its attendant rewards for the skilled workers who are able to perform high-tech jobs Others explain it as the inevitable result of increasing globalization in the world economy These two factors are certainly implicated Both have helped to increase global output and global incomes but both have also imposed costs on some people in some places Both have also shoveled generous rewards to a favored few Those bearing the highest costs have been the middle and lower classes in the developed world Those favored include those with capital and those who are highly educated in fields that allow them to take full advantage of globalization and technological advances
Globalization and technological advances generally benefit the same segments of society Globalization has made both production and capital more mobile without equivalent increases in labor mobility Businesses now face fewer legal and institutional impediments to movement of capital goods and services in and out of countries
Advances in technology have reduced the costs of moving goods and services from one country to another For example some accounting firms have American clientsrsquo tax returns prepared in India That is possible only because of recent changes in communications technology and institutions that allow exports of the services from India and import of those services to the US without expensive trade restrictions Here the shareholders of the accounting firm gain through lower costs while less work is available for American tax preparers Further downward pressure is exerted on the wages of the remaining tax preparers
Endless examples of ldquooutsourcingrdquo job loss and downward pressure on working-class Americans have become the staple of economic conversation for three decades Taken together and across the economy these examples create
Widening economic inequality in minnesota
Growth amp Justice 12
conditions that have increased inequality and poverty in the US Was this inevitable Is it necessary that poverty and inequality must increase as a result of technological changes and globalization
We do not believe so Public policies could have largely or completely mitigated the effects of technological changes and globalization Further we believe that government policies enacted over the last thirty years have not only failed to mitigate the effects but have independently increased poverty and inequality In short we are hopeful about the possibility of policy action mitigating inequality And we believe past and future increases in inequality and poverty are not inescapable and can be reversed
First let us look at the experiences of some other industrialized democratic countries They have faced the same forces of globalization and technological change Yet inequality and poverty in many of those countries has not changed appreciably
As noted earlier much of the growth in incomes in the US has been captured by those with incomes in the top 1 Figure 11 shows the path of top 1 income shares for the US Japan Australia and France all from 1913 to 20094 The message from this international comparison is that rising inequality is neither inevitable nor is it necessary for an economy to perform well Alone among the four rich countries shown the US has seen a dramatic rise in the top income share
Overall inequality as measured by the Gini coefficient (Figure 12) similarly demonstrates that the US is more unequal than other high income countries France Canada and Norway represent the other developed countries and have substantially lower inequality than the US In fact these countries have Gini coefficients not seen in the US since the 1970s Note that these are estimates made by The World Bank and differ somewhat from those for the US as estimated by the US Census Bureau
4 These data are different from those in Figure 3 in that income from capital gains is excluded in Figure 11 The source database includes information on capital gains income for the US but not for the other countries
0
5
10
15
20
25
1915
1920
1935
1930
1925
1945
1955
1980
1985
1950
1940
2000
1960
1965
1970
1975
1995
1990
2005
2010
Australia - Atkinson amp Leigh (2007)Japan - Moriquchi amp Saez (2010)
United States - Pikey amp Saez (2007) France - Pikey (2001 2007) Landais (2007)
Fig 11 Top 1 income shares for the United States Australia France amp Japan 1913 - 20011
Year
Inco
me
shar
e
source World Top Incomes Database
00
010
020
030
040
050
060
Norway Canada France India UnitedStates
China Brazil
0415
055
0408
03270368
0326
0258
Fig 12 Gini coefficients for selected countries
source The World Bank
Widening economic inequality in minnesota
Growth amp Justice 13
Figure 13 from the Organization for Economic Cooperation and Development (OECD) shows poverty rates in the mid-2000rsquos for selected OECD countries We stand near the top In the figure each bar represents the percentage of a countryrsquos population living in households with less than 50 of that countryrsquos median income According to this measure the US has the third-highest poverty rate in the OECD at 173 Americarsquos 2010 median income was $49445 We can say then that 173 of all US households had income that year below $24722 Note that the poverty rate as measured by the OECD is higher than reported by the US Census Bureau That agency defines poverty differently than the OECD
Other high income countries have faced globalization and technological changes without a rapid proportional rise in incomes at the top dramatic increases in overall inequality or similar levels of poverty Our neighbor Canada reports median family income of $69860 in 2010 While the definition used by Statistics Canada may differ from that of our Census Bureau it seems reasonable to conclude that Canadian household income is at least comparable to that in the US Canada now has lower unemployment and growth rates similar to ours Canada is doing at least as well as we are economically without our high levels of inequality and poverty
We conclude that recent and future increases in inequality are not inevitable and that we could reduce inequality in the future
vI a proposal For a new polIcy evaluatIon tool the ldquoeconomIc InequalIty Impact assessmentrdquo
In the late 1960s as awareness spread about the threat posed by pollution of all kinds to property and especially to human health policymakers in the United States began to adopt laws appropriations and regulations designed to reduce or remediate environmental damages
Many of the laws and regulations simply required reductions in pollutants and emissions or banned the use of the worst toxins such as DDT But one of the most important provisions was the introduction of requirements to estimate in advance the environmental impact from pending development projects or policies The Environmental Impact Statement or EIS became a useful and accepted policy development tool
We believe growing inequality represents a similar threat to our societyrsquos long-term well-being A further concentration of income and wealth in fewer and fewer households and the accompanying rise in poverty and the decline of middle-income economic stability compels policymakers at all levels to conduct a more systematic assessment of economic inequality impact before they make decisions that could further exacerbate inequality We propose that all economically significant legislation and new state regulations in Minnesota should be subjected to an analysis that measures the policyrsquos impact on economic inequality
The experience with environmental impact measurement is encouraging In a 1994 paper noted environmental law professor William H Rodgers Jr included the EIS in his list of the seven most influential or effective US
0
5
10
15
20
25
Denmark Sweden OECD UnitedKingdom
Canada UnitedStates
Mexico
173
21
114111 113
84
61
Fig 13 Poverty rates at 50 or less of median income for selected OECD countries
source Organization for Economic Cooperation and Development (OECD)
Widening economic inequality in minnesota
Growth amp Justice 14
environmental laws The EIS was part of the National Environmental Policy Act of 1969 (NEPA) and requires federal agencies to prepare an EIS to accompany any agency action that has a significant effect on the human environment Rodgers noted that environmental impact statements were ldquoreplicated in rapid fashion throughout the United States and around the worldrdquo and have become ldquothe most frequently copied and most frequently cited of all US domestic environmental lawsrdquo 5
Legislators and other policymakers in Minnesota could develop an Economic Inequality Impact Assessment (EIIA) for all major policies that are likely to have a measurable effect on income or wealth distribution (This specific title and acronym used hereafter is the creation of the authors of this report we hope to popularize the concept but are not adamant about how it is labeled or the specifics of its implementation)
Minnesota already has a reputation among the states for distinctive high-quality economic measurement tools The Price of Government measurement and the biennial Tax Incidence Study both launched in the 1990s and updated regularly provide uniquely detailed perspective on the overall size of state-and-local government as a percent of income (Price of Government) and how the taxes for that public investment is paid by economic strata (Tax Incidence Study) These tools have greatly enabled quantitative analysis of relative fairness and equality
Legislative and executive branch staffers are familiar with the concept of projecting the costs and benefits of potential policy When legislators advance bills that directly or indirectly create a cost for state or local governments they must seek fiscal notes which calculate the costs of the proposed legislation
Support for measuring projected inequality particularly as it relates to poverty has come in recent years from a growing national coalition of community and philanthropic efforts and Minnesota has been a leader in this effort
The Washington DC based Center for Law and Social Policy (CLASP) published a summary of federal and state efforts that align with a CLASP initiative for Poverty Impact Projections (PIP) The PIP concept as described in that 2011 CLASP report could be easily applied to a broader Economic Inequality Impact Assessment
As stated in the CLASP study ldquoGetting a clearer prognosis of the potential impact of a pending policy is valuable not just for elected officials who need to vote on bills but also for other policymakers and community stakeholders who need to make planning and implementation decisionsrdquo 6
Minnesota is one of the few states highlighted in the CLASP report as having done the most to advance the concept of poverty impact projections noting that just such a mechanism was a key recommendation of the Legislative Commission to End Poverty in Minnesota by 2020 Along with many other local groups particularly the nonprofit organization A Minnesota Without Poverty we encourage efforts toward establishing a poverty impact projection but submit that a broader top-to-bottom evaluation of policy in the form of an Economic Inequality Impact Assessment would be even more valuable
5 Rodgers Jr W H (1994) The Seven Statutory Wonders of US Environmental Law Origins and Morphology Loyola of Los Angeles Law Review 1009-1022 Available at httpdigital commonslmuedullrvol27iss315
6 Levin-Epstein J amp Sanes M (August 2011) At the Forefront Poverty Impact Projections Washington DC CLASP
Widening economic inequality in minnesota
Growth amp Justice 15 2324 University Ave W Suite 120 A Saint Paul MN 55114 wwwgrowthandjusticeorg
Smart Investments Practical Solutions Broader Prosperity
We do not offer here a precise formula for an EIIA But our conversations and interviews with state tax and budget experts suggest the following in regard to practical design and implementation of an EIIA for Minnesota
bull The EIIA could be housed in the Minnesota Management and Budget agency within the office of the State Economist The agency commissioner could appoint an advisory group of economic experts to assist in designing an EIIA process and methodology
bull An EIIA for tax bills could begin in the Revenue Department using more detailed projections about the impact of various tax proposals on the Suits index and other measurements of tax incidence
bull An EIIA could initially calculate the estimated direction of the effect on inequality measures rather than predict specific numerical outcomes An EIIA likely would need to have a de minimis threshold as do fiscal notes in the state budget process so that not every bill or proposal coming before a committee would need to be assessed
bull Scores of specific policy proposals aimed at reducing inequalitymdashinvestment in early childhood education higher minimum wages elimination of high-income tax cuts and breaksmdashare proposed every year by national and state policymakers In many cases the effects on reducing inequality are obvious intuitively But how much more valuable would it be for policymakers to have more precise information about the relative impacts of such proposals
Better economic information will help policymakers navigate toward a more equitable and sustainable economy and society Establishment of an Economic Inequality Impact Assessment would be a valuable addition to the policymaking toolbox
about the authors
Jay Coggins is an associate professor with the Department of Applied Economics at the University of Minnesota and a policy fellow for Growth amp Justice
thomas legg is a senior lecturer at the University of Minnesotarsquos Carlson School of Management and a policy fellow for Growth amp Justice
dane smith is the president of Growth amp Justice
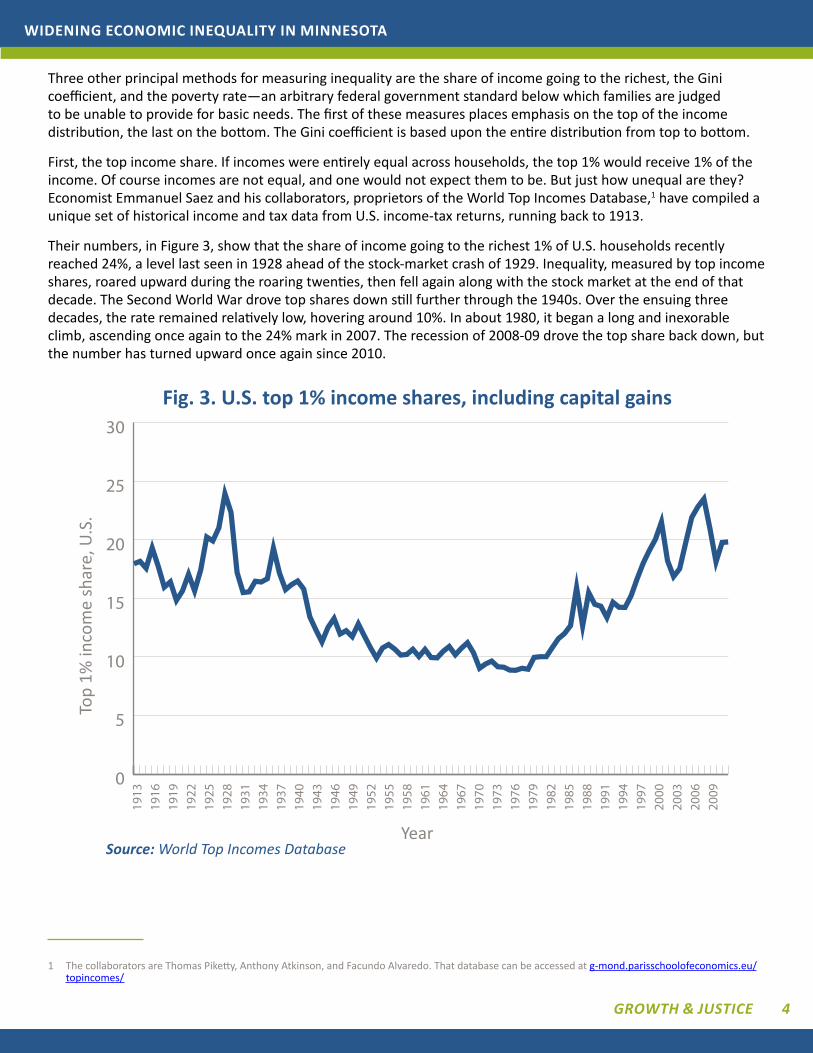
Widening economic inequality in minnesota
Growth amp Justice 4
Three other principal methods for measuring inequality are the share of income going to the richest the Gini coefficient and the poverty ratemdashan arbitrary federal government standard below which families are judged to be unable to provide for basic needs The first of these measures places emphasis on the top of the income distribution the last on the bottom The Gini coefficient is based upon the entire distribution from top to bottom
First the top income share If incomes were entirely equal across households the top 1 would receive 1 of the income Of course incomes are not equal and one would not expect them to be But just how unequal are they Economist Emmanuel Saez and his collaborators proprietors of the World Top Incomes Database1 have compiled a unique set of historical income and tax data from US income-tax returns running back to 1913
Their numbers in Figure 3 show that the share of income going to the richest 1 of US households recently reached 24 a level last seen in 1928 ahead of the stock-market crash of 1929 Inequality measured by top income shares roared upward during the roaring twenties then fell again along with the stock market at the end of that decade The Second World War drove top shares down still further through the 1940s Over the ensuing three decades the rate remained relatively low hovering around 10 In about 1980 it began a long and inexorable climb ascending once again to the 24 mark in 2007 The recession of 2008-09 drove the top share back down but the number has turned upward once again since 2010
1 The collaborators are Thomas Piketty Anthony Atkinson and Facundo Alvaredo That database can be accessed at g-mondparisschoolofeconomicseutopincomes
0
5
10
15
20
25
30
1913
1916
1925
1922
1919
1928
1931
1934
1937
1940
1943
2000
1997
1994
1991
1988
1985
1982
1979
1976
1973
1970
1967
1964
1961
1958
1955
1952
1949
1946
2009
2006
2003
Fig 3 US top 1 income shares including capital gains
Top
1 in
com
e sh
are
US
Yearsource World Top Incomes Database
Widening economic inequality in minnesota
Growth amp Justice 5
Incomes for the entire country have risen in the past several decades but the gains have been uneven Those at the top have seen their income rise handsomely while everyone else has seen little gain Figure 4 shows the breakdown The blue curve represents the poorest 20 of households whose incomes rose by about 40 in inflation-adjusted dollars during the 30-year period Thatrsquos about 1 per year The orange curve represents households between the 20th and the 80th percentiles Their incomes rose a little less than the bottom quintile by about 36 in total The gray curve represents households between the 80th and 99th percentiles Their incomes rose by about 60 even after dropping dramatically during 2008 and 2009
The striking curve is the top curve in green It represents the income trajectory of the top 1 whose incomes grew by 300 through 2007 before dropping dramatically during the recent downturn As noted below the top 1 has garnered most of the increased household income since 2009
The economy continues to sputter but in 2010 (the most recent year for which we have data) US aggregate household income began once again to march upward In a recent study Emanuel Saez dug into the distribution of this increase across income groups His findings are startling average family income grew by 23 between 2009 and 2010 but fully 93 of this increase was captured by the richest 1 of households The remaining 99 were left to scramble for the other 7 These numbers translate into an increase of 116 for the top 1 and an average increase of 02 for everyone else2
The Gini coefficient devised in 1912 by the Italian economist Corrado Gini measures the level of inequality for an entire income distribution It ranges from zero (if every household has the same income) to one (if one household has all of the income) A bigger Gini means higher inequality
The Gini coefficient is the oil tanker of inequality measures It doesnrsquot change very fast over time even if top income shares are rising quickly Changes in the Gini that appear to be small which might be said of the numbers described here represent fairly hefty increases in inequality
2 The fact that only the richest households experienced a significant gain in income yet the average income rose quite a lot illustrates an important point about average and median Median represents the middle of a distribution There are equal numbers of households to the right and to the left of the median Average income is total national income divided by the number of households If Bill Gatesrsquo income were to double it would have a noticeable effect on average income but the median income would be unchanged For this reason economists usually use the median rather than the average to describe the center of the income distribution
-50
0
50
100
150
200
250
300
350
1979
1980
1983
1982
1981
1991
1990
1989
1988
1987
1986
1985
1984
2002
2001
2000
1999
1998
1997
1996
1995
1994
1993
1992
2007
2006
2005
2004
2003
2009
2008
0 - 20
21 - 80
Top 1
81 - 99
Income percenles
G
row
th in
afte
r-tax
inco
me
Yearsource Congressional Budget Office
Fig 4 Growth in after tax income by income category 1979-2009
Widening economic inequality in minnesota
Growth amp Justice 6
Figure 5 compares Gini coefficients for the US and Minnesota for each of the last four decennial censuses (State-level Ginis are not available every year) Though inequality is lower in Minnesota than in the US both numbers have been rising steadily for at least the past four decades We will see in Section IV that the Gini for both the US and for Minnesota exceeds the number found in most other rich industrialized countries
Poverty rates convey yet another picture of inequality As the economy waxes and wanes the number of people living below the poverty line also waxes and wanes What does it mean to be in poverty Each year the Census Bureau publishes a table of income thresholds depending on the size and demographic make-up of a household that determine whether a given family is living in poverty In 2011 the poverty threshold for a family of two adults and two children was $22811 If such a family has total income below this level all four members adults and children alike are judged to be living in poverty The threshold for a single adult aged less than 65 was $11702
The income level marking the bottom of the top quintile precisely 80 along the income distribution is $100065 A person living in such a family or one that lies even further up the income scale might face some difficulty in imagining what it must be like to get by on only $22811 How exactly does a family pay the rent put food on the table buy gas for the drive to work and buy health coverage and clothes for the four members of the household Too often for one or more categories one doesnrsquot
In 2011 an all-time high of 462 million Americans lived below the poverty line This translates into 150 of all citizens a rate last touched in 1993 Figure 6 shows the evolution of the poverty rate since 1995 in the US and in Minnesota Both have been marching upward since 2000 Minnesotans do not reside in poverty at the same rate as do Americans more generally but even here the rate has lately crept above 10 The number of Minnesotans living in poverty now exceeds half a million These numbers represent a tremendous amount of aggregate misery and anxiety across the state
Pove
rty
rate
Yearsource US Census Bureau
Fig 6 Poverty rates US amp MN 1995 - 2010
4
6
8
10
12
14
16
18
2002
2001
2000
1999
1998
1997
1996
1995
2007
2006
2005
2004
2003
2009
2008
US
MN
2010
Gini
coe
ffici
ent
034
036
038
040
042
044
046
048
2009199919891979
MN
US
Yearsource US Census Bureau
Fig 5 Gini Coefficients US and Minnesota
Widening economic inequality in minnesota
Growth amp Justice 7
III InequalIty Is hIghest where Income Is lowest
Whenever the rising tide of inequality is decried there doubtless will be plenty of respondents who express a firm and abiding disbelief in the numbers Just as there are many who deny the science indicating global climate change so there are many who deny the evidence indicating that inequality is on the rise
Many theories have been advanced to explain this resistance to accept the evidence One likely possibility is that a great many Americans and a great many Minnesotans live in places where income is high and inequality is low The importance of this empirical fact can hardly be overstated inequality tends to be highest where income is lowest
Minnesotarsquos suburban metro counties for instance rank at or near the top of the list with respect to median income They rank at or near the bottom of the list with respect to the Gini coefficient and the poverty rate People who live in these counties may have little or no first-hand experience with inequality or with widespread poverty Convincing them to believe in something their eyes rarely see can be a challenge
It should not be surprising that inequality varies across the landscape Aggregate numbers whether for all of the US or all of Minnesota mask important variability within the relevant population And the pattern is consistent The upper left map in Figure 7 shows median income by state across the 48 contiguous US states The light gray color represents the lowest median income level The upper right map shows Gini coefficients The orange represents the highest level of inequality The lower map shows the poverty rate by state with orange indicating a higher poverty rate The correlation is imperfect but still striking Many of the lowest-income states are to be found in the south where inequality and poverty rates both tend to be high
Gini Coefficient
Fig 7 Median income Gini coefficient and poverty rate 2011 US states
source US Census Bureau
lt $456000 gt $59500$47500 - $52000$45600 - $47500 $52000 - $59500 lt 0432 gt 04690453 - 04670432 - 0453 0467 - 0469
85 - 118 162 - 219123 - 142118 - 123 142 - 162
median Income
Poverty Rate
Widening economic inequality in minnesota
Growth amp Justice 8
Figure 8 shows the relationship between state-level median income and the Gini coefficient in a scatter plot The line represents the general relationship between income and inequality Its downward slope tells us that inequality tends to be lowest where income is highest
Median household income has risen little over the last 30 years and has actually fallen since 2000 Minnesota compares favorably to the US as a whole but the advantage is slipping Our median household income remains higher and our inequality and poverty rates are lower than average but much of that favorable relative standing has disappeared since 2000 Our income is declining and inequality is rising absolutely and relative to other states Over the last 10 years we have fallen from 9th lowest Gini to 13th Our poverty rate has worsened from the 3rd lowest to 11th lowest
Iv Income InequalIty IncreasIngly becomes a publIc concern and economIc threat
The evidence is clear that inequality in America is rising The question of whether rising inequality is a cause for concern though is more contentious There are those who see it as a grave threat Others see it as a sign of a healthy and vigorous capitalist economy Some inequality is essential in producing opportunities and incentives for individuals to create new products to invest in innovative ideas and to work hard The economy as a whole is more productive and aggregate wealth is higher when innovation is vigorous and capital is put to its most valuable use The incentive to ldquoget richrdquo helps drive initiative and innovation
Accepting a life of grinding penury for large portions of the populace is offensive to empathetic and humane sensibilities and has been throughout human history But the acceleration of inequality trends in recent years is provoking important questions about the effect on growth itself Is economic growth threatened by inequality Does high inequality cause the economy as a whole to produce less for all
Median household income
Gini
coe
ffici
ent
Fig 8 Income and Gini Coefficients US States (2011)
source US Census Bureau
$35000 $40000 $45000 $50000 $55000 $60000 $65000 $70000
040
041
042
043
044
045
046
047
048
049
050
051
MN
US
High inequality
Low inequality
Widening economic inequality in minnesota
Growth amp Justice 9
These crucial questions occupy us in this section In particular we ask whether there is a level of inequality above which the positive incentives to contribute to economic performance are more than offset by the social costs And if so have we yet reached or exceeded that level
Some think that continued growth in inequality will continue to benefit society In this view economic growth is now hampered by public policies that overly limit the economic rewards to investment and effort In this view taxes and costly regulatory burdens to innovation investment and hard work need to be reduced Witness recent calls for lower top tax rates elimination of the Environmental Protection Agency and efforts to pass ldquoright to workrdquo laws
Others believe that increases in income inequality over the last thirty years are creating social harm sufficient to more than offset any benefits of additional economic growth Some go further providing evidence that current levels of inequality are actually reducing growth
We support the latter view that income inequality has crossed a threshold that threatens overall growth and that it is an issue of great importance In this section we present facts which establish the relative public ignorance about inequality discuss its actual damage to economic growth and provide some explanation of the cause-and-effect dynamics
perceived Actual and Desired Inequality
Inequality is an important issue if Americans believe it is an important issue In a study published in 2011 economists Michael Norton and Dan Ariely asked a random sample of 5522 Americans to rank three alternative distributions of wealth for a society3 The three distributions were as depicted in Figure 9 The first in 9a is the actual distribution of wealth in the US The richest 20 of American households hold 84 of total wealth and the poorest 20 of households hold 01 The third in 9c is a hypothetical distribution in which each fifth of the population has the same level of wealth This represents perfect equality The middle distribution 9b is a hypothetical intermediate wealth distribution There the richest 20 hold 36 of the wealth and the poorest 20 hold 11
Respondents to the online survey were asked to imagine that they might be a member of a given society but that their own place in the society would be determined by chance Which society would they rather inhabit They were provided an opportunity to choose from the three societies depicted in Figure 9 (without being told that 9a was the actual distribution of wealth in the US) Norton and Ariely discovered that for their respondents the least desirable alternative is the actual US distribution depicted in 9a The top choice for desired actual distribution was the intermediate distribution (9b) with 47 making it their first choice The equal distribution (9c) was next with 43 choosing it The actual US wealth distribution (9a) came last with only 10 choosing it
3 Wealth is different from income Also called net worth wealth is the value of all assets less the value of all debts owed Wealth is more concentrated than is income among the richest households
Top 20
Boom 20
Middle 204th 20
2nd 2084
1184
0201
Fig 9a US wealth distribution
Top 20
Boom 20
Middle 204th 20
2nd 20
2020
20
2020
Fig 9c Equal wealth distribution
Top 20
Boom 20
Middle 204th 20
2nd 2018
11 15
21
36 18
Fig 9b Intermediate wealth distribution
Widening economic inequality in minnesota
Growth amp Justice 10
Norton and Ariely then asked two further questions The first asked respondents to specify the level of wealth inequality that they believe exists in the US The second asked them to specify the level of wealth that they would like to see in the US Figure 10 taken from Norton and Arielyrsquos published study shows the results of these questions The first bar shows the actual US wealth distribution The second shows the average of respondentsrsquo estimates of the US wealth distribution The third shows the average of respondentsrsquo ideal US wealth distribution
Two main lessons may be drawn from these results The first is that people appear to underestimate dramatically the level of wealth inequality in the US economy The average person believes that the richest quintile holds about 57 of wealth when the actual share is 84 Second people wish that wealth inequality were even lower than they believe it to be The average person feels that the richest quintile should hold about 32 of wealth
Norton and Ariely confirm our belief that most favor some inequality Most would prefer less inequality than they think exists and would prefer far less than actually exists Our point is that most Americans think current inequality is excessive and likely would feel stronger about that if they knew the actual facts
Inequality and Growth
As we have posited earlier a certain amount of inequality is inevitable and most economists would agree that some is essential for healthy and vigorous economic growth As inequality increases though the marginal benefit to output from additional inequality logically declines Has inequality risen to a point where the marginal effects on output are actually negative That is is inequality now so high that recent widening has caused lower GDP than we would have had with the lower levels of inequality of the middle of the last century (a period of consistently high growth)
Ramaprasad Rajaram of the University of Georgia believes so In his 2010 PhD dissertation Poverty Income Inequality and Economic Growth in US Counties A Spatial Analysis he considers the effects of income inequality and poverty on economic growth He relates per capita income growth to poverty rates and overall income inequality (Gini coefficients) in 3072 US counties using data from the 1980 (1979 data) and 2000 (1999 data) US Census He assesses the relationship of poverty in 1979 to growth from 1979 to 1999 and finds that counties with lower poverty rates in 1979 grew on average significantly more quickly during the next 20 years He similarly found that counties with less overall income inequality in 1979 grew on average significantly more quickly than those with higher income inequality in 1979
He then went a step further looking at actual growth from 1979 to 1999 as a predictor of 1999 poverty and inequality measures He found that counties that grew more quickly from 1979 through 1999 had lower poverty rates and overall inequality at the end of the period Finally he split the counties into ldquorichrdquo and ldquopoorrdquo to see whether the effects differed He found little difference
Actual
Estimated
Preferred
Top 20 Second 20 Fourth 20 Bottom 20Middle 20
0 10 20 30 40 50 60 70 80 90 100
Percent of wealth owned
Fig 10 Actual estimated and preferred US wealth distributions
Widening economic inequality in minnesota
Growth amp Justice 11
His results tell a compelling story Those areas with less inequality and poverty today all else equal can expect higher future growth in future per capita income In the future those that actually experienced the highest growth are likely to have lower poverty and overall inequality In summary those that grow quickly are likely to be the ones that start with lower inequality The resulting high growth in turn has a dampening effect on future increases in inequality This is a virtuous cycle in which if all share in growing prosperity prosperity grows more rapidly
Inequality and Demand for Goods and Services
US consumers have driven the growth of the US economy at least since World War II Personal consumption has been about 70 of Gross Domestic Product (GDP) Through at least 1979 this consumption was driven by a broad and growing middle class and growing income widely shared across the income distribution Continued long-term growth likely will continue to depend on growing consumption If personal consumption is to remain at 70 of GDP it must grow at the same rate as GDP
As household income increases consumption increases along with it This has the effect of increasing the demand for the goods and services that give rise to the additional income Poor households spend nearly all their increases in income while middle income households spend most of the increases Those at the top spend a smaller proportion of additional income
When incomes at the top are growing much more quickly than those in the middle and the bottom of the distribution consumption naturally declines as a share of GDP In 2010 a year of weak economic recovery 93 of the growth in income went to the top 1 of households As a result this apportionment of additional personal income generated less additional demand for goods and services This perverse braking effect might be viewed as a downward spiral a vicious circle Slowing economic growth leads to increased inequality which then leads to even slower growthIn summary most Americans wish for less inequality than we have even while they underestimate the degree of current inequality Higher inequality inevitably produces lower growth because the wealthy spend less of their income than those less wealthy As income goes increasingly to the wealthy demand for goods and services is less than optimum Growth is constrained as inequality increases beyond a level that encourages growth
v causes oF InequalIty
Why exactly have poverty rates and income inequality increased so dramatically since 1980 Was it unavoidable What of the future How might we prevent further widening or even reverse the trend
Some observers explain our rising inequality as the inevitable result of advancing technology with its attendant rewards for the skilled workers who are able to perform high-tech jobs Others explain it as the inevitable result of increasing globalization in the world economy These two factors are certainly implicated Both have helped to increase global output and global incomes but both have also imposed costs on some people in some places Both have also shoveled generous rewards to a favored few Those bearing the highest costs have been the middle and lower classes in the developed world Those favored include those with capital and those who are highly educated in fields that allow them to take full advantage of globalization and technological advances
Globalization and technological advances generally benefit the same segments of society Globalization has made both production and capital more mobile without equivalent increases in labor mobility Businesses now face fewer legal and institutional impediments to movement of capital goods and services in and out of countries
Advances in technology have reduced the costs of moving goods and services from one country to another For example some accounting firms have American clientsrsquo tax returns prepared in India That is possible only because of recent changes in communications technology and institutions that allow exports of the services from India and import of those services to the US without expensive trade restrictions Here the shareholders of the accounting firm gain through lower costs while less work is available for American tax preparers Further downward pressure is exerted on the wages of the remaining tax preparers
Endless examples of ldquooutsourcingrdquo job loss and downward pressure on working-class Americans have become the staple of economic conversation for three decades Taken together and across the economy these examples create
Widening economic inequality in minnesota
Growth amp Justice 12
conditions that have increased inequality and poverty in the US Was this inevitable Is it necessary that poverty and inequality must increase as a result of technological changes and globalization
We do not believe so Public policies could have largely or completely mitigated the effects of technological changes and globalization Further we believe that government policies enacted over the last thirty years have not only failed to mitigate the effects but have independently increased poverty and inequality In short we are hopeful about the possibility of policy action mitigating inequality And we believe past and future increases in inequality and poverty are not inescapable and can be reversed
First let us look at the experiences of some other industrialized democratic countries They have faced the same forces of globalization and technological change Yet inequality and poverty in many of those countries has not changed appreciably
As noted earlier much of the growth in incomes in the US has been captured by those with incomes in the top 1 Figure 11 shows the path of top 1 income shares for the US Japan Australia and France all from 1913 to 20094 The message from this international comparison is that rising inequality is neither inevitable nor is it necessary for an economy to perform well Alone among the four rich countries shown the US has seen a dramatic rise in the top income share
Overall inequality as measured by the Gini coefficient (Figure 12) similarly demonstrates that the US is more unequal than other high income countries France Canada and Norway represent the other developed countries and have substantially lower inequality than the US In fact these countries have Gini coefficients not seen in the US since the 1970s Note that these are estimates made by The World Bank and differ somewhat from those for the US as estimated by the US Census Bureau
4 These data are different from those in Figure 3 in that income from capital gains is excluded in Figure 11 The source database includes information on capital gains income for the US but not for the other countries
0
5
10
15
20
25
1915
1920
1935
1930
1925
1945
1955
1980
1985
1950
1940
2000
1960
1965
1970
1975
1995
1990
2005
2010
Australia - Atkinson amp Leigh (2007)Japan - Moriquchi amp Saez (2010)
United States - Pikey amp Saez (2007) France - Pikey (2001 2007) Landais (2007)
Fig 11 Top 1 income shares for the United States Australia France amp Japan 1913 - 20011
Year
Inco
me
shar
e
source World Top Incomes Database
00
010
020
030
040
050
060
Norway Canada France India UnitedStates
China Brazil
0415
055
0408
03270368
0326
0258
Fig 12 Gini coefficients for selected countries
source The World Bank
Widening economic inequality in minnesota
Growth amp Justice 13
Figure 13 from the Organization for Economic Cooperation and Development (OECD) shows poverty rates in the mid-2000rsquos for selected OECD countries We stand near the top In the figure each bar represents the percentage of a countryrsquos population living in households with less than 50 of that countryrsquos median income According to this measure the US has the third-highest poverty rate in the OECD at 173 Americarsquos 2010 median income was $49445 We can say then that 173 of all US households had income that year below $24722 Note that the poverty rate as measured by the OECD is higher than reported by the US Census Bureau That agency defines poverty differently than the OECD
Other high income countries have faced globalization and technological changes without a rapid proportional rise in incomes at the top dramatic increases in overall inequality or similar levels of poverty Our neighbor Canada reports median family income of $69860 in 2010 While the definition used by Statistics Canada may differ from that of our Census Bureau it seems reasonable to conclude that Canadian household income is at least comparable to that in the US Canada now has lower unemployment and growth rates similar to ours Canada is doing at least as well as we are economically without our high levels of inequality and poverty
We conclude that recent and future increases in inequality are not inevitable and that we could reduce inequality in the future
vI a proposal For a new polIcy evaluatIon tool the ldquoeconomIc InequalIty Impact assessmentrdquo
In the late 1960s as awareness spread about the threat posed by pollution of all kinds to property and especially to human health policymakers in the United States began to adopt laws appropriations and regulations designed to reduce or remediate environmental damages
Many of the laws and regulations simply required reductions in pollutants and emissions or banned the use of the worst toxins such as DDT But one of the most important provisions was the introduction of requirements to estimate in advance the environmental impact from pending development projects or policies The Environmental Impact Statement or EIS became a useful and accepted policy development tool
We believe growing inequality represents a similar threat to our societyrsquos long-term well-being A further concentration of income and wealth in fewer and fewer households and the accompanying rise in poverty and the decline of middle-income economic stability compels policymakers at all levels to conduct a more systematic assessment of economic inequality impact before they make decisions that could further exacerbate inequality We propose that all economically significant legislation and new state regulations in Minnesota should be subjected to an analysis that measures the policyrsquos impact on economic inequality
The experience with environmental impact measurement is encouraging In a 1994 paper noted environmental law professor William H Rodgers Jr included the EIS in his list of the seven most influential or effective US
0
5
10
15
20
25
Denmark Sweden OECD UnitedKingdom
Canada UnitedStates
Mexico
173
21
114111 113
84
61
Fig 13 Poverty rates at 50 or less of median income for selected OECD countries
source Organization for Economic Cooperation and Development (OECD)
Widening economic inequality in minnesota
Growth amp Justice 14
environmental laws The EIS was part of the National Environmental Policy Act of 1969 (NEPA) and requires federal agencies to prepare an EIS to accompany any agency action that has a significant effect on the human environment Rodgers noted that environmental impact statements were ldquoreplicated in rapid fashion throughout the United States and around the worldrdquo and have become ldquothe most frequently copied and most frequently cited of all US domestic environmental lawsrdquo 5
Legislators and other policymakers in Minnesota could develop an Economic Inequality Impact Assessment (EIIA) for all major policies that are likely to have a measurable effect on income or wealth distribution (This specific title and acronym used hereafter is the creation of the authors of this report we hope to popularize the concept but are not adamant about how it is labeled or the specifics of its implementation)
Minnesota already has a reputation among the states for distinctive high-quality economic measurement tools The Price of Government measurement and the biennial Tax Incidence Study both launched in the 1990s and updated regularly provide uniquely detailed perspective on the overall size of state-and-local government as a percent of income (Price of Government) and how the taxes for that public investment is paid by economic strata (Tax Incidence Study) These tools have greatly enabled quantitative analysis of relative fairness and equality
Legislative and executive branch staffers are familiar with the concept of projecting the costs and benefits of potential policy When legislators advance bills that directly or indirectly create a cost for state or local governments they must seek fiscal notes which calculate the costs of the proposed legislation
Support for measuring projected inequality particularly as it relates to poverty has come in recent years from a growing national coalition of community and philanthropic efforts and Minnesota has been a leader in this effort
The Washington DC based Center for Law and Social Policy (CLASP) published a summary of federal and state efforts that align with a CLASP initiative for Poverty Impact Projections (PIP) The PIP concept as described in that 2011 CLASP report could be easily applied to a broader Economic Inequality Impact Assessment
As stated in the CLASP study ldquoGetting a clearer prognosis of the potential impact of a pending policy is valuable not just for elected officials who need to vote on bills but also for other policymakers and community stakeholders who need to make planning and implementation decisionsrdquo 6
Minnesota is one of the few states highlighted in the CLASP report as having done the most to advance the concept of poverty impact projections noting that just such a mechanism was a key recommendation of the Legislative Commission to End Poverty in Minnesota by 2020 Along with many other local groups particularly the nonprofit organization A Minnesota Without Poverty we encourage efforts toward establishing a poverty impact projection but submit that a broader top-to-bottom evaluation of policy in the form of an Economic Inequality Impact Assessment would be even more valuable
5 Rodgers Jr W H (1994) The Seven Statutory Wonders of US Environmental Law Origins and Morphology Loyola of Los Angeles Law Review 1009-1022 Available at httpdigital commonslmuedullrvol27iss315
6 Levin-Epstein J amp Sanes M (August 2011) At the Forefront Poverty Impact Projections Washington DC CLASP
Widening economic inequality in minnesota
Growth amp Justice 15 2324 University Ave W Suite 120 A Saint Paul MN 55114 wwwgrowthandjusticeorg
Smart Investments Practical Solutions Broader Prosperity
We do not offer here a precise formula for an EIIA But our conversations and interviews with state tax and budget experts suggest the following in regard to practical design and implementation of an EIIA for Minnesota
bull The EIIA could be housed in the Minnesota Management and Budget agency within the office of the State Economist The agency commissioner could appoint an advisory group of economic experts to assist in designing an EIIA process and methodology
bull An EIIA for tax bills could begin in the Revenue Department using more detailed projections about the impact of various tax proposals on the Suits index and other measurements of tax incidence
bull An EIIA could initially calculate the estimated direction of the effect on inequality measures rather than predict specific numerical outcomes An EIIA likely would need to have a de minimis threshold as do fiscal notes in the state budget process so that not every bill or proposal coming before a committee would need to be assessed
bull Scores of specific policy proposals aimed at reducing inequalitymdashinvestment in early childhood education higher minimum wages elimination of high-income tax cuts and breaksmdashare proposed every year by national and state policymakers In many cases the effects on reducing inequality are obvious intuitively But how much more valuable would it be for policymakers to have more precise information about the relative impacts of such proposals
Better economic information will help policymakers navigate toward a more equitable and sustainable economy and society Establishment of an Economic Inequality Impact Assessment would be a valuable addition to the policymaking toolbox
about the authors
Jay Coggins is an associate professor with the Department of Applied Economics at the University of Minnesota and a policy fellow for Growth amp Justice
thomas legg is a senior lecturer at the University of Minnesotarsquos Carlson School of Management and a policy fellow for Growth amp Justice
dane smith is the president of Growth amp Justice
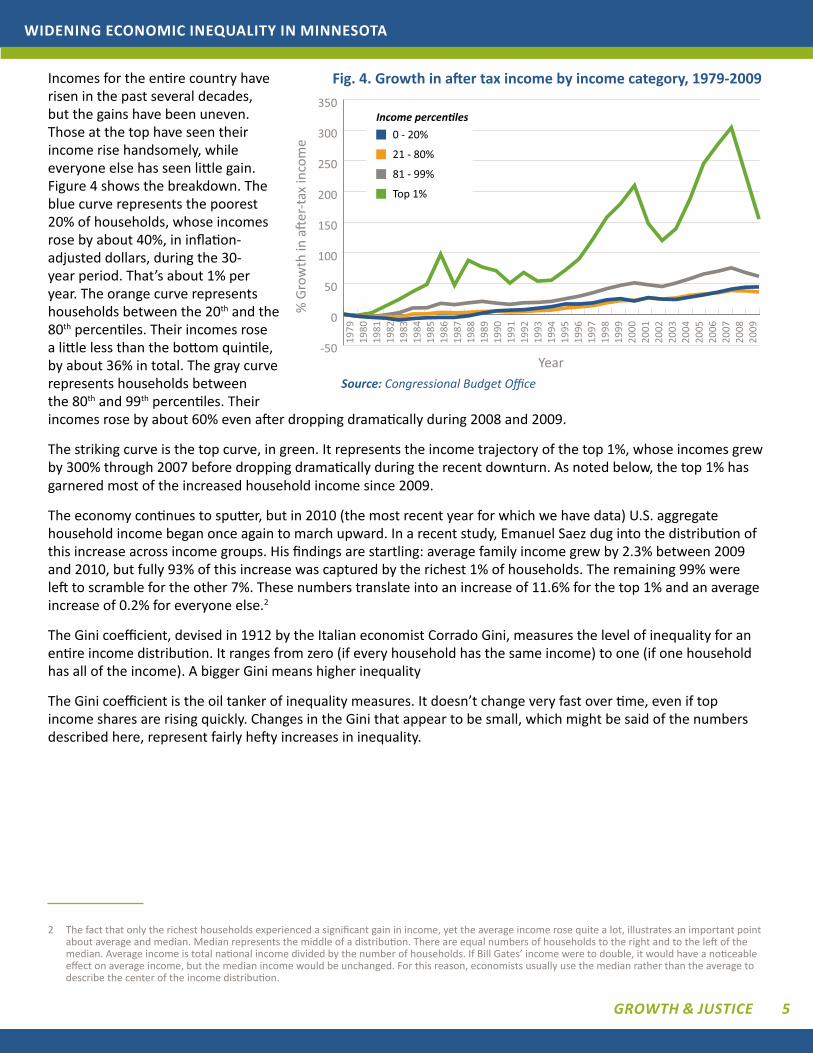
Widening economic inequality in minnesota
Growth amp Justice 5
Incomes for the entire country have risen in the past several decades but the gains have been uneven Those at the top have seen their income rise handsomely while everyone else has seen little gain Figure 4 shows the breakdown The blue curve represents the poorest 20 of households whose incomes rose by about 40 in inflation-adjusted dollars during the 30-year period Thatrsquos about 1 per year The orange curve represents households between the 20th and the 80th percentiles Their incomes rose a little less than the bottom quintile by about 36 in total The gray curve represents households between the 80th and 99th percentiles Their incomes rose by about 60 even after dropping dramatically during 2008 and 2009
The striking curve is the top curve in green It represents the income trajectory of the top 1 whose incomes grew by 300 through 2007 before dropping dramatically during the recent downturn As noted below the top 1 has garnered most of the increased household income since 2009
The economy continues to sputter but in 2010 (the most recent year for which we have data) US aggregate household income began once again to march upward In a recent study Emanuel Saez dug into the distribution of this increase across income groups His findings are startling average family income grew by 23 between 2009 and 2010 but fully 93 of this increase was captured by the richest 1 of households The remaining 99 were left to scramble for the other 7 These numbers translate into an increase of 116 for the top 1 and an average increase of 02 for everyone else2
The Gini coefficient devised in 1912 by the Italian economist Corrado Gini measures the level of inequality for an entire income distribution It ranges from zero (if every household has the same income) to one (if one household has all of the income) A bigger Gini means higher inequality
The Gini coefficient is the oil tanker of inequality measures It doesnrsquot change very fast over time even if top income shares are rising quickly Changes in the Gini that appear to be small which might be said of the numbers described here represent fairly hefty increases in inequality
2 The fact that only the richest households experienced a significant gain in income yet the average income rose quite a lot illustrates an important point about average and median Median represents the middle of a distribution There are equal numbers of households to the right and to the left of the median Average income is total national income divided by the number of households If Bill Gatesrsquo income were to double it would have a noticeable effect on average income but the median income would be unchanged For this reason economists usually use the median rather than the average to describe the center of the income distribution
-50
0
50
100
150
200
250
300
350
1979
1980
1983
1982
1981
1991
1990
1989
1988
1987
1986
1985
1984
2002
2001
2000
1999
1998
1997
1996
1995
1994
1993
1992
2007
2006
2005
2004
2003
2009
2008
0 - 20
21 - 80
Top 1
81 - 99
Income percenles
G
row
th in
afte
r-tax
inco
me
Yearsource Congressional Budget Office
Fig 4 Growth in after tax income by income category 1979-2009
Widening economic inequality in minnesota
Growth amp Justice 6
Figure 5 compares Gini coefficients for the US and Minnesota for each of the last four decennial censuses (State-level Ginis are not available every year) Though inequality is lower in Minnesota than in the US both numbers have been rising steadily for at least the past four decades We will see in Section IV that the Gini for both the US and for Minnesota exceeds the number found in most other rich industrialized countries
Poverty rates convey yet another picture of inequality As the economy waxes and wanes the number of people living below the poverty line also waxes and wanes What does it mean to be in poverty Each year the Census Bureau publishes a table of income thresholds depending on the size and demographic make-up of a household that determine whether a given family is living in poverty In 2011 the poverty threshold for a family of two adults and two children was $22811 If such a family has total income below this level all four members adults and children alike are judged to be living in poverty The threshold for a single adult aged less than 65 was $11702
The income level marking the bottom of the top quintile precisely 80 along the income distribution is $100065 A person living in such a family or one that lies even further up the income scale might face some difficulty in imagining what it must be like to get by on only $22811 How exactly does a family pay the rent put food on the table buy gas for the drive to work and buy health coverage and clothes for the four members of the household Too often for one or more categories one doesnrsquot
In 2011 an all-time high of 462 million Americans lived below the poverty line This translates into 150 of all citizens a rate last touched in 1993 Figure 6 shows the evolution of the poverty rate since 1995 in the US and in Minnesota Both have been marching upward since 2000 Minnesotans do not reside in poverty at the same rate as do Americans more generally but even here the rate has lately crept above 10 The number of Minnesotans living in poverty now exceeds half a million These numbers represent a tremendous amount of aggregate misery and anxiety across the state
Pove
rty
rate
Yearsource US Census Bureau
Fig 6 Poverty rates US amp MN 1995 - 2010
4
6
8
10
12
14
16
18
2002
2001
2000
1999
1998
1997
1996
1995
2007
2006
2005
2004
2003
2009
2008
US
MN
2010
Gini
coe
ffici
ent
034
036
038
040
042
044
046
048
2009199919891979
MN
US
Yearsource US Census Bureau
Fig 5 Gini Coefficients US and Minnesota
Widening economic inequality in minnesota
Growth amp Justice 7
III InequalIty Is hIghest where Income Is lowest
Whenever the rising tide of inequality is decried there doubtless will be plenty of respondents who express a firm and abiding disbelief in the numbers Just as there are many who deny the science indicating global climate change so there are many who deny the evidence indicating that inequality is on the rise
Many theories have been advanced to explain this resistance to accept the evidence One likely possibility is that a great many Americans and a great many Minnesotans live in places where income is high and inequality is low The importance of this empirical fact can hardly be overstated inequality tends to be highest where income is lowest
Minnesotarsquos suburban metro counties for instance rank at or near the top of the list with respect to median income They rank at or near the bottom of the list with respect to the Gini coefficient and the poverty rate People who live in these counties may have little or no first-hand experience with inequality or with widespread poverty Convincing them to believe in something their eyes rarely see can be a challenge
It should not be surprising that inequality varies across the landscape Aggregate numbers whether for all of the US or all of Minnesota mask important variability within the relevant population And the pattern is consistent The upper left map in Figure 7 shows median income by state across the 48 contiguous US states The light gray color represents the lowest median income level The upper right map shows Gini coefficients The orange represents the highest level of inequality The lower map shows the poverty rate by state with orange indicating a higher poverty rate The correlation is imperfect but still striking Many of the lowest-income states are to be found in the south where inequality and poverty rates both tend to be high
Gini Coefficient
Fig 7 Median income Gini coefficient and poverty rate 2011 US states
source US Census Bureau
lt $456000 gt $59500$47500 - $52000$45600 - $47500 $52000 - $59500 lt 0432 gt 04690453 - 04670432 - 0453 0467 - 0469
85 - 118 162 - 219123 - 142118 - 123 142 - 162
median Income
Poverty Rate
Widening economic inequality in minnesota
Growth amp Justice 8
Figure 8 shows the relationship between state-level median income and the Gini coefficient in a scatter plot The line represents the general relationship between income and inequality Its downward slope tells us that inequality tends to be lowest where income is highest
Median household income has risen little over the last 30 years and has actually fallen since 2000 Minnesota compares favorably to the US as a whole but the advantage is slipping Our median household income remains higher and our inequality and poverty rates are lower than average but much of that favorable relative standing has disappeared since 2000 Our income is declining and inequality is rising absolutely and relative to other states Over the last 10 years we have fallen from 9th lowest Gini to 13th Our poverty rate has worsened from the 3rd lowest to 11th lowest
Iv Income InequalIty IncreasIngly becomes a publIc concern and economIc threat
The evidence is clear that inequality in America is rising The question of whether rising inequality is a cause for concern though is more contentious There are those who see it as a grave threat Others see it as a sign of a healthy and vigorous capitalist economy Some inequality is essential in producing opportunities and incentives for individuals to create new products to invest in innovative ideas and to work hard The economy as a whole is more productive and aggregate wealth is higher when innovation is vigorous and capital is put to its most valuable use The incentive to ldquoget richrdquo helps drive initiative and innovation
Accepting a life of grinding penury for large portions of the populace is offensive to empathetic and humane sensibilities and has been throughout human history But the acceleration of inequality trends in recent years is provoking important questions about the effect on growth itself Is economic growth threatened by inequality Does high inequality cause the economy as a whole to produce less for all
Median household income
Gini
coe
ffici
ent
Fig 8 Income and Gini Coefficients US States (2011)
source US Census Bureau
$35000 $40000 $45000 $50000 $55000 $60000 $65000 $70000
040
041
042
043
044
045
046
047
048
049
050
051
MN
US
High inequality
Low inequality
Widening economic inequality in minnesota
Growth amp Justice 9
These crucial questions occupy us in this section In particular we ask whether there is a level of inequality above which the positive incentives to contribute to economic performance are more than offset by the social costs And if so have we yet reached or exceeded that level
Some think that continued growth in inequality will continue to benefit society In this view economic growth is now hampered by public policies that overly limit the economic rewards to investment and effort In this view taxes and costly regulatory burdens to innovation investment and hard work need to be reduced Witness recent calls for lower top tax rates elimination of the Environmental Protection Agency and efforts to pass ldquoright to workrdquo laws
Others believe that increases in income inequality over the last thirty years are creating social harm sufficient to more than offset any benefits of additional economic growth Some go further providing evidence that current levels of inequality are actually reducing growth
We support the latter view that income inequality has crossed a threshold that threatens overall growth and that it is an issue of great importance In this section we present facts which establish the relative public ignorance about inequality discuss its actual damage to economic growth and provide some explanation of the cause-and-effect dynamics
perceived Actual and Desired Inequality
Inequality is an important issue if Americans believe it is an important issue In a study published in 2011 economists Michael Norton and Dan Ariely asked a random sample of 5522 Americans to rank three alternative distributions of wealth for a society3 The three distributions were as depicted in Figure 9 The first in 9a is the actual distribution of wealth in the US The richest 20 of American households hold 84 of total wealth and the poorest 20 of households hold 01 The third in 9c is a hypothetical distribution in which each fifth of the population has the same level of wealth This represents perfect equality The middle distribution 9b is a hypothetical intermediate wealth distribution There the richest 20 hold 36 of the wealth and the poorest 20 hold 11
Respondents to the online survey were asked to imagine that they might be a member of a given society but that their own place in the society would be determined by chance Which society would they rather inhabit They were provided an opportunity to choose from the three societies depicted in Figure 9 (without being told that 9a was the actual distribution of wealth in the US) Norton and Ariely discovered that for their respondents the least desirable alternative is the actual US distribution depicted in 9a The top choice for desired actual distribution was the intermediate distribution (9b) with 47 making it their first choice The equal distribution (9c) was next with 43 choosing it The actual US wealth distribution (9a) came last with only 10 choosing it
3 Wealth is different from income Also called net worth wealth is the value of all assets less the value of all debts owed Wealth is more concentrated than is income among the richest households
Top 20
Boom 20
Middle 204th 20
2nd 2084
1184
0201
Fig 9a US wealth distribution
Top 20
Boom 20
Middle 204th 20
2nd 20
2020
20
2020
Fig 9c Equal wealth distribution
Top 20
Boom 20
Middle 204th 20
2nd 2018
11 15
21
36 18
Fig 9b Intermediate wealth distribution
Widening economic inequality in minnesota
Growth amp Justice 10
Norton and Ariely then asked two further questions The first asked respondents to specify the level of wealth inequality that they believe exists in the US The second asked them to specify the level of wealth that they would like to see in the US Figure 10 taken from Norton and Arielyrsquos published study shows the results of these questions The first bar shows the actual US wealth distribution The second shows the average of respondentsrsquo estimates of the US wealth distribution The third shows the average of respondentsrsquo ideal US wealth distribution
Two main lessons may be drawn from these results The first is that people appear to underestimate dramatically the level of wealth inequality in the US economy The average person believes that the richest quintile holds about 57 of wealth when the actual share is 84 Second people wish that wealth inequality were even lower than they believe it to be The average person feels that the richest quintile should hold about 32 of wealth
Norton and Ariely confirm our belief that most favor some inequality Most would prefer less inequality than they think exists and would prefer far less than actually exists Our point is that most Americans think current inequality is excessive and likely would feel stronger about that if they knew the actual facts
Inequality and Growth
As we have posited earlier a certain amount of inequality is inevitable and most economists would agree that some is essential for healthy and vigorous economic growth As inequality increases though the marginal benefit to output from additional inequality logically declines Has inequality risen to a point where the marginal effects on output are actually negative That is is inequality now so high that recent widening has caused lower GDP than we would have had with the lower levels of inequality of the middle of the last century (a period of consistently high growth)
Ramaprasad Rajaram of the University of Georgia believes so In his 2010 PhD dissertation Poverty Income Inequality and Economic Growth in US Counties A Spatial Analysis he considers the effects of income inequality and poverty on economic growth He relates per capita income growth to poverty rates and overall income inequality (Gini coefficients) in 3072 US counties using data from the 1980 (1979 data) and 2000 (1999 data) US Census He assesses the relationship of poverty in 1979 to growth from 1979 to 1999 and finds that counties with lower poverty rates in 1979 grew on average significantly more quickly during the next 20 years He similarly found that counties with less overall income inequality in 1979 grew on average significantly more quickly than those with higher income inequality in 1979
He then went a step further looking at actual growth from 1979 to 1999 as a predictor of 1999 poverty and inequality measures He found that counties that grew more quickly from 1979 through 1999 had lower poverty rates and overall inequality at the end of the period Finally he split the counties into ldquorichrdquo and ldquopoorrdquo to see whether the effects differed He found little difference
Actual
Estimated
Preferred
Top 20 Second 20 Fourth 20 Bottom 20Middle 20
0 10 20 30 40 50 60 70 80 90 100
Percent of wealth owned
Fig 10 Actual estimated and preferred US wealth distributions
Widening economic inequality in minnesota
Growth amp Justice 11
His results tell a compelling story Those areas with less inequality and poverty today all else equal can expect higher future growth in future per capita income In the future those that actually experienced the highest growth are likely to have lower poverty and overall inequality In summary those that grow quickly are likely to be the ones that start with lower inequality The resulting high growth in turn has a dampening effect on future increases in inequality This is a virtuous cycle in which if all share in growing prosperity prosperity grows more rapidly
Inequality and Demand for Goods and Services
US consumers have driven the growth of the US economy at least since World War II Personal consumption has been about 70 of Gross Domestic Product (GDP) Through at least 1979 this consumption was driven by a broad and growing middle class and growing income widely shared across the income distribution Continued long-term growth likely will continue to depend on growing consumption If personal consumption is to remain at 70 of GDP it must grow at the same rate as GDP
As household income increases consumption increases along with it This has the effect of increasing the demand for the goods and services that give rise to the additional income Poor households spend nearly all their increases in income while middle income households spend most of the increases Those at the top spend a smaller proportion of additional income
When incomes at the top are growing much more quickly than those in the middle and the bottom of the distribution consumption naturally declines as a share of GDP In 2010 a year of weak economic recovery 93 of the growth in income went to the top 1 of households As a result this apportionment of additional personal income generated less additional demand for goods and services This perverse braking effect might be viewed as a downward spiral a vicious circle Slowing economic growth leads to increased inequality which then leads to even slower growthIn summary most Americans wish for less inequality than we have even while they underestimate the degree of current inequality Higher inequality inevitably produces lower growth because the wealthy spend less of their income than those less wealthy As income goes increasingly to the wealthy demand for goods and services is less than optimum Growth is constrained as inequality increases beyond a level that encourages growth
v causes oF InequalIty
Why exactly have poverty rates and income inequality increased so dramatically since 1980 Was it unavoidable What of the future How might we prevent further widening or even reverse the trend
Some observers explain our rising inequality as the inevitable result of advancing technology with its attendant rewards for the skilled workers who are able to perform high-tech jobs Others explain it as the inevitable result of increasing globalization in the world economy These two factors are certainly implicated Both have helped to increase global output and global incomes but both have also imposed costs on some people in some places Both have also shoveled generous rewards to a favored few Those bearing the highest costs have been the middle and lower classes in the developed world Those favored include those with capital and those who are highly educated in fields that allow them to take full advantage of globalization and technological advances
Globalization and technological advances generally benefit the same segments of society Globalization has made both production and capital more mobile without equivalent increases in labor mobility Businesses now face fewer legal and institutional impediments to movement of capital goods and services in and out of countries
Advances in technology have reduced the costs of moving goods and services from one country to another For example some accounting firms have American clientsrsquo tax returns prepared in India That is possible only because of recent changes in communications technology and institutions that allow exports of the services from India and import of those services to the US without expensive trade restrictions Here the shareholders of the accounting firm gain through lower costs while less work is available for American tax preparers Further downward pressure is exerted on the wages of the remaining tax preparers
Endless examples of ldquooutsourcingrdquo job loss and downward pressure on working-class Americans have become the staple of economic conversation for three decades Taken together and across the economy these examples create
Widening economic inequality in minnesota
Growth amp Justice 12
conditions that have increased inequality and poverty in the US Was this inevitable Is it necessary that poverty and inequality must increase as a result of technological changes and globalization
We do not believe so Public policies could have largely or completely mitigated the effects of technological changes and globalization Further we believe that government policies enacted over the last thirty years have not only failed to mitigate the effects but have independently increased poverty and inequality In short we are hopeful about the possibility of policy action mitigating inequality And we believe past and future increases in inequality and poverty are not inescapable and can be reversed
First let us look at the experiences of some other industrialized democratic countries They have faced the same forces of globalization and technological change Yet inequality and poverty in many of those countries has not changed appreciably
As noted earlier much of the growth in incomes in the US has been captured by those with incomes in the top 1 Figure 11 shows the path of top 1 income shares for the US Japan Australia and France all from 1913 to 20094 The message from this international comparison is that rising inequality is neither inevitable nor is it necessary for an economy to perform well Alone among the four rich countries shown the US has seen a dramatic rise in the top income share
Overall inequality as measured by the Gini coefficient (Figure 12) similarly demonstrates that the US is more unequal than other high income countries France Canada and Norway represent the other developed countries and have substantially lower inequality than the US In fact these countries have Gini coefficients not seen in the US since the 1970s Note that these are estimates made by The World Bank and differ somewhat from those for the US as estimated by the US Census Bureau
4 These data are different from those in Figure 3 in that income from capital gains is excluded in Figure 11 The source database includes information on capital gains income for the US but not for the other countries
0
5
10
15
20
25
1915
1920
1935
1930
1925
1945
1955
1980
1985
1950
1940
2000
1960
1965
1970
1975
1995
1990
2005
2010
Australia - Atkinson amp Leigh (2007)Japan - Moriquchi amp Saez (2010)
United States - Pikey amp Saez (2007) France - Pikey (2001 2007) Landais (2007)
Fig 11 Top 1 income shares for the United States Australia France amp Japan 1913 - 20011
Year
Inco
me
shar
e
source World Top Incomes Database
00
010
020
030
040
050
060
Norway Canada France India UnitedStates
China Brazil
0415
055
0408
03270368
0326
0258
Fig 12 Gini coefficients for selected countries
source The World Bank
Widening economic inequality in minnesota
Growth amp Justice 13
Figure 13 from the Organization for Economic Cooperation and Development (OECD) shows poverty rates in the mid-2000rsquos for selected OECD countries We stand near the top In the figure each bar represents the percentage of a countryrsquos population living in households with less than 50 of that countryrsquos median income According to this measure the US has the third-highest poverty rate in the OECD at 173 Americarsquos 2010 median income was $49445 We can say then that 173 of all US households had income that year below $24722 Note that the poverty rate as measured by the OECD is higher than reported by the US Census Bureau That agency defines poverty differently than the OECD
Other high income countries have faced globalization and technological changes without a rapid proportional rise in incomes at the top dramatic increases in overall inequality or similar levels of poverty Our neighbor Canada reports median family income of $69860 in 2010 While the definition used by Statistics Canada may differ from that of our Census Bureau it seems reasonable to conclude that Canadian household income is at least comparable to that in the US Canada now has lower unemployment and growth rates similar to ours Canada is doing at least as well as we are economically without our high levels of inequality and poverty
We conclude that recent and future increases in inequality are not inevitable and that we could reduce inequality in the future
vI a proposal For a new polIcy evaluatIon tool the ldquoeconomIc InequalIty Impact assessmentrdquo
In the late 1960s as awareness spread about the threat posed by pollution of all kinds to property and especially to human health policymakers in the United States began to adopt laws appropriations and regulations designed to reduce or remediate environmental damages
Many of the laws and regulations simply required reductions in pollutants and emissions or banned the use of the worst toxins such as DDT But one of the most important provisions was the introduction of requirements to estimate in advance the environmental impact from pending development projects or policies The Environmental Impact Statement or EIS became a useful and accepted policy development tool
We believe growing inequality represents a similar threat to our societyrsquos long-term well-being A further concentration of income and wealth in fewer and fewer households and the accompanying rise in poverty and the decline of middle-income economic stability compels policymakers at all levels to conduct a more systematic assessment of economic inequality impact before they make decisions that could further exacerbate inequality We propose that all economically significant legislation and new state regulations in Minnesota should be subjected to an analysis that measures the policyrsquos impact on economic inequality
The experience with environmental impact measurement is encouraging In a 1994 paper noted environmental law professor William H Rodgers Jr included the EIS in his list of the seven most influential or effective US
0
5
10
15
20
25
Denmark Sweden OECD UnitedKingdom
Canada UnitedStates
Mexico
173
21
114111 113
84
61
Fig 13 Poverty rates at 50 or less of median income for selected OECD countries
source Organization for Economic Cooperation and Development (OECD)
Widening economic inequality in minnesota
Growth amp Justice 14
environmental laws The EIS was part of the National Environmental Policy Act of 1969 (NEPA) and requires federal agencies to prepare an EIS to accompany any agency action that has a significant effect on the human environment Rodgers noted that environmental impact statements were ldquoreplicated in rapid fashion throughout the United States and around the worldrdquo and have become ldquothe most frequently copied and most frequently cited of all US domestic environmental lawsrdquo 5
Legislators and other policymakers in Minnesota could develop an Economic Inequality Impact Assessment (EIIA) for all major policies that are likely to have a measurable effect on income or wealth distribution (This specific title and acronym used hereafter is the creation of the authors of this report we hope to popularize the concept but are not adamant about how it is labeled or the specifics of its implementation)
Minnesota already has a reputation among the states for distinctive high-quality economic measurement tools The Price of Government measurement and the biennial Tax Incidence Study both launched in the 1990s and updated regularly provide uniquely detailed perspective on the overall size of state-and-local government as a percent of income (Price of Government) and how the taxes for that public investment is paid by economic strata (Tax Incidence Study) These tools have greatly enabled quantitative analysis of relative fairness and equality
Legislative and executive branch staffers are familiar with the concept of projecting the costs and benefits of potential policy When legislators advance bills that directly or indirectly create a cost for state or local governments they must seek fiscal notes which calculate the costs of the proposed legislation
Support for measuring projected inequality particularly as it relates to poverty has come in recent years from a growing national coalition of community and philanthropic efforts and Minnesota has been a leader in this effort
The Washington DC based Center for Law and Social Policy (CLASP) published a summary of federal and state efforts that align with a CLASP initiative for Poverty Impact Projections (PIP) The PIP concept as described in that 2011 CLASP report could be easily applied to a broader Economic Inequality Impact Assessment
As stated in the CLASP study ldquoGetting a clearer prognosis of the potential impact of a pending policy is valuable not just for elected officials who need to vote on bills but also for other policymakers and community stakeholders who need to make planning and implementation decisionsrdquo 6
Minnesota is one of the few states highlighted in the CLASP report as having done the most to advance the concept of poverty impact projections noting that just such a mechanism was a key recommendation of the Legislative Commission to End Poverty in Minnesota by 2020 Along with many other local groups particularly the nonprofit organization A Minnesota Without Poverty we encourage efforts toward establishing a poverty impact projection but submit that a broader top-to-bottom evaluation of policy in the form of an Economic Inequality Impact Assessment would be even more valuable
5 Rodgers Jr W H (1994) The Seven Statutory Wonders of US Environmental Law Origins and Morphology Loyola of Los Angeles Law Review 1009-1022 Available at httpdigital commonslmuedullrvol27iss315
6 Levin-Epstein J amp Sanes M (August 2011) At the Forefront Poverty Impact Projections Washington DC CLASP
Widening economic inequality in minnesota
Growth amp Justice 15 2324 University Ave W Suite 120 A Saint Paul MN 55114 wwwgrowthandjusticeorg
Smart Investments Practical Solutions Broader Prosperity
We do not offer here a precise formula for an EIIA But our conversations and interviews with state tax and budget experts suggest the following in regard to practical design and implementation of an EIIA for Minnesota
bull The EIIA could be housed in the Minnesota Management and Budget agency within the office of the State Economist The agency commissioner could appoint an advisory group of economic experts to assist in designing an EIIA process and methodology
bull An EIIA for tax bills could begin in the Revenue Department using more detailed projections about the impact of various tax proposals on the Suits index and other measurements of tax incidence
bull An EIIA could initially calculate the estimated direction of the effect on inequality measures rather than predict specific numerical outcomes An EIIA likely would need to have a de minimis threshold as do fiscal notes in the state budget process so that not every bill or proposal coming before a committee would need to be assessed
bull Scores of specific policy proposals aimed at reducing inequalitymdashinvestment in early childhood education higher minimum wages elimination of high-income tax cuts and breaksmdashare proposed every year by national and state policymakers In many cases the effects on reducing inequality are obvious intuitively But how much more valuable would it be for policymakers to have more precise information about the relative impacts of such proposals
Better economic information will help policymakers navigate toward a more equitable and sustainable economy and society Establishment of an Economic Inequality Impact Assessment would be a valuable addition to the policymaking toolbox
about the authors
Jay Coggins is an associate professor with the Department of Applied Economics at the University of Minnesota and a policy fellow for Growth amp Justice
thomas legg is a senior lecturer at the University of Minnesotarsquos Carlson School of Management and a policy fellow for Growth amp Justice
dane smith is the president of Growth amp Justice
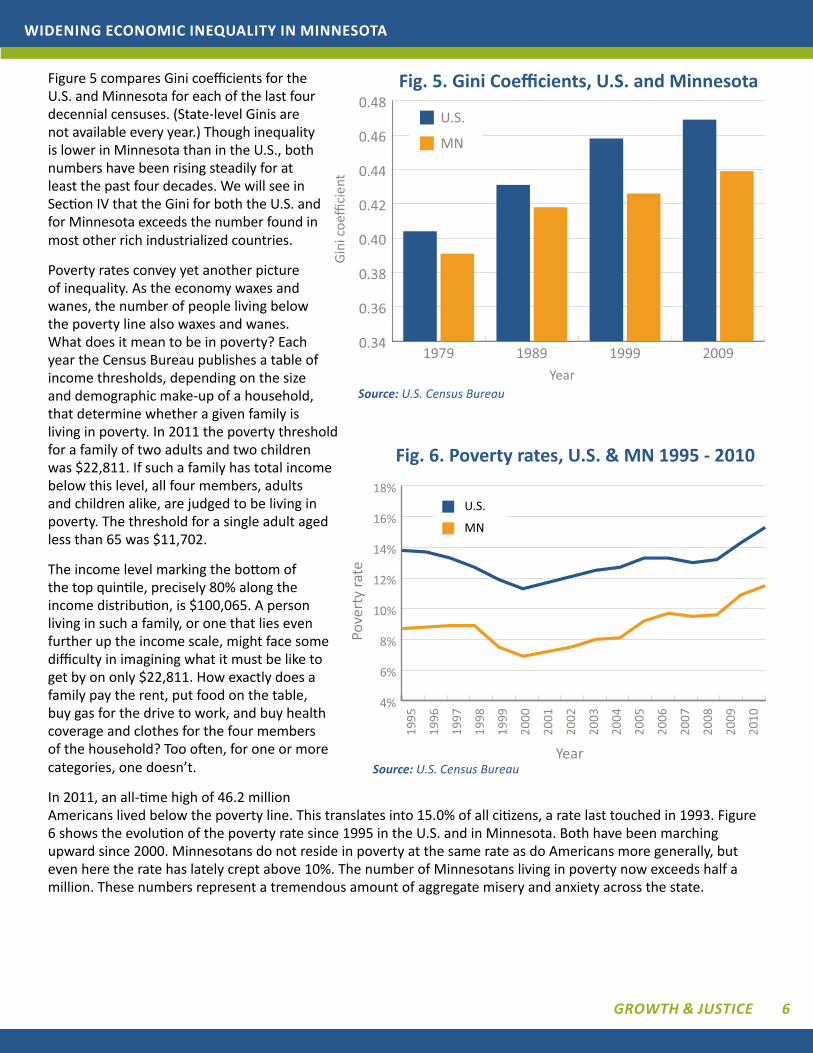
Widening economic inequality in minnesota
Growth amp Justice 6
Figure 5 compares Gini coefficients for the US and Minnesota for each of the last four decennial censuses (State-level Ginis are not available every year) Though inequality is lower in Minnesota than in the US both numbers have been rising steadily for at least the past four decades We will see in Section IV that the Gini for both the US and for Minnesota exceeds the number found in most other rich industrialized countries
Poverty rates convey yet another picture of inequality As the economy waxes and wanes the number of people living below the poverty line also waxes and wanes What does it mean to be in poverty Each year the Census Bureau publishes a table of income thresholds depending on the size and demographic make-up of a household that determine whether a given family is living in poverty In 2011 the poverty threshold for a family of two adults and two children was $22811 If such a family has total income below this level all four members adults and children alike are judged to be living in poverty The threshold for a single adult aged less than 65 was $11702
The income level marking the bottom of the top quintile precisely 80 along the income distribution is $100065 A person living in such a family or one that lies even further up the income scale might face some difficulty in imagining what it must be like to get by on only $22811 How exactly does a family pay the rent put food on the table buy gas for the drive to work and buy health coverage and clothes for the four members of the household Too often for one or more categories one doesnrsquot
In 2011 an all-time high of 462 million Americans lived below the poverty line This translates into 150 of all citizens a rate last touched in 1993 Figure 6 shows the evolution of the poverty rate since 1995 in the US and in Minnesota Both have been marching upward since 2000 Minnesotans do not reside in poverty at the same rate as do Americans more generally but even here the rate has lately crept above 10 The number of Minnesotans living in poverty now exceeds half a million These numbers represent a tremendous amount of aggregate misery and anxiety across the state
Pove
rty
rate
Yearsource US Census Bureau
Fig 6 Poverty rates US amp MN 1995 - 2010
4
6
8
10
12
14
16
18
2002
2001
2000
1999
1998
1997
1996
1995
2007
2006
2005
2004
2003
2009
2008
US
MN
2010
Gini
coe
ffici
ent
034
036
038
040
042
044
046
048
2009199919891979
MN
US
Yearsource US Census Bureau
Fig 5 Gini Coefficients US and Minnesota
Widening economic inequality in minnesota
Growth amp Justice 7
III InequalIty Is hIghest where Income Is lowest
Whenever the rising tide of inequality is decried there doubtless will be plenty of respondents who express a firm and abiding disbelief in the numbers Just as there are many who deny the science indicating global climate change so there are many who deny the evidence indicating that inequality is on the rise
Many theories have been advanced to explain this resistance to accept the evidence One likely possibility is that a great many Americans and a great many Minnesotans live in places where income is high and inequality is low The importance of this empirical fact can hardly be overstated inequality tends to be highest where income is lowest
Minnesotarsquos suburban metro counties for instance rank at or near the top of the list with respect to median income They rank at or near the bottom of the list with respect to the Gini coefficient and the poverty rate People who live in these counties may have little or no first-hand experience with inequality or with widespread poverty Convincing them to believe in something their eyes rarely see can be a challenge
It should not be surprising that inequality varies across the landscape Aggregate numbers whether for all of the US or all of Minnesota mask important variability within the relevant population And the pattern is consistent The upper left map in Figure 7 shows median income by state across the 48 contiguous US states The light gray color represents the lowest median income level The upper right map shows Gini coefficients The orange represents the highest level of inequality The lower map shows the poverty rate by state with orange indicating a higher poverty rate The correlation is imperfect but still striking Many of the lowest-income states are to be found in the south where inequality and poverty rates both tend to be high
Gini Coefficient
Fig 7 Median income Gini coefficient and poverty rate 2011 US states
source US Census Bureau
lt $456000 gt $59500$47500 - $52000$45600 - $47500 $52000 - $59500 lt 0432 gt 04690453 - 04670432 - 0453 0467 - 0469
85 - 118 162 - 219123 - 142118 - 123 142 - 162
median Income
Poverty Rate
Widening economic inequality in minnesota
Growth amp Justice 8
Figure 8 shows the relationship between state-level median income and the Gini coefficient in a scatter plot The line represents the general relationship between income and inequality Its downward slope tells us that inequality tends to be lowest where income is highest
Median household income has risen little over the last 30 years and has actually fallen since 2000 Minnesota compares favorably to the US as a whole but the advantage is slipping Our median household income remains higher and our inequality and poverty rates are lower than average but much of that favorable relative standing has disappeared since 2000 Our income is declining and inequality is rising absolutely and relative to other states Over the last 10 years we have fallen from 9th lowest Gini to 13th Our poverty rate has worsened from the 3rd lowest to 11th lowest
Iv Income InequalIty IncreasIngly becomes a publIc concern and economIc threat
The evidence is clear that inequality in America is rising The question of whether rising inequality is a cause for concern though is more contentious There are those who see it as a grave threat Others see it as a sign of a healthy and vigorous capitalist economy Some inequality is essential in producing opportunities and incentives for individuals to create new products to invest in innovative ideas and to work hard The economy as a whole is more productive and aggregate wealth is higher when innovation is vigorous and capital is put to its most valuable use The incentive to ldquoget richrdquo helps drive initiative and innovation
Accepting a life of grinding penury for large portions of the populace is offensive to empathetic and humane sensibilities and has been throughout human history But the acceleration of inequality trends in recent years is provoking important questions about the effect on growth itself Is economic growth threatened by inequality Does high inequality cause the economy as a whole to produce less for all
Median household income
Gini
coe
ffici
ent
Fig 8 Income and Gini Coefficients US States (2011)
source US Census Bureau
$35000 $40000 $45000 $50000 $55000 $60000 $65000 $70000
040
041
042
043
044
045
046
047
048
049
050
051
MN
US
High inequality
Low inequality
Widening economic inequality in minnesota
Growth amp Justice 9
These crucial questions occupy us in this section In particular we ask whether there is a level of inequality above which the positive incentives to contribute to economic performance are more than offset by the social costs And if so have we yet reached or exceeded that level
Some think that continued growth in inequality will continue to benefit society In this view economic growth is now hampered by public policies that overly limit the economic rewards to investment and effort In this view taxes and costly regulatory burdens to innovation investment and hard work need to be reduced Witness recent calls for lower top tax rates elimination of the Environmental Protection Agency and efforts to pass ldquoright to workrdquo laws
Others believe that increases in income inequality over the last thirty years are creating social harm sufficient to more than offset any benefits of additional economic growth Some go further providing evidence that current levels of inequality are actually reducing growth
We support the latter view that income inequality has crossed a threshold that threatens overall growth and that it is an issue of great importance In this section we present facts which establish the relative public ignorance about inequality discuss its actual damage to economic growth and provide some explanation of the cause-and-effect dynamics
perceived Actual and Desired Inequality
Inequality is an important issue if Americans believe it is an important issue In a study published in 2011 economists Michael Norton and Dan Ariely asked a random sample of 5522 Americans to rank three alternative distributions of wealth for a society3 The three distributions were as depicted in Figure 9 The first in 9a is the actual distribution of wealth in the US The richest 20 of American households hold 84 of total wealth and the poorest 20 of households hold 01 The third in 9c is a hypothetical distribution in which each fifth of the population has the same level of wealth This represents perfect equality The middle distribution 9b is a hypothetical intermediate wealth distribution There the richest 20 hold 36 of the wealth and the poorest 20 hold 11
Respondents to the online survey were asked to imagine that they might be a member of a given society but that their own place in the society would be determined by chance Which society would they rather inhabit They were provided an opportunity to choose from the three societies depicted in Figure 9 (without being told that 9a was the actual distribution of wealth in the US) Norton and Ariely discovered that for their respondents the least desirable alternative is the actual US distribution depicted in 9a The top choice for desired actual distribution was the intermediate distribution (9b) with 47 making it their first choice The equal distribution (9c) was next with 43 choosing it The actual US wealth distribution (9a) came last with only 10 choosing it
3 Wealth is different from income Also called net worth wealth is the value of all assets less the value of all debts owed Wealth is more concentrated than is income among the richest households
Top 20
Boom 20
Middle 204th 20
2nd 2084
1184
0201
Fig 9a US wealth distribution
Top 20
Boom 20
Middle 204th 20
2nd 20
2020
20
2020
Fig 9c Equal wealth distribution
Top 20
Boom 20
Middle 204th 20
2nd 2018
11 15
21
36 18
Fig 9b Intermediate wealth distribution
Widening economic inequality in minnesota
Growth amp Justice 10
Norton and Ariely then asked two further questions The first asked respondents to specify the level of wealth inequality that they believe exists in the US The second asked them to specify the level of wealth that they would like to see in the US Figure 10 taken from Norton and Arielyrsquos published study shows the results of these questions The first bar shows the actual US wealth distribution The second shows the average of respondentsrsquo estimates of the US wealth distribution The third shows the average of respondentsrsquo ideal US wealth distribution
Two main lessons may be drawn from these results The first is that people appear to underestimate dramatically the level of wealth inequality in the US economy The average person believes that the richest quintile holds about 57 of wealth when the actual share is 84 Second people wish that wealth inequality were even lower than they believe it to be The average person feels that the richest quintile should hold about 32 of wealth
Norton and Ariely confirm our belief that most favor some inequality Most would prefer less inequality than they think exists and would prefer far less than actually exists Our point is that most Americans think current inequality is excessive and likely would feel stronger about that if they knew the actual facts
Inequality and Growth
As we have posited earlier a certain amount of inequality is inevitable and most economists would agree that some is essential for healthy and vigorous economic growth As inequality increases though the marginal benefit to output from additional inequality logically declines Has inequality risen to a point where the marginal effects on output are actually negative That is is inequality now so high that recent widening has caused lower GDP than we would have had with the lower levels of inequality of the middle of the last century (a period of consistently high growth)
Ramaprasad Rajaram of the University of Georgia believes so In his 2010 PhD dissertation Poverty Income Inequality and Economic Growth in US Counties A Spatial Analysis he considers the effects of income inequality and poverty on economic growth He relates per capita income growth to poverty rates and overall income inequality (Gini coefficients) in 3072 US counties using data from the 1980 (1979 data) and 2000 (1999 data) US Census He assesses the relationship of poverty in 1979 to growth from 1979 to 1999 and finds that counties with lower poverty rates in 1979 grew on average significantly more quickly during the next 20 years He similarly found that counties with less overall income inequality in 1979 grew on average significantly more quickly than those with higher income inequality in 1979
He then went a step further looking at actual growth from 1979 to 1999 as a predictor of 1999 poverty and inequality measures He found that counties that grew more quickly from 1979 through 1999 had lower poverty rates and overall inequality at the end of the period Finally he split the counties into ldquorichrdquo and ldquopoorrdquo to see whether the effects differed He found little difference
Actual
Estimated
Preferred
Top 20 Second 20 Fourth 20 Bottom 20Middle 20
0 10 20 30 40 50 60 70 80 90 100
Percent of wealth owned
Fig 10 Actual estimated and preferred US wealth distributions
Widening economic inequality in minnesota
Growth amp Justice 11
His results tell a compelling story Those areas with less inequality and poverty today all else equal can expect higher future growth in future per capita income In the future those that actually experienced the highest growth are likely to have lower poverty and overall inequality In summary those that grow quickly are likely to be the ones that start with lower inequality The resulting high growth in turn has a dampening effect on future increases in inequality This is a virtuous cycle in which if all share in growing prosperity prosperity grows more rapidly
Inequality and Demand for Goods and Services
US consumers have driven the growth of the US economy at least since World War II Personal consumption has been about 70 of Gross Domestic Product (GDP) Through at least 1979 this consumption was driven by a broad and growing middle class and growing income widely shared across the income distribution Continued long-term growth likely will continue to depend on growing consumption If personal consumption is to remain at 70 of GDP it must grow at the same rate as GDP
As household income increases consumption increases along with it This has the effect of increasing the demand for the goods and services that give rise to the additional income Poor households spend nearly all their increases in income while middle income households spend most of the increases Those at the top spend a smaller proportion of additional income
When incomes at the top are growing much more quickly than those in the middle and the bottom of the distribution consumption naturally declines as a share of GDP In 2010 a year of weak economic recovery 93 of the growth in income went to the top 1 of households As a result this apportionment of additional personal income generated less additional demand for goods and services This perverse braking effect might be viewed as a downward spiral a vicious circle Slowing economic growth leads to increased inequality which then leads to even slower growthIn summary most Americans wish for less inequality than we have even while they underestimate the degree of current inequality Higher inequality inevitably produces lower growth because the wealthy spend less of their income than those less wealthy As income goes increasingly to the wealthy demand for goods and services is less than optimum Growth is constrained as inequality increases beyond a level that encourages growth
v causes oF InequalIty
Why exactly have poverty rates and income inequality increased so dramatically since 1980 Was it unavoidable What of the future How might we prevent further widening or even reverse the trend
Some observers explain our rising inequality as the inevitable result of advancing technology with its attendant rewards for the skilled workers who are able to perform high-tech jobs Others explain it as the inevitable result of increasing globalization in the world economy These two factors are certainly implicated Both have helped to increase global output and global incomes but both have also imposed costs on some people in some places Both have also shoveled generous rewards to a favored few Those bearing the highest costs have been the middle and lower classes in the developed world Those favored include those with capital and those who are highly educated in fields that allow them to take full advantage of globalization and technological advances
Globalization and technological advances generally benefit the same segments of society Globalization has made both production and capital more mobile without equivalent increases in labor mobility Businesses now face fewer legal and institutional impediments to movement of capital goods and services in and out of countries
Advances in technology have reduced the costs of moving goods and services from one country to another For example some accounting firms have American clientsrsquo tax returns prepared in India That is possible only because of recent changes in communications technology and institutions that allow exports of the services from India and import of those services to the US without expensive trade restrictions Here the shareholders of the accounting firm gain through lower costs while less work is available for American tax preparers Further downward pressure is exerted on the wages of the remaining tax preparers
Endless examples of ldquooutsourcingrdquo job loss and downward pressure on working-class Americans have become the staple of economic conversation for three decades Taken together and across the economy these examples create
Widening economic inequality in minnesota
Growth amp Justice 12
conditions that have increased inequality and poverty in the US Was this inevitable Is it necessary that poverty and inequality must increase as a result of technological changes and globalization
We do not believe so Public policies could have largely or completely mitigated the effects of technological changes and globalization Further we believe that government policies enacted over the last thirty years have not only failed to mitigate the effects but have independently increased poverty and inequality In short we are hopeful about the possibility of policy action mitigating inequality And we believe past and future increases in inequality and poverty are not inescapable and can be reversed
First let us look at the experiences of some other industrialized democratic countries They have faced the same forces of globalization and technological change Yet inequality and poverty in many of those countries has not changed appreciably
As noted earlier much of the growth in incomes in the US has been captured by those with incomes in the top 1 Figure 11 shows the path of top 1 income shares for the US Japan Australia and France all from 1913 to 20094 The message from this international comparison is that rising inequality is neither inevitable nor is it necessary for an economy to perform well Alone among the four rich countries shown the US has seen a dramatic rise in the top income share
Overall inequality as measured by the Gini coefficient (Figure 12) similarly demonstrates that the US is more unequal than other high income countries France Canada and Norway represent the other developed countries and have substantially lower inequality than the US In fact these countries have Gini coefficients not seen in the US since the 1970s Note that these are estimates made by The World Bank and differ somewhat from those for the US as estimated by the US Census Bureau
4 These data are different from those in Figure 3 in that income from capital gains is excluded in Figure 11 The source database includes information on capital gains income for the US but not for the other countries
0
5
10
15
20
25
1915
1920
1935
1930
1925
1945
1955
1980
1985
1950
1940
2000
1960
1965
1970
1975
1995
1990
2005
2010
Australia - Atkinson amp Leigh (2007)Japan - Moriquchi amp Saez (2010)
United States - Pikey amp Saez (2007) France - Pikey (2001 2007) Landais (2007)
Fig 11 Top 1 income shares for the United States Australia France amp Japan 1913 - 20011
Year
Inco
me
shar
e
source World Top Incomes Database
00
010
020
030
040
050
060
Norway Canada France India UnitedStates
China Brazil
0415
055
0408
03270368
0326
0258
Fig 12 Gini coefficients for selected countries
source The World Bank
Widening economic inequality in minnesota
Growth amp Justice 13
Figure 13 from the Organization for Economic Cooperation and Development (OECD) shows poverty rates in the mid-2000rsquos for selected OECD countries We stand near the top In the figure each bar represents the percentage of a countryrsquos population living in households with less than 50 of that countryrsquos median income According to this measure the US has the third-highest poverty rate in the OECD at 173 Americarsquos 2010 median income was $49445 We can say then that 173 of all US households had income that year below $24722 Note that the poverty rate as measured by the OECD is higher than reported by the US Census Bureau That agency defines poverty differently than the OECD
Other high income countries have faced globalization and technological changes without a rapid proportional rise in incomes at the top dramatic increases in overall inequality or similar levels of poverty Our neighbor Canada reports median family income of $69860 in 2010 While the definition used by Statistics Canada may differ from that of our Census Bureau it seems reasonable to conclude that Canadian household income is at least comparable to that in the US Canada now has lower unemployment and growth rates similar to ours Canada is doing at least as well as we are economically without our high levels of inequality and poverty
We conclude that recent and future increases in inequality are not inevitable and that we could reduce inequality in the future
vI a proposal For a new polIcy evaluatIon tool the ldquoeconomIc InequalIty Impact assessmentrdquo
In the late 1960s as awareness spread about the threat posed by pollution of all kinds to property and especially to human health policymakers in the United States began to adopt laws appropriations and regulations designed to reduce or remediate environmental damages
Many of the laws and regulations simply required reductions in pollutants and emissions or banned the use of the worst toxins such as DDT But one of the most important provisions was the introduction of requirements to estimate in advance the environmental impact from pending development projects or policies The Environmental Impact Statement or EIS became a useful and accepted policy development tool
We believe growing inequality represents a similar threat to our societyrsquos long-term well-being A further concentration of income and wealth in fewer and fewer households and the accompanying rise in poverty and the decline of middle-income economic stability compels policymakers at all levels to conduct a more systematic assessment of economic inequality impact before they make decisions that could further exacerbate inequality We propose that all economically significant legislation and new state regulations in Minnesota should be subjected to an analysis that measures the policyrsquos impact on economic inequality
The experience with environmental impact measurement is encouraging In a 1994 paper noted environmental law professor William H Rodgers Jr included the EIS in his list of the seven most influential or effective US
0
5
10
15
20
25
Denmark Sweden OECD UnitedKingdom
Canada UnitedStates
Mexico
173
21
114111 113
84
61
Fig 13 Poverty rates at 50 or less of median income for selected OECD countries
source Organization for Economic Cooperation and Development (OECD)
Widening economic inequality in minnesota
Growth amp Justice 14
environmental laws The EIS was part of the National Environmental Policy Act of 1969 (NEPA) and requires federal agencies to prepare an EIS to accompany any agency action that has a significant effect on the human environment Rodgers noted that environmental impact statements were ldquoreplicated in rapid fashion throughout the United States and around the worldrdquo and have become ldquothe most frequently copied and most frequently cited of all US domestic environmental lawsrdquo 5
Legislators and other policymakers in Minnesota could develop an Economic Inequality Impact Assessment (EIIA) for all major policies that are likely to have a measurable effect on income or wealth distribution (This specific title and acronym used hereafter is the creation of the authors of this report we hope to popularize the concept but are not adamant about how it is labeled or the specifics of its implementation)
Minnesota already has a reputation among the states for distinctive high-quality economic measurement tools The Price of Government measurement and the biennial Tax Incidence Study both launched in the 1990s and updated regularly provide uniquely detailed perspective on the overall size of state-and-local government as a percent of income (Price of Government) and how the taxes for that public investment is paid by economic strata (Tax Incidence Study) These tools have greatly enabled quantitative analysis of relative fairness and equality
Legislative and executive branch staffers are familiar with the concept of projecting the costs and benefits of potential policy When legislators advance bills that directly or indirectly create a cost for state or local governments they must seek fiscal notes which calculate the costs of the proposed legislation
Support for measuring projected inequality particularly as it relates to poverty has come in recent years from a growing national coalition of community and philanthropic efforts and Minnesota has been a leader in this effort
The Washington DC based Center for Law and Social Policy (CLASP) published a summary of federal and state efforts that align with a CLASP initiative for Poverty Impact Projections (PIP) The PIP concept as described in that 2011 CLASP report could be easily applied to a broader Economic Inequality Impact Assessment
As stated in the CLASP study ldquoGetting a clearer prognosis of the potential impact of a pending policy is valuable not just for elected officials who need to vote on bills but also for other policymakers and community stakeholders who need to make planning and implementation decisionsrdquo 6
Minnesota is one of the few states highlighted in the CLASP report as having done the most to advance the concept of poverty impact projections noting that just such a mechanism was a key recommendation of the Legislative Commission to End Poverty in Minnesota by 2020 Along with many other local groups particularly the nonprofit organization A Minnesota Without Poverty we encourage efforts toward establishing a poverty impact projection but submit that a broader top-to-bottom evaluation of policy in the form of an Economic Inequality Impact Assessment would be even more valuable
5 Rodgers Jr W H (1994) The Seven Statutory Wonders of US Environmental Law Origins and Morphology Loyola of Los Angeles Law Review 1009-1022 Available at httpdigital commonslmuedullrvol27iss315
6 Levin-Epstein J amp Sanes M (August 2011) At the Forefront Poverty Impact Projections Washington DC CLASP
Widening economic inequality in minnesota
Growth amp Justice 15 2324 University Ave W Suite 120 A Saint Paul MN 55114 wwwgrowthandjusticeorg
Smart Investments Practical Solutions Broader Prosperity
We do not offer here a precise formula for an EIIA But our conversations and interviews with state tax and budget experts suggest the following in regard to practical design and implementation of an EIIA for Minnesota
bull The EIIA could be housed in the Minnesota Management and Budget agency within the office of the State Economist The agency commissioner could appoint an advisory group of economic experts to assist in designing an EIIA process and methodology
bull An EIIA for tax bills could begin in the Revenue Department using more detailed projections about the impact of various tax proposals on the Suits index and other measurements of tax incidence
bull An EIIA could initially calculate the estimated direction of the effect on inequality measures rather than predict specific numerical outcomes An EIIA likely would need to have a de minimis threshold as do fiscal notes in the state budget process so that not every bill or proposal coming before a committee would need to be assessed
bull Scores of specific policy proposals aimed at reducing inequalitymdashinvestment in early childhood education higher minimum wages elimination of high-income tax cuts and breaksmdashare proposed every year by national and state policymakers In many cases the effects on reducing inequality are obvious intuitively But how much more valuable would it be for policymakers to have more precise information about the relative impacts of such proposals
Better economic information will help policymakers navigate toward a more equitable and sustainable economy and society Establishment of an Economic Inequality Impact Assessment would be a valuable addition to the policymaking toolbox
about the authors
Jay Coggins is an associate professor with the Department of Applied Economics at the University of Minnesota and a policy fellow for Growth amp Justice
thomas legg is a senior lecturer at the University of Minnesotarsquos Carlson School of Management and a policy fellow for Growth amp Justice
dane smith is the president of Growth amp Justice
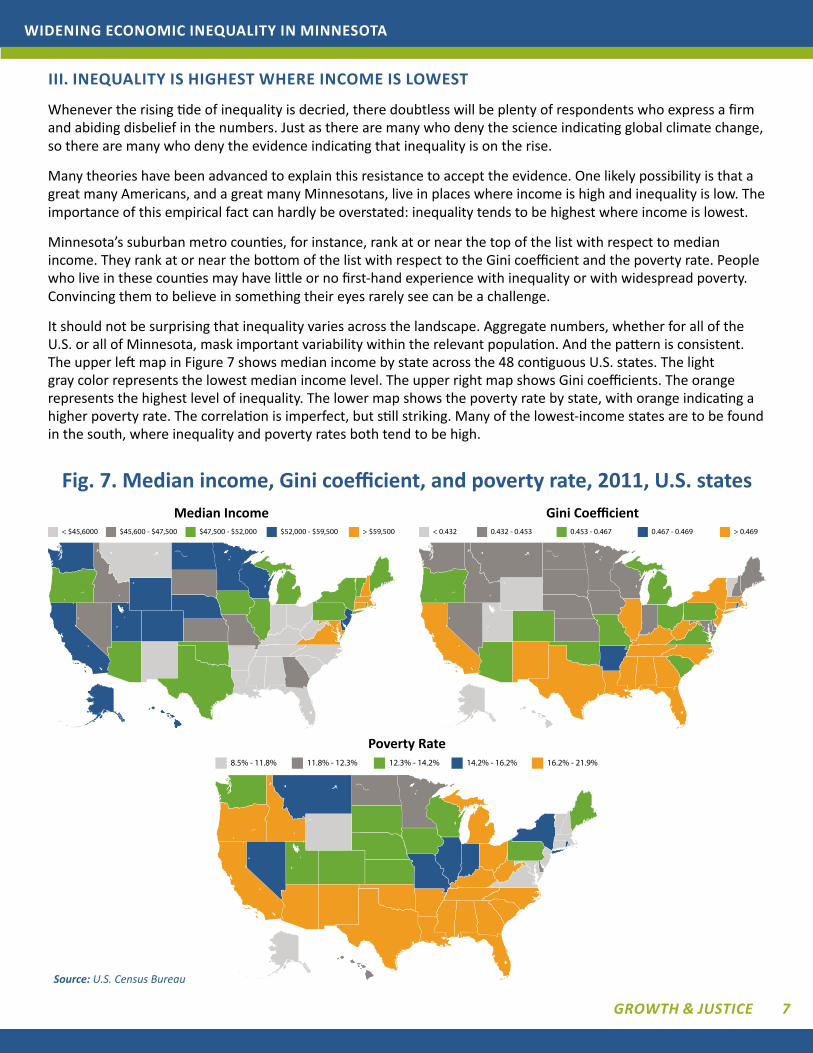
Widening economic inequality in minnesota
Growth amp Justice 7
III InequalIty Is hIghest where Income Is lowest
Whenever the rising tide of inequality is decried there doubtless will be plenty of respondents who express a firm and abiding disbelief in the numbers Just as there are many who deny the science indicating global climate change so there are many who deny the evidence indicating that inequality is on the rise
Many theories have been advanced to explain this resistance to accept the evidence One likely possibility is that a great many Americans and a great many Minnesotans live in places where income is high and inequality is low The importance of this empirical fact can hardly be overstated inequality tends to be highest where income is lowest
Minnesotarsquos suburban metro counties for instance rank at or near the top of the list with respect to median income They rank at or near the bottom of the list with respect to the Gini coefficient and the poverty rate People who live in these counties may have little or no first-hand experience with inequality or with widespread poverty Convincing them to believe in something their eyes rarely see can be a challenge
It should not be surprising that inequality varies across the landscape Aggregate numbers whether for all of the US or all of Minnesota mask important variability within the relevant population And the pattern is consistent The upper left map in Figure 7 shows median income by state across the 48 contiguous US states The light gray color represents the lowest median income level The upper right map shows Gini coefficients The orange represents the highest level of inequality The lower map shows the poverty rate by state with orange indicating a higher poverty rate The correlation is imperfect but still striking Many of the lowest-income states are to be found in the south where inequality and poverty rates both tend to be high
Gini Coefficient
Fig 7 Median income Gini coefficient and poverty rate 2011 US states
source US Census Bureau
lt $456000 gt $59500$47500 - $52000$45600 - $47500 $52000 - $59500 lt 0432 gt 04690453 - 04670432 - 0453 0467 - 0469
85 - 118 162 - 219123 - 142118 - 123 142 - 162
median Income
Poverty Rate
Widening economic inequality in minnesota
Growth amp Justice 8
Figure 8 shows the relationship between state-level median income and the Gini coefficient in a scatter plot The line represents the general relationship between income and inequality Its downward slope tells us that inequality tends to be lowest where income is highest
Median household income has risen little over the last 30 years and has actually fallen since 2000 Minnesota compares favorably to the US as a whole but the advantage is slipping Our median household income remains higher and our inequality and poverty rates are lower than average but much of that favorable relative standing has disappeared since 2000 Our income is declining and inequality is rising absolutely and relative to other states Over the last 10 years we have fallen from 9th lowest Gini to 13th Our poverty rate has worsened from the 3rd lowest to 11th lowest
Iv Income InequalIty IncreasIngly becomes a publIc concern and economIc threat
The evidence is clear that inequality in America is rising The question of whether rising inequality is a cause for concern though is more contentious There are those who see it as a grave threat Others see it as a sign of a healthy and vigorous capitalist economy Some inequality is essential in producing opportunities and incentives for individuals to create new products to invest in innovative ideas and to work hard The economy as a whole is more productive and aggregate wealth is higher when innovation is vigorous and capital is put to its most valuable use The incentive to ldquoget richrdquo helps drive initiative and innovation
Accepting a life of grinding penury for large portions of the populace is offensive to empathetic and humane sensibilities and has been throughout human history But the acceleration of inequality trends in recent years is provoking important questions about the effect on growth itself Is economic growth threatened by inequality Does high inequality cause the economy as a whole to produce less for all
Median household income
Gini
coe
ffici
ent
Fig 8 Income and Gini Coefficients US States (2011)
source US Census Bureau
$35000 $40000 $45000 $50000 $55000 $60000 $65000 $70000
040
041
042
043
044
045
046
047
048
049
050
051
MN
US
High inequality
Low inequality
Widening economic inequality in minnesota
Growth amp Justice 9
These crucial questions occupy us in this section In particular we ask whether there is a level of inequality above which the positive incentives to contribute to economic performance are more than offset by the social costs And if so have we yet reached or exceeded that level
Some think that continued growth in inequality will continue to benefit society In this view economic growth is now hampered by public policies that overly limit the economic rewards to investment and effort In this view taxes and costly regulatory burdens to innovation investment and hard work need to be reduced Witness recent calls for lower top tax rates elimination of the Environmental Protection Agency and efforts to pass ldquoright to workrdquo laws
Others believe that increases in income inequality over the last thirty years are creating social harm sufficient to more than offset any benefits of additional economic growth Some go further providing evidence that current levels of inequality are actually reducing growth
We support the latter view that income inequality has crossed a threshold that threatens overall growth and that it is an issue of great importance In this section we present facts which establish the relative public ignorance about inequality discuss its actual damage to economic growth and provide some explanation of the cause-and-effect dynamics
perceived Actual and Desired Inequality
Inequality is an important issue if Americans believe it is an important issue In a study published in 2011 economists Michael Norton and Dan Ariely asked a random sample of 5522 Americans to rank three alternative distributions of wealth for a society3 The three distributions were as depicted in Figure 9 The first in 9a is the actual distribution of wealth in the US The richest 20 of American households hold 84 of total wealth and the poorest 20 of households hold 01 The third in 9c is a hypothetical distribution in which each fifth of the population has the same level of wealth This represents perfect equality The middle distribution 9b is a hypothetical intermediate wealth distribution There the richest 20 hold 36 of the wealth and the poorest 20 hold 11
Respondents to the online survey were asked to imagine that they might be a member of a given society but that their own place in the society would be determined by chance Which society would they rather inhabit They were provided an opportunity to choose from the three societies depicted in Figure 9 (without being told that 9a was the actual distribution of wealth in the US) Norton and Ariely discovered that for their respondents the least desirable alternative is the actual US distribution depicted in 9a The top choice for desired actual distribution was the intermediate distribution (9b) with 47 making it their first choice The equal distribution (9c) was next with 43 choosing it The actual US wealth distribution (9a) came last with only 10 choosing it
3 Wealth is different from income Also called net worth wealth is the value of all assets less the value of all debts owed Wealth is more concentrated than is income among the richest households
Top 20
Boom 20
Middle 204th 20
2nd 2084
1184
0201
Fig 9a US wealth distribution
Top 20
Boom 20
Middle 204th 20
2nd 20
2020
20
2020
Fig 9c Equal wealth distribution
Top 20
Boom 20
Middle 204th 20
2nd 2018
11 15
21
36 18
Fig 9b Intermediate wealth distribution
Widening economic inequality in minnesota
Growth amp Justice 10
Norton and Ariely then asked two further questions The first asked respondents to specify the level of wealth inequality that they believe exists in the US The second asked them to specify the level of wealth that they would like to see in the US Figure 10 taken from Norton and Arielyrsquos published study shows the results of these questions The first bar shows the actual US wealth distribution The second shows the average of respondentsrsquo estimates of the US wealth distribution The third shows the average of respondentsrsquo ideal US wealth distribution
Two main lessons may be drawn from these results The first is that people appear to underestimate dramatically the level of wealth inequality in the US economy The average person believes that the richest quintile holds about 57 of wealth when the actual share is 84 Second people wish that wealth inequality were even lower than they believe it to be The average person feels that the richest quintile should hold about 32 of wealth
Norton and Ariely confirm our belief that most favor some inequality Most would prefer less inequality than they think exists and would prefer far less than actually exists Our point is that most Americans think current inequality is excessive and likely would feel stronger about that if they knew the actual facts
Inequality and Growth
As we have posited earlier a certain amount of inequality is inevitable and most economists would agree that some is essential for healthy and vigorous economic growth As inequality increases though the marginal benefit to output from additional inequality logically declines Has inequality risen to a point where the marginal effects on output are actually negative That is is inequality now so high that recent widening has caused lower GDP than we would have had with the lower levels of inequality of the middle of the last century (a period of consistently high growth)
Ramaprasad Rajaram of the University of Georgia believes so In his 2010 PhD dissertation Poverty Income Inequality and Economic Growth in US Counties A Spatial Analysis he considers the effects of income inequality and poverty on economic growth He relates per capita income growth to poverty rates and overall income inequality (Gini coefficients) in 3072 US counties using data from the 1980 (1979 data) and 2000 (1999 data) US Census He assesses the relationship of poverty in 1979 to growth from 1979 to 1999 and finds that counties with lower poverty rates in 1979 grew on average significantly more quickly during the next 20 years He similarly found that counties with less overall income inequality in 1979 grew on average significantly more quickly than those with higher income inequality in 1979
He then went a step further looking at actual growth from 1979 to 1999 as a predictor of 1999 poverty and inequality measures He found that counties that grew more quickly from 1979 through 1999 had lower poverty rates and overall inequality at the end of the period Finally he split the counties into ldquorichrdquo and ldquopoorrdquo to see whether the effects differed He found little difference
Actual
Estimated
Preferred
Top 20 Second 20 Fourth 20 Bottom 20Middle 20
0 10 20 30 40 50 60 70 80 90 100
Percent of wealth owned
Fig 10 Actual estimated and preferred US wealth distributions
Widening economic inequality in minnesota
Growth amp Justice 11
His results tell a compelling story Those areas with less inequality and poverty today all else equal can expect higher future growth in future per capita income In the future those that actually experienced the highest growth are likely to have lower poverty and overall inequality In summary those that grow quickly are likely to be the ones that start with lower inequality The resulting high growth in turn has a dampening effect on future increases in inequality This is a virtuous cycle in which if all share in growing prosperity prosperity grows more rapidly
Inequality and Demand for Goods and Services
US consumers have driven the growth of the US economy at least since World War II Personal consumption has been about 70 of Gross Domestic Product (GDP) Through at least 1979 this consumption was driven by a broad and growing middle class and growing income widely shared across the income distribution Continued long-term growth likely will continue to depend on growing consumption If personal consumption is to remain at 70 of GDP it must grow at the same rate as GDP
As household income increases consumption increases along with it This has the effect of increasing the demand for the goods and services that give rise to the additional income Poor households spend nearly all their increases in income while middle income households spend most of the increases Those at the top spend a smaller proportion of additional income
When incomes at the top are growing much more quickly than those in the middle and the bottom of the distribution consumption naturally declines as a share of GDP In 2010 a year of weak economic recovery 93 of the growth in income went to the top 1 of households As a result this apportionment of additional personal income generated less additional demand for goods and services This perverse braking effect might be viewed as a downward spiral a vicious circle Slowing economic growth leads to increased inequality which then leads to even slower growthIn summary most Americans wish for less inequality than we have even while they underestimate the degree of current inequality Higher inequality inevitably produces lower growth because the wealthy spend less of their income than those less wealthy As income goes increasingly to the wealthy demand for goods and services is less than optimum Growth is constrained as inequality increases beyond a level that encourages growth
v causes oF InequalIty
Why exactly have poverty rates and income inequality increased so dramatically since 1980 Was it unavoidable What of the future How might we prevent further widening or even reverse the trend
Some observers explain our rising inequality as the inevitable result of advancing technology with its attendant rewards for the skilled workers who are able to perform high-tech jobs Others explain it as the inevitable result of increasing globalization in the world economy These two factors are certainly implicated Both have helped to increase global output and global incomes but both have also imposed costs on some people in some places Both have also shoveled generous rewards to a favored few Those bearing the highest costs have been the middle and lower classes in the developed world Those favored include those with capital and those who are highly educated in fields that allow them to take full advantage of globalization and technological advances
Globalization and technological advances generally benefit the same segments of society Globalization has made both production and capital more mobile without equivalent increases in labor mobility Businesses now face fewer legal and institutional impediments to movement of capital goods and services in and out of countries
Advances in technology have reduced the costs of moving goods and services from one country to another For example some accounting firms have American clientsrsquo tax returns prepared in India That is possible only because of recent changes in communications technology and institutions that allow exports of the services from India and import of those services to the US without expensive trade restrictions Here the shareholders of the accounting firm gain through lower costs while less work is available for American tax preparers Further downward pressure is exerted on the wages of the remaining tax preparers
Endless examples of ldquooutsourcingrdquo job loss and downward pressure on working-class Americans have become the staple of economic conversation for three decades Taken together and across the economy these examples create
Widening economic inequality in minnesota
Growth amp Justice 12
conditions that have increased inequality and poverty in the US Was this inevitable Is it necessary that poverty and inequality must increase as a result of technological changes and globalization
We do not believe so Public policies could have largely or completely mitigated the effects of technological changes and globalization Further we believe that government policies enacted over the last thirty years have not only failed to mitigate the effects but have independently increased poverty and inequality In short we are hopeful about the possibility of policy action mitigating inequality And we believe past and future increases in inequality and poverty are not inescapable and can be reversed
First let us look at the experiences of some other industrialized democratic countries They have faced the same forces of globalization and technological change Yet inequality and poverty in many of those countries has not changed appreciably
As noted earlier much of the growth in incomes in the US has been captured by those with incomes in the top 1 Figure 11 shows the path of top 1 income shares for the US Japan Australia and France all from 1913 to 20094 The message from this international comparison is that rising inequality is neither inevitable nor is it necessary for an economy to perform well Alone among the four rich countries shown the US has seen a dramatic rise in the top income share
Overall inequality as measured by the Gini coefficient (Figure 12) similarly demonstrates that the US is more unequal than other high income countries France Canada and Norway represent the other developed countries and have substantially lower inequality than the US In fact these countries have Gini coefficients not seen in the US since the 1970s Note that these are estimates made by The World Bank and differ somewhat from those for the US as estimated by the US Census Bureau
4 These data are different from those in Figure 3 in that income from capital gains is excluded in Figure 11 The source database includes information on capital gains income for the US but not for the other countries
0
5
10
15
20
25
1915
1920
1935
1930
1925
1945
1955
1980
1985
1950
1940
2000
1960
1965
1970
1975
1995
1990
2005
2010
Australia - Atkinson amp Leigh (2007)Japan - Moriquchi amp Saez (2010)
United States - Pikey amp Saez (2007) France - Pikey (2001 2007) Landais (2007)
Fig 11 Top 1 income shares for the United States Australia France amp Japan 1913 - 20011
Year
Inco
me
shar
e
source World Top Incomes Database
00
010
020
030
040
050
060
Norway Canada France India UnitedStates
China Brazil
0415
055
0408
03270368
0326
0258
Fig 12 Gini coefficients for selected countries
source The World Bank
Widening economic inequality in minnesota
Growth amp Justice 13
Figure 13 from the Organization for Economic Cooperation and Development (OECD) shows poverty rates in the mid-2000rsquos for selected OECD countries We stand near the top In the figure each bar represents the percentage of a countryrsquos population living in households with less than 50 of that countryrsquos median income According to this measure the US has the third-highest poverty rate in the OECD at 173 Americarsquos 2010 median income was $49445 We can say then that 173 of all US households had income that year below $24722 Note that the poverty rate as measured by the OECD is higher than reported by the US Census Bureau That agency defines poverty differently than the OECD
Other high income countries have faced globalization and technological changes without a rapid proportional rise in incomes at the top dramatic increases in overall inequality or similar levels of poverty Our neighbor Canada reports median family income of $69860 in 2010 While the definition used by Statistics Canada may differ from that of our Census Bureau it seems reasonable to conclude that Canadian household income is at least comparable to that in the US Canada now has lower unemployment and growth rates similar to ours Canada is doing at least as well as we are economically without our high levels of inequality and poverty
We conclude that recent and future increases in inequality are not inevitable and that we could reduce inequality in the future
vI a proposal For a new polIcy evaluatIon tool the ldquoeconomIc InequalIty Impact assessmentrdquo
In the late 1960s as awareness spread about the threat posed by pollution of all kinds to property and especially to human health policymakers in the United States began to adopt laws appropriations and regulations designed to reduce or remediate environmental damages
Many of the laws and regulations simply required reductions in pollutants and emissions or banned the use of the worst toxins such as DDT But one of the most important provisions was the introduction of requirements to estimate in advance the environmental impact from pending development projects or policies The Environmental Impact Statement or EIS became a useful and accepted policy development tool
We believe growing inequality represents a similar threat to our societyrsquos long-term well-being A further concentration of income and wealth in fewer and fewer households and the accompanying rise in poverty and the decline of middle-income economic stability compels policymakers at all levels to conduct a more systematic assessment of economic inequality impact before they make decisions that could further exacerbate inequality We propose that all economically significant legislation and new state regulations in Minnesota should be subjected to an analysis that measures the policyrsquos impact on economic inequality
The experience with environmental impact measurement is encouraging In a 1994 paper noted environmental law professor William H Rodgers Jr included the EIS in his list of the seven most influential or effective US
0
5
10
15
20
25
Denmark Sweden OECD UnitedKingdom
Canada UnitedStates
Mexico
173
21
114111 113
84
61
Fig 13 Poverty rates at 50 or less of median income for selected OECD countries
source Organization for Economic Cooperation and Development (OECD)
Widening economic inequality in minnesota
Growth amp Justice 14
environmental laws The EIS was part of the National Environmental Policy Act of 1969 (NEPA) and requires federal agencies to prepare an EIS to accompany any agency action that has a significant effect on the human environment Rodgers noted that environmental impact statements were ldquoreplicated in rapid fashion throughout the United States and around the worldrdquo and have become ldquothe most frequently copied and most frequently cited of all US domestic environmental lawsrdquo 5
Legislators and other policymakers in Minnesota could develop an Economic Inequality Impact Assessment (EIIA) for all major policies that are likely to have a measurable effect on income or wealth distribution (This specific title and acronym used hereafter is the creation of the authors of this report we hope to popularize the concept but are not adamant about how it is labeled or the specifics of its implementation)
Minnesota already has a reputation among the states for distinctive high-quality economic measurement tools The Price of Government measurement and the biennial Tax Incidence Study both launched in the 1990s and updated regularly provide uniquely detailed perspective on the overall size of state-and-local government as a percent of income (Price of Government) and how the taxes for that public investment is paid by economic strata (Tax Incidence Study) These tools have greatly enabled quantitative analysis of relative fairness and equality
Legislative and executive branch staffers are familiar with the concept of projecting the costs and benefits of potential policy When legislators advance bills that directly or indirectly create a cost for state or local governments they must seek fiscal notes which calculate the costs of the proposed legislation
Support for measuring projected inequality particularly as it relates to poverty has come in recent years from a growing national coalition of community and philanthropic efforts and Minnesota has been a leader in this effort
The Washington DC based Center for Law and Social Policy (CLASP) published a summary of federal and state efforts that align with a CLASP initiative for Poverty Impact Projections (PIP) The PIP concept as described in that 2011 CLASP report could be easily applied to a broader Economic Inequality Impact Assessment
As stated in the CLASP study ldquoGetting a clearer prognosis of the potential impact of a pending policy is valuable not just for elected officials who need to vote on bills but also for other policymakers and community stakeholders who need to make planning and implementation decisionsrdquo 6
Minnesota is one of the few states highlighted in the CLASP report as having done the most to advance the concept of poverty impact projections noting that just such a mechanism was a key recommendation of the Legislative Commission to End Poverty in Minnesota by 2020 Along with many other local groups particularly the nonprofit organization A Minnesota Without Poverty we encourage efforts toward establishing a poverty impact projection but submit that a broader top-to-bottom evaluation of policy in the form of an Economic Inequality Impact Assessment would be even more valuable
5 Rodgers Jr W H (1994) The Seven Statutory Wonders of US Environmental Law Origins and Morphology Loyola of Los Angeles Law Review 1009-1022 Available at httpdigital commonslmuedullrvol27iss315
6 Levin-Epstein J amp Sanes M (August 2011) At the Forefront Poverty Impact Projections Washington DC CLASP
Widening economic inequality in minnesota
Growth amp Justice 15 2324 University Ave W Suite 120 A Saint Paul MN 55114 wwwgrowthandjusticeorg
Smart Investments Practical Solutions Broader Prosperity
We do not offer here a precise formula for an EIIA But our conversations and interviews with state tax and budget experts suggest the following in regard to practical design and implementation of an EIIA for Minnesota
bull The EIIA could be housed in the Minnesota Management and Budget agency within the office of the State Economist The agency commissioner could appoint an advisory group of economic experts to assist in designing an EIIA process and methodology
bull An EIIA for tax bills could begin in the Revenue Department using more detailed projections about the impact of various tax proposals on the Suits index and other measurements of tax incidence
bull An EIIA could initially calculate the estimated direction of the effect on inequality measures rather than predict specific numerical outcomes An EIIA likely would need to have a de minimis threshold as do fiscal notes in the state budget process so that not every bill or proposal coming before a committee would need to be assessed
bull Scores of specific policy proposals aimed at reducing inequalitymdashinvestment in early childhood education higher minimum wages elimination of high-income tax cuts and breaksmdashare proposed every year by national and state policymakers In many cases the effects on reducing inequality are obvious intuitively But how much more valuable would it be for policymakers to have more precise information about the relative impacts of such proposals
Better economic information will help policymakers navigate toward a more equitable and sustainable economy and society Establishment of an Economic Inequality Impact Assessment would be a valuable addition to the policymaking toolbox
about the authors
Jay Coggins is an associate professor with the Department of Applied Economics at the University of Minnesota and a policy fellow for Growth amp Justice
thomas legg is a senior lecturer at the University of Minnesotarsquos Carlson School of Management and a policy fellow for Growth amp Justice
dane smith is the president of Growth amp Justice
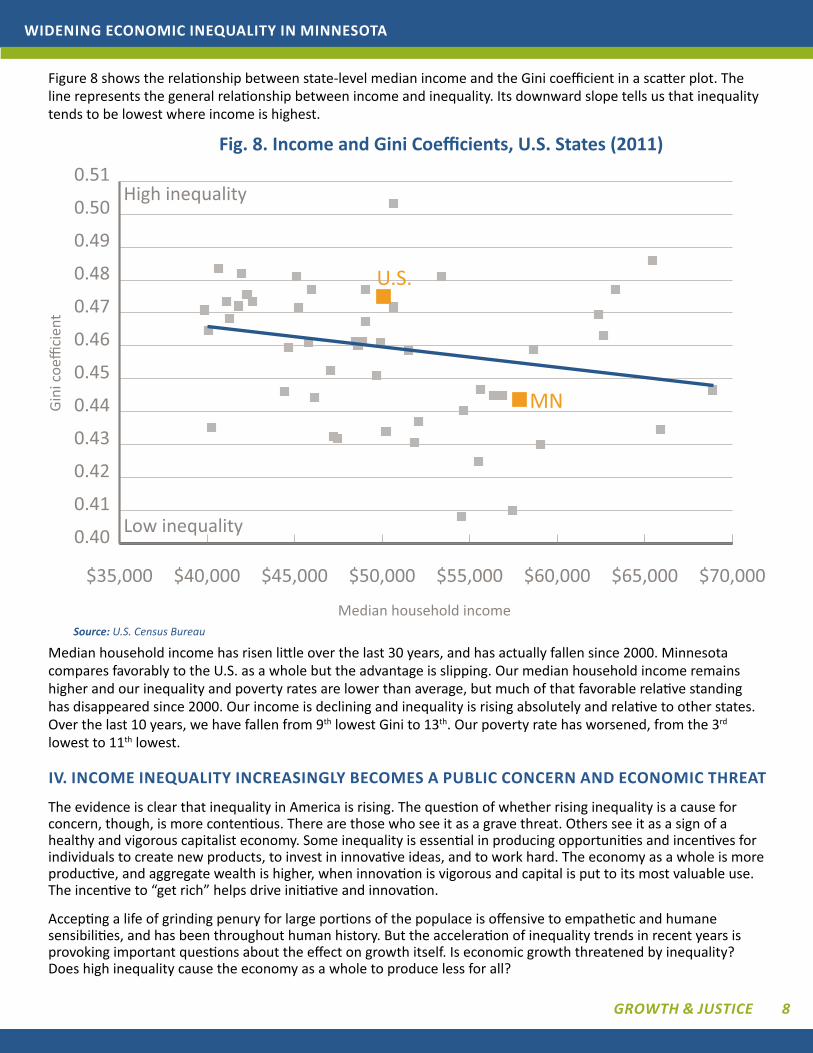
Widening economic inequality in minnesota
Growth amp Justice 8
Figure 8 shows the relationship between state-level median income and the Gini coefficient in a scatter plot The line represents the general relationship between income and inequality Its downward slope tells us that inequality tends to be lowest where income is highest
Median household income has risen little over the last 30 years and has actually fallen since 2000 Minnesota compares favorably to the US as a whole but the advantage is slipping Our median household income remains higher and our inequality and poverty rates are lower than average but much of that favorable relative standing has disappeared since 2000 Our income is declining and inequality is rising absolutely and relative to other states Over the last 10 years we have fallen from 9th lowest Gini to 13th Our poverty rate has worsened from the 3rd lowest to 11th lowest
Iv Income InequalIty IncreasIngly becomes a publIc concern and economIc threat
The evidence is clear that inequality in America is rising The question of whether rising inequality is a cause for concern though is more contentious There are those who see it as a grave threat Others see it as a sign of a healthy and vigorous capitalist economy Some inequality is essential in producing opportunities and incentives for individuals to create new products to invest in innovative ideas and to work hard The economy as a whole is more productive and aggregate wealth is higher when innovation is vigorous and capital is put to its most valuable use The incentive to ldquoget richrdquo helps drive initiative and innovation
Accepting a life of grinding penury for large portions of the populace is offensive to empathetic and humane sensibilities and has been throughout human history But the acceleration of inequality trends in recent years is provoking important questions about the effect on growth itself Is economic growth threatened by inequality Does high inequality cause the economy as a whole to produce less for all
Median household income
Gini
coe
ffici
ent
Fig 8 Income and Gini Coefficients US States (2011)
source US Census Bureau
$35000 $40000 $45000 $50000 $55000 $60000 $65000 $70000
040
041
042
043
044
045
046
047
048
049
050
051
MN
US
High inequality
Low inequality
Widening economic inequality in minnesota
Growth amp Justice 9
These crucial questions occupy us in this section In particular we ask whether there is a level of inequality above which the positive incentives to contribute to economic performance are more than offset by the social costs And if so have we yet reached or exceeded that level
Some think that continued growth in inequality will continue to benefit society In this view economic growth is now hampered by public policies that overly limit the economic rewards to investment and effort In this view taxes and costly regulatory burdens to innovation investment and hard work need to be reduced Witness recent calls for lower top tax rates elimination of the Environmental Protection Agency and efforts to pass ldquoright to workrdquo laws
Others believe that increases in income inequality over the last thirty years are creating social harm sufficient to more than offset any benefits of additional economic growth Some go further providing evidence that current levels of inequality are actually reducing growth
We support the latter view that income inequality has crossed a threshold that threatens overall growth and that it is an issue of great importance In this section we present facts which establish the relative public ignorance about inequality discuss its actual damage to economic growth and provide some explanation of the cause-and-effect dynamics
perceived Actual and Desired Inequality
Inequality is an important issue if Americans believe it is an important issue In a study published in 2011 economists Michael Norton and Dan Ariely asked a random sample of 5522 Americans to rank three alternative distributions of wealth for a society3 The three distributions were as depicted in Figure 9 The first in 9a is the actual distribution of wealth in the US The richest 20 of American households hold 84 of total wealth and the poorest 20 of households hold 01 The third in 9c is a hypothetical distribution in which each fifth of the population has the same level of wealth This represents perfect equality The middle distribution 9b is a hypothetical intermediate wealth distribution There the richest 20 hold 36 of the wealth and the poorest 20 hold 11
Respondents to the online survey were asked to imagine that they might be a member of a given society but that their own place in the society would be determined by chance Which society would they rather inhabit They were provided an opportunity to choose from the three societies depicted in Figure 9 (without being told that 9a was the actual distribution of wealth in the US) Norton and Ariely discovered that for their respondents the least desirable alternative is the actual US distribution depicted in 9a The top choice for desired actual distribution was the intermediate distribution (9b) with 47 making it their first choice The equal distribution (9c) was next with 43 choosing it The actual US wealth distribution (9a) came last with only 10 choosing it
3 Wealth is different from income Also called net worth wealth is the value of all assets less the value of all debts owed Wealth is more concentrated than is income among the richest households
Top 20
Boom 20
Middle 204th 20
2nd 2084
1184
0201
Fig 9a US wealth distribution
Top 20
Boom 20
Middle 204th 20
2nd 20
2020
20
2020
Fig 9c Equal wealth distribution
Top 20
Boom 20
Middle 204th 20
2nd 2018
11 15
21
36 18
Fig 9b Intermediate wealth distribution
Widening economic inequality in minnesota
Growth amp Justice 10
Norton and Ariely then asked two further questions The first asked respondents to specify the level of wealth inequality that they believe exists in the US The second asked them to specify the level of wealth that they would like to see in the US Figure 10 taken from Norton and Arielyrsquos published study shows the results of these questions The first bar shows the actual US wealth distribution The second shows the average of respondentsrsquo estimates of the US wealth distribution The third shows the average of respondentsrsquo ideal US wealth distribution
Two main lessons may be drawn from these results The first is that people appear to underestimate dramatically the level of wealth inequality in the US economy The average person believes that the richest quintile holds about 57 of wealth when the actual share is 84 Second people wish that wealth inequality were even lower than they believe it to be The average person feels that the richest quintile should hold about 32 of wealth
Norton and Ariely confirm our belief that most favor some inequality Most would prefer less inequality than they think exists and would prefer far less than actually exists Our point is that most Americans think current inequality is excessive and likely would feel stronger about that if they knew the actual facts
Inequality and Growth
As we have posited earlier a certain amount of inequality is inevitable and most economists would agree that some is essential for healthy and vigorous economic growth As inequality increases though the marginal benefit to output from additional inequality logically declines Has inequality risen to a point where the marginal effects on output are actually negative That is is inequality now so high that recent widening has caused lower GDP than we would have had with the lower levels of inequality of the middle of the last century (a period of consistently high growth)
Ramaprasad Rajaram of the University of Georgia believes so In his 2010 PhD dissertation Poverty Income Inequality and Economic Growth in US Counties A Spatial Analysis he considers the effects of income inequality and poverty on economic growth He relates per capita income growth to poverty rates and overall income inequality (Gini coefficients) in 3072 US counties using data from the 1980 (1979 data) and 2000 (1999 data) US Census He assesses the relationship of poverty in 1979 to growth from 1979 to 1999 and finds that counties with lower poverty rates in 1979 grew on average significantly more quickly during the next 20 years He similarly found that counties with less overall income inequality in 1979 grew on average significantly more quickly than those with higher income inequality in 1979
He then went a step further looking at actual growth from 1979 to 1999 as a predictor of 1999 poverty and inequality measures He found that counties that grew more quickly from 1979 through 1999 had lower poverty rates and overall inequality at the end of the period Finally he split the counties into ldquorichrdquo and ldquopoorrdquo to see whether the effects differed He found little difference
Actual
Estimated
Preferred
Top 20 Second 20 Fourth 20 Bottom 20Middle 20
0 10 20 30 40 50 60 70 80 90 100
Percent of wealth owned
Fig 10 Actual estimated and preferred US wealth distributions
Widening economic inequality in minnesota
Growth amp Justice 11
His results tell a compelling story Those areas with less inequality and poverty today all else equal can expect higher future growth in future per capita income In the future those that actually experienced the highest growth are likely to have lower poverty and overall inequality In summary those that grow quickly are likely to be the ones that start with lower inequality The resulting high growth in turn has a dampening effect on future increases in inequality This is a virtuous cycle in which if all share in growing prosperity prosperity grows more rapidly
Inequality and Demand for Goods and Services
US consumers have driven the growth of the US economy at least since World War II Personal consumption has been about 70 of Gross Domestic Product (GDP) Through at least 1979 this consumption was driven by a broad and growing middle class and growing income widely shared across the income distribution Continued long-term growth likely will continue to depend on growing consumption If personal consumption is to remain at 70 of GDP it must grow at the same rate as GDP
As household income increases consumption increases along with it This has the effect of increasing the demand for the goods and services that give rise to the additional income Poor households spend nearly all their increases in income while middle income households spend most of the increases Those at the top spend a smaller proportion of additional income
When incomes at the top are growing much more quickly than those in the middle and the bottom of the distribution consumption naturally declines as a share of GDP In 2010 a year of weak economic recovery 93 of the growth in income went to the top 1 of households As a result this apportionment of additional personal income generated less additional demand for goods and services This perverse braking effect might be viewed as a downward spiral a vicious circle Slowing economic growth leads to increased inequality which then leads to even slower growthIn summary most Americans wish for less inequality than we have even while they underestimate the degree of current inequality Higher inequality inevitably produces lower growth because the wealthy spend less of their income than those less wealthy As income goes increasingly to the wealthy demand for goods and services is less than optimum Growth is constrained as inequality increases beyond a level that encourages growth
v causes oF InequalIty
Why exactly have poverty rates and income inequality increased so dramatically since 1980 Was it unavoidable What of the future How might we prevent further widening or even reverse the trend
Some observers explain our rising inequality as the inevitable result of advancing technology with its attendant rewards for the skilled workers who are able to perform high-tech jobs Others explain it as the inevitable result of increasing globalization in the world economy These two factors are certainly implicated Both have helped to increase global output and global incomes but both have also imposed costs on some people in some places Both have also shoveled generous rewards to a favored few Those bearing the highest costs have been the middle and lower classes in the developed world Those favored include those with capital and those who are highly educated in fields that allow them to take full advantage of globalization and technological advances
Globalization and technological advances generally benefit the same segments of society Globalization has made both production and capital more mobile without equivalent increases in labor mobility Businesses now face fewer legal and institutional impediments to movement of capital goods and services in and out of countries
Advances in technology have reduced the costs of moving goods and services from one country to another For example some accounting firms have American clientsrsquo tax returns prepared in India That is possible only because of recent changes in communications technology and institutions that allow exports of the services from India and import of those services to the US without expensive trade restrictions Here the shareholders of the accounting firm gain through lower costs while less work is available for American tax preparers Further downward pressure is exerted on the wages of the remaining tax preparers
Endless examples of ldquooutsourcingrdquo job loss and downward pressure on working-class Americans have become the staple of economic conversation for three decades Taken together and across the economy these examples create
Widening economic inequality in minnesota
Growth amp Justice 12
conditions that have increased inequality and poverty in the US Was this inevitable Is it necessary that poverty and inequality must increase as a result of technological changes and globalization
We do not believe so Public policies could have largely or completely mitigated the effects of technological changes and globalization Further we believe that government policies enacted over the last thirty years have not only failed to mitigate the effects but have independently increased poverty and inequality In short we are hopeful about the possibility of policy action mitigating inequality And we believe past and future increases in inequality and poverty are not inescapable and can be reversed
First let us look at the experiences of some other industrialized democratic countries They have faced the same forces of globalization and technological change Yet inequality and poverty in many of those countries has not changed appreciably
As noted earlier much of the growth in incomes in the US has been captured by those with incomes in the top 1 Figure 11 shows the path of top 1 income shares for the US Japan Australia and France all from 1913 to 20094 The message from this international comparison is that rising inequality is neither inevitable nor is it necessary for an economy to perform well Alone among the four rich countries shown the US has seen a dramatic rise in the top income share
Overall inequality as measured by the Gini coefficient (Figure 12) similarly demonstrates that the US is more unequal than other high income countries France Canada and Norway represent the other developed countries and have substantially lower inequality than the US In fact these countries have Gini coefficients not seen in the US since the 1970s Note that these are estimates made by The World Bank and differ somewhat from those for the US as estimated by the US Census Bureau
4 These data are different from those in Figure 3 in that income from capital gains is excluded in Figure 11 The source database includes information on capital gains income for the US but not for the other countries
0
5
10
15
20
25
1915
1920
1935
1930
1925
1945
1955
1980
1985
1950
1940
2000
1960
1965
1970
1975
1995
1990
2005
2010
Australia - Atkinson amp Leigh (2007)Japan - Moriquchi amp Saez (2010)
United States - Pikey amp Saez (2007) France - Pikey (2001 2007) Landais (2007)
Fig 11 Top 1 income shares for the United States Australia France amp Japan 1913 - 20011
Year
Inco
me
shar
e
source World Top Incomes Database
00
010
020
030
040
050
060
Norway Canada France India UnitedStates
China Brazil
0415
055
0408
03270368
0326
0258
Fig 12 Gini coefficients for selected countries
source The World Bank
Widening economic inequality in minnesota
Growth amp Justice 13
Figure 13 from the Organization for Economic Cooperation and Development (OECD) shows poverty rates in the mid-2000rsquos for selected OECD countries We stand near the top In the figure each bar represents the percentage of a countryrsquos population living in households with less than 50 of that countryrsquos median income According to this measure the US has the third-highest poverty rate in the OECD at 173 Americarsquos 2010 median income was $49445 We can say then that 173 of all US households had income that year below $24722 Note that the poverty rate as measured by the OECD is higher than reported by the US Census Bureau That agency defines poverty differently than the OECD
Other high income countries have faced globalization and technological changes without a rapid proportional rise in incomes at the top dramatic increases in overall inequality or similar levels of poverty Our neighbor Canada reports median family income of $69860 in 2010 While the definition used by Statistics Canada may differ from that of our Census Bureau it seems reasonable to conclude that Canadian household income is at least comparable to that in the US Canada now has lower unemployment and growth rates similar to ours Canada is doing at least as well as we are economically without our high levels of inequality and poverty
We conclude that recent and future increases in inequality are not inevitable and that we could reduce inequality in the future
vI a proposal For a new polIcy evaluatIon tool the ldquoeconomIc InequalIty Impact assessmentrdquo
In the late 1960s as awareness spread about the threat posed by pollution of all kinds to property and especially to human health policymakers in the United States began to adopt laws appropriations and regulations designed to reduce or remediate environmental damages
Many of the laws and regulations simply required reductions in pollutants and emissions or banned the use of the worst toxins such as DDT But one of the most important provisions was the introduction of requirements to estimate in advance the environmental impact from pending development projects or policies The Environmental Impact Statement or EIS became a useful and accepted policy development tool
We believe growing inequality represents a similar threat to our societyrsquos long-term well-being A further concentration of income and wealth in fewer and fewer households and the accompanying rise in poverty and the decline of middle-income economic stability compels policymakers at all levels to conduct a more systematic assessment of economic inequality impact before they make decisions that could further exacerbate inequality We propose that all economically significant legislation and new state regulations in Minnesota should be subjected to an analysis that measures the policyrsquos impact on economic inequality
The experience with environmental impact measurement is encouraging In a 1994 paper noted environmental law professor William H Rodgers Jr included the EIS in his list of the seven most influential or effective US
0
5
10
15
20
25
Denmark Sweden OECD UnitedKingdom
Canada UnitedStates
Mexico
173
21
114111 113
84
61
Fig 13 Poverty rates at 50 or less of median income for selected OECD countries
source Organization for Economic Cooperation and Development (OECD)
Widening economic inequality in minnesota
Growth amp Justice 14
environmental laws The EIS was part of the National Environmental Policy Act of 1969 (NEPA) and requires federal agencies to prepare an EIS to accompany any agency action that has a significant effect on the human environment Rodgers noted that environmental impact statements were ldquoreplicated in rapid fashion throughout the United States and around the worldrdquo and have become ldquothe most frequently copied and most frequently cited of all US domestic environmental lawsrdquo 5
Legislators and other policymakers in Minnesota could develop an Economic Inequality Impact Assessment (EIIA) for all major policies that are likely to have a measurable effect on income or wealth distribution (This specific title and acronym used hereafter is the creation of the authors of this report we hope to popularize the concept but are not adamant about how it is labeled or the specifics of its implementation)
Minnesota already has a reputation among the states for distinctive high-quality economic measurement tools The Price of Government measurement and the biennial Tax Incidence Study both launched in the 1990s and updated regularly provide uniquely detailed perspective on the overall size of state-and-local government as a percent of income (Price of Government) and how the taxes for that public investment is paid by economic strata (Tax Incidence Study) These tools have greatly enabled quantitative analysis of relative fairness and equality
Legislative and executive branch staffers are familiar with the concept of projecting the costs and benefits of potential policy When legislators advance bills that directly or indirectly create a cost for state or local governments they must seek fiscal notes which calculate the costs of the proposed legislation
Support for measuring projected inequality particularly as it relates to poverty has come in recent years from a growing national coalition of community and philanthropic efforts and Minnesota has been a leader in this effort
The Washington DC based Center for Law and Social Policy (CLASP) published a summary of federal and state efforts that align with a CLASP initiative for Poverty Impact Projections (PIP) The PIP concept as described in that 2011 CLASP report could be easily applied to a broader Economic Inequality Impact Assessment
As stated in the CLASP study ldquoGetting a clearer prognosis of the potential impact of a pending policy is valuable not just for elected officials who need to vote on bills but also for other policymakers and community stakeholders who need to make planning and implementation decisionsrdquo 6
Minnesota is one of the few states highlighted in the CLASP report as having done the most to advance the concept of poverty impact projections noting that just such a mechanism was a key recommendation of the Legislative Commission to End Poverty in Minnesota by 2020 Along with many other local groups particularly the nonprofit organization A Minnesota Without Poverty we encourage efforts toward establishing a poverty impact projection but submit that a broader top-to-bottom evaluation of policy in the form of an Economic Inequality Impact Assessment would be even more valuable
5 Rodgers Jr W H (1994) The Seven Statutory Wonders of US Environmental Law Origins and Morphology Loyola of Los Angeles Law Review 1009-1022 Available at httpdigital commonslmuedullrvol27iss315
6 Levin-Epstein J amp Sanes M (August 2011) At the Forefront Poverty Impact Projections Washington DC CLASP
Widening economic inequality in minnesota
Growth amp Justice 15 2324 University Ave W Suite 120 A Saint Paul MN 55114 wwwgrowthandjusticeorg
Smart Investments Practical Solutions Broader Prosperity
We do not offer here a precise formula for an EIIA But our conversations and interviews with state tax and budget experts suggest the following in regard to practical design and implementation of an EIIA for Minnesota
bull The EIIA could be housed in the Minnesota Management and Budget agency within the office of the State Economist The agency commissioner could appoint an advisory group of economic experts to assist in designing an EIIA process and methodology
bull An EIIA for tax bills could begin in the Revenue Department using more detailed projections about the impact of various tax proposals on the Suits index and other measurements of tax incidence
bull An EIIA could initially calculate the estimated direction of the effect on inequality measures rather than predict specific numerical outcomes An EIIA likely would need to have a de minimis threshold as do fiscal notes in the state budget process so that not every bill or proposal coming before a committee would need to be assessed
bull Scores of specific policy proposals aimed at reducing inequalitymdashinvestment in early childhood education higher minimum wages elimination of high-income tax cuts and breaksmdashare proposed every year by national and state policymakers In many cases the effects on reducing inequality are obvious intuitively But how much more valuable would it be for policymakers to have more precise information about the relative impacts of such proposals
Better economic information will help policymakers navigate toward a more equitable and sustainable economy and society Establishment of an Economic Inequality Impact Assessment would be a valuable addition to the policymaking toolbox
about the authors
Jay Coggins is an associate professor with the Department of Applied Economics at the University of Minnesota and a policy fellow for Growth amp Justice
thomas legg is a senior lecturer at the University of Minnesotarsquos Carlson School of Management and a policy fellow for Growth amp Justice
dane smith is the president of Growth amp Justice
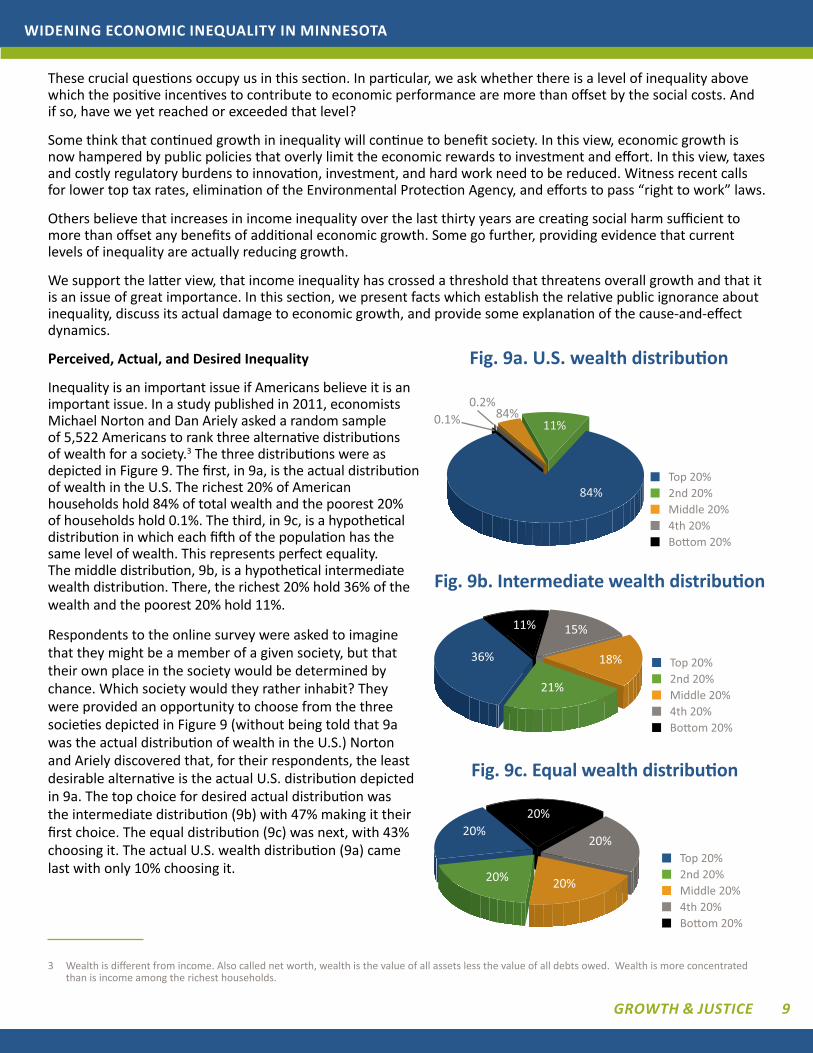
Widening economic inequality in minnesota
Growth amp Justice 9
These crucial questions occupy us in this section In particular we ask whether there is a level of inequality above which the positive incentives to contribute to economic performance are more than offset by the social costs And if so have we yet reached or exceeded that level
Some think that continued growth in inequality will continue to benefit society In this view economic growth is now hampered by public policies that overly limit the economic rewards to investment and effort In this view taxes and costly regulatory burdens to innovation investment and hard work need to be reduced Witness recent calls for lower top tax rates elimination of the Environmental Protection Agency and efforts to pass ldquoright to workrdquo laws
Others believe that increases in income inequality over the last thirty years are creating social harm sufficient to more than offset any benefits of additional economic growth Some go further providing evidence that current levels of inequality are actually reducing growth
We support the latter view that income inequality has crossed a threshold that threatens overall growth and that it is an issue of great importance In this section we present facts which establish the relative public ignorance about inequality discuss its actual damage to economic growth and provide some explanation of the cause-and-effect dynamics
perceived Actual and Desired Inequality
Inequality is an important issue if Americans believe it is an important issue In a study published in 2011 economists Michael Norton and Dan Ariely asked a random sample of 5522 Americans to rank three alternative distributions of wealth for a society3 The three distributions were as depicted in Figure 9 The first in 9a is the actual distribution of wealth in the US The richest 20 of American households hold 84 of total wealth and the poorest 20 of households hold 01 The third in 9c is a hypothetical distribution in which each fifth of the population has the same level of wealth This represents perfect equality The middle distribution 9b is a hypothetical intermediate wealth distribution There the richest 20 hold 36 of the wealth and the poorest 20 hold 11
Respondents to the online survey were asked to imagine that they might be a member of a given society but that their own place in the society would be determined by chance Which society would they rather inhabit They were provided an opportunity to choose from the three societies depicted in Figure 9 (without being told that 9a was the actual distribution of wealth in the US) Norton and Ariely discovered that for their respondents the least desirable alternative is the actual US distribution depicted in 9a The top choice for desired actual distribution was the intermediate distribution (9b) with 47 making it their first choice The equal distribution (9c) was next with 43 choosing it The actual US wealth distribution (9a) came last with only 10 choosing it
3 Wealth is different from income Also called net worth wealth is the value of all assets less the value of all debts owed Wealth is more concentrated than is income among the richest households
Top 20
Boom 20
Middle 204th 20
2nd 2084
1184
0201
Fig 9a US wealth distribution
Top 20
Boom 20
Middle 204th 20
2nd 20
2020
20
2020
Fig 9c Equal wealth distribution
Top 20
Boom 20
Middle 204th 20
2nd 2018
11 15
21
36 18
Fig 9b Intermediate wealth distribution
Widening economic inequality in minnesota
Growth amp Justice 10
Norton and Ariely then asked two further questions The first asked respondents to specify the level of wealth inequality that they believe exists in the US The second asked them to specify the level of wealth that they would like to see in the US Figure 10 taken from Norton and Arielyrsquos published study shows the results of these questions The first bar shows the actual US wealth distribution The second shows the average of respondentsrsquo estimates of the US wealth distribution The third shows the average of respondentsrsquo ideal US wealth distribution
Two main lessons may be drawn from these results The first is that people appear to underestimate dramatically the level of wealth inequality in the US economy The average person believes that the richest quintile holds about 57 of wealth when the actual share is 84 Second people wish that wealth inequality were even lower than they believe it to be The average person feels that the richest quintile should hold about 32 of wealth
Norton and Ariely confirm our belief that most favor some inequality Most would prefer less inequality than they think exists and would prefer far less than actually exists Our point is that most Americans think current inequality is excessive and likely would feel stronger about that if they knew the actual facts
Inequality and Growth
As we have posited earlier a certain amount of inequality is inevitable and most economists would agree that some is essential for healthy and vigorous economic growth As inequality increases though the marginal benefit to output from additional inequality logically declines Has inequality risen to a point where the marginal effects on output are actually negative That is is inequality now so high that recent widening has caused lower GDP than we would have had with the lower levels of inequality of the middle of the last century (a period of consistently high growth)
Ramaprasad Rajaram of the University of Georgia believes so In his 2010 PhD dissertation Poverty Income Inequality and Economic Growth in US Counties A Spatial Analysis he considers the effects of income inequality and poverty on economic growth He relates per capita income growth to poverty rates and overall income inequality (Gini coefficients) in 3072 US counties using data from the 1980 (1979 data) and 2000 (1999 data) US Census He assesses the relationship of poverty in 1979 to growth from 1979 to 1999 and finds that counties with lower poverty rates in 1979 grew on average significantly more quickly during the next 20 years He similarly found that counties with less overall income inequality in 1979 grew on average significantly more quickly than those with higher income inequality in 1979
He then went a step further looking at actual growth from 1979 to 1999 as a predictor of 1999 poverty and inequality measures He found that counties that grew more quickly from 1979 through 1999 had lower poverty rates and overall inequality at the end of the period Finally he split the counties into ldquorichrdquo and ldquopoorrdquo to see whether the effects differed He found little difference
Actual
Estimated
Preferred
Top 20 Second 20 Fourth 20 Bottom 20Middle 20
0 10 20 30 40 50 60 70 80 90 100
Percent of wealth owned
Fig 10 Actual estimated and preferred US wealth distributions
Widening economic inequality in minnesota
Growth amp Justice 11
His results tell a compelling story Those areas with less inequality and poverty today all else equal can expect higher future growth in future per capita income In the future those that actually experienced the highest growth are likely to have lower poverty and overall inequality In summary those that grow quickly are likely to be the ones that start with lower inequality The resulting high growth in turn has a dampening effect on future increases in inequality This is a virtuous cycle in which if all share in growing prosperity prosperity grows more rapidly
Inequality and Demand for Goods and Services
US consumers have driven the growth of the US economy at least since World War II Personal consumption has been about 70 of Gross Domestic Product (GDP) Through at least 1979 this consumption was driven by a broad and growing middle class and growing income widely shared across the income distribution Continued long-term growth likely will continue to depend on growing consumption If personal consumption is to remain at 70 of GDP it must grow at the same rate as GDP
As household income increases consumption increases along with it This has the effect of increasing the demand for the goods and services that give rise to the additional income Poor households spend nearly all their increases in income while middle income households spend most of the increases Those at the top spend a smaller proportion of additional income
When incomes at the top are growing much more quickly than those in the middle and the bottom of the distribution consumption naturally declines as a share of GDP In 2010 a year of weak economic recovery 93 of the growth in income went to the top 1 of households As a result this apportionment of additional personal income generated less additional demand for goods and services This perverse braking effect might be viewed as a downward spiral a vicious circle Slowing economic growth leads to increased inequality which then leads to even slower growthIn summary most Americans wish for less inequality than we have even while they underestimate the degree of current inequality Higher inequality inevitably produces lower growth because the wealthy spend less of their income than those less wealthy As income goes increasingly to the wealthy demand for goods and services is less than optimum Growth is constrained as inequality increases beyond a level that encourages growth
v causes oF InequalIty
Why exactly have poverty rates and income inequality increased so dramatically since 1980 Was it unavoidable What of the future How might we prevent further widening or even reverse the trend
Some observers explain our rising inequality as the inevitable result of advancing technology with its attendant rewards for the skilled workers who are able to perform high-tech jobs Others explain it as the inevitable result of increasing globalization in the world economy These two factors are certainly implicated Both have helped to increase global output and global incomes but both have also imposed costs on some people in some places Both have also shoveled generous rewards to a favored few Those bearing the highest costs have been the middle and lower classes in the developed world Those favored include those with capital and those who are highly educated in fields that allow them to take full advantage of globalization and technological advances
Globalization and technological advances generally benefit the same segments of society Globalization has made both production and capital more mobile without equivalent increases in labor mobility Businesses now face fewer legal and institutional impediments to movement of capital goods and services in and out of countries
Advances in technology have reduced the costs of moving goods and services from one country to another For example some accounting firms have American clientsrsquo tax returns prepared in India That is possible only because of recent changes in communications technology and institutions that allow exports of the services from India and import of those services to the US without expensive trade restrictions Here the shareholders of the accounting firm gain through lower costs while less work is available for American tax preparers Further downward pressure is exerted on the wages of the remaining tax preparers
Endless examples of ldquooutsourcingrdquo job loss and downward pressure on working-class Americans have become the staple of economic conversation for three decades Taken together and across the economy these examples create
Widening economic inequality in minnesota
Growth amp Justice 12
conditions that have increased inequality and poverty in the US Was this inevitable Is it necessary that poverty and inequality must increase as a result of technological changes and globalization
We do not believe so Public policies could have largely or completely mitigated the effects of technological changes and globalization Further we believe that government policies enacted over the last thirty years have not only failed to mitigate the effects but have independently increased poverty and inequality In short we are hopeful about the possibility of policy action mitigating inequality And we believe past and future increases in inequality and poverty are not inescapable and can be reversed
First let us look at the experiences of some other industrialized democratic countries They have faced the same forces of globalization and technological change Yet inequality and poverty in many of those countries has not changed appreciably
As noted earlier much of the growth in incomes in the US has been captured by those with incomes in the top 1 Figure 11 shows the path of top 1 income shares for the US Japan Australia and France all from 1913 to 20094 The message from this international comparison is that rising inequality is neither inevitable nor is it necessary for an economy to perform well Alone among the four rich countries shown the US has seen a dramatic rise in the top income share
Overall inequality as measured by the Gini coefficient (Figure 12) similarly demonstrates that the US is more unequal than other high income countries France Canada and Norway represent the other developed countries and have substantially lower inequality than the US In fact these countries have Gini coefficients not seen in the US since the 1970s Note that these are estimates made by The World Bank and differ somewhat from those for the US as estimated by the US Census Bureau
4 These data are different from those in Figure 3 in that income from capital gains is excluded in Figure 11 The source database includes information on capital gains income for the US but not for the other countries
0
5
10
15
20
25
1915
1920
1935
1930
1925
1945
1955
1980
1985
1950
1940
2000
1960
1965
1970
1975
1995
1990
2005
2010
Australia - Atkinson amp Leigh (2007)Japan - Moriquchi amp Saez (2010)
United States - Pikey amp Saez (2007) France - Pikey (2001 2007) Landais (2007)
Fig 11 Top 1 income shares for the United States Australia France amp Japan 1913 - 20011
Year
Inco
me
shar
e
source World Top Incomes Database
00
010
020
030
040
050
060
Norway Canada France India UnitedStates
China Brazil
0415
055
0408
03270368
0326
0258
Fig 12 Gini coefficients for selected countries
source The World Bank
Widening economic inequality in minnesota
Growth amp Justice 13
Figure 13 from the Organization for Economic Cooperation and Development (OECD) shows poverty rates in the mid-2000rsquos for selected OECD countries We stand near the top In the figure each bar represents the percentage of a countryrsquos population living in households with less than 50 of that countryrsquos median income According to this measure the US has the third-highest poverty rate in the OECD at 173 Americarsquos 2010 median income was $49445 We can say then that 173 of all US households had income that year below $24722 Note that the poverty rate as measured by the OECD is higher than reported by the US Census Bureau That agency defines poverty differently than the OECD
Other high income countries have faced globalization and technological changes without a rapid proportional rise in incomes at the top dramatic increases in overall inequality or similar levels of poverty Our neighbor Canada reports median family income of $69860 in 2010 While the definition used by Statistics Canada may differ from that of our Census Bureau it seems reasonable to conclude that Canadian household income is at least comparable to that in the US Canada now has lower unemployment and growth rates similar to ours Canada is doing at least as well as we are economically without our high levels of inequality and poverty
We conclude that recent and future increases in inequality are not inevitable and that we could reduce inequality in the future
vI a proposal For a new polIcy evaluatIon tool the ldquoeconomIc InequalIty Impact assessmentrdquo
In the late 1960s as awareness spread about the threat posed by pollution of all kinds to property and especially to human health policymakers in the United States began to adopt laws appropriations and regulations designed to reduce or remediate environmental damages
Many of the laws and regulations simply required reductions in pollutants and emissions or banned the use of the worst toxins such as DDT But one of the most important provisions was the introduction of requirements to estimate in advance the environmental impact from pending development projects or policies The Environmental Impact Statement or EIS became a useful and accepted policy development tool
We believe growing inequality represents a similar threat to our societyrsquos long-term well-being A further concentration of income and wealth in fewer and fewer households and the accompanying rise in poverty and the decline of middle-income economic stability compels policymakers at all levels to conduct a more systematic assessment of economic inequality impact before they make decisions that could further exacerbate inequality We propose that all economically significant legislation and new state regulations in Minnesota should be subjected to an analysis that measures the policyrsquos impact on economic inequality
The experience with environmental impact measurement is encouraging In a 1994 paper noted environmental law professor William H Rodgers Jr included the EIS in his list of the seven most influential or effective US
0
5
10
15
20
25
Denmark Sweden OECD UnitedKingdom
Canada UnitedStates
Mexico
173
21
114111 113
84
61
Fig 13 Poverty rates at 50 or less of median income for selected OECD countries
source Organization for Economic Cooperation and Development (OECD)
Widening economic inequality in minnesota
Growth amp Justice 14
environmental laws The EIS was part of the National Environmental Policy Act of 1969 (NEPA) and requires federal agencies to prepare an EIS to accompany any agency action that has a significant effect on the human environment Rodgers noted that environmental impact statements were ldquoreplicated in rapid fashion throughout the United States and around the worldrdquo and have become ldquothe most frequently copied and most frequently cited of all US domestic environmental lawsrdquo 5
Legislators and other policymakers in Minnesota could develop an Economic Inequality Impact Assessment (EIIA) for all major policies that are likely to have a measurable effect on income or wealth distribution (This specific title and acronym used hereafter is the creation of the authors of this report we hope to popularize the concept but are not adamant about how it is labeled or the specifics of its implementation)
Minnesota already has a reputation among the states for distinctive high-quality economic measurement tools The Price of Government measurement and the biennial Tax Incidence Study both launched in the 1990s and updated regularly provide uniquely detailed perspective on the overall size of state-and-local government as a percent of income (Price of Government) and how the taxes for that public investment is paid by economic strata (Tax Incidence Study) These tools have greatly enabled quantitative analysis of relative fairness and equality
Legislative and executive branch staffers are familiar with the concept of projecting the costs and benefits of potential policy When legislators advance bills that directly or indirectly create a cost for state or local governments they must seek fiscal notes which calculate the costs of the proposed legislation
Support for measuring projected inequality particularly as it relates to poverty has come in recent years from a growing national coalition of community and philanthropic efforts and Minnesota has been a leader in this effort
The Washington DC based Center for Law and Social Policy (CLASP) published a summary of federal and state efforts that align with a CLASP initiative for Poverty Impact Projections (PIP) The PIP concept as described in that 2011 CLASP report could be easily applied to a broader Economic Inequality Impact Assessment
As stated in the CLASP study ldquoGetting a clearer prognosis of the potential impact of a pending policy is valuable not just for elected officials who need to vote on bills but also for other policymakers and community stakeholders who need to make planning and implementation decisionsrdquo 6
Minnesota is one of the few states highlighted in the CLASP report as having done the most to advance the concept of poverty impact projections noting that just such a mechanism was a key recommendation of the Legislative Commission to End Poverty in Minnesota by 2020 Along with many other local groups particularly the nonprofit organization A Minnesota Without Poverty we encourage efforts toward establishing a poverty impact projection but submit that a broader top-to-bottom evaluation of policy in the form of an Economic Inequality Impact Assessment would be even more valuable
5 Rodgers Jr W H (1994) The Seven Statutory Wonders of US Environmental Law Origins and Morphology Loyola of Los Angeles Law Review 1009-1022 Available at httpdigital commonslmuedullrvol27iss315
6 Levin-Epstein J amp Sanes M (August 2011) At the Forefront Poverty Impact Projections Washington DC CLASP
Widening economic inequality in minnesota
Growth amp Justice 15 2324 University Ave W Suite 120 A Saint Paul MN 55114 wwwgrowthandjusticeorg
Smart Investments Practical Solutions Broader Prosperity
We do not offer here a precise formula for an EIIA But our conversations and interviews with state tax and budget experts suggest the following in regard to practical design and implementation of an EIIA for Minnesota
bull The EIIA could be housed in the Minnesota Management and Budget agency within the office of the State Economist The agency commissioner could appoint an advisory group of economic experts to assist in designing an EIIA process and methodology
bull An EIIA for tax bills could begin in the Revenue Department using more detailed projections about the impact of various tax proposals on the Suits index and other measurements of tax incidence
bull An EIIA could initially calculate the estimated direction of the effect on inequality measures rather than predict specific numerical outcomes An EIIA likely would need to have a de minimis threshold as do fiscal notes in the state budget process so that not every bill or proposal coming before a committee would need to be assessed
bull Scores of specific policy proposals aimed at reducing inequalitymdashinvestment in early childhood education higher minimum wages elimination of high-income tax cuts and breaksmdashare proposed every year by national and state policymakers In many cases the effects on reducing inequality are obvious intuitively But how much more valuable would it be for policymakers to have more precise information about the relative impacts of such proposals
Better economic information will help policymakers navigate toward a more equitable and sustainable economy and society Establishment of an Economic Inequality Impact Assessment would be a valuable addition to the policymaking toolbox
about the authors
Jay Coggins is an associate professor with the Department of Applied Economics at the University of Minnesota and a policy fellow for Growth amp Justice
thomas legg is a senior lecturer at the University of Minnesotarsquos Carlson School of Management and a policy fellow for Growth amp Justice
dane smith is the president of Growth amp Justice
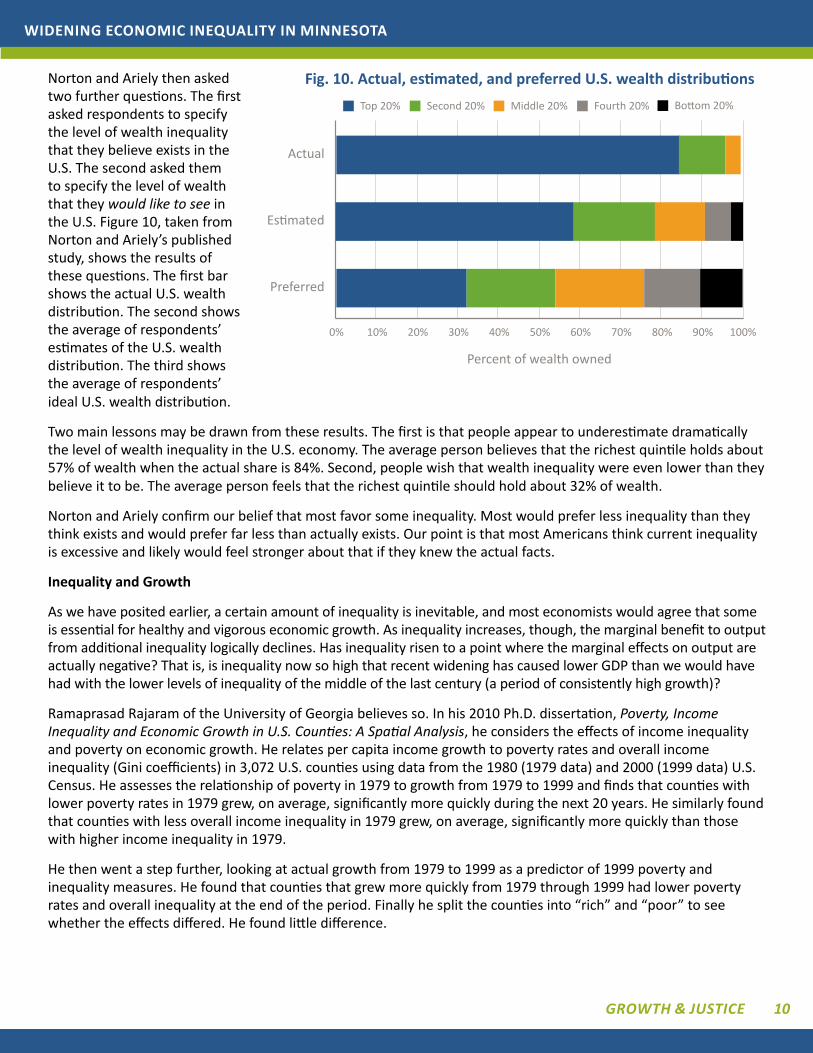
Widening economic inequality in minnesota
Growth amp Justice 10
Norton and Ariely then asked two further questions The first asked respondents to specify the level of wealth inequality that they believe exists in the US The second asked them to specify the level of wealth that they would like to see in the US Figure 10 taken from Norton and Arielyrsquos published study shows the results of these questions The first bar shows the actual US wealth distribution The second shows the average of respondentsrsquo estimates of the US wealth distribution The third shows the average of respondentsrsquo ideal US wealth distribution
Two main lessons may be drawn from these results The first is that people appear to underestimate dramatically the level of wealth inequality in the US economy The average person believes that the richest quintile holds about 57 of wealth when the actual share is 84 Second people wish that wealth inequality were even lower than they believe it to be The average person feels that the richest quintile should hold about 32 of wealth
Norton and Ariely confirm our belief that most favor some inequality Most would prefer less inequality than they think exists and would prefer far less than actually exists Our point is that most Americans think current inequality is excessive and likely would feel stronger about that if they knew the actual facts
Inequality and Growth
As we have posited earlier a certain amount of inequality is inevitable and most economists would agree that some is essential for healthy and vigorous economic growth As inequality increases though the marginal benefit to output from additional inequality logically declines Has inequality risen to a point where the marginal effects on output are actually negative That is is inequality now so high that recent widening has caused lower GDP than we would have had with the lower levels of inequality of the middle of the last century (a period of consistently high growth)
Ramaprasad Rajaram of the University of Georgia believes so In his 2010 PhD dissertation Poverty Income Inequality and Economic Growth in US Counties A Spatial Analysis he considers the effects of income inequality and poverty on economic growth He relates per capita income growth to poverty rates and overall income inequality (Gini coefficients) in 3072 US counties using data from the 1980 (1979 data) and 2000 (1999 data) US Census He assesses the relationship of poverty in 1979 to growth from 1979 to 1999 and finds that counties with lower poverty rates in 1979 grew on average significantly more quickly during the next 20 years He similarly found that counties with less overall income inequality in 1979 grew on average significantly more quickly than those with higher income inequality in 1979
He then went a step further looking at actual growth from 1979 to 1999 as a predictor of 1999 poverty and inequality measures He found that counties that grew more quickly from 1979 through 1999 had lower poverty rates and overall inequality at the end of the period Finally he split the counties into ldquorichrdquo and ldquopoorrdquo to see whether the effects differed He found little difference
Actual
Estimated
Preferred
Top 20 Second 20 Fourth 20 Bottom 20Middle 20
0 10 20 30 40 50 60 70 80 90 100
Percent of wealth owned
Fig 10 Actual estimated and preferred US wealth distributions
Widening economic inequality in minnesota
Growth amp Justice 11
His results tell a compelling story Those areas with less inequality and poverty today all else equal can expect higher future growth in future per capita income In the future those that actually experienced the highest growth are likely to have lower poverty and overall inequality In summary those that grow quickly are likely to be the ones that start with lower inequality The resulting high growth in turn has a dampening effect on future increases in inequality This is a virtuous cycle in which if all share in growing prosperity prosperity grows more rapidly
Inequality and Demand for Goods and Services
US consumers have driven the growth of the US economy at least since World War II Personal consumption has been about 70 of Gross Domestic Product (GDP) Through at least 1979 this consumption was driven by a broad and growing middle class and growing income widely shared across the income distribution Continued long-term growth likely will continue to depend on growing consumption If personal consumption is to remain at 70 of GDP it must grow at the same rate as GDP
As household income increases consumption increases along with it This has the effect of increasing the demand for the goods and services that give rise to the additional income Poor households spend nearly all their increases in income while middle income households spend most of the increases Those at the top spend a smaller proportion of additional income
When incomes at the top are growing much more quickly than those in the middle and the bottom of the distribution consumption naturally declines as a share of GDP In 2010 a year of weak economic recovery 93 of the growth in income went to the top 1 of households As a result this apportionment of additional personal income generated less additional demand for goods and services This perverse braking effect might be viewed as a downward spiral a vicious circle Slowing economic growth leads to increased inequality which then leads to even slower growthIn summary most Americans wish for less inequality than we have even while they underestimate the degree of current inequality Higher inequality inevitably produces lower growth because the wealthy spend less of their income than those less wealthy As income goes increasingly to the wealthy demand for goods and services is less than optimum Growth is constrained as inequality increases beyond a level that encourages growth
v causes oF InequalIty
Why exactly have poverty rates and income inequality increased so dramatically since 1980 Was it unavoidable What of the future How might we prevent further widening or even reverse the trend
Some observers explain our rising inequality as the inevitable result of advancing technology with its attendant rewards for the skilled workers who are able to perform high-tech jobs Others explain it as the inevitable result of increasing globalization in the world economy These two factors are certainly implicated Both have helped to increase global output and global incomes but both have also imposed costs on some people in some places Both have also shoveled generous rewards to a favored few Those bearing the highest costs have been the middle and lower classes in the developed world Those favored include those with capital and those who are highly educated in fields that allow them to take full advantage of globalization and technological advances
Globalization and technological advances generally benefit the same segments of society Globalization has made both production and capital more mobile without equivalent increases in labor mobility Businesses now face fewer legal and institutional impediments to movement of capital goods and services in and out of countries
Advances in technology have reduced the costs of moving goods and services from one country to another For example some accounting firms have American clientsrsquo tax returns prepared in India That is possible only because of recent changes in communications technology and institutions that allow exports of the services from India and import of those services to the US without expensive trade restrictions Here the shareholders of the accounting firm gain through lower costs while less work is available for American tax preparers Further downward pressure is exerted on the wages of the remaining tax preparers
Endless examples of ldquooutsourcingrdquo job loss and downward pressure on working-class Americans have become the staple of economic conversation for three decades Taken together and across the economy these examples create
Widening economic inequality in minnesota
Growth amp Justice 12
conditions that have increased inequality and poverty in the US Was this inevitable Is it necessary that poverty and inequality must increase as a result of technological changes and globalization
We do not believe so Public policies could have largely or completely mitigated the effects of technological changes and globalization Further we believe that government policies enacted over the last thirty years have not only failed to mitigate the effects but have independently increased poverty and inequality In short we are hopeful about the possibility of policy action mitigating inequality And we believe past and future increases in inequality and poverty are not inescapable and can be reversed
First let us look at the experiences of some other industrialized democratic countries They have faced the same forces of globalization and technological change Yet inequality and poverty in many of those countries has not changed appreciably
As noted earlier much of the growth in incomes in the US has been captured by those with incomes in the top 1 Figure 11 shows the path of top 1 income shares for the US Japan Australia and France all from 1913 to 20094 The message from this international comparison is that rising inequality is neither inevitable nor is it necessary for an economy to perform well Alone among the four rich countries shown the US has seen a dramatic rise in the top income share
Overall inequality as measured by the Gini coefficient (Figure 12) similarly demonstrates that the US is more unequal than other high income countries France Canada and Norway represent the other developed countries and have substantially lower inequality than the US In fact these countries have Gini coefficients not seen in the US since the 1970s Note that these are estimates made by The World Bank and differ somewhat from those for the US as estimated by the US Census Bureau
4 These data are different from those in Figure 3 in that income from capital gains is excluded in Figure 11 The source database includes information on capital gains income for the US but not for the other countries
0
5
10
15
20
25
1915
1920
1935
1930
1925
1945
1955
1980
1985
1950
1940
2000
1960
1965
1970
1975
1995
1990
2005
2010
Australia - Atkinson amp Leigh (2007)Japan - Moriquchi amp Saez (2010)
United States - Pikey amp Saez (2007) France - Pikey (2001 2007) Landais (2007)
Fig 11 Top 1 income shares for the United States Australia France amp Japan 1913 - 20011
Year
Inco
me
shar
e
source World Top Incomes Database
00
010
020
030
040
050
060
Norway Canada France India UnitedStates
China Brazil
0415
055
0408
03270368
0326
0258
Fig 12 Gini coefficients for selected countries
source The World Bank
Widening economic inequality in minnesota
Growth amp Justice 13
Figure 13 from the Organization for Economic Cooperation and Development (OECD) shows poverty rates in the mid-2000rsquos for selected OECD countries We stand near the top In the figure each bar represents the percentage of a countryrsquos population living in households with less than 50 of that countryrsquos median income According to this measure the US has the third-highest poverty rate in the OECD at 173 Americarsquos 2010 median income was $49445 We can say then that 173 of all US households had income that year below $24722 Note that the poverty rate as measured by the OECD is higher than reported by the US Census Bureau That agency defines poverty differently than the OECD
Other high income countries have faced globalization and technological changes without a rapid proportional rise in incomes at the top dramatic increases in overall inequality or similar levels of poverty Our neighbor Canada reports median family income of $69860 in 2010 While the definition used by Statistics Canada may differ from that of our Census Bureau it seems reasonable to conclude that Canadian household income is at least comparable to that in the US Canada now has lower unemployment and growth rates similar to ours Canada is doing at least as well as we are economically without our high levels of inequality and poverty
We conclude that recent and future increases in inequality are not inevitable and that we could reduce inequality in the future
vI a proposal For a new polIcy evaluatIon tool the ldquoeconomIc InequalIty Impact assessmentrdquo
In the late 1960s as awareness spread about the threat posed by pollution of all kinds to property and especially to human health policymakers in the United States began to adopt laws appropriations and regulations designed to reduce or remediate environmental damages
Many of the laws and regulations simply required reductions in pollutants and emissions or banned the use of the worst toxins such as DDT But one of the most important provisions was the introduction of requirements to estimate in advance the environmental impact from pending development projects or policies The Environmental Impact Statement or EIS became a useful and accepted policy development tool
We believe growing inequality represents a similar threat to our societyrsquos long-term well-being A further concentration of income and wealth in fewer and fewer households and the accompanying rise in poverty and the decline of middle-income economic stability compels policymakers at all levels to conduct a more systematic assessment of economic inequality impact before they make decisions that could further exacerbate inequality We propose that all economically significant legislation and new state regulations in Minnesota should be subjected to an analysis that measures the policyrsquos impact on economic inequality
The experience with environmental impact measurement is encouraging In a 1994 paper noted environmental law professor William H Rodgers Jr included the EIS in his list of the seven most influential or effective US
0
5
10
15
20
25
Denmark Sweden OECD UnitedKingdom
Canada UnitedStates
Mexico
173
21
114111 113
84
61
Fig 13 Poverty rates at 50 or less of median income for selected OECD countries
source Organization for Economic Cooperation and Development (OECD)
Widening economic inequality in minnesota
Growth amp Justice 14
environmental laws The EIS was part of the National Environmental Policy Act of 1969 (NEPA) and requires federal agencies to prepare an EIS to accompany any agency action that has a significant effect on the human environment Rodgers noted that environmental impact statements were ldquoreplicated in rapid fashion throughout the United States and around the worldrdquo and have become ldquothe most frequently copied and most frequently cited of all US domestic environmental lawsrdquo 5
Legislators and other policymakers in Minnesota could develop an Economic Inequality Impact Assessment (EIIA) for all major policies that are likely to have a measurable effect on income or wealth distribution (This specific title and acronym used hereafter is the creation of the authors of this report we hope to popularize the concept but are not adamant about how it is labeled or the specifics of its implementation)
Minnesota already has a reputation among the states for distinctive high-quality economic measurement tools The Price of Government measurement and the biennial Tax Incidence Study both launched in the 1990s and updated regularly provide uniquely detailed perspective on the overall size of state-and-local government as a percent of income (Price of Government) and how the taxes for that public investment is paid by economic strata (Tax Incidence Study) These tools have greatly enabled quantitative analysis of relative fairness and equality
Legislative and executive branch staffers are familiar with the concept of projecting the costs and benefits of potential policy When legislators advance bills that directly or indirectly create a cost for state or local governments they must seek fiscal notes which calculate the costs of the proposed legislation
Support for measuring projected inequality particularly as it relates to poverty has come in recent years from a growing national coalition of community and philanthropic efforts and Minnesota has been a leader in this effort
The Washington DC based Center for Law and Social Policy (CLASP) published a summary of federal and state efforts that align with a CLASP initiative for Poverty Impact Projections (PIP) The PIP concept as described in that 2011 CLASP report could be easily applied to a broader Economic Inequality Impact Assessment
As stated in the CLASP study ldquoGetting a clearer prognosis of the potential impact of a pending policy is valuable not just for elected officials who need to vote on bills but also for other policymakers and community stakeholders who need to make planning and implementation decisionsrdquo 6
Minnesota is one of the few states highlighted in the CLASP report as having done the most to advance the concept of poverty impact projections noting that just such a mechanism was a key recommendation of the Legislative Commission to End Poverty in Minnesota by 2020 Along with many other local groups particularly the nonprofit organization A Minnesota Without Poverty we encourage efforts toward establishing a poverty impact projection but submit that a broader top-to-bottom evaluation of policy in the form of an Economic Inequality Impact Assessment would be even more valuable
5 Rodgers Jr W H (1994) The Seven Statutory Wonders of US Environmental Law Origins and Morphology Loyola of Los Angeles Law Review 1009-1022 Available at httpdigital commonslmuedullrvol27iss315
6 Levin-Epstein J amp Sanes M (August 2011) At the Forefront Poverty Impact Projections Washington DC CLASP
Widening economic inequality in minnesota
Growth amp Justice 15 2324 University Ave W Suite 120 A Saint Paul MN 55114 wwwgrowthandjusticeorg
Smart Investments Practical Solutions Broader Prosperity
We do not offer here a precise formula for an EIIA But our conversations and interviews with state tax and budget experts suggest the following in regard to practical design and implementation of an EIIA for Minnesota
bull The EIIA could be housed in the Minnesota Management and Budget agency within the office of the State Economist The agency commissioner could appoint an advisory group of economic experts to assist in designing an EIIA process and methodology
bull An EIIA for tax bills could begin in the Revenue Department using more detailed projections about the impact of various tax proposals on the Suits index and other measurements of tax incidence
bull An EIIA could initially calculate the estimated direction of the effect on inequality measures rather than predict specific numerical outcomes An EIIA likely would need to have a de minimis threshold as do fiscal notes in the state budget process so that not every bill or proposal coming before a committee would need to be assessed
bull Scores of specific policy proposals aimed at reducing inequalitymdashinvestment in early childhood education higher minimum wages elimination of high-income tax cuts and breaksmdashare proposed every year by national and state policymakers In many cases the effects on reducing inequality are obvious intuitively But how much more valuable would it be for policymakers to have more precise information about the relative impacts of such proposals
Better economic information will help policymakers navigate toward a more equitable and sustainable economy and society Establishment of an Economic Inequality Impact Assessment would be a valuable addition to the policymaking toolbox
about the authors
Jay Coggins is an associate professor with the Department of Applied Economics at the University of Minnesota and a policy fellow for Growth amp Justice
thomas legg is a senior lecturer at the University of Minnesotarsquos Carlson School of Management and a policy fellow for Growth amp Justice
dane smith is the president of Growth amp Justice
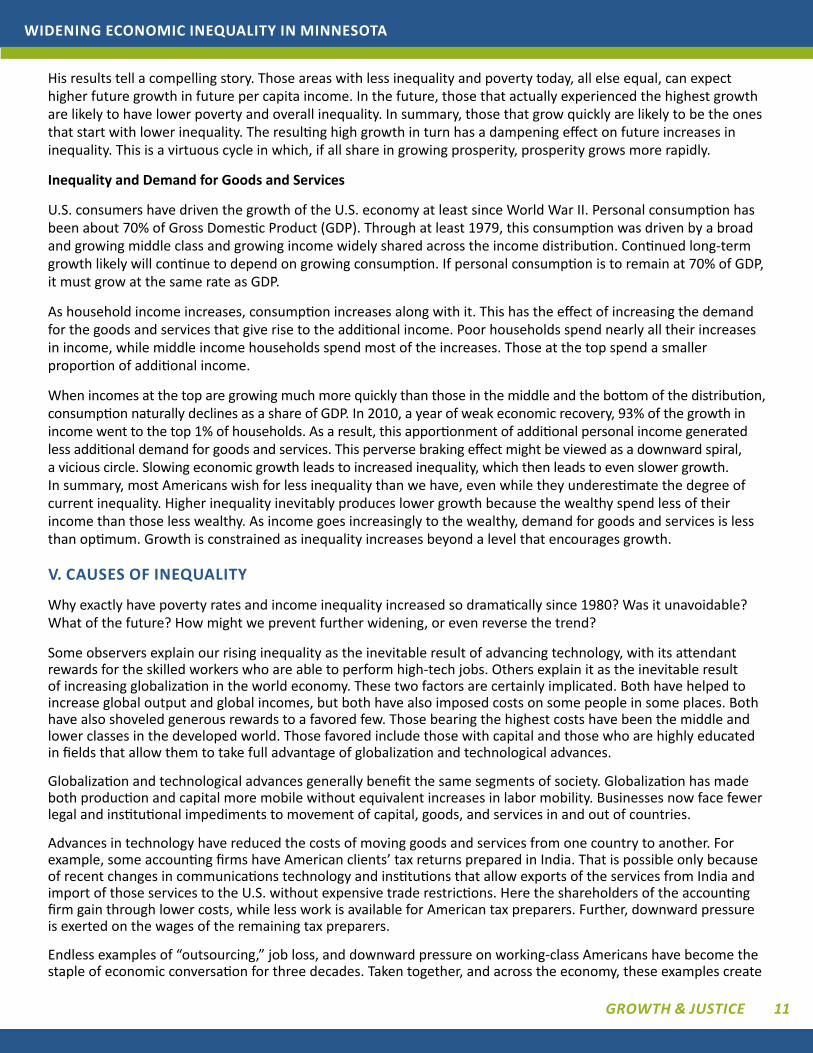
Widening economic inequality in minnesota
Growth amp Justice 11
His results tell a compelling story Those areas with less inequality and poverty today all else equal can expect higher future growth in future per capita income In the future those that actually experienced the highest growth are likely to have lower poverty and overall inequality In summary those that grow quickly are likely to be the ones that start with lower inequality The resulting high growth in turn has a dampening effect on future increases in inequality This is a virtuous cycle in which if all share in growing prosperity prosperity grows more rapidly
Inequality and Demand for Goods and Services
US consumers have driven the growth of the US economy at least since World War II Personal consumption has been about 70 of Gross Domestic Product (GDP) Through at least 1979 this consumption was driven by a broad and growing middle class and growing income widely shared across the income distribution Continued long-term growth likely will continue to depend on growing consumption If personal consumption is to remain at 70 of GDP it must grow at the same rate as GDP
As household income increases consumption increases along with it This has the effect of increasing the demand for the goods and services that give rise to the additional income Poor households spend nearly all their increases in income while middle income households spend most of the increases Those at the top spend a smaller proportion of additional income
When incomes at the top are growing much more quickly than those in the middle and the bottom of the distribution consumption naturally declines as a share of GDP In 2010 a year of weak economic recovery 93 of the growth in income went to the top 1 of households As a result this apportionment of additional personal income generated less additional demand for goods and services This perverse braking effect might be viewed as a downward spiral a vicious circle Slowing economic growth leads to increased inequality which then leads to even slower growthIn summary most Americans wish for less inequality than we have even while they underestimate the degree of current inequality Higher inequality inevitably produces lower growth because the wealthy spend less of their income than those less wealthy As income goes increasingly to the wealthy demand for goods and services is less than optimum Growth is constrained as inequality increases beyond a level that encourages growth
v causes oF InequalIty
Why exactly have poverty rates and income inequality increased so dramatically since 1980 Was it unavoidable What of the future How might we prevent further widening or even reverse the trend
Some observers explain our rising inequality as the inevitable result of advancing technology with its attendant rewards for the skilled workers who are able to perform high-tech jobs Others explain it as the inevitable result of increasing globalization in the world economy These two factors are certainly implicated Both have helped to increase global output and global incomes but both have also imposed costs on some people in some places Both have also shoveled generous rewards to a favored few Those bearing the highest costs have been the middle and lower classes in the developed world Those favored include those with capital and those who are highly educated in fields that allow them to take full advantage of globalization and technological advances
Globalization and technological advances generally benefit the same segments of society Globalization has made both production and capital more mobile without equivalent increases in labor mobility Businesses now face fewer legal and institutional impediments to movement of capital goods and services in and out of countries
Advances in technology have reduced the costs of moving goods and services from one country to another For example some accounting firms have American clientsrsquo tax returns prepared in India That is possible only because of recent changes in communications technology and institutions that allow exports of the services from India and import of those services to the US without expensive trade restrictions Here the shareholders of the accounting firm gain through lower costs while less work is available for American tax preparers Further downward pressure is exerted on the wages of the remaining tax preparers
Endless examples of ldquooutsourcingrdquo job loss and downward pressure on working-class Americans have become the staple of economic conversation for three decades Taken together and across the economy these examples create
Widening economic inequality in minnesota
Growth amp Justice 12
conditions that have increased inequality and poverty in the US Was this inevitable Is it necessary that poverty and inequality must increase as a result of technological changes and globalization
We do not believe so Public policies could have largely or completely mitigated the effects of technological changes and globalization Further we believe that government policies enacted over the last thirty years have not only failed to mitigate the effects but have independently increased poverty and inequality In short we are hopeful about the possibility of policy action mitigating inequality And we believe past and future increases in inequality and poverty are not inescapable and can be reversed
First let us look at the experiences of some other industrialized democratic countries They have faced the same forces of globalization and technological change Yet inequality and poverty in many of those countries has not changed appreciably
As noted earlier much of the growth in incomes in the US has been captured by those with incomes in the top 1 Figure 11 shows the path of top 1 income shares for the US Japan Australia and France all from 1913 to 20094 The message from this international comparison is that rising inequality is neither inevitable nor is it necessary for an economy to perform well Alone among the four rich countries shown the US has seen a dramatic rise in the top income share
Overall inequality as measured by the Gini coefficient (Figure 12) similarly demonstrates that the US is more unequal than other high income countries France Canada and Norway represent the other developed countries and have substantially lower inequality than the US In fact these countries have Gini coefficients not seen in the US since the 1970s Note that these are estimates made by The World Bank and differ somewhat from those for the US as estimated by the US Census Bureau
4 These data are different from those in Figure 3 in that income from capital gains is excluded in Figure 11 The source database includes information on capital gains income for the US but not for the other countries
0
5
10
15
20
25
1915
1920
1935
1930
1925
1945
1955
1980
1985
1950
1940
2000
1960
1965
1970
1975
1995
1990
2005
2010
Australia - Atkinson amp Leigh (2007)Japan - Moriquchi amp Saez (2010)
United States - Pikey amp Saez (2007) France - Pikey (2001 2007) Landais (2007)
Fig 11 Top 1 income shares for the United States Australia France amp Japan 1913 - 20011
Year
Inco
me
shar
e
source World Top Incomes Database
00
010
020
030
040
050
060
Norway Canada France India UnitedStates
China Brazil
0415
055
0408
03270368
0326
0258
Fig 12 Gini coefficients for selected countries
source The World Bank
Widening economic inequality in minnesota
Growth amp Justice 13
Figure 13 from the Organization for Economic Cooperation and Development (OECD) shows poverty rates in the mid-2000rsquos for selected OECD countries We stand near the top In the figure each bar represents the percentage of a countryrsquos population living in households with less than 50 of that countryrsquos median income According to this measure the US has the third-highest poverty rate in the OECD at 173 Americarsquos 2010 median income was $49445 We can say then that 173 of all US households had income that year below $24722 Note that the poverty rate as measured by the OECD is higher than reported by the US Census Bureau That agency defines poverty differently than the OECD
Other high income countries have faced globalization and technological changes without a rapid proportional rise in incomes at the top dramatic increases in overall inequality or similar levels of poverty Our neighbor Canada reports median family income of $69860 in 2010 While the definition used by Statistics Canada may differ from that of our Census Bureau it seems reasonable to conclude that Canadian household income is at least comparable to that in the US Canada now has lower unemployment and growth rates similar to ours Canada is doing at least as well as we are economically without our high levels of inequality and poverty
We conclude that recent and future increases in inequality are not inevitable and that we could reduce inequality in the future
vI a proposal For a new polIcy evaluatIon tool the ldquoeconomIc InequalIty Impact assessmentrdquo
In the late 1960s as awareness spread about the threat posed by pollution of all kinds to property and especially to human health policymakers in the United States began to adopt laws appropriations and regulations designed to reduce or remediate environmental damages
Many of the laws and regulations simply required reductions in pollutants and emissions or banned the use of the worst toxins such as DDT But one of the most important provisions was the introduction of requirements to estimate in advance the environmental impact from pending development projects or policies The Environmental Impact Statement or EIS became a useful and accepted policy development tool
We believe growing inequality represents a similar threat to our societyrsquos long-term well-being A further concentration of income and wealth in fewer and fewer households and the accompanying rise in poverty and the decline of middle-income economic stability compels policymakers at all levels to conduct a more systematic assessment of economic inequality impact before they make decisions that could further exacerbate inequality We propose that all economically significant legislation and new state regulations in Minnesota should be subjected to an analysis that measures the policyrsquos impact on economic inequality
The experience with environmental impact measurement is encouraging In a 1994 paper noted environmental law professor William H Rodgers Jr included the EIS in his list of the seven most influential or effective US
0
5
10
15
20
25
Denmark Sweden OECD UnitedKingdom
Canada UnitedStates
Mexico
173
21
114111 113
84
61
Fig 13 Poverty rates at 50 or less of median income for selected OECD countries
source Organization for Economic Cooperation and Development (OECD)
Widening economic inequality in minnesota
Growth amp Justice 14
environmental laws The EIS was part of the National Environmental Policy Act of 1969 (NEPA) and requires federal agencies to prepare an EIS to accompany any agency action that has a significant effect on the human environment Rodgers noted that environmental impact statements were ldquoreplicated in rapid fashion throughout the United States and around the worldrdquo and have become ldquothe most frequently copied and most frequently cited of all US domestic environmental lawsrdquo 5
Legislators and other policymakers in Minnesota could develop an Economic Inequality Impact Assessment (EIIA) for all major policies that are likely to have a measurable effect on income or wealth distribution (This specific title and acronym used hereafter is the creation of the authors of this report we hope to popularize the concept but are not adamant about how it is labeled or the specifics of its implementation)
Minnesota already has a reputation among the states for distinctive high-quality economic measurement tools The Price of Government measurement and the biennial Tax Incidence Study both launched in the 1990s and updated regularly provide uniquely detailed perspective on the overall size of state-and-local government as a percent of income (Price of Government) and how the taxes for that public investment is paid by economic strata (Tax Incidence Study) These tools have greatly enabled quantitative analysis of relative fairness and equality
Legislative and executive branch staffers are familiar with the concept of projecting the costs and benefits of potential policy When legislators advance bills that directly or indirectly create a cost for state or local governments they must seek fiscal notes which calculate the costs of the proposed legislation
Support for measuring projected inequality particularly as it relates to poverty has come in recent years from a growing national coalition of community and philanthropic efforts and Minnesota has been a leader in this effort
The Washington DC based Center for Law and Social Policy (CLASP) published a summary of federal and state efforts that align with a CLASP initiative for Poverty Impact Projections (PIP) The PIP concept as described in that 2011 CLASP report could be easily applied to a broader Economic Inequality Impact Assessment
As stated in the CLASP study ldquoGetting a clearer prognosis of the potential impact of a pending policy is valuable not just for elected officials who need to vote on bills but also for other policymakers and community stakeholders who need to make planning and implementation decisionsrdquo 6
Minnesota is one of the few states highlighted in the CLASP report as having done the most to advance the concept of poverty impact projections noting that just such a mechanism was a key recommendation of the Legislative Commission to End Poverty in Minnesota by 2020 Along with many other local groups particularly the nonprofit organization A Minnesota Without Poverty we encourage efforts toward establishing a poverty impact projection but submit that a broader top-to-bottom evaluation of policy in the form of an Economic Inequality Impact Assessment would be even more valuable
5 Rodgers Jr W H (1994) The Seven Statutory Wonders of US Environmental Law Origins and Morphology Loyola of Los Angeles Law Review 1009-1022 Available at httpdigital commonslmuedullrvol27iss315
6 Levin-Epstein J amp Sanes M (August 2011) At the Forefront Poverty Impact Projections Washington DC CLASP
Widening economic inequality in minnesota
Growth amp Justice 15 2324 University Ave W Suite 120 A Saint Paul MN 55114 wwwgrowthandjusticeorg
Smart Investments Practical Solutions Broader Prosperity
We do not offer here a precise formula for an EIIA But our conversations and interviews with state tax and budget experts suggest the following in regard to practical design and implementation of an EIIA for Minnesota
bull The EIIA could be housed in the Minnesota Management and Budget agency within the office of the State Economist The agency commissioner could appoint an advisory group of economic experts to assist in designing an EIIA process and methodology
bull An EIIA for tax bills could begin in the Revenue Department using more detailed projections about the impact of various tax proposals on the Suits index and other measurements of tax incidence
bull An EIIA could initially calculate the estimated direction of the effect on inequality measures rather than predict specific numerical outcomes An EIIA likely would need to have a de minimis threshold as do fiscal notes in the state budget process so that not every bill or proposal coming before a committee would need to be assessed
bull Scores of specific policy proposals aimed at reducing inequalitymdashinvestment in early childhood education higher minimum wages elimination of high-income tax cuts and breaksmdashare proposed every year by national and state policymakers In many cases the effects on reducing inequality are obvious intuitively But how much more valuable would it be for policymakers to have more precise information about the relative impacts of such proposals
Better economic information will help policymakers navigate toward a more equitable and sustainable economy and society Establishment of an Economic Inequality Impact Assessment would be a valuable addition to the policymaking toolbox
about the authors
Jay Coggins is an associate professor with the Department of Applied Economics at the University of Minnesota and a policy fellow for Growth amp Justice
thomas legg is a senior lecturer at the University of Minnesotarsquos Carlson School of Management and a policy fellow for Growth amp Justice
dane smith is the president of Growth amp Justice
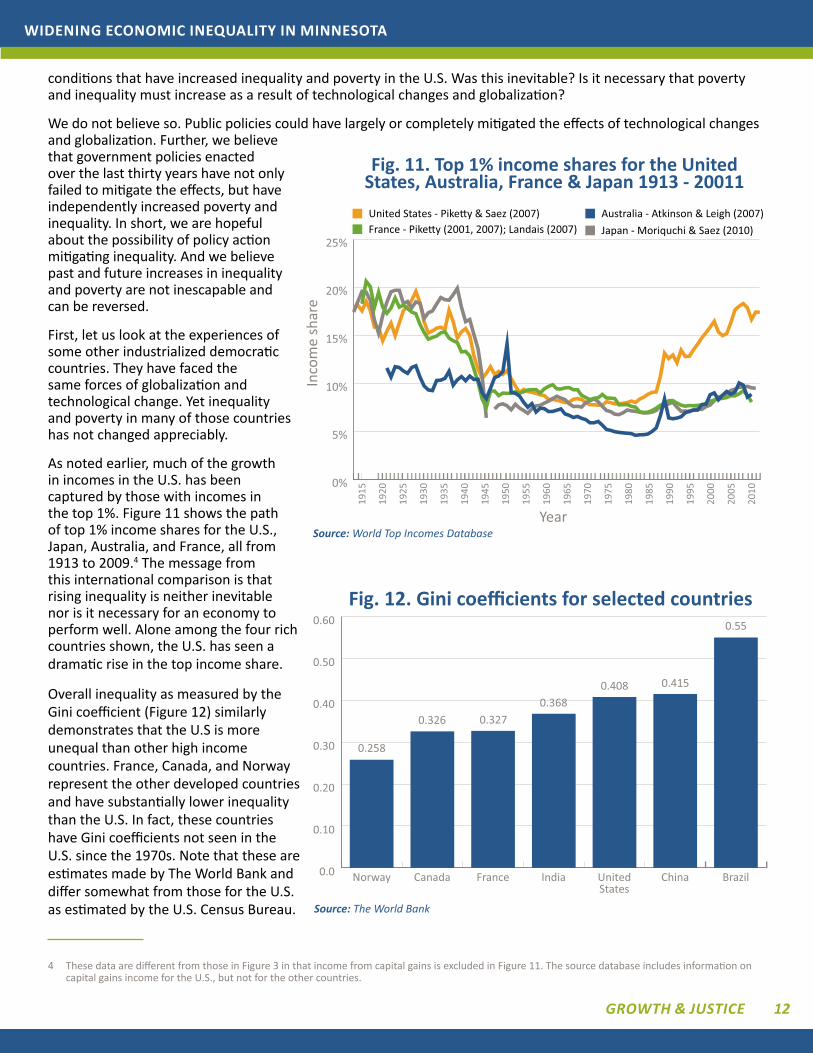
Widening economic inequality in minnesota
Growth amp Justice 12
conditions that have increased inequality and poverty in the US Was this inevitable Is it necessary that poverty and inequality must increase as a result of technological changes and globalization
We do not believe so Public policies could have largely or completely mitigated the effects of technological changes and globalization Further we believe that government policies enacted over the last thirty years have not only failed to mitigate the effects but have independently increased poverty and inequality In short we are hopeful about the possibility of policy action mitigating inequality And we believe past and future increases in inequality and poverty are not inescapable and can be reversed
First let us look at the experiences of some other industrialized democratic countries They have faced the same forces of globalization and technological change Yet inequality and poverty in many of those countries has not changed appreciably
As noted earlier much of the growth in incomes in the US has been captured by those with incomes in the top 1 Figure 11 shows the path of top 1 income shares for the US Japan Australia and France all from 1913 to 20094 The message from this international comparison is that rising inequality is neither inevitable nor is it necessary for an economy to perform well Alone among the four rich countries shown the US has seen a dramatic rise in the top income share
Overall inequality as measured by the Gini coefficient (Figure 12) similarly demonstrates that the US is more unequal than other high income countries France Canada and Norway represent the other developed countries and have substantially lower inequality than the US In fact these countries have Gini coefficients not seen in the US since the 1970s Note that these are estimates made by The World Bank and differ somewhat from those for the US as estimated by the US Census Bureau
4 These data are different from those in Figure 3 in that income from capital gains is excluded in Figure 11 The source database includes information on capital gains income for the US but not for the other countries
0
5
10
15
20
25
1915
1920
1935
1930
1925
1945
1955
1980
1985
1950
1940
2000
1960
1965
1970
1975
1995
1990
2005
2010
Australia - Atkinson amp Leigh (2007)Japan - Moriquchi amp Saez (2010)
United States - Pikey amp Saez (2007) France - Pikey (2001 2007) Landais (2007)
Fig 11 Top 1 income shares for the United States Australia France amp Japan 1913 - 20011
Year
Inco
me
shar
e
source World Top Incomes Database
00
010
020
030
040
050
060
Norway Canada France India UnitedStates
China Brazil
0415
055
0408
03270368
0326
0258
Fig 12 Gini coefficients for selected countries
source The World Bank
Widening economic inequality in minnesota
Growth amp Justice 13
Figure 13 from the Organization for Economic Cooperation and Development (OECD) shows poverty rates in the mid-2000rsquos for selected OECD countries We stand near the top In the figure each bar represents the percentage of a countryrsquos population living in households with less than 50 of that countryrsquos median income According to this measure the US has the third-highest poverty rate in the OECD at 173 Americarsquos 2010 median income was $49445 We can say then that 173 of all US households had income that year below $24722 Note that the poverty rate as measured by the OECD is higher than reported by the US Census Bureau That agency defines poverty differently than the OECD
Other high income countries have faced globalization and technological changes without a rapid proportional rise in incomes at the top dramatic increases in overall inequality or similar levels of poverty Our neighbor Canada reports median family income of $69860 in 2010 While the definition used by Statistics Canada may differ from that of our Census Bureau it seems reasonable to conclude that Canadian household income is at least comparable to that in the US Canada now has lower unemployment and growth rates similar to ours Canada is doing at least as well as we are economically without our high levels of inequality and poverty
We conclude that recent and future increases in inequality are not inevitable and that we could reduce inequality in the future
vI a proposal For a new polIcy evaluatIon tool the ldquoeconomIc InequalIty Impact assessmentrdquo
In the late 1960s as awareness spread about the threat posed by pollution of all kinds to property and especially to human health policymakers in the United States began to adopt laws appropriations and regulations designed to reduce or remediate environmental damages
Many of the laws and regulations simply required reductions in pollutants and emissions or banned the use of the worst toxins such as DDT But one of the most important provisions was the introduction of requirements to estimate in advance the environmental impact from pending development projects or policies The Environmental Impact Statement or EIS became a useful and accepted policy development tool
We believe growing inequality represents a similar threat to our societyrsquos long-term well-being A further concentration of income and wealth in fewer and fewer households and the accompanying rise in poverty and the decline of middle-income economic stability compels policymakers at all levels to conduct a more systematic assessment of economic inequality impact before they make decisions that could further exacerbate inequality We propose that all economically significant legislation and new state regulations in Minnesota should be subjected to an analysis that measures the policyrsquos impact on economic inequality
The experience with environmental impact measurement is encouraging In a 1994 paper noted environmental law professor William H Rodgers Jr included the EIS in his list of the seven most influential or effective US
0
5
10
15
20
25
Denmark Sweden OECD UnitedKingdom
Canada UnitedStates
Mexico
173
21
114111 113
84
61
Fig 13 Poverty rates at 50 or less of median income for selected OECD countries
source Organization for Economic Cooperation and Development (OECD)
Widening economic inequality in minnesota
Growth amp Justice 14
environmental laws The EIS was part of the National Environmental Policy Act of 1969 (NEPA) and requires federal agencies to prepare an EIS to accompany any agency action that has a significant effect on the human environment Rodgers noted that environmental impact statements were ldquoreplicated in rapid fashion throughout the United States and around the worldrdquo and have become ldquothe most frequently copied and most frequently cited of all US domestic environmental lawsrdquo 5
Legislators and other policymakers in Minnesota could develop an Economic Inequality Impact Assessment (EIIA) for all major policies that are likely to have a measurable effect on income or wealth distribution (This specific title and acronym used hereafter is the creation of the authors of this report we hope to popularize the concept but are not adamant about how it is labeled or the specifics of its implementation)
Minnesota already has a reputation among the states for distinctive high-quality economic measurement tools The Price of Government measurement and the biennial Tax Incidence Study both launched in the 1990s and updated regularly provide uniquely detailed perspective on the overall size of state-and-local government as a percent of income (Price of Government) and how the taxes for that public investment is paid by economic strata (Tax Incidence Study) These tools have greatly enabled quantitative analysis of relative fairness and equality
Legislative and executive branch staffers are familiar with the concept of projecting the costs and benefits of potential policy When legislators advance bills that directly or indirectly create a cost for state or local governments they must seek fiscal notes which calculate the costs of the proposed legislation
Support for measuring projected inequality particularly as it relates to poverty has come in recent years from a growing national coalition of community and philanthropic efforts and Minnesota has been a leader in this effort
The Washington DC based Center for Law and Social Policy (CLASP) published a summary of federal and state efforts that align with a CLASP initiative for Poverty Impact Projections (PIP) The PIP concept as described in that 2011 CLASP report could be easily applied to a broader Economic Inequality Impact Assessment
As stated in the CLASP study ldquoGetting a clearer prognosis of the potential impact of a pending policy is valuable not just for elected officials who need to vote on bills but also for other policymakers and community stakeholders who need to make planning and implementation decisionsrdquo 6
Minnesota is one of the few states highlighted in the CLASP report as having done the most to advance the concept of poverty impact projections noting that just such a mechanism was a key recommendation of the Legislative Commission to End Poverty in Minnesota by 2020 Along with many other local groups particularly the nonprofit organization A Minnesota Without Poverty we encourage efforts toward establishing a poverty impact projection but submit that a broader top-to-bottom evaluation of policy in the form of an Economic Inequality Impact Assessment would be even more valuable
5 Rodgers Jr W H (1994) The Seven Statutory Wonders of US Environmental Law Origins and Morphology Loyola of Los Angeles Law Review 1009-1022 Available at httpdigital commonslmuedullrvol27iss315
6 Levin-Epstein J amp Sanes M (August 2011) At the Forefront Poverty Impact Projections Washington DC CLASP
Widening economic inequality in minnesota
Growth amp Justice 15 2324 University Ave W Suite 120 A Saint Paul MN 55114 wwwgrowthandjusticeorg
Smart Investments Practical Solutions Broader Prosperity
We do not offer here a precise formula for an EIIA But our conversations and interviews with state tax and budget experts suggest the following in regard to practical design and implementation of an EIIA for Minnesota
bull The EIIA could be housed in the Minnesota Management and Budget agency within the office of the State Economist The agency commissioner could appoint an advisory group of economic experts to assist in designing an EIIA process and methodology
bull An EIIA for tax bills could begin in the Revenue Department using more detailed projections about the impact of various tax proposals on the Suits index and other measurements of tax incidence
bull An EIIA could initially calculate the estimated direction of the effect on inequality measures rather than predict specific numerical outcomes An EIIA likely would need to have a de minimis threshold as do fiscal notes in the state budget process so that not every bill or proposal coming before a committee would need to be assessed
bull Scores of specific policy proposals aimed at reducing inequalitymdashinvestment in early childhood education higher minimum wages elimination of high-income tax cuts and breaksmdashare proposed every year by national and state policymakers In many cases the effects on reducing inequality are obvious intuitively But how much more valuable would it be for policymakers to have more precise information about the relative impacts of such proposals
Better economic information will help policymakers navigate toward a more equitable and sustainable economy and society Establishment of an Economic Inequality Impact Assessment would be a valuable addition to the policymaking toolbox
about the authors
Jay Coggins is an associate professor with the Department of Applied Economics at the University of Minnesota and a policy fellow for Growth amp Justice
thomas legg is a senior lecturer at the University of Minnesotarsquos Carlson School of Management and a policy fellow for Growth amp Justice
dane smith is the president of Growth amp Justice
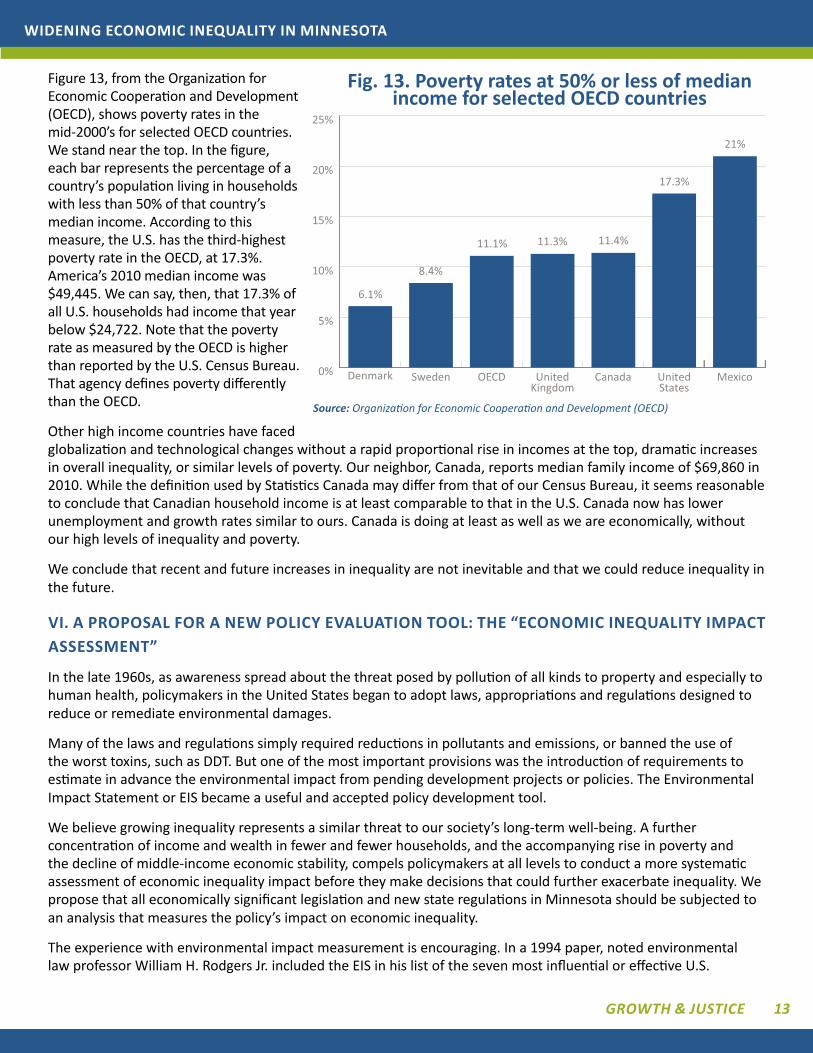
Widening economic inequality in minnesota
Growth amp Justice 13
Figure 13 from the Organization for Economic Cooperation and Development (OECD) shows poverty rates in the mid-2000rsquos for selected OECD countries We stand near the top In the figure each bar represents the percentage of a countryrsquos population living in households with less than 50 of that countryrsquos median income According to this measure the US has the third-highest poverty rate in the OECD at 173 Americarsquos 2010 median income was $49445 We can say then that 173 of all US households had income that year below $24722 Note that the poverty rate as measured by the OECD is higher than reported by the US Census Bureau That agency defines poverty differently than the OECD
Other high income countries have faced globalization and technological changes without a rapid proportional rise in incomes at the top dramatic increases in overall inequality or similar levels of poverty Our neighbor Canada reports median family income of $69860 in 2010 While the definition used by Statistics Canada may differ from that of our Census Bureau it seems reasonable to conclude that Canadian household income is at least comparable to that in the US Canada now has lower unemployment and growth rates similar to ours Canada is doing at least as well as we are economically without our high levels of inequality and poverty
We conclude that recent and future increases in inequality are not inevitable and that we could reduce inequality in the future
vI a proposal For a new polIcy evaluatIon tool the ldquoeconomIc InequalIty Impact assessmentrdquo
In the late 1960s as awareness spread about the threat posed by pollution of all kinds to property and especially to human health policymakers in the United States began to adopt laws appropriations and regulations designed to reduce or remediate environmental damages
Many of the laws and regulations simply required reductions in pollutants and emissions or banned the use of the worst toxins such as DDT But one of the most important provisions was the introduction of requirements to estimate in advance the environmental impact from pending development projects or policies The Environmental Impact Statement or EIS became a useful and accepted policy development tool
We believe growing inequality represents a similar threat to our societyrsquos long-term well-being A further concentration of income and wealth in fewer and fewer households and the accompanying rise in poverty and the decline of middle-income economic stability compels policymakers at all levels to conduct a more systematic assessment of economic inequality impact before they make decisions that could further exacerbate inequality We propose that all economically significant legislation and new state regulations in Minnesota should be subjected to an analysis that measures the policyrsquos impact on economic inequality
The experience with environmental impact measurement is encouraging In a 1994 paper noted environmental law professor William H Rodgers Jr included the EIS in his list of the seven most influential or effective US
0
5
10
15
20
25
Denmark Sweden OECD UnitedKingdom
Canada UnitedStates
Mexico
173
21
114111 113
84
61
Fig 13 Poverty rates at 50 or less of median income for selected OECD countries
source Organization for Economic Cooperation and Development (OECD)
Widening economic inequality in minnesota
Growth amp Justice 14
environmental laws The EIS was part of the National Environmental Policy Act of 1969 (NEPA) and requires federal agencies to prepare an EIS to accompany any agency action that has a significant effect on the human environment Rodgers noted that environmental impact statements were ldquoreplicated in rapid fashion throughout the United States and around the worldrdquo and have become ldquothe most frequently copied and most frequently cited of all US domestic environmental lawsrdquo 5
Legislators and other policymakers in Minnesota could develop an Economic Inequality Impact Assessment (EIIA) for all major policies that are likely to have a measurable effect on income or wealth distribution (This specific title and acronym used hereafter is the creation of the authors of this report we hope to popularize the concept but are not adamant about how it is labeled or the specifics of its implementation)
Minnesota already has a reputation among the states for distinctive high-quality economic measurement tools The Price of Government measurement and the biennial Tax Incidence Study both launched in the 1990s and updated regularly provide uniquely detailed perspective on the overall size of state-and-local government as a percent of income (Price of Government) and how the taxes for that public investment is paid by economic strata (Tax Incidence Study) These tools have greatly enabled quantitative analysis of relative fairness and equality
Legislative and executive branch staffers are familiar with the concept of projecting the costs and benefits of potential policy When legislators advance bills that directly or indirectly create a cost for state or local governments they must seek fiscal notes which calculate the costs of the proposed legislation
Support for measuring projected inequality particularly as it relates to poverty has come in recent years from a growing national coalition of community and philanthropic efforts and Minnesota has been a leader in this effort
The Washington DC based Center for Law and Social Policy (CLASP) published a summary of federal and state efforts that align with a CLASP initiative for Poverty Impact Projections (PIP) The PIP concept as described in that 2011 CLASP report could be easily applied to a broader Economic Inequality Impact Assessment
As stated in the CLASP study ldquoGetting a clearer prognosis of the potential impact of a pending policy is valuable not just for elected officials who need to vote on bills but also for other policymakers and community stakeholders who need to make planning and implementation decisionsrdquo 6
Minnesota is one of the few states highlighted in the CLASP report as having done the most to advance the concept of poverty impact projections noting that just such a mechanism was a key recommendation of the Legislative Commission to End Poverty in Minnesota by 2020 Along with many other local groups particularly the nonprofit organization A Minnesota Without Poverty we encourage efforts toward establishing a poverty impact projection but submit that a broader top-to-bottom evaluation of policy in the form of an Economic Inequality Impact Assessment would be even more valuable
5 Rodgers Jr W H (1994) The Seven Statutory Wonders of US Environmental Law Origins and Morphology Loyola of Los Angeles Law Review 1009-1022 Available at httpdigital commonslmuedullrvol27iss315
6 Levin-Epstein J amp Sanes M (August 2011) At the Forefront Poverty Impact Projections Washington DC CLASP
Widening economic inequality in minnesota
Growth amp Justice 15 2324 University Ave W Suite 120 A Saint Paul MN 55114 wwwgrowthandjusticeorg
Smart Investments Practical Solutions Broader Prosperity
We do not offer here a precise formula for an EIIA But our conversations and interviews with state tax and budget experts suggest the following in regard to practical design and implementation of an EIIA for Minnesota
bull The EIIA could be housed in the Minnesota Management and Budget agency within the office of the State Economist The agency commissioner could appoint an advisory group of economic experts to assist in designing an EIIA process and methodology
bull An EIIA for tax bills could begin in the Revenue Department using more detailed projections about the impact of various tax proposals on the Suits index and other measurements of tax incidence
bull An EIIA could initially calculate the estimated direction of the effect on inequality measures rather than predict specific numerical outcomes An EIIA likely would need to have a de minimis threshold as do fiscal notes in the state budget process so that not every bill or proposal coming before a committee would need to be assessed
bull Scores of specific policy proposals aimed at reducing inequalitymdashinvestment in early childhood education higher minimum wages elimination of high-income tax cuts and breaksmdashare proposed every year by national and state policymakers In many cases the effects on reducing inequality are obvious intuitively But how much more valuable would it be for policymakers to have more precise information about the relative impacts of such proposals
Better economic information will help policymakers navigate toward a more equitable and sustainable economy and society Establishment of an Economic Inequality Impact Assessment would be a valuable addition to the policymaking toolbox
about the authors
Jay Coggins is an associate professor with the Department of Applied Economics at the University of Minnesota and a policy fellow for Growth amp Justice
thomas legg is a senior lecturer at the University of Minnesotarsquos Carlson School of Management and a policy fellow for Growth amp Justice
dane smith is the president of Growth amp Justice
Widening economic inequality in minnesota
Growth amp Justice 15 2324 University Ave W Suite 120 A Saint Paul MN 55114 wwwgrowthandjusticeorg
Smart Investments Practical Solutions Broader Prosperity
We do not offer here a precise formula for an EIIA But our conversations and interviews with state tax and budget experts suggest the following in regard to practical design and implementation of an EIIA for Minnesota
bull The EIIA could be housed in the Minnesota Management and Budget agency within the office of the State Economist The agency commissioner could appoint an advisory group of economic experts to assist in designing an EIIA process and methodology
bull An EIIA for tax bills could begin in the Revenue Department using more detailed projections about the impact of various tax proposals on the Suits index and other measurements of tax incidence
bull An EIIA could initially calculate the estimated direction of the effect on inequality measures rather than predict specific numerical outcomes An EIIA likely would need to have a de minimis threshold as do fiscal notes in the state budget process so that not every bill or proposal coming before a committee would need to be assessed
bull Scores of specific policy proposals aimed at reducing inequalitymdashinvestment in early childhood education higher minimum wages elimination of high-income tax cuts and breaksmdashare proposed every year by national and state policymakers In many cases the effects on reducing inequality are obvious intuitively But how much more valuable would it be for policymakers to have more precise information about the relative impacts of such proposals
Better economic information will help policymakers navigate toward a more equitable and sustainable economy and society Establishment of an Economic Inequality Impact Assessment would be a valuable addition to the policymaking toolbox
about the authors
Jay Coggins is an associate professor with the Department of Applied Economics at the University of Minnesota and a policy fellow for Growth amp Justice
thomas legg is a senior lecturer at the University of Minnesotarsquos Carlson School of Management and a policy fellow for Growth amp Justice
dane smith is the president of Growth amp Justice