Embed Size (px)
Citation preview

sensors
Letter
Wide-Band High Concentration-RatioVolume-Holographic Grating for Solar Concentration
Chengchen Wang, Jianshe Ma, Hongxu Kao, Taihui Wu and Ping Su *
Tsinghua Shenzhen International Graduate School, Tsinghua University, Shenzhen 518055, China;[email protected] (C.W.); [email protected] (J.M.); [email protected] (H.K.);[email protected] (T.W.)* Correspondence: [email protected]
Received: 22 September 2020; Accepted: 21 October 2020; Published: 26 October 2020�����������������
Abstract: Efficient and low-cost solar-energy collection has become the focus of many researchworks. This paper proposes a recording method and an experimental verification of a wide-band,large-angle, and high concentration-ratio volume-holographic grating for solar concentration.We applied the Kogelnik coupled-wave theory and photopolymer diffusion model to analysethe formation mechanism and influencing factors on the diffraction efficiency of monochromaticvolume-holographic gratings. We design and construct a three-color laser-interference systemto record three monochromatic volume-holographic gratings. The best recording conditions aredetermined by experiment and simulation. A trichromatic volume-holographic grating is obtained bygluing the three monochromatic gratings together. The experimental results show that the trichromaticvolume-holographic grating with a working angle of 6.7◦ and a working band of visible light has alight concentration ratio of 149.2 under an illumination of the combined recorded three-color beams,and that under sunlight is 27.2. We find that the proposed trichromatic volume-holographic gratingfor light concentration offers the advantages of wide band and high light concentration ratio, whichprovide a reference for solar concentration.
Keywords: solar concentration; volume hologram; photopolymer; wide band
1. Introduction
Non-renewable energy sources, such as coal, petroleum, and natural gas, not only causeenvironmental pollution, but also restrict economic development to a certain extent. Solving theenergy problem has become an urgent issue to address in our contemporary society. As a typeof renewable energy, solar energy provides the advantages of universality, safety, and long-lastingproperties; therefore, it offers special development prospects. At present, traditional concentrators,such as lenses and Fresnel lenses, are widely applied, but they have small condensing angle. Hence, atracking device must be installed when they are used as sunlight concentrator, which leads to issuessuch as complicated concentrator structure and high cost. Following the development of materialtechnology, concentrators based on volume holography are expected to solve the small working-angleproblem of traditional concentrators.
Ludamn et al. [1] first proposed holographic concentrators. Thereafter, the theory and methodof holographic concentrators have been gradually developed. According to previous studies, manyresearchers studied the feasibility of solar concentrators and proposed various volume-holographicconcentration structures [2–22]. Ren et al. proposed a three-layer volume-holographic tandemconcentrator system [3] that could achieve a condensing angle of more than 60◦. Akbari et al. proposeda four-layer volume-holographic concentrator system [11] that could concentrate light from 24◦, andthe monochromatic light concentration ratio was 20. Lee et al. proposed an angle-multiplexing
Sensors 2020, 20, 6080; doi:10.3390/s20216080 www.mdpi.com/journal/sensors
Sensors 2020, 20, 6080 2 of 14
volume-holographic concentrator system [18]. In their concentrator system, the object light was aspherical wave generated by a condensing lens, and the reference light was multiplexed three planewaves in which the angle of the three plane-wave beams was 10◦ apart. The diffraction efficienciesof the different angle ranges were 16.6%, 21.8%, and 26.5%. Although these systems could achievea certain light-gathering effect, they had low light-gathering efficiency. Because of monochromaticholography, the dispersion effect was inevitable.
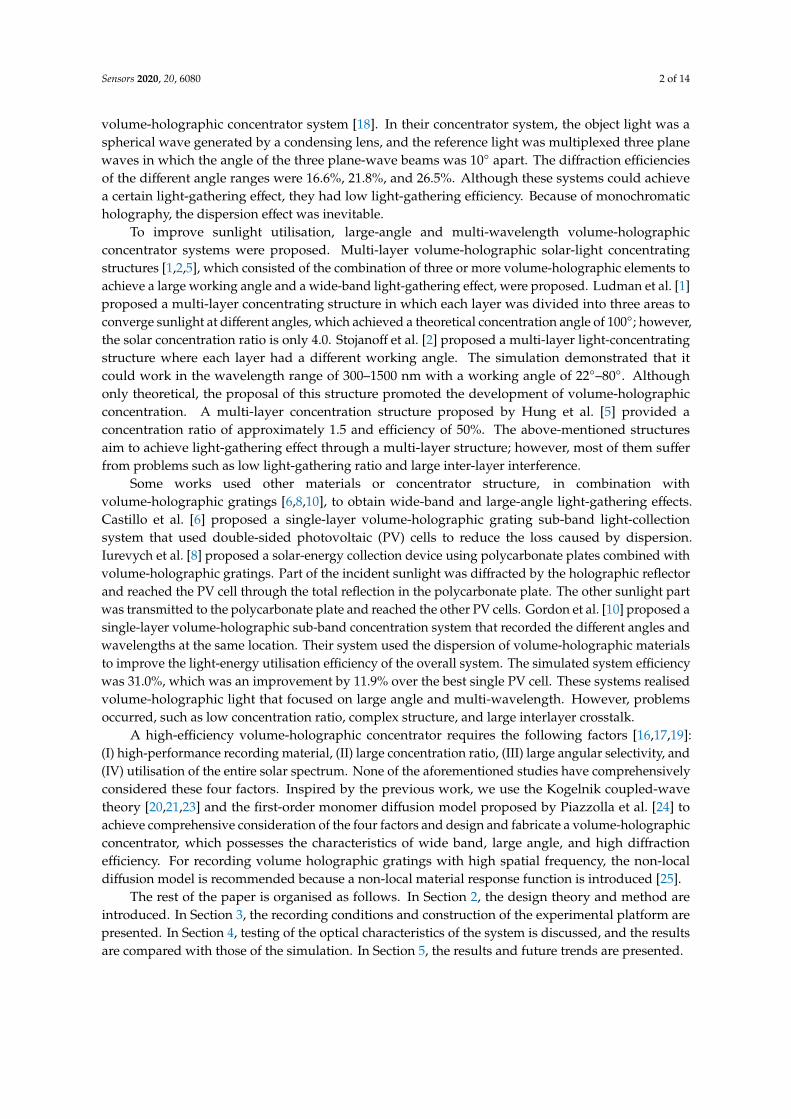
To improve sunlight utilisation, large-angle and multi-wavelength volume-holographicconcentrator systems were proposed. Multi-layer volume-holographic solar-light concentratingstructures [1,2,5], which consisted of the combination of three or more volume-holographic elements toachieve a large working angle and a wide-band light-gathering effect, were proposed. Ludman et al. [1]proposed a multi-layer concentrating structure in which each layer was divided into three areas toconverge sunlight at different angles, which achieved a theoretical concentration angle of 100◦; however,the solar concentration ratio is only 4.0. Stojanoff et al. [2] proposed a multi-layer light-concentratingstructure where each layer had a different working angle. The simulation demonstrated that itcould work in the wavelength range of 300–1500 nm with a working angle of 22◦–80◦. Althoughonly theoretical, the proposal of this structure promoted the development of volume-holographicconcentration. A multi-layer concentration structure proposed by Hung et al. [5] provided aconcentration ratio of approximately 1.5 and efficiency of 50%. The above-mentioned structuresaim to achieve light-gathering effect through a multi-layer structure; however, most of them sufferfrom problems such as low light-gathering ratio and large inter-layer interference.
Some works used other materials or concentrator structure, in combination withvolume-holographic gratings [6,8,10], to obtain wide-band and large-angle light-gathering effects.Castillo et al. [6] proposed a single-layer volume-holographic grating sub-band light-collectionsystem that used double-sided photovoltaic (PV) cells to reduce the loss caused by dispersion.Iurevych et al. [8] proposed a solar-energy collection device using polycarbonate plates combined withvolume-holographic gratings. Part of the incident sunlight was diffracted by the holographic reflectorand reached the PV cell through the total reflection in the polycarbonate plate. The other sunlight partwas transmitted to the polycarbonate plate and reached the other PV cells. Gordon et al. [10] proposed asingle-layer volume-holographic sub-band concentration system that recorded the different angles andwavelengths at the same location. Their system used the dispersion of volume-holographic materialsto improve the light-energy utilisation efficiency of the overall system. The simulated system efficiencywas 31.0%, which was an improvement by 11.9% over the best single PV cell. These systems realisedvolume-holographic light that focused on large angle and multi-wavelength. However, problemsoccurred, such as low concentration ratio, complex structure, and large interlayer crosstalk.
A high-efficiency volume-holographic concentrator requires the following factors [16,17,19]:(I) high-performance recording material, (II) large concentration ratio, (III) large angular selectivity, and(IV) utilisation of the entire solar spectrum. None of the aforementioned studies have comprehensivelyconsidered these four factors. Inspired by the previous work, we use the Kogelnik coupled-wavetheory [20,21,23] and the first-order monomer diffusion model proposed by Piazzolla et al. [24] toachieve comprehensive consideration of the four factors and design and fabricate a volume-holographicconcentrator, which possesses the characteristics of wide band, large angle, and high diffractionefficiency. For recording volume holographic gratings with high spatial frequency, the non-localdiffusion model is recommended because a non-local material response function is introduced [25].
The rest of the paper is organised as follows. In Section 2, the design theory and method areintroduced. In Section 3, the recording conditions and construction of the experimental platform arepresented. In Section 4, testing of the optical characteristics of the system is discussed, and the resultsare compared with those of the simulation. In Section 5, the results and future trends are presented.
Sensors 2020, 20, 6080 3 of 14
2. Design Theory and Method
According to previous studies, the present work starts from the Kogelnik coupled-wave theory [23]and establishes a volume-holographic solar-light concentration model.
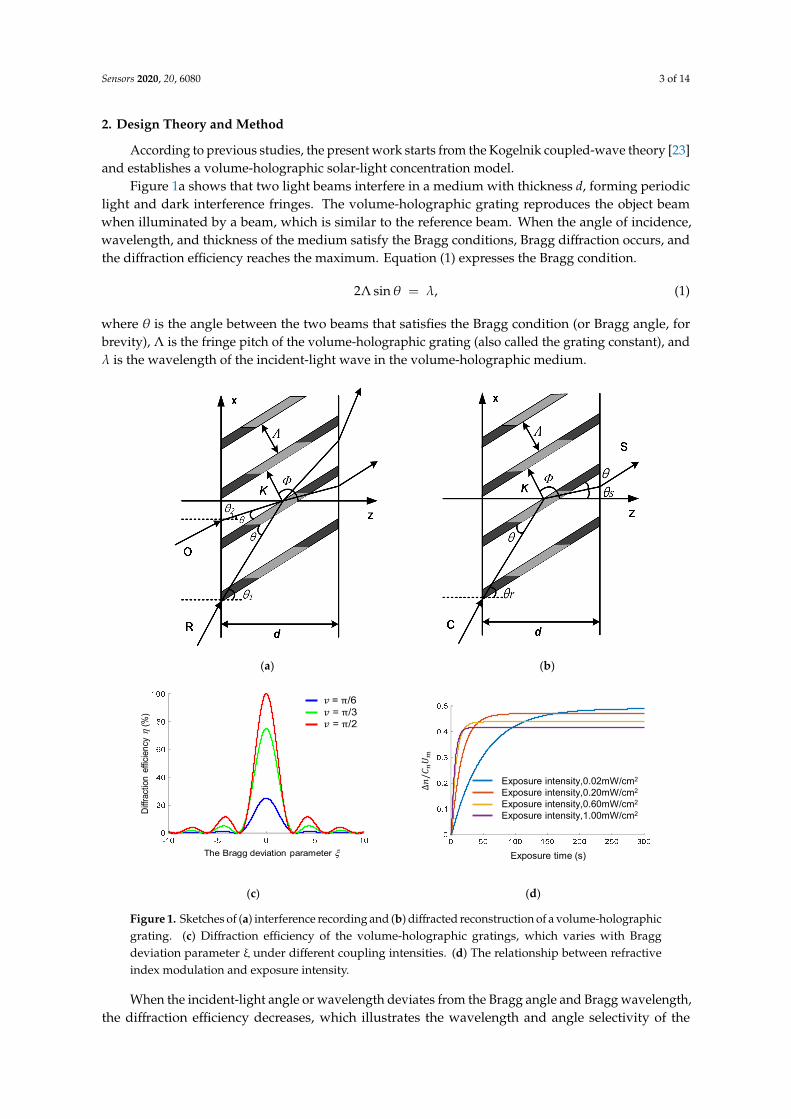
Figure 1a shows that two light beams interfere in a medium with thickness d, forming periodiclight and dark interference fringes. The volume-holographic grating reproduces the object beamwhen illuminated by a beam, which is similar to the reference beam. When the angle of incidence,wavelength, and thickness of the medium satisfy the Bragg conditions, Bragg diffraction occurs, andthe diffraction efficiency reaches the maximum. Equation (1) expresses the Bragg condition.
2Λ sinθ = λ, (1)
where θ is the angle between the two beams that satisfies the Bragg condition (or Bragg angle, forbrevity), Λ is the fringe pitch of the volume-holographic grating (also called the grating constant), andλ is the wavelength of the incident-light wave in the volume-holographic medium.
Sensors 2020, 20, x FOR PEER REVIEW 3 of 14
Figure 1a shows that two light beams interfere in a medium with thickness 𝑑, forming periodic light and dark interference fringes. The volume-holographic grating reproduces the object beam when illuminated by a beam, which is similar to the reference beam. When the angle of incidence, wavelength, and thickness of the medium satisfy the Bragg conditions, Bragg diffraction occurs, and the diffraction efficiency reaches the maximum. Equation (1) expresses the Bragg condition.
2 sinθ λΛ = , (1)
where 𝜃 is the angle between the two beams that satisfies the Bragg condition (or Bragg angle, for brevity), Λ is the fringe pitch of the volume-holographic grating (also called the grating constant), and 𝜆 is the wavelength of the incident-light wave in the volume-holographic medium.
(a) (b)
(c) (d)
Figure 1. Sketches of (a) interference recording and (b) diffracted reconstruction of a volume-holographic grating. (c) Diffraction efficiency of the volume-holographic gratings, which varies with Bragg deviation parameter ξ under different coupling intensities. (d) The relationship between refractive index modulation and exposure intensity.
When the incident-light angle or wavelength deviates from the Bragg angle and Bragg wavelength, the diffraction efficiency decreases, which illustrates the wavelength and angle selectivity of the volume holography. To achieve maximum diffraction efficiency, we use the approximate coupled-wave theory to find the appropriate wavelength and incident angle. Currently, the Kogelnik coupled-wave theory [23] is the most widely used theory for analysing the efficiency of the volume-hologram diffraction. In this theory, volume holography is considered to be the exchange in energy between the diffracted and incident waves. The diffraction efficiency is defined as the ratio
𝑣 = π/6𝑣 = π/3𝑣 = π/2
The Bragg deviation parameter ξ
Diffr
actio
n ef
ficie
ncy
η(%
)
Exposure intensity,0.02mW/cm2
Exposure intensity,0.20mW/cm2
Exposure intensity,0.60mW/cm2
Exposure intensity,1.00mW/cm2
Exposure time (s)
Figure 1. Sketches of (a) interference recording and (b) diffracted reconstruction of a volume-holographicgrating. (c) Diffraction efficiency of the volume-holographic gratings, which varies with Braggdeviation parameter ξ under different coupling intensities. (d) The relationship between refractiveindex modulation and exposure intensity.
When the incident-light angle or wavelength deviates from the Bragg angle and Bragg wavelength,the diffraction efficiency decreases, which illustrates the wavelength and angle selectivity of the

Sensors 2020, 20, 6080 4 of 14
volume holography. To achieve maximum diffraction efficiency, we use the approximate coupled-wavetheory to find the appropriate wavelength and incident angle. Currently, the Kogelnik coupled-wavetheory [23] is the most widely used theory for analysing the efficiency of the volume-hologramdiffraction. In this theory, volume holography is considered to be the exchange in energy between thediffracted and incident waves. The diffraction efficiency is defined as the ratio of the two intensities.According to the Kogelnik coupled-wave theory, the diffraction efficiency is expressed as [23]
ηT =sin2 (v2 + ξ2)
1/2
1 + ξ2/v2 (2)
where parameter ηT is the diffraction efficiency of the volume hologram, ξ = ∆θkd sin(φ− θ0)/2qs −
∆λk2d/8πnqs is the Bragg deviation parameter of the incident reference or object light wave, andv = π∆nd/λ cosθ is the coupling strength between the object and reference light waves in the volumehologram, where ∆n can be obtained by a diffusion model.
Figure 1c shows the diffraction-efficiency curve that varies with Bragg deviation parameter ξwhenν is equal to π/6, π/3 , and π/2 within a period. We can observe that coupling intensity ν affects notonly the gradient but also the peak of the diffraction efficiency. Therefore, after the material selection,the best diffraction efficiency can be obtained by studying the wavelength and angle selectivity.
According to the thickness of the holographic recording medium, the recorded holograms can beclassified into plane and volume holograms, also known as surface and thick holograms, respectively.Distinguished variable Q is expressed as [26]
Q =2πλsdnΛ2 (3)
where λs is the incident-light wavelength in a medium with refractive index n, which is related towavelength λ0 of light in the vacuum according to λs = λ0/n. d is the thickness of the holographicmaterial substrate. When Q ≥ 10 the recorded hologram is a volume hologram; otherwise, it is aplane hologram.
We employ the first-order monomer diffusion model proposed by Piazzolla et al. [24] toquantitatively describe the influence of each parameter on the recording process. The analyticalformula for the refractive-index modulation is expressed as follows:
∆n(t) =mτ∆nM
τD + τ
{1− exp
{γ[1− exp
( tτ
)]}−
τDγ
τDγ+ τ
[1− exp(−
τDγ+ τ
τDγt)]}
(4)
where ∆nM = CnδUm represents the maximum amplitude of the grating modulation. Um is the initialmonomer concentration, and Cn, m, and γ are constants. k0 represents the polymerisation coefficient.τ = 1/ϕIδ denotes the polymerisation time constant. τD is the diffusion time constant. Parameters δand ϕ are constants whose values are related to the material, and I is the exposure intensity. It can beseen from v = π∆nd/λ cosθ that the coupling strength v is related to the refractive index modulationdegree, and from Equation (4), the refractive index modulation degree is related to the exposureintensity, the polymerization coefficient and the diffusion time constant. Because polymerizationcoefficient and diffusion time constant are unique properties of polymers, the degree of refractive indexmodulation can be changed by changing the exposure intensity. After the relevant material parametersare determined, the relationship curve between refractive index modulation and exposure intensity isshown in Figure 1d. When the exposure intensity is high, the saturation refractive index modulationdecreases; when the exposure intensity is small, the saturation refractive index modulation of thepolymer increases.
In this study, Bayfol HX200 [27–29] is used as the volume-holographic recording material, whosethickness is 16 ± 2 µm. The average refractive index at 532-nm wavelength is 1.5. The sensitivewavelength of the material covers the range from 400 to 700 nm, which is suitable for solar-light
Sensors 2020, 20, 6080 5 of 14
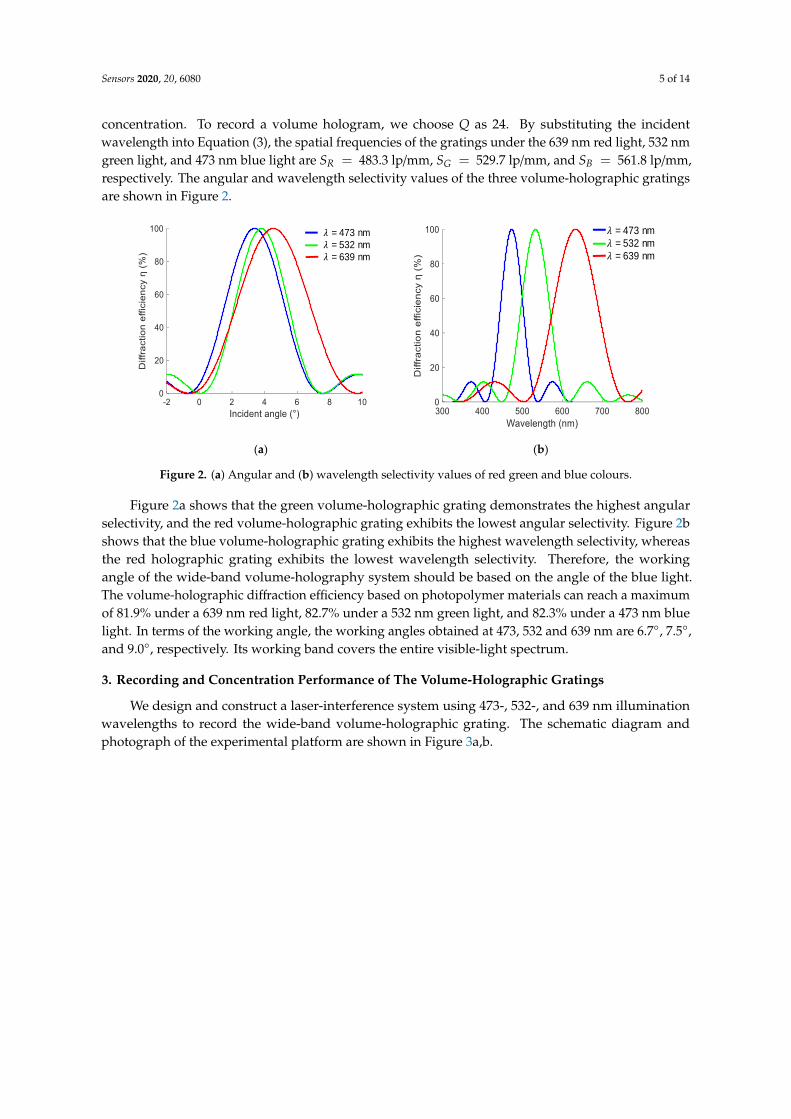
concentration. To record a volume hologram, we choose Q as 24. By substituting the incidentwavelength into Equation (3), the spatial frequencies of the gratings under the 639 nm red light, 532 nmgreen light, and 473 nm blue light are SR = 483.3 lp/mm, SG = 529.7 lp/mm, and SB = 561.8 lp/mm,respectively. The angular and wavelength selectivity values of the three volume-holographic gratingsare shown in Figure 2.
Sensors 2020, 20, x FOR PEER REVIEW 5 of 14
𝜆 = 473 nm
𝜆 = 532 nm
𝜆 = 639 nm
𝜆 = 473 nm
𝜆 = 532 nm
𝜆 = 639 nm
(a) (b)
Figure 2. (a) Angular and (b) wavelength selectivity values of red green and blue colours.
Figure 2a shows that the green volume-holographic grating demonstrates the highest angular
selectivity, and the red volume-holographic grating exhibits the lowest angular selectivity. Figure 2b
shows that the blue volume-holographic grating exhibits the highest wavelength selectivity, whereas
the red holographic grating exhibits the lowest wavelength selectivity. Therefore, the working angle
of the wide-band volume-holography system should be based on the angle of the blue light. The
volume-holographic diffraction efficiency based on photopolymer materials can reach a maximum
of 81.9% under a 639 nm red light, 82.7% under a 532 nm green light, and 82.3% under a 473 nm blue
light. In terms of the working angle, the working angles obtained at 473, 532 and 639 nm are 6.7°, 7.5°,
and 9.0°, respectively. Its working band covers the entire visible-light spectrum.
3. Recording and Concentration Performance of The Volume-Holographic Gratings
We design and construct a laser-interference system using 473-, 532-, and 639 nm illumination
wavelengths to record the wide-band volume-holographic grating. The schematic diagram and
photograph of the experimental platform are shown in Figure 3a,b.
B:473 nm
HWP1 HWP2
M
PBS SF2
SF1
EL
D
D
S1
PS
RS2
RS1
R:639 nm
G:532 nm
AS1
AS2
AS3
S2
S3
M
M
DM1
DM2
S1 opens: S2 opens: S3 opens: The trichromatic VHG
(a)
(b)
Figure 2. (a) Angular and (b) wavelength selectivity values of red green and blue colours.
Figure 2a shows that the green volume-holographic grating demonstrates the highest angularselectivity, and the red volume-holographic grating exhibits the lowest angular selectivity. Figure 2bshows that the blue volume-holographic grating exhibits the highest wavelength selectivity, whereasthe red holographic grating exhibits the lowest wavelength selectivity. Therefore, the workingangle of the wide-band volume-holography system should be based on the angle of the blue light.The volume-holographic diffraction efficiency based on photopolymer materials can reach a maximumof 81.9% under a 639 nm red light, 82.7% under a 532 nm green light, and 82.3% under a 473 nm bluelight. In terms of the working angle, the working angles obtained at 473, 532 and 639 nm are 6.7◦, 7.5◦,and 9.0◦, respectively. Its working band covers the entire visible-light spectrum.
3. Recording and Concentration Performance of The Volume-Holographic Gratings
We design and construct a laser-interference system using 473-, 532-, and 639 nm illuminationwavelengths to record the wide-band volume-holographic grating. The schematic diagram andphotograph of the experimental platform are shown in Figure 3a,b.
Sensors 2020, 20, 6080 6 of 14
Sensors 2020, 20, x FOR PEER REVIEW 5 of 14
(a) (b)
Figure 2. (a) Angular and (b) wavelength selectivity values of red green and blue colours.
Figure 2a shows that the green volume-holographic grating demonstrates the highest angular selectivity, and the red volume-holographic grating exhibits the lowest angular selectivity. Figure 2b shows that the blue volume-holographic grating exhibits the highest wavelength selectivity, whereas the red holographic grating exhibits the lowest wavelength selectivity. Therefore, the working angle of the wide-band volume-holography system should be based on the angle of the blue light. The volume-holographic diffraction efficiency based on photopolymer materials can reach a maximum of 81.9% under a 639 nm red light, 82.7% under a 532 nm green light, and 82.3% under a 473 nm blue light. In terms of the working angle, the working angles obtained at 473, 532 and 639 nm are 6.7°, 7.5°, and 9.0°, respectively. Its working band covers the entire visible-light spectrum.
3. Recording and Concentration Performance of The Volume-Holographic Gratings
We design and construct a laser-interference system using 473-, 532-, and 639 nm illumination wavelengths to record the wide-band volume-holographic grating. The schematic diagram and photograph of the experimental platform are shown in Figure 3a,b.
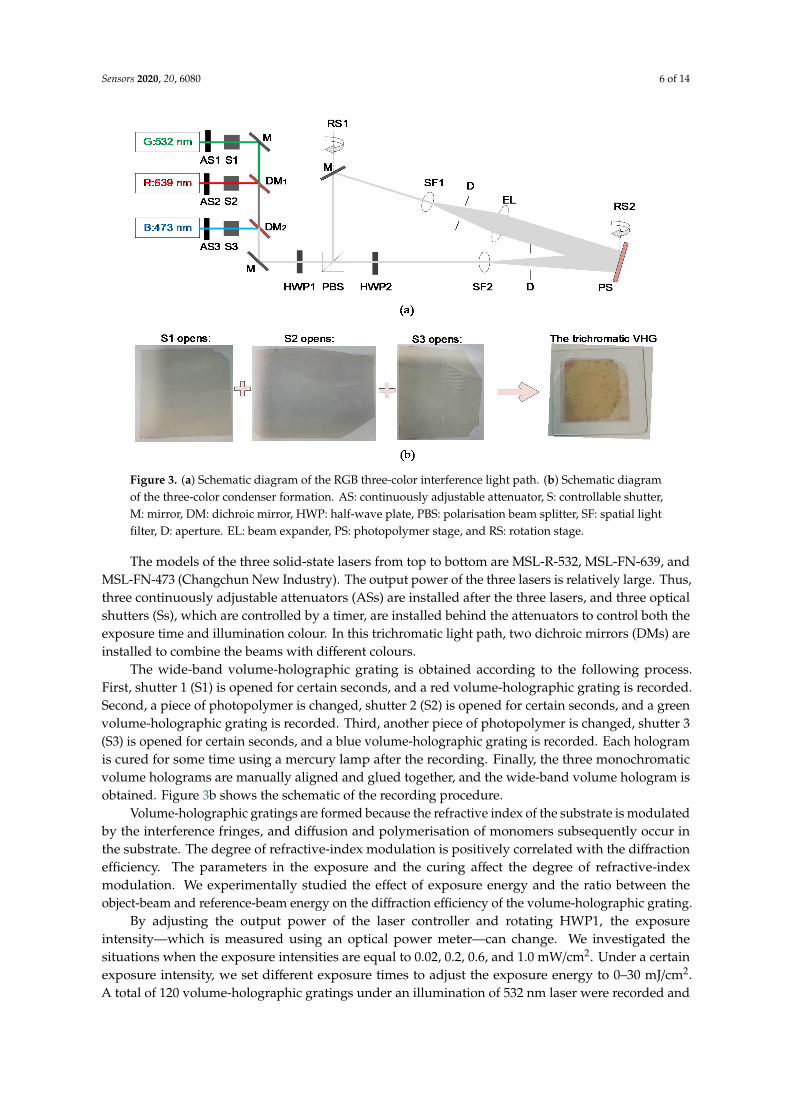
Figure 3. (a) Schematic diagram of the RGB three-color interference light path. (b) Schematic diagramof the three-color condenser formation. AS: continuously adjustable attenuator, S: controllable shutter,M: mirror, DM: dichroic mirror, HWP: half-wave plate, PBS: polarisation beam splitter, SF: spatial lightfilter, D: aperture. EL: beam expander, PS: photopolymer stage, and RS: rotation stage.
The models of the three solid-state lasers from top to bottom are MSL-R-532, MSL-FN-639, andMSL-FN-473 (Changchun New Industry). The output power of the three lasers is relatively large. Thus,three continuously adjustable attenuators (ASs) are installed after the three lasers, and three opticalshutters (Ss), which are controlled by a timer, are installed behind the attenuators to control both theexposure time and illumination colour. In this trichromatic light path, two dichroic mirrors (DMs) areinstalled to combine the beams with different colours.
The wide-band volume-holographic grating is obtained according to the following process.First, shutter 1 (S1) is opened for certain seconds, and a red volume-holographic grating is recorded.Second, a piece of photopolymer is changed, shutter 2 (S2) is opened for certain seconds, and a greenvolume-holographic grating is recorded. Third, another piece of photopolymer is changed, shutter 3(S3) is opened for certain seconds, and a blue volume-holographic grating is recorded. Each hologramis cured for some time using a mercury lamp after the recording. Finally, the three monochromaticvolume holograms are manually aligned and glued together, and the wide-band volume hologram isobtained. Figure 3b shows the schematic of the recording procedure.
Volume-holographic gratings are formed because the refractive index of the substrate is modulatedby the interference fringes, and diffusion and polymerisation of monomers subsequently occur inthe substrate. The degree of refractive-index modulation is positively correlated with the diffractionefficiency. The parameters in the exposure and the curing affect the degree of refractive-indexmodulation. We experimentally studied the effect of exposure energy and the ratio between theobject-beam and reference-beam energy on the diffraction efficiency of the volume-holographic grating.
By adjusting the output power of the laser controller and rotating HWP1, the exposureintensity—which is measured using an optical power meter—can change. We investigated thesituations when the exposure intensities are equal to 0.02, 0.2, 0.6, and 1.0 mW/cm2. Under a certainexposure intensity, we set different exposure times to adjust the exposure energy to 0–30 mJ/cm2.A total of 120 volume-holographic gratings under an illumination of 532 nm laser were recorded and
Sensors 2020, 20, 6080 7 of 14
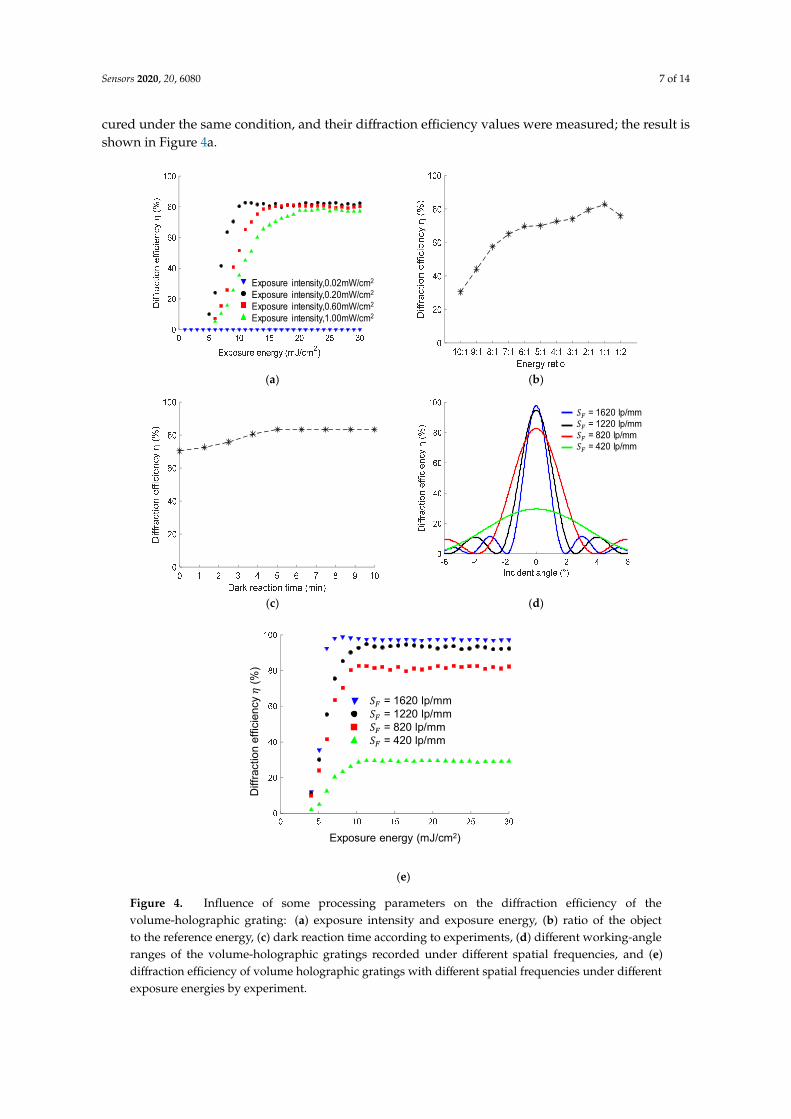
cured under the same condition, and their diffraction efficiency values were measured; the result isshown in Figure 4a.
Sensors 2020, 20, x FOR PEER REVIEW 7 of 14
object and reference beams corresponding to the spatial frequencies of 420, 820, 1220, and 1620. The results are shown in Figure 4d. By rotating RS1 and adjusting the follow-up optical path, different spatial frequencies can be obtained and the diffraction efficiency of the recorded holographic gratings are tested under different exposure energies, the result of which is shown in Figure 4e. The measured maximum diffraction efficiency of volume holographic gratings with four different spatial frequencies are in accordance with the simulated results in Figure 4d.
Exposure intensity,0.02mW/cm2
Exposure intensity,0.20mW/cm2
Exposure intensity,0.60mW/cm2
Exposure intensity,1.00mW/cm2
(a) (b)
𝑆 = 1620 lp/mm𝑆 = 1220 lp/mm𝑆 = 820 lp/mm𝑆 = 420 lp/mm
(c) (d)
(e)
Figure 4. Influence of some processing parameters on the diffraction efficiency of the volume-holographic grating: (a) exposure intensity and exposure energy, (b) ratio of the object to the reference energy, (c) dark reaction time according to experiments, (d) different working-angle ranges of the volume-holographic gratings recorded under different spatial frequencies, and (e) diffraction
SF=1220lp/mmSF=820lp/mmExposure intensity,1.00mW/cm2
= 1620 lp/mm= 1220 lp/mm= 820 lp/mm= 420 lp/mm
Exposure energy (mJ/cm2)
Diff
ract
ion
effic
ienc
y (%
)
Figure 4. Influence of some processing parameters on the diffraction efficiency of thevolume-holographic grating: (a) exposure intensity and exposure energy, (b) ratio of the objectto the reference energy, (c) dark reaction time according to experiments, (d) different working-angleranges of the volume-holographic gratings recorded under different spatial frequencies, and (e)diffraction efficiency of volume holographic gratings with different spatial frequencies under differentexposure energies by experiment.

Sensors 2020, 20, 6080 8 of 14
The ratio between the object-beam and reference-beam energy is adjusted by rotating HWP1,from 10:1 to 1:2. Different volume-holographic gratings illuminated by 532 nm laser were recordedand cured under different energy ratios. The relationship between the diffraction efficiency of thevolume-holographic gratings and energy ratio is shown in Figure 4b, which shows that when theratio of the light intensity of the object and reference light paths gradually decreases, the diffractionefficiency value of the volume hologram gradually increases. The diffraction efficiency reaches themaximum when the light-intensity ratio of the two beam paths is 1:1.
The dark reaction time, which is the time between the recording and curing, can also affect thediffraction efficiency. We change the dark reaction time in the production procedure and study theeffect of the dark reaction time on the diffraction efficiency; the result is shown in Figure 4c. Whenthe dark reaction time is zero, the curing process is directly performed after the interference exposure.Under this situation, the volume-hologram diffraction efficiency is approximately 70%. When the darkreaction time increases, the diffraction efficiency gradually increases. When the dark reaction time isapproximately 5 min, the diffraction efficiency of the polymer material reaches the maximum valueand remains stable with the continuous increase in the dark reaction time, which indicates that therefractive-index modulation is saturated.
The spatial frequency, which is determined by the angle between the object and reference beams,also affect the diffraction efficiency of the volume-holographic grating. We use Equation (2) to calculatethe diffraction efficiency of the volume-holographic grating under different monochromatic incidentangles, and the volume-holographic grating is recorded according to the angles between the objectand reference beams corresponding to the spatial frequencies of 420, 820, 1220, and 1620. The resultsare shown in Figure 4d. By rotating RS1 and adjusting the follow-up optical path, different spatialfrequencies can be obtained and the diffraction efficiency of the recorded holographic gratings aretested under different exposure energies, the result of which is shown in Figure 4e. The measuredmaximum diffraction efficiency of volume holographic gratings with four different spatial frequenciesare in accordance with the simulated results in Figure 4d.
Figure 4a shows the experimental results under different exposure intensities on the diffractionefficiency. The selected exposure intensities are 0.02, 0.2, 0.6, and 1.0 mW/cm2. We can observethat the change trend in the diffraction efficiency is consistent with the simulation results. Higherdiffraction efficiency can be achieved at lower exposure intensity. However, with the increase in theexposure intensity, the diffraction efficiency of the volume hologram becomes the largest. The valueis reduced; thus, the diffraction efficiency obtained through the experiment is 0.2 mW/cm2, and thediffraction efficiency becomes the best. At this time, the maximum diffraction efficiency value is 82.7%.Subsequent experiments are conducted at this exposure intensity.
Our result reveals that the larger the spatial frequency is, the larger is the diffraction efficiency ofthe volume hologram. When the spatial frequency is 820 lp/mm, the maximum diffraction efficiencyis 82.7%, and the working angle is 7.5◦. As the spatial frequency increases, although the diffractionefficiency also increases, the working-angle range becomes significantly small. Therefore, a larger spatialfrequency is not conducive for the application of volume-holographic gratings for the condensation ofa solar-concentration system. In our case, we choose a spatial-frequency value of 820 lp/mm, whichcorresponds to an intersection angle of 7.5◦ between the reference and object beams. We adjust theangle using a manual rotation stage.
According to the aforementioned discussions, to obtain volume-holographic gratings with highdiffraction efficiency, the exposure intensity under a uniform light intensity is 0.2 mW/cm2, that is, theexposure intensities of the reference-light and object-light paths are both 0.1 mW/cm2, and the anglebetween the two beam paths is adjusted to 7.5◦ so that the spatial frequency is 820 lp/mm. The threemonochromatic volume-holographic gratings are recorded at the same grating spatial frequency;thus, the angle between the two beam paths remains unchanged. The dark reaction time is 5 min.The working angle of the trichromatic volume-holographic grating is 6.7◦, which is equal to that of
Sensors 2020, 20, 6080 9 of 14
the blue volume-holographic grating. The working band is the visible band, that is, the trichromaticvolume-hologram diffraction reproduces the concentrated sunlight.
4. Results
To characterise the optical properties of the monochromatic volume-holographic gratings,we illuminate them using the corresponding three monochromatic lasers used for the recording.To characterise the optical properties of the cohesive trichromatic volume-holographic grating, weilluminate it using the combined beam of the three monochromatic lasers used for the recording andusing sunlight.
4.1. Optical Properties of The Monochromatic Volume-Holographic Gratings Illuminated by The CorrespondingThree Recording Lasers
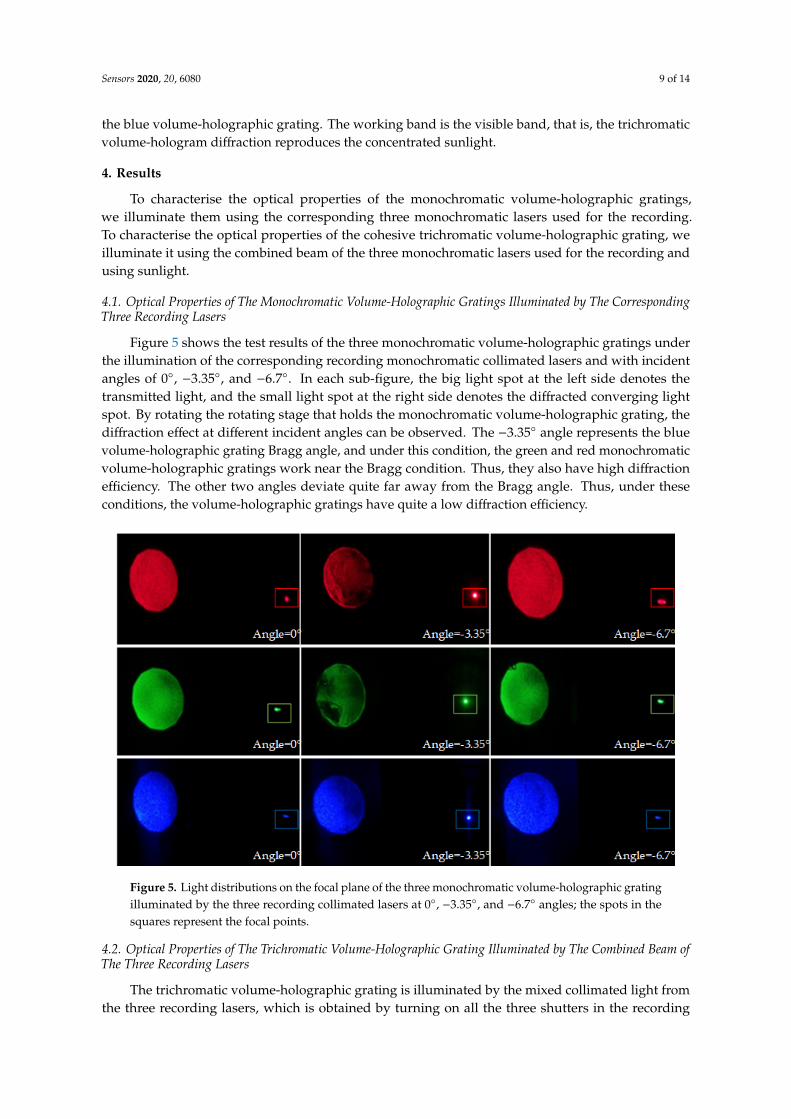
Figure 5 shows the test results of the three monochromatic volume-holographic gratings underthe illumination of the corresponding recording monochromatic collimated lasers and with incidentangles of 0◦, −3.35◦, and −6.7◦. In each sub-figure, the big light spot at the left side denotes thetransmitted light, and the small light spot at the right side denotes the diffracted converging lightspot. By rotating the rotating stage that holds the monochromatic volume-holographic grating, thediffraction effect at different incident angles can be observed. The −3.35◦ angle represents the bluevolume-holographic grating Bragg angle, and under this condition, the green and red monochromaticvolume-holographic gratings work near the Bragg condition. Thus, they also have high diffractionefficiency. The other two angles deviate quite far away from the Bragg angle. Thus, under theseconditions, the volume-holographic gratings have quite a low diffraction efficiency.Sensors 2020, 20, x FOR PEER REVIEW 9 of 14
Figure 5. Light distributions on the focal plane of the three monochromatic volume-holographic grating illuminated by the three recording collimated lasers at 0°, −3.35°, and −6.7° angles; the spots in the squares represent the focal points.
4.2. Optical Properties of The Trichromatic Volume-Holographic Grating Illuminated by The Combined Beam of The Three Recording Lasers
The trichromatic volume-holographic grating is illuminated by the mixed collimated light from the three recording lasers, which is obtained by turning on all the three shutters in the recording optical path. By rotating the rotation stage that holds the trichromatic volume-holographic grating, the diffraction effect at different incident angles can be observed, and the diffraction efficiency can be measured using an optical power meter. The result is shown in Figure 6a. Figure 6a also shows the simulated relationship between the diffraction efficiency and incident angle, which is quite consistent with the experiment result. It also shows that the working angle of the single-layer RGB volume-holographic grating is 6.7°. At an incident angle of −3.35°, the diffraction efficiency reaches the maximum value of 55.7%. The light distribution on the focal plane at the incident angle of −3.35° is captured and shown in Figure 6b. The light spot next to the focus point in Figure 6b is caused by the chromatic dispersion of monochromatic volume holographic gratings. A charge-coupled device (MV-EM510M; pixel pitch = 3.45 μm) is used to image the focal spot and measure its size. The focal spot occupies approximately 408 pixels on the sensor plane, which corresponds to a diameter of 0.704 mm. The geometric focusing ratio is calculated using the ratio of the focal-spot area to the incident-beam area, i.e., 𝛲 = 𝑆 / 𝑆 = 149.2. The average light energy utilisation rate in this angle range is 26.54%.
Figure 5. Light distributions on the focal plane of the three monochromatic volume-holographic gratingilluminated by the three recording collimated lasers at 0◦, −3.35◦, and −6.7◦ angles; the spots in thesquares represent the focal points.
4.2. Optical Properties of The Trichromatic Volume-Holographic Grating Illuminated by The Combined Beam ofThe Three Recording Lasers
The trichromatic volume-holographic grating is illuminated by the mixed collimated light fromthe three recording lasers, which is obtained by turning on all the three shutters in the recording

Sensors 2020, 20, 6080 10 of 14
optical path. By rotating the rotation stage that holds the trichromatic volume-holographic grating,the diffraction effect at different incident angles can be observed, and the diffraction efficiency canbe measured using an optical power meter. The result is shown in Figure 6a. Figure 6a also showsthe simulated relationship between the diffraction efficiency and incident angle, which is quiteconsistent with the experiment result. It also shows that the working angle of the single-layer RGBvolume-holographic grating is 6.7◦. At an incident angle of −3.35◦, the diffraction efficiency reachesthe maximum value of 55.7%. The light distribution on the focal plane at the incident angle of −3.35◦
is captured and shown in Figure 6b. The light spot next to the focus point in Figure 6b is caused bythe chromatic dispersion of monochromatic volume holographic gratings. A charge-coupled device(MV-EM510M; pixel pitch = 3.45 µm) is used to image the focal spot and measure its size. The focal spotoccupies approximately 408 pixels on the sensor plane, which corresponds to a diameter of 0.704 mm.The geometric focusing ratio is calculated using the ratio of the focal-spot area to the incident-beamarea, i.e., P = S0/ S′0 = 149.2. The average light energy utilisation rate in this angle range is 26.54%.Sensors 2020, 20, x FOR PEER REVIEW 10 of 14
Figure 6. (a) Relationship between the working angle and diffraction efficiency of the trichromatic volume-holographic grating. (b) Light distribution on the focal plane of the trichromatic volume-holographic grating at an incident angle of −3.35° illuminated by the combined three laser beams. Inside the red square is the focal spot.
4.3. Optical Characteristics of The Trichromatic Volume-Holographic Grating Illuminated by Sunlight
We place the trichromatic volume-holographic grating under sunlight to test its convergence performance. The trichromatic volume-holographic grating is rotated so that we can determine the Bragg condition by observing the light distributions on the focal plane, as shown in Figure 7a,b. Under the Bragg condition, the diffracted light spot is the smallest and brightest, as shown in Figure 7a. The convergent white light spot shown in Figure 7a is approximately a rectangle whose length and width are approximately 5.7 and 1.5 mm, respectively. Then, the geometric concentration ratio under sunlight can be calculated using the ratio of the focal-spot area to the incident-beam area, i.e., 𝛲 = 𝑆 / 𝑆 = 27.2. The average light energy utilization rate of the condenser under the sunlight measured by using an optical power meter (Newport No.840-C) is 21.01%.
Figure 6. (a) Relationship between the working angle and diffraction efficiency of the trichromaticvolume-holographic grating. (b) Light distribution on the focal plane of the trichromaticvolume-holographic grating at an incident angle of −3.35◦ illuminated by the combined three laserbeams. Inside the red square is the focal spot.
4.3. Optical Characteristics of The Trichromatic Volume-Holographic Grating Illuminated by Sunlight
We place the trichromatic volume-holographic grating under sunlight to test its convergenceperformance. The trichromatic volume-holographic grating is rotated so that we can determine theBragg condition by observing the light distributions on the focal plane, as shown in Figure 7a,b. Underthe Bragg condition, the diffracted light spot is the smallest and brightest, as shown in Figure 7a.The convergent white light spot shown in Figure 7a is approximately a rectangle whose length andwidth are approximately 5.7 and 1.5 mm, respectively. Then, the geometric concentration ratiounder sunlight can be calculated using the ratio of the focal-spot area to the incident-beam area, i.e.,P′ = S0/ S′1 = 27.2. The average light energy utilization rate of the condenser under the sunlightmeasured by using an optical power meter (Newport No.840-C) is 21.01%.

Sensors 2020, 20, 6080 11 of 14
Sensors 2020, 20, x FOR PEER REVIEW 10 of 14
Figure 6. (a) Relationship between the working angle and diffraction efficiency of the trichromatic volume-holographic grating. (b) Light distribution on the focal plane of the trichromatic volume-holographic grating at an incident angle of −3.35° illuminated by the combined three laser beams. Inside the red square is the focal spot.
4.3. Optical Characteristics of The Trichromatic Volume-Holographic Grating Illuminated by Sunlight
We place the trichromatic volume-holographic grating under sunlight to test its convergence performance. The trichromatic volume-holographic grating is rotated so that we can determine the Bragg condition by observing the light distributions on the focal plane, as shown in Figure 7a,b. Under the Bragg condition, the diffracted light spot is the smallest and brightest, as shown in Figure 7a. The convergent white light spot shown in Figure 7a is approximately a rectangle whose length and width are approximately 5.7 and 1.5 mm, respectively. Then, the geometric concentration ratio under sunlight can be calculated using the ratio of the focal-spot area to the incident-beam area, i.e., 𝛲 = 𝑆 / 𝑆 = 27.2. The average light energy utilization rate of the condenser under the sunlight measured by using an optical power meter (Newport No.840-C) is 21.01%.
Figure 7. (a) Schematic diagram of the samples illuminated by sunlight. Light distribution on the focalplane of the trichromatic volume-holographic grating illuminated by sunlight under (b) the Braggcondition and (c) a small deviation from the Bragg condition.
We characterise the working wavelength range by measuring the transmission rate of thetrichromatic volume-holographic grating using a spectrophotometer (Hitachi U-4100). The result isshown in Figure 8.
Sensors 2020, 20, x FOR PEER REVIEW 11 of 14
Figure 7. (a) Schematic diagram of the samples illuminated by sunlight. Light distribution on the focal plane of the trichromatic volume-holographic grating illuminated by sunlight under (b) the Bragg condition and (c) a small deviation from the Bragg condition.
We characterise the working wavelength range by measuring the transmission rate of the trichromatic volume-holographic grating using a spectrophotometer (Hitachi U-4100). The result is shown in Figure 8.
Figure 8. Relationship between the diffraction efficiency and working wavelength of the trichromatic volume-holographic grating.
Figure 8 shows that the single-layer cohesive RGB volume-holographic grating has an effective spectral range of 400–700 nm, which covers most of the visible-light band. The maximum value of the diffraction efficiency in the visible band is approximately 500 nm. When the wavelength is more than 500 nm, the diffraction efficiency gradually decreases with the increase in the wavelength, and the diffraction efficiency in the visible band exhibits quite high diffraction efficiency.
4.4. Discussion
Compared with previous work, it can be seen from Table 1 that the proposed trichromatic volume holographic grating has the highest concentration ratio and relatively high light energy utilization rate. Although the trichromatic volume-holographic grating can reproduce sunlight, the result is not perfect because the light spot is quite red. There are still diffraction spots when one color light illuminates the different color holographic gratings. And the diffraction efficiency of the trichromatic holographic grating is larger under the red-light illumination than that under blue and green light illumination. These lead the result shown in Figure 7, i.e., the central spot is reddish and there are diffraction spots with less efficiency around the central spot. This phenomenon may be caused by the mutual interference between the three-color monomer molecules in the photopolymer material. Therefore, in the future, if photopolymer materials are used to record the volume-holographic gratings for sunlight concentration, the three-color monomer molecules in the polymer should be optimised so that the wide-band volume-holographic condensing system becomes more effective in reproducing sunlight. Furthermore, a multi-layer concentrating system can be constructed according to our present work to obtain large working-angle solar concentrators.
Table 1. Light energy utilization and concentration ratio of different structures.
Structure Light Energy
Utilization(%) Concentration
Ratio by Bianco et al. [3] 13.83 5.85 by Lee et al. [18] 18.22 15
by Castro et al. [6] 50 1.5 by Akbari et al. [11] 18.64 20
Figure 8. Relationship between the diffraction efficiency and working wavelength of the trichromaticvolume-holographic grating.
Figure 8 shows that the single-layer cohesive RGB volume-holographic grating has an effectivespectral range of 400–700 nm, which covers most of the visible-light band. The maximum value of thediffraction efficiency in the visible band is approximately 500 nm. When the wavelength is more than500 nm, the diffraction efficiency gradually decreases with the increase in the wavelength, and thediffraction efficiency in the visible band exhibits quite high diffraction efficiency.
4.4. Discussion
Compared with previous work, it can be seen from Table 1 that the proposed trichromatic volumeholographic grating has the highest concentration ratio and relatively high light energy utilizationrate. Although the trichromatic volume-holographic grating can reproduce sunlight, the result is

Sensors 2020, 20, 6080 12 of 14
not perfect because the light spot is quite red. There are still diffraction spots when one color lightilluminates the different color holographic gratings. And the diffraction efficiency of the trichromaticholographic grating is larger under the red-light illumination than that under blue and green lightillumination. These lead the result shown in Figure 7, i.e., the central spot is reddish and there arediffraction spots with less efficiency around the central spot. This phenomenon may be caused bythe mutual interference between the three-color monomer molecules in the photopolymer material.Therefore, in the future, if photopolymer materials are used to record the volume-holographic gratingsfor sunlight concentration, the three-color monomer molecules in the polymer should be optimised sothat the wide-band volume-holographic condensing system becomes more effective in reproducingsunlight. Furthermore, a multi-layer concentrating system can be constructed according to our presentwork to obtain large working-angle solar concentrators.
Table 1. Light energy utilization and concentration ratio of different structures.
Structure Light Energy Utilization(%) Concentration Ratio
by Bianco et al. [3] 13.83 5.85
by Lee et al. [18] 18.22 15
by Castro et al. [6] 50 1.5
by Akbari et al. [11] 18.64 20
the proposed trichromatic volumeholographic grating
21.01 27.2
5. Conclusions
To solve the problem of high cost in the current conventional solar-concentration technologydue to the tracking system, we propose a new wide-band solar-concentration technology basedon volume holography. We use the Kogelnik coupled-wave theory and a photopolymer monomerdiffusion model to investigate the diffraction principle of volume holography and obtain the mainfactors that affect its diffraction efficiency, namely, spatial frequency, exposure intensity, polymerisationcoefficient, and diffusion time constant. Through theoretical analysis and calculation of the diffractionefficiency of a trichromatic volume-holographic grating, a laser-interference optical path with centrewavelengths of 473, 532, and 639 nm was constructed to fabricate a wide-band volume-holographicgrating. The samples were recorded under the following best recording conditions: the exposureintensity under uniform light intensity is 0.2 mW/cm2, the spatial frequency is 820 lp/mm by adjustingthe angle of the two light paths, and the dark reaction time is 5 min. The experimental results reveal thatthe single-layer trichromatic holographic grating under the illumination of the three recording lasersexhibits a concentration ratio of 149.2, a maximum diffraction efficiency of 55.7%, a working angle of6.7◦, and a light-energy utilisation rate of 26.54% within the working angle range. When the grating isunder sunlight, the concentration ratio is 27.2, which is also quite high, and a light-energy utilisationrate of 21.01%. The working band is visible light. This work provides an idea for a plane concentrationsystem, and the large-angle and wide-band characteristics reduce the cost of solar-energy collection.
Author Contributions: Conceptualization, writing, review and supervision J.M., writing, software, validationand editing, C.W., Methodology and validation, H.K., software, T.W., writing, review, editing and supervision, P.S.All authors have read and agreed to the published version of the manuscript.
Funding: This research is supported by Shenzhen International Collaboration Fund (GJHZ20190821164405428)and the Basic Research Program of Shenzhen (JCYJ20170412171744267).
Conflicts of Interest: The authors declare no conflict of interest.
References
1. Ludman, J.E. Holographic solar concentrator. Appl. Opt. 1982, 21, 3057–3058. [CrossRef] [PubMed]

Sensors 2020, 20, 6080 13 of 14
2. Stojanoff, C.G.; Schutte, H.; Schulat, J.; Kubiza, R.; Froning, P. Fabrication of large format hologramsin dichromated gelatin films for sun control and solar concentrators. In Proceedings of the SPIE—TheInternational Society for Optical Engineering, San Jose, CA, USA, 12–13 February 1997; Volume 3010,pp. 156–167.
3. Xuechang, R.; Shou, L.; Xiangsu, Z.; Xiaoyun, C. Fabrication of holographic Fresnel lens used assolar concentrator. In Proceedings of the SPIE—Holography and Diffractive Optics III, Beijing, China,12–14 November 2007; Sheng, Y., Hsu, D.S., Yu, C.X., Eds.; 2008; Volume 6832, p. N8321.
4. Castro, J.M.; Zhang, D.; Myer, B.; Kostuk, R.K. Energy collection efficiency of holographic planar solarconcentrators. Appl. Opt. 2010, 49, 858–870. [CrossRef] [PubMed]
5. Hung, J.; Chan, P.S.; Sun, C.; Ho, C.W.; Tam, W.Y. Doubly slanted layer structures in holographic gelatinemulsions: Solar concentrators. J. Opt. 2010, 12. [CrossRef]
6. Castillo, J.E.; Russo, J.M.; Kostuk, R.K.; Rosenberg, G.A. Thermal effects of the extended holographic regionsfor holographic planar concentrator. J. Photonics Energy 2011, 1, 015504. [CrossRef]
7. Hsieh, M.-L.; Lin, S.-H.; Hsu, K.Y.; Burr, J.A.; Lin, S.-Y. An efficient solar concentrator using volume hologram.In Proceedings of the SPIE— the 2011 Conference on Lasers and Electro-Optics, Baltimore, MD, USA,1–6 May 2011.
8. Iurevych, O.; Gubin, S.; Dudeck, M. Combined receiver of solar radiation with holographic planar concentrator.In Proceedings of the 1st International Symposium on Electrical Arc and Thermal Plasmas in Africa,Ouagadougou, Burkina Faso, 17–22 October 2011; Volume 29.
9. Chemisana, D.; Victoria Collados, M.; Quintanilla, M.; Atencia, J. Holographic lenses for building integratedconcentrating photovoltaics. Appl. Energy 2013, 110, 227–235. [CrossRef]
10. Zhang, D.; Gordon, M.; Russo, J.M.; Vorndran, S.; Kostuk, R.K. Spectrum-splitting photovoltaic system usingtransmission holographic lenses. J. Photonics Energy 2013, 3, 034597. [CrossRef]
11. Akbari, H.; Naydenova, I.; Martin, S. Using acrylamide-based photopolymers for fabrication of holographicoptical elements in solar energy applications. Appl. Opt. 2014, 53, 1343–1353. [CrossRef]
12. Bianco, G.; Ferrara, M.A.; Borbone, F.; Roviello, A.; Striano, V.; Coppola, G. Photopolymer-based volumeholographic optical elements: Design and possible applications. J. Eur. Opt. Soc. Rapid Publ. 2015, 10.[CrossRef]
13. Ghosh, A.; Nirala, A.K.; Yadav, H.L. Dependence of wavelength selectivity of holographic PV concentratoron processing parameters. Optik 2015, 126, 622–625. [CrossRef]
14. Lee, J.-H.; Wu, H.-Y.; Piao, M.-L.; Kim, N. Holographic solar energy concentrator using angular multiplexedand iterative recording method. IEEE Photonics J. 2016, 8. [CrossRef]
15. Ludman, J.E.; Riccobono, J.; Semenova, I.V.; Reinhand, N.O.; Tai, W.; Li, X.L.; Syphers, G.; Rallis, E.; Sliker, G.;Martin, J. The optimization of a holographic system for solar power generation. Sol. Energy 1997, 60, 1–9.[CrossRef]
16. Ferrara, M.A.; Striano, V.; Coppola, G. Volume holographic optical elements as solar concentrators:An Overview. Appl. Sci. 2019, 9, 193. [CrossRef]
17. Sam, T.L.S.; Kumar, P.T.A. Wavelength response analysis and optimization of photopolymer volumeholographic elements for Solar energy applications. Adv. Opt. Sci. Eng. 2017, 194, 149–155.
18. Sunita, D.; Matthew, E.; Emily, C.W. Simulation and partial prototyping of an eight-junction holographicspectrum-splitting photovoltaic module. Energy Sci. Eng. 2019, 7, 2572–2584.
19. Wu, Y.; Chrysler, B.; Pelaez, S.A.; Kostuk, R.K. Design and optimization of cascaded DCG based holographicelements for spectrum-splitting PV systems. In Proceedings of the SPIE— Nonimaging Optics: EfficientDesign for Illumination and Solar Concentration XIV; International Society for Optics and Photonics,San Diego, CA, USA, 6–7 August 2017; Volume 10379.
20. Marín-Sáez, J.; Collados, M.V.; Chemisana, D. Energy analysis of holographic lenses for solar concentration.In Proceedings of the SPIE—Holography: Advances and Modern Trends V; International Society for Opticsand Photonics, Prague, CZECH REPUBLIC, 24–27 April 2017; Volume 10233.
21. Marín-Sáez, J.; Atencia, J.; Chemisana, D.; Collados, M. Full modeling and experimental validation ofcylindrical holographic lenses recorded in Bayfol HX photopolymer and partly operating in the transitionregime for solar concentration. Opt. Express 2018, 26, 398–412. [CrossRef] [PubMed]
22. Li, D.; Michel, J.; Hu, J.; Gu, T. Compact spectrum splitter for laterally arrayed multi-junction concentratorphotovoltaic modules. Opt. Lett. 2019, 44, 3274–3277. [CrossRef]
Sensors 2020, 20, 6080 14 of 14
23. Kogelnik, H. Coupled wave theory for thick hologram gratings. Bell Syst. Tech. J. 1969, 48, 2909. [CrossRef]24. Piazzolla, S.; Jenkins, B.K. First-harmonic diffusion model for holographic grating formation in photopolymers.
J. Opt. Soc. Am. B Opt. Phys. 2000, 17, 1147–1157. [CrossRef]25. John, T.; Justin, R.L. Nonlocal-response diffusion model of holographic recording in photopolymer.
Opt. Soc. Am. 2000, 17, 1108–1114.26. Klein, W.R. Theoretical efficiency of bragg devices. Proc. Inst. Electr. Electron. Eng. 1966, 54, 803. [CrossRef]27. Jurbergs, D.; Bruder, F.-K.; Deuber, F.; Faecke, T.; Hagen, R.; Hoenel, D.; Roelle, T.; Weiser, M.-S.; Volkov, A.
New recording materials for the holographic industry. In Proceedings of the SPIE—Practical HolographyXXIII: Materials and Applications, San Jose, CA, USA, 25–28 January 2009; Bjelkhagen, H.I., Kostuk, R.K.,Eds.; 2009; Volume 7233.
28. Bruder, F.-K.; Deuber, F.; Faecke, T.; Hagen, R.; Hoenel, D.; Jurbergs, D.; Roelle, T.; Weiser, M.-S.Reaction-diffusion model applied to high resolution Bayfol (R) HX photopolymer. In Proceedings ofthe SPIE—Practical Holography XXIV: Materials and Applications, San Francisco, CA, USA, 24–27 January2010; Bjelkhagen, H.I., Kostuk, R.K., Eds.; 2010; Volume 7619.
29. Zanutta, A.; Orselli, E.; Faecke, T.; Bianco, A. Photopolymeric films with highly tunable refractive indexmodulation for high precision diffractive optics. Opt. Mater. Express 2016, 6, 252–263. [CrossRef]
Publisher’s Note: MDPI stays neutral with regard to jurisdictional claims in published maps and institutionalaffiliations.
© 2020 by the authors. Licensee MDPI, Basel, Switzerland. This article is an open accessarticle distributed under the terms and conditions of the Creative Commons Attribution(CC BY) license (http://creativecommons.org/licenses/by/4.0/).