Embed Size (px)
Citation preview

WICHITA PUBLIC SCHOOLS

i
• Budget General Information (characteristics of district)
• Supplemental Information for Tables in Summary of Expenditures
• KSDE Website Information Available
• Summary of Expenditures (Sumexpen.xls)
1
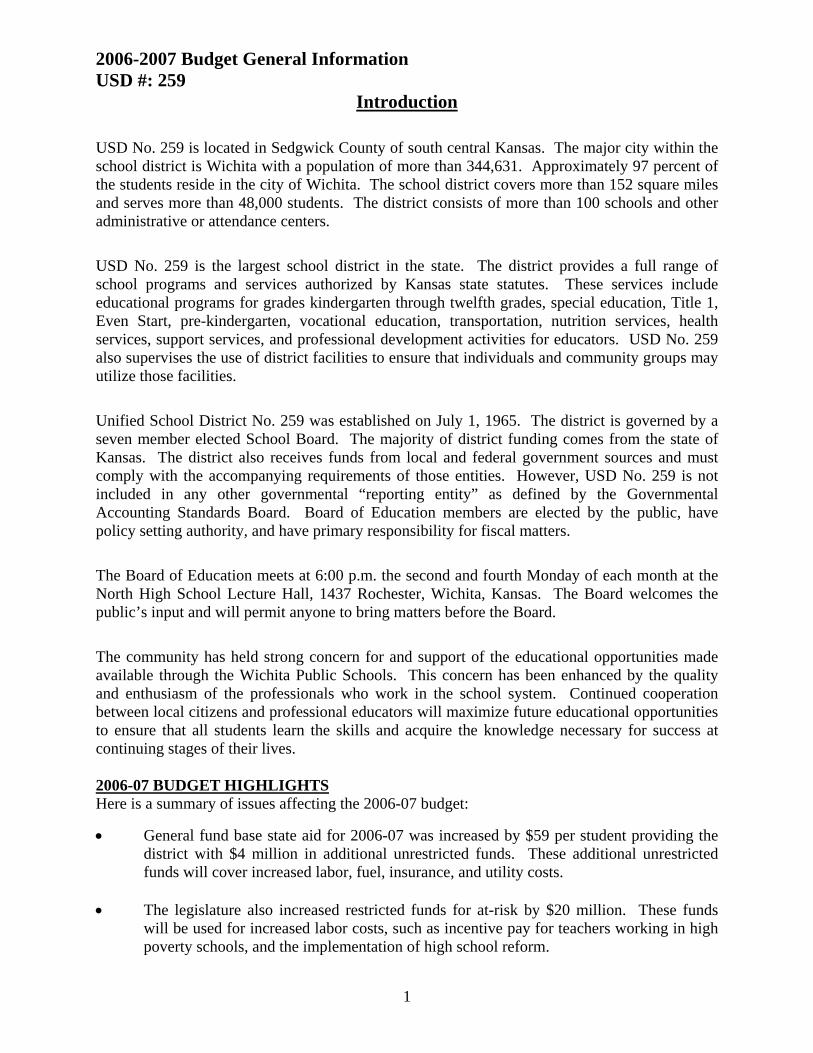
2006-2007 Budget General Information USD #: 259
Introduction
USD No. 259 is located in Sedgwick County of south central Kansas. The major city within the school district is Wichita with a population of more than 344,631. Approximately 97 percent of the students reside in the city of Wichita. The school district covers more than 152 square miles and serves more than 48,000 students. The district consists of more than 100 schools and other administrative or attendance centers.
USD No. 259 is the largest school district in the state. The district provides a full range of school programs and services authorized by Kansas state statutes. These services include educational programs for grades kindergarten through twelfth grades, special education, Title 1, Even Start, pre-kindergarten, vocational education, transportation, nutrition services, health services, support services, and professional development activities for educators. USD No. 259 also supervises the use of district facilities to ensure that individuals and community groups may utilize those facilities.
Unified School District No. 259 was established on July 1, 1965. The district is governed by a seven member elected School Board. The majority of district funding comes from the state of Kansas. The district also receives funds from local and federal government sources and must comply with the accompanying requirements of those entities. However, USD No. 259 is not included in any other governmental “reporting entity” as defined by the Governmental Accounting Standards Board. Board of Education members are elected by the public, have policy setting authority, and have primary responsibility for fiscal matters.
The Board of Education meets at 6:00 p.m. the second and fourth Monday of each month at the North High School Lecture Hall, 1437 Rochester, Wichita, Kansas. The Board welcomes the public’s input and will permit anyone to bring matters before the Board.
The community has held strong concern for and support of the educational opportunities made available through the Wichita Public Schools. This concern has been enhanced by the quality and enthusiasm of the professionals who work in the school system. Continued cooperation between local citizens and professional educators will maximize future educational opportunities to ensure that all students learn the skills and acquire the knowledge necessary for success at continuing stages of their lives. 2006-07 BUDGET HIGHLIGHTS Here is a summary of issues affecting the 2006-07 budget:
• General fund base state aid for 2006-07 was increased by $59 per student providing the district with $4 million in additional unrestricted funds. These additional unrestricted funds will cover increased labor, fuel, insurance, and utility costs.
• The legislature also increased restricted funds for at-risk by $20 million. These funds
will be used for increased labor costs, such as incentive pay for teachers working in high poverty schools, and the implementation of high school reform.

2
• Special Education expenses increased by $6 million to provide services to the district’s growing special needs student population. The legislature provided a $4 million increase in state aid to support these students.
• Starting in 2005-06, the legislature added $3.7 million in Capital Outlay aid. These
additional funds and accumulated cash reserves will increase the Capital Outlay budget by $9 million to allow for the construction of two new elementary schools. One new school will replace the existing Earhart Environmental magnet. The second new school is being added to the Northeast community to reduce the number of students bused for the purpose of desegregation.
• The approved state law allows schools to increase the local option budget to 30 percent of
the general fund. This budget has been built based on maintaining a 27 percent LOB percentage which will generate an additional $7 million.
• The Adult Education (GED) program will again be contracted through the Wichita Area
Technical College. It will be funded in 2006-07 with the beginning year cash balance, and no levy for 2006 will be filed for this program. The district does not plan on offering this program in 2008. Instead students will be encouraged to take advantage of our learning centers where they can earn a high school diploma.
• The proposed total mill levy for 2006-07 remains flat. • This budget has been built on the basis of no increase in enrollment. • An estimated $5 million was included in the Supplemental General fund for the New
Facilities Weighting program. The state provides $1,079 per student per year for two years for students occupying newly constructed classrooms to assist with the start up costs of equipping new facilities. (The $5 million budget represents a $3 million dollar decrease over 2005-06 funding.) The New Facilities Weighting funds have been primarily targeted for classroom computers and other technology.
• Increased state funds will support 6 percent raises plus the addition of 40 minutes per
week and four days per year to the teachers’ contract. • With the increased state funds the district continues to support instruction by adding 168
new positions including the following:
67 additional teachers to reduce class sizes, add Bilingual and Vocational classes and to implement All Day Kindergarten at all sites.
34 additional teachers for Secondary Literacy reform. 44 Data Tech positions to analyze assessment data to improve classroom
instruction. 20 Instructional Coaches. 3 Other support staff.
• In April 2000, the community approved a 20-year, $284.5 million bond issue to air
condition all schools, eliminate most portables, replace five schools, build two new schools, add 19 multipurpose rooms, nine libraries, and upgrade science labs and building infrastructure throughout the district. All of the bonds have been issued. Twenty-four

3
percent of the principle and interest payments will be funded by the state while 76 percent will be funded by a local tax levy. The bond levy is expected to remain at 6 mills well below the 8.65 mills originally projected at the time of the election. Bond construction is expected to be completed by the end of 2006.
• The 2006-07 state school finance plan requires that each school district conduct a needs
assessment of every attendance center and use this information in preparing the school district budget. The district has required comprehensive building-based analysis for more than ten years. (called the Campus Improvement Plan) which encompasses in-depth data analysis, evaluation of current programs, and changes to increase student achievement. This information is then used to build each site’s budget.
Board Members
District 1: Shirley Jefferson, 8042 E. Champions Ct., Wichita, KS 67226 (Term 2005-2007) District 2: Connie Dietz, 8310 Greenbriar Lane, Wichita, KS 67226 (Term 2005-2009) District 3: Sarah Skelton, 5903 E. Skinner, Wichita, KS 67218 (Term 2003-2007) District 4: Chip Gramke, 3351 S. All Hallows, Wichita, KS 67217 (Term 2003-2007) District 5: Lanora Nolan, 1664 Melrose Lane, Wichita, KS 67212 (Term 2005-2009) District 6: Lynn W. Rogers, 935 Porter Ave., Wichita, KS 67203 (Term 2005-2009) At-Large: Kevass Harding, 5816 E. 48th Circle North, Wichita, KS 67220 (Term 2003-2007)
Key Staff
DISTRICT ADMINISTRATION ORGANIZATIONAL CHARTWICHITA PUBLIC SCHOOLS
Chief Operations Officer
Division Director of Special EducationChief Information Officer
Chief Financial Officer
Chief Academic Officer
Asst. Superintendent of Human Resources
Division Director of Marketing and
Communications
Director of Governmental Relations
Division Director of Facilities
Division Director of Operations
Board of Education
Asst. Superintendent of High Schools
Asst. Superintendent of Middle Schools
Superintendent
Asst. Superintendent of Elementary Schools
(*Held by 2 positions.)
District Offices
Schools
Superintendent: Winston Brooks Chief Academic Officer: Mary Ellen Isaac Assistant Superintendent of Elementary Schools: Greg Rasmussen Assistant Superintendent of Elementary Schools: Alicia Thompson Assistant Superintendent of Middle Schools: Kathy J. Busch Assistant Superintendent of High Schools: Denise Wren Assistant Superintendent of Human Resources: Ed Raymond Chief Information Officer: Cathy Barbieri Chief Operations Officer: Martin Libhart Division Director of Marketing and Communications: Wendy Johnson Division Director of Operations: Darren Muci Division Director of Special Education: Neil Guthrie

4
Director of Governmental Relations: Diane Gjerstad Curriculum (Learning Services) and Staff Development: Denise Seguine Business Office Staff: Chief Financial Officer/Treasurer: Linda Jones Controller/Assistant Treasurer: Barbara Phillips Director of Budgeting: Ronda Goode Director of Payroll: Debbie Thomas
The District’s Accomplishments and Challenges The District’s Accomplishments
• Recognized nationally by American School Board Journal as one of seven leading urban school districts in the U.S. for gains in student achievement.
• Thirty-two schools received the 2006 Standard of Excellence status—the state’s highest honor, based on their performance on the Kansas state assessments.
• Five schools have received certificates of merit as part of the annual Challenge Awards from the Confidence in Kansas Public Education Task Force, for making a significant difference in student achievement despite challenges in school population.
• Science teacher at Robinson Middle School received the National Educator Award from the Milken Family Foundation.
• Spaght Accelerated Magnet 4/5th grade teacher named 2006 Kansas Teacher of the Year finalist.
• Wilbur Middle School teacher received Presidential Award for Excellence in Science. • McLean Science/Technology Magnet teacher received Presidential Award for Excellence
in Math. • North High School named an AVID (Achievement Via Individual Determination)
National Demonstration School, the only one in Kansas and one of the few across the country.
• The National Merit Scholarship competition has named six semi-finalists who attend Wichita high schools.
• Northwest High School student receives prestigious Gore Scholarship from Wichita State University.
• Hadley Middle School’s Assistant Principal named Kansas Association of School Administrators’ Assistant Principal of the Year.
• Drama teacher at Northwest High School was inducted into the National Hall of Fame for Theater Teachers.
• The Wichita Public Schools is one of six districts in the nation to receive the U.S. Environmental Protection Agency’s Indoor Air Quality Tools for Schools 2006 Excellence Award.
• East High School student received Wichita State University’s Clay Barton Scholarship. • Horace Mann teacher received the 2006 Kansas Horizon Award from the Kansas
Department of Education. • Franklin and Pleasant Valley Elementary Schools made the largest gains in Kansas in
first to second grade for Reading First, a program designed to promote early literacy. • Northwest students placed fourteenth in the nation at the WordMasters Challenge, a
competition reading and analyzing prose and poetry. • Two North High School students named Dell Scholars. • Two North High School students named Gates Millennium Scholars.

5
• Pleasant Valley Elementary received the Kansas Healthy School Award from Governor Kathleen Sebelius.
• Robinson students participated in the Science Olympiad National Tournament. • West High School student wins fourth consecutive class 5A title at the state wrestling
tournament – the first African-American in Kansas to do so. • North High School counselor receives humanitarian Award from the NCCJ of Kansas. • Three middle school students score in the top one-percent in Duke University’s Talent
Identification Program. • Beech Elementary participated in the World’s Largest Concert, which was televised
nationally on PBS. The District’s Challenges
• Wichita Public Schools is the largest district situated between the Mississippi River and Denver, and Dallas and the Canadian border.
• Over 66 percent of students come from low income households which qualify for free or reduced lunches.
• Over 17 percent of students receive special education services. Over $92 million is spent on special needs students.
• The non-English speaking population comprises approximately 11 percent of the student body. The percentage of non-English speaking students has grown by 67 percent since 1997-98.
• Approximately one-third of the district’s aging workforce is expected to retire in the next five years. A growing teacher shortage exists nation-wide.
• The state dictated budget per pupil of $4,316 has not kept pace with inflation since the State implemented a student-weighted school funding formula in 1992.
• State statutes limit how much the district can spend. Though additional resources are needed to meet our challenging population, state statutes do not allow for generation of those resources.
• The Kansas Supreme Court ruled in 2005 that schools had been under funded to such an extent that the Kansas Constitution had been violated. The Legislature was ordered to increase school funding and to do a cost study to determine the actual cost of providing a suitable education. In July 2006, the Kansas Supreme Court dismissed the lawsuit.
• Employee health insurance costs have increased nearly 70% over the past five years. • Energy costs have doubled over the past five years due to increased fuel costs and the
implementation of district-wide air-conditioning.
6
Supplemental Information for the Following Tables 1. Summary of Total Expenditures by Function (All Funds)
• Cost increases reflect the hiring of 197 positions. • An average 6 percent increase to employee salary schedules plus 4.25 percent for four
additional teacher contract days plus 40 minutes per week additional teacher collaboration time was negotiated.
• The budget for Capital Improvements has increased significantly due to the planned construction of two new elementary schools.
• The budget for other costs reflects additional food service and district retirement costs.
2. Summary of General and Supplemental General Fund Expenditures by Function
• Increases are primarily due to 6 percent increase to employee salary schedules plus 4.25 percent for four additional teacher contract days plus 40 minutes per week for teacher collaboration time.
• Decreases are due to the transfer of staff to the new At-Risk funds. • Costs increases were also budgeted in utilities, fuel, and sanitation.
3. Instruction Expenditures (1000)
• Increases are primarily due to a 6 percent increase to employee salary schedules plus 4.25 percent for four additional teacher contract days plus 40 minutes per week for teacher collaboration time.
• Also, 67 positions were added to reduce class sizes, add bilingual and vocational classes, and implement all-day kindergarten at all sites.
• An additional 34 teaching positions were added for secondary literacy reform. • 20 instructional coaches were added, and 44 positions were added to analyze
assessment data to improve teaching strategies. • The decrease in instructional costs in the Supplemental General fund is a result of the
expected reduction in New Facilities Weighting technology funds for 2006-07. • In 2006-07, the Adult Education will no longer be levied. Carryover monies will be
used to finish out this program for the district. In the future Learning Centers will be used as an alternative for students formally in the GED program.
4. Sources of Revenue and Proposed Budget for 2006-07
• July 1, 2006, cash balances reflect June 2006 tax collections needed to fund budgeted expenditures until the January 2007 tax distribution is received.
• The negative federal funds cash balance reflects June 2006 expenditures reimbursed by the federal government in July 2006.
• KPERS reflects revenues paid by the state for school employee retirement benefits. These funds are not retained or controlled by the district. They are transferred by the state to the district and returned to the state in the same day. KPERS funds were not included in the district financials prior to 2004.
• Transfers represent money transferred between funds. Since transfers must be budgeted by state law in both the sending and receiving funds, duplicate transfers are subtracted from the total for purposes of calculating the total budgeted expenditures.

7
• Only the General and Supplemental General funds are unrestricted and available to be used at the board’s discretion. All the other funds are restricted and must only be used for the purposes generated. Many of the programs such as the special education and bilingual funds are mandated by both state and federal law.
5. Other Information – FTE
• Enrollment has increase by 1,600 over the past 10 years. • While overall enrollment has held steady over time, the number of low-income
students has continually increased. Currently over 66 percent of students qualify for free or reduced students.
6. Miscellaneous Information Mill Rates by Fund
• The district has held the mill levy flat for five years and is currently 3.6 mills lower than in 2001.
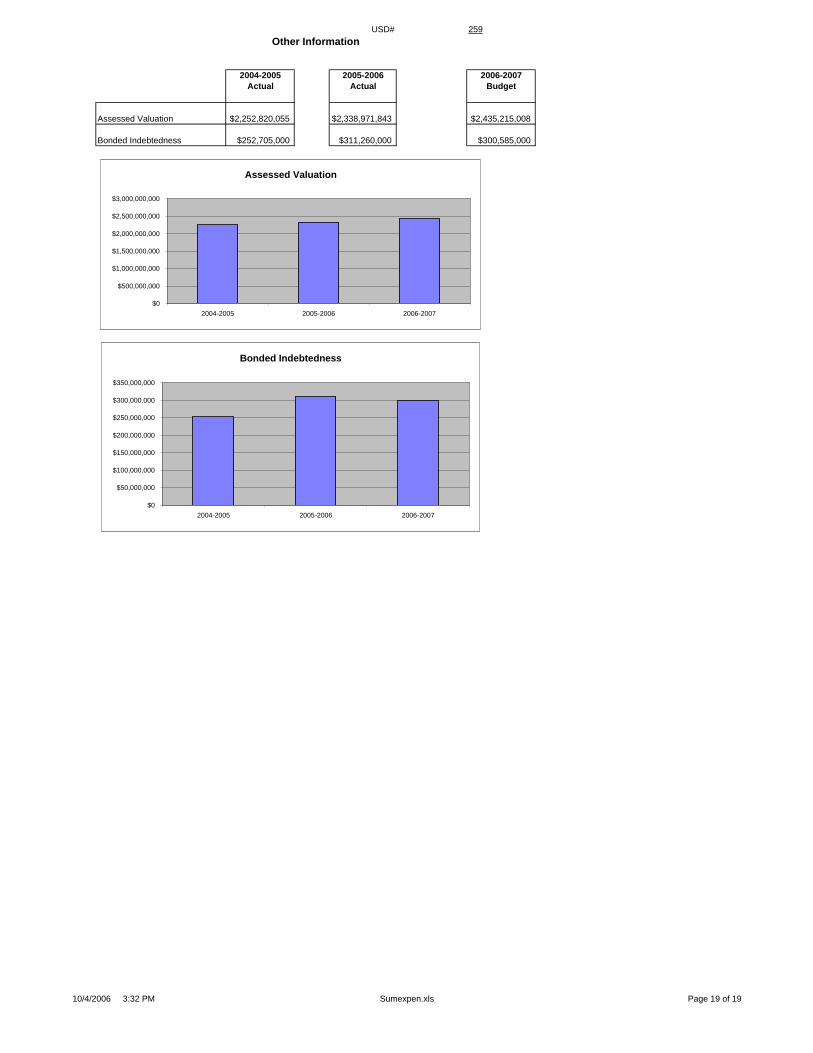
7. Other Information – Assessed Valuation and Bonded Indebtedness
• Assessed valuation grew by 4 percent in 2006-07. Unlike the city and county, increased tax collections due to growth in assessed valuation in the General or Supplemental General funds do no increase budget authority. Both the General and Supplemental General funds are set by state formula. Tax collections in the General fund are deducted from state aid received.
8. Average Salary
• Hiring highly qualified teaching staff has become one of the district’s biggest challenges. In order to be competitive in the labor market, the district gave significant salary increases in 2005-06 and 2006-07. The 2006 increases also reflect the additional cost of adding four days to the instructional calendar and an additional 40 minutes per week of teacher collaboration time.

8
KSDE Website Information Available K-12 Statistics (Building, District or State Totals) http://www.ksde.org/k12/k12.html
• Attendance / Enrollment Reports • Staff Reports • Graduates / Dropouts Reports • Crime / Violence Reports
School Finance Reports and Publications http://www.ksde.org/leaf/reports_and_publications/reports.html
• Certified Personnel • Enrollment • Dropouts • Graduates • Salary Reports
Kansas Building Report Card http://online.ksde.org/rcard
• Attendance Rate • Graduation Rate • Dropout Rate • School Violence • Assessments
o Reading o Mathematics o Writing
• Graduates Passing Adv. Science Courses • Graduates Passing Adv. Math Courses

USD# 259
Summary of Total Expenditures By Function(All Funds)
% % % % %2004-2005 of 2005-2006 of inc/ 2006-2007 of inc/
Actual Tot Actual Tot dec Budget Tot dec
Instruction 211,880,305 50% 235,101,864 50% 11% 277,597,730 51% 18%
Student & Instructional Support 51,501,870 12% 60,901,382 13% 18% 61,194,128 11% 0%
General Administration 6,087,030 1% 6,786,613 1% 11% 7,431,489 1% 10%
School Administration (Building) 25,048,347 6% 28,274,707 6% 13% 29,724,911 5% 5%
Operations & Maintenance 36,556,081 9% 40,151,550 9% 10% 42,023,543 8% 5%
Capital Improvements 17,378,759 4% 16,655,345 4% -4% 35,538,358 7% 113%
Debt Services 21,604,438 5% 21,807,388 5% 1% 21,987,113 4% 1%
Other Costs 52,320,976 12% 58,505,171 12% 12% 65,318,315 12% 12%
Total Expenditures 422,377,806 100% 468,184,020 100% 11% 540,815,587 100% 16%
Amount per Pupil $9,005 $9,982 11% $11,521 15%
Note: Percentages on charts are within +-1% due to rounding used. Pie graph percentages may differ from charts for this reason also.
Further definition of what goes into each category:Instruction - 1000 Operations & Maintenance - 2600Student & Instructional Support - 2100 & 2200 Other Costs - 2500, 2900 and 3000 and all others not included elsewhereGeneral Administration - 2300 Capital Improvements - 4000School Administration (Building) - 2400 Debt Services - 5100 Transfers - 5200
The funds that are included in the categories above are: General, Supplemental General, Bilingual Education, At Risk(4yr Old), At Risk(K-12), Capital Outlay, Driver Education, Extraordinary School Program, Summer School, Special Education, Vocational Education, Professional Development, Bond & Interest #1, Bond & Interest #2, No-Fund Warrant, Special Assessment, Parent Education, School Retirement, Student Materials Revolving & Textbook Rental, Tuition Reimbursement, Gifts/Grants, KPERS Special Retirement Contribution, Contingency, Special Liability Expense, Federal Funds, Adult Education, Adult Supplemental Education, Area Vocational Education, and Special Education Coop.
Summary of Total Expenditures By Function (All Funds)
0
50,000,000
100,000,000
150,000,000
200,000,000
250,000,000
300,000,000
Instruction Student &Instructional
Support
GeneralAdministration
SchoolAdministration
(Building)
Operations &Maintenance
CapitalImprovements
Debt Services Other Costs
2004-20052005-20062006-2007
2006-2007 Summary of Total Expenditures By Function (All Funds)
Instruction52%
General Administration1%
Operations & Maintenance8%
Capital Improvements7%
Debt Services4%
Other Costs12%
Student & Instructional Support11%
Administration (Building)5%
InstructionStudent & Instructional SupportGeneral AdministrationSchool Administration (Building)Operations & MaintenanceCapital ImprovementsDebt ServicesOther Costs
10/4/2006 3:32 PM Sumexpen.xls Page 1 of 19

USD# 259
Summary of General Expendituresby Function
% % % % %2004-2005 of 2005-2006 of inc/ 2006-2007 of inc/
Actual Tot Actual Tot dec Budget Tot dec
Instruction 127,109,613 61% 118,058,952 60% -7% 133,165,665 63% 13%
Student & Instructional Support 17,243,748 8% 21,130,320 11% 23% 19,435,226 9% -8%
General Administration 1,688,903 1% 2,179,178 1% 29% 2,130,606 1% -2%
School Administration (Building) 21,784,824 11% 22,114,177 11% 2% 23,319,867 11% 5%
Operations & Maintenance 25,895,344 12% 27,498,244 14% 6% 27,428,819 13% 0%
Capital Improvements 0 0% 0 0% 0% 0 0% 0%
Other Costs 13,465,447 6% 4,997,795 3% -63% 5,478,607 3% 10%
Total Expenditures 207,187,879 100% 195,978,666 100% -5% 210,958,790 100% 8%
Amount per Pupil $4,417 $4,178 -5% $4,494 8%
The Summary of General Fund Expenditures chart information comes from pages 6-13 and only uses the 'General Fund' line items.
Summary of General Fund Expendituresby Function
0
20,000,000
40,000,000
60,000,000
80,000,000
100,000,000
120,000,000
140,000,000
Instruction Student &Instructional
Support
GeneralAdministration
SchoolAdministration
(Building)
Operations &Maintenance
CapitalImprovements
Other Costs
2004-20052005-20062006-2007
2006-2007 Summary of General Fund Expendituresby Function
Instruction63%Student & Instructional
Support9%
General Administration1%
School Administration (Building)
11%
Operations & Maintenance13%
Other Costs3%
InstructionStudent & Instructional SupportGeneral AdministrationSchool Administration (Building)Operations & MaintenanceCapital ImprovementsOther Costs
10/4/2006 3:32 PM Sumexpen.xls Page 2 of 19
USD# 259
Summary of Supplemental General Fund Expendituresby Function
% % % % %2004-2005 of 2005-2006 of inc/ 2006-2007 of inc/
Actual Tot Actual Tot dec Budget Tot dec
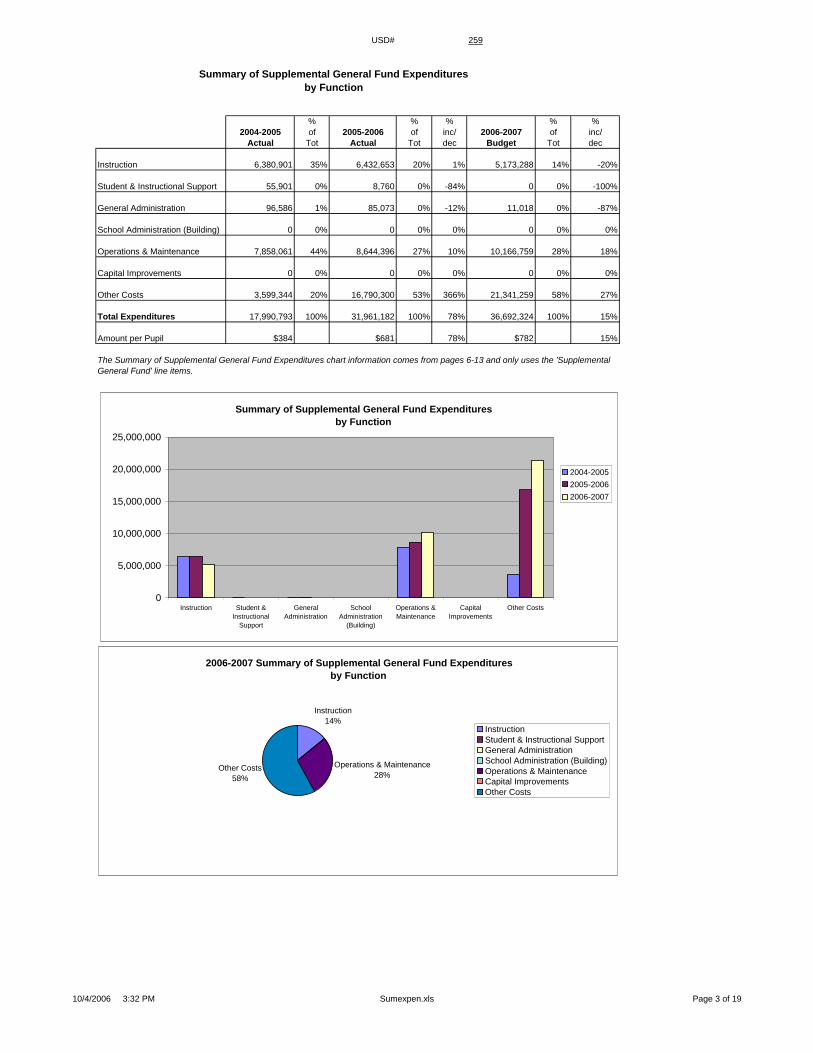
Instruction 6,380,901 35% 6,432,653 20% 1% 5,173,288 14% -20%
Student & Instructional Support 55,901 0% 8,760 0% -84% 0 0% -100%
General Administration 96,586 1% 85,073 0% -12% 11,018 0% -87%
School Administration (Building) 0 0% 0 0% 0% 0 0% 0%
Operations & Maintenance 7,858,061 44% 8,644,396 27% 10% 10,166,759 28% 18%
Capital Improvements 0 0% 0 0% 0% 0 0% 0%
Other Costs 3,599,344 20% 16,790,300 53% 366% 21,341,259 58% 27%
Total Expenditures 17,990,793 100% 31,961,182 100% 78% 36,692,324 100% 15%
Amount per Pupil $384 $681 78% $782 15%
The Summary of Supplemental General Fund Expenditures chart information comes from pages 6-13 and only uses the 'Supplemental General Fund' line items.
2006-2007 Summary of Supplemental General Fund Expendituresby Function
Instruction14%
Operations & Maintenance28%
Other Costs58%
InstructionStudent & Instructional SupportGeneral AdministrationSchool Administration (Building)Operations & MaintenanceCapital ImprovementsOther Costs
Summary of Supplemental General Fund Expendituresby Function
0
5,000,000
10,000,000
15,000,000
20,000,000
25,000,000
Instruction Student &Instructional
Support
GeneralAdministration
SchoolAdministration
(Building)
Operations &Maintenance
CapitalImprovements
Other Costs
2004-20052005-20062006-2007
10/4/2006 3:32 PM Sumexpen.xls Page 3 of 19
USD# 259Summary of General and Supplemental General Fund
Expenditures by Function
% % % % %2004-2005 of 2005-2006 of inc/ 2006-2007 of inc/
Actual Tot Actual Tot dec Budget Tot dec
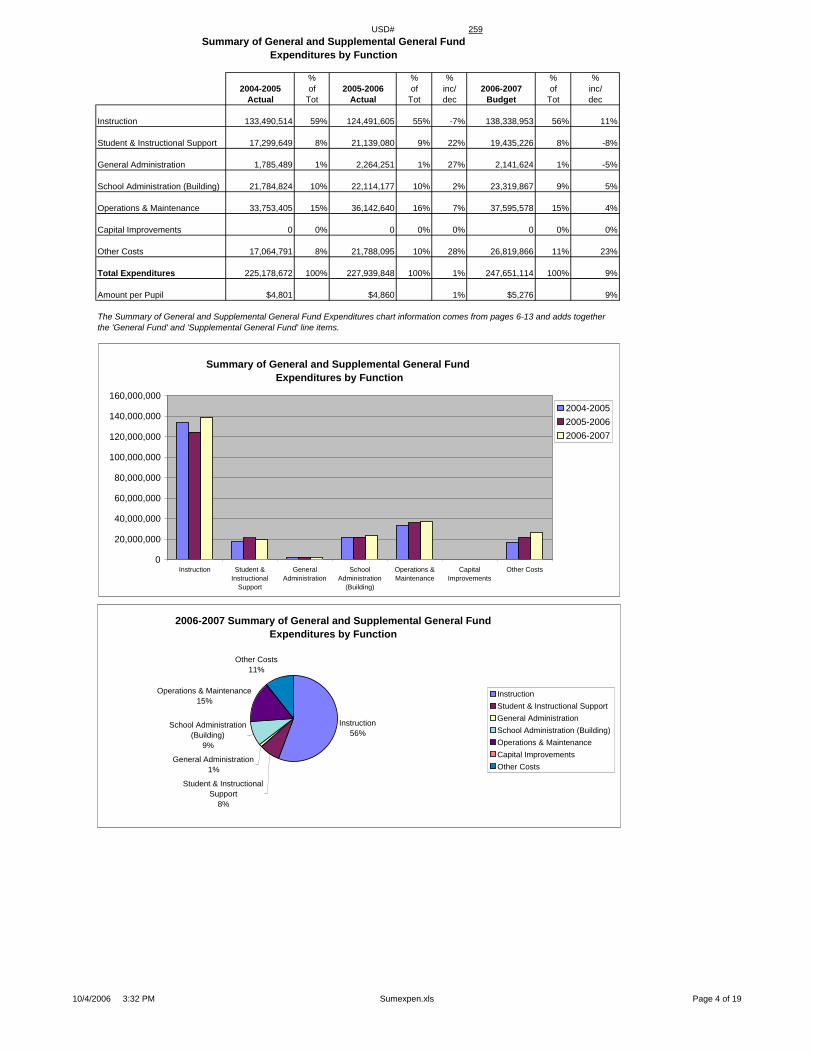
Instruction 133,490,514 59% 124,491,605 55% -7% 138,338,953 56% 11%
Student & Instructional Support 17,299,649 8% 21,139,080 9% 22% 19,435,226 8% -8%
General Administration 1,785,489 1% 2,264,251 1% 27% 2,141,624 1% -5%
School Administration (Building) 21,784,824 10% 22,114,177 10% 2% 23,319,867 9% 5%
Operations & Maintenance 33,753,405 15% 36,142,640 16% 7% 37,595,578 15% 4%
Capital Improvements 0 0% 0 0% 0% 0 0% 0%
Other Costs 17,064,791 8% 21,788,095 10% 28% 26,819,866 11% 23%
Total Expenditures 225,178,672 100% 227,939,848 100% 1% 247,651,114 100% 9%
Amount per Pupil $4,801 $4,860 1% $5,276 9%
The Summary of General and Supplemental General Fund Expenditures chart information comes from pages 6-13 and adds togetherthe 'General Fund' and 'Supplemental General Fund' line items.
Summary of General and Supplemental General Fund Expenditures by Function
0
20,000,000
40,000,000
60,000,000
80,000,000
100,000,000
120,000,000
140,000,000
160,000,000
Instruction Student &Instructional
Support
GeneralAdministration
SchoolAdministration
(Building)
Operations &Maintenance
CapitalImprovements
Other Costs
2004-20052005-20062006-2007
2006-2007 Summary of General and Supplemental General Fund Expenditures by Function
Instruction56%
Student & Instructional Support
8%
General Administration1%
School Administration (Building)
9%
Operations & Maintenance15%
Other Costs11%
InstructionStudent & Instructional SupportGeneral AdministrationSchool Administration (Building)Operations & MaintenanceCapital ImprovementsOther Costs
10/4/2006 3:32 PM Sumexpen.xls Page 4 of 19

USD# 259
Summary of Special Education Fundby Function
% % % % %2004-2005 of 2005-2006 of inc/ 2006-2007 of inc/
Actual Tot Actual Tot dec Budget Tot dec
Instruction 44,731,257 58% 46,057,660 57% 3% 55,513,771 60% 21%
Student & Instructional Support 14,416,888 19% 15,957,841 20% 11% 17,294,625 19% 8%
General Administration 1,054,150 1% 2,204,177 3% 109% 2,166,573 2% -2%
School Administration (Building) 1,589,771 2% 2,061,786 3% 30% 2,391,128 3% 16%
Operations & Maintenance 894,059 1% 940,185 1% 5% 963,408 1% 2%
Capital Improvements 0 0% 0 0% 0% 0 0% 0%
Other Costs 14,283,057 19% 13,145,753 16% -8% 13,872,044 15% 6%
Total Expenditures 76,969,182 100% 80,367,402 100% 4% 92,201,549 100% 15%
Amount per Pupil $1,641 $1,713 4% $1,964 15%
The Summary of Special Education Fund Expenditures chart information comes from pages 6-13 and only uses the 'Special Education Fund'line items. (Total expenditures excludes Special Ed Coop Fund because it would include expenditures for all schools participating in the Coop.)
Summary of Special Education Fund Expendituresby Function
0
10,000,000
20,000,000
30,000,000
40,000,000
50,000,000
60,000,000
Instruction Student &Instructional
Support
GeneralAdministration
SchoolAdministration
(Building)
Operations &Maintenance
CapitalImprovements
Other Costs
2004-20052005-20062006-2007
2006-2007 Summary of Special Education Fundby Function
Instruction60%
Operations & Maintenance1%
Other Costs15%
School Administration (Building)
3%
General Administration2%
Student & Instructional Support
19%
InstructionStudent & Instructional SupportGeneral AdministrationSchool Administration (Building)Operations & MaintenanceCapital ImprovementsOther Costs
10/4/2006 3:32 PM Sumexpen.xls Page 5 of 19

USD# 259Instruction Expenditures (1000)
% %2004-2005 2005-2006 inc/ 2006-2007 inc/
Actual Actual dec Budget dec
General 127,109,613 118,058,952 -7% 133,165,665 13%Federal Funds 10,691,713 11,481,798 7% 11,836,357 3%Supplemental General 6,380,901 6,432,653 1% 5,173,288 -20%At Risk (4yr Old) 3,262,629 3,629,562 11%At Risk (K-12) 23,051,412 40,500,969 76%Bilingual Education 5,237,085 6,411,976 22% 7,632,117 19%Capital Outlay 0 0 0% 0 0%Driver Education 878,219 957,014 9% 1,127,625 18%Declining Enrollment 0 0 0%Extraordinary School Program 1,551,666 517,856 -67% 509,916 -2%Food Service 0 0 0% 0 0%Professional Development 0 0 0% 0 0%Parent Education Program 0 0 0% 0 0%Summer School 157,744 285,138 81% 363,995 28%Special Education 44,731,257 46,057,660 3% 55,513,771 21%Vocational Education 4,680,808 5,886,027 26% 6,627,724 13%Gifts/Grants 622,292 950,129 53% 953,870 0%Special Liability 0 0 0% 0 0%School Retirement 0 0 0% 0 0%Extraordinary Growth Facilities 0 0 0% 0 0%Special Reserve 0 0 0%KPERS Spec. Ret. Contribution 5,804,883 7,023,014 21% 9,129,918 30%Contingency Reserve 250,000 0 -100%Text Book & Student Material 2,384,338 3,425,606 44%Bond & Interest #1 0 0 0% 0 0%Bond & Interest #2 0 0 0% 0 0%No-Fund Warrant 0 0 0% 0 0%Special Assessment 0 0 0% 0 0%Temporary Note 0 0 0% 0 0%
SUBTOTAL 210,480,519 233,801,864 11% 276,164,777 18%Enrollment (FTE)* 46,905.1 46,905.1 0% 46,943.0 0%Amount per Pupil 4,487 4,985 11% 5,883 18%
Adult Education 1,399,786 1,300,000 -7% 1,432,953 10%Adult Supplemental Education 0 0 0% 0 0%Area Vocational School 0 0 0% 0 0%Tuition Reimbursement 0 0 0% 0 0%Special Education Coop 0 0 0% 0 0%TOTAL 211,880,305 235,101,864 11% 277,597,730 18%
NOTE: Gifts/Grants includes private grants and grants from nonfederal sources.
Amount per pupil excludes the following funds: Area Vocational School, Adult Education, Adult Supplemental Education,Special Education Coop and Tuition Reimbursement.
*Enrollment (FTE) includes the enrollment of the district used for state aid and budget authority, and all other preschool enrollmentand kindergarten students attending full time.
Instruction Expenditures
0
50,000,000
100,000,000
150,000,000
200,000,000
250,000,000
300,000,000
2004-2005 2005-2006 2006-2007
Instruction Expenditures
0
20,000,000
40,000,000
60,000,000
80,000,000
100,000,000
120,000,000
140,000,000
2004-2005 2005-2006 2006-2007
General Supplemental GeneralSpecial Education
10/4/2006 3:32 PM Sumexpen.xls Page 6 of 19

USD# 259
Student and Instructional Support Expenditures (2100 & 2200)
% %2004-2005 2005-2006 inc/ 2006-2007 inc/
Actual Actual dec Budget dec
General 17,243,748 21,130,320 23% 19,435,226 -8%Federal Funds 13,800,808 15,172,991 10% 14,943,361 -2%Supplemental General 55,901 8,760 -84% 0 -100%At Risk (4yr Old) 315,786 342,156 8%At Risk (K-12) 1,845,336 2,215,783 20%Bilingual Education 0 42,198 0% 0 -100%Capital Outlay 0 0 0% 0 0%Driver Training 179,948 183,511 2% 180,001 -2%Declining Enrollment 0 0 0%Extraordinary School Program 0 0 0% 0 0%Food Service 0 0 0% 0 0%Professional Development 1,059,862 1,194,924 13% 1,382,010 16%Parent Education Program 786,371 892,318 13% 948,223 6%Summer School 3,817 855 -78% 0 -100%Special Education 14,416,888 15,957,841 11% 17,294,625 8%Vocational Education 140,657 1,072 -99% 0 -100%Gifts/Grants 1,483,173 937,484 -37% 937,484 0%Special Liability 0 0 0% 0 0%School Retirement 0 0 0% 0 0%Extraordinary Growth Facilities 0 0 0% 0 0%Special Reserve 0 0 0%KPERS Spec. Ret. Contribution 2,235,032 2,704,045 21% 3,515,259 30%Contingency Reserve 0 0 0%Text Book & Student Material 95,665 513,941 437%Bond & Interest #1 0 0 0% 0 0%Bond & Interest #2 0 0 0% 0 0%No-Fund Warrant 0 0 0% 0 0%Special Assessment 0 0 0% 0 0%Temporary Note 0 0 0% 0 0%
SUBTOTAL 51,501,870 60,901,382 18% 61,194,128 0%Enrollment (FTE)* 46,905.1 46,905.1 0% 46,943.0 0%Amount per Pupil 1,098 1,298 18% 1,304 0%
Adult Education 0 0 0% 0 0%Adult Supplemental Education 0 0 0% 0 0%Area Vocational School 0 0 0% 0 0%Tuition Reimbursement 0 0 0% 0 0%Special Education Coop 0 0 0% 0 0%TOTAL 51,501,870 60,901,382 18% 61,194,128 0%Amount per Pupil $1,159 $1,370 18% $1,377 0%
NOTE: Gifts/Grants includes private grants and grants from nonfederal sources.
Amount per pupil excludes the following funds: Area Vocational School, Adult Education, Adult Supplemental Education,Special Education Coop and Tuition Reimbursement.
*Enrollment (FTE) includes the enrollment of the district used for state aid and budget authority, and all other preschool enrollmentand kindergarten students attending full time.
Student and Instructional Support Expenditures
0
10,000,000
20,000,000
30,000,000
40,000,000
50,000,000
60,000,000
70,000,000
2004-2005 2005-2006 2006-2007
10/4/2006 3:32 PM Sumexpen.xls Page 7 of 19

USD# 259
General Administration Expenditures (2300)
% %2004-2005 2005-2006 inc/ 2006-2007 inc/
Actual Actual dec Budget dec
General 1,688,903 2,179,178 29% 2,130,606 -2%Federal Funds 1,447,004 1,291,077 -11% 1,145,866 -11%Supplemental General 96,586 85,073 -12% 11,018 -87%At Risk (4yr Old) 0 0 0%At Risk (K-12) 0 0 0%Bilingual Education 0 0 0% 0 0%Capital Outlay 0 0 0% 0 0%Driver Training 0 0 0% 0 0%Declining Enrollment 0 0 0%Extraordinary School Program 0 0 0% 0 0%Food Service 0 0 0% 0 0%Professional Development 0 0 0% 0 0%Parent Education Program 0 0 0% 0 0%Summer School 0 0 0% 0 0%Special Education 1,054,150 2,204,177 109% 2,166,573 -2%Vocational Education 465,934 0 -100% 0 0%Gifts/Grants 201,305 202,667 1% 202,667 0%Special Liability Expense 831,292 459,242 -45% 1,300,000 183%School Retirement 0 0 0% 0 0%Extraordinary Growth Facilities 0 0 0% 0 0%Special Reserve 0 0 0%KPERS Spec. Ret. Contribution 301,856 365,199 21% 474,759 30%Contingency Reserve 0 0 0%Text Book & Student Material 0 0 0%Bond & Interest #1 0 0 0% 0 0%Bond & Interest #2 0 0 0% 0 0%No-Fund Warrant 0 0 0% 0 0%Special Assessment 0 0 0% 0 0%Temporary Note 0 0 0% 0 0%
SUBTOTAL 6,087,030 6,786,613 11% 7,431,489 10%Enrollment (FTE)* 46,905.1 46,905.1 0% 46,943.0 0%Amount per Pupil 130 145 11% 158 9%
Adult Education 0 0 0% 0 0%Adult Supplemental Education 0 0 0% 0 0%Area Vocational School 0 0 0% 0 0%Tuition Reimbursement 0 0 0% 0 0%Special Education Coop 0 0 0% 0 0%TOTAL 6,087,030 6,786,613 11% 7,431,489 10%
NOTE: Gifts/Grants includes private grants and grants from nonfederal sources.
Amount per pupil excludes the following funds: Area Vocational School, Adult Education, Adult Supplemental Education,Special Education Coop and Tuition Reimbursement.
*Enrollment (FTE) includes the enrollment of the district used for state aid and budget authority, and all other preschool enrollmentand kindergarten students attending full time.
General Administration Expenditures
0
1,000,000
2,000,000
3,000,000
4,000,000
5,000,000
6,000,000
7,000,000
8,000,000
2004-2005 2005-2006 2006-2007
10/4/2006 3:32 PM Sumexpen.xls Page 8 of 19

USD# 259
School Administration Expenditures (2400)
% %2004-2005 2005-2006 inc/ 2006-2007 inc/
Actual Actual dec Budget dec
General 21,784,824 22,114,177 2% 23,319,867 5%Federal Funds 455,432 381,372 -16% 384,322 1%Supplemental General 0 0 0% 0 0%At Risk (4yr Old) 158,790 135,912 -14%At Risk (K-12) 1,382,428 1,014,918 -27%Bilingual Education 0 188,058 0% 0 -100%Capital Outlay 0 0 0% 0 0%Driver Training 0 0 0% 0 0%Declining Enrollment 0 0 0%Extraordinary School Program 74,975 0 -100% 0 0%Food Service 0 0 0% 0 0%Professional Development 0 0 0% 0 0%Parent Education Program 0 0 0% 0 0%Summer School 909 15,556 1611% 0 -100%Special Education 1,589,771 2,061,786 30% 2,391,128 16%Vocational Education 0 577,114 0% 669,697 16%Gifts/Grants 2,785 16,624 497% 16,624 0%Special Liability Expense 0 0 0% 0 0%School Retirement 0 0 0% 0 0%Extraordinary Growth Facilities 0 0 0% 0 0%Special Reserve 0 0 0%KPERS Spec. Ret. Contribution 1,139,651 1,378,802 21% 1,792,443 30%Contingency Reserve 0 0 0%Text Book & Student Material 0 0 0%Bond & Interest #1 0 0 0% 0 0%Bond & Interest #2 0 0 0% 0 0%No-Fund Warrant 0 0 0% 0 0%Special Assessment 0 0 0% 0 0%Temporary Note 0 0 0% 0 0%
SUBTOTAL 25,048,347 28,274,707 13% 29,724,911 5%Enrollment (FTE)* 46,905.1 46,905.1 0% 46,943.0 0%Amount per Pupil 534 603 13% 633 5%
Adult Education 0 0 0% 0 0%Adult Supplemental Education 0 0 0% 0 0%Area Vocational School 0 0 0% 0 0%Tuition Reimbursement 0 0 0% 0 0%Special Education Coop 0 0 0% 0 0%TOTAL 25,048,347 28,274,707 13% 29,724,911 5%
NOTE: Gifts/Grants includes private grants and grants from nonfederal sources.
Amount per pupil excludes the following funds: Area Vocational School, Adult Education, Adult Supplemental Education,Special Education Coop and Tuition Reimbursement.
*Enrollment (FTE) includes the enrollment of the district used for state aid and budget authority, and all other preschool enrollmentand kindergarten students attending full time.
School Administration Expenditures
0
5,000,000
10,000,000
15,000,000
20,000,000
25,000,000
30,000,000
35,000,000
2004-2005 2005-2006 2006-2007
10/4/2006 3:32 PM Sumexpen.xls Page 9 of 19

USD# 259
Operations and Maintenance Expenditures (2600)
% %2004-2005 2005-2006 inc/ 2006-2007 inc/
Actual Actual dec Budget dec
General 25,895,344 27,498,244 6% 27,428,819 0%Federal Funds 117,234 408,081 248% 169,063 -59%Supplemental General 7,858,061 8,644,396 10% 10,166,759 18%At Risk (4yr Old) 14,284 18,466 29%At Risk (K-12) 362,007 398,004 10%Bilingual Education 0 0 0% 0 0%Capital Outlay 0 0 0% 0 0%Driver Training 36,085 36,548 1% 58,400 60%Declining Enrollment 0 0 0%Extraordinary School Program 0 0 0% 0 0%Food Service 103,698 117,162 13% 147,150 26%Professional Development 0 0 0% 0 0%Parent Education Program 0 0 0% 0 0%Summer School 7,820 307 -96% 0 -100%Special Education 894,059 940,185 5% 963,408 2%Vocational Education 0 1,573 0% 0 -100%Gifts/Grants 143,009 313,061 119% 313,061 0%Special Liability 0 0 0% 0 0%School Retirement 0 0 0% 0 0%Extraordinary Growth Facilities 0 0 0% 0 0%Special Reserve 0 0 0%KPERS Spec. Ret. Contribution 1,500,771 1,815,702 21% 2,360,413 30%Contingency Reserve 0 0 0%Text Book & Student Material 0 0 0%Bond & Interest #1 0 0 0% 0 0%Bond & Interest #2 0 0 0% 0 0%No-Fund Warrant 0 0 0% 0 0%Special Assessment 0 0 0% 0 0%Temporary Note 0 0 0% 0 0%
SUBTOTAL 36,556,081 40,151,550 10% 42,023,543 5%Enrollment (FTE)* 46,905.1 46,905.1 0% 46,943.0 0%Amount per Pupil 779 856 10% 895 5%
Adult Education 0 0 0% 0 0%Adult Supplemental Education 0 0 0% 0 0%Area Vocational School 0 0 0% 0 0%Tuition Reimbursement 0 0 0% 0 0%Special Education Coop 0 0 0% 0 0%TOTAL 36,556,081 40,151,550 10% 42,023,543 5%
NOTE: Gifts/Grants includes private grants and grants from nonfederal sources.
Amount per pupil excludes the following funds: Area Vocational School, Adult Education, Adult Supplemental Education,Special Education Coop and Tuition Reimbursement.
*Enrollment (FTE) includes the enrollment of the district used for state aid and budget authority, and all other preschool enrollmentand kindergarten students attending full time.
Operations and Maintenance Expenditures
0
5,000,000
10,000,000
15,000,000
20,000,000
25,000,000
30,000,000
35,000,000
40,000,000
45,000,000
2004-2005 2005-2006 2006-2007
10/4/2006 3:32 PM Sumexpen.xls Page 10 of 19

USD# 259
Other Costs(2500 & 2900: Other Supplemental Services)
(2700: Transportation)(3000: Non-Instruction Services)
% %2004-2005 2005-2006 inc/ 2006-2007 inc/
Actual Actual dec Budget dec
General 13,465,447 4,997,795 -63% 5,478,607 10%Federal Funds 1,779,759 2,179,879 22% 1,709,958 -22%Supplemental General 3,599,344 16,790,300 366% 21,341,259 27%At Risk (4yr Old) 0 0 0%At Risk (K-12) 0 0 0%Bilingual Education 311,083 374,622 20% 255,676 -32%Capital Outlay 0 0 0% 0 0%Driver Training 71,872 70,430 -2% 45,762 -35%Declining Enrollment 0 0 0%Extraordinary School Program 0 0 0% 0 0%Food Service 16,352,158 18,300,973 12% 19,480,543 6%Professional Development 0 0 0% 0 0%Parent Education Program 0 0 0% 0 0%Summer School 15,625 17,025 9% 12,194 -28%Special Education 14,283,057 13,145,753 -8% 13,872,044 6%Vocational Education 391,022 98,421 -75% 337,434 243%Gifts/Grants 1,349,408 1,680,419 25% 1,680,419 0%Special Liability 0 0 0% 0 0%School Retirement 0 0 0% 0 0%Extraordinary Growth Facilities 0 0 0% 0 0%Special Reserve 0 0 0%KPERS Spec. Ret. Contribution 702,201 849,554 21% 1,104,419 30%Contingency Reserve 0 0 0%Text Book & Student Material 0 0 0%Bond & Interest #1 0 0 0% 0 0%Bond & Interest #2 0 0 0% 0 0%No-Fund Warrant 0 0 0% 0 0%Special Assessment 0 0 0% 0 0%Temporary Note 0 0 0% 0 0%
SUBTOTAL 52,320,976 58,505,171 12% 65,318,315 12%Enrollment (FTE)* 46,905.1 46,905.1 0% 46,943.0 0%Amount per Pupil 1,115 1,247 12% 1,391 12%
Adult Education 0 0 0% 0 0%Adult Supplemental Education 0 0 0% 0 0%Area Vocational School 0 0 0% 0 0%Tuition Reimbursement 0 0 0% 0 0%Special Education Coop 0 0 0% 0 0%TOTAL 52,320,976 58,505,171 12% 65,318,315 12%
NOTE: Gifts/Grants includes private grants and grants from nonfederal sources.
Amount per pupil excludes the following funds: Area Vocational School, Adult Education, Adult Supplemental Education,Special Education Coop and Tuition Reimbursement.
*Enrollment (FTE) includes the enrollment of the district used for state aid and budget authority, and all other preschool enrollmentand kindergarten students attending full time.
Other Costs
0
10,000,000
20,000,000
30,000,000
40,000,000
50,000,000
60,000,000
70,000,000
2004-2005 2005-2006 2006-2007
10/4/2006 3:32 PM Sumexpen.xls Page 11 of 19

USD# 259
Capital Improvements Expenditures (4000)
% %2004-2005 2005-2006 inc/ 2006-2007 inc/
Actual Actual dec Budget dec
General 0 0 0% 0 0%Federal Funds 0 0 0% 0 0%Supplemental General 0 0 0% 0 0%At Risk (4yr Old) 0 0 0%At Risk (K-12) 0 0 0%Bilingual Education 0 0 0% 0 0%Capital Outlay 17,154,430 16,494,640 -4% 35,038,358 112%Driver Training 0 0 0% 0 0%Declining Enrollment 0 0 0%Extraordinary School Program 0 0 0% 0 0%Food Service 0 0 0% 0 0%Professional Development 0 0 0% 0 0%Parent Education Program 0 0 0% 0 0%Summer School 0 0 0% 0 0%Special Education 0 0 0% 0 0%Vocational Education 0 0 0% 0 0%Gifts/Grants 0 0 0% 0 0%Special Liability 0 0 0% 0 0%School Retirement 0 0 0% 0 0%Extraordinary Growth Facilities 0 0 0% 0 0%Special Reserve 0 0 0%KPERS Spec. Ret. Contribution 0 0 0% 0 0%Contingency Reserve 0 0 0%Text Book & Student Material 0 0 0%Bond & Interest #1 0 0 0% 0 0%Bond & Interest #2 0 0 0% 0 0%No-Fund Warrant 0 0 0% 0 0%Special Assessment 224,329 160,705 -28% 500,000 211%Temporary Note 0 0 0% 0 0%
SUBTOTAL 17,378,759 16,655,345 -4% 35,538,358 113%Enrollment (FTE)* 46,905.1 46,905.1 0% 46,943.0 0%Amount per Pupil 371 355 -4% 757 113%
Adult Education 0 0 0% 0 0%Adult Supplemental Education 0 0 0% 0 0%Area Vocational School 0 0 0% 0 0%Tuition Reimbursement 0 0 0% 0 0%Special Education Coop 0 0 0% 0 0%TOTAL 17,378,759 16,655,345 -4% 35,538,358 113%
NOTE: Gifts/Grants includes private grants and grants from nonfederal sources.
Amount per pupil excludes the following funds: Area Vocational School, Adult Education, Adult Supplemental Education,Special Education Coop and Tuition Reimbursement.
*Enrollment (FTE) includes the enrollment of the district used for state aid and budget authority, and all other preschool enrollmentand kindergarten students attending full time.
Capital Improvements (4000)
0
5,000,000
10,000,000
15,000,000
20,000,000
25,000,000
30,000,000
35,000,000
40,000,000
2004-2005 2005-2006 2006-2007
10/4/2006 3:32 PM Sumexpen.xls Page 12 of 19

USD# 259
Debt Services Expenditures (5100)
% %2004-2005 2005-2006 inc/ 2006-2007 inc/
Actual Actual dec Budget dec
General 0 0 0% 0 0%Federal Funds 0 0 0% 0 0%Supplemental General 0 0 0% 0 0%At Risk (4yr Old) 0 0 0%At Risk (K-12) 0 0 0%Bilingual Education 0 0 0% 0 0%Capital Outlay 0 0 0% 0 0%Driver Training 0 0 0% 0 0%Declining Enrollment 0 0 0%Extraordinary School Program 0 0 0% 0 0%Food Service 0 0 0% 0 0%Professional Development 0 0 0% 0 0%Parent Education Program 0 0 0% 0 0%Summer School 0 0 0% 0 0%Special Education 0 0 0% 0 0%Vocational Education 0 0 0% 0 0%Gifts/Grants 0 0 0% 0 0%Special Liability 0 0 0% 0 0%School Retirement 0 0 0% 0 0%Extraordinary Growth Facilities 0 0 0% 0 0%Special Reserve 0 0 0%KPERS Spec. Ret. Contribution 0 0 0% 0 0%Contingency Reserve 0 0 0%Text Book & Student Material 0 0 0%Bond & Interest #1 21,604,438 21,807,388 1% 21,987,113 1%Bond & Interest #2 0 0 0% 0 0%No-Fund Warrant 0 0 0% 0 0%Special Assessment 0 0 0% 0 0%Temporary Note 0 0 0% 0 0%
SUBTOTAL 21,604,438 21,807,388 1% 21,987,113 1%Enrollment (FTE)* 46,905.1 46,905.1 0% 46,943.0 0%Amount per Pupil 461 465 1% 468 1%
Adult Education 0 0 0% 0 0%Adult Supplemental Education 0 0 0% 0 0%Area Vocational School 0 0 0% 0 0%Tuition Reimbursement 0 0 0% 0 0%Special Education Coop 0 0 0% 0 0%TOTAL 21,604,438 21,807,388 1% 21,987,113 1%
NOTE: Gifts/Grants includes private grants and grants from nonfederal sources.
Amount per pupil excludes the following funds: Area Vocational School, Adult Education, Adult Supplemental Education,Special Education Coop and Tuition Reimbursement.
*Enrollment (FTE) includes the enrollment of the district used for state aid and budget authority, and all other preschool enrollmentand kindergarten students attending full time.
Debt Services (5100)
0
5,000,000
10,000,000
15,000,000
20,000,000
25,000,000
2004-2005 2005-2006 2006-2007
10/4/2006 3:32 PM Sumexpen.xls Page 13 of 19

USD# 259
Transfers (5200)
% %2004-2005 2005-2006 inc/ 2006-2007 inc/
Actual Actual dec Budget dec
General 37,938,786 78,130,750 106% 87,504,263 12%Federal Funds 0 0 0% 0 0%Supplemental General 43,101,973 41,443,461 -4% 43,892,700 6%At Risk (4yr Old) 0 0 0%At Risk (K-12) 0 0 0%Bilingual Education 0 0 0% 0 0%Capital OutlayDriver Training 0 0 0% 0 0%Declining Enrollment 0 0 0%Extraordinary School Program 0 0 0% 0 0%Food Service 0 0 0% 0 0%Professional Development 0 0 0% 0 0%Parent Education Program 0 0 0% 0 0%Summer School 0 0 0% 0 0%Special Education 0 0 0% 0 0%Vocational Education 0 0 0% 0 0%Gifts/Grants 0 0 0% 0 0%Special Liability 0 0 0% 0 0%School Retirement 0 0 0% 0 0%Extraordinary Growth Facilities 0 0 0% 0 0%Special Reserve 0 0 0%KPERS Spec. Ret. Contribution 0 0 0% 0 0%Contingency Reserve 0 0 0%Text Book & Student Material 0 0 0%Bond & Interest #1 0 0 0% 0 0%Bond & Interest #2 0 0 0% 0 0%No-Fund Warrant 0 0 0% 0 0%Special Assessment 0 0 0% 0 0%Temporary Note 0 0 0% 0 0%
SUBTOTAL 81,040,759 119,574,211 48% 131,396,963 10%Enrollment (FTE)* 46,905.1 46,905.1 0% 46,943.0 0%Amount per Pupil 1,728 2,549 48% 2,799 10%
Adult Education 0 0 0% 0 0%Adult Supplemental Education 0 0 0% 0 0%Area Vocational School 0 0 0% 0 0%Tuition Reimbursement 0 0 0% 0 0%Special Education Coop 0 0 0% 0 0%TOTAL 81,040,759 119,574,211 48% 131,396,963 10%
NOTE: Gifts/Grants includes private grants and grants from nonfederal sources.
Amount per pupil excludes the following funds: Area Vocational School, Adult Education, Adult Supplemental Education,Special Education Coop and Tuition Reimbursement.
*Enrollment (FTE) includes the enrollment of the district used for state aid and budget authority, and all other preschool enrollmentand kindergarten students attending full time.
Transfers (5200)
0
20,000,000
40,000,000
60,000,000
80,000,000
100,000,000
120,000,000
140,000,000
2004-2005 2005-2006 2006-2007
10/4/2006 3:32 PM Sumexpen.xls Page 14 of 19

USD# 259Miscellaneous Information
Unencumbered Cash Balance by Fund
July 1, 2004 July 1, 2005 July 1, 2006General 273,270 377,923 331,130Federal Funds -895,432 -104,240 -2,321,439Supplemental General 12,109,880 7,186,985 4,128,170At Risk (4yr Old) 126,638At Risk (K-12) 0Bilingual Education 0 0 410Capital Outlay 13,041,340 18,707,028 31,076,125Driver Training 495,579 510,930 767,216Declining Enrollment 0Extraordinary School Program 661,493 379,969 802,856Food Service 4,826,008 4,388,190 3,162,649Professional Development 983,967 986,131 875,943Parent Education Program 28,609 3,647 22,818Summer School 164,416 632,171 521,825Special Education 10,449,249 11,840,820 13,771,103Vocational Education 0 0 12,375Gifts/Grants 3,304,794 3,478,017 4,101,044Special Liability 2,003,774 2,148,497 2,837,310School Retirement 0 0 0Extraordinary Growth Facilities 0 0 0Special Reserve 24,760,436 23,597,382KPERS Spec. Ret. Contribution 0 0Contingency Reserve 9,715,861 9,774,472Text Book & Student Material 5,548,808 7,747,818Bond & Interest 1 20,813,522 21,922,779 21,526,254Bond & Interest 2 0 0 0No Fund Warrant 0 0 0Special Assessment 863,599 1,255,219 1,274,779Temporary Note 0 0 0
SUBTOTAL 109,149,173 114,833,738 83,017,206Enrollment (FTE)* 46,905.1 46,905.1 46,943.0Amount per Pupil 2,327 2,448 1,768
Adult Education 1,375,724 1,217,584 1,216,982Adult Supplemental Education 0 0 0Area Vocational School 0 0 0Tuition Reimbursement 0 0 0Special Education Coop 0 0 0TOTAL 110,524,897 116,051,322 84,234,188
NOTE: Gifts/Grants includes private grants and grants from nonfederal sources.
Amount per pupil excludes the following funds: Area Vocational School, Adult Education, Adult Supplemental Education,Special Education Coop and Tuition Reimbursement.
*Enrollment (FTE) includes the enrollment of the district used for state aid and budget authority, and all other preschool enrollmentand kindergarten students attending full time.
Unencumbered Cash Balances by Fund
0
20,000,000
40,000,000
60,000,000
80,000,000
100,000,000
120,000,000
140,000,000
2004 2005 2006
10/4/2006 3:32 PM Sumexpen.xls Page 15 of 19

USD# 259
Reserve FundsUnencumbered Cash Balance
July 1, 2004 July 1, 2005Special Reserve 24,760,436 23,597,382TOTAL OTHER 24,760,436 23,597,382Amount per Pupil $528 $503
*School districts are authorized by law to self insure rather than purchase insurance for the following categories: Worker's Comp,Health Insurance, Life Insurance, Property and Casualty (Risk Management) and Disability Income Insurance. Monies are placedin the Self Insured Fund to pay for claims which may arise from the categories listed above.
Unencumbered Cash Balances by Fund (Reserve Funds Only)
0
5,000,000
10,000,000
15,000,000
20,000,000
25,000,000
30,000,000
2004 2005
10/4/2006 3:32 PM Sumexpen.xls Page 16 of 19

USD# 259Other Information
2002-2003 2003-2004 % 2004-2005 % 2005-2006 % 2006-2007 %Actual Actual inc/ Actual inc/ Actual inc/ Budget inc/
dec dec dec dec
Enrollment (FTE)* 44,805.5 44,641.8 0% 44,438.3 0% 44,456.2 0% 44,456.2 0%
Enrollment (FTE)** 46,373.5 46,865.1 1% 46,905.1 0% 46,905.1 0% 46,943.0 0%Number of Students - Free Meals 23,426 25,485 9% 26,247 3% 26,706 2% 26,709 0%Number of Students - Reduced Meals 5,943 5,569 -6% 5,555 0% 5,657 2% 5,569 -2%
*FTE for state aid and budget authority purposes for general fund (excludes 4yr at-risk.)
** FTE includes 9/20 enrollment used for state aid purposes and adding the additional FTE for preschool programs, headstart, and all-daykindergarten. For example, preschool students attending half days on September 20th would be counted as .5 FTE. Kindergartenstudents attending full time every day would be counted as 1.0 FTE.
Enrollment (FTE)* for Budget Authority
0.0
5000.0
10000.0
15000.0
20000.0
25000.0
30000.0
35000.0
40000.0
45000.0
50000.0
2002-2003 2003-2004 2004-2005 2005-2006 2006-2007
Low Income Students
0
5000
10000
15000
20000
25000
30000
2002-2003 2003-2004 2004-2005 2005-2006 2006-2007
Free MealsReduced Meals
Enrollment (FTE)** Used for Calculating "Amount Per Pupil"
46000.046100.046200.046300.046400.046500.046600.046700.046800.046900.047000.0
2002-2003 2003-2004 2004-2005 2005-2006 2006-2007
10/4/2006 3:32 PM Sumexpen.xls Page 17 of 19

USD# 259
Miscellaneous InformationMill Rates by Fund
2004-2005 2005-2006 2006-2007Actual Actual Budget
General 20.000 20.000 20.000Supplemental General 16.257 17.679 18.293Adult Education 0.499 0.500 0.000Capital Outlay 6.990 7.000 7.000Declining Enrollment 0.000 0.000Special Liability 0.367 0.114 0.000School Retirement 0.000 0.000 0.000Extraordinary Growth Facilities 0.000 0.000 0.000Bond & Interest 1 6.974 6.007 6.007Bond & Interest 2 0.000 0.000 0.000No Fund Warrant 0.000 0.000 0.000Special Assessment 0.209 0.000 0.000Temporary Note 0.000 0.000 0.000TOTAL USD 51.296 51.300 51.300Historical Museum 0.000 0.000 0.000Public Library Board 0.000 0.000 0.000Public Library Brd & Emp Benf 0.000 0.000 0.000Recreation Commission 0.000 0.000 0.000Recreation Commission Employee Benefit 0.000 0.000 0.000TOTAL OTHER 0.000 0.000 0.000
2006-2007 Miscellaneous InformationMill Rates by Fund (Total USD)
General38%
Supplemental General36%
Capital Outlay14%
Bond & Interest 112%
GeneralSupplemental GeneralAdult EducationCapital OutlaySpecial LiabilitySchool RetirementDeclining EnrollmentBond & Interest 1Bond & Interest 2Extraordinary Growth FacilitiesNo Fund WarrantSpecial AssessmentTemporary Note
Total USD Mill Rates
0.000
10.000
20.000
30.000
40.000
50.000
60.000
2004-2005 2005-2006 2006-2007
10/4/2006 3:32 PM Sumexpen.xls Page 18 of 19
USD# 259Other Information
2004-2005 2005-2006 2006-2007Actual Actual Budget
Assessed Valuation $2,252,820,055 $2,338,971,843 $2,435,215,008
Bonded Indebtedness $252,705,000 $311,260,000 $300,585,000
Assessed Valuation
$0
$500,000,000
$1,000,000,000
$1,500,000,000
$2,000,000,000
$2,500,000,000
$3,000,000,000
2004-2005 2005-2006 2006-2007
Bonded Indebtedness
$0
$50,000,000
$100,000,000
$150,000,000
$200,000,000
$250,000,000
$300,000,000
$350,000,000
2004-2005 2005-2006 2006-2007
10/4/2006 3:32 PM Sumexpen.xls Page 19 of 19