Embed Size (px)
Citation preview

U.S. Department of Agriculture | Food and Nutrition Service | Office of Policy Support | November 2015
WIC Participant and Program Characteristics Final Report

WIC Participant and Program Characteristics 2014
Final Report
November 2015
Authors: Betsy Thorn
Chrystine Tadler Nicole Huret Elaine Ayo
Carole Trippe
Michele Mendelson (Abt) Kelly Lawrence Patlan (Abt)
Gabriel Schwartz (Abt) Vinh Tran (Abt)
Submitted to: Office of Policy Support Food and Nutrition Service U.S. Department of Agriculture 3101 Park Center Drive Alexandria, VA 22302
Submitted by: Insight Policy Research 1901 N. Moore Street Suite 1100 Arlington, VA 22209
This study was conducted under Contract No. AG-3198-C-11-0010 with the Food and Nutrition Service. This report is available on the Food and Nutrition Service Web site at http://www.fns.usda.gov/wic-participant-and-program-characteristics-2014 Suggested Citation: Thorn, B., Tadler, C., Huret, N., Trippe, C., Ayo, E., Mendelson, M., Patlan, K. L., Schwartz, G., & Tran, V. (2015). WIC Participant and Program Characteristics 2014. Prepared by Insight Policy Research under Contract No. AG-3198-C-11-0010. Alexandria, VA: U.S. Department of Agriculture, Food and Nutrition Service.

TABLE OF CONTENTS EXECUTIVE SUMMARY ............................................................................................................................................ I
A. THE 2014 REPORT .................................................................................................................................... II B. THE 2014 WIC PROGRAM ........................................................................................................................ III C. PARTICIPANT CHARACTERISTICS IN 2014 ................................................................................................ III
I. INTRODUCTION ................................................................................................................................. 1
A. PROGRAM OPERATIONS .......................................................................................................................... 2 B. PARTICIPANT BENEFITS ............................................................................................................................ 5 C. ELIGIBILITY FOR WIC BENEFITS ................................................................................................................. 6 D. PREVIOUS REPORTS ON WIC PARTICIPANT AND PROGRAM CHARACTERISTICS ..................................... 8 E. REPORT ON WIC PARTICIPANT AND PROGRAM CHARACTERISTICS 2014 ............................................. 13 F. ORGANIZATION OF THE REPORT ............................................................................................................ 15
II. OVERVIEW OF WIC PARTICIPATION AND DEMOGRAPHICS OF WIC PARTICIPANTS ......................... 17
A. WIC PARTICIPATION ............................................................................................................................... 17 B. AGE ......................................................................................................................................................... 21 C. TRIMESTER OF ENROLLMENT ................................................................................................................. 21 D. REGION ................................................................................................................................................... 24 E. RACE AND ETHNICITY ............................................................................................................................. 24
III. INCOME OF WIC PARTICIPANTS ...................................................................................................... 32
A. PARTICIPATION IN OTHER BENEFIT PROGRAMS .................................................................................... 32 B. HOUSEHOLD SIZE AND INCOME ............................................................................................................. 34 C. POVERTY STATUS ................................................................................................................................... 42
IV. NUTRITIONAL RISK CHARACTERISTICS ............................................................................................. 54
A. NUTRITIONAL RISK CRITERIA .................................................................................................................. 57 B. NUTRITIONAL RISKS BY DEMOGRAPHIC AND ECONOMIC CHARACTERISTICS ....................................... 59 C. ANTHROPOMETRIC VALUES ................................................................................................................. 109 D. BLOOD MEASURES ............................................................................................................................... 123
V. RISK PRIORITY LEVELS ................................................................................................................... 133
A. OVERVIEW OF RISK PRIORITY LEVELS ................................................................................................... 133 B. RISK PRIORITY LEVELS OF WIC PARTICIPANTS IN 2014 ........................................................................ 134 C. SHIFTS IN RISK PRIORITY LEVELS BETWEEN 2012 AND 2014 ............................................................... 139
VI. BREASTFEEDING OF WIC INFANTS ................................................................................................. 141
A. BREASTFEEDING INITIATION RATES ..................................................................................................... 141 B. BREASTFEEDING DURATION ................................................................................................................. 146
VII. CHARACTERISTICS OF MIGRANT WIC PARTICIPANTS ..................................................................... 152
A. DEMOGRAPHIC CHARACTERISTICS OF MIGRANT WIC PARTICIPANTS ................................................. 152 B. INCOME OF MIGRANT WIC PARTICIPANTS .......................................................................................... 157 C. NUTRITIONAL RISK CHARACTERISTICS OF MIGRANT WIC PARTICIPANTS............................................ 163 D. WIC RISK PRIORITY LEVELS OF MIGRANT WIC PARTICIPANTS ............................................................. 170
ABBREVIATIONS AND ACRONYMS ................................................................................................................... AA-1
REFERENCES ....................................................................................................................................................... R-1
APPENDIX A: CHAPTER II SUPPLEMENTAL TABLES AND FIGURES ........................................................................A-1

APPENDIX B: CHAPTER III SUPPLEMENTAL TABLE ............................................................................................... B-1
APPENDIX C: CHAPTER IV SUPPLEMENTAL TABLES ............................................................................................. C-1
APPENDIX D: CHAPTER VI SUPPLEMENTAL TABLES ............................................................................................ D-1
APPENDIX E: CHAPTER VII SUPPLEMENTAL TABLES ............................................................................................ E-1
APPENDIX F: SUPPLEMENTAL DATA SET ............................................................................................................. F-1

LIST OF TABLES
Chapter I Table I.1. Distribution of Local WIC Agencies and WIC Participants by State WIC Agency ...................................... 3 Table I.2. Minimum Data Set Variables and Definitions: Guidance to State WIC Agencies ..................................... 9 Table I.3. Supplemental Data Set Variables and Definitions: Guidance to State WIC Agencies ............................ 12
Chapter II Table II.1. Percent Distribution of WIC Participants by Participant Category: 2012, 2014 .................................... 19 Table II.2. Distribution of WIC Participants by Participant Category: 1992–2014 .................................................. 20 Table II.3. Distribution of Age of WIC Participants at Certification by WIC Participant Category:
2010, 2012, 2014 .................................................................................................................................... 22 Table II.4. Distribution of Pregnant Women WIC Participants by Trimester of Enrollment: 2010, 2012, 2014 .... 23 Table II.5. Distribution of WIC Participants by Region: 2010, 2012, 2014 .............................................................. 24 Table II.6. Percent Distribution of Race and Ethnicity Of WIC Participants (2014) and General U.S.
Population (2013) ................................................................................................................................... 27 Table II.7. Percent Distribution of Race and Ethnicity of WIC Women, Infants, and Children: 2012, 2014 ........... 28 Table II.8. Percent Distribution of Ethnicity by Race of WIC Participants ............................................................... 29 Table II.9. Percent Distribution of Race and Ethnicity of WIC Participants by Participant Category ...................... 30 Table II.10. Percent Distribution of Race and Ethnicity of WIC Participants by Region ............................................ 31
Chapter III Table III.1. Number and Percent of WIC Participants With Reported Participation in Other Programs
at Certification ........................................................................................................................................ 34 Table III.2. Distribution of the Size of Families or Economic Units of WIC Participants by Participant Category .... 37 Table III.3. Mean and Median Annualized Family or Economic Unit Income of WIC Participants by
Participant Category ............................................................................................................................... 38 Table III.4. Average Annualized Family or Economic Unit Income of WIC Participants by Participant Category
and Race ................................................................................................................................................. 39 Table III.5. Average Annualized Family or Economic Unit Income of WIC Participants by Participant Category
and Ethnicity .......................................................................................................................................... 41 Table III.6. Poverty Status of WIC Participants: 2010, 2012, 2014........................................................................... 44 Table III.7. Distribution of Income as a Percent of Federal Poverty Guideline of WIC Participants by
Participant Category ............................................................................................................................... 45 Table III.8. Distribution of Income as a Percent of Federal Poverty Guideline of WIC Participants by
Participant Category and Race ............................................................................................................... 46 Table III.9. Distribution of Income as a Percent of Federal Poverty Guideline of WIC Participants by
Participant Category and Ethnicity ......................................................................................................... 50 Table III.10. Distribution of Income as a Percent of Federal Poverty Guideline at Certification for WIC
Participants Reporting No Other Benefit Receipt ................................................................................. 52 Table III.11. Poverty Status of WIC Participants Reporting Income Versus General U.S. Population: 2014 .............. 53
Chapter IV Table IV.1. Broad Categories of FNS-Issued Specific Nutritional Risks ..................................................................... 56 Table IV.2. Distribution of Number of Nutritional Risk Factors for WIC Participants Reported at Certification:
2010, 2012, 2014 .................................................................................................................................... 58 Table IV.3. Number and Percent of WIC Participants With Specific Nutritional Risks Reported at Certification ... 63 Table IV.4. Number and Percent of Women WIC Participants by Participant Category, Age at Certification,
and Broad Category of Nutritional Risk Reported ................................................................................. 64

Table IV.5. Number and Percent of Infant and Child WIC Participants by Age at Certification and Broad Category of Nutritional Risk Reported ................................................................................................... 65
Table IV.6. Number and Percent of Women WIC Participants by Participant Category With Specific Nutritional Risks Reported ..................................................................................................................... 66
Table IV.7. Number and Percent of Infant WIC Participants With Specific Nutritional Risks Reported by Age at Certification ........................................................................................................................................ 67
Table IV.8. Number and Percent of Child WIC Participants With Specific Nutritional Risks Reported by Age at Certification ........................................................................................................................................ 68
Table IV.9. Nutritional Risks Reported for at Least 15 Percent of WIC Participants: 2010, 2012, 2014 .................. 69 Table IV.10. Nutritional Risks Reported for at Least 15 Percent Of Pregnant WIC Participants by Age
at Certification ........................................................................................................................................ 70 Table IV.11. Number and Percent of American Indian or Alaska Native Only WIC Participants With Specific
Nutritional Risks Reported by Participant Category .............................................................................. 71 Table IV.12. Number and Percent of Asian Only WIC Participants With Specific Nutritional Risks Reported by
Participant Category ............................................................................................................................... 73 Table IV.13. Number and Percent of Black or African American Only WIC Participants With Specific Nutritional
Risks Reported by Participant Category ................................................................................................. 75 Table IV.14. Number and Percent of Native Hawaiian or Other Pacific Islander Only WIC Participants With
Specific Nutritional Risks Reported by Participant Category ................................................................. 77 Table IV.15. Number and Percent of White Only WIC Participants With Specific Nutritional Risks Reported by
Participant Category ............................................................................................................................... 79 Table IV.16. Number and Percent of WIC Participants With Two or More Races Reported and With Specific
Nutritional Risks Reported by Participant Category ............................................................................... 81 Table IV.17. Number and Percent of Hispanic/Latino WIC Participants With Specific Nutritional Risks
Reported by Participant Category .......................................................................................................... 83 Table IV.18. Number and Percent of Not Hispanic/Latino WIC Participants With Specific Nutritional Risks
Reported by Participant Category .......................................................................................................... 85 Table IV.19. Nutritional Risks Reported for at Least 15 Percent Of American Indian or Alaska Native Only WIC
Participants by Participant Category ..................................................................................................... 87 Table IV.20. Nutritional Risks Reported for at Least 15 Percent Of Asian Only WIC Participants by
Participant Category ............................................................................................................................... 88 Table IV.21. Nutritional Risks Reported for at Least 15 Percent Of Black or African American Only WIC
Participants by Participant Category ...................................................................................................... 89 Table IV.22. Nutritional Risks Reported for at Least 15 Percent Of Native Hawaiian or Other Pacific Islander
Only WIC Participants by Participant Category ...................................................................................... 90 Table IV.23. Nutritional Risks Reported for at Least 15 Percent Of White Only WIC Participants by
Participant Category ............................................................................................................................... 91 Table IV.24. Nutritional Risks Reported for at Least 15 Percent Of WIC Participants With Two or More Races
Reported by Participant Category .......................................................................................................... 92 Table IV.25. Nutritional Risks Reported for at Least 15 Percent Of Hispanic/Latino WIC Participants by
Participant Category ............................................................................................................................... 93 Table IV.26. Nutritional Risks Reported for at Least 15 Percent Of Non-Hispanic/Latino WIC Participants by
Participant Category ............................................................................................................................... 94 Table IV.27. Number and Percent of Women WIC Participants With Specific Nutritional Risks Reported at
Certification by Income as a Percent of Federal Poverty Guideline ....................................................... 95 Table IV.28. Number and Percent of Infant WIC Participants With Specific Nutritional Risks Reported at
Certification by Income as a Percent of Federal Poverty Guideline ....................................................... 97 Table IV.29. Number and Percent of Child WIC Participants With Specific Nutritional Risks Reported at
Certification by Income as a Percent of Federal Poverty Guideline ....................................................... 99 Table IV.30. Number and Percent of 1-Year-Old Child WIC Participants With Specific Nutritional Risks
Reported at Certification by Income as a Percent of Federal Poverty Guideline ................................. 101 Table IV.31. Number and Percent of 2-Year-Old Child WIC Participants With Specific Nutritional Risks
Reported at Certification by Income as a Percent of Federal Poverty Guideline ................................. 103
Table IV.32. Number and Percent of 3-Year-Old Child WIC Participants With Specific Nutritional Risks Reported at Certification by Income as a Percent of Federal Poverty Guideline ................................. 105
Table IV.33. Number and Percent of 4-Year-Old Child WIC Participants With Specific Nutritional Risks Reported at Certification by Income as a Percent of Federal Poverty Guideline ................................. 107
Table IV.34. Distribution of Infant WIC Participants According to Selected Anthropometric Measures: 2014 ...... 113 Table IV.35. Distribution of Infant WIC Participants by Race According to Selected Anthropometric Measures ... 114 Table IV.36. Distribution of Infant WIC Participants by Ethnicity According to Selected
Anthropometric Measures ................................................................................................................... 115 Table IV.37. Number and Percent of Infant and 1-Year-Old Child WIC Participants at Risk According to
FNS-Issued Nutritional Risk Criteria for Anthropometric Measures .................................................... 116 Table IV.38. Distribution of Child WIC Participants by Age According to Selected Anthropometric
Measures: 2014 .................................................................................................................................... 117 Table IV.39. Distribution of Child WIC Participants by Age and Race According to Selected
Anthropometric Measures ................................................................................................................... 118 Table IV.40. Distribution of Child WIC Participants by Age and Ethnicity According to Selected
Anthropometric Measures ................................................................................................................... 120 Table IV.41. Number and Percent of Child WIC Participants Aged 2 or Older at Risk According to FNS-Issued
Nutritional Risk Criteria for Anthropometric Measures ....................................................................... 121 Table IV.42. Number and Percent of Breastfeeding and Postpartum Women WIC Participants at Risk
According to FNS-Issued Nutritional Risk Criteria for Anthropometric Measures ............................... 122 Table IV.43. FNS-Issued Nutritional Risk Eligibility For Hemoglobin and Hematocrit Levels .................................. 125 Table IV.44. Availability of Hematological Data for WIC Participants: Percent of WIC Participants by
Participant Category With Specific Types of Hematological Measures ............................................... 126 Table IV.45. Number and Percent of Women WIC Participants Falling Below FNS-Issued Nutritional Risk
Criteria for Hematologic Standards ...................................................................................................... 127 Table IV.46. Number and Percent of Child WIC Participants Falling Below FNS-Issued Nutritional Risk
Criteria for Hematologic Standards ...................................................................................................... 128 Table IV.47. Number and Percent of Anemic Women WIC Participants by Participant Category and Race ........... 129 Table IV.48. Number and Percent of Anemic Women WIC Participants by Participant Category and Ethnicity ..... 130 Table IV.49. Number and Percent of Anemic Child WIC Participants by Age and Race at Time of
Blood Measurement ............................................................................................................................ 131 Table IV.50. Number and Percent of Anemic Child WIC Participants by Age and Ethnicity at Time of
Blood Measurement ............................................................................................................................ 132
Chapter V Table V.1. WIC Risk Priorities ................................................................................................................................ 134 Table V.2. Risk Priority Levels of All WIC Participants by Participant Category .................................................... 136 Table V.3. Risk Priority Levels of Infant WIC Participants by Age at Certification ................................................. 137 Table V.4. Risk Priority Levels of Child WIC Participants by Age at Certification .................................................. 138 Table V.5. Risk Priority Levels by Participants Category: 2012, 2014.................................................................... 140
Chapter VI Table VI.1. Breastfeeding Initiation Rates for WIC Infants and Children Aged 6–13 Months in April 2014
by State ................................................................................................................................................ 143 Table VI.2. Changes in Breastfeeding Initiation Rates for WIC Infants in April: 1998–2014 .................................. 145 Table VI.3. Breastfeeding Duration for WIC Infants and Children Aged 6–13 Months in April 2014 by State ...... 148 Table VI.4. Estimated Breastfeeding Duration by State: Number and Percent of WIC Infants and Children
Aged 6–13 Months in April 2014 Breastfeeding for 6 Months or More ............................................. 150
Chapter VII Table VII.1. Distribution of WIC Participants by Migrant Status and WIC Certification Category ........................... 154 Table VII.2. Distribution of Migrant WIC Participants by Participant Category and Age at Certification............... 155

Table VII.3. Distribution of Migrant Pregnant Women WIC Participants by Trimester of Enrollment ................... 156 Table VII.4. Number and Percent of Migrant WIC Participants With Reported Participation in Other
Programs at Certification ..................................................................................................................... 159 Table VII.5. Mean and Median Annualized Family or Economic Unit Income of WIC Participants by
Participant Category and Migrant Status ............................................................................................. 160 Table VII.6. Distribution of Income as a Percent of Federal Poverty Guideline of WIC Participants by
Participant Category and Migrant Status ............................................................................................. 161 Table VII.7. Nutritional Risks Reported for at Least 15 Percent Of Migrant WIC Participants by
Participant Category ............................................................................................................................. 165 Table VII.8. Number and Percent of Migrant WIC Participants With Specific Nutritional Risks Reported by
Participant Category ............................................................................................................................. 166 Table VII.9. Number and Percent of Anemic Migrant WIC Participants by Participant Category ........................... 168 Table VII.10. Distribution of Infant and Child Migrant WIC Participants According to Selected
Anthropometric Measures ................................................................................................................... 169 Table VII.11. Risk Priority Levels of Migrant WIC Participants by Participant Category ........................................... 171
APPENDICES
Appendix A Table A.II.1. Number and Percent of WIC Participants by Participant Category and State ..................................... A-1 Table A.II.6. Distribution of Race for WIC Participants With Two or More Races Reported .................................... A-5 Table A.II.7. Distribution of Racial and Ethnic Characteristics of WIC Women, Infants, and Children:
2010, 2012, 2014 .................................................................................................................................. A-6 Table A.II.8. Distribution of Race and Ethnicity of WIC Participants ........................................................................ A-8 Table A.II.9. Distribution of Race and Ethnicity of WIC Participants by Participant Category ................................. A-9
Appendix B Table B.III.7. Distribution of WIC Participants According to Income as a Percent of Federal Poverty Guideline
by Participant Category: 2010, 2012, 2014 .......................................................................................... B-1
Appendix C Table C.IV.1. Broad Categories, Specific Nutritional Risks, and Risk Criteria ............................................................ C-1 Table C.IV.34.Distribution of Infant WIC Participants According to Selected Anthropometric Measures:
2010, 2012, 2014 .................................................................................................................................. C-5 Table C.IV.35.Distribution of Infant WIC Participants by Race According to Selected
Anthropometric Measures ................................................................................................................... C-6 Table C.IV.36.Distribution of Infant WIC Participants by Ethnicity According to Selected
Anthropometric Measures ................................................................................................................... C-7 Table C.IV.38.Distribution of Child WIC Participants by Age According to Selected Anthropometric Measures:
2010, 2012, 2014 .................................................................................................................................. C-8 Table C.IV.39.Distribution of Child WIC Participants by Age and Race According to Selected
Anthropometric Measures ................................................................................................................... C-9 Table C.IV.40.Distribution of Child WIC Participants by Age and Ethnicity According to Selected
Anthropometric Measures ................................................................................................................. C-11
Appendix D Table D.VI.1. Breastfeeding Initiation Rates for WIC Infants Aged 7–11 Months in April 2014 by State .................. D-1 Table D.VI.3. Changes in Breastfeeding Initiation Rates for WIC Infants Aged 7–11 Months in April,
1998–2014 ......................................................................................................................................... D-12 Table D.VI.4. Breastfeeding Duration for WIC Infants Aged 7–11 Months in April 2014 by State .......................... D-13 Table D.VI.5. Estimated Breastfeeding Duration by State: Number and Percent of WIC Infants Aged 7–11
Months in April 2014 Breastfeeding for 6 Months or More .............................................................. D-16

Appendix E Table E.VII.1. Distribution of Migrant WIC Participants by State ............................................................................... E-1
Appendix F Table F.1. States Reporting Supplemental Data Set Items .................................................................................... F-1 Table F.2. Distribution of Birth Weights for Infant and Child WIC Participants by State ....................................... F-2 Table F.3. Distribution of Birth Weights for Infant and Child Migrant WIC Participants by State ......................... F-5 Table F.4. Mean Birth Weight in Grams of WIC Infants by Race and State ........................................................... F-7 Table F.5. Mean Birth Weight in Grams of WIC Infants by Ethnicity and State ................................................... F-18 Table F.6. Mean Birth Weight in Grams of WIC Children by Race and State ....................................................... F-25 Table F.7. Mean Birth Weight in Grams of WIC Children by Ethnicity and State ................................................ F-36 Table F.8. Length of Enrollment in WIC for Women WIC Participants for Most Recent Pregnancy From
First WIC Certification to April 30, 2014, by Participant Category and State ...................................... F-43 Table F.9. Length of Enrollment in WIC for Infant and Child WIC Participants From First WIC Certification
to April 30, 2014, by Age and State ..................................................................................................... F-57 Table F.10. Years of Education Reported by Women WIC Participants by Participant Category and State .......... F-71 Table F.11. Distribution of Total Number of Pregnancies for Pregnant Women WIC Participants by State ......... F-81 Table F.12. Distribution of Total Number of Live Births for Pregnant Women WIC Participants by State ............ F-84 Table F.13. Short Stature at Birth Among WIC Infants and Children by State: Number and Percent at or
Below 2.3rd Percentile for Birth Length .............................................................................................. F-87 Table F.14. Number of Household Members Who Received WIC Benefits by Participant Category and State .... F-90 Table F.15a. Prepregnant Body Mass Index for Pregnant Women WIC Participants by State Weight
Categories in Effect Prior to Revision 10 to the Nutritional Risk Criteria ..........................................F-102 Table F.15b. Prepregnant Body Mass Index for Pregnant Women WIC Participants by State Weight
Categories as Defined in Revision 10 to the Nutritional Risk Criteria ...............................................F-105 Table F.16. Mean Weight Gain During Pregnancy for Mothers Who Received WIC by Race and State .............F-108 Table F.17. Mean Weight Gain During Pregnancy for Mothers Who Received WIC by Ethnicity and State .......F-118 Table F.18. Lapsed Time in Months Between Last and Current Pregnancies for Pregnant Women WIC
Participants by State .........................................................................................................................F-125

LIST OF FIGURES
Executive Summary Figure ES.1. Number of WIC Participants by Category and Age of Children: April 2014 ............................................ iii Figure ES.2. Distribution of Individuals Who Participated in WIC............................................................................... iv Figure ES.3. Poverty Status of WIC Participants Reporting Income Versus General U.S. Population ........................ vi Figure ES.4. Breastfeeding Initiation Rates by State for WIC Infant Participants Aged 6–13 Months, April 2014 .. viii Figure ES.5. Distribution of Migrant WIC Participants by State, April 2014 ............................................................... ix
Chapter I Figure I.1. WIC Participation by State, April 2014 Total WIC Participation: 9,303,253 ........................................... 14
Chapter II Figure II.1. Total WIC Participants: 1992–2014 ........................................................................................................ 18 Figure II.2. Distribution of Race and Ethnicity of WIC Participants .......................................................................... 25
Chapter III Figure III.1. Number and Percent of WIC Participants With Reported Participation in Other Programs at
Certification: 2008, 2010, 2012, 2014 .................................................................................................... 33
Chapter VII Figure VII.1. Distribution of Migrant WIC Participants by State, April 2014 ............................................................ 152 Figure VII.2. Percent of Overall U.S. and Migrant WIC Participants With Reported Participation in
Other Programs .................................................................................................................................... 157 Figure VII.3. Mean Annual Income for Migrant WIC Participants and Nonmigrant WIC Participants:
2010–2014 ........................................................................................................................................... 158
APPENDICES
Appendix A Figure A.II.7. Distribution of Racial and Ethnic Characteristics of WIC Participants: 1992–2014 .............................. A-7
Appendix D Figure D.VI.2.Breastfeeding Initiation Rates by State for WIC Infants Aged 7–11 Months in April,
1998–2014 ........................................................................................................................................... D-3

ACKNOWLEDGMENTS
This report was prepared by Insight Policy Research, Inc. (Insight) under Contract Number AG-3198-C-11-0010 from the U.S. Department of Agriculture, Food and Nutrition Service. It represents a team effort in which many individuals made key contributions in addition to the authors. We gratefully acknowledge their assistance. In particular, we would like to recognize Janis Johnston and Anna Potter, Project Officers, for their leadership and guidance. We would also like to thank the numerous FNS staff who have provided support, expert advice, and encouragement to the Insight team. Their insightful comments on the interim deliverables and throughout the study greatly improved this research. The authors would also like to express our appreciation to the dedicated individuals in each of the 90 State agencies that participated in PC2014. Their time and effort to provide complete and accurate data files made this research possible. The authors would like to acknowledge numerous individuals from Insight and Abt Associates, Inc. (Abt) who provided valuable assistance throughout this study. In particular, from Insight, we would like to thank Danielle Llanos and Michelle Bennett whose work with the WIC State agencies, data diagnostics, and data cleaning was invaluable. We also thank Alexandra Suchman (Insight) for her amazing management and organization of all aspects of the study. From Abt, we would like to thank Don Laliberty, whose programming expertise was essential to the comprehensive analysis of these data. Also from Abt, we would like to thank Amar Patel and Brian Freeman for their work on review of the report tabulations. Also from Insight, we would like to thank Dar Haddix for editing this report and Daven Ralston for her assistance with production. Anne Peterson (Insight), Susan Bartlett (Abt), Brittany McGill (Insight), and Denise Bellows (Insight) all provided useful suggestions on the content of this report.
WIC Participant and Program Characteristics: 2014 Final Report
Page i
EXECUTIVE SUMMARY
The Special Supplemental Nutrition Program for Women, Infants, and Children (WIC) is administered by the Food and Nutrition Service (FNS) of the U.S. Department of Agriculture (USDA). WIC benefits include nutritious supplemental foods; nutrition education; counseling, including breastfeeding promotion and support; and referrals to health care, social services, and other community providers for pregnant, breastfeeding, and postpartum women, infants, and children up to the age of 5 years.1 For pregnant women, WIC seeks to improve fetal development and reduce the incidence of low birth weight, short gestation, and anemia through intervention during the prenatal period. For infants and children, WIC seeks to provide nutritious foods during critical times of growth and development to prevent health problems and improve their health status. For breastfeeding and postpartum women, WIC also seeks to improve dietary intake and promotes breastfeeding as the optimal method of infant feeding.
To receive WIC benefits, an individual must be categorically eligible: a pregnant, breastfeeding, or postpartum woman;2 an infant up to the age of 1 year; or a child aged 1 through his or her fifth birthday. In addition, each applicant must be income eligible and at nutritional risk. Eligible applicants receive supplemental food, usually in the form of vouchers, checks, or electronic benefit transfer (EBT) cards that allow them to obtain specific types of food (for example, milk, juice, and cereal) from participating retail vendors at no charge.
WIC was established in 1972 by an amendment to the Child Nutrition Act of 1966 (Pub. L. 89–642). In April 2014, 9.3 million women, infants, and children participated in WIC. The full fiscal year 2014 appropriation for the program was $6.72 billion. WIC is not an entitlement program.
Since 1988, FNS has produced biennial reports on participant and program characteristics in WIC. This information is used for general program monitoring as well as for managing the information needs of the program. FNS uses this regularly updated WIC information to estimate budgets, submit civil rights reporting, identify research needs, and review current and proposed WIC policies and procedures. The biennial reports include information on the following:
• Demographic, income, and nutritional risk characteristics of WIC participants
• Breastfeeding initiation and duration by State
• WIC participation for migrant farm worker families
• Other topics that are deemed appropriate by the Secretary of Agriculture
This publication is the 14th report in the WIC Participant and Program Characteristics (PC) study series.
1 Children may participate in WIC through 4 years of age, but are no longer eligible upon their fifth birthdays. 2 Pregnant women are eligible during pregnancy and up to 6 weeks after the birth of an infant or the end of the pregnancy; breastfeeding women are eligible up to the infant’s first birthday; and postpartum women are eligible up to 6 months after the birth of the infant or the end of the pregnancy.

WIC Participant and Program Characteristics: 2014 Final Report
Page ii
A. THE 2014 REPORT
Like all biennial WIC PC reports since 1992, the 2014 report (PC2014) employs the prototype reporting system developed by FNS that uses participant information compiled from State WIC agencies. The reports, including PC2014, contain information on a census of WIC participants in April of the reporting year.3
In this report, the term “participants” is defined as persons on WIC master lists or persons listed in WIC operating files who are certified to receive WIC benefits in April 2014. This definition differs from WIC’s regulatory definition of participants, which is based on an actual claim of WIC benefits that generally includes receipt of a WIC food instrument. Also included in WIC PC are those included in the regulatory definition of participants: partially breastfeeding women who receive no WIC foods or food instruments but who are partially breastfeeding their infants who are receiving WIC foods or food instruments, and infants who receive no WIC foods or food instruments but are being fully breastfed by their mothers who are receiving WIC food or food instruments. The definitional difference of individuals certified to receive benefits rather than actual claim or receipt of benefits results in a count of PC2014 WIC participants that is approximately 11 percent greater than the number of participants in regular program accounting reports for April 2014. This percentage difference is similar to previously reported differences in these biennial statistics.
1. Participant Records
The current system for reporting participant data is based on the automated transfer of an agreed-upon set of data elements. State WIC agencies download routinely collected information from their existing automated client and management information systems. State and local WIC staff use these data to certify applicant eligibility for WIC benefits and to issue food instruments. This set of 20 agreed-upon items is known as the Minimum Data Set (MDS) and was developed by FNS working with the Information Committee of the National WIC Association (formerly the National Association of WIC Directors) and the Centers for Disease Control and Prevention (CDC).
For PC2014, 90 State agencies submitted MDS data on a census of WIC participants. The State-maintained information systems that are the sources of data for PC2014 do not always contain complete information on every individual who enrolled in WIC, though overall reporting has improved substantially over time. PC2014 data may be unreported for a variety of reasons, some of which may indicate that participants in the not-reported category may be different from those individuals with data reported. Assumptions regarding missing data vary by the nature of the variable and by the category of WIC participant. To account for these anomalies, a uniform strategy has been adopted for preparing all tables in this report. Data not reported are included in the calculation of percentage distributions for each characteristic. While including missing data in the denominators for all calculations tends to place estimates for each characteristic at a lower bound, this approach has allowed consistent presentation of tabulations throughout the report. Furthermore, it ensures all information needed to calculate upper-bound estimates is readily
3 Due to management information system constraints, Virginia provided data for October 2013 rather than April 2014.

WIC Participant and Program Characteristics: 2014 Final Report
Page iii
available in every table. Caution should be used in comparing results across groups or over time. Missing data always must be considered in gauging differences among groups or categories of WIC participants or in analyzing trends across years. For PC2014, reporting approached 100 percent on all but a few variables; unreported data were more prevalent in earlier reports.
B. THE 2014 WIC PROGRAM
In 2014, WIC services were delivered in each of the 50 States, the District of Columbia, and 5 territories (American Samoa, Guam, the Northern Mariana Islands, Puerto Rico, and the Virgin Islands) in addition to 34 Indian tribal organizations. The 90 State agencies reporting PC2014 data operated more than 1,800 local agencies where staff delivered WIC services. Ten States served nearly three-fifths (58.5 percent) of all WIC participants; two States—California and Texas—provided services to more than a quarter (27.8 percent) of WIC participants.
C. PARTICIPANT CHARACTERISTICS IN 2014
In April 2014, 9,303,253 women, infants, and children participated in WIC (see figure ES.1). Although WIC participation generally has grown steadily since the program began, participation in 2014 was 4.4 percent lower than in 2012. This decline is a continuation of a 2.9-percent decrease from 2010 to 2012; the only other prior decrease in participation between WIC PC data collections occurred between 1998 and 2000.
Figure ES.1. Number of WIC Participants by Category and Age of Children: April 2014
Notes
Data presented in this chart for pregnant, breastfeeding, and postpartum women and infants is shown in table II.1. Total number of children by age group is shown in table IV.8.

WIC Participant and Program Characteristics: 2014 Final Report
Page iv
Approximately half (53.3 percent) of WIC participants in April 2014 were children (see figure ES.2). Infants accounted for 23.0 percent of participants and women accounted for 23.6 percent. These distributions are similar to those from 2012 and have remained essentially unchanged since 2000. Women were divided further into three categories: pregnant (9.6 percent of all participants), breastfeeding (7.4 percent of all participants), and postpartum (6.6 percent of all participants). The proportion of breastfeeding women was higher than the proportion of postpartum women for the first time in 2012, and the difference between the two categories grew in 2014.
Figure ES.2. Distribution of Individuals Who Participated in WIC
Notes
Data for pregnant, breastfeeding, and postpartum women and for infants is presented in table II.2. The percent of children by age group is calculated from the total number of children by age group presented in table IV.8 as a percent of total WIC participation.
Most (86.0 percent) of the pregnant women participating in WIC in April 2014 were aged 18 to 34, as were 84.4 percent of breastfeeding and 87.3 percent of postpartum women. Only 3.4 percent of women WIC clients were aged 17 or younger. Most (91.4 percent) infant WIC participants were certified for WIC benefits during their first 3 months of life. Child participation decreased as age increased—36.7 percent of child participants were 1 year of age and only 14.2 percent were 4 years of age at time of most recent certification.
In 2014, more than half (54.5 percent) of pregnant WIC participants enrolled in the program during their first trimesters of pregnancy. Most of the remainder (36.0 percent) of pregnant women enrolled during their second trimesters. Only 9.2 percent enrolled during their third trimesters. Although the percentage of women who enrolled during their first trimesters increased by more than 5 percentage points from 2010 to 2012 (51.6 percent to 56.9 percent), this percentage decreased by 2.4 percentage points in 2014. Additionally, the percentage of women who enrolled during their third trimesters decreased from 9.4 percent in 2010 to 7.8
WIC Participant and Program Characteristics: 2014 Final Report
Page v
percent in 2012, then increased to 9.2 percent in 2014. Therefore, the distribution of trimester of enrollment in 2014 more closely resembles the distribution for the same variable in 2010 than in 2012.
1. Race and Ethnicity
The Office of Management and Budget requires race and ethnicity to be reported separately. One measure records whether the individual is Hispanic/Latino and the second records racial category or categories; multiple racial identifications are permitted. In 2014, 58.7 percent of all WIC participants were identified as White Only, 20.3 percent were identified as Black or African American Only, 11.1 percent were identified as American Indian or Alaska Native Only, and 4.1 percent were identified as either Asian Only or Native Hawaiian or Other Pacific Islander Only. Two or more races were identified for 5.4 percent of WIC participants. For ethnicity, 41.6 percent of participants reported as Hispanic/Latino. Race and ethnicity reporting stayed relatively constant from 2012 to 2014.
2. Participation in Other Programs
WIC legislation allows income eligibility requirements to be met by participation in means-tested programs (Medicaid, Temporary Assistance to Needy Families (TANF), and the Supplemental Nutrition Assistance Program (SNAP)). In April 2014, 72.8 percent of WIC participants reported receiving benefits from at least one of these three national public assistance programs that classified them as adjunctively income eligible for WIC, down from 74.6 percent in 2012. With respect to each program, 68.8 percent of WIC clients received Medicaid benefits, a decrease of 2 percentage points from 2012; 35.1 percent received SNAP benefits, a decrease of 0.7 percentage points; and 7.5 percent of WIC participants reported receiving TANF benefits, a decrease of 1.1 percentage points from 2012. Only 6.0 percent reported receiving benefits from all three programs.
These findings likely underestimate participation in these programs. One potential reason for underreporting is that many local agencies record this information at the time of certification for WIC. Staff at many local WIC service sites refer WIC enrollees to other programs, and any enrollment in those other programs subsequent to WIC certification may not be captured in the estimates presented here. Another consideration is that constraints in various WIC management information systems, as well as required procedures for documenting income and participation in other programs, may have limited the number of programs entered into computer systems by local WIC staff.
3. Household Size
The mean household size of WIC participants in April 2014 was 4.1 persons. Average household size has remained stable since the first WIC PC census data collection in 1992.
4. Income
Among WIC participants reporting some income, the average annualized income of families/economic units of WIC participants in April 2014 was $17,372, an increase of $530 (3.1

WIC Participant and Program Characteristics: 2014 Final Report
Page vi
percent) from 2012. This small increase is consistent with broader economic data showing a slow rate of economic growth since 2012.
Across participant categories, breastfeeding women reported the highest average household income at $16,800; postpartum women exhibited the lowest average household income at $12,996. Across racial and ethnic groups, Black or African American WIC participants displayed the lowest average household income—$13,337 for families or economic units. Asian participants had the highest average annualized household income at $20,985. Findings about income must be interpreted with caution, given that household income is not reported for 8.2 percent of WIC participants.
5. Poverty Status
WIC participants come from some of the Nation’s poorest households. In 2014, almost three-quarters (74.2 percent) of all WIC participants reported incomes below the Federal poverty guideline. Despite small increases in average income, the proportion of WIC participants with incomes below the Federal poverty guideline increased by 0.9 percentage points between 2012 and 2014. To provide a point of comparison for these levels, in the 2013 Current Population Survey data, 14.5 percent of the general population had incomes below the Federal poverty threshold. The sharp contrast between WIC clients and the general population can be seen in figure ES.3, which compares the poverty status of WIC participants reporting income with that of the general U.S. population.
Figure ES.3. Poverty Status of WIC Participants
Reporting Income Versus General U.S. Population
Notes
Data presented in this chart are shown in table III.11. Percents may not add to 100 percent due to rounding.

WIC Participant and Program Characteristics: 2014 Final Report
Page vii
6. Nutritional Risk
For PC2014, States could report up to 10 nutritional risks for each participant. For women, high weight-for-height and inappropriate (both high and low) weight gain during pregnancy were the predominant risks reported. Children showed inappropriate nutrition practices and the anthropometric risk high weight-for-height/length as their most frequently recorded risks. Eighty-two percent of WIC infants were recorded to be at risk due, at least in part, to the WIC eligibility of their mothers or because their mothers were at risk during pregnancy. At least one nutritional risk was reported for almost 100 percent of WIC participants in April 2014.
The May 27, 2011 FNS Memorandum, “Transmittal of New and Revised Nutrition Risk Criteria,” implemented in October 2012, revised a number of anthropometric risks for infants and young children. For infants and children younger than 2 years of age, World Health Organization (WHO) growth standards are used, replacing the 2000 CDC growth charts. This change in growth standards resulted in minor modifications to existing risk criteria cutoffs. This memorandum also established the new high weight-for-length risk criteria for this age group. To be assigned the high weight-for-height/length specific nutritional risk,4 WIC participants in this age group must now either (1) be at risk for overweight based on biological parent body mass index (BMI) (an old criterion) or (2) have specific weight and length measurements that are considered high weight-for-length according to WHO growth standards (a new criterion). As a result, the proportion of 1-year-old children assigned the high weight-for-height/length specific nutritional risk increased by 10.6 percentage points between 2010 and 2014, while the proportion of older children displaying this specific nutritional risk remained essentially unchanged. This increase in assignment of the high weight-for-height/length specific nutritional risk was particularly apparent among older infants: while the proportion of 0- to 3-month-old infants assigned the high weight-for-height/length specific nutritional risk increased by roughly 8 percentage points, the increase for 9- to 11-month-old infants was twice as great, 16.5 percentage points.
7. Breastfeeding Rates
PC2014 breastfeeding estimates are based on data from 83 State agencies. In the 83 State agencies that reported breastfeeding data, 69.8 percent of all 6- to 13-month-old infants and children initiated breastfeeding. Nearly half of State agencies (48.7 percent) had breastfeeding initiation rates between 60 percent and 79 percent (see figure ES.4). Only 7.7 percent of agencies had initiation rates of less than 40 percent and only 5.1 percent of agencies had initiation rates of more than 90 percent. The PC1998 benchmark estimate of breastfeeding initiation was 41.5 percent. With the exception of 2006–2008, the breastfeeding initiation rate increased approximately 4 percentage points between each PC reporting period from 1998 to 2012. However, for PC2014, there a smaller increase in the breastfeeding initiation rate (2.7 percentage points, from 67.1 percent in 2012 to 69.8 percent in 2014).
4 The high weight-for-height/length specific nutritional risk includes the following risk criteria: overweight (women); obese (children 2–5 years of age); overweight or at risk of overweight (infants and children); high weight-for-length (infants and children younger than 24 months of age).

WIC Participant and Program Characteristics: 2014 Final Report
Page viii
Figure ES.4. Breastfeeding Initiation Rates by State for WIC Infant Participants Aged 6–13 Months,
April 2014
Notes
None of the State agencies that reported data on breastfeeding initiation for 2014 reported rates of less than 20%. See table VI.1 for additional detail.

WIC Participant and Program Characteristics: 2014 Final Report
Page ix
8. Migrant Status
Figure ES.5 shows migrant participation across the States. In April 2014, there were 39,071 migrant WIC participants identified on State WIC participation files. Migrant WIC participants made up less than half of 1 percent of the Nation’s total WIC population. Four-fifths (80.8 percent) of the migrant participants were located in California, Florida, Michigan, New York, and Texas. The certification categories of migrant WIC participants did not differ greatly from other WIC participants. A somewhat greater proportion of migrants were children (55.3 percent versus 53.2 percent), while a lesser proportion (20.0 percent versus 23.1 percent) were infants. Women made up about the same proportion of migrant participants as they did of nonmigrant participants (24.7 percent and 23.7 percent, respectively), though a greater proportion of migrants were breastfeeding women and a lesser proportion were postpartum women. Migrant WIC participants had similar levels of both participation in other assistance programs and median annual income compared to nonmigrant participants. Because migrant WIC participants experienced a somewhat greater increase in annual income than nonmigrants did between 2012 and 2014, the 2014 income gap between migrants and nonmigrants (0.4 percent) was smaller than it was in 2012 (2.9 percent) and much smaller than it was in 2010 (7.8 percent).
Figure ES.5. Distribution of Migrant WIC Participants by State, April 2014
Notes
Percentages are based on total migrant WIC participation.

WIC Participant and Program Characteristics: 2014 Final Report
Page x
9. Food Package Data
States were required to provide food prescription data and an FNS Food Package Type descriptor as part of the WIC MDS. These data will be described in a separate WIC PC2014 Food Package report (expected to be released in September 2015).

WIC Participant and Program Characteristics: 2014 Final Report
Page 1
I. INTRODUCTION
The Special Supplemental Nutrition Program for Women, Infants, and Children (WIC) is administered by the Food and Nutrition Service (FNS) of the U.S. Department of Agriculture (USDA). WIC was established to counteract the negative effects of poverty on prenatal and pediatric health and provides benefits including nutritious supplemental foods; nutrition education; counseling, such as breastfeeding promotion and support; and referrals to health care, social service, and other community providers for pregnant, breastfeeding, and postpartum5 women, infants, and children up to the age of 5 years. By intervening during the prenatal period, WIC seeks to improve fetal development and reduce the incidence of low birth weight, short gestation, and maternal anemia. Infants and children who are at nutritional risk can receive benefits to maintain and improve their health and development. For breastfeeding and postpartum women, WIC also seeks to improve dietary intake and promotes breastfeeding as the optimal method of infant feeding.
WIC was established in 1972 by an amendment to the Child Nutrition Act of 1966 (Pub. L. 89–642). In April 2014, 9.3 million women, infants, and children participated in WIC. For fiscal year (FY) 2014, Congress appropriated $6.72 billion for WIC.
Since 1988, FNS has produced biennial reports on WIC participant and program characteristics (PC). FNS uses this regularly updated information for general program monitoring and for managing WIC’s information needs such as estimating budgets, submitting civil rights reports, identifying research needs, and reviewing current and proposed WIC policies and procedures. The biennial reports include information on the following:
• Demographic, income, and nutritional risk characteristics of WIC participants
• Breastfeeding initiation and duration by State
• WIC participation for migrant families6
• Other topics as deemed appropriate by the Secretary of Agriculture
For purposes of the biennial reports, a WIC participant is defined as a person who is certified to receive WIC benefits in April, including individuals who do not claim or use the food instruments7 issued during the period. Furthermore, in accordance with WIC guidelines, this includes fully breastfeeding infants who are certified for WIC benefits but do not receive food packages. It also includes partially breastfeeding women who do not receive food packages, provided their infants receive WIC food instruments.
This introduction provides a brief summary of the WIC program and WIC program reports. The remainder of the chapter describes WIC benefits and eligibility requirements, summarizes 2014 participant and program characteristics, and outlines the organization of the following chapters in this report. 5 Postpartum women are defined as nonbreastfeeding women up to 6 months after pregnancy. 6 Federal WIC regulations define a migrant as an individual whose principal employment is in agriculture on a seasonal basis, who has been so employed within the last 24 months, and who establishes a temporary abode for the purposes of such employment. 7 WIC agencies issue benefits through food instruments, which include vouchers, checks, and electronic benefit transfer (EBT) cards.

WIC Participant and Program Characteristics: 2014 Final Report
Page 2
A. PROGRAM OPERATIONS
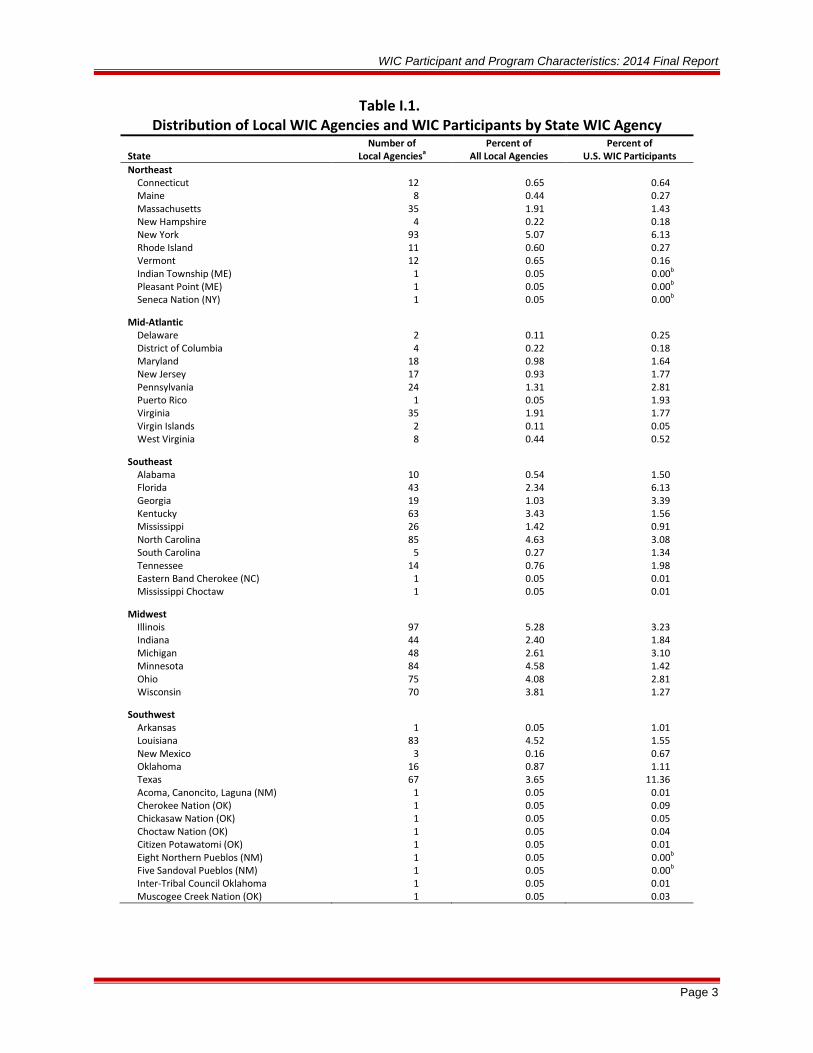
WIC services are delivered in each of the 50 States, American Samoa, the District of Columbia, Guam, the Northern Mariana Islands, Puerto Rico, and the Virgin Islands. Additionally, in April 2014, 34 Indian tribal organizations (ITOs) served as State WIC agencies, for a total of 90 State agencies nationwide. More than 1,800 local agencies8 provided services to participants. Table I.1 presents information on the number of local agencies operated by the 90 State agencies. Ten State agencies served nearly three-fifths (58.5 percent) of all WIC participants.9 Two State agencies combined—California and Texas—provided services to more than a quarter (27.8 percent) of WIC participants.
At the Federal level, FNS—through its seven administrative regional offices—provides cash grants to State agencies for nutrition services and program administration, set nutritional risk eligibility standards, issue regulations and monitor compliance with these regulations, offer technical assistance to State agencies, and conduct studies of program operation and performance. State agencies allocate funds to local WIC sponsoring agencies, monitor compliance with Federal and State regulations, and supply technical assistance to local agency staff.
Since 1987, State agencies have negotiated rebates provided by manufacturers of infant formula, infant cereal, infant foods, and juice to reduce food costs. State and local agencies use these rebates to provide WIC services to larger numbers of eligible individuals.
8 Local agencies are defined as the organizations one level below State agencies. 9 The 10 State agencies are California, Florida, Georgia, Illinois, Michigan, North Carolina, Ohio, Pennsylvania, New York, and Texas.
WIC Participant and Program Characteristics: 2014 Final Report
Page 3
Table I.1. Distribution of Local WIC Agencies and WIC Participants by State WIC Agency
State Number of
Local Agenciesa Percent of
All Local Agencies Percent of
U.S. WIC Participants Northeast
Connecticut 12 0.65 0.64 Maine 8 0.44 0.27 Massachusetts 35 1.91 1.43 New Hampshire 4 0.22 0.18 New York 93 5.07 6.13 Rhode Island 11 0.60 0.27 Vermont 12 0.65 0.16 Indian Township (ME) 1 0.05 0.00b Pleasant Point (ME) 1 0.05 0.00b Seneca Nation (NY) 1 0.05 0.00b
Mid-Atlantic Delaware 2 0.11 0.25
District of Columbia 4 0.22 0.18 Maryland 18 0.98 1.64 New Jersey 17 0.93 1.77 Pennsylvania 24 1.31 2.81 Puerto Rico 1 0.05 1.93 Virginia 35 1.91 1.77 Virgin Islands 2 0.11 0.05 West Virginia 8 0.44 0.52
Southeast Alabama 10 0.54 1.50
Florida 43 2.34 6.13 Georgia 19 1.03 3.39 Kentucky 63 3.43 1.56 Mississippi 26 1.42 0.91 North Carolina 85 4.63 3.08 South Carolina 5 0.27 1.34 Tennessee 14 0.76 1.98 Eastern Band Cherokee (NC) 1 0.05 0.01 Mississippi Choctaw 1 0.05 0.01
Midwest Illinois 97 5.28 3.23
Indiana 44 2.40 1.84 Michigan 48 2.61 3.10 Minnesota 84 4.58 1.42 Ohio 75 4.08 2.81 Wisconsin 70 3.81 1.27
Southwest Arkansas 1 0.05 1.01
Louisiana 83 4.52 1.55 New Mexico 3 0.16 0.67 Oklahoma 16 0.87 1.11 Texas 67 3.65 11.36 Acoma, Canoncito, Laguna (NM) 1 0.05 0.01 Cherokee Nation (OK) 1 0.05 0.09 Chickasaw Nation (OK) 1 0.05 0.05 Choctaw Nation (OK) 1 0.05 0.04 Citizen Potawatomi (OK) 1 0.05 0.01 Eight Northern Pueblos (NM) 1 0.05 0.00b Five Sandoval Pueblos (NM) 1 0.05 0.00b Inter-Tribal Council Oklahoma 1 0.05 0.01 Muscogee Creek Nation (OK) 1 0.05 0.03

WIC Participant and Program Characteristics: 2014 Final Report
Page 4
Table I.1. (continued) Distribution of Local WIC Agencies and WIC Participants by State WIC Agency
State Number of
Local Agenciesa Percent of
All Local Agencies Percent of
U.S. WIC Participants Southwest (continued)
Osage Nation (OK) 1 0.05 0.03 Otoe Missouria (OK) 1 0.05 0.01 Pueblo of Isleta (NM) 1 0.05 0.01 Pueblo of San Felipe (NM) 1 0.05 0.00b Pueblo of Zuni (NM) 1 0.05 0.01 Santo Domingo (NM) 1 0.05 0.00b Wichita, Caddo, Delaware (OK) 1 0.05 0.05
Mountain Plains Colorado 38 2.07 1.08
Iowa 20 1.09 0.81 Kansas 58 3.16 0.81 Missouri 118 6.43 1.58 Montana 27 1.47 0.23 Nebraska 13 0.71 0.44 North Dakota 26 1.42 0.15 South Dakota 62 3.38 0.23 Utah 12 0.65 0.76 Wyoming 19 1.03 0.12 Cheyenne River Sioux (SD) 1 0.05 0.01 Eastern Shoshone (WY) 1 0.05 0.00b Northern Arapahoe (WY) 1 0.05 0.00b Omaha Nation (NE) 1 0.05 0.00b Rosebud Sioux (SD) 1 0.05 0.01 Santee Sioux (NE) 1 0.05 0.00b Standing Rock Sioux (ND) 1 0.05 0.01 Three Affiliated Tribes (ND) 1 0.05 0.00b Ute Mountain Ute (CO) 1 0.05 0.00b Winnebago (NE) 1 0.05 0.00b
Western Alaska 13 0.71 0.23
American Samoa 1 0.05 0.07 Arizona 21 1.14 1.87 California 84 4.58 16.46 Guam 1 0.05 0.09 Hawaii 17 0.93 0.42 Idaho 9 0.49 0.47 Nevada 17 0.93 0.83 Northern Mariana Islands 1 0.05 0.04 Oregon 34 1.85 1.16 Washington 61 3.32 2.17 Inter-Tribal Council Arizona 12 0.65 0.12 Inter-Tribal Council Nevada 1 0.05 0.02 Navajo Nation (AZ) 1 0.05 0.12
Total 1,836 100.00 100.00
Notes
Percents may not add to 100.00% due to rounding. a The count of local agencies is derived from State participation files containing identifiers for local agencies charged with administering WIC services. b Indicates agencies serving less than 0.005% of U.S. WIC.

WIC Participant and Program Characteristics: 2014 Final Report
Page 5
B. PARTICIPANT BENEFITS
WIC seeks to improve the health of program participants by providing nutritious food and nutrition education, including breastfeeding promotion and support, as adjuncts to good health care. This section describes the benefits provided by WIC.
1. Food Packages
Most State agencies issue WIC food instruments in the form of vouchers, checks, or electronic benefit transfer (EBT) cards to participants who use them to purchase a set of prescribed foods that provide specific nutrients known to be lacking in the diets of target populations. Federal regulations specify WIC food packages designed for different categories of participants. These packages include foods that are good sources of specific nutrients—protein, iron, calcium, and vitamins A and C. Infant food packages reflect the developmental needs of infants as well as the infant feeding practice guidelines of the American Academy of Pediatrics. Other food packages align with the Dietary Guidelines for Americans10 recommendations and also take into consideration the recommended eating patterns for preschool children and the special additional nutritional requirements of pregnant and breastfeeding women.
FNS updated regulations regarding the contents of WIC food packages through publication of an interim rule in the Federal Register in December 2007, with a final implementation date of October 2009. The Interim Rule aligned the food packages more closely with updated nutrition science, promoted long-term breastfeeding, and permitted some substitutions within food categories to meet the needs of WIC’s diverse population better. New foods offered include whole-wheat bread; infant food fruit, vegetables, and meat; and fruits and vegetables in fresh, frozen, canned, or dried form through the addition of a cash-value voucher to food packages for children and women. Optional food substitutions include additional types of canned fish; canned beans as a substitute for dry beans or peanut butter; various whole grains, including brown rice and oatmeal, as a substitute for whole-wheat bread; and soy-based beverage and tofu as milk alternatives. The rule reduced food allowances of milk, eggs, and juice for women and children; eliminated juice from infant packages; and reduced the formula allowance for partially breastfeeding and older infants. In March 2014, FNS published the final rule on WIC food packages, which updated the interim rule. However, the implementation dates for the various provisions in the final rule range from June 2, 2014 through April 1, 2015, after the reference date for PC2014 data collection.
Most State agencies deliver WIC food benefits to WIC clients by issuing food instruments in the form of checks or vouchers to purchase their supplemental foods at authorized local grocery stores. Participants can redeem these checks or vouchers only for food prescribed by health or nutrition professionals at local agencies. The prescribed food items are specified on each WIC food instrument. In a few geographic areas, food is delivered to participant homes or participants claim food at specified distribution points. A small number of State agencies issue benefits through both checks or vouchers and EBT. Over the past 12 years, FNS has worked with
10 Dietary Guidelines for Americans, published jointly by USDA and the U.S. Department of Health and Human Services (HHS), provides recommendations for attaining and maintaining a healthy weight, reducing risks of chronic disease, and promoting overall health. This report is revised every 5 years (USDA & HHS, 2010).

WIC Participant and Program Characteristics: 2014 Final Report
Page 6
volunteer WIC State agencies to design and test EBT systems for WIC benefits using smart cards and online real-time telecommunications. As of April 2014, 13 State agencies have implemented EBT statewide and several others planned to implement EBT in the near future to meet the USDA deadline to issue benefits solely through EBT by 2020 (USDA, 2014b).
2. Nutrition Education and Counseling
Nutrition education plays a crucial role in WIC as an essential benefit intended to achieve positive changes in participant knowledge, attitudes, and behaviors about food consumption. FNS regulations require WIC service agencies to offer participants (or their mothers or other care providers) at least two nutrition education sessions during each certification period. While not a requirement, participants may choose to be counseled in one-on-one settings, take classes online, or attend group classes on a variety of topics related to health and nutrition. As part of nutrition education and counseling, agencies promote breastfeeding as the optimal source of infant nutrition to pregnant and breastfeeding women.
3. Access to Health Care and Social Services
Each WIC agency refers participants to appropriate health care and social services. Through either the provision of onsite health services or referral to other agencies, WIC serves as a link between participants and appropriate health care providers or systems. Most local agencies refer clients to a variety of social services, including but not limited to income support, child support, childcare services, and substance abuse counseling. Coordination between WIC and social service programs increased after 1989 when Federal law created adjunctive and automatic income eligibility for WIC benefits. Under adjunctive income eligibility, State agencies use documentation of participation in the Supplemental Nutrition Assistance Program (SNAP), the Temporary Assistance to Needy Families program (TANF), or Medicaid. Under automatic income eligibility, State agencies may choose to use documentation of participation in other means-tested programs as evidence of income eligibility for WIC.
C. ELIGIBILITY FOR WIC BENEFITS
Eligibility for receipt of WIC benefits is based on four factors: categorical eligibility, residency, identity, income eligibility, and nutritional risk. First, a participant must be a member of certain categorically eligible groups: women during pregnancy and up to the first 6 weeks after delivery; women up to 1 year postpartum if breastfeeding or up to 6 months postpartum if not breastfeeding; infants up to 1 year old; and children up to the age of 5 years.
Second, applicants must apply for and receive benefits in the State in which they reside; e.g., a Kansas resident cannot be certified to receive WIC benefits in Nebraska.
Third, a participant must be income eligible according to the income eligibility limit set by the State of residency. This income limit may not exceed 185 percent, or be less than 100 percent, of the U.S. Department of Health and Human Services (HHS) poverty income guidelines, which are based on household size and State of residence (48 contiguous States, Alaska, or Hawaii). All State agencies set the income eligibility threshold at 185 percent of the Federal poverty guideline in April 2014 (USDA, 2014a). As of July 2013, a person from a family of four living within the

WIC Participant and Program Characteristics: 2014 Final Report
Page 7
48 contiguous States with an annual household income of $43,568 or less would be income eligible for WIC benefits at the 185-percent threshold.11
State agencies can determine if an applicant is adjunctively income eligible for WIC benefits through documentation of his/her own or certain family members’ participation in Medicaid, TANF, or SNAP. Applicants also may be deemed automatically income eligible for WIC based on participation in other means-tested programs whose income eligibility thresholds are at or below those for WIC. Beginning in October 1998, with passage of the William F. Goodling Child Nutrition Reauthorization Act of 1998 (Pub. L. 105–336), applicants not certified under adjunctive or automatic eligibility provisions were required to provide written proof of family income.12 Examples of documentation include current pay or unemployment stubs, earnings statements, and income tax forms.
Finally, each WIC participant must be determined to be at nutritional risk based on a medical and/or nutritional assessment by a competent professional authority such as a physician, nutritionist, nurse, or other health professional or paraprofessional. At a minimum, height (or length) and weight are recorded; additionally, with the exception of infants younger than 9 months of age, a hematological test is administered to assess blood iron status. In response to recommendations made by the Institute of Medicine (IOM), WIC has adopted uniform nutritional risk criteria across the Nation. Beginning in April 1999, FNS, in conjunction with the National WIC Association,13 established approximately 100 detailed risk criteria with applicable thresholds for determining WIC nutritional risk eligibility. State agencies have the option of implementing more-stringent criteria, but cannot implement criteria that are more lenient. State and local agencies develop appropriate screening systems within the national standards to assess nutritional risk. Factors that can indicate risk include abnormal weight gain during pregnancy, a history of high-risk pregnancies, low birth weight, being underweight or overweight, anemia, or a pattern of inadequate dietary nutrition. Individuals who are adjunctively income eligible for WIC because of participation in other qualifying means-tested programs also must be determined to be at nutritional risk to receive benefits.
WIC must operate within annual funding levels established by appropriation law. The number of participants served each year depends on total funds available as well as on FNS allocation of these funds to individual State agencies. Changes in the cost of food also may impact the number of participants able to be served. To help State agencies and local WIC providers prioritize WIC participants according to need, FNS has defined seven Risk Priority levels based on applicant categorical status and type of nutritional risk. In general, the purpose of the existing priority system is to give preference to medically based nutritional risks over risks based only on inadequate diet. In 2014, WIC served all eligible individuals who sought benefits, regardless of assigned priority level. Chapter V presents detailed information on WIC participant Risk Priorities and priority levels in 2014.
11 Poverty guidelines established in July 2013 were in effect through June 2014, so these guidelines cover most of the period for which WIC participants active in April 2014 were certified. 12 Although WIC regulations distinguish means-tested programs used for adjunctive income eligibility from programs used to establish automatic income eligibility, the two mechanisms work similarly with respect to income eligibility. 13 Formerly the National Association of WIC Directors.

WIC Participant and Program Characteristics: 2014 Final Report
Page 8
D. PREVIOUS REPORTS ON WIC PARTICIPANT AND PROGRAM CHARACTERISTICS
FNS has published 14 previous reports on WIC PC. In 1984 (PC1984), 1988 (PC1988), and 1990 (PC1990), FNS and its contractors conducted studies using nationally representative samples of WIC participants. Data were obtained through mail surveys of State and local agencies; record abstractions at local WIC service sites; and, for PC1988, interviews with participants and follow-up data collection on claiming food instruments.
The first WIC PC report (1984), conducted for FNS by Ebon Research Systems, collected data from 28 State agencies, 204 local agencies, 356 service sites, and 6,444 participant records. Major findings addressed the following:
• The distribution of participants by participant category, priority, and income
• The nutritional risks of WIC participants
• State and local agency coordination with health and social service programs
• The methods, frequency, and types of nutrition education provided to WIC participants
PC1990 served as a transitional study built on the PC1984 and PC1988 research designs while minimizing sample size to conserve research expenditures. A goal for PC1990 and all future studies of WIC participant characteristics was to limit burden on State agencies to encourage them to continue biennial participation in the WIC reporting system. For PC1990, field researchers from Abt Associates abstracted data from a nationally representative sample of 2,343 participant records; additionally, Abt surveyed all State agencies to obtain information on WIC program operations.
The methodology Insight Policy Research used for the PC2014 report was developed by Abt Associates for the PC1992 report. The PC1992 report was substantially different from earlier reports with regard to collecting WIC participation data. FNS developed a prototype reporting system that allows acquisition of all participation data through the routine transfer of an agreed-upon set of data elements. State and local WIC staff members obtain these data to certify applicant eligibility for WIC benefits, guide nutrition education, and issue food instruments. This Minimum Data Set (MDS) was developed through a partnership between FNS, the Information Committee of the National WIC Association, and the Centers for Disease Control and Prevention (CDC). The MDS consists of 20 items, which are listed in table I.2. The specifications also include an 11-item Supplemental Data Set (SDS) (see table I.3). State agencies provide these supplemental data if they are available. For this report, 85 of the 90 State agencies submitted some or all SDS data elements (see table E.1).

WIC Participant and Program Characteristics: 2014 Final Report
Page 9
Table I.2. Minimum Data Set Variables and Definitions: Guidance to State WIC Agencies
The data items listed below are included in the MDS. For biennial reports on WIC Participant and Program Characteristics, the term participant means a person on WIC master lists or a person listed in WIC operating files who is certified to receive WIC benefits in April 2014. State agencies should ensure that the data items reflect the participant's status on each item at the time of the most recent WIC Program certification as of April 2014. However, as a convenience to State agencies that do not maintain historical files and that update the information in their automated systems during certification periods, current information that is on file for each participant in April 2014 will be accepted. 1. State Agency ID A unique number that permits linkage to the WIC State agency where the participant was
certified. It is the first 7 digits of the 10-digit local agency code maintained by FNS in the WIC Local Agency Directory (WIC LAD).
2a. Local Agency ID A unique number that permits linkage to the local agency where the participant was
certified as eligible for WIC benefits. It is the last 3 digits of the 10-digit Local Agency Code maintained by FNS in WIC LAD.
2b. Service Site ID A unique number that permits linkage to the service site where the participant was
certified. For State agencies that submitted service site or clinic-level data for WIC LAD, service site IDs appear in WIC LAD as the 3-digit codes under Administering Agency.
Note: For PC2014, State agencies should not substitute Service Site ID for Local Agency ID (item 2a above). 3. Case ID A unique record number for each participant that maintains individual privacy at the national
level. Note: For each participant, each State agency should construct a Case ID for their PC2014 data
submissions; do not use the case number of the participant as listed in State agency-held files. 4. Date of Birth Month, day, and year of participant's birth reported in MMDDYYYY format. 5. Race/Ethnicity This categorization requires classification of participants based on ethnicity as well as race.
The two categories for ethnicity are Hispanic/Latino and Not Hispanic/Latino. The five racial categories, as required by OMB,a are (1) American Indian or Alaska Native; (2) Asian; (3) Black or African American; (4) Native Hawaiian or Other Pacific Islander; or (5) White. One or more racial categories may be selected.
State agencies may report race/ethnicity using one of two formats:
• Yes/No for each of the categories resulting in a six-digit code (1=yes; 2=no) • Three digits to represent key combinations of racial selections with the first digit representing
ethnicity and the last two representing race combinations 6a. Certification Category The category—one of five possible categories—under which a person is certified as
eligible for WIC benefits. These include (1) pregnant woman; (2) breastfeeding woman; (3) postpartum woman (not breastfeeding); (4) infant (younger than 12 months); and (5) child (12–59 months).

WIC Participant and Program Characteristics: 2014 Final Report
Page 10
Table I.2. (continued) Minimum Data Set Variables and Definitions: Guidance to State WIC Agencies
6b–c. Expected Date of Delivery or Number of Weeks Gestation For pregnant women, the projected date of delivery (MMDDYYYY format) or the number of weeks since the last menstrual period as determined at WIC Program certification.
7. Date of Certification The date the person was declared eligible for the most current WIC Program
certification as of April 2014. Month, day, and year should be reported in MMDDYYYY format. 8. Sex For infants and children, male or female. 9. Risk Priority Code Participant priority level for WIC Program certification at the time of the most recent
WIC Program certification as of April 2014. 10a–c. Participation in TANF, SNAP, Medicaid The participant's reported participation in each of these
programs at the time of the most recent WIC Program certification as of April 2014. 11. Migrant Status Participant migrant status according to the Federal WIC Program definition of a migrant
(currently counted in the FNS 498 report). 12. Number in Family or Economic Unit The number of persons in the family or economic unit upon which
WIC income eligibility was based. States may report a self-declared number in the family or economic unit for participants whose income
was not required to be determined as part of the WIC certification process. These participants include adjunctively income eligible participants (due to TANF, SNAP, or Medicaid participation) and those participants deemed income eligible under optional procedures available to the State agency in Federal WIC Regulations, Section 246.7(d)(2)(vi-viii) (means-tested programs identified by the State for automatic WIC Program income eligibility, income eligibility of pregnant women, and income eligibility of Indian and instream migrant applicants).
13a–c. Family or Economic Unit Income
1. For persons for whom income is determined during the certification process, the income amount that was determined to qualify them for the WIC Program during the most recent certification as of April 2014.
FNS will convert income expressed in different measures (weekly, monthly, yearly, etc.) to annual
amounts. 2. For descriptive purposes only, for participants whose income was not required to be
determined as part of the WIC Program certification process, the self-reported income at time of certification. These participants include adjunctively income eligible participants and those persons deemed eligible under optional procedures available to the State agency in Federal WIC Regulations, Section 246.7(d)(2)(vi-viii).
States should not use zero to indicate income values that are missing or not available. Zero should
indicate only an actual value of zero. Note: Due to the large proportion of WIC participants who are adjunctively income eligible, their
income information is essential to describe income among the overall WIC population. States are required to provide income information on those adjunctively eligible for WIC according to Federal WIC Regulations, Section 246.7.

WIC Participant and Program Characteristics: 2014 Final Report
Page 11
Table I.2. (continued) Minimum Data Set Variables and Definitions: Guidance to State WIC Agencies
14a–j. Nutrition Risks Present at Certification The highest-priority nutrition risks present at the WIC Program certification current in April 2014, up to a maximum of 10. Uniform coding is required in submissions from all States, according to WIC Policy Memorandum 98-9.
15a–b. Hemoglobin or Hematocrit The value for the measure of iron status that applies to the WIC Program
certification current in April 2014. 15c. Date of Blood Test Month, day, and year blood measure was collected and reported in MMDDYYYY
format. States must submit this for all participants reporting a blood measure. 16a–b. Weight The participant's weight measured according to the CDC nutrition surveillance program
standards [nearest one-quarter pound]. States may report weight in grams if weight is not collected in pounds and quarter pounds.
17a–b. Height The participant's height (or length) measured according to the CDC nutrition surveillance
program standards [nearest one-eighth inch]. States may report height in centimeters if height is not collected in inches and eighth inches.
18. Date of Height and Weight Measure The date of the height and weight measures that were used during
the most recent WIC Program certification period as of April 2014 in MMDDYYYY format. 19a. Currently Breastfed For infants and children aged 6 to 13 months in April 2014, whether the participant
is currently receiving breastmilk. 19b. Ever Breastfed For infants and children aged 6 to 13 months in April 2014, whether the participant ever
received breastmilk. 19c. Length of Time Breastfed For infants and children aged 6 to 13 months in April 2014, the number of
weeks the participant received breastmilk. 19d. Date Breastfeeding Data Collected For infants and children aged 6 to 13 months in April 2014, the date
on which breastfeeding status was reported in MMDDYYYY format. 20a–n. Food Codes States have the option of providing food data in an item-quantity format or a food package
format. States should provide the food package codes or item codes and quantities for all food prescribed for the participant during the month of April 2014.
20o. Food Package Type A code representing the interim rule food package descriptor. This descriptor
uniquely represents the FNS food package number (I through VII), participant type, breastfeeding status, and (for infants and children only) age associated with the reported food code(s) for that participant.
Notes a OMB = Office of Management and Budget

WIC Participant and Program Characteristics: 2014 Final Report
Page 12
Table I.3. Supplemental Data Set Variables and Definitions: Guidance to State WIC Agencies
The data items listed below are included in the SDS. State agencies that are currently collecting these items should include them in April data submissions. For biennial reports on WIC participant and program characteristics, the term participant means a person on WIC master lists or a person listed in WIC operating files who is certified to receive WIC benefits in April 2014. The data items should reflect the participant's status on each item at the time of the most recent WIC Program certification as of April 2014. However, as a convenience to State agencies that do not maintain historical files and that update the information in their automated systems during certification periods, current information that is on the file for each participant in April 2014 will be accepted. 21. Date of First WIC Certification Date the participant was first certified for the WIC Program in
MMDDYYYY format. For pregnant, breastfeeding, and postpartum women, this applies to the current/most recent pregnancy and not to prior pregnancies.
22. Education Level For pregnant, breastfeeding and postpartum women, the highest grade or year of
school completed. For infants and children, the highest grade or year of school completed by mother or primary caretaker.
23. Number in Household in WIC The number of people in the participant's household receiving WIC
benefits. 24. Date Previous Pregnancy Ended For pregnant women, the date that the previous pregnancy ended in
MMDDYYYY format. 25. Total Number of Pregnancies For pregnant women, the total number of times the woman has been
pregnant, including this pregnancy, all live births and any pregnancies resulting in miscarriage, abortion or stillbirth.
26. Total Number of Live Births For pregnant women, the total number of babies born alive to this woman,
including babies who may have died shortly after birth. 27a-b. Prepregnancy Weight For pregnant women only, the participant's weight immediately prior to
pregnancy. Prepregnancy weight may be reported either in pounds and ounces, or in grams. 28a-b. Weight Gain During Pregnancy For breastfeeding and postpartum women, the participant's weight gain
during pregnancy as taken immediately at or prior to delivery. Weight gain during pregnancy may be reported in either pounds and quarter pounds or in grams.
29a-b. Birth Weight For infants and children, the participant's weight at birth measured according to CDC
nutrition surveillance program standards (lbs./ounces). Birth weight may be reported in either pounds and ounces or in grams.
30a-b. Birth Length For infants and children, the participant's length measured according to CDC nutrition
surveillance program standards (nearest one-eighth inches). Birth length may be reported in either inches and eighth inches or in centimeters.
31. Participation in the Food Distribution on Indian Reservations Program The participant's reported
participation in this program at the time of the most recent WIC Program certification as of April 2014.
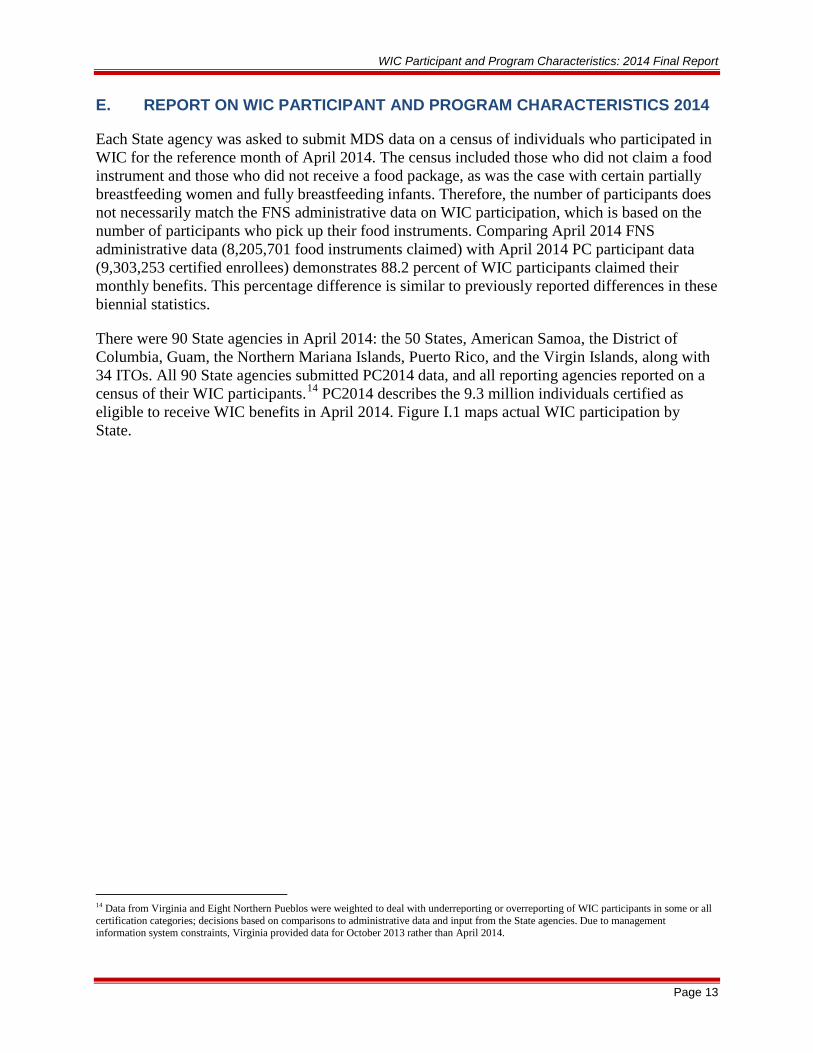
WIC Participant and Program Characteristics: 2014 Final Report
Page 13
E. REPORT ON WIC PARTICIPANT AND PROGRAM CHARACTERISTICS 2014
Each State agency was asked to submit MDS data on a census of individuals who participated in WIC for the reference month of April 2014. The census included those who did not claim a food instrument and those who did not receive a food package, as was the case with certain partially breastfeeding women and fully breastfeeding infants. Therefore, the number of participants does not necessarily match the FNS administrative data on WIC participation, which is based on the number of participants who pick up their food instruments. Comparing April 2014 FNS administrative data (8,205,701 food instruments claimed) with April 2014 PC participant data (9,303,253 certified enrollees) demonstrates 88.2 percent of WIC participants claimed their monthly benefits. This percentage difference is similar to previously reported differences in these biennial statistics.
There were 90 State agencies in April 2014: the 50 States, American Samoa, the District of Columbia, Guam, the Northern Mariana Islands, Puerto Rico, and the Virgin Islands, along with 34 ITOs. All 90 State agencies submitted PC2014 data, and all reporting agencies reported on a census of their WIC participants.14 PC2014 describes the 9.3 million individuals certified as eligible to receive WIC benefits in April 2014. Figure I.1 maps actual WIC participation by State.
14 Data from Virginia and Eight Northern Pueblos were weighted to deal with underreporting or overreporting of WIC participants in some or all certification categories; decisions based on comparisons to administrative data and input from the State agencies. Due to management information system constraints, Virginia provided data for October 2013 rather than April 2014.

WIC Participant and Program Characteristics: 2014 Final Report
Page 14
Figure I.1. WIC Participation by State, April 2014
Total WIC Participation: 9,303,253
Notes
For this figure, ITO participation counts are included in total State participation counts; U.S. territories are excluded from participation counts.
For PC2014, most State agencies provided information on each MDS item for each participant. While overall reporting has improved substantially over time, rates of unreported data remain relatively high for two items: income and blood measurement. Data on income were submitted for 90.9 percent of the 9.3 million WIC participants; an additional 0.9 percent of participants reported an income of zero dollars. Fifteen State agencies—Alaska, Kentucky, Massachusetts, Puerto Rico, Tennessee, Utah, and 9 ITOs—provided income data for less than 70 percent of their WIC participants. Similarly, PC2014 contains blood measurement data for only 91 percent of WIC women participants. WIC regulations do not require blood tests for infants younger than 9 months of age, in addition, blood tests are required only annually for children older than age 2 whose results were within normal ranges within the last 6 months; for these reasons, blood measurements may be absent for a large portion of infants and children in a State agency database.
The State agency-maintained information systems that serve as the sources of data for PC2014 do not always contain complete information on every individual who participates in WIC. To account for this anomaly, all tables in this publication, with the exception of breastfeeding tables,
WIC Participant and Program Characteristics: 2014 Final Report
Page 15
include columns or rows labeled “not reported.” These figures indicate the numbers and percentages of WIC participants for whom State agencies could not provide information on specific items.
PC2014 data may be unreported for a variety of reasons, some of which could indicate differences between participants with unreported data and those individuals with reported data. To account for these anomalies, a uniform strategy has been adopted for preparing all tables in this report. Data not reported are included in the calculation of percentage distributions for each characteristic. While including missing data in the denominators for all calculations tends to place estimates for each characteristic at a lower bound, this approach has allowed consistent presentation of tabulations throughout the report. Furthermore, it ensures all information needed to calculate upper-bound estimates is readily available in every table. Caution should be used in comparing results across groups or over time. Missing data must always be considered in gauging differences among groups or categories of WIC participants or in analyzing trends across years.
Eighty-five State agencies (94 percent) provided some or all SDS data elements for PC2014. Two of the three largest State agencies, California and New York (accounting for 22.6 percent of WIC participants), did not report any SDS data, which limits the completeness of SDS reporting. The most frequently reported SDS items were as follows:
• Prepregnancy weight, submitted by 82 agencies, representing 65.9 percent of pregnant WIC participants
• Date of first WIC certification, submitted by 79 agencies, representing 62.4 percent of WIC participants
• Birth weight, submitted by 77 agencies, representing 59.2 percent of WIC infants and children
• Weight gain during pregnancy, submitted by 73 agencies, representing 54.9 percent of breastfeeding and postpartum women
• Number of household members receiving WIC benefits, submitted by 73 agencies, representing 45.8 percent of WIC participants
The limited amount and incompleteness of SDS data preclude computation of national estimates. Appendix F of this report presents a series of tables reporting State-level data for those States submitting SDS information as well as a list of State agencies that supplied SDS data.
F. ORGANIZATION OF THE REPORT
This report presents the results of the PC2014 data collection efforts. Chapters II through VII present data on different aspects of WIC participants and programs. Chapter II presents information on overall WIC program participation as well as demographic data on WIC participants. Chapter III offers information on economic status of WIC households. Chapter IV provides information on nutritional risks of WIC participants. Chapter V describes WIC priority groups. Chapter VI provides information on breastfeeding initiation and duration. Chapter VII contains information on migrant WIC participants.

WIC Participant and Program Characteristics: 2014 Final Report
Page 16
This report makes references to changes from previous data PC collections. Please see previous reports for detailed tables containing data from these collections.

WIC Participant and Program Characteristics: 2014 Final Report
Page 17
II. OVERVIEW OF WIC PARTICIPATION AND DEMOGRAPHICS OF WIC PARTICIPANTS
For the purposes of this report, WIC participants are defined as persons certified to receive WIC benefits in April 2014, regardless of whether or not the individuals claimed or used the food instruments issued. This definition differs from the participation measure used in FNS administrative data, which is based on the number of participants who claimed their food instruments. Additionally, in accordance with WIC regulations, participation data include fully breastfeeding infants and partially breastfeeding women, even if they receive no food package, provided their breastfeeding mothers or infants receive a food package.
This chapter presents data on the demographic characteristics of WIC participants. Section A discusses overall participation levels and the distribution of participants across certification categories. Sections B through E describe the age of participants, the trimester of enrollment during pregnancy for pregnant women, the distribution of WIC participants by geographical region, and the race and ethnicity of WIC participants.
A. WIC PARTICIPATION
With full congressional funding for more than 15 years, WIC has served all eligible women, infants, and children. Changes in participation over these years mainly reflect changes in eligibility of participants. In general, the number of participants has increased steadily over time. However, from 2012 to 2014, WIC participation declined 4.4 percent, from 9,734,468 to 9,303,253 (see figure II.1). This decline is a continuation of a 2.9-percent decrease from 2010 to 2012. The only other decrease in participation between WIC PC data collections occurred between 1998 and 2000. The recent decline may be partially attributable to a slowly improving economy following the recent recession, but also may be in response to declining birth and total fertility rates in the United States (Martin, Hamilton, Osterman, Curtin, & Mathews, 2015).

WIC Participant and Program Characteristics: 2014 Final Report
Page 18
Figure II.1. Total WIC Participants: 1992–2014
This decrease in WIC participation occurred across all certification categories except one: the number of breastfeeding women increased by 3.3 percent (see table II.1). Among the other certification categories, the number of pregnant women showed the largest change with a decrease of 8.8 percent, the number of postpartum women decreased by 5.5 percent, the number of infants decreased by 4.4 percent, and the number of children decreased by 4.5 percent.
From 2012 to 2014, the proportions of women and children participants changed slightly while the proportion of infants remained constant at 23.0 percent (see table II.2). Among women, the proportion of breastfeeding women increased from 6.8 percent in 2012 to 7.4 percent in 2014, while the proportion of postpartum women decreased slightly (6.7 percent in 2012 to 6.6 percent in 2014). In 2012, for the first time since WIC PC data collections began, the proportion of breastfeeding women was higher than the proportion of postpartum women, and the difference between the two categories has grown. Between 2012 and 2014, the proportion of pregnant women decreased by 0.5 percentage points to 9.6 percent; this decline continues a steady trend beginning in 1992, when 13.6 percent of WIC participants were pregnant women.

WIC Participant and Program Characteristics: 2014 Final Report
Page 19
Table II.1. Percent Distribution of WIC Participants by Participant Category:
2012, 2014
Participant Category Number of
Participants 2012 Number of
Participants 2014 Percent Change
2012–2014 Women
Pregnant women 983,192 896,551 -8.8 Breastfeeding women 665,526 687,351 3.3 Postpartum women 651,347 615,559 -5.5 Total women 2,300,065 2,199,461 -4.4
Infants 2,240,045 2,141,988 -4.4
Children 5,194,358 4,961,804 -4.5
U.S. WIC 9,734,468 9,303,253 -4.4 Notes
Percents may not add to 100.0% and subtotals may not add to totals due to rounding and to the use of weights in the case of several State agencies that either under- or overreported the number of participants.
For the biennial PC reports, participants are defined as persons on WIC master lists who are certified to receive WIC benefits in April, including individuals who neither claim nor use their food instruments. This definition differs from FNS administrative data in which participants are defined as individuals who claim their food instruments.
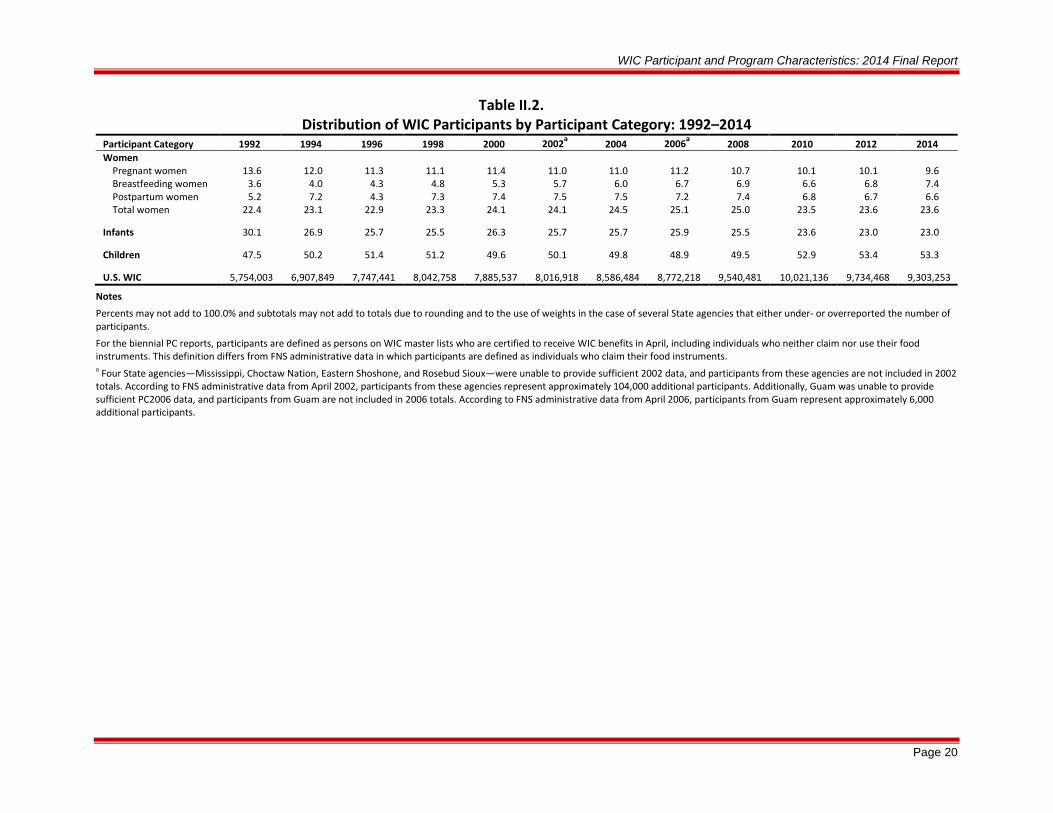
WIC Participant and Program Characteristics: 2014 Final Report
Page 20
Table II.2. Distribution of WIC Participants by Participant Category: 1992–2014
Participant Category 1992 1994 1996 1998 2000 2002a 2004 2006a 2008 2010 2012 2014 Women
Pregnant women 13.6 12.0 11.3 11.1 11.4 11.0 11.0 11.2 10.7 10.1 10.1 9.6 Breastfeeding women 3.6 4.0 4.3 4.8 5.3 5.7 6.0 6.7 6.9 6.6 6.8 7.4 Postpartum women 5.2 7.2 4.3 7.3 7.4 7.5 7.5 7.2 7.4 6.8 6.7 6.6 Total women 22.4 23.1 22.9 23.3 24.1 24.1 24.5 25.1 25.0 23.5 23.6 23.6
Infants 30.1 26.9 25.7 25.5 26.3 25.7 25.7 25.9 25.5 23.6 23.0 23.0
Children 47.5 50.2 51.4 51.2 49.6 50.1 49.8 48.9 49.5 52.9 53.4 53.3
U.S. WIC 5,754,003 6,907,849 7,747,441 8,042,758 7,885,537 8,016,918 8,586,484 8,772,218 9,540,481 10,021,136 9,734,468 9,303,253
Notes
Percents may not add to 100.0% and subtotals may not add to totals due to rounding and to the use of weights in the case of several State agencies that either under- or overreported the number of participants.
For the biennial PC reports, participants are defined as persons on WIC master lists who are certified to receive WIC benefits in April, including individuals who neither claim nor use their food instruments. This definition differs from FNS administrative data in which participants are defined as individuals who claim their food instruments. a Four State agencies—Mississippi, Choctaw Nation, Eastern Shoshone, and Rosebud Sioux—were unable to provide sufficient 2002 data, and participants from these agencies are not included in 2002 totals. According to FNS administrative data from April 2002, participants from these agencies represent approximately 104,000 additional participants. Additionally, Guam was unable to provide sufficient PC2006 data, and participants from Guam are not included in 2006 totals. According to FNS administrative data from April 2006, participants from Guam represent approximately 6,000 additional participants.

WIC Participant and Program Characteristics: 2014 Final Report
Page 21
B. AGE
Most WIC women (85.9 percent) were aged 18 to 34 (see table II.3). During the past 22 years, the proportion of total WIC women participants younger than age 18 has declined steadily, from 10.6 percent in 1992 to 3.4 percent in 2014.15 The proportion of WIC women aged 18 to 34 has shown little or no change during the past 12 years. The proportion of WIC women aged 35 and older has risen slowly and steadily since 1992, from 5.2 percent to 10.5 percent in 2014. Breastfeeding women tended to comprise a larger proportion of participants older than age 35 (13.4 percent) as compared to pregnant and postpartum women (9.6 percent and 8.8 percent, respectively).
Most WIC infants (91.4 percent) were aged 0 to 3 months at time of certification, a proportion only slightly decreased since 2012, when 92.5 percent of infants were aged 0 to 3 months at time of certification. In 2014, 36.7 percent of children were 1 year old, 25.9 percent were 2 years old, 23.1 percent were 3 years old, and 14.2 percent were 4 years old at the time of certification. The age distributions of 2- and 3-year-old children at certification have remained fairly stable since 2008. However, the proportions of 1- and 4-year-old children have increased by 1.9 percentage points and decreased by 2.3 percentage points since 2012, respectively.
C. TRIMESTER OF ENROLLMENT
In 2014, more than half of pregnant WIC participants (54.5 percent) enrolled in the program during their first trimesters of pregnancy and most of the remainder (36.0 percent) during their second trimesters (see table II.4). Only 9.2 percent enrolled during their third trimesters. Although the percentage of women who enrolled during their first trimesters increased by more than 5 percentage points from 2010 to 2012 (51.6 percent to 56.9 percent), this percentage decreased by 2.4 percentage points in 2014. Additionally, the percentage of women who enrolled during their third trimesters decreased from 9.4 percent in 2010 to 7.8 percent in 2012, but increased to 9.2 percent in 2014. Therefore, the distribution of trimester of enrollment in 2014 more closely resembles the distribution for the same variable in 2010 than in 2012.
15 Between 1992 and 2014, the number of WIC women participants younger than age 18 dropped from 136,437 in 1992 to 76,042 in 2014 (a 44.3% decrease). This decrease was particularly great between 2012 (100,038) and 2014 (76,042) which is consistent with broader decreases in teen pregnancy. This decrease occurred despite the overall increase in the number of women WIC participants between these 2 years (1,289,115 in 1992 and 2,199,46 in 2014).

WIC Participant and Program Characteristics: 2014 Final Report
Page 22
Table II.3. Distribution of Age of WIC Participants at Certification by WIC Participant Category:
2010, 2012, 2014 Participant Category and Age at Certification
2010
2012
2014
Women
Pregnant Women 1,015,173 983,192 896,551
Younger than 15 years 0.3 0.3 0.2 15–17 years 6.1 5.0 4.1 18–34 years 85.6 86.0 86.0 35 years or older 8.0 8.6 9.6 Age not reported 0.0 0.1 0.2
Breastfeeding Women 659,933 665,526 687,351 Younger than 15 years 0.1 0.1 0.1 15–17 years 3.0 2.5 2.1 18–34 years 84.6 84.5 84.4 35 years or older 12.2 12.9 13.4 Age not reported 0.1 0.0 0.1
Postpartum Women 681,260 651,347 615,559 Younger than 15 years 0.2 0.2 0.1 15–17 years 5.5 4.6 3.6 18–34 years 86.6 87.1 87.3 35 years or older 7.5 8.0 8.8 Age not reported 0.1 0.1 0.1
Total Women 2,356,367 2,300,065 2,199,461 Younger than 15 years 0.2 0.2 0.1 15–17 years 5.0 4.2 3.3 18–34 years 85.6 85.9 85.9 35 years or older 9.0 9.7 10.5 Age not reported 0.1 0.1 0.1
Infantsa 2,366,706 2,240,045 2,141,988 0–3 months 92.4 92.5 91.4 4–5 months 2.7 2.6 2.9 6–8 months 3.5 3.6 4.0 9–11 months 1.4 1.3 1.6 Age not reported 0.1 0.1 0.1
Childrenb 5,298,063 5,194,358 4,961,804 1 year 34.8 34.8 36.7 2 years 26.2 25.3 25.9 3 years 22.8 23.3 23.1 4 years 16.1 16.5 14.2 Age not reported 0.0 0.0 0.1
U.S. WIC 10,021,135 9,734,468 9,303,523
Notes
Percents may not add to 100.0% and subtotals may not add to totals due to rounding and to the use of weights in the case of several State agencies that either under- or overreported the number of participants. a An infant is defined as a participant who at certification is younger than 1 year of age and would be classified as a child at the age of 366 days. For infants, age at certification generally represents age when initial WIC benefits were received because infants are not required to be recertified until their first birthday. b In April 2014, about 2.45% of participants classified as 1-year-old children were in fact 11-month-old infants who were reclassified as children without being formally recertified; likewise, about 0.02% of WIC participants who were classified as infants were older than 366 days. In April 2012, these figures were 2.04% and 0.07%, respectively; in April 2010, they were 1.94% and 0.03%, respectively. Since children can be certified annually for up to 4 years, the distribution of children's age at last certification corresponds closely to the distribution of current age.

WIC Participant and Program Characteristics: 2014 Final Report
Page 23
Table II.4. Distribution of Pregnant Women WIC Participants by Trimester of Enrollment:
2010, 2012, 2014
2010 2012 2014
Trimester of Enrollment Number Percent Number Percent Number Percent First trimester 523,683 51.6 559,432 56.9 488,299 54.5 Second trimester 358,895 35.4 341,076 34.7 323,034 36.0 Third trimester 95,699 9.4 77,036 7.8 82,338 9.2 Trimester not reported 36,895 3.6 5,646 0.6 2,878 0.3
Total Pregnant Women 1,015,173 100.0 983,192 100.0 896,551 100.0 Notes
Percents may not add to 100.0% and subtotals may not add to totals due to rounding and to the use of weights in the case of several State agencies that either under- or overreported the number of participants.

WIC Participant and Program Characteristics: 2014 Final Report
Page 24
D. REGION
WIC participation varies considerably by region. Of the seven regions, the Western Region encompassed the greatest number of participants, with 2,240,496 (24.1 percent of all WIC participants), while the Mountain Plains Region had the fewest at 582,285 (6.3 percent of all WIC participants; table II.5). All regions experienced a decrease in the number of participants since 2012, which is consistent with the decrease in overall WIC participation between 2012 and 2014.
Table II.5. Distribution of WIC Participants by Region: 2010, 2012, 2014
2010 2012 2014
Region Number Percent Number Percent Number Percent Northeast 878,845 8.8 874,064 9.0 845,658 9.1 Mid-Atlantic 1,071,433 10.7 1,068,189 11.0 1,016,483 10.9 Southeast 1,974,089 19.7 1,900,047 19.5 1,850,588 19.9 Midwest 1,400,832 14.0 1,340,267 13.8 1,272,077 13.7 Southwest 1,622,722 16.2 1,499,957 15.4 1,495,666 16.1 Mountain Plains 655,785 6.6 637,688 6.6 582,285 6.3 Western 2,407,430 24.0 2,414,256 24.8 2,240,496 24.1
U.S. WIC 10,021,136 100.0 9,734,468 100.0 9,303,253 100.0 Notes
Percents may not add to 100.0% and subtotals may not add to totals due to rounding and to the use of weights in the case of several State agencies that either under- or overreported the number of participants.
E. RACE AND ETHNICITY
The Office of Management and Budget (OMB) requires race and ethnicity to be reported separately. One measure indicates whether the individual is Hispanic/Latino. The other reports the individual’s racial category or categories; multiple racial identifications are permitted. The five racial categories required by OMB are (1) American Indian or Alaska Native; (2) Asian; (3) Black or African American; (4) Native Hawaiian or Other Pacific Islander; and (5) White. These categories were first used for the 2006 PC report.
In 2014, only one race was reported for most WIC participants: 58.7 percent of all WIC participants were identified as White Only, 20.3 percent were identified as Black or African American Only, 11.1 percent were identified as American Indian or Alaska Native Only, and 4.1 percent of participants were identified as either Asian Only or Native Hawaiian or Other Pacific Islander Only (see figure II.2). Two or more races were reported for 5.4 percent of WIC participants. Table A.II.6 in appendix A provides a detailed breakdown of participants reporting two or more races. Hispanic/Latino ethnicity was reported for 41.6 percent of participants.

WIC Participant and Program Characteristics: 2014 Final Report
Page 25
Figure II.2. Distribution of Race and Ethnicity of WIC Participants
The distribution of race and ethnicity in the WIC population varied from the distribution in the overall U.S. population as reported during the 2009–2013 American Community Survey (see table II.6). In the WIC population, a lower percentage of people were identified as White Only and higher percentages of people were identified as Black or African American Only and American Indian or Alaska Native Only. The difference in racial and ethnic distribution is particularly large for the American Indian or Alaska Native Only category; 11.1 percent of the WIC population fell into this category, in comparison to less than 1 percent of the overall U.S. population. This difference is likely due to State agency variations in the reporting of race for Hispanic/Latino WIC participants, as described later in this section.
Race and ethnicity reporting stayed relatively constant from 2012 to 2014 (see table II.7). Race distribution changes ranged from a decrease of 1.1 percentage points for American Indian or Alaska Native Only to increases of 0.5 percentage points in two categories, Black or African American Only and White Only. The proportion of participants for whom an ethnicity of Hispanic/Latino was reported also remained relatively constant at 41.6 percent.
The proportion of participants for whom a race of American Indian or Alaska Native Only was reported increased substantially around the time of the introduction of the revised OMB race and ethnicity reporting in 2006.16 In 2004, just 1.6 percent of WIC participants were identified as American Indian or Alaska Native. In PC2006, the percentage of American Indian or Alaska Native Only participants soared to 15.3 percent of all WIC participants. The proportion of participants recorded as American Indian or Alaska Native Only, which has fluctuated since 2006, was 11.1 percent in 2014.
16 See table A.II.7 and figure A.II.7 in appendix A for additional detail on the change in race and ethnicity reporting.
WIC Participant and Program Characteristics: 2014 Final Report
Page 26
The change between 2004 and 2006 in the percent of participants classified as American Indian or Alaska Native appears to be related to the revised OMB racial categories. OMB defines an American Indian or Alaska Native as a person who has origins in any of the original peoples of North and South America (including Central America) and who maintains tribal affiliation or community attachment. In PC2006, the guidelines for reporting race were revised; the new guidelines require a WIC participant who indicates he/she is Hispanic/Latino to also indicate race, choosing from the five racial categories listed earlier in this section. If the recipient does not designate a race, WIC staff are required to do so based on observation. Some Hispanic/Latino participants and WIC staff may view American Indian or Alaska Native as the most appropriate racial group for Hispanic/Latino participants when race must be designated based on observation, and may select that race category in the absence of another preference by the participant. The proportion of Hispanic/Latino WIC participants who were also identified as American Indian or Alaska Native Only varied widely across State agencies.
In general, the racial and ethnic composition for WIC’s certification categories was similar to the overall racial/ethnic distribution of WIC participants (see table II.9), with few notable exceptions. Breastfeeding women were disproportionately Hispanic/Latino compared to all WIC women (44.5 percent of breastfeeding women were Hispanic/Latino, whereas 38.2 percent of all WIC women were Hispanic/Latino), while postpartum women were disproportionately non-Hispanic/Latino (69.2 percent of postpartum women were non-Hispanic/Latino, whereas 61.8 percent of all WIC women were non-Hispanic/Latino). Additionally, of WIC recipients, a larger proportion of children compared to women and infants were Hispanic/Latino (44.7 percent compared to 38.2 percent and 38.0 percent, respectively). Table A.II.9 in appendix A shows a more-detailed breakdown of race and ethnicity by certification category, providing counts rather than percentages.

WIC Participant and Program Characteristics: 2014 Final Report
Page 27
Table II.6. Percent Distribution of Race and Ethnicity Of
WIC Participants (2014) and General U.S. Population (2013)a
WIC Participants
U.S. Population
Race American Indian or Alaska Native Only 11.1 0.8
Asian Only 3.3 4.9 Black or African American Only 20.3 12.6 Native Hawaiian or Other Pacific Islander Only 0.8 0.2 White Only 58.7 74.0 Some other race - 4.7 Two or more races 5.4 2.8 Race not reported 0.2 -
Ethnicity Hispanic/Latino 41.6 16.6
Not Hispanic/Latino 58.3 83.4 Ethnicity not reported 0.1 -
Notes
For WIC PC data, percents may not add to 100.0% and subtotals may not add to totals due to rounding and the use of weights in the case of several State agencies that either under- or overreported the number of participants.
Hyphens indicate categories that were not available in either WIC PC data or American Community Survey data. a Source: U.S. Department of Commerce, n.d.

WIC Participant and Program Characteristics: 2014 Final Report
Page 28
Table II.7. Percent Distribution of Race and Ethnicity of WIC Women, Infants, and Children: 2012, 2014
Total Women Infants Children Total WIC Participants
Characteristics 2012 2014 2012 2014 2012 2014 2012 2014 Race
American Indian or Alaska Native Only 11.2 10.4 9.8 9.0 13.7 12.3 12.2 11.1 Asian Only 3.4 3.6 3.0 3.1 2.9 3.3 3.1 3.3 Black or African American Only 19.9 20.5 21.9 22.4 18.8 19.4 19.8 20.3 Native Hawaiian or Other Pacific Islander Only 0.9 0.9 0.8 0.8 0.9 0.8 0.8 0.8 White Only 60.9 61.4 58.0 58.2 57.1 57.8 58.2 58.7 Two or more races 2.8 3.0 5.6 6.1 5.9 6.3 5.1 5.4 Race not reported 0.8 0.2 0.8 0.3 0.7 0.2 0.7 0.2
Total 100.0 100.0 100.0 100.0 100.0 100.0 100.0 100.0
U.S. WIC 2,300,065 2,199,461 2,240,045 2,141,988 5,194,358 4,961,804 9,734,468 9,303,253 Ethnicity
Hispanic/Latino 37.7 38.2 37.3 38.0 44.9 44.7 41.5 41.6 Not Hispanic/Latino 61.6 61.8 61.9 62.0 54.4 55.2 57.8 58.3 Ethnicity not reported 0.7 0.1 0.7 0.1 0.6 0.1 0.7 0.1
Total 100.0 100.0 100.0 100.0 100.0 100.0 100.0 100.0
U.S. WIC 2,300,065 2,199,461 2,240,045 2,141,988 5,194,358 4,961,804 9,734,468 9,303,253
Notes
Percents may not add to 100.0% and subtotals may not add to totals due to rounding and the use of weights in the case of several State agencies that either under- or overreported the number of participants.

WIC Participant and Program Characteristics: 2014 Final Report
Page 29
Table II.8. Percent Distribution of Ethnicity by Race of WIC Participants
Race Hispanic Non-Hispanic Ethnicity
Not Reported American Indian or Alaskan Native Only 24.0 1.9 0.0a Asian Only 0.3 5.5 0.0a Black or African American Only 2.6 33.0 0.2 Native Hawaiian or Other Pacific Islander Only 0.7 0.9 0.0a White Only 67.3 52.7 0.2 Two or more races 5.0 5.8 0.0a Race not reported 0.1 0.1 99.5
Total 100.0 100.0 100.0
U.S. WIC 3,871,150 5,423,239 8,865 Notes
Percents may not add to 100.0% and subtotals may not add to totals due to rounding and to the use of weights in the case of several State agencies that either under- or overreported the number of participants. a Indicates less than 0.05%.

WIC Participant and Program Characteristics: 2014 Final Report
Page 30
Table II.9. Percent Distribution of Race and Ethnicity of WIC Participants by Participant Category
Characteristics Pregnant Women
Breastfeeding Women
Postpartum Women
Total Women
Infants
Children
Total WIC Participants
Race
American Indian or Alaska Native Only 11.0 11.1 8.7 10.4 9.0 12.3 11.1
Asian Only 3.4 4.4 3.0 3.6 3.1 3.3 3.3 Black or African American Only 19.6 17.8 24.8 20.5 22.4 19.4 20.3 Native Hawaiian or Other Pacific Islander Only 0.8 1.0 0.9 0.9 0.8 0.8 0.8 White Only 62.0 62.4 59.6 61.4 58.2 57.8 58.7 Two or more races 2.9 3.2 2.9 3.0 6.1 6.3 5.4 Race not reported 0.2 0.2 0.2 0.2 0.3 0.2 0.2
Total 100.0 100.0 100.0 100.0 100.0 100.0 100.0
U.S. WIC 896,551 687,351 615,559 2,199,461 2,141,988 4,961,804 9,303,253 Ethnicity
Hispanic/Latino 38.4 44.5 30.8 38.2 38.0 44.7 41.6 Not Hispanic/Latino 61.5 55.4 69.2 61.8 62.0 55.2 58.3 Ethnicity not reported 0.1 0.1 0.1 0.1 0.1 0.1 0.1
Total 100.0 100.0 100.0 100.0 100.0 100.0 100.0
U.S. WIC 896,551 687,351 615,559 2,199,461 2,141,988 4,961,804 9,303,253
Notes
Percents may not add to 100.0% and subtotals may not add to totals due to rounding and the use of weights in the case of several State agencies that either under- or overreported the number of participants.

WIC Participant and Program Characteristics: 2014 Final Report
Page 31
Table II.10. Percent Distribution of Race and Ethnicity of WIC Participants by Region
U.S. WIC
Northeast
Mid-Atlantic
Southeast
Midwest
Southwest
Mountain Plains
Western
Percent
Number
Race
American Indian or Alaska Native Only 9.5 17.3 1.3 1.0 2.6 9.3 28.9 11.1 1,032,650
Asian Only 7.8 2.4 1.5 3.3 1.5 2.0 5.1 3.3 309,259 Black or African American Only 23.9 25.5 35.0 24.1 17.4 11.2 6.8 20.3 1,892,154 Native Hawaiian or Other
Pacific Islander Only 1.3
1.2
0.2
0.2
0.3
0.7
1.8
0.8
78,228 White Only 53.9 49.8 58.7 64.7 74.2 71.1 47.8 58.7 5,465,187 Two or more races 3.5 3.6 3.1 6.2 3.8 5.6 9.6 5.4 506,271 Race not reported 0.1 0.2 0.3 0.5 0.2 0.1 0.1 0.2 19,504
Total 100.0 100.0 100.0 100.0 100.0 100.0 100.0 100.0
U.S. WIC 845,658 1,016,483 1,850,588 1,272,077 1,495,666 582,285 2,240,496
9,303,253 Ethnicity
Hispanic/Latino 36.4 40.6 23.7 20.1 57.4 27.2 64.3 41.6 3,871,150 Not Hispanic/Latino 63.6 59.3 76.3 79.4 42.5 72.8 35.7 58.3 5,423,239 Ethnicity not reported 0.0a 0.0a 0.0a 0.5 0.1 0.0a 0.0a 0.1 8,865
Total 100.0 100.0 100.0 100.0 100.0 100.0 100.0 100.0
U.S. WIC 845,658 1,016,483 1,850,588 1,272,077 1,495,666 582,285 2,240,496
9,303,253
Notes
Percents may not add to 100.0% and subtotals may not add to totals due to rounding and to the use of weights in the case of several State agencies that either under- or overreported the number of participants. a Indicates less than 0.05%.

WIC Participant and Program Characteristics: 2014 Final Report
Page 32
III. INCOME OF WIC PARTICIPANTS
In 2014, the Nation saw sustained yet gradual improvement in many areas of the economy as the country recovered from the longest and deepest economic downturn since the Great Depression. Even with these slight improvements, however, most economic indicators had not yet reached their prerecession levels. The seasonally adjusted unemployment rate consistently improved throughout 2013 and into the first 4 months of 2014, falling from a high of 8.0 percent in January 2013 to a low of 6.2 percent in April 2014. In contrast, unemployment hovered around 5 percent for much of 2007, the last year before the onset of the recession (U.S. Department of Labor [DOL], n.d.).
Federal regulations require categorically eligible WIC applicants to meet income eligibility standards set by State agencies. Income limits must be between 100 percent and 185 percent of Federal poverty guidelines as established by HHS. These guidelines are based on household size.17 All State agencies currently set WIC income eligibility at 185 percent of the Federal poverty guideline. At the threshold in effect in April 2014, a person from a family of four with an annual household income of $43,568 or less was income eligible for WIC (USDA, 2014a).
State agencies may determine an applicant is adjunctively income eligible for WIC benefits if the individual can document participation in TANF, SNAP, or Medicaid.18 WIC regulations also allow State agencies to extend automatic WIC income eligibility to individuals participating in other means-tested programs that apply income eligibility guidelines that are in congruence with State regulations on WIC income.19 All State agencies except American Samoa, Puerto Rico, and the Northern Mariana Islands apply TANF, SNAP, and Medicaid participation to determine adjunctive WIC income eligibility.20
This chapter presents data on the income of WIC participants and related measures. Section A describes the participation of WIC participants in other benefit programs. Section B discusses household size and income. Section C describes the poverty status of WIC participants’ households.
A. PARTICIPATION IN OTHER BENEFIT PROGRAMS
Table III.1 shows the reported participation of WIC recipients in the TANF, SNAP, and Medicaid programs. Of WIC participants, 7.5 percent reported participation in TANF, slightly more than one-third (35.1 percent) reported receipt of SNAP benefits, and more than two-thirds (68.8 percent) reported enrollment in Medicaid in 2014. These findings likely underestimate participation in these programs. One potential reason for underreporting is many local agencies record this information when certifying individuals for WIC. Staff at many WIC local agencies refer WIC enrollees to other programs, and any enrollment subsequent to certification may not 17 Poverty guidelines are higher for Alaska and Hawaii than for all other State agencies. 18 Because the Medicaid program permits recipients to have higher incomes, it is possible some WIC participant household incomes are more than 185% of the Federal poverty guideline. 19 Although WIC regulations distinguish means-tested programs used for adjunctive income eligibility from programs used to establish automatic income eligibility, the two mechanisms work similarly with respect to income eligibility. 20 American Samoa, Puerto Rico, and the Northern Mariana Islands do not participate in SNAP, but participants in their respective nutrition assistance programs are automatically eligible for WIC. Medicaid recipients in American Samoa and the Northern Mariana Islands, and TANF and Medicaid recipients in Puerto Rico, also are adjunctively eligible for WIC.

WIC Participant and Program Characteristics: 2014 Final Report
Page 33
be captured in the estimates presented here. Another consideration is that constraints in various WIC management information systems, as well as required procedures for documenting income and participation in other programs, may have limited the number of programs entered into computer systems by local WIC staff. Finally, approximately 6 percent of participants had no data reported for one or more programs.
Participation in all three means-tested programs decreased between PC reporting years for the first time since 2008, but remained above or close to prerecession levels (see figure III.1). Between 2012 and 2014, TANF participation of WIC participants decreased from 8.6 percent to 7.5 percent, SNAP participation decreased from 35.8 percent to 35.1 percent, and Medicaid participation decreased from 70.8 percent to 68.8 percent. In April 2014, 72.8 percent of WIC participants reported receiving benefits from at least one of the programs, (i.e., TANF, Medicaid, or SNAP) which classified them as adjunctively income eligible for WIC (see table III.1), down from 74.6 percent in 2012.
Figure III.1. Number and Percent of WIC Participants With Reported Participation In
Other Programs at Certification: 2008, 2010, 2012, 2014
Notes
Illinois was unable to provide sufficient PC2010 data on participation in TANF.
Alaska was unable to provide sufficient PC2014 data on participation in TANF, SNAP, and Medicaid.
Participants missing data on participation in one or more programs were excluded from the bar chart. Excluding only those participants for whom data are not reported on a single program changes the percentages slightly: TANF (7.6%); SNAP (37.0%); Medicaid (71.4%).
Members of most ITOs can participate in the Food Distribution Program on Indian Reservations (FDPIR) as an alternative to SNAP. PC2014 SDS collected data on FDPIR participation, though reporting is fairly incomplete. Thirty-one of 34 ITOs, representing approximately 68% of all participants in ITO WIC programs, chose to report these data. Of the 43,853 WIC participants in ITOs reporting FDPIR, only 0.6% participated in the FDPIR program.

WIC Participant and Program Characteristics: 2014 Final Report
Page 34
Table III.1. Number and Percent of WIC Participants With Reported Participation In
Other Programs at Certification
Number % U.S. WIC
Participants Reporting Participation in Other Programs by Program TANF 699,952 7.5
SNAP 3,268,231 35.1 Medicaid 6,402,851 68.8 Participation in any other program 6,769,683 72.8
Participants Reporting Participation in Other Programs by Combination of Programs TANF, SNAP, and Medicaid 557,853 6.0 TANF and SNAP 29,099 0.3 TANF and Medicaid 61,692 0.7 SNAP and Medicaid 2,394,853 25.7 TANF only 51,308 0.6 SNAP only 286,426 3.1 Medicaid only 3,388,453 36.4 Do not participate in other programs 1,960,470 21.1 Not reported 573,100 6.2
U.S. WIC 9,303,253 100.0 Notes
Percents may not add to 100.0% and subtotals may not add to totals due to rounding and to the use of weights in the case of several State agencies that either under- or overreported the number of participants.
Alaska was unable to provide sufficient PC2014 data on participation in TANF, SNAP, and Medicaid.
“Not reported” indicates the number and percentage of participants with data not reported for one or more programs.
Members of most ITOs can participate in the Food Distribution Program on Indian Reservations (FDPIR) as an alternative to SNAP. PC2014 SDS collected data on FDPIR participation, though reporting is fairly incomplete. Thirty-one of 34 ITOs, representing approximately 68% of all participants in ITO WIC programs, chose to report these data. Of the 43,853 WIC participants in ITOs reporting FDPIR, only 0.6% participates in the FDPIR program.
B. HOUSEHOLD SIZE AND INCOME
For PC2014, State agencies were asked to provide information on family or economic unit size and income for WIC participant during April 2014.21 Household size was reported for almost 100 percent of participants, similar to reporting levels in previous years (see table III.2). Income reporting remained consistent at 91.8 percent in 2014 (see table III.3) compared to 91.7 percent in 2012. Prior to 2012, income reporting had increased steadily, from 84.1 percent of all participants in 2002 to 92.3 percent in 2010. Five States (Alaska, Kentucky, Massachusetts, Tennessee, and Utah), nine ITOs, and Puerto Rico were missing income data for 30 percent or more of their WIC participants in 2014. Respondents who do not report income are generally adjunctively eligible to participate in WIC; in 2014, 92.8 percent of WIC participants who did not report income did report participation in one or more means-tested programs that convey adjunctive eligibility (SNAP, TANF and Medicaid).
21 The term “family or economic unit” refers to the group of people whose incomes are evaluated for WIC eligibility purposes and is used in the Guidance provided to State agencies (see tables I.2 and I.3). The term is used interchangeably with “household” in this chapter.
WIC Participant and Program Characteristics: 2014 Final Report
Page 35
For some participants, State agencies reported “actual” income amounts—that is, the dollar amounts reported by WIC applicants. For many participants who were adjunctively income eligible, State agencies reported income ranges rather than dollar amounts. For analytic purposes, the midpoints of the ranges were assigned as household income.22 Both types of data have been combined to compute average annualized income and calculate poverty status.
Some State agencies reported income values of zero for some participants. However, State agencies appear to have used income values of zero in an inconsistent manner across State information technology systems. Some State agencies reported using zero values to indicate actual incomes of zero dollars, while others reported using zero values as placeholders in cases of missing or unknown income values or in cases of adjunctive eligibility (for example, if a participant was adjunctively eligible, the State agency did not collect an income value from the participant). Consistent with previous PC data collections, income data for participants who reported both zero income and participation in another benefit program was deleted during the data cleaning process. Other State agencies have very low or no zero income reporting and may have restrictions on clinic workers’ abilities to enter zero values in the income field. Although available income data from all State agencies are included in this analysis, zero incomes have been tabulated separately given the uncertainty in interpreting them.
Table III.2 shows mean family or economic unit size for WIC participants has remained at about four persons since 2010. Similar to data from 2010 and 2012, 1.2 percent of infants, 1.4 percent of children, and 1.7 percent of women were classified as residing in one-person households for WIC income eligibility determination in 2014. These categories include infants and children placed in foster care and women who miscarry or whose infants are placed in foster care.
Tables III.3, III.4, and III.5 present mean and median incomes by participant category, race, and ethnicity, respectively. Data to calculate mean and median income were not reported for 8.2 percent of WIC participants and were reported as zero for an additional 0.9 percent (see table III.3).
Table III.3 shows average family or economic unit income across all participant categories was $17,372 in April 2014, which constitutes an increase of $530 (3.1 percent) since 2012. This small increase is consistent with broader economic data showing an inflation rate of 3 percent between April 2012 and April 2014 (DOL, 2014). Breastfeeding women reported the highest mean annualized income ($18,518) while postpartum women reported the lowest ($15,166).
Median income in 2014 was $15,550 for the WIC population overall. Consistent with average income, median income increased 3.7 percent from 2012. Breastfeeding women reported the highest median income ($16,800) and postpartum women reported the lowest ($12,996).
Examining income differences by race categories showed that Asian participants reported the highest average incomes while Blacks or African Americans reported the lowest incomes (see table III.4), continuing trends from previous years. Since 2012, average annualized income has increased among all race categories. In addition, higher average incomes were reported for
22 Income ranges were reported in $100-per-month increments up to a top category of $6,200 per month and above (to a top code of $6,417).

WIC Participant and Program Characteristics: 2014 Final Report
Page 36
Hispanic/Latino than for non-Hispanic/Latino WIC participants in 2014 (see table III.5), consistent with previous years.

WIC Participant and Program Characteristics: 2014 Final Report
Page 37
Table III.2. Distribution of the Size of Families or Economic Units of WIC Participants by Participant Category
Pregnant Women Breastfeeding Women Postpartum Women Total Women
Size of Family or Economic Unit 2010 2012 2014 2010 2012 2014 2010 2012 2014 2010 2012 2014
1 persona 2.6 2.9 3.7 0.0 0.0 0.0 0.5 0.6 0.6 1.3 1.4 1.7 2 persons 18.6 18.9 18.7 10.3 10.5 10.6 15.4 15.2 14.5 15.3 15.4 15.0 3 persons 27.7 27.2 26.8 27.4 27.5 27.7 29.4 29.0 29.1 28.1 27.8 27.7 4 persons 23.9 23.8 23.3 26.9 26.8 26.5 25.2 25.3 25.8 25.1 25.1 25.0 5 persons 14.4 14.4 14.4 18.3 18.3 18.2 15.2 15.3 16.0 15.7 15.8 16.0 6+ persons 12.3 12.3 12.5 16.4 16.4 16.4 12.6 12.6 13.4 13.5 13.6 14.0 Not reported 0.2 0.2 0.2 0.4 0.3 0.4 1.4 1.6 0.4 0.6 0.6 0.3
Total 100.0 100.0 100.0 100.0 100.0 100.0 100.0 100.0 100.0 100.0 100.0 100.0
U.S. WIC 1,015,173 983,192 896,551 659,933 665,526 687,351 681,260 651,347 615,559 2,356,367 2,300,065 2,199,461
Mean 3.8 3.7 3.7 4.2 4.2 4.2 3.9 3.9 3.9 3.9 3.9 3.9
Infants Children Total WIC Size of Family or Economic Unit 2010 2012 2014 2010 2012 2014 2010 2012 2014
1 persona 1.1 1.0 1.2 1.3 1.1 1.4 1.2 1.2 1.4 2 persons 13.5 13.1 12.6 9.4 9.6 9.5 11.8 11.8 11.5 3 persons 28.4 28.3 28.1 21.8 21.9 22.0 24.9 24.8 24.7 4 persons 25.8 26.1 26.0 29.0 28.8 28.7 27.3 27.3 27.2 5 persons 16.3 16.6 16.8 20.0 20.0 20.2 18.1 18.2 18.4 6+ persons 14.0 14.2 14.6 16.8 17.1 17.8 15.4 15.6 16.2 Not reported 0.5 0.4 0.3 1.3 1.2 0.1 0.9 0.9 0.2
Total 100.0 100.0 100.0 100.0 100.0 100.0 100.0 100.0 100.0
U.S. WIC 2,366,706 2,240,045 2,141,988 5,298,063 5,194,358 4,961,804 10,021,136 9,734,468 9,303,253
Mean 4.0 4.0 4.0 4.2 4.2 4.2 4.1 4.1 4.1
Notes
Percents may not add to 100.0% and subtotals may not add to totals due to rounding and to the use of weights in the case of several State agencies that either under- or overreported the number of participants.
Calculations in this table are based on all families or economic units reporting size. Units reporting zero members are included in the size-not-reported category. a Mothers who miscarry, mothers of infants assigned to foster care, and infants and children assigned to foster care may be reported as one-person economic units.

WIC Participant and Program Characteristics: 2014 Final Report
Page 38
Table III.3. Mean and Median Annualized Family or Economic Unit Income of WIC Participants by Participant Category
Pregnant Women
Breastfeeding Women
Postpartum Women
Total Women
Infants
Children Total WIC
Average (Mean) Income $16,823 $18,518 $15,166 $16,904 $16,452 $17,962 $17,372
Median Income $15,000 $16,800 $12,996 $15,000 $14,400 $15,600 $15,550
Percent With Income Reported 91.5 91.8 89.0 90.9 88.8 91.8 90.9 Percent With Income Reported as Zeroa 0.9 0.9 0.8 0.8 1.7 0.6 0.9 Percent With Income Not Reportedb 7.7 7.4 10.2 8.3 9.6 7.6 8.2
U.S. WIC 896,551 687,351 615,559 2,199,461 2,141,988 4,961,804 9,303,253 Notes
Percents may not add to 100.0% and subtotals may not add to totals due to rounding and to the use of weights in the case of several State agencies that either under- or overreported the number of participants.
State and local agencies may collect data on weekly, monthly, or annual incomes. For reporting and analysis, annualized incomes have been computed.
Income calculations include only those participants for whom State agencies reported data on income, income period, and size of economic unit.
In 2014, a State agency could report actual income or an income range. Both types of data are included in the calculations of mean and median incomes. a Zero incomes are reported separately and excluded from these mean and median calculations. In some reporting agencies, zero may be used to indicate missing information or adjunctive eligibility. PC2014 cannot distinguish between households with missing income information and households reporting zero income. b “Not reported” indicates the percentage of participants by participant category for whom data on income, income period, or size of economic unit were not reported.

WIC Participant and Program Characteristics: 2014 Final Report
Page 39
Table III.4. Average Annualized Family or Economic Unit Income of WIC Participants by Participant Category and Race
Race Pregnant Women
Breastfeeding Women
Postpartum Women Total Women
Infants Children Total WIC
American Indian or Alaska Native Only
Average (mean) income $17,182 $18,158 $15,625 $17,161 $16,396 $17,954 $17,491 Median income $15,600 $16,728 $14,400 $15,600 $15,080 $16,332 $15,600 Percent with income reported 90.9 94.3 89.4 91.7 89.7 91.6 91.3 Percent with income reported as zeroa 1.6 1.1 1.4 1.4 2.1 1.7 1.7 Percent with income not reportedb 7.5 4.6 9.2 6.9 8.2 6.7 7.0 Number of WIC participants 98,857 76,204 53,695 228,756 193,678 610,215 1,032,650
Asian Only
Average (mean) income $20,291 $20,581 $20,003 $20,335 $20,112 $21,653 $20,985 Median income $18,204 $18,924 $18,192 $18,460 $18,200 $19,656 $19,200 Percent with income reported 94.2 93.8 93.3 93.8 92.7 94.3 93.9 Percent with income reported as zeroa 0.8 1.0 0.7 0.8 1.3 0.6 0.8 Percent with income not reportedb 5.0 5.2 6.1 5.3 6.0 5.1 5.4 Number of WIC participants 30,448 30,192 18,394 79,034 67,330 162,895 309,259
Black or African American Only
Average (mean) income $13,209 $14,980 $11,262 $13,035 $12,445 $13,903 $13,337 Median income $10,800 $12,480 $8,520 $10,400 $9,568 $11,280 $10,404 Percent with income reported 90.4 87.9 87.7 88.8 86.8 90.7 89.3 Percent with income reported as zeroa 0.6 0.7 0.6 0.6 1.8 0.4 0.8 Percent with income not reportedb 9.0 11.4 11.8 10.6 11.4 8.9 9.9 Number of WIC participants 176,086 122,584 152,655 451,325 480,234 960,594 1,892,154
Native Hawaiian or Other Pacific Islander Only
Average (mean) income $17,979 $19,913 $16,906 $18,381 $17,792 $19,862 $19,031 Median income $15,600 $17,712 $14,820 $16,056 $15,600 $16,956 $16,484 Percent with income reported 93.6 94.6 92.7 93.7 93.0 94.0 93.7 Percent with income reported as zeroa 1.0 1.2 1.2 1.1 1.6 0.7 1.0 Percent with income not reportedb 5.5 4.2 6.1 5.2 5.3 5.3 5.3 Number of WIC participants 7,302 6,836 5,242 19,381 17,651 41,197 78,228
White Only
Average (mean) income $17,685 $19,380 $16,434 $17,896 $17,803 $19,082 $18,503 Median income $15,600 $18,000 $14,400 $15,696 $15,600 $16,800 $16,548 Percent with income reported 91.7 92.2 89.2 91.2 89.1 91.8 91.0 Percent with income reported as zeroa 0.8 0.8 0.8 0.8 1.5 0.5 0.8 Percent with income not reportedb 7.5 7.0 10.0 8.0 9.5 7.8 8.2 Number of WIC participants 555,968 428,716 366,710 1,351,395 1,247,561 2,866,232 5,465,187

WIC Participant and Program Characteristics: 2014 Final Report
Page 40
Table III.4. (continued) Average Annualized Family or Economic Unit Income of WIC Participants by Participant Category and Race
Race Pregnant Women
Breastfeeding Women
Postpartum Women Total Women
Infants Children Total WIC
Two or More Races
Average (mean) income $16,709 $18,495 $14,826 $16,801 $15,877 $17,825 $17,204 Median income $14,400 $16,488 $12,000 $14,400 $13,128 $15,348 $14,400 Percent with income reported 93.1 93.9 91.9 93.0 91.1 94.3 93.3 Percent with income reported as zeroa 1.2 1.1 0.9 1.1 2.0 0.6 1.1 Percent with income not reportedb 5.8 5.0 7.2 5.9 6.9 5.0 5.6 Number of WIC participants 26,405 21,733 17,809 65,947 129,955 310,368 506,271
Race Not Reported
Average (mean) income $15,718 $17,897 $14,336 $16,079 $14,843 $17,173 $16,439 Median income $13,440 $16,640 $11,424 $14,148 $11,424 $16,120 $15,106 Percent with income reported 69.8 64.3 48.7 62.0 56.4 77.1 68.4 Percent with income reported as zeroa 1.3 1.5 1.3 1.4 1.8 1.2 1.4 Percent with income not reportedb 29.0 34.3 50.0 36.7 41.8 21.6 30.2 Number of WIC participants 1,485 1,084 1,054 3,623 5,578 10,303 19,504
Notes
Percents may not add to 100.0 and subtotals may not add to totals due to rounding and to the use of weights in the case of several State agencies that either under- or overreported the number of participants.
State and local agencies may collect data on weekly, monthly, or annual incomes. For reporting and analysis, annualized incomes have been computed. In addition, note that income calculations include only those participants for whom State agencies reported data on income, income period, and size of economic unit.
In 2014, a State agency could report actual income or an income range. Both types of data are included in the calculations of mean and median incomes. a Zero incomes are reported separately and excluded from these mean and median calculations. In some reporting agencies, zero may be used to indicate missing information or adjunctive eligibility. PC2014 cannot distinguish between households with missing income information and households reporting zero income. b “Not reported” indicates the percentage of participants by participant category for whom data on income, income period, or size of economic unit were not reported.

WIC Participant and Program Characteristics: 2014 Final Report
Page 41
Table III.5. Average Annualized Family or Economic Unit Income of WIC Participants by Participant Category and Ethnicity
Ethnicity Pregnant Women
Breastfeeding Women
Postpartum Women
Total Women Infants Children Total WIC
Hispanic/Latino
Average (mean) income $17,669 $18,308 $16,347 $17,610 $17,127 $18,080 $17,781
Median income $16,116 $16,800 $14,952 $15,984 $15,600 $16,440 $16,044 Percent with income reported 93.5 93.9 91.7 93.2 91.4 93.3 92.9 Percent with income reported as zeroa 0.9 0.9 1.0 0.9 1.8 0.8 1.0 Percent with income not reportedb 5.5 5.2 7.4 5.8 6.8 6.0 6.1 Number of WIC participants 344,455 305,881 189,429 839,766 813,038 2,218,346 3,871,150
Not Hispanic/Latino
Average (mean) income $16,275 $18,695 $14,618 $16,448 $16,018 $17,862 $17,068
Median income $13,920 $16,640 $11,976 $14,092 $13,188 $15,000 $14,400 Percent with income reported 90.3 90.1 87.9 89.5 87.2 90.6 89.5 Percent with income reported as zeroa 0.8 0.8 0.7 0.8 1.6 0.5 0.8 Percent with income not reportedb 8.9 9.1 11.4 9.8 11.2 8.9 9.7 Number of WIC participants 551,573 381,052 425,707 1,358,332 1,327,150 2,737,757 5,423,239
Ethnicity Not Reported
Average (mean) income $17,921 $17,759 $16,138 $17,487 $16,908 $18,527 $18,317
Median income $16,474 $17,680 $14,612 $16,432 $15,000 $17,680 $17,420 Percent with income reported 52.4 51.2 31.0 45.4 16.4 77.8 60.3 Percent with income reported as zeroa 1.5 1.7 2.1 1.8 0.8 0.6 0.8 Percent with income not reportedb 46.1 47.1 66.9 52.9 82.8 21.6 38.8 Number of WIC participants 523 418 423 1,364 1,799 5,701 8,865
Notes
Percents may not add to 100.0% and subtotals may not add to totals due to rounding and to the use of weights in the case of several State agencies that either under- or overreported the number of participants.
State and local agencies may collect data on weekly, monthly, or annual incomes. For reporting and analysis, annualized incomes have been computed. In addition, note that income calculations include only those participants for whom State agencies reported data on income, income period, and size of economic unit.
In 2014, a State agency could report actual income or an income range. Both types of data are included in the calculations of mean and median incomes. a Zero incomes are reported separately and excluded from these mean and median calculations. In some reporting agencies, zero may be used to indicate missing information or adjunctive eligibility. PC2014 cannot distinguish between households with missing income information and households reporting zero income. b “Not reported” indicates the percentage of participants by participant category for whom data on income, income period, or size of economic unit were not reported.

WIC Participant and Program Characteristics: 2014 Final Report
Page 42
C. POVERTY STATUS
The majority of WIC participants come from households with incomes at or below the Federal poverty guideline, defined as $23,850 for a family of four in the 48 contiguous States (HHS, 2014).23 Household income, household size, and State for each participant were compared to HHS poverty guidelines to calculate the participant’s income as a percentage of the Federal poverty guideline. Tables III.6, III.7, III.8, and III.9 present poverty status information and examine changes over time and differences by participant category, race, and ethnicity.24 Despite the general economic recovery and modest increases in the income of WIC participants, the proportion of WIC participants in poverty continued to grow. Two-thirds (67.4 percent) of all WIC participants reported incomes at or below the Federal poverty guideline, and one-third (34.4 percent) reported incomes at or below 50 percent of the Federal poverty guideline (see table III.6, U.S. WIC column).25 This represents increases of 3.6 and 2.7 percentage points in the proportion of participants with incomes at or below the Federal poverty guideline and incomes at or below 50 percent of the Federal poverty guideline, respectively, between 2010 and 2014. This trend of increasing poverty extends back to 2002, when 53.9 percent of participants had incomes at or below the Federal poverty guideline and 26.5 percent had incomes at or below 50 percent of the Federal poverty guideline. Prior to 2002, the percentage of WIC participants with income at or below these thresholds had decreased steadily.
A small percentage of participants reported incomes of more than 185 percent of the Federal poverty guideline (1.3 percent in 2014). The presence of WIC participants with reported incomes of more than 185 percent of the guideline could be attributed to certification error (Cole, Hoaglin, & Kirlin, 2001) or adjunctive eligibility through the Medicaid program, which results in households with incomes above this level participating in a number of States. As noted above, WIC participants were 3.2 percentage points more likely to be enrolled in Medicaid in 2014 compared to in 2010. However, caution should be used in interpreting these data given that there is still a rather substantial percentage of unreported income (8.2 percent in 2014).
The general trends discussed here remain when unreported data are excluded from the denominators (see table III.6, U.S. WIC Reporting Income columns). Overall, the percentage of WIC participants with incomes at or below the Federal poverty guideline—as a proportion of only those WIC participants reporting non-zero income data—has increased since 2010 from 69.6 percent to 74.1 percent.
Comparing across participant categories, levels of poverty are similar also (see table III.7). Breastfeeding women are the least likely to have incomes at or below the Federal poverty guideline (65.1 percent), followed closely by pregnant women (65.2 percent). Postpartum women are the most likely to have incomes at or below the Federal poverty guideline (69.7 percent).
23 The poverty guideline for a family of four in the contiguous United States and the District of Columbia is $23,850. It is $29,820 for a family of four in Alaska and $27,430 in Hawaii. No official guidelines are defined for U.S. territories; WIC offices in those areas decide which guideline to use. 24 Table B.III.7 in appendix B presents data on poverty guideline by participant category for 2010, 2012, and 2014. 25 Households not reporting income are included in the denominator of the U.S. WIC columns. U.S. WIC Reporting Income columns exclude households not reporting income and households reporting zero income.

WIC Participant and Program Characteristics: 2014 Final Report
Page 43
Table B.III.7 in appendix B shows a 0.8-percentage-point increase between 2012 and 2014 in the number of WIC participants with income at or below the Federal poverty guideline, which is a slower rate of growth than the 2.8-percentage-point increase between 2010 and 2012 and a 3-percentage-point increase between 2008 and 2010. The increase in the proportion of participants at or below the Federal poverty guideline affected participants in all certification categories except for pregnant women, which saw no change. In 2012, the smallest increase was among postpartum women (1.7 percentage points), with all other groups seeing increases of 2 percentage points or more.
Consistent with the findings on average income data reported in the previous section, Asian Only participants were least likely to have incomes at or below the Federal poverty guideline (61.2 percent). In contrast, Black or African American Only participants (73.5 percent) were most likely to have incomes at or below the poverty guideline (see table III.8). This represents a 2.1 percentage-point increase for Black or African American Only participants from 2012.
In contrast to the overall income findings, a larger percentage of the Hispanic/Latino group (70.7 percent) than of the non-Hispanic/Latino group (65.0 percent) had incomes at or below the Federal poverty guideline (see table III.9). These rankings are consistent with findings from previous reports going back to 2008. All racial and ethnic groups continued to show increases in the percentage of participants with incomes at or below the poverty guideline in 2014, furthering a trend observed since 2008. American Indian or Alaska Native Only participants were the lone exception to this trend; the percentage of these participants below the poverty guideline decreased between 2012 and 2014.
Table III.10 presents the distribution of income as a percentage of the Federal poverty guideline for WIC participants who reported no participation in the TANF, SNAP, and Medicaid programs. This group, which accounted for 21.1 percent of the WIC population (see table III.1), is less needy than the portion of the WIC population receiving other means-tested benefits. As might be expected, only 53.8 percent of WIC participants reporting no participation in other programs had incomes at or below the Federal poverty guideline, as compared with approximately 70.9 percent of the WIC population reporting participation in additional public assistance programs.26
Compared to the broader U.S. population, WIC participants contain a higher proportion of low-income households. Table III.11 presents data on income as a percentage of the Federal poverty threshold for the general U.S. population, for American families, and for families with children younger than age 6. National data are drawn from the U.S. Census Bureau's Current Population Survey (CPS).27 In general, 14.5 percent of the U.S. population had incomes below the Federal poverty threshold. This increased to 20.4 percent among families with children younger than 6 years old. By comparison, 74.2 percent of all WIC participants reporting income had incomes below the Federal poverty guideline.
26 Poverty status of WIC population reporting participation in public assistance programs is calculated from data in tables III.7 and III.10. This calculation includes individuals for whom data on participation in one or more programs are not reported in the group of WIC participants reporting participation in other programs. 27 The poverty guideline cutoffs in table III.11 are slightly different from the cutoffs used in tables III.5 through III.10. The table III.11 cutoffs match data available on the CPS Web site (U.S. Department of Commerce and DOL, 2014).

WIC Participant and Program Characteristics: 2014 Final Report
Page 44
Table III.6. Poverty Status of WIC Participants: 2010, 2012, 2014
U.S. WICa U.S. WIC Reportinga Income Percent of Federal Poverty Guideline 2010 2012 2014
2010 2012 2014
0–50 31.7 33.4 34.4 34.6 36.7 37.8 51–100 32.1 33.2 33.0 35.0 36.5 36.3 101–130 12.6 11.4 11.2 13.7 12.6 12.3 131–150 5.6 5.3 5.0 6.1 5.8 5.6 151–185 6.8 6.2 5.9 7.4 6.9 6.5 186–200b 1.7 0.4 0.4 1.9 0.5 0.5 More than 200b 1.2 0.9 0.9 1.3 1.0 1.1
Income Reported as Zeroc 0.6 0.8 0.9 N/A N/A N/A Not Reportedd 7.7 8.3 8.2 N/A N/A N/A Total Population 10,021,136 9,734,468 9,303,253 9,191,573 8,843,751 8,454,774
Notes
Percents may not add to 100.0% and subtotals may not add to totals due to rounding and to the use of weights in the case of several State agencies that either under- or overreported the number of participants.
N/A indicates not applicable. a WIC participant poverty guideline calculations are based on income, income period, and household size as reported by State agencies. Figures in this table represent a count of individual WIC participants. b WIC participant household incomes of more than 185% of the Federal poverty guideline could be due to certification error or adjunct eligibility through the Medicaid program, which allows households with income above this level to participate in WIC in a number of States. c Zero incomes are reported separately and excluded from these income calculations. In some reporting agencies, zero may be used to indicate missing information or adjunctive eligibility. Therefore, PC reports cannot distinguish between households with missing income information and households reporting zero income. d “Not reported” indicates the percentage of participants for whom data on income, income period, or size of economic unit were not reported.

WIC Participant and Program Characteristics: 2014 Final Report
Page 45
Table III.7. Distribution of Income as a Percent of Federal Poverty Guideline of WIC Participants by Participant Category
Pregnant Women
Breastfeeding Women
Postpartum Women
Total Women
Infants
Children
Total Participants
Percent of Federal Poverty Guideline % Cum. %
% Cum. %
% Cum. %
% Cum. %
% Cum. %
% Cum. %
% Cum. % 0–50 33.1 33.1 30.4 30.4 40.5 40.5 34.3 34.3 36.4 36.4 33.5 33.5 34.4 34.4 51–100 32.1 65.2 34.7 65.1 29.2 69.7 32.1 66.4 30.7 67.0 34.4 67.9 33.0 67.3 101–130 12.0 77.2 12.6 77.7 9.5 79.2 11.5 77.9 10.4 77.5 11.4 79.3 11.2 78.5 131–150 5.6 82.9 5.7 83.5 4.1 83.3 5.2 83.2 4.6 82.1 5.1 84.4 5.0 83.6 151–185 6.8 89.7 6.9 90.4 4.6 87.9 6.2 89.4 5.4 87.5 5.9 90.3 5.9 89.5 186–200a 0.6 90.3 0.4 90.8 0.3 88.2 0.5 89.8 0.4 87.9 0.4 90.8 0.4 89.9 201–225a 0.6 90.9 0.4 91.2 0.3 88.5 0.5 90.3 0.4 88.3 0.4 91.2 0.4 90.3 226–250a 0.3 91.1 0.2 91.4 0.2 88.7 0.2 90.5 0.2 88.4 0.2 91.4 0.2 90.5 More than 250a 0.3 91.5 0.3 91.8 0.3 89.0 0.3 90.9 0.3 88.8 0.4 91.8 0.3 90.9
Income Reported as Zerob 0.9 92.3
0.9 92.6
0.8 89.8
0.8 91.7
1.7 90.4
0.6 92.4
0.9 91.8
Not Reportedc 7.7 100.0 7.4 100.0 10.2 100.0 8.3 100.0 9.6 100.0 7.6 100.0 8.2 100.0
U.S. WIC 896,551 687,351 615,559 2,199,461 2,141,988 4,961,804 9,303,253
Notes
Percents may not add to 100.0% and subtotals may not add to totals due to rounding and to the use of weights in the case of several State agencies that either under- or overreported the number of participants.
Poverty guideline calculations are based on income, income period, and household size as reported by State agencies. a WIC participant household incomes of more than 185% of poverty could be due to certification error or adjunct eligibility through the Medicaid program, which allows households with income above this level to participate in WIC in a number of States. b Zero incomes are reported separately and excluded from these income calculations. In some reporting agencies, zero may be used to indicate missing information or adjunctive eligibility. Therefore, PC2014 cannot distinguish between households with missing income information and households reporting zero income. c “Not reported” indicates the percentage of participants by participant category for whom data on income, income period, or size of economic unit were not reported.

WIC Participant and Program Characteristics: 2014 Final Report
Page 46
Table III.8. Distribution of Income as a Percent of Federal Poverty Guideline of WIC Participants by Participant Category and Race
Pregnant Women
Breastfeeding Women
Postpartum Women
Total Women
Infants
Children
Total Participants
Percent of Federal Poverty Guideline % Cum. %
% Cum. %
% Cum. %
% Cum. %
% Cum. %
% Cum. %
% Cum. %
American Indian or Alaska Native Only
0–50 30.0 30.0 28.5 28.5 36.3 36.3 31.0 31.0 33.4 33.4 30.0 30.0 30.9 30.9 51–100 36.1 66.2 42.1 70.6 34.3 70.6 37.7 68.7 36.6 70.1 38.9 68.9 38.2 69.1 101–130 12.1 78.3 12.4 82.9 10.0 80.7 11.7 80.4 10.5 80.5 11.7 80.6 11.5 80.5 131–150 5.4 83.7 4.9 87.8 3.9 84.6 4.9 85.3 4.0 84.6 4.8 85.4 4.7 85.2 151–185 6.4 90.1 5.5 93.3 4.1 88.7 5.6 90.9 4.4 89.0 5.1 90.5 5.1 90.3 186–200a 0.3 90.4 0.3 93.7 0.2 88.9 0.3 91.1 0.2 89.2 0.4 90.9 0.3 90.6 201–225a 0.3 90.7 0.3 94.0 0.2 89.1 0.3 91.4 0.2 89.4 0.3 91.2 0.3 90.9 226–250a 0.1 90.8 0.1 94.1 0.1 89.2 0.1 91.5 0.1 89.5 0.2 91.4 0.1 91.1 More than 250a 0.1 90.9 0.2 94.3 0.1 89.4 0.2 91.7 0.2 89.7 0.2 91.6 0.2 91.3
Income Reported as Zerob 1.6 92.5
1.1 95.4
1.4 90.8
1.4 93.1
2.1 91.8
1.7 93.3
1.7 93.0
Not Reportedc 7.5 100.0 4.6 100.0 9.2 100.0 6.9 100.0 8.2 100.0 6.7 100.0 7.0 100.0
U.S. WIC 98,857 76,204 53,695 228,756 193,678 610,215 1,032,650
Asian Only
0–50 21.7 21.7 21.8 21.8 24.1 24.1 22.3 22.3 24.0 24.0 21.3 21.3 22.1 22.1 51–100 37.0 58.7 37.7 59.5 38.3 62.3 37.6 59.9 37.9 61.9 40.3 61.6 39.1 61.2 101–130 16.0 74.7 16.0 75.5 15.0 77.4 15.8 75.6 14.8 76.6 15.2 76.8 15.3 76.5 131–150 7.2 81.9 6.8 82.3 6.4 83.8 6.8 82.5 6.2 82.8 6.7 83.5 6.6 83.1 151–185 10.2 92.0 9.9 92.2 7.9 91.7 9.5 92.0 8.4 91.3 8.9 92.5 9.0 92.1 186–200a 0.7 92.7 0.5 92.6 0.5 92.2 0.6 92.6 0.4 91.7 0.6 93.1 0.6 92.6 201–225a 0.7 93.4 0.5 93.1 0.4 92.6 0.6 93.1 0.4 92.1 0.6 93.7 0.5 93.2 226–250a 0.3 93.7 0.2 93.4 0.3 92.9 0.3 93.4 0.2 92.3 0.3 94.0 0.3 93.5 More than 250a 0.5 94.2 0.5 93.8 0.4 93.3 0.4 93.8 0.4 92.7 0.4 94.3 0.4 93.9
Income Reported as Zerob 0.8 95.0
1.0 94.8
0.7 93.9
0.8 94.7
1.3 94.0
0.6 94.9
0.8 94.6
Not Reportedc 5.0 100.0 5.2 100.0 6.1 100.0 5.3 100.0 6.0 100.0 5.1 100.0 5.4 100.0
U.S. WIC 30,448 30,192 18,394 79,034
67,330 162,895 309,259

WIC Participant and Program Characteristics: 2014 Final Report
Page 47
Table III.8. (continued) Distribution of Income as a Percent of Federal Poverty Guideline of WIC Participants by Participant Category and Race
Pregnant Women
Breastfeeding Women
Postpartum Women
Total Women Infants
Children
Total Participants
Percent of Federal Poverty Guideline % Cum. %
% Cum. %
% Cum. %
% Cum. %
% Cum. %
% Cum. %
% Cum. %
Black or African American Only
0–50 43.8 43.8 40.9 40.9 53.8 53.8 46.4 46.4 49.3 49.3 46.4 46.4 47.1 47.1 51–100 27.2 71.0 27.5 68.3 22.3 76.1 25.6 72.0 23.5 72.9 28.1 74.5 26.4 73.5 101–130 9.1 80.0 9.4 77.8 5.9 82.1 8.1 80.1 6.9 79.8 8.2 82.7 7.8 81.3 131–150 4.1 84.1 4.2 81.9 2.4 84.5 3.6 83.7 3.0 82.7 3.4 86.1 3.3 84.7 151–185 4.8 89.0 5.0 86.9 2.6 87.1 4.1 87.8 3.3 86.1 3.8 89.9 3.7 88.4 186–200a 0.4 89.4 0.3 87.2 0.2 87.3 0.3 88.1 0.2 86.3 0.3 90.1 0.3 88.7 201–225a 0.5 89.9 0.3 87.5 0.2 87.4 0.3 88.4 0.2 86.5 0.2 90.4 0.3 88.9 226–250a 0.2 90.1 0.2 87.6 0.1 87.5 0.2 88.6 0.1 86.6 0.1 90.5 0.1 89.0 More than 250a 0.2 90.4 0.2 87.9 0.2 87.7 0.2 88.8 0.2 86.8 0.2 90.7 0.2 89.3
Income Reported as Zerob 0.6 91.0
0.7 88.6
0.6 88.2
0.6 89.4
1.8 88.6
0.4 91.1
0.8 90.1
Not Reportedc 9.0 100.0 11.4 100.0 11.8 100.0 10.6 100.0 11.4 100.0 8.9 100.0 9.9 100.0
U.S. WIC 176,086 122,584 152,655 451,325 480,234 960,594 1,892,154
Native Hawaiian or
Other Pacific Islander Only
0–50 33.7 33.7 31.6 31.6 39.8 39.8 34.6 34.6 38.2 38.2 35.8 35.8 36.1 36.1 51–100 34.5 68.3 37.2 68.9 33.1 72.9 35.1 69.7 33.8 72.0 34.4 70.1 34.4 70.5 101–130 11.8 80.1 11.9 80.7 10.1 82.9 11.4 81.1 10.3 82.3 11.2 81.4 11.1 81.5 131–150 5.4 85.5 5.9 86.6 4.4 87.4 5.3 86.4 4.6 87.0 5.5 86.9 5.3 86.8 151–185 6.8 92.4 6.9 93.6 4.5 91.9 6.2 92.7 5.3 92.3 6.2 93.1 6.0 92.8 186–200a 0.4 92.8 0.3 93.9 0.2 92.1 0.3 93.0 0.2 92.4 0.3 93.4 0.3 93.1 201–225a 0.4 93.2 0.3 94.2 0.2 92.4 0.3 93.3 0.2 92.7 0.3 93.7 0.3 93.4 226–250a 0.2 93.3 0.1 94.3 0.1 92.5 0.1 93.5 0.1 92.8 0.1 93.8 0.1 93.5 More than 250a 0.2 93.6 0.3 94.6 0.2 92.7 0.2 93.7 0.2 93.0 0.2 94.0 0.2 93.7
Income Reported as Zerob 1.0 94.5
1.2 95.8
1.2 93.9
1.1 94.8
1.6 94.7
0.7 94.7
1.0 94.7
Not Reportedc 5.5 100.0 4.2 100.0 6.1 100.0 5.2 100.0 5.3 100.0 5.3 100.0 5.3 100.0
U.S. WIC
7,302
6,836
5,242 19,381
17,651
41,197
78,228

WIC Participant and Program Characteristics: 2014 Final Report
Page 48
Table III.8. (continued) Distribution of Income as a Percent of Federal Poverty Guideline of WIC Participants by Participant Category and Race
Pregnant Women
Breastfeeding Women
Postpartum Women
Total Women Infants
Children
Total Participants
Percent of Federal Poverty Guideline % Cum. %
% Cum. %
% Cum. %
% Cum. %
% Cum. %
% Cum. %
% Cum. %
White Only
0–50 30.9 30.9 28.3 28.3 36.3 36.3 31.5 31.5 32.2 32.2 30.5 30.5 31.1 31.1
51–100 32.6 63.5 35.3 63.6 30.8 67.1 33.0 64.5 32.3 64.5 35.2 65.7 34.0 65.1 101–130 12.7 76.2 13.4 76.9 10.6 77.7 12.3 76.9 11.6 76.0 12.2 77.9 12.1 77.2 131–150 6.1 82.3 6.2 83.2 4.8 82.4 5.8 82.6 5.3 81.3 5.6 83.5 5.6 82.8 151–185 7.3 89.7 7.4 90.6 5.3 87.8 6.8 89.4 6.2 87.5 6.6 90.1 6.6 89.4 186–200a 0.7 90.3 0.5 91.1 0.4 88.2 0.5 90.0 0.4 87.9 0.5 90.6 0.5 89.9 201–225a 0.7 91.0 0.5 91.6 0.4 88.6 0.6 90.5 0.5 88.4 0.5 91.1 0.5 90.4 226–250a 0.3 91.3 0.2 91.8 0.2 88.8 0.3 90.8 0.2 88.6 0.2 91.4 0.2 90.6 More than 250a 0.4 91.7 0.4 92.2 0.4 89.2 0.4 91.2 0.4 89.1 0.4 91.8 0.4 91.0
Income Reported as Zerob 0.8 92.5
0.8 93.0
0.8 90.0
0.8 92.0
1.5 90.5
0.5 92.2
0.8 91.8
Not Reportedc 7.5 100.0 7.0 100.0 10.0 100.0 8.0 100.0 9.5 100.0 7.8 100.0 8.2 100.0
U.S. WIC 555,968 428,716 366,710 1,351,395 1,247,561 2,866,232 5,465,187
Two or More Races
0–50 35.2 35.2 31.6 31.6 43.4 43.4 36.2 36.2 39.2 39.2 34.9 34.9 36.2 36.2 51–100 31.5 66.8 34.3 65.9 29.8 73.2 32.0 68.2 29.6 68.9 33.5 68.4 32.3 68.5 101–130 11.8 78.6 12.6 78.5 9.2 82.4 11.4 79.6 10.3 79.2 11.9 80.4 11.5 80.0 131–150 5.9 84.5 6.5 85.0 4.1 86.5 5.6 85.2 4.8 84.0 5.6 85.9 5.4 85.4 151–185 6.9 91.4 7.3 92.3 4.3 90.8 6.3 91.5 5.7 89.7 6.7 92.6 6.4 91.7 186–200a 0.5 91.8 0.5 92.8 0.4 91.2 0.5 92.0 0.4 90.1 0.5 93.1 0.5 92.2 201–225a 0.6 92.4 0.4 93.2 0.3 91.5 0.5 92.4 0.4 90.5 0.5 93.7 0.5 92.7 226–250a 0.2 92.7 0.3 93.5 0.2 91.7 0.2 92.7 0.2 90.7 0.3 93.9 0.2 92.9 More than 250a 0.4 93.1 0.4 93.9 0.2 91.9 0.3 93.0 0.4 91.1 0.4 94.3 0.4 93.3
Income Reported as Zerob 1.2 94.2
1.1 95.0
0.9 92.8
1.1 94.1
2.0 93.1
0.6 95.0
1.1 94.4
Not Reportedc 5.8 100.0 5.0 100.0 7.2 100.0 5.9 100.0 6.9 100.0 5.0 100.0 5.6 100.0
U.S. WIC
26,405 21,733 17,809 65,947 129,955 310,368 506,271

WIC Participant and Program Characteristics: 2014 Final Report
Page 49
Table III.8. (continued) Distribution of Income as a Percent of Federal Poverty Guideline of WIC Participants by Participant Category and Race
Pregnant Women
Breastfeeding Women
Postpartum Women
Total Women Infants
Children
Total Participants
Percent of Federal Poverty Guideline % Cum. %
% Cum. %
% Cum. %
% Cum. %
% Cum. %
% Cum. %
% Cum. %
Race Not Reported
0–50 25.5 25.5 22.2 22.2 21.1 21.1 23.2 23.2 25.3 25.3 26.9 26.9 25.8 25.8
51–100 27.7 53.3 23.5 45.7 19.4 40.6 24.1 47.3 20.1 45.4 34.4 61.3 28.4 54.1 101–130 8.5 61.7 9.6 55.3 4.0 44.6 7.5 54.8 5.3 50.7 8.8 70.0 7.6 61.7 131–150 3.1 64.8 3.9 59.2 1.6 46.2 2.9 57.7 2.5 53.3 3.0 73.0 2.8 64.5 151–185 4.0 68.9 4.2 63.3 2.4 48.6 3.6 61.3 2.5 55.8 3.3 76.3 3.1 67.7 186–200a 0.2 69.1 0.5 63.8 0.0 48.6 0.2 61.5 0.2 56.0 0.3 76.6 0.3 67.9 201–225a 0.2 69.3 0.3 64.1 0.1 48.7 0.2 61.7 0.2 56.2 0.2 76.9 0.2 68.1 226–250a 0.3 69.6 0.1 64.2 0.0 48.7 0.1 61.9 0.1 56.2 0.1 77.0 0.1 68.2 More than 250a 0.2 69.8 0.1 64.3 0.0 48.7 0.1 62.0 0.2 56.4 0.2 77.1 0.2 68.4
Income Reported as Zerob 1.3 71.0
1.5 65.7
1.3 50.0
1.4 63.3
1.8 58.2
1.2 78.4
1.4 69.8
Not Reportedc 29.0 100.0 34.3 100.0 50.0 100.0 36.7 100.0 41.8 100.0 21.6 100.0 30.2 100.0
U.S. WIC 1,485 1,084 1,054 3,623 5,578 10,303 19,504
Notes
Percents may not add to 100.0% and subtotals may not add to totals due to rounding and to the use of weights in the case of several State agencies that either under- or overreported the number of participants.
Poverty guideline calculations are based on income, income period, and household size as reported by State agencies. a WIC participant household incomes of more than 185% of the Federal poverty guideline could be due to certification error or adjunct eligibility through the Medicaid program, which allows households with income above this level to participate in WIC in a number of States. b Zero incomes are reported separately and excluded from these income calculations. In some reporting agencies, zero may be used to indicate missing information or adjunctive eligibility. Therefore, PC2014 cannot distinguish between households with missing income information and households reporting zero income. c “Not reported” indicates the percentage of participants by participant category for whom data on income, income period, or size of economic unit were not reported.
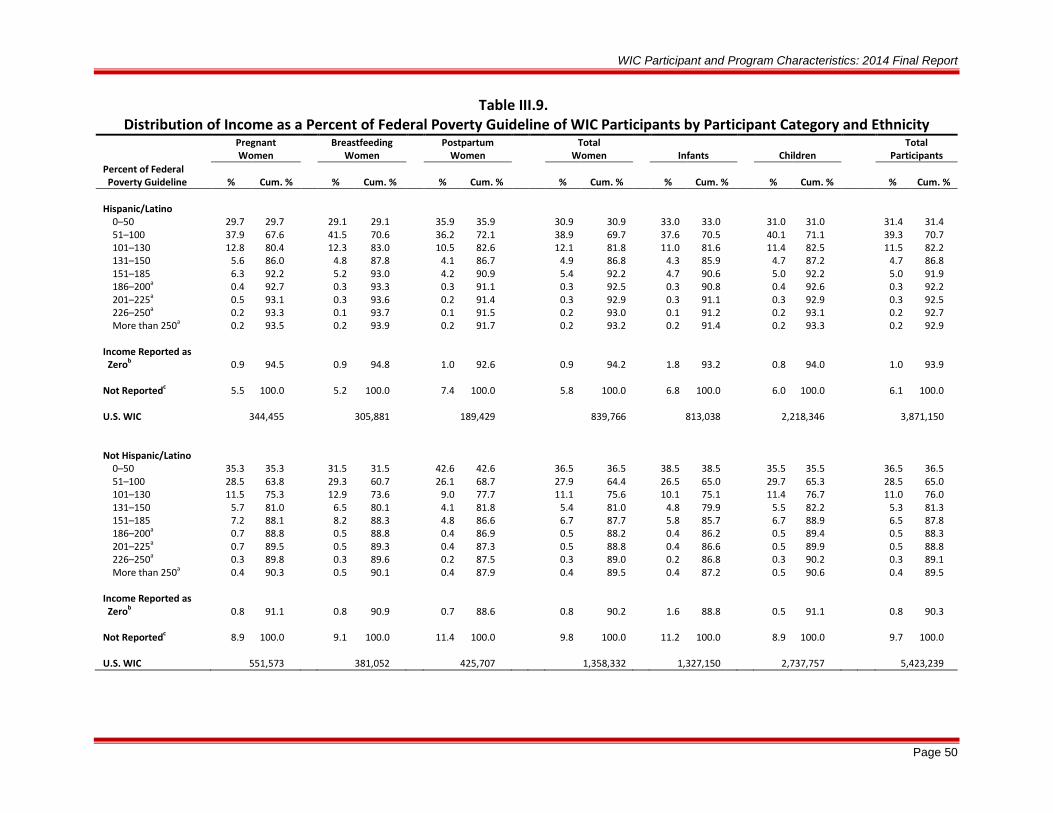
WIC Participant and Program Characteristics: 2014 Final Report
Page 50
Table III.9. Distribution of Income as a Percent of Federal Poverty Guideline of WIC Participants by Participant Category and Ethnicity
Pregnant Women
Breastfeeding Women
Postpartum Women
Total Women Infants Children
Total Participants
Percent of Federal Poverty Guideline % Cum. %
% Cum. %
% Cum. %
% Cum. %
% Cum. %
% Cum. %
% Cum. %
Hispanic/Latino
0–50 29.7 29.7 29.1 29.1 35.9 35.9 30.9 30.9 33.0 33.0 31.0 31.0 31.4 31.4
51–100 37.9 67.6 41.5 70.6 36.2 72.1 38.9 69.7 37.6 70.5 40.1 71.1 39.3 70.7 101–130 12.8 80.4 12.3 83.0 10.5 82.6 12.1 81.8 11.0 81.6 11.4 82.5 11.5 82.2 131–150 5.6 86.0 4.8 87.8 4.1 86.7 4.9 86.8 4.3 85.9 4.7 87.2 4.7 86.8 151–185 6.3 92.2 5.2 93.0 4.2 90.9 5.4 92.2 4.7 90.6 5.0 92.2 5.0 91.9 186–200a 0.4 92.7 0.3 93.3 0.3 91.1 0.3 92.5 0.3 90.8 0.4 92.6 0.3 92.2 201–225a 0.5 93.1 0.3 93.6 0.2 91.4 0.3 92.9 0.3 91.1 0.3 92.9 0.3 92.5 226–250a 0.2 93.3 0.1 93.7 0.1 91.5 0.2 93.0 0.1 91.2 0.2 93.1 0.2 92.7 More than 250a 0.2 93.5 0.2 93.9 0.2 91.7 0.2 93.2 0.2 91.4 0.2 93.3 0.2 92.9
Income Reported as Zerob 0.9 94.5
0.9 94.8
1.0 92.6
0.9 94.2
1.8 93.2
0.8 94.0
1.0 93.9
Not Reportedc 5.5 100.0 5.2 100.0 7.4 100.0 5.8 100.0 6.8 100.0 6.0 100.0 6.1 100.0
U.S. WIC 344,455 305,881 189,429 839,766 813,038 2,218,346 3,871,150
Not Hispanic/Latino
0–50 35.3 35.3 31.5 31.5 42.6 42.6 36.5 36.5 38.5 38.5 35.5 35.5 36.5 36.5 51–100 28.5 63.8 29.3 60.7 26.1 68.7 27.9 64.4 26.5 65.0 29.7 65.3 28.5 65.0 101–130 11.5 75.3 12.9 73.6 9.0 77.7 11.1 75.6 10.1 75.1 11.4 76.7 11.0 76.0 131–150 5.7 81.0 6.5 80.1 4.1 81.8 5.4 81.0 4.8 79.9 5.5 82.2 5.3 81.3 151–185 7.2 88.1 8.2 88.3 4.8 86.6 6.7 87.7 5.8 85.7 6.7 88.9 6.5 87.8 186–200a 0.7 88.8 0.5 88.8 0.4 86.9 0.5 88.2 0.4 86.2 0.5 89.4 0.5 88.3 201–225a 0.7 89.5 0.5 89.3 0.4 87.3 0.5 88.8 0.4 86.6 0.5 89.9 0.5 88.8 226–250a 0.3 89.8 0.3 89.6 0.2 87.5 0.3 89.0 0.2 86.8 0.3 90.2 0.3 89.1 More than 250a 0.4 90.3 0.5 90.1 0.4 87.9 0.4 89.5 0.4 87.2 0.5 90.6 0.4 89.5
Income Reported as Zerob 0.8 91.1
0.8 90.9
0.7 88.6
0.8 90.2
1.6 88.8
0.5 91.1
0.8 90.3
Not Reportedc 8.9 100.0 9.1 100.0 11.4 100.0 9.8 100.0 11.2 100.0 8.9 100.0 9.7 100.0
U.S. WIC 551,573 381,052 425,707 1,358,332 1,327,150 2,737,757 5,423,239
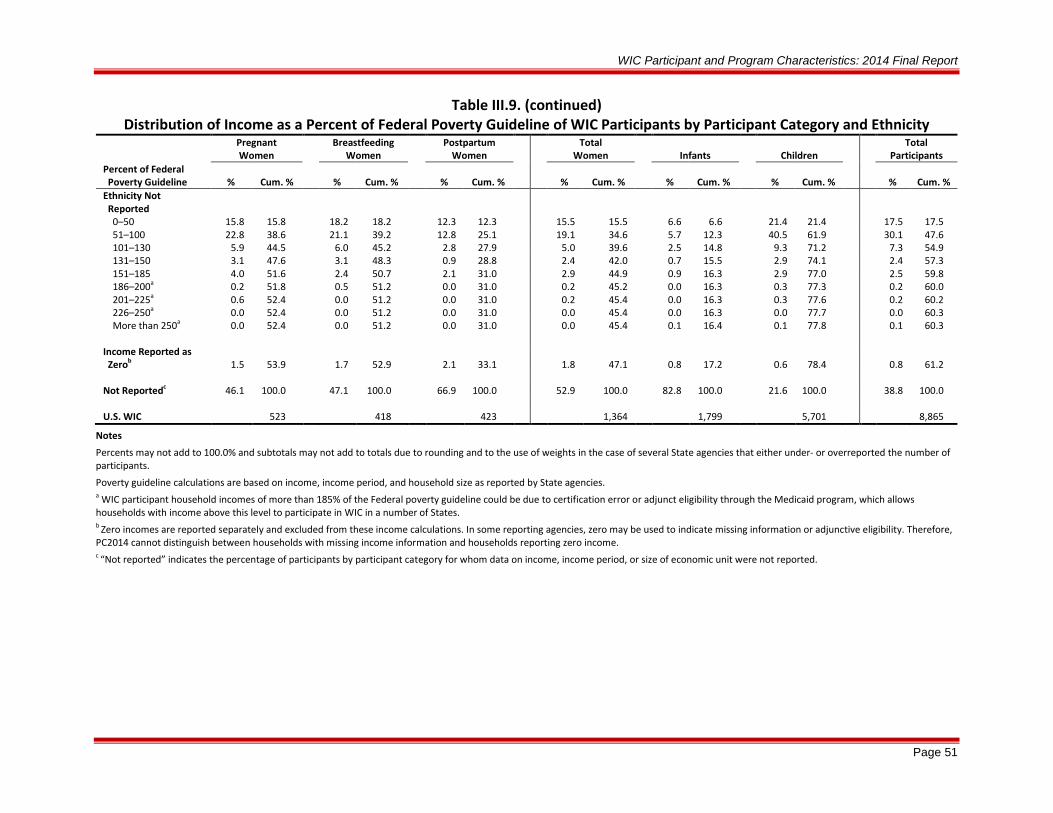
WIC Participant and Program Characteristics: 2014 Final Report
Page 51
Table III.9. (continued) Distribution of Income as a Percent of Federal Poverty Guideline of WIC Participants by Participant Category and Ethnicity
Pregnant Women
Breastfeeding Women
Postpartum Women
Total Women
Infants
Children
Total Participants
Percent of Federal Poverty Guideline % Cum. %
% Cum. %
% Cum. %
% Cum. %
% Cum. %
% Cum. %
% Cum. %
Ethnicity Not Reported
0–50 15.8 15.8 18.2 18.2 12.3 12.3 15.5 15.5 6.6 6.6 21.4 21.4 17.5 17.5 51–100 22.8 38.6 21.1 39.2 12.8 25.1 19.1 34.6 5.7 12.3 40.5 61.9 30.1 47.6 101–130 5.9 44.5 6.0 45.2 2.8 27.9 5.0 39.6 2.5 14.8 9.3 71.2 7.3 54.9 131–150 3.1 47.6 3.1 48.3 0.9 28.8 2.4 42.0 0.7 15.5 2.9 74.1 2.4 57.3 151–185 4.0 51.6 2.4 50.7 2.1 31.0 2.9 44.9 0.9 16.3 2.9 77.0 2.5 59.8 186–200a 0.2 51.8 0.5 51.2 0.0 31.0 0.2 45.2 0.0 16.3 0.3 77.3 0.2 60.0 201–225a 0.6 52.4 0.0 51.2 0.0 31.0 0.2 45.4 0.0 16.3 0.3 77.6 0.2 60.2 226–250a 0.0 52.4 0.0 51.2 0.0 31.0 0.0 45.4 0.0 16.3 0.0 77.7 0.0 60.3 More than 250a 0.0 52.4 0.0 51.2 0.0 31.0 0.0 45.4 0.1 16.4 0.1 77.8 0.1 60.3
Income Reported as Zerob 1.5 53.9
1.7 52.9
2.1 33.1
1.8 47.1
0.8 17.2
0.6 78.4
0.8 61.2
Not Reportedc 46.1 100.0 47.1 100.0 66.9 100.0 52.9 100.0 82.8 100.0 21.6 100.0 38.8 100.0
U.S. WIC 523 418 423 1,364 1,799 5,701 8,865
Notes
Percents may not add to 100.0% and subtotals may not add to totals due to rounding and to the use of weights in the case of several State agencies that either under- or overreported the number of participants.
Poverty guideline calculations are based on income, income period, and household size as reported by State agencies. a WIC participant household incomes of more than 185% of the Federal poverty guideline could be due to certification error or adjunct eligibility through the Medicaid program, which allows households with income above this level to participate in WIC in a number of States. b Zero incomes are reported separately and excluded from these income calculations. In some reporting agencies, zero may be used to indicate missing information or adjunctive eligibility. Therefore, PC2014 cannot distinguish between households with missing income information and households reporting zero income. c “Not reported” indicates the percentage of participants by participant category for whom data on income, income period, or size of economic unit were not reported.

WIC Participant and Program Characteristics: 2014 Final Report
Page 52
Table III.10. Distribution of Income as a Percent of Federal Poverty Guideline at Certification for WIC Participants
Reporting No Other Benefit Receipta
Pregnant Women
Breastfeeding Women
Postpartum Women
Total Women
Infants
Children
Total Participants
Percent of Federal Poverty Guideline Number %
Number %
Number %
Number %
Number %
Number %
Number %
0–50 58,753 22.7 41,705 21.8 30,477 26.3 130,936 23.1 176,583 29.0 157,894 20.1 465,413 23.7 51–100 82,786 32.0 64,535 33.7 35,212 30.4 182,532 32.3 190,241 31.3 217,809 27.7 590,581 30.1 101–130 43,276 16.7 31,069 16.2 17,354 15.0 91,699 16.2 83,921 13.8 135,901 17.3 311,520 15.9 131–150 25,202 9.7 18,671 9.7 10,331 8.9 54,204 9.6 47,509 7.8 92,773 11.8 194,486 9.9 151–185 34,222 13.2 25,529 13.3 13,653 11.8 73,403 13.0 62,095 10.2 135,126 17.2 270,624 13.8 186–200b 1,656 0.6 507 0.3 272 0.2 2,436 0.4 1,207 0.2 2,215 0.3 5,858 0.3 201–225b 1,835 0.7 478 0.2 221 0.2 2,533 0.4 1,174 0.2 1,690 0.2 5,397 0.3 226–250b 719 0.3 224 0.1 122 0.1 1,064 0.2 540 0.1 780 0.1 2,385 0.1 More than 250b 465 0.2 373 0.2 250 0.2 1,087 0.2 1,021 0.2 1,382 0.2 3,490 0.2
Income Reported as Zeroc 6,426 2.5
5,158 2.7
4,474 3.9
16,058 2.8
31,178 5.1
27,254 3.5
74,490 3.8
Not Reportedd 3,203 1.2 3,454 1.8 3,316 2.9 9,972 1.8 12,904 2.1 13,348 1.7 36,225 1.8
U.S. WIC 258,542 100.0 191,701 100.0 115,681 100.0 565,924 100.0 608,372 100.0 786,173 100.0 1,960,470 100.0
Notes
Percents may not add to 100.0% and subtotals may not add to totals due to rounding and to the use of weights in the case of several State agencies that either under- or overreported the number of participants. a This table excludes individuals for whom data on participation in one or more programs (TANF, SNAP, and Medicaid) are not reported. b WIC participant household incomes of more than 185% of the Federal poverty guideline could be due to certification error or adjunct eligibility through the Medicaid program, which allows households with income above this level to participate in WIC in a number of States. c Zero incomes are reported separately and excluded from these income calculations. In some reporting agencies, zero may be used to indicate missing information or adjunctive eligibility. Therefore, PC2014 cannot distinguish between households with missing income information and households reporting zero income. d “Not reported” indicates the percentage of participants by participant category for whom data on income, income period, or size of economic unit are not reported.

WIC Participant and Program Characteristics: 2014 Final Report
Page 53
Table III.11. Poverty Status of WIC Participants Reporting Income Versus General U.S. Population: 2014
Income as a Percent of Federal Poverty Measurea
General U.S. Populationb
Persons in U.S. Familiesb
Persons in U.S. Families With
Children Younger Than
Age 6b
U.S. WIC Reporting Incomec
Less than 100 14.5 12.4 20.4 74.2 100-less than 130 5.9 5.5 7.8 12.3 130-less than 150 3.9 3.6 4.8 5.5 150-less than 185 6.7 6.3 8.0 6.5 185-less than200d 2.9 2.8 3.2 0.5 200 and greaterd 66.1 69.4 55.8 1.1
Total Population 312,965,000 254,988,000 69,522,000 8,538,983 Notes
Percents may not add to 100.0% and subtotals may not add to totals due to rounding and to the use of weights in the case of several State agencies that either under- or overreported the number of participants. a The poverty thresholds used in the analysis of the general U.S. population are based on family income, size, and age composition. The poverty guidelines used in the analysis of the U.S. WIC population are based only on family income and size. b CPS poverty thresholds reflect respondents' 2013 incomes (U.S. Department of Commerce and DOL, 2014). c WIC participant poverty level calculations are based on income, income period, and household size as reported by State agencies. Figures in this table represent a count of individual WIC participants. Zero incomes are included in these income calculations; participants not reporting income are excluded. Poverty level cutoffs are slightly different than those that are included in Tables III.5-III.8 in order to be comparable with CPS tabulations. d WIC participant household incomes of more than 185% of the Federal poverty level could be due to certification error or adjunct eligibility through the Medicaid program, which allows households with income above this level to participate in a number of States.

WIC Participant and Program Characteristics: 2014 Final Report
Page 54
IV. NUTRITIONAL RISK CHARACTERISTICS
To qualify for WIC benefits, applicants must be determined to be at nutritional risk based on anthropometric, biochemical, clinical, or dietary factors. During the eligibility determination process, height and weight must be measured, and a blood test for anemia (usually hemoglobin or hematocrit) is administered to all applicants except infants younger than 9 months of age. Medical history and dietary patterns are also considered during this process. A competent professional authority, such as a physician, nutritionist, nurse, or other health professional or paraprofessional, determines nutritional risk based on these data.
Federal policy prior to 1999 permitted State agencies to develop nutritional risk criteria within broad Federal parameters spelled out in the Child Nutrition Act of 1966, as amended. Accordingly, the nutritional risk criteria used to determine eligibility varied across State agencies. WIC PC reports from 1988 through 1998 reflect these differences among State agencies. In 1992, FNS asked IOM to review the scientific basis for WIC risk criteria and to recommend definitions and thresholds. A report issued by the National Academy of Sciences in 1996, which included a series of recommendations, was the basis for a policy change that took effect April 1, 1999 (IOM, 1996). Now, State agencies are required to use only criteria and definitions that have been reviewed by the Risk Identification and Selection Collaborative (a joint National WIC Association/FNS working group) and approved by FNS. Within these national nutritional risk standards, State agencies may use more-restrictive criteria, but not less-restrictive criteria, to define specific risks. Caution should be exercised when comparing PC2014 nutritional risk data with findings from years prior to 2000, before nutritional risk data were reported using uniform criteria and definitions.
Table IV.1 presents specific nutritional risks within their respective broad risk categories. Analysis and tabulations of nutritional risks included in this report are based on these levels of nutritional risk categorization (i.e., broad risk category and specific nutritional risk). Additional detail on the risk criteria that define specific nutritional risks are included in appendix table C.IV.1. This chapter includes discussion on how FNS revisions to risk criteria influence PC reporting of the specific nutritional risks they define.
FNS has revised the nutritional risk criteria several times since 1999. Between PC2006 and PC2008, WIC implemented WIC Policy Memorandum 98-9, Revision 8, which revised and consolidated dietary risks and shifted dietary risk criteria between specific risks (USDA, 2005). While the implementation date for Revision 8 was October 2006, the most significant effects of this revision with respect to the consolidation of dietary risks were seen in PC2010.
WIC Policy Memorandum 98-9, Revision 9 was implemented between PC2008 and PC2010 (USDA, 2007). This revision added a new allowable risk criterion—exposure to environmental tobacco smoke—to the specific nutritional risk “other nutritional risks” and expanded criteria for maternal smoking in the specific nutritional risk “substance abuse.”
WIC Policy Memorandum 98-9, Revision 10 was implemented between PC2010 and PC2012 (USDA, 2009). This revision included two new allowable risk criteria, history of preeclampsia and pre-diabetes. It also revised and updated a number of existing risk criteria, including lowering the body mass index (BMI) threshold below which pregnant women are assigned the

WIC Participant and Program Characteristics: 2014 Final Report
Page 55
low weight-for-height risk as well as the threshold above which pregnant women are assigned the high weight-for-height risk.28 PC2014 reflects the continuing decline in the number of pregnant women who are assigned the low weight-for-height specific nutritional risk, as well as the increase in pregnant women who are assigned the high weight-for-height specific nutritional risk, resulting from these changes in BMI thresholds.
Finally, a memorandum issued by FNS on May 27, 2011, and implemented in October 2012, entitled “Transmittal of New and Revised Nutrition Risk Criteria” (hereafter, “the May 2011 Memorandum”), revised a number of anthropometric risks for infants and young children. For infants and children younger than 2 years of age, World Health Organization (WHO) growth standards replaced the CDC growth charts from 2000. This change resulted in minor modifications to existing risk criteria cutoffs for underweight or at risk of underweight and for low head circumference. The May 2011 Memorandum also created the high weight-for-length risk criteria for infants and children younger than 2 years of age. For infants and children participating in WIC to be assigned the high weight-for-height/length specific nutritional risk,29 they must now either (1) be at risk for overweight based on the risk criterion for biological parent BMI (an old criterion), or (2) have specific weight and length measurements that are considered high weight-for-length according to WHO growth standards (a new criterion). Prior to this change, infants and children younger than 2 years of age were assigned the high weight-for-height/length specific nutritional risk based solely on biological parent BMI. This change means PC2014 high weight-for-height/length percentiles for infants and children younger than 2 years of age are not comparable to figures reported in PC2012 or any earlier year. This also accounts for the sizeable increase in infants and children assigned the high weight-for-height/length specific nutritional risk between PC2012 and PC2014 illustrated in some tables in this report.
Section A of this chapter examines the number of specific nutritional risks per participant. Section B discusses differences in specific nutritional risks across demographic and economic characteristic categories. Section C presents information on the height/length and weight of participants, as measured at certification, and compares the measurements with national norms. Section D, the last section in this chapter, examines WIC participants’ blood values.
28 Revision 10 lowered the prepregnancy BMI cutoff value for pregnant women to be assigned the low weight-for-height specific nutritional risk (based on the underweight risk criterion) from a BMI less than 19.8 to a BMI less than 18.5. This revision also lowered the prepregnancy BMI cutoff value for pregnant women to be assigned the high weight-for-height/length specific nutritional risk (based on the overweight risk criterion) from a BMI less than or equal to 26.1 to a BMI less than or equal to 25. 29 The high weight-for-height/length specific nutritional risk includes the following risk criteria: overweight (women); obese (children 2–5 years of age); overweight or at risk of overweight (infants and children); high weight-for-length (infants and children younger than 24 months of age).

WIC Participant and Program Characteristics: 2014 Final Report
Page 56
Table IV.1. Broad Categories of FNS-Issued Specific Nutritional Risks
Anthropometric Low weight-for-height
High weight-for-height/length
Short stature
Inappropriate growth/weight gain pattern
Low birth weight/premature birth
Other anthropometric risk
Biochemical Hematocrit or hemoglobin below FNS criteria
Other biochemical test results that indicate nutritional abnormality (such as elevated blood lead levels)
Clinical/Health/Medical Pregnancy-induced conditions (such as hyperemesis gravidarum, gestational diabetes, history of gestational diabetes, history of preeclampsia)
Delivery of low birth weight or premature infant
Prior stillbirth, fetal, or neonatal death
General obstetrical risks (such as multiple fetus births, high parity and young age, closely spaced pregnancies)
Nutrition-related risk conditions (such as any nutrition-related chronic disease, genetic disorder, infectious disease, gastrointestinal disorders, drug nutrient interactions, pre-diabetes)
Substance abuse (drugs, alcohol, tobacco)
Other health risks (fetal alcohol syndrome, dental problems)
Dietary Failure to meet Dietary Guidelines for Americans
Inappropriate nutrition practices
Other Risk Regression/transfer (nutritional risk unknown)/presumptive eligibility
Breastfeeding mother and infant dyad
Infant of a WIC-eligible mother or mother at risk during pregnancy
Homelessness/migrancy
Other nutritional risks
WIC Participant and Program Characteristics: 2014 Final Report
Page 57
A. NUTRITIONAL RISK CRITERIA
During the eligibility determination and recertification processes, WIC staff collect anthropometric, biochemical, medical history, and dietary information from applicants and participants. To capture additional information on nutritional risks of WIC participants, State agencies could report the 10 highest priority nutritional risks present at the current certification, starting with PC2006. Prior to 2006, States were able to report the three highest priority nutritional risks.
The percentage of WIC participants for whom more than one nutritional risk was reported increased from 48.9 in 2010 to 51.8 in 2012 and to 54.0 in 2014 (see table IV.2). Multiple risks were most likely to be reported for women: PC2014 data for roughly four-fifths of participants in each certification category for women included more than one nutritional risk, while almost three-fifths of infants’ and two-fifths of children’s PC2014 data included multiple nutritional risks. Fewer than 7 percent of infants’ data and fewer than 2 percent of children’s data included more than three nutritional risks in 2014.
As in PC2012, breastfeeding women’s PC2014 data included the most nutritional risks; 55.7 percent included three or more nutritional risks, while only 17.5 percent contained one nutritional risk, the lowest of any certification category.

WIC Participant and Program Characteristics: 2014 Final Report
Page 58
Table IV.2. Distribution of Number of Nutritional Risk Factors for WIC Participants Reported at Certification: 2010, 2012, 2014
Pregnant Women
Breastfeeding Women
Postpartum Women
Infants
Children
Total WIC
Number of Risk Factors 2010 2012 2014
2010 2012 2014
2010 2012 2014
2010 2012 2014
2010 2012 2014
2010 2012 2014
1 29.1 23.6 22.6 20.7 18.4 17.5 23.6 21.6 21.4 49.8 44.8 41.8 62.7 61.2 59.1 50.8 48.0 46.0 2 31.5 29.7 29.2 28.0 27.2 26.7 29.0 28.1 27.9 33.4 35.4 35.2 28.4 29.4 30.3 29.9 30.6 30.9 3 23.6 25.8 26.2 26.1 26.6 26.7 25.8 25.8 25.7 12.3 14.5 16.2 7.3 7.7 8.4 12.6 13.6 14.4 4 10.5 13.4 14.0 16.0 17.3 17.7 13.9 15.1 15.3 3.2 4.1 5.0 1.2 1.3 1.6 4.4 5.2 5.7 5 3.7 5.1 5.4 6.8 7.7 8.1 5.6 6.6 6.7 0.7 0.9 1.2 0.2 0.2 0.2 1.5 1.8 2.0 6 1.1 1.6 1.8 1.7 2.1 2.5 1.5 2.0 2.2 0.1 0.1 0.3 0.0 0.0 0.0 0.4 0.5 0.6 7 0.3 0.5 0.5 0.4 0.5 0.6 0.3 0.5 0.6 0.0 0.0 0.1 0.0 0.0 0.0 0.1 0.1 0.2 8 0.1 0.1 0.1 0.0 0.1 0.1 0.1 0.1 0.1 0.0 0.0 0.0 0.0 0.0 0.0 0.0 0.0 0.0 9 0.0 0.0 0.0 0.0 0.0 0.0 0.0 0.0 0.0 0.0 0.0 0.0 0.0 0.0 0.0 0.0 0.0 0.0 10 0.0 0.0 0.0 0.0 0.0 0.0 0.0 0.0 0.0 0.0 0.0 0.0 0.0 0.0 0.0 0.0 0.0 0.0
No Risk Reported 0.2 0.2 0.1 0.2 0.1 0.1 0.1 0.1 0.2 0.4 0.1 0.3 0.3 0.2 0.4 0.3 0.2 0.3
Total 100.0 100.0 100.0 100.0 100.0 100.0 100.0 100.0 100.0 100.0 100.0 100.0 100.0 100.0 100.0 100.0 100.0 100.0

WIC Participant and Program Characteristics: 2014 Final Report
Page 59
B. NUTRITIONAL RISKS BY DEMOGRAPHIC AND ECONOMIC CHARACTERISTICS
Consistent with earlier PC reports, the most commonly assigned broad categories of nutritional risk reported for the entire WIC population were dietary and anthropometric risks (see table IV.3). Distributions varied across participant categories, age, race, and poverty status.
The implementation of WIC Policy Memorandum 98-9, Revision 8 (USDA, 2005) established failure to meet Dietary Guidelines for Americans as a presumed dietary risk criterion for women and children and restricted its assignment to those for whom no other risk criterion were identified. Once this change was implemented, the share of participants assigned this specific nutritional risk dropped from 16.0 percent in 2008 to 12.1 percent in 2010 and 9.5 percent in 2012. In 2014, however, the proportion of WIC participants assigned this specific nutritional risk leveled out at 10.3 percent (see table IV.3).
Table IV.3 also reveals an increase in the proportion of WIC participants assigned the high weight-for-height/length specific nutritional risk from 26.8 percent in 2012 to 30.9 percent in 2014. As shown in tables IV.6, IV.7, and IV.8, this change appears primarily driven by infants and children younger than 2 years of age, reflecting the addition of the high weight-for-length risk criterion based on participant anthropometric measures for these age groups mandated by the May 2011 Memorandum. Specifically, while the percentage of women WIC participants assigned the high weight-for-height/length specific nutritional risk increased only 2.2 percentage points, the increase among infants was much higher at 8.4 percentage points (from 6.6 percent in 2012 to 15.0 percent in 2014). Similarly, the proportion of 1-year-old children assigned the high weight-for-height/length specific nutritional risk increased by 10.6 percentage points between 2012 and 2014, while the proportion of older children displaying this risk remained essentially unchanged. This increase in high weight-for-height/length was particularly apparent among older infants: while the proportion of 0- to 3-month-old infants displaying the high weight-for-height/length specific nutritional risk increased by roughly 8 percentage points, the increase for 9- to 11-month-old infants was twice as great, 16.5 percentage points.
Tables IV.4 and IV.6 provide information on nutritional risks for women WIC participants. Table IV.4 presents broad categories of nutritional risk by age. The broad category of clinical, health, and medical risks was more likely to be assigned to women younger than age 18 than to older women. This risk was assigned to 95.6 percent of women younger than age 15 and 91.8 percent of women aged 15 to 17, compared to 52.4 percent of women aged 18 to 34 and 57.8 percent of women older than age 34.
Anthropometric risks, as a broad category, show the opposite trend. Younger women were less likely to have these risks (61.1 percent of women younger than age 15 and 64.1 percent of women aged 15 to 17) than older women were (72.7 percent of women aged 18 to 34 and 77.5 percent of women older than age 34).
The specific nutritional risks (see table IV.6) reported most frequently for WIC women in PC2014 were high weight-for-height/length (55.0 percent), inappropriate growth or weight gain pattern (43.4 percent), and inappropriate nutritional practices (33.2 percent). Other relatively

WIC Participant and Program Characteristics: 2014 Final Report
Page 60
common risks among WIC women included general obstetrical risks (26.3 percent) and blood values below FNS-issued criteria (23.7 percent).
The relative prevalence of these specific nutritional risks varied among pregnant, breastfeeding, and postpartum women. Similar to previous years, breastfeeding women were more likely to be assigned a specific nutritional risk in the broad category of “other” risk because it includes the breastfeeding mother/infant dyad. Almost half (50.3 percent) of breastfeeding women were assigned to the “other” risk category compared with only 10.3 percent of pregnant or postpartum women. Pregnant women were more likely to be assigned the specific nutritional risk for general obstetrical risks and less likely to be assigned the hematocrit/hemoglobin levels below FNS criteria risk compared to other women WIC participants. Specifically, 31.0 percent of pregnant women were assigned general obstetrical risks, compared with 22.1 percent and 24.0 percent of breastfeeding and postpartum women, respectively. Only 10.1 percent of pregnant women were assigned hematocrit or hemoglobin levels below FNS criteria risk, compared with 30.8 percent of breastfeeding women and 35.8 percent of postpartum women.
Changes in BMI thresholds for several risk criteria introduced by Revision 10 between PC2010 and PC2012 (particularly a lower prepregnancy BMI threshold for overweight and a lower BMI threshold for high maternal weight gain) appeared to result in an increase in the percentage of pregnant women assigned anthropometric risks between PC2010 and PC2012. Between PC2012 and PC2014, however, overall anthropometric risks for pregnant women remained relatively stable, rising only 2.4 percentage points (compared to the increase of 8.9 percentage points between PC2010 and PC2012). Inappropriate growth or weight gain pattern increased between PC2012 and PC2014 for this population (4.6 percentage points), but this growth was significantly less pronounced than the 18.2-percent increase between PC2010 and PC2012 when Revision 10 implementation occurred.
The percentage of women in all categories assigned the specific nutritional risk of hematocrit or hemoglobin below FNS criteria increased slowly but steadily between PC2002 and PC2012 from 6.6 percent to 24.4 percent. In 2014, however, this increase leveled out at 23.8 percent. The current prevalence levels, however, are still below levels observed in PC1998, especially for pregnant women.
Specific nutritional risks for infants varied by age at certification (see tables IV.5 and IV.7). The broad category of dietary risks was more likely to be assigned to older infants: this risk was assigned to 55.6 percent of infants certified between 6 and 8 months of age and 56.6 percent of infants certified between 9 and 11 months of age. By comparison, 32.6 percent of infants certified between 0 and 3 months of age and 40.7 percent of infants certified between 4 and 5 months of age were assigned this risk. More than two-fifths (41.5 percent) of all infants were certified in the broad anthropometric risk category, most commonly the specific nutritional risks for low birth weight or high weight-for-height/length.
At certification, more than four-fifths (84.7 percent) of infants aged 0 to 3 months and almost two-thirds (64.0 percent) of infants aged 4 to 5 months were at risk because their mothers were WIC-eligible or were at risk during pregnancy.

WIC Participant and Program Characteristics: 2014 Final Report
Page 61
The most common broad categories of nutritional risks assigned to children were dietary risks (75.8 percent) and anthropometric risks (42.1 percent; table IV.5.) At certification, roughly one-third (30.0 percent to 34.8 percent, depending on age) of children aged 2 and older were assigned to the specific anthropometric risk of high weight-for-height/length. The addition of a new risk criterion, high weight-for-length, for children younger than 2 years of age was likely responsible for the rise in assignment of the high weight-for-height/length specific nutritional risk for 1-year-old children from 6.2 percent in PC2010 to 7.6 percent in PC2012 and 18.2 percent in PC2014.
Tables IV.9 and IV.10 present the most frequently assigned risks by participant category in 2010, 2012, and 2014. High weight-for-height/length, as discussed above, rose significantly among infants (likely because of the May 2011 Memorandum), which explains its inclusion in table IV.9 this year. The information in table IV.10 refines the assignment for pregnant women, presenting the most frequently assigned specific nutritional risks by age at certification.
Tables IV.11 through IV.26 show specific and broad categories of nutritional risks by race and ethnicity. The general patterns of reported specific nutritional risks by race/ethnicity are similar to 2012 reporting. Blood measurements below FNS criteria occurred most frequently among Black or African American Only women (36.4 percent, from table IV.13; occurrence in all other racial groups was less than 23.1 percent). Asian Only women were most likely to be assigned the low weight-for-height specific nutritional risk (7.7 percent; table IV.12), while Black or African American Only women were most likely to be assigned the high weight-for-height/length specific nutritional risk (59.4 percent; table IV.13). American Indian or Alaska Native, Hispanic/Latino, and multiracial pregnant women were more likely to be assigned the inappropriate growth or weight gain pattern risk than were pregnant women of a different race or ethnicity. Meanwhile, American Indian or Alaska Native Only and Asian Only postpartum women were less likely to be assigned this risk than were postpartum women of a different racial or ethnic group.
Substance abuse (drugs, alcohol, and/or tobacco) among pregnant WIC women was most prevalent for White Only women (15.8 percent; table IV.15) and women reporting two or more races (18.1 percent; table IV.16). Notable differences in rates of reporting the substance use specific nutritional risk were also apparent between Hispanic/Latino and non-Hispanic/Latino pregnant women, at 5.3 percent and 18.0 percent, respectively. Asian Only pregnant women were most likely to be assigned the failure to meet Dietary Guidelines for Americans risk (13.0 percent; table IV.12) than were women of other races. Hispanic/Latino pregnant women were assigned inappropriate growth or weight gain pattern (59.8 percent; table IV.17) more often than were non-Hispanic/Latino pregnant women (51.8 percent).
The most common specific nutritional risk for infants across all racial and ethnic categories was WIC-eligible mother or mother at risk during pregnancy. Black or African American Only infants were more likely to be assigned low birth weight or premature birth risks (18.5 percent; table IV.13) than were infants in other racial groups (14.2 percent or lower), while non-Hispanic/Latino infants were more likely than Hispanic/Latino infants to be assigned this risk (16.0 percent versus 12.7 percent, respectively; table IV.17). Conversely, Hispanic/Latino infants were more likely to have a WIC-eligible mother or mother at risk during pregnancy (85.6 percent) than were non-Hispanic/Latino infants (79.2 percent).

WIC Participant and Program Characteristics: 2014 Final Report
Page 62
The broad dietary risk category was the risk category most commonly assigned to children regardless of race or ethnicity. Notable differences by race and ethnicity include American Indian or Alaska Native Only children being somewhat more likely to have been assigned a specific nutritional risk based on high weight-for-height/length (32.1 percent; table IV.11). Black or African American Only children were also nearly twice as likely to be assigned the blood measurements below FNS criteria specific nutritional risk (20.0 percent; table IV.13) as were any other racial or ethnic groups.
Tables IV.27 through IV.33 present distributions of specific and broad categories of nutritional risks by participant income as a percentage of the Federal poverty guideline. The differences seen across Federal poverty guidelines in 2014 were similar to findings in previous years. Women at lower income levels were assigned higher levels of obstetrical risk; 27.6 percent of women with incomes at or below the poverty guideline were assigned this risk compared with 22.3 percent of women with incomes of between 130 percent and 185 percent of the poverty guideline (table IV.27). Women at lower income levels also were assigned the blood measures below FNS criteria risk more frequently, with 24.8 percent of women with incomes at or below the poverty guideline assigned this risk compared to 18.9 percent of women with incomes of between 130 percent and 185 percent of the poverty guideline.

WIC Participant and Program Characteristics: 2014 Final Report
Page 63
Table IV.3. Number and Percent of WIC Participants With Specific Nutritional Risks
Reported at Certification
2012 2014
Broad Risk Category and Specific Nutritional Risk Number Percent Number Percent Anthropometric 4,560,768 46.9 4,581,627 49.2
Low weight-for-height 595,312 6.1 479,472 5.2 High weight-for-height/length 2,608,423 26.8 2,876,196 30.9 Short stature 677,503 7.0 597,530 6.4 Inappropriate growth or weight gain pattern 1,123,085 11.5 1,140,852 12.3 Low birth weight or premature birth 531,989 5.5 534,965 5.8 Other anthropometric risk 127,871 1.3 133,411 1.4
Biochemical 1,115,559 11.5 1,135,357 12.2 Hematocrit or hemoglobin below FNS criteria 1,112,453 11.4 1,132,719 12.2 Other biochemical test results that indicate nutritional
abnormality 3,633 0.0a 3,205 0.0a
Clinical, Health, Medical 1,805,202 18.5 1,740,865 18.7 Pregnancy-induced conditions 154,105 1.6 165,923 1.8 Delivery of low birth weight or premature infant 182,186 1.9 185,190 2.0 Prior stillbirth, fetal, or neonatal death 71,631 0.7 68,818 0.7 General obstetrical risks 614,638 6.3 578,253 6.2 Nutrition-related risk conditions 872,633 9.0 879,493 9.5 Substance abuse 249,067 2.6 228,885 2.5 Other health risks 176,061 1.8 160,160 1.7
Dietary 5,688,485 58.4 5,397,824 58.0 Failure to meet Dietary Guidelines for Americans 920,563 9.5 955,604 10.3 Inappropriate nutrition practices 4,840,382 49.7 4,541,176 48.8
Other Risk 2,809,907 28.9 2,659,303 28.6 Regression/Transfer/Presumptive eligibility 143,585 1.5 135,053 1.5 Breastfeeding mother and infant dyad 437,317 4.5 472,670 5.1 Infant of a WIC-eligible mother or mother at risk during
pregnancy 1,852,945 19.0 1,761,912 18.9 Homelessness/migrancy 31,112 0.3 35,103 0.4 Other nutritional risks 559,713 5.7 460,122 4.9
No Risk Reported 16,640 0.2 25,707 0.3
U.S. WIC—Total Number of Risks Reported 17,886,205
17,526,712
U.S. WIC—Total Number of Participants 9,734,468 9,303,253 Notes
State agencies could report up to 10 nutritional risks for each participant. This table examines all risks reported for every participant. When multiple risks (or risk criteria) within the same risk category are reported for one person, these risks are combined and counted one time to accurately calculate the number and percent of WIC participants with a specific risk or broad risk category. a Indicates nutritional risk reported for less than 0.05% of the total number of WIC participants.

WIC Participant and Program Characteristics: 2014 Final Report
Page 64
Table IV.4. Number and Percent of Women WIC Participants by Participant Category, Age at Certification, And
Broad Category of Nutritional Risk Reported
Participant Category and Age at Certification
Anthropometric
Biochemical Clinical, Health,
and Medical
Dietary
Other Risksa No Risk
Reported
Total Womenb Number % Number % Number % Number % Number % Number % Number %
Pregnant Women 711,484 79.4 90,453 10.1 490,269 54.7 392,469 43.8 92,247 10.3 1,215 0.1 896,551 100.0 Younger than 15 years 1,226 69.0 249 14.0 1,710 96.2 679 38.2 583 32.8 2 0.1 1,777 100.0 15–17 years 26,420 72.8 4,273 11.8 33,304 91.7 14,499 39.9 9,158 25.2 34 0.1 36,315 100.0 18–34 years 610,940 79.2 76,859 10.0 404,892 52.5 338,613 43.9 76,767 10.0 1,061 0.1 771,114 100.0 35 years or older 71,577 83.6 8,605 10.0 49,386 57.7 38,453 44.9 5,189 6.1 98 0.1 85,635 100.0 Age not reported 1,320 77.2 468 27.4 976 57.1 225 13.1 551 32.2 20 1.2 1,710 100.0
Breastfeeding Women 466,275 67.8 211,654 30.8 344,129 50.1 259,777 37.8 345,591 50.3 654 0.1 687,351 100.0 Younger than 15 years 251 52.8 193 40.6 446 93.7 155 32.7 243 51.0 0 0.0 476 100.0 15–17 years 7,645 54.1 5,359 37.9 12,938 91.6 5,332 37.8 6,851 48.5 3 0.0 14,122 100.0 18–34 years 390,249 67.3 177,427 30.6 279,817 48.2 219,446 37.8 289,830 50.0 562 0.1 580,078 100.0 35 years or older 67,723 73.5 28,488 30.9 50,609 55.0 34,738 37.7 48,495 52.7 68 0.1 92,087 100.0 Age not reported 406 69.1 186 31.7 319 54.2 107 18.2 173 29.5 21 3.6 588 100.0
Postpartum Women 426,711 69.3 220,320 35.8 360,093 58.5 251,781 40.9 63,251 10.3 1,004 0.2 615,559 100.0 Younger than 15 years 464 50.3 395 42.7 879 95.2 352 38.2 179 19.4 0 0.0 923 100.0 15–17 years 12,628 56.3 8,665 38.6 20,642 92.0 8,825 39.3 3,871 17.3 22 0.1 22,429 100.0 18–34 years 372,721 69.3 192,448 35.8 304,233 56.6 220,238 41.0 54,959 10.2 899 0.2 537,477 100.0 35 years or older 40,574 74.8 18,653 34.4 34,053 62.8 22,268 41.0 4,170 7.7 70 0.1 54,261 100.0 Age not reported 323 68.9 159 33.9 286 61.0 98 20.9 73 15.6 13 2.8 469 100.0
Total women 1,604,470 72.9 522,427 23.8 1,194,491 54.3 904,028 41.1 501,089 22.8 2,873 0.1 2,199,461 100.0 Younger than 15 years 1,942 61.1 837 26.3 3,035 95.6 1,187 37.4 1,005 31.6 2 0.1 3,176 100.0 15–17 years 46,694 64.1 18,297 25.1 66,884 91.8 28,656 39.3 19,879 27.3 59 0.1 72,866 100.0 18–34 years 1,373,910 72.7 446,734 23.7 988,943 52.4 778,297 41.2 421,555 22.3 2,523 0.1 1,888,669 100.0 35 years or older 179,875 77.5 55,746 24.0 134,048 57.8 95,459 41.1 57,854 24.9 236 0.1 231,983 100.0 Age not reported 2,049 74.1 813 29.4 1,581 57.1 430 15.5 797 28.8 54 2.0 2,767 100.0
Notes
In 2014, State agencies could report up to 10 nutritional risks for each participant. This table examines all risks reported for every participant. When multiple risks (or risk criteria) within the same risk category are reported for one person, these risks are combined and counted one time to accurately calculate the number and percent of WIC participants with a specific risk or broad risk category. Nonetheless, because of the reporting of multiple risks, rows total more than 100%. a Other risks include regression/transfer (nutritional risk unknown), presumptive eligibility, breastfeeding mother and infant dyad, and homelessness/migrancy. b The total women column reports the number of women in the referenced WIC participant category and age range.

WIC Participant and Program Characteristics: 2014 Final Report
Page 65
Table IV.5. Number and Percent of Infant and Child WIC Participants by Age at Certification and Broad Category of Nutritional Risk Reported
Participant Category and Age at Certification
Anthropometric
Biochemical Clinical, Health, and
Medical
Dietary
Other Risksa No Risk
Reported Total Infants
and Childrenb Number % Number % Number % Number % Number % Number % Number %
Infantsc 888,429 41.5 19,673 0.9 106,552 5.0 730,544 34.1 1,825,218 85.2 5,381 0.3 2,141,988 100.0 0–3 months 809,057 41.3 10,663 0.5 92,268 4.7 637,747 32.6 1,719,727 87.8 4,409 0.2 1,958,669 100.0 4–5 months 24,784 40.5 515 0.8 5,448 8.9 24,883 40.7 44,869 73.4 284 0.5 61,152 100.0 6–8 months 36,814 43.0 2,177 2.5 6,562 7.7 47,528 55.6 46,420 54.3 394 0.5 85,552 100.0 9–11 months 17,074 49.0 6,131 17.6 2,168 6.2 19,749 56.6 13,407 38.4 245 0.7 34,876 100.0 Age not reported 700 40.3 188 10.8 107 6.2 637 36.7 795 45.7 49 2.8 1,738 100.0
Children 2,088,727 42.1 593,257 12.0 439,822 8.9 3,763,252 75.8 332,998 6.7 17,451 0.4 4,961,804 100.0 1 year 683,588 37.6 288,983 15.9 132,947 7.3 1,392,503 76.5 128,163 7.0 12,320 0.7 1,819,921 100.0 2 years 555,408 43.2 157,162 12.2 111,679 8.7 988,452 76.8 84,045 6.5 2,261 0.2 1,286,485 100.0 3 years 522,419 45.5 102,519 8.9 116,829 10.2 857,685 74.8 74,255 6.5 1,659 0.1 1,147,273 100.0 4 years 325,576 46.2 44,105 6.3 78,063 11.1 522,503 74.2 46,227 6.6 1,150 0.2 704,497 100.0 Age not reported 1,736 47.8 488 13.5 305 8.4 2,109 58.1 308 8.5 61 1.7 3,628 100.0
Notes
In 2014, State agencies could report up to 10 nutritional risks for each participant. This table examines all risks reported for every participant. When multiple risks (or risk criteria) within the same risk category are reported for one person, these risks are combined and counted one time to accurately calculate the number and percent of WIC participants with a specific risk or broad risk category. Nonetheless, because of the reporting of multiple risks, rows total more than 100%. a Other risks include regression/transfer (nutritional risk unknown), presumptive eligibility, breastfeeding mother and infant dyad, infant of a WIC-eligible mother or mother at risk during pregnancy, and homelessness/migrancy. b The total column reports the number of infants or children in the age range. c An infant is defined as a participant who at certification is younger than 1 year of age and would be classified as a child at the age of 366 days.

WIC Participant and Program Characteristics: 2014 Final Report
Page 66
Table IV.6. Number and Percent of Women WIC Participants by Participant Category With Specific Nutritional Risks Reported
Pregnant Women Breastfeeding Women Postpartum Women Total Women
Broad Risk Category and Specific Nutritional Risk Number % Number % Number % Number % Women in WIC Participant Category 896,551
687,351
615,559
2,199,461
Anthropometric 711,484 79.4 466,275 67.8 426,711 69.3 1,604,470 72.9
Low weight-for-height 35,353 3.9 19,435 2.8 21,747 3.5 76,535 3.5 High weight-for-height/length 498,265 55.6 373,595 54.4 337,257 54.8 1,209,117 55.0 Short stature 3 0.0 2 0.0 1 0.0 6 0.0 Inappropriate growth or weight gain pattern 491,940 54.9 245,301 35.7 217,417 35.3 954,658 43.4 Other anthropometric risk 3 0.0 5 0.0 2 0.0 10 0.0
Biochemical 90,453 10.1 211,654 30.8 220,320 35.8 522,427 23.8 Hematocrit or hemoglobin below FNS criteria 90,388 10.1 211,601 30.8 220,275 35.8 522,264 23.7 Other biochemical test results that indicate nutritional abnormality 78 0.0 98 0.0 77 0.0 253 0.0
Clinical, Health, Medical 490,269 54.7 344,129 50.1 360,093 58.5 1,194,491 54.3 Pregnancy-induced conditions 68,945 7.7 52,382 7.6 44,596 7.2 165,923 7.5 Delivery of low birth weight or premature infant 56,151 6.3 63,950 9.3 65,089 10.6 185,190 8.4 Prior stillbirth, fetal, or neonatal death 47,520 5.3 5,369 0.8 15,930 2.6 68,818 3.1 General obstetrical risks 278,217 31.0 152,102 22.1 147,933 24.0 578,253 26.3 Nutrition-related risk conditions 110,162 12.3 156,865 22.8 157,166 25.5 424,193 19.3 Substance abuse 117,266 13.1 25,576 3.7 79,725 13.0 222,568 10.1 Other health risks 31,937 3.6 15,659 2.3 17,269 2.8 64,866 2.9
Dietary 392,469 43.8 259,777 37.8 251,781 40.9 904,028 41.1 Failure to meet Dietary Guidelines for Americans 80,007 8.9 54,532 7.9 52,704 8.6 187,243 8.5 Inappropriate nutrition practices 318,219 35.5 209,188 30.4 202,741 32.9 730,148 33.2
Other Risk 92,247 10.3 345,591 50.3 63,251 10.3 501,089 22.8 Regression/Transfer/Presumptive eligibility 13,043 1.5 5,724 0.8 6,351 1.0 25,117 1.1 Breastfeeding mother and infant dyad 2,647 0.3 331,666 48.3 19,608 3.2 353,921 16.1 Homelessness/migrancy 5,168 0.6 2,624 0.4 2,565 0.4 10,357 0.5 Other nutritional risks 72,877 8.1 16,809 2.4 36,246 5.9 125,932 5.7
No Risk Reported 1,215 0.1 654 0.1 1,004 0.2 2,873 0.1
Notes
In 2014, State agencies could report up to 10 nutritional risks for each participant. This table examines all risks reported for every participant. When multiple risks (or risk criteria) within the same risk category are reported for one person, these risks are combined and counted one time to accurately calculate the number and percent of WIC participants with a specific risk or broad risk category.
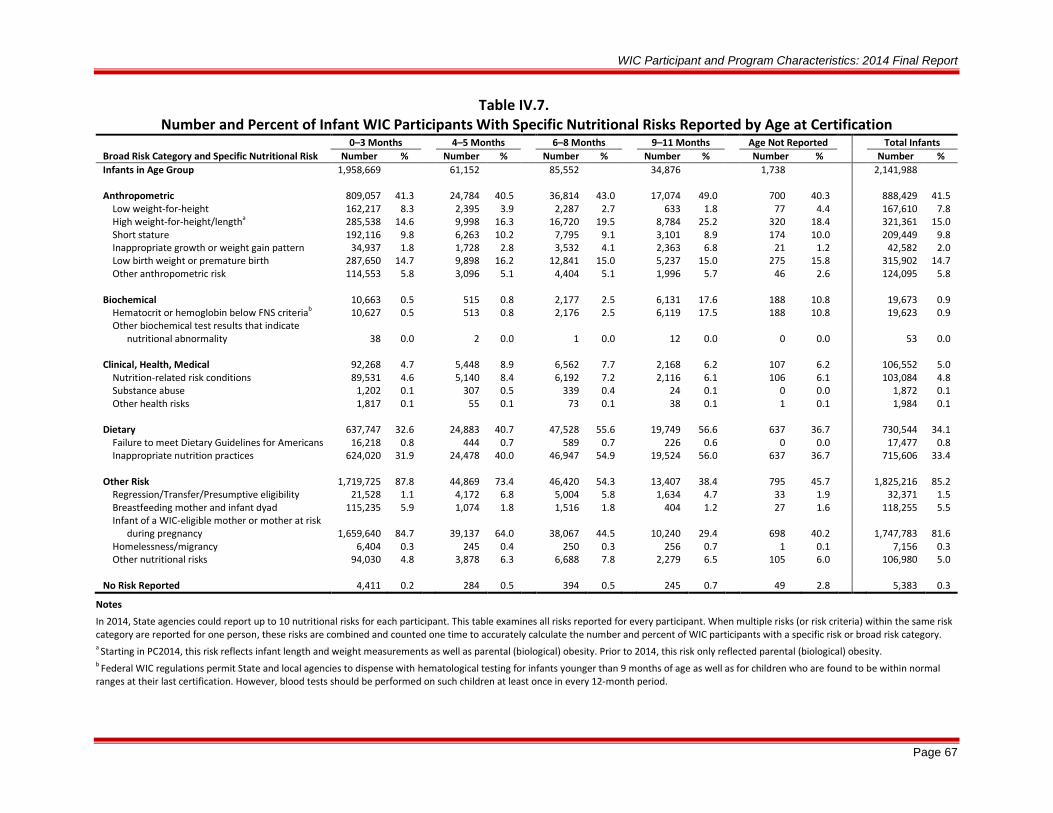
WIC Participant and Program Characteristics: 2014 Final Report
Page 67
Table IV.7. Number and Percent of Infant WIC Participants With Specific Nutritional Risks Reported by Age at Certification
0–3 Months 4–5 Months 6–8 Months 9–11 Months Age Not Reported Total Infants
Broad Risk Category and Specific Nutritional Risk Number % Number % Number % Number % Number % Number % Infants in Age Group 1,958,669
61,152
85,552
34,876
1,738
2,141,988
Anthropometric 809,057 41.3 24,784 40.5 36,814 43.0 17,074 49.0 700 40.3 888,429 41.5
Low weight-for-height 162,217 8.3 2,395 3.9 2,287 2.7 633 1.8 77 4.4 167,610 7.8 High weight-for-height/lengtha 285,538 14.6 9,998 16.3 16,720 19.5 8,784 25.2 320 18.4 321,361 15.0 Short stature 192,116 9.8 6,263 10.2 7,795 9.1 3,101 8.9 174 10.0 209,449 9.8 Inappropriate growth or weight gain pattern 34,937 1.8 1,728 2.8 3,532 4.1 2,363 6.8 21 1.2 42,582 2.0 Low birth weight or premature birth 287,650 14.7 9,898 16.2 12,841 15.0 5,237 15.0 275 15.8 315,902 14.7 Other anthropometric risk 114,553 5.8 3,096 5.1 4,404 5.1 1,996 5.7 46 2.6 124,095 5.8
Biochemical 10,663 0.5 515 0.8 2,177 2.5 6,131 17.6 188 10.8 19,673 0.9 Hematocrit or hemoglobin below FNS criteriab 10,627 0.5 513 0.8 2,176 2.5 6,119 17.5 188 10.8 19,623 0.9 Other biochemical test results that indicate
nutritional abnormality 38 0.0
2 0.0
1 0.0
12 0.0
0 0.0
53 0.0
Clinical, Health, Medical 92,268 4.7 5,448 8.9 6,562 7.7 2,168 6.2 107 6.2 106,552 5.0 Nutrition-related risk conditions 89,531 4.6 5,140 8.4 6,192 7.2 2,116 6.1 106 6.1 103,084 4.8 Substance abuse 1,202 0.1 307 0.5 339 0.4 24 0.1 0 0.0 1,872 0.1 Other health risks 1,817 0.1 55 0.1 73 0.1 38 0.1 1 0.1 1,984 0.1
Dietary 637,747 32.6 24,883 40.7 47,528 55.6 19,749 56.6 637 36.7 730,544 34.1 Failure to meet Dietary Guidelines for Americans 16,218 0.8 444 0.7 589 0.7 226 0.6 0 0.0 17,477 0.8 Inappropriate nutrition practices 624,020 31.9 24,478 40.0 46,947 54.9 19,524 56.0 637 36.7 715,606 33.4
Other Risk 1,719,725 87.8 44,869 73.4 46,420 54.3 13,407 38.4 795 45.7 1,825,216 85.2 Regression/Transfer/Presumptive eligibility 21,528 1.1 4,172 6.8 5,004 5.8 1,634 4.7 33 1.9 32,371 1.5 Breastfeeding mother and infant dyad 115,235 5.9 1,074 1.8 1,516 1.8 404 1.2 27 1.6 118,255 5.5 Infant of a WIC-eligible mother or mother at risk
during pregnancy 1,659,640 84.7
39,137 64.0
38,067 44.5
10,240 29.4
698 40.2
1,747,783 81.6 Homelessness/migrancy 6,404 0.3 245 0.4 250 0.3 256 0.7 1 0.1 7,156 0.3 Other nutritional risks 94,030 4.8 3,878 6.3 6,688 7.8 2,279 6.5 105 6.0 106,980 5.0
No Risk Reported 4,411 0.2 284 0.5 394 0.5 245 0.7 49 2.8 5,383 0.3
Notes
In 2014, State agencies could report up to 10 nutritional risks for each participant. This table examines all risks reported for every participant. When multiple risks (or risk criteria) within the same risk category are reported for one person, these risks are combined and counted one time to accurately calculate the number and percent of WIC participants with a specific risk or broad risk category. a Starting in PC2014, this risk reflects infant length and weight measurements as well as parental (biological) obesity. Prior to 2014, this risk only reflected parental (biological) obesity. b Federal WIC regulations permit State and local agencies to dispense with hematological testing for infants younger than 9 months of age as well as for children who are found to be within normal ranges at their last certification. However, blood tests should be performed on such children at least once in every 12-month period.

WIC Participant and Program Characteristics: 2014 Final Report
Page 68
Table IV.8. Number and Percent of Child WIC Participants With Specific Nutritional Risks Reported by Age at Certification
1 Year 2 Years 3 Years 4 Years Age Not Reported Total Children
Broad Risk Category and Specific Nutritional Risk Number % Number % Number % Number % Number % Number % Children in Age Group 1,819,921
1,286,485
1,147,273
704,497
3,628
4,961,804
Anthropometric 683,588 37.6 555,408 43.2 522,419 45.5 325,576 46.2 1,736 47.8 2,088,727 42.1
Low weight-for-height 32,955 1.8 85,837 6.7 74,798 6.5 41,541 5.9 195 5.4 235,327 4.7 High weight-for-height/lengtha 330,899 18.2 385,774 30.0 382,466 33.3 245,447 34.8 1,132 31.2 1,345,719 27.1 Short stature 166,856 9.2 104,607 8.1 75,746 6.6 40,580 5.8 286 7.9 388,075 7.8 Inappropriate growth or weight gain pattern 55,308 3.0 29,829 2.3 35,278 3.1 23,009 3.3 188 5.2 143,612 2.9 Low birth weight or premature birth 209,258 11.5 6,838 0.5 1,752 0.2 985 0.1 230 6.3 219,063 4.4 Other anthropometric risk 7,624 0.4 772 0.1 604 0.1 297 0.0 9 0.2 9,306 0.2
Biochemical 288,983 15.9 157,162 12.2 102,519 8.9 44,105 6.3 488 13.5 593,257 12.0 Hematocrit or hemoglobin below FNS criteriab 288,317 15.8 156,313 12.2 101,877 8.9 43,838 6.2 488 13.5 590,833 11.9 Other biochemical test results that indicate
nutritional abnormality 843 0.0
1,022 0.1
743 0.1
291 0.0
0 0.0
2,899 0.1
Clinical, Health, Medical 132,947 7.3 111,679 8.7 116,829 10.2 78,063 11.1 305 8.4 439,822 8.9 Nutrition-related risk conditions 125,240 6.9 92,216 7.2 83,673 7.3 50,809 7.2 279 7.7 352,216 7.1 Substance abuse 1,569 0.1 1,055 0.1 1,032 0.1 788 0.1 1 0.0 4,445 0.1 Other health risks 7,253 0.4 20,759 1.6 35,945 3.1 29,325 4.2 28 0.8 93,310 1.9
Dietary 1,392,503 76.5 988,452 76.8 857,685 74.8 522,503 74.2 2,109 58.1 3,763,252 75.8 Failure to meet Dietary Guidelines for
Americans 102,351 5.6
254,188 19.8
245,726 21.4
148,145 21.0
474 13.1
750,884 15.1 Inappropriate nutrition practices 1,313,706 72.2 763,514 59.3 632,249 55.1 384,314 54.6 1,640 45.2 3,095,422 62.4
Other Risk 128,163 7.0 84,045 6.5 74,255 6.5 46,227 6.6 308 8.5 332,998 6.7 Regression/Transfer/Presumptive eligibility 26,796 1.5 20,852 1.6 18,919 1.6 10,957 1.6 41 1.1 77,565 1.6 Breastfeeding mother and infant dyad 467 0.0 8 0.0 9 0.0 5 0.0 5 0.1 494 0.0 Infant of a WIC-eligible mother or mother at risk
during pregnancy 12,703 0.7
582 0.0
479 0.0
305 0.0
60 1.7
14,129 0.3 Homelessness/migrancy 6,211 0.3 4,802 0.4 4,117 0.4 2,454 0.3 6 0.2 17,589 0.4 Other nutritional risks 84,068 4.6 58,610 4.6 51,396 4.5 32,929 4.7 208 5.7 227,210 4.6
No Risk Reported 12,320 0.7 2,261 0.2 1,659 0.1 1,150 0.2 61 1.7 17,451 0.4
Notes
In 2014, State agencies could report up to 10 nutritional risks for each participant. This table examines all risks reported for every participant. When multiple risks (or risk criteria) within the same risk category are reported for one person, these risks are combined and counted one time to accurately calculate the number and percent of WIC participants with a specific risk or broad risk category. a Starting in PC2014, for 1-year-old children, this risk reflects child length and weight measurements and parental (biological) obesity. Prior to 2014, this risk only reflected parental (biological) obesity. b Federal WIC regulations permit State and local agencies to dispense with hematological testing for infants younger than 9 months of age as well as for children who are found to be within normal ranges at their last certification. However, blood tests should be performed on such children at least once in every 12-month period.

WIC Participant and Program Characteristics: 2014 Final Report
Page 69
Table IV.9. Nutritional Risks Reported for at Least 15 Percent of WIC Participants:
2010, 2012, 2014 Participant Category and Specific Nutritional Risk 2010 2012 2014 Pregnant Women 1,015,173 983,192 896,551
General obstetrical risks 32.4 30.4 31.0 Inappropriate growth or weight gain pattern 32.1 50.3 54.9 Inappropriate nutrition practices 33.3 35.8 35.5 Prepregnancy high weight-for-height 45.5 53.8 55.6
Breastfeeding Women 659,933 665,526 687,351 Breastfeeding mother and infant dyad 44.5 46.3 48.3 General obstetrical risks 24.3 22.9 22.1 Hematocrit or hemoglobin below FNS criteria 31.2 32.8 30.8 High weight-for-height 50.9 53.3 54.4 Inappropriate growth or weight gain pattern 32.5 35.0 35.7 Inappropriate nutrition practices 24.9 28.1 30.4 Nutrition-related risk conditions 18.6 20.5 22.8
Postpartum Women 681,260 651,347 615,559 General obstetrical risks 26.6 25.0 24.0 Hematocrit or hemoglobin below FNS criteria 35.5 37.1 35.8 High weight-for-height 50.7 52.8 54.8 Inappropriate growth or weight gain pattern 32.0 34.8 35.3 Inappropriate nutrition practices 29.4 32.2 32.9 Nutrition-related risk conditions 22.0 23.5 25.5
Infants 2,366,706 2,240,045 2,141,988 High weight-for-height/lengtha 5.4 6.6 15.0 Inappropriate nutrition practices 26.4 31.0 33.4 Infant of a WIC-eligible mother or mother at risk
during pregnancy 81.5 82.0 81.6
Children 5,298,063 5,194,358 4,961,804 High weight-for-height/lengtha 22.9 23.7 27.1 Failure to meet Dietary Guidelines for Americans 16.5 13.0 15.1 Inappropriate nutrition practices 60.5 65.4 62.4
Notes
Each State agency is allowed to report up to 10 risks for each participant.
This table includes only nutritional risks reported for at least 15% of participants in each certification category in 2014. a Starting in PC2014, for infants and 1-year-old children, this risk reflects infant/child length and weight measurements and parental (biological) obesity. Prior to 2014, this risk only reflected parental (biological) obesity.

WIC Participant and Program Characteristics: 2014 Final Report
Page 70
Table IV.10. Nutritional Risks Reported for at Least 15 Percent
Of Pregnant WIC Participants by Age at Certification Age at Certification and Specific Nutritional Risk Percent Younger Than 15 Years 1,777
General obstetrical risks 95.3 Inappropriate growth or weight gain pattern 54.3 Inappropriate nutrition practices 34.4 Other nutritional risks 31.2 Prepregnancy high weight-for-height 27.7
15–17 years 36,315 General obstetrical risks 89.8 Inappropriate growth or weight gain pattern 55.5 Inappropriate nutrition practices 34.8 Other nutritional risks 23.1 Prepregnancy high weight-for-height 33.6
18–34 years 771,114 General obstetrical risks 28.4 Inappropriate growth or weight gain pattern 54.9 Inappropriate nutrition practices 35.4 Prepregnancy high weight-for-height 55.2
35 Years or Older 85,635 General obstetrical risks 28.2 Inappropriate growth or weight gain pattern 54.6 Inappropriate nutrition practices 37.3 Nutrition-related risk conditions 17.9 Prepregnancy high weight-for-height 68.8
Not Reported 1,710
Pregnant Women 896,551 Notes
These figures represent 15% or more of all pregnant WIC participants in each age group.

WIC Participant and Program Characteristics: 2014 Final Report
Page 71
Table IV.11. Number and Percent of American Indian or Alaska Native Only WIC Participants With Specific Nutritional Risks Reported
By Participant Category
Broad Risk Category and Specific Nutritional Risk
Pregnant Women
Breastfeeding Women
Postpartum Women
Total Women
Infants
Children
Total WIC
Number % Number % Number % Number % Number % Number % Number % Participants in Category 98,857
76,204
53,695 228,756
193,678
610,215 1,032,650
Anthropometric 78,080 79.0 47,995 63.0 34,082 63.5 160,156 70.0 67,513 34.9 269,033 44.1 496,703 48.1
Low weight-for-height 2,932 3.0 1,185 1.6 1,368 2.5 5,485 2.4 11,919 6.2 27,339 4.5 44,743 4.3 High weight-for-height/lengtha 54,599 55.2 42,643 56.0 29,372 54.7 126,613 55.3 25,035 12.9 195,724 32.1 347,372 33.6 Short stature 1 0.0 0 0.0 0 0.0 1 0.0 16,147 8.3 50,139 8.2 66,287 6.4 Inappropriate growth or weight
gain pattern 59,259 59.9
18,773 24.6
13,077 24.4
91,110 39.8
2,995 1.5
8,068 1.3
102,173 9.9 Low birth weight or premature
birth 0 0.0
0 0.0
0 0.0
0 0.0
20,506 10.6
8,968 1.5
29,474 2.9 Other anthropometric risk 2 0.0 0 0.0 1 0.0 3 0.0 13,133 6.8 697 0.1 13,832 1.3
Biochemical 6,220 6.3 21,099 27.7 15,346 28.6 42,665 18.7 1,952 1.0 44,148 7.2 88,765 8.6 Hematocrit or hemoglobin below
FNS criteria 6,215 6.3
21,096 27.7
15,345 28.6
42,656 18.6
1,950 1.0
44,071 7.2
88,677 8.6 Other biochemical test results
that indicate nutritional abnormality 6 0.0
4 0.0
4 0.0
14 0.0
2 0.0
92 0.0
108 0.0
Clinical, Health, Medical 45,115 45.6 30,064 39.5 25,730 47.9 100,909 44.1 8,764 4.5 48,192 7.9 157,865 15.3 Pregnancy-induced conditions 7,557 7.6 5,608 7.4 3,363 6.3 16,528 7.2 0 0.0 0 0.0 16,528 1.6 Delivery of low birth weight or
premature infant 1,741 1.8
2,715 3.6
2,057 3.8
6,512 2.8
0 0.0
0 0.0
6,512 0.6 Prior stillbirth, fetal, or neonatal
death 2,978 3.0
795 1.0
1,793 3.3
5,567 2.4
0 0.0
0 0.0
5,567 0.5 General obstetrical risks 28,878 29.2 14,989 19.7 12,385 23.1 56,251 24.6 0 0.0 0 0.0 56,251 5.4 Nutrition-related risk conditions 7,503 7.6 10,729 14.1 10,424 19.4 28,656 12.5 8,566 4.4 31,775 5.2 68,997 6.7 Substance abuse 8,078 8.2 878 1.2 2,134 4.0 11,090 4.8 1 0.0 4 0.0 11,095 1.1 Other health risks 961 1.0 670 0.9 428 0.8 2,058 0.9 210 0.1 17,539 2.9 19,808 1.9
Dietary 67,950 68.7 49,352 64.8 33,612 62.6 150,913 66.0 69,552 35.9 509,455 83.5 729,920 70.7 Failure to meet Dietary
Guidelines for Americans 11,780 11.9
7,979 10.5
6,667 12.4
26,425 11.6
170 0.1
66,357 10.9
92,952 9.0 Inappropriate nutrition practices 57,216 57.9 41,969 55.1 27,293 50.8 126,478 55.3 69,392 35.8 453,382 74.3 649,253 62.9

WIC Participant and Program Characteristics: 2014 Final Report
Page 72
Table IV.11. (continued) Number and Percent of American Indian or Alaska Native Only WIC Participants With Specific Nutritional Risks Reported
By Participant Category
Broad Risk Category and Specific Nutritional Risk
Pregnant Women
Breastfeeding Women
Postpartum Women
Total Women
Infants
Children
Total WIC
Number % Number % Number % Number % Number % Number % Number % Other Risk 6,818 6.9 55,611 73.0 2,924 5.4 65,353 28.6 173,116 89.4 27,022 4.4 265,490 25.7
Regression/Transfer/ Presumptive eligibility 3,015 3.0
447 0.6
442 0.8
3,904 1.7
2,629 1.4
7,523 1.2
14,056 1.4
Breastfeeding mother and infant dyad 27 0.0
54,813 71.9
746 1.4
55,586 24.3
3,931 2.0
24 0.0
59,541 5.8
Infant of a WIC-eligible mother or mother at risk during pregnancy 0 0.0
0 0.0
0 0.0
0 0.0
168,780 87.1
569 0.1
169,349 16.4 Homelessness/migrancy 375 0.4 193 0.3 158 0.3 726 0.3 440 0.2 1,163 0.2 2,329 0.2 Other nutritional risks 3,600 3.6 1,069 1.4 1,622 3.0 6,291 2.7 4,394 2.3 17,953 2.9 28,638 2.8
No Risk Reported 101 0.1 66 0.1 62 0.1 229 0.1 121 0.1 802 0.1 1,152 0.1
Notes
An infant is defined as a participant who at certification is younger than 1 year of age and would be classified as a child at the age of 366 days.
In 2014, State agencies could report up to 10 nutritional risks for each participant. This table examines all risks reported for every participant. When multiple risks (or risk criteria) within the same risk category are reported for one person, these risks are combined and counted one time to accurately calculate the number and percent of WIC participants with a specific risk or broad risk category.
This table reports information on persons having origins in any of the original peoples of North America who maintain cultural identification through tribal affiliation or community recognition (includes Aleuts and Eskimos). a Starting in PC2014, for infants and 1-year-old children, this risk reflects infant/child length and weight measurements and parental (biological) obesity. Prior to 2014, this risk only reflected parental (biological) obesity.

WIC Participant and Program Characteristics: 2014 Final Report
Page 73
Table IV.12. Number and Percent of Asian Only WIC Participants With Specific Nutritional Risks Reported by Participant Category
Broad Risk Category and Specific Nutritional Risk
Pregnant Women
Breastfeeding Women
Postpartum Women
Total Women
Infants
Children
Total WIC
Number % Number % Number % Number % Number % Number % Number % Participants in Category 30,448
30,192
18,394 79,034
67,330
162,895 309,259
Anthropometric 20,807 68.3 14,395 47.7 8,675 47.2 43,876 55.5 23,205 34.5 62,206 38.2 129,288 41.8
Low weight-for-height 2,891 9.5 2,096 6.9 1,114 6.1 6,101 7.7 6,246 9.3 12,737 7.8 25,085 8.1 High weight-for-height/lengtha 8,887 29.2 8,710 28.8 5,397 29.3 22,993 29.1 5,961 8.9 30,342 18.6 59,296 19.2 Short stature 1 0.0 0 0.0 0 0.0 1 0.0 5,699 8.5 16,361 10.0 22,061 7.1 Inappropriate growth or weight
gain pattern 15,555 51.1
7,263 24.1
4,318 23.5
27,135 34.3
965 1.4
5,195 3.2
33,295 10.8 Low birth weight or premature
birth 0 0.0
0 0.0
0 0.0
0 0.0
8,373 12.4
5,912 3.6
14,285 4.6 Other anthropometric risk 0 0.0 0 0.0 0 0.0 0 0.0 2,640 3.9 279 0.2 2,919 0.9
Biochemical 2,566 8.4 9,101 30.1 6,211 33.8 17,878 22.6 667 1.0 16,062 9.9 34,607 11.2 Hematocrit or hemoglobin below
FNS criteria 2,563 8.4
9,098 30.1
6,210 33.8
17,871 22.6
667 1.0
15,988 9.8
34,526 11.2 Other biochemical test results
that indicate nutritional abnormality 3 0.0
5 0.0
3 0.0
11 0.0
1 0.0
96 0.1
108 0.0
Clinical, Health, Medical 13,888 45.6 13,186 43.7 8,735 47.5 35,809 45.3 1,770 2.6 17,308 10.6 54,887 17.7 Pregnancy-induced conditions 2,516 8.3 2,754 9.1 1,544 8.4 6,814 8.6 0 0.0 0 0.0 6,814 2.2 Delivery of low birth weight or
premature infant 1,016 3.3
2,455 8.1
1,448 7.9
4,919 6.2
0 0.0
0 0.0
4,919 1.6 Prior stillbirth, fetal, or neonatal
death 840 2.8
122 0.4
299 1.6
1,260 1.6
0 0.0
0 0.0
1,260 0.4 General obstetrical risks 8,351 27.4 5,348 17.7 4,043 22.0 17,742 22.4 0 0.0 0 0.0 17,742 5.7 Nutrition-related risk conditions 3,311 10.9 5,697 18.9 3,434 18.7 12,442 15.7 1,731 2.6 13,549 8.3 27,722 9.0 Substance abuse 926 3.0 152 0.5 304 1.7 1,382 1.7 10 0.0 5 0.0 1,397 0.5 Other health risks 786 2.6 518 1.7 267 1.5 1,571 2.0 33 0.0 4,298 2.6 5,902 1.9
Dietary 18,674 61.3 15,694 52.0 11,206 60.9 45,574 57.7 21,144 31.4 137,310 84.3 204,028 66.0 Failure to meet Dietary
Guidelines for Americans 3,950 13.0
3,032 10.0
2,739 14.9
9,721 12.3
243 0.4
21,701 13.3
31,665 10.2 Inappropriate nutrition practices 15,012 49.3 12,921 42.8 8,590 46.7 36,523 46.2 20,920 31.1 117,887 72.4 175,331 56.7
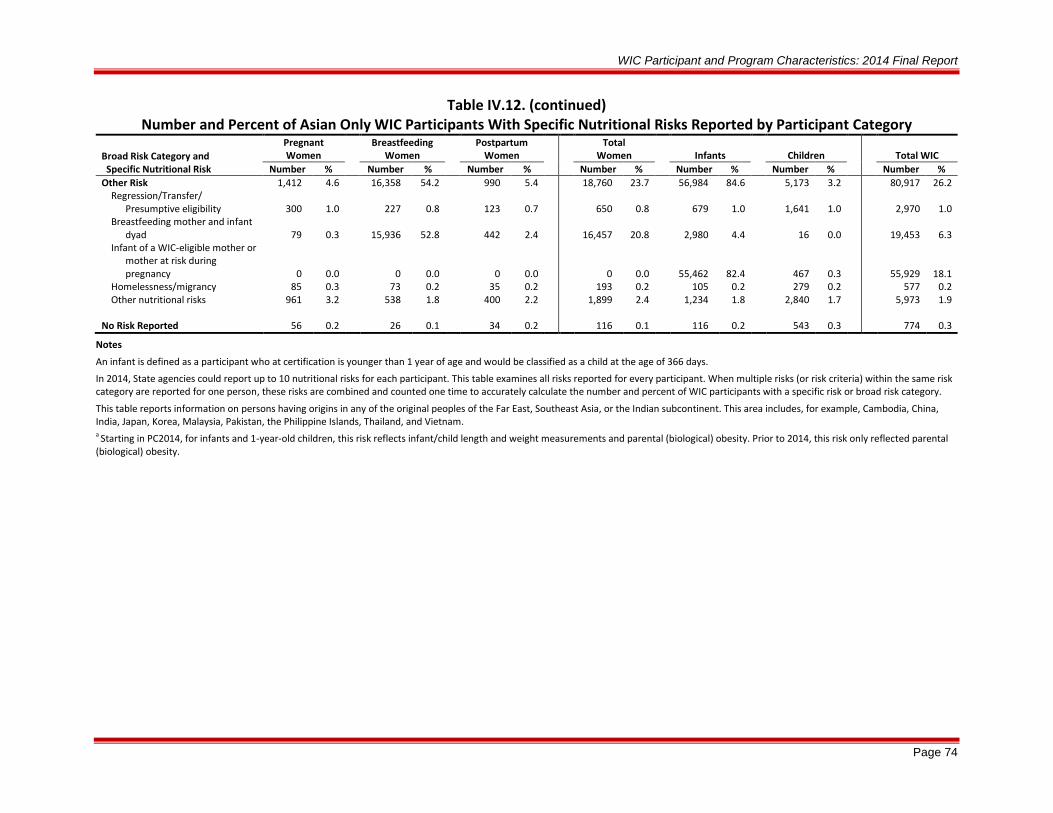
WIC Participant and Program Characteristics: 2014 Final Report
Page 74
Table IV.12. (continued) Number and Percent of Asian Only WIC Participants With Specific Nutritional Risks Reported by Participant Category
Broad Risk Category and Specific Nutritional Risk
Pregnant Women
Breastfeeding Women
Postpartum Women
Total Women
Infants
Children
Total WIC
Number % Number % Number % Number % Number % Number % Number % Other Risk 1,412 4.6 16,358 54.2 990 5.4 18,760 23.7 56,984 84.6 5,173 3.2 80,917 26.2
Regression/Transfer/ Presumptive eligibility 300 1.0
227 0.8
123 0.7
650 0.8
679 1.0
1,641 1.0
2,970 1.0
Breastfeeding mother and infant dyad 79 0.3
15,936 52.8
442 2.4
16,457 20.8
2,980 4.4
16 0.0
19,453 6.3
Infant of a WIC-eligible mother or mother at risk during pregnancy 0 0.0
0 0.0
0 0.0
0 0.0
55,462 82.4
467 0.3
55,929 18.1 Homelessness/migrancy 85 0.3 73 0.2 35 0.2 193 0.2 105 0.2 279 0.2 577 0.2 Other nutritional risks 961 3.2 538 1.8 400 2.2 1,899 2.4 1,234 1.8 2,840 1.7 5,973 1.9
No Risk Reported 56 0.2 26 0.1 34 0.2 116 0.1 116 0.2 543 0.3 774 0.3
Notes
An infant is defined as a participant who at certification is younger than 1 year of age and would be classified as a child at the age of 366 days.
In 2014, State agencies could report up to 10 nutritional risks for each participant. This table examines all risks reported for every participant. When multiple risks (or risk criteria) within the same risk category are reported for one person, these risks are combined and counted one time to accurately calculate the number and percent of WIC participants with a specific risk or broad risk category.
This table reports information on persons having origins in any of the original peoples of the Far East, Southeast Asia, or the Indian subcontinent. This area includes, for example, Cambodia, China, India, Japan, Korea, Malaysia, Pakistan, the Philippine Islands, Thailand, and Vietnam. a Starting in PC2014, for infants and 1-year-old children, this risk reflects infant/child length and weight measurements and parental (biological) obesity. Prior to 2014, this risk only reflected parental (biological) obesity.

WIC Participant and Program Characteristics: 2014 Final Report
Page 75
Table IV.13. Number and Percent of Black or African American Only WIC Participants With Specific Nutritional Risks Reported
By Participant Category
Broad Risk Category and Specific Nutritional Risk
Pregnant Women
Breastfeeding Women
Postpartum Women
Total Women
Infants
Children
Total WIC
Number % Number % Number % Number % Number % Number % Number % Participants in Category 176,086
122,584
152,655 451,325
480,234
960,594 1,892,154
Anthropometric 143,626 81.6 89,407 72.9 110,145 72.2 343,178 76.0 218,011 45.4 401,145 41.8 962,334 50.9
Low weight-for-height 6,604 3.8 3,521 2.9 5,344 3.5 15,469 3.4 47,622 9.9 61,458 6.4 124,549 6.6 High weight-for-
height/lengtha 106,111 60.3
73,227 59.7
88,553 58.0
267,891 59.4
72,575 15.1
238,548 24.8
579,013 30.6 Short stature 0 0.0 1 0.0 1 0.0 2 0.0 57,390 12.0 63,134 6.6 120,526 6.4 Inappropriate growth or
weight gain pattern 94,056 53.4
47,783 39.0
55,739 36.5
197,577 43.8
7,965 1.7
31,148 3.2
236,690 12.5 Low birth weight or
premature birth 0 0.0
0 0.0
0 0.0
0 0.0
88,709 18.5
61,340 6.4
150,049 7.9 Other anthropometric risk 0 0.0 0 0.0 0 0.0 0 0.0 24,172 5.0 2,385 0.2 26,557 1.4
Biochemical 35,027 19.9 53,601 43.7 75,611 49.5 164,239 36.4 5,123 1.1 192,783 20.1 362,144 19.1 Hematocrit or hemoglobin
below FNS criteria 35,012 19.9
53,591 43.7
75,597 49.5
164,199 36.4
5,113 1.1
192,090 20.0
361,402 19.1 Other biochemical test
results that indicate nutritional abnormality 21 0.0
20 0.0
25 0.0
67 0.0
10 0.0
881 0.1
957 0.1
Clinical, Health, Medical 93,114 52.9 64,740 52.8 87,267 57.2 245,121 54.3 21,067 4.4 91,407 9.5 357,595 18.9 Pregnancy-induced
conditions 11,933 6.8
8,356 6.8
9,333 6.1
29,621 6.6
0 0.0
0 0.0
29,621 1.6 Delivery of low birth weight
or premature infant 14,087 8.0
16,907 13.8
21,490 14.1
52,485 11.6
0 0.0
0 0.0
52,485 2.8 Prior stillbirth, fetal, or
neonatal death 10,117 5.7
927 0.8
2,946 1.9
13,990 3.1
0 0.0
0 0.0
13,990 0.7 General obstetrical risks 52,821 30.0 26,156 21.3 35,161 23.0 114,138 25.3 0 0.0 0 0.0 114,138 6.0 Nutrition-related risk
conditions 22,958 13.0
32,505 26.5
40,437 26.5
95,901 21.2
20,404 4.2
81,271 8.5
197,576 10.4 Substance abuse 14,795 8.4 2,961 2.4 12,447 8.2 30,203 6.7 397 0.1 752 0.1 31,352 1.7 Other health risks 5,368 3.0 2,710 2.2 3,168 2.1 11,245 2.5 330 0.1 11,035 1.1 22,611 1.2
Dietary 68,117 38.7 38,576 31.5 54,846 35.9 161,539 35.8 155,742 32.4 703,224 73.2 1,020,505 53.9 Failure to meet Dietary
Guidelines for Americans 13,512 7.7
8,097 6.6
11,198 7.3
32,806 7.3
6,390 1.3
152,375 15.9
191,571 10.1 Inappropriate nutrition
practices 55,777 31.7
31,236 25.5
44,774 29.3
131,787 29.2
150,491 31.3
572,673 59.6
854,951 45.2

WIC Participant and Program Characteristics: 2014 Final Report
Page 76
Table IV.13. (continued) Number and Percent of Black or African American Only WIC Participants With Specific Nutritional Risks Reported
By Participant Category
Broad Risk Category and Specific Nutritional Risk
Pregnant Women
Breastfeeding Women
Postpartum Women
Total Women
Infants
Children
Total WIC
Number % Number % Number % Number % Number % Number % Number % Other Risk 17,556 10.0 55,821 45.5 13,456 8.8 86,833 19.2 396,098 82.5 66,851 7.0 549,782 29.1
Regression/Transfer/ Presumptive eligibility 1,844 1.0
913 0.7
1,265 0.8
4,021 0.9
6,399 1.3
13,894 1.4
24,313 1.3
Breastfeeding mother and infant dyad 625 0.4
53,470 43.6
4,029 2.6
58,124 12.9
22,106 4.6
109 0.0
80,339 4.2
Infant of a WIC-eligible mother or mother at risk during pregnancy 0 0.0
0 0.0
0 0.0
0 0.0
380,054 79.1
4,611 0.5
384,665 20.3 Homelessness/migrancy 803 0.5 396 0.3 493 0.3 1,693 0.4 1,280 0.3 2,559 0.3 5,532 0.3 Other nutritional risks 14,540 8.3 2,918 2.4 7,981 5.2 25,439 5.6 22,911 4.8 46,624 4.9 94,975 5.0
No Risk Reported 234 0.1 105 0.1 246 0.2 585 0.1 1,437 0.3 4,147 0.4 6,169 0.3
Notes
An infant is defined as a participant who at certification is younger than 1 year of age and would be classified as a child at the age of 366 days.
In 2014, State agencies could report up to 10 nutritional risks for each participant. This table examines all risks reported for every participant. When multiple risks (or risk criteria) within the same risk category are reported for one person, these risks are combined and counted one time to accurately calculate the number and percent of WIC participants with a specific risk or broad risk category.
This table reports information on persons having origins in any of the Black racial groups of Africa. a Starting in PC2014, for infants and 1-year-old children, this risk reflects infant/child length and weight measurements and parental (biological) obesity. Prior to 2014, this risk only reflected parental (biological) obesity.
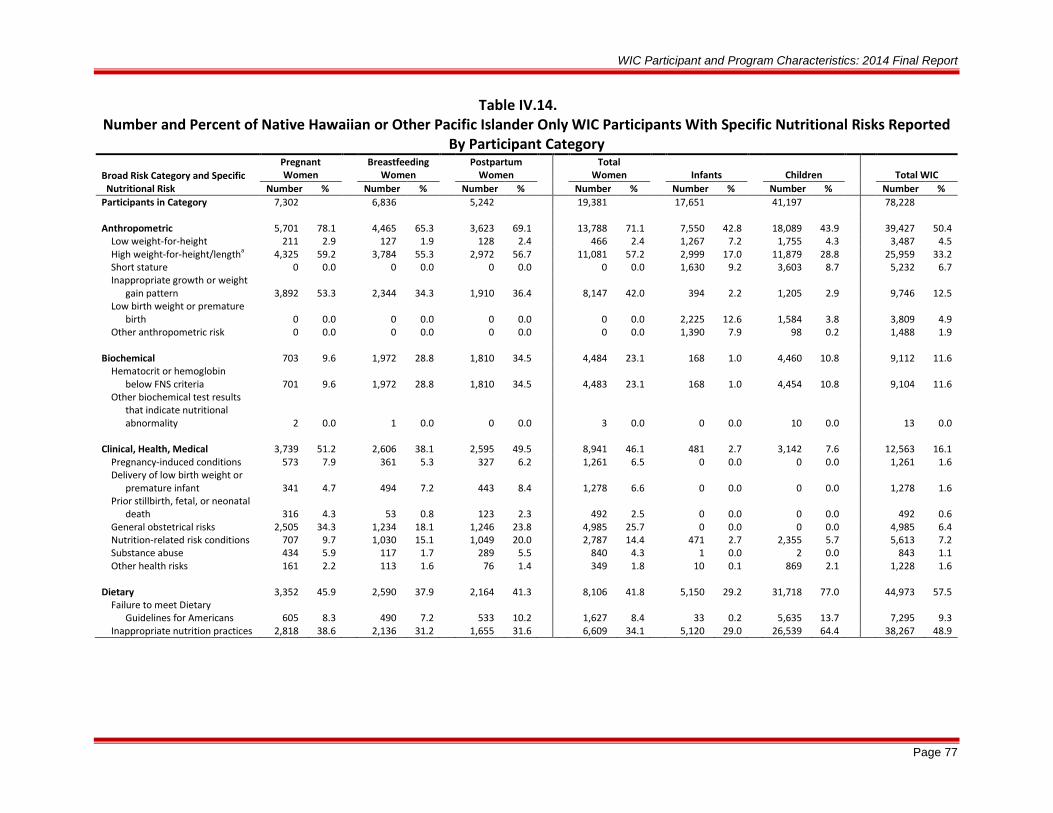
WIC Participant and Program Characteristics: 2014 Final Report
Page 77
Table IV.14. Number and Percent of Native Hawaiian or Other Pacific Islander Only WIC Participants With Specific Nutritional Risks Reported
By Participant Category
Broad Risk Category and Specific Nutritional Risk
Pregnant Women
Breastfeeding Women
Postpartum Women
Total Women
Infants
Children
Total WIC
Number % Number % Number % Number % Number % Number % Number % Participants in Category 7,302
6,836
5,242 19,381
17,651
41,197 78,228
Anthropometric 5,701 78.1 4,465 65.3 3,623 69.1 13,788 71.1 7,550 42.8 18,089 43.9 39,427 50.4
Low weight-for-height 211 2.9 127 1.9 128 2.4 466 2.4 1,267 7.2 1,755 4.3 3,487 4.5 High weight-for-height/lengtha 4,325 59.2 3,784 55.3 2,972 56.7 11,081 57.2 2,999 17.0 11,879 28.8 25,959 33.2 Short stature 0 0.0 0 0.0 0 0.0 0 0.0 1,630 9.2 3,603 8.7 5,232 6.7 Inappropriate growth or weight
gain pattern 3,892 53.3
2,344 34.3
1,910 36.4
8,147 42.0
394 2.2
1,205 2.9
9,746 12.5 Low birth weight or premature
birth 0 0.0
0 0.0
0 0.0
0 0.0
2,225 12.6
1,584 3.8
3,809 4.9 Other anthropometric risk 0 0.0 0 0.0 0 0.0 0 0.0 1,390 7.9 98 0.2 1,488 1.9
Biochemical 703 9.6 1,972 28.8 1,810 34.5 4,484 23.1 168 1.0 4,460 10.8 9,112 11.6 Hematocrit or hemoglobin
below FNS criteria 701 9.6
1,972 28.8
1,810 34.5
4,483 23.1
168 1.0
4,454 10.8
9,104 11.6 Other biochemical test results
that indicate nutritional abnormality 2 0.0
1 0.0
0 0.0
3 0.0
0 0.0
10 0.0
13 0.0
Clinical, Health, Medical 3,739 51.2 2,606 38.1 2,595 49.5 8,941 46.1 481 2.7 3,142 7.6 12,563 16.1 Pregnancy-induced conditions 573 7.9 361 5.3 327 6.2 1,261 6.5 0 0.0 0 0.0 1,261 1.6 Delivery of low birth weight or
premature infant 341 4.7
494 7.2
443 8.4
1,278 6.6
0 0.0
0 0.0
1,278 1.6 Prior stillbirth, fetal, or neonatal
death 316 4.3
53 0.8
123 2.3
492 2.5
0 0.0
0 0.0
492 0.6 General obstetrical risks 2,505 34.3 1,234 18.1 1,246 23.8 4,985 25.7 0 0.0 0 0.0 4,985 6.4 Nutrition-related risk conditions 707 9.7 1,030 15.1 1,049 20.0 2,787 14.4 471 2.7 2,355 5.7 5,613 7.2 Substance abuse 434 5.9 117 1.7 289 5.5 840 4.3 1 0.0 2 0.0 843 1.1 Other health risks 161 2.2 113 1.6 76 1.4 349 1.8 10 0.1 869 2.1 1,228 1.6
Dietary 3,352 45.9 2,590 37.9 2,164 41.3 8,106 41.8 5,150 29.2 31,718 77.0 44,973 57.5 Failure to meet Dietary
Guidelines for Americans 605 8.3
490 7.2
533 10.2
1,627 8.4
33 0.2
5,635 13.7
7,295 9.3 Inappropriate nutrition practices 2,818 38.6 2,136 31.2 1,655 31.6 6,609 34.1 5,120 29.0 26,539 64.4 38,267 48.9

WIC Participant and Program Characteristics: 2014 Final Report
Page 78
Table IV.14. (continued) Number and Percent of Native Hawaiian or Other Pacific Islander Only WIC Participants With Specific Nutritional Risks Reported
By Participant Category
Broad Risk Category and Specific Nutritional Risk
Pregnant Women
Breastfeeding Women
Postpartum Women
Total Women
Infants
Children
Total WIC
Number % Number % Number % Number % Number % Number % Number % Other Risk 524 7.2 3,132 45.8 342 6.5 3,998 20.6 14,575 82.6 2,012 4.9 20,585 26.3
Regression/Transfer/ Presumptive eligibility 139 1.9
49 0.7
62 1.2
250 1.3
272 1.5
514 1.2
1,035 1.3
Breastfeeding mother and infant dyad 11 0.2
2,983 43.6
92 1.8
3,086 15.9
491 2.8
5 0.0
3,582 4.6
Infant of a WIC-eligible mother or mother at risk during pregnancy 0 0.0
0 0.0
0 0.0
0 0.0
14,118 80.0
133 0.3
14,251 18.2 Homelessness/migrancy 46 0.6 30 0.4 23 0.4 99 0.5 67 0.4 158 0.4 324 0.4 Other nutritional risks 333 4.6 167 2.4 170 3.2 670 3.5 447 2.5 1,235 3.0 2,352 3.0
No Risk Reported 13 0.2 12 0.2 6 0.1 31 0.2 21 0.1 130 0.3 182 0.2
Notes
An infant is defined as a participant who at certification is younger than 1 year of age and would be classified as a child at the age of 366 days.
In 2014, State agencies could report up to 10 nutritional risks for each participant. This table examines all risks reported for every participant. When multiple risks (or risk criteria) within the same risk category are reported for one person, these risks are combined and counted one time to accurately calculate the number and percent of WIC participants with a specific risk or broad risk category.
This table reports information on persons having origins in any of the original peoples of Hawaii, Guam, Samoa, or other Pacific Islands. a Starting in PC2014, for infants and 1-year-old children, this risk reflects infant/child length and weight measurements and parental (biological) obesity. Prior to 2014, this risk only reflected parental (biological) obesity.
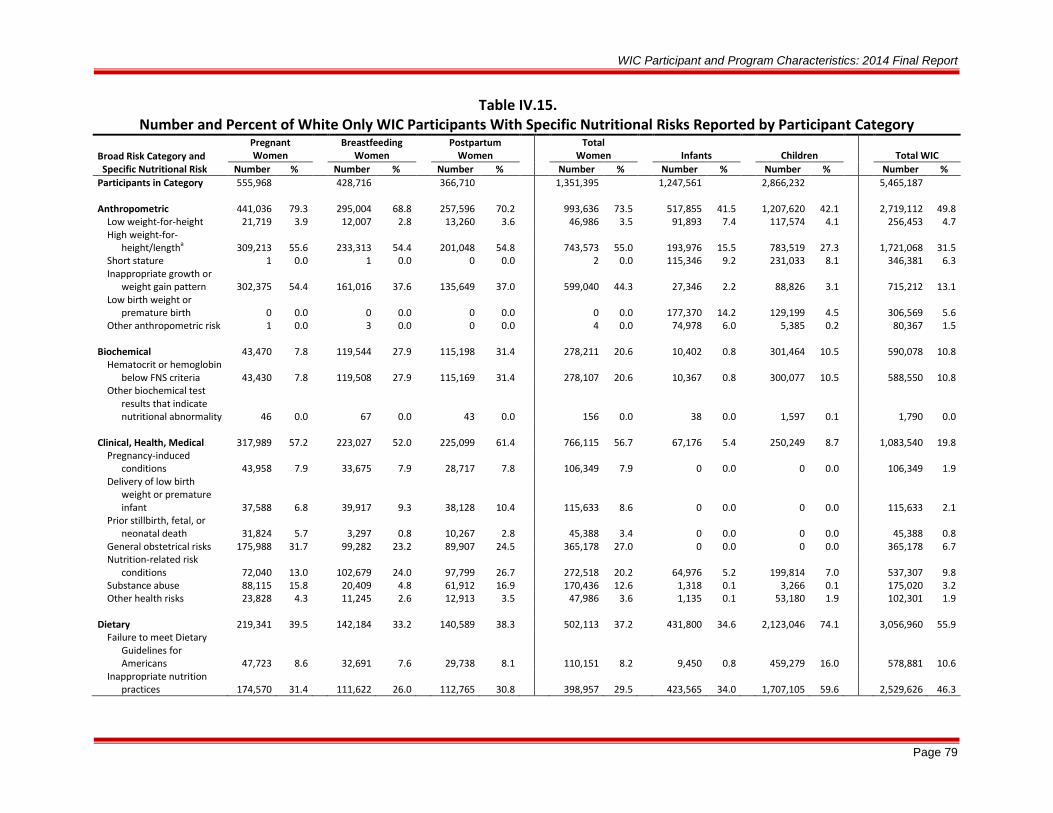
WIC Participant and Program Characteristics: 2014 Final Report
Page 79
Table IV.15. Number and Percent of White Only WIC Participants With Specific Nutritional Risks Reported by Participant Category
Broad Risk Category and Specific Nutritional Risk
Pregnant Women
Breastfeeding Women
Postpartum Women
Total Women
Infants
Children
Total WIC
Number % Number % Number % Number % Number % Number % Number % Participants in Category 555,968
428,716
366,710 1,351,395
1,247,561
2,866,232 5,465,187
Anthropometric 441,036 79.3 295,004 68.8 257,596 70.2 993,636 73.5 517,855 41.5 1,207,620 42.1 2,719,112 49.8
Low weight-for-height 21,719 3.9 12,007 2.8 13,260 3.6 46,986 3.5 91,893 7.4 117,574 4.1 256,453 4.7 High weight-for-
height/lengtha 309,213 55.6
233,313 54.4
201,048 54.8
743,573 55.0
193,976 15.5
783,519 27.3
1,721,068 31.5 Short stature 1 0.0 1 0.0 0 0.0 2 0.0 115,346 9.2 231,033 8.1 346,381 6.3 Inappropriate growth or
weight gain pattern 302,375 54.4
161,016 37.6
135,649 37.0
599,040 44.3
27,346 2.2
88,826 3.1
715,212 13.1 Low birth weight or
premature birth 0 0.0
0 0.0
0 0.0
0 0.0
177,370 14.2
129,199 4.5
306,569 5.6 Other anthropometric risk 1 0.0 3 0.0 0 0.0 4 0.0 74,978 6.0 5,385 0.2 80,367 1.5
Biochemical 43,470 7.8 119,544 27.9 115,198 31.4 278,211 20.6 10,402 0.8 301,464 10.5 590,078 10.8 Hematocrit or hemoglobin
below FNS criteria 43,430 7.8
119,508 27.9
115,169 31.4
278,107 20.6
10,367 0.8
300,077 10.5
588,550 10.8 Other biochemical test
results that indicate nutritional abnormality 46 0.0
67 0.0
43 0.0
156 0.0
38 0.0
1,597 0.1
1,790 0.0
Clinical, Health, Medical 317,989 57.2 223,027 52.0 225,099 61.4 766,115 56.7 67,176 5.4 250,249 8.7 1,083,540 19.8 Pregnancy-induced
conditions 43,958 7.9
33,675 7.9
28,717 7.8
106,349 7.9
0 0.0
0 0.0
106,349 1.9 Delivery of low birth
weight or premature infant 37,588 6.8
39,917 9.3
38,128 10.4
115,633 8.6
0 0.0
0 0.0
115,633 2.1 Prior stillbirth, fetal, or
neonatal death 31,824 5.7
3,297 0.8
10,267 2.8
45,388 3.4
0 0.0
0 0.0
45,388 0.8 General obstetrical risks 175,988 31.7 99,282 23.2 89,907 24.5 365,178 27.0 0 0.0 0 0.0 365,178 6.7 Nutrition-related risk
conditions 72,040 13.0
102,679 24.0
97,799 26.7
272,518 20.2
64,976 5.2
199,814 7.0
537,307 9.8 Substance abuse 88,115 15.8 20,409 4.8 61,912 16.9 170,436 12.6 1,318 0.1 3,266 0.1 175,020 3.2 Other health risks 23,828 4.3 11,245 2.6 12,913 3.5 47,986 3.6 1,135 0.1 53,180 1.9 102,301 1.9
Dietary 219,341 39.5 142,184 33.2 140,589 38.3 502,113 37.2 431,800 34.6 2,123,046 74.1 3,056,960 55.9 Failure to meet Dietary
Guidelines for Americans 47,723 8.6
32,691 7.6
29,738 8.1
110,151 8.2
9,450 0.8
459,279 16.0
578,881 10.6 Inappropriate nutrition
practices 174,570 31.4
111,622 26.0
112,765 30.8
398,957 29.5
423,565 34.0
1,707,105 59.6
2,529,626 46.3

WIC Participant and Program Characteristics: 2014 Final Report
Page 80
Table IV.15. (continued) Number and Percent of White Only WIC Participants With Specific Nutritional Risks Reported by Participant Category
Broad Risk Category and Specific Nutritional Risk
Pregnant Women
Breastfeeding Women
Postpartum Women
Total Women
Infants
Children
Total WIC
Number % Number % Number % Number % Number % Number % Number % Other Risk 62,468 11.2 199,571 46.6 43,177 11.8 305,216 22.6 1,066,146 85.5 207,524 7.2 1,578,886 28.9
Regression/Transfer/ Presumptive eligibility 6,884 1.2
3,467 0.8
3,711 1.0
14,061 1.0
17,677 1.4
47,432 1.7
79,169 1.4
Breastfeeding mother and infant dyad 1,863 0.3
190,052 44.3
13,741 3.7
205,656 15.2
83,281 6.7
315 0.0
289,252 5.3
Infant of a WIC-eligible mother or mother at risk during pregnancy 0 0.0
0 0.0
0 0.0
0 0.0
1,018,328 81.6
7,703 0.3
1,026,031 18.8 Homelessness/migrancy 3,564 0.6 1,824 0.4 1,742 0.5 7,131 0.5 4,645 0.4 12,316 0.4 24,092 0.4 Other nutritional risks 51,096 9.2 11,560 2.7 25,066 6.8 87,722 6.5 70,107 5.6 142,169 5.0 299,998 5.5
No Risk Reported 744 0.1 407 0.1 619 0.2 1,771 0.1 3,424 0.3 10,485 0.4 15,680 0.3
Notes
An infant is defined as a participant who at certification is younger than 1 year of age and would be classified as a child at the age of 366 days.
In 2014, State agencies could report up to 10 nutritional risks for each participant. This table examines all risks reported for every participant. When multiple risks (or risk criteria) within the same risk category are reported for one person, these risks are combined and counted one time to accurately calculate the number and percent of WIC participants with a specific risk or broad risk category.
This table reports information on persons having origins in any of the original peoples of Europe, North Africa, or the Middle East. a Starting in PC2014, for infants and 1-year-old children, this risk reflects infant/child length and weight measurements and parental (biological) obesity. Prior to 2014, this risk only reflected parental (biological) obesity.

WIC Participant and Program Characteristics: 2014 Final Report
Page 81
Table IV.16. Number and Percent of WIC Participants With Two or More Races Reported and With Specific Nutritional Risks Reported
By Participant Category
Broad Risk Category and Specific Nutritional Risk
Pregnant Women
Breastfeeding Women
Postpartum Women
Total Women
Infants
Children
Total WIC
Number % Number % Number % Number % Number % Number % Number % Participants in Category 26,405
21,733
17,809 65,947
129,955
310,368 506,271
Anthropometric 21,475 81.3 14,603 67.2 12,292 69.0 48,369 73.3 52,978 40.8 126,587 40.8 227,933 45.0
Low weight-for-height 956 3.6 491 2.3 518 2.9 1,964 3.0 8,475 6.5 14,038 4.5 24,477 4.8 High weight-for-height/lengtha 14,569 55.2 11,578 53.3 9,681 54.4 35,828 54.3 20,187 15.5 82,641 26.6 138,657 27.4 Short stature 0 0.0 0 0.0 0 0.0 0 0.0 12,943 10.0 23,226 7.5 36,169 7.1 Inappropriate growth or weight
gain pattern 16,351 61.9
7,950 36.6
6,592 37.0
30,892 46.8
2,840 2.2
8,996 2.9
42,728 8.4 Low birth weight or premature
birth 0 0.0
0 0.0
0 0.0
0 0.0
18,325 14.1
11,788 3.8
30,114 5.9 Other anthropometric risk 0 0.0 2 0.0 1 0.0 3 0.0 7,650 5.9 450 0.1 8,104 1.6
Biochemical 2,376 9.0 6,153 28.3 5,998 33.7 14,527 22.0 1,294 1.0 33,404 10.8 49,225 9.7 Hematocrit or hemoglobin
below FNS criteria 2,375 9.0
6,153 28.3
5,997 33.7
14,525 22.0
1,291 1.0
33,226 10.7
49,042 9.7 Other biochemical test results
that indicate nutritional abnormality 1 0.0
0 0.0
2 0.0
3 0.0
3 0.0
212 0.1
218 0.0
Clinical, Health, Medical 15,812 59.9 10,158 46.7 10,376 58.3 36,345 55.1 7,066 5.4 29,048 9.4 72,459 14.3 Pregnancy-induced conditions 2,322 8.8 1,580 7.3 1,285 7.2 5,187 7.9 0 0.0 0 0.0 5,187 1.0 Delivery of low birth weight or
premature infant 1,302 4.9
1,411 6.5
1,483 8.3
4,196 6.4
0 0.0
0 0.0
4,196 0.8 Prior stillbirth, fetal, or neonatal
death 1,366 5.2
162 0.7
478 2.7
2,006 3.0
0 0.0
0 0.0
2,006 0.4 General obstetrical risks 9,381 35.5 4,977 22.9 5,079 28.5 19,436 29.5 0 0.0 0 0.0 19,436 3.8 Nutrition-related risk conditions 3,489 13.2 4,034 18.6 3,894 21.9 11,418 17.3 6,714 5.2 23,061 7.4 41,192 8.1 Substance abuse 4,778 18.1 1,047 4.8 2,604 14.6 8,429 12.8 145 0.1 416 0.1 8,990 1.8 Other health risks 811 3.1 395 1.8 402 2.3 1,608 2.4 257 0.2 6,299 2.0 8,164 1.6
Dietary 14,608 55.3 11,094 51.0 9,146 51.4 34,847 52.8 46,378 35.7 252,365 81.3 333,590 65.9 Failure to meet Dietary
Guidelines for Americans 2,334 8.8
2,140 9.8
1,769 9.9
6,243 9.5
1,191 0.9
44,797 14.4
52,231 10.3 Inappropriate nutrition practices 12,498 47.3 9,112 41.9 7,505 42.1 29,115 44.1 45,340 34.9 212,421 68.4 286,875 56.7

WIC Participant and Program Characteristics: 2014 Final Report
Page 82
Table IV.16. (continued) Number and Percent of WIC Participants Reporting Two or More Races With Specific Nutritional Risks Reported
By Participant Category
Broad Risk Category and Specific Nutritional Risk
Pregnant Women
Breastfeeding Women
Postpartum Women
Total Women
Infants
Children
Total WIC
Number % Number % Number % Number % Number % Number % Number % Other Risk 2,862 10.8 14,314 65.9 1,723 9.7 18,899 28.7 113,035 87.0 21,681 7.0 153,615 30.3
Regression/Transfer/ Presumptive eligibility 375 1.4
154 0.7
148 0.8
676 1.0
1,838 1.4
4,174 1.3
6,688 1.3
Breastfeeding mother and infant dyad 42 0.2
14,003 64.4
551 3.1
14,596 22.1
5,356 4.1
25 0.0
19,977 3.9
Infant of a WIC-eligible mother or mother at risk during pregnancy 0 0.0
0 0.0
0 0.0
0 0.0
108,598 83.6
640 0.2
109,238 21.6 Homelessness/migrancy 284 1.1 106 0.5 110 0.6 500 0.8 596 0.5 1,091 0.4 2,187 0.4 Other nutritional risks 2,223 8.4 527 2.4 966 5.4 3,716 5.6 7,497 5.8 16,015 5.2 27,228 5.4
No Risk Reported 51 0.2 21 0.1 20 0.1 92 0.1 226 0.2 1,221 0.4 1,540 0.3
Notes
An infant is defined as a participant who at certification is younger than 1 year of age and would be classified as a child at the age of 366 days.
In 2014, State agencies could report up to 10 nutritional risks for each participant. This table examines all risks reported for every participant. When multiple risks (or risk criteria) within the same risk category are reported for one person, these risks are combined and counted one time to accurately calculate the number and percent of WIC participants with a specific risk or broad risk category.
This table reports information on persons reporting two or more races. a Starting in PC2014, for infants and 1-year-old children, this risk reflects infant/child length and weight measurements and parental (biological) obesity. Prior to 2014, this risk only reflected parental (biological) obesity.

WIC Participant and Program Characteristics: 2014 Final Report
Page 83
Table IV.17. Number and Percent of Hispanic/Latino WIC Participants With Specific Nutritional Risks Reported by Participant Category
Broad Risk Category and Specific Nutritional Risk
Pregnant Women
Breastfeeding Women
Postpartum Women
Total Women
Infants
Children
Total WIC
Number % Number % Number % Number % Number % Number % Number % Participants in Category 344,455
305,881
189,429 839,766
813,038
2,218,346 3,871,150
Anthropometric 280,250 81.4 208,228 68.1 128,857 68.0 617,335 73.5 306,686 37.7 952,618 42.9 1,876,639 48.5
Low weight-for-height 9,145 2.7 5,722 1.9 4,585 2.4 19,452 2.3 49,668 6.1 88,376 4.0 157,495 4.1 High weight-for-height/lengtha 200,415 58.2 177,944 58.2 108,398 57.2 486,757 58.0 119,531 14.7 658,075 29.7 1,264,363 32.7 Short stature 1 0.0 0 0.0 0 0.0 1 0.0 65,592 8.1 179,377 8.1 244,970 6.3 Inappropriate growth or weight
gain pattern 205,838 59.8
99,795 32.6
60,005 31.7
365,638 43.5
11,090 1.4
49,324 2.2
426,052 11.0 Low birth weight or premature
birth 0 0.0
0 0.0
0 0.0
0 0.0
103,497 12.7
68,287 3.1
171,784 4.4 Other anthropometric risk 0 0.0 0 0.0 0 0.0 0 0.0 46,793 5.8 2,778 0.1 49,572 1.3
Biochemical 25,763 7.5 97,274 31.8 60,761 32.1 183,798 21.9 5,562 0.7 223,146 10.1 412,506 10.7 Hematocrit or hemoglobin below
FNS criteria 25,736 7.5
97,247 31.8
60,751 32.1
183,735 21.9
5,547 0.7
222,480 10.0
411,761 10.6 Other biochemical test results that
indicate nutritional abnormality 27 0.0
54 0.0
17 0.0
99 0.0
17 0.0
799 0.0
914 0.0
Clinical, Health, Medical 163,239 47.4 144,254 47.2 96,156 50.8 403,649 48.1 30,932 3.8 162,990 7.3 597,571 15.4 Pregnancy-induced conditions 25,076 7.3 23,748 7.8 12,578 6.6 61,402 7.3 0 0.0 0 0.0 61,402 1.6 Delivery of low birth weight or
premature infant 15,446 4.5
25,345 8.3
14,054 7.4
54,845 6.5
0 0.0
0 0.0
54,845 1.4 Prior stillbirth, fetal, or neonatal
death 13,267 3.9
2,013 0.7
5,949 3.1
21,229 2.5
0 0.0
0 0.0
21,229 0.5 General obstetrical risks 105,465 30.6 67,237 22.0 47,039 24.8 219,742 26.2 0 0.0 0 0.0 219,742 5.7 Nutrition-related risk conditions 28,396 8.2 65,145 21.3 40,833 21.6 134,374 16.0 30,162 3.7 120,822 5.4 285,358 7.4 Substance abuse 18,244 5.3 2,155 0.7 5,042 2.7 25,442 3.0 116 0.0 165 0.0 25,723 0.7 Other health risks 6,602 1.9 5,289 1.7 2,599 1.4 14,490 1.7 735 0.1 45,350 2.0 60,575 1.6
Dietary 178,003 51.7 135,278 44.2 96,442 50.9 409,724 48.8 311,122 38.3 1,713,835 77.3 2,434,681 62.9 Failure to meet Dietary Guidelines
for Americans 33,971 9.9
24,960 8.2
19,428 10.3
78,359 9.3
5,261 0.6
330,202 14.9
413,822 10.7 Inappropriate nutrition practices 146,549 42.5 111,894 36.6 77,975 41.2 336,418 40.1 306,632 37.7 1,417,131 63.9 2,060,181 53.2
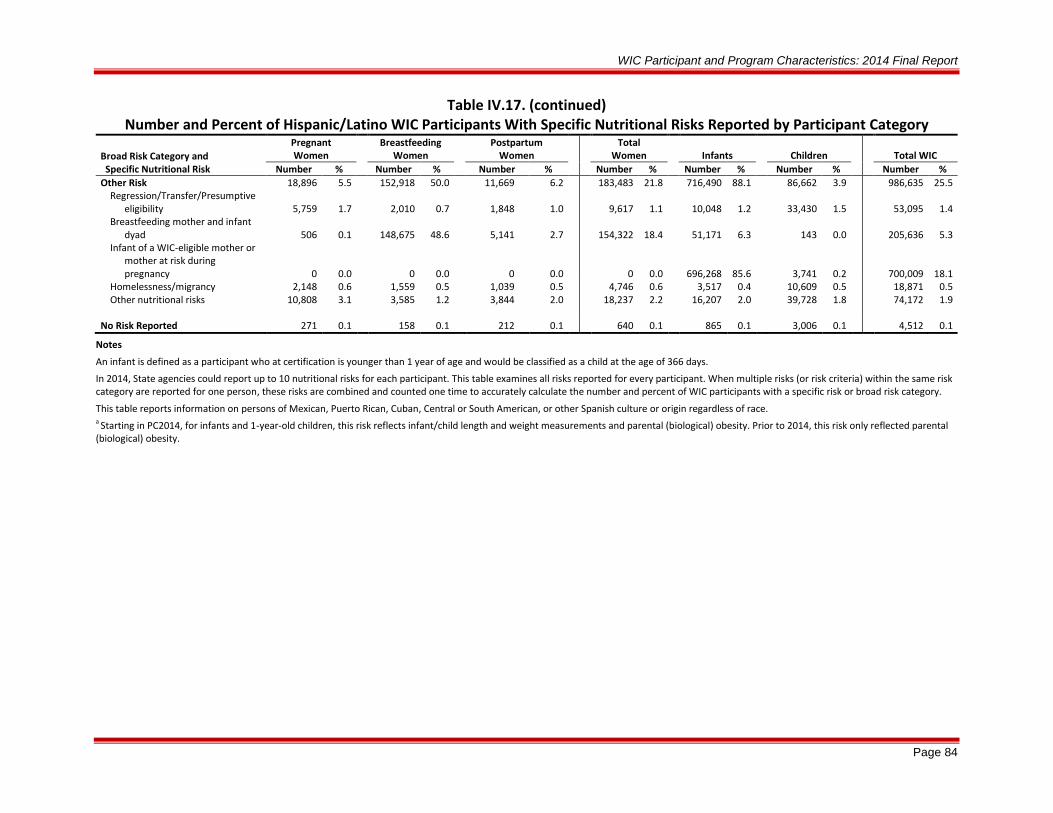
WIC Participant and Program Characteristics: 2014 Final Report
Page 84
Table IV.17. (continued) Number and Percent of Hispanic/Latino WIC Participants With Specific Nutritional Risks Reported by Participant Category
Broad Risk Category and Specific Nutritional Risk
Pregnant Women
Breastfeeding Women
Postpartum Women
Total Women
Infants
Children
Total WIC
Number % Number % Number % Number % Number % Number % Number % Other Risk 18,896 5.5 152,918 50.0 11,669 6.2 183,483 21.8 716,490 88.1 86,662 3.9 986,635 25.5
Regression/Transfer/Presumptive eligibility 5,759 1.7
2,010 0.7
1,848 1.0
9,617 1.1
10,048 1.2
33,430 1.5
53,095 1.4
Breastfeeding mother and infant dyad 506 0.1
148,675 48.6
5,141 2.7
154,322 18.4
51,171 6.3
143 0.0
205,636 5.3
Infant of a WIC-eligible mother or mother at risk during pregnancy 0 0.0
0 0.0
0 0.0
0 0.0
696,268 85.6
3,741 0.2
700,009 18.1 Homelessness/migrancy 2,148 0.6 1,559 0.5 1,039 0.5 4,746 0.6 3,517 0.4 10,609 0.5 18,871 0.5 Other nutritional risks 10,808 3.1 3,585 1.2 3,844 2.0 18,237 2.2 16,207 2.0 39,728 1.8 74,172 1.9
No Risk Reported 271 0.1 158 0.1 212 0.1 640 0.1 865 0.1 3,006 0.1 4,512 0.1
Notes
An infant is defined as a participant who at certification is younger than 1 year of age and would be classified as a child at the age of 366 days.
In 2014, State agencies could report up to 10 nutritional risks for each participant. This table examines all risks reported for every participant. When multiple risks (or risk criteria) within the same risk category are reported for one person, these risks are combined and counted one time to accurately calculate the number and percent of WIC participants with a specific risk or broad risk category.
This table reports information on persons of Mexican, Puerto Rican, Cuban, Central or South American, or other Spanish culture or origin regardless of race. a Starting in PC2014, for infants and 1-year-old children, this risk reflects infant/child length and weight measurements and parental (biological) obesity. Prior to 2014, this risk only reflected parental (biological) obesity.

WIC Participant and Program Characteristics: 2014 Final Report
Page 85
Table IV.18. Number and Percent of Not Hispanic/Latino WIC Participants With Specific Nutritional Risks Reported by Participant Category
Broad Risk Category and Specific Nutritional Risk
Pregnant Women
Breastfeeding Women
Postpartum Women
Total Women
Infants
Children
Total WIC
Number % Number % Number % Number % Number % Number % Number % Participants in Category 551,573
381,052
425,707 1,358,332
1,327,150
2,737,757 5,423,239
Anthropometric 430,981 78.1 257,882 67.7 297,755 69.9 986,619 72.6 581,484 43.8 1,133,906 41.4 2,702,009 49.8
Low weight-for-height 26,201 4.8 13,712 3.6 17,157 4.0 57,071 4.2 117,914 8.9 146,741 5.4 321,725 5.9 High weight-for-height/lengtha 297,655 54.0 195,505 51.3 228,778 53.7 721,938 53.1 201,744 15.2 685,902 25.1 1,609,584 29.7 Short stature 2 0.0 2 0.0 1 0.0 5 0.0 143,764 10.8 208,407 7.6 352,176 6.5 Inappropriate growth or weight
gain pattern 285,965 51.8
145,435 38.2
157,364 37.0
588,765 43.3
31,453 2.4
94,266 3.4
714,484 13.2 Low birth weight or premature
birth 0 0.0
0 0.0
0 0.0
0 0.0
212,342 16.0
150,651 5.5
362,993 6.7 Other anthropometric risk 3 0.0 5 0.0 2 0.0 10 0.0 77,260 5.8 6,515 0.2 83,785 1.5
Biochemical 64,668 11.7 114,315 30.0 159,496 37.5 338,479 24.9 14,053 1.1 369,647 13.5 722,180 13.3 Hematocrit or hemoglobin below
FNS criteria 64,630 11.7
114,289 30.0
159,460 37.5
338,379 24.9
14,018 1.1
367,896 13.4
720,293 13.3 Other biochemical test results
that indicate nutritional abnormality 51 0.0
43 0.0
60 0.0
154 0.0
36 0.0
2,091 0.1
2,281 0.0
Clinical, Health, Medical 326,858 59.3 199,749 52.4 263,823 62.0 790,430 58.2 75,587 5.7 276,686 10.1 1,142,703 21.1 Pregnancy-induced conditions 43,828 7.9 28,617 7.5 32,006 7.5 104,451 7.7 0 0.0 0 0.0 104,451 1.9 Delivery of low birth weight or
premature infant 40,668 7.4
38,592 10.1
51,020 12.0
130,280 9.6
0 0.0
0 0.0
130,280 2.4 Prior stillbirth, fetal, or
neonatal death 34,229 6.2
3,351 0.9
9,972 2.3
47,552 3.5
0 0.0
0 0.0
47,552 0.9 General obstetrical risks 172,656 31.3 84,824 22.3 100,840 23.7 358,319 26.4 0 0.0 0 0.0 358,319 6.6 Nutrition-related risk
conditions 81,746 14.8
91,646 24.1
116,284 27.3
289,676 21.3
72,889 5.5
231,280 8.4
593,846 11.0 Substance abuse 99,008 18.0 23,418 6.1 74,674 17.5 197,099 14.5 1,756 0.1 4,280 0.2 203,135 3.7 Other health risks 25,328 4.6 10,369 2.7 14,670 3.4 50,367 3.7 1,249 0.1 47,927 1.8 99,543 1.8
Dietary 214,359 38.9 124,401 32.6 155,272 36.5 494,032 36.4 419,330 31.6 2,045,930 74.7 2,959,292 54.6 Failure to meet Dietary
Guidelines for Americans 45,984 8.3
29,530 7.7
33,244 7.8
108,758 8.0
12,216 0.9
420,138 15.3
541,112 10.0 Inappropriate nutrition practices 171,614 31.1 97,236 25.5 124,731 29.3 393,581 29.0 408,882 30.8 1,675,344 61.2 2,477,807 45.7

WIC Participant and Program Characteristics: 2014 Final Report
Page 86
Table IV.18. (continued) Number and Percent of Not Hispanic/Latino WIC Participants With Specific Nutritional Risks Reported by Participant Category
Broad Risk Category and Specific Nutritional Risk
Pregnant Women
Breastfeeding Women
Postpartum Women
Total Women
Infants
Children
Total WIC
Number % Number % Number % Number % Number % Number % Number % Other Risk 73,086 13.3 192,349 50.5 51,292 12.0 316,728 23.3 1,106,981 83.4 245,013 8.9 1,668,721 30.8
Regression/Transfer/ Presumptive eligibility 7,041 1.3
3,514 0.9
4,222 1.0
14,777 1.1
20,683 1.6
42,908 1.6
78,368 1.4
Breastfeeding mother and infant dyad 2,141 0.4
182,821 48.0
14,461 3.4
199,423 14.7
67,077 5.1
351 0.0
266,850 4.9
Infant of a WIC-eligible mother or mother at risk during pregnancy 0 0.0
0 0.0
0 0.0
0 0.0
1,051,303 79.2
10,386 0.4
1,061,689 19.6 Homelessness/migrancy 3,018 0.5 1,064 0.3 1,524 0.4 5,607 0.4 3,626 0.3 6,972 0.3 16,205 0.3 Other nutritional risks 62,040 11.2 13,213 3.5 32,389 7.6 107,642 7.9 90,688 6.8 187,357 6.8 385,688 7.1
No Risk Reported 932 0.2 485 0.1 781 0.2 2,198 0.2 4,503 0.3 14,332 0.5 21,033 0.4
Notes
An infant is defined as a participant who at certification is younger than 1 year of age and would be classified as a child at the age of 366 days.
In 2014, State agencies could report up to 10 nutritional risks for each participant. This table examines all risks reported for every participant. When multiple risks (or risk criteria) within the same risk category are reported for one person, these risks are combined and counted one time to accurately calculate the number and percent of WIC participants with a specific risk or broad risk category.
This table reports information on persons not of Mexican, Puerto Rican, Cuban, Central, or South American, or other Spanish culture or origin regardless of race. a Starting in PC2014, for infants and 1-year-old children, this risk reflects infant/child length and weight measurements and parental (biological) obesity. Prior to 2014, this risk only reflected parental (biological) obesity.

WIC Participant and Program Characteristics: 2014 Final Report
Page 87
Table IV.19. Nutritional Risks Reported for at Least 15 Percent Of
American Indian or Alaska Native Only WIC Participants By Participant Category
Participant Category and Specific Nutritional Risk Percent Pregnant Women 98,857
General obstetrical risks 29.2 Inappropriate growth or weight gain pattern 59.9 Inappropriate nutrition practices 57.9 Prepregnancy high weight-for-height 55.2
Breastfeeding Women 76,204 Breastfeeding mother and infant dyad 71.9 General obstetrical risks 19.7 Hematocrit or hemoglobin below FNS criteria 27.7 High weight-for-height 56.0 Inappropriate growth or weight gain pattern 24.6 Inappropriate nutrition practices 55.1
Postpartum Women 53,695 General obstetrical risks 23.1 Hematocrit or hemoglobin below FNS criteria 28.6 High weight-for-height 54.7 Inappropriate growth or weight gain pattern 24.4 Inappropriate nutrition practices 50.8 Nutrition-related risk conditions 19.4
Infants 193,678 Inappropriate nutrition practices 35.8 Infant of a WIC-eligible mother or mother at risk during pregnancy 87.1
Children 610,215 High weight-for-height/lengtha 32.1 Inappropriate nutrition practices 74.3
Total 1,032,650 Notes
These figures represent 15% or more of all WIC participants in the participant category in this racial or ethnic group.
American Indians and Alaska Natives include persons having origins in any of the original peoples of North America who maintain cultural identification through tribal affiliation or community recognition (includes Aleuts and Eskimos). a Starting in PC2014, for 1-year-old children, this risk reflects child length and weight measurements and parental (biological) obesity. Prior to 2014, this risk only reflected parental (biological) obesity.

WIC Participant and Program Characteristics: 2014 Final Report
Page 88
Table IV.20. Nutritional Risks Reported for at Least 15 Percent Of
Asian Only WIC Participants By Participant Category
Participant Category and Specific Nutritional Risk Percent Pregnant Women 30,448
General obstetrical risks 27.4 Inappropriate growth or weight gain pattern 51.1 Inappropriate nutrition practices 49.3 Prepregnancy high weight-for-height 29.2
Breastfeeding Women 30,192 Breastfeeding mother and infant dyad 52.8 General obstetrical risks 17.7 Hematocrit or hemoglobin below FNS criteria 30.1 High weight-for-height 28.8 Inappropriate growth or weight gain pattern 24.1 Inappropriate nutrition practices 42.8 Nutrition-related risk conditions 18.9
Postpartum Women 18,394 General obstetrical risks 22.0 Hematocrit or hemoglobin below FNS criteria 33.8 High weight-for-height 29.3 Inappropriate growth or weight gain pattern 23.5 Inappropriate nutrition practices 46.7 Nutrition-related risk conditions 18.7
Infants 67,330 Inappropriate nutrition practices 31.1 Infant of a WIC-eligible mother or mother at risk during pregnancy 82.4
Children 162,895 High weight-for-height/lengtha 18.6 Inappropriate nutrition practices 72.4
Total 309,259 Notes
These figures represent 15% or more of all WIC participants in the participant category in this racial or ethnic group.
This table reports information on persons having origins in any of the original peoples of the Far East, Southeast Asia, or the Indian subcontinent. This area includes, for example, Cambodia, China, India, Japan, Korea, Malaysia, Pakistan, the Philippine Islands, Thailand, and Vietnam. a Starting in PC2014, for 1-year-old children, this risk reflects child length and weight measurements and parental (biological) obesity. Prior to 2014, this risk only reflected parental (biological) obesity.

WIC Participant and Program Characteristics: 2014 Final Report
Page 89
Table IV.21. Nutritional Risks Reported for at Least 15 Percent Of
Black or African American Only WIC Participants By Participant Category
Participant Category and Specific Nutritional Risk Percent Pregnant Women 176,086
General obstetrical risks 30.0 Hematocrit or hemoglobin below FNS criteria 19.9 Inappropriate growth or weight gain pattern 53.4 Inappropriate nutrition practices 31.7 Prepregnancy high weight-for-height 60.3
Breastfeeding Women 122,584 Breastfeeding mother and infant dyad 43.6 General obstetrical risks 21.3 Hematocrit or hemoglobin below FNS criteria 43.7 High weight-for-height 59.7 Inappropriate growth or weight gain pattern 39.0 Inappropriate nutrition practices 25.5 Nutrition-related risk conditions 26.5
Postpartum Women 152,655 General obstetrical risks 23.0 Hematocrit or hemoglobin below FNS criteria 49.5 High weight-for-height 58.0 Inappropriate growth or weight gain pattern 36.5 Inappropriate nutrition practices 29.3 Nutrition-related risk conditions 26.5
Infants 480,234 High weight-for-height/lengtha 15.1 Inappropriate nutrition practices 31.3 Infant of a WIC-eligible mother or mother at risk during pregnancy 79.1 Low birth weight or premature birth 18.5
Children 960,594 Failure to meet Dietary Guidelines for Americans 15.9 Hematocrit or hemoglobin below FNS criteria 20.0 High weight-for-height/lengtha 24.8 Inappropriate nutrition practices 59.6
Total 1,892,154 Notes
These figures represent 15% or more of all WIC participants in the participant category in this racial or ethnic group.
This table reports information on persons having origins in any of the Black racial groups of Africa. a Starting in PC2014, for infants and 1-year-old children, this risk reflects infant/child length and weight measurements and parental (biological) obesity. Prior to 2014, this risk only reflected parental (biological) obesity.
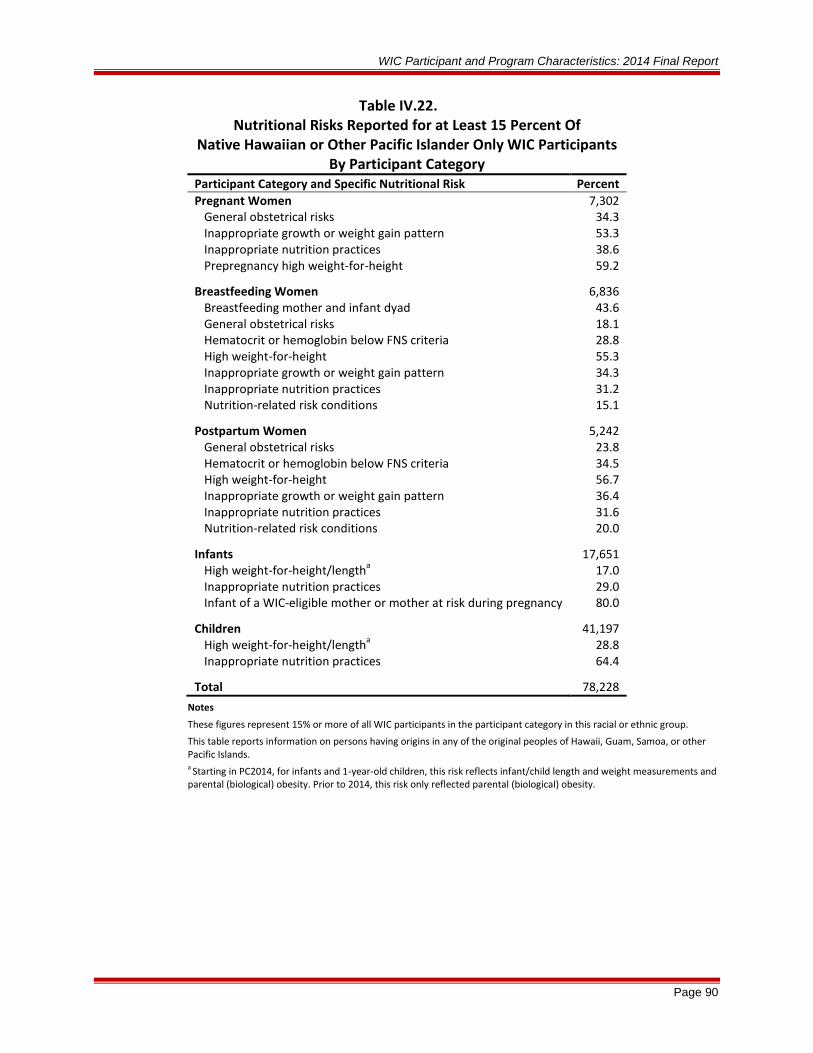
WIC Participant and Program Characteristics: 2014 Final Report
Page 90
Table IV.22. Nutritional Risks Reported for at Least 15 Percent Of
Native Hawaiian or Other Pacific Islander Only WIC Participants By Participant Category
Participant Category and Specific Nutritional Risk Percent Pregnant Women 7,302
General obstetrical risks 34.3 Inappropriate growth or weight gain pattern 53.3 Inappropriate nutrition practices 38.6 Prepregnancy high weight-for-height 59.2
Breastfeeding Women 6,836 Breastfeeding mother and infant dyad 43.6 General obstetrical risks 18.1 Hematocrit or hemoglobin below FNS criteria 28.8 High weight-for-height 55.3 Inappropriate growth or weight gain pattern 34.3 Inappropriate nutrition practices 31.2 Nutrition-related risk conditions 15.1
Postpartum Women 5,242 General obstetrical risks 23.8 Hematocrit or hemoglobin below FNS criteria 34.5 High weight-for-height 56.7 Inappropriate growth or weight gain pattern 36.4 Inappropriate nutrition practices 31.6 Nutrition-related risk conditions 20.0
Infants 17,651 High weight-for-height/lengtha 17.0 Inappropriate nutrition practices 29.0 Infant of a WIC-eligible mother or mother at risk during pregnancy 80.0
Children 41,197 High weight-for-height/lengtha 28.8 Inappropriate nutrition practices 64.4
Total 78,228 Notes
These figures represent 15% or more of all WIC participants in the participant category in this racial or ethnic group.
This table reports information on persons having origins in any of the original peoples of Hawaii, Guam, Samoa, or other Pacific Islands. a Starting in PC2014, for infants and 1-year-old children, this risk reflects infant/child length and weight measurements and parental (biological) obesity. Prior to 2014, this risk only reflected parental (biological) obesity.

WIC Participant and Program Characteristics: 2014 Final Report
Page 91
Table IV.23. Nutritional Risks Reported for at Least 15 Percent Of
White Only WIC Participants By Participant Category
Participant Category and Specific Nutritional Risk Percent Pregnant Women 555,968
General obstetrical risks 31.7 Inappropriate growth or weight gain pattern 54.4 Inappropriate nutrition practices 31.4 Prepregnancy high weight-for-height 55.6 Substance abuse 15.8
Breastfeeding Women 428,716 Breastfeeding mother and infant dyad 44.3 General obstetrical risks 23.2 Hematocrit or hemoglobin below FNS criteria 27.9 High weight-for-height 54.4 Inappropriate growth or weight gain pattern 37.6 Inappropriate nutrition practices 26.0 Nutrition-related risk conditions 24.0
Postpartum Women 366,710 General obstetrical risks 24.5 Hematocrit or hemoglobin below FNS criteria 31.4 High weight-for-height 54.8 Inappropriate growth or weight gain pattern 37.0 Inappropriate nutrition practices 30.8 Nutrition-related risk conditions 26.7 Substance abuse 16.9
Infants 1,247,561 High weight-for-height/lengtha 15.5 Inappropriate nutrition practices 34.0 Infant of a WIC-eligible mother or mother at risk during pregnancy 81.6
Children 2,866,232 Failure to meet Dietary Guidelines for Americans 16.0 High weight-for-height/lengtha 27.3 Inappropriate nutrition practices 59.6
Total 5,465,187 Notes
These figures represent 15% or more of all WIC participants in the participant category in this racial or ethnic group.
This table reports information on persons having origins in any of the original peoples of Europe, North Africa, or the Middle East. a Starting in PC2014, for infants and 1-year-old children, this risk reflects infant/child length and weight measurements and parental (biological) obesity. Prior to 2014, this risk only reflected parental (biological) obesity.

WIC Participant and Program Characteristics: 2014 Final Report
Page 92
Table IV.24. Nutritional Risks Reported for at Least 15 Percent Of WIC Participants With Two or More Races Reported
By Participant Category Participant Category and Specific Nutritional Risk Percent Pregnant Women 26,405
General obstetrical risks 35.5 Inappropriate growth or weight gain pattern 61.9 Inappropriate nutrition practices 47.3 Prepregnancy high weight-for-height 55.2 Substance abuse 18.1
Breastfeeding Women 21,733 Breastfeeding mother and infant dyad 64.4 General obstetrical risks 22.9 Hematocrit or hemoglobin below FNS criteria 28.3 High weight-for-height 53.3 Inappropriate growth or weight gain pattern 36.6 Inappropriate nutrition practices 41.9 Nutrition-related risk conditions 18.6
Postpartum Women 17,809 General obstetrical risks 28.5 Hematocrit or hemoglobin below FNS criteria 33.7 High weight-for-height 54.4 Inappropriate growth or weight gain pattern 37.0 Inappropriate nutrition practices 42.1 Nutrition-related risk conditions 21.9
Infants 129,955 High weight-for-height/lengtha 15.5 Inappropriate nutrition practices 34.9 Infant of a WIC-eligible mother or mother at risk during pregnancy 83.6
Children 310,368 High weight-for-height/lengtha 26.6 Inappropriate nutrition practices 68.4
Total 506,271 Notes
These figures represent 15% or more of all WIC participants in the participant category in this racial or ethnic group.
This table reports information on persons reporting two or more races. a Starting in PC2014, for infants and 1-year-old children, this risk reflects infant/child length and weight measurements and parental (biological) obesity. Prior to 2014, this risk only reflected parental (biological) obesity.

WIC Participant and Program Characteristics: 2014 Final Report
Page 93
Table IV.25. Nutritional Risks Reported for at Least 15 Percent Of
Hispanic/Latino WIC Participants By Participant Category
Participant Category and Specific Nutritional Risk Percent Pregnant Women 344,455
General obstetrical risks 30.6 Inappropriate growth or weight gain pattern 59.8 Inappropriate nutrition practices 42.5 Prepregnancy high weight-for-height 58.2
Breastfeeding Women 305,881 Breastfeeding mother and infant dyad 48.6 General obstetrical risks 22.0 Hematocrit or hemoglobin below FNS criteria 31.8 High weight-for-height 58.2 Inappropriate growth or weight gain pattern 32.6 Inappropriate nutrition practices 36.6 Nutrition-related risk conditions 21.3
Postpartum Women 189,429 General obstetrical risks 24.8 Hematocrit or hemoglobin below FNS criteria 32.1 High weight-for-height 57.2 Inappropriate growth or weight gain pattern 31.7 Inappropriate nutrition practices 41.2 Nutrition-related risk conditions 21.6
Infants 813,038 Inappropriate nutrition practices 37.7 Infant of a WIC-eligible mother or mother at risk during pregnancy 85.6
Children 2,218,346 High weight-for-height/lengtha 29.7 Inappropriate nutrition practices 63.9
Total 3,871,150 Notes
These figures represent 15% or more of all WIC participants in the participant category in this racial or ethnic group.
This table reports information on persons of Mexican, Puerto Rican, Cuban, Central or South American, or other Spanish culture or origin regardless of race. a Starting in PC2014, for 1-year-old children, this risk reflects child length and weight measurements and parental (biological) obesity. Prior to 2014, this risk only reflected parental (biological) obesity.

WIC Participant and Program Characteristics: 2014 Final Report
Page 94
Table IV.26. Nutritional Risks Reported for at Least 15 Percent Of
Non-Hispanic/Latino WIC Participants By Participant Category
Participant Category and Specific Nutritional Risk Percent Pregnant Women 551,573
General obstetrical risks 31.3 Inappropriate growth or weight gain pattern 51.8 Inappropriate nutrition practices 31.1 Prepregnancy high weight-for-height 54.0 Substance abuse 18.0
Breastfeeding Women 381,052 Breastfeeding mother and infant dyad 48.0 General obstetrical risks 22.3 Hematocrit or hemoglobin below FNS criteria 30.0 High weight-for-height 51.3 Inappropriate growth or weight gain pattern 38.2 Inappropriate nutrition practices 25.5 Nutrition-related risk conditions 24.1
Postpartum Women 425,707 General obstetrical risks 23.7 Hematocrit or hemoglobin below FNS criteria 37.5 High weight-for-height 53.7 Inappropriate growth or weight gain pattern 37.0 Inappropriate nutrition practices 29.3 Nutrition-related risk conditions 27.3 Substance abuse 17.5
Infants 1,327,150 High weight-for-height/lengtha 15.2 Inappropriate nutrition practices 30.8 Infant of a WIC-eligible mother or mother at risk during pregnancy 79.2 Low birth weight or premature birth 16.0
Children 2,737,757 Failure to meet Dietary Guidelines for Americans 15.3 High weight-for-height/lengtha 25.1 Inappropriate nutrition practices 61.2
Total 5,423,239 Notes
These figures represent 15% or more of all WIC participants in the participant category in this racial or ethnic group.
This table reports information on persons not of Mexican, Puerto Rican, Cuban, Central, or South American, or other Spanish culture or origin regardless of race. a Starting in PC2014, for infants and 1-year-old children, this risk reflects infant/child length and weight measurements and parental (biological) obesity. Prior to 2014, this risk only reflected parental (biological) obesity.

WIC Participant and Program Characteristics: 2014 Final Report
Page 95
Table IV.27. Number and Percent of Women WIC Participants With Specific Nutritional Risks Reported at Certification
By Income as a Percent of Federal Poverty Guideline
Broad Risk Category and Specific Nutritional Risk
Up to 100%
101% to 130%
131% to 185%
186% and Greater Income Reported
as Zeroa
Not Reportedb
Total Women Number % Number % Number % Number % Number % Number % Number %
Participants in Category 1,461,363
252,627
252,114
32,630
18,383
182,344
2,199,461
Anthropometric 1,076,989 73.7 184,802 73.2 182,980 72.6 23,518 72.1 11,104 60.4 125,077 68.6 1,604,470 72.9 Low weight-for-height 51,658 3.5 7,689 3.0 7,323 2.9 1,113 3.4 745 4.1 8,007 4.4 76,535 3.5 High weight-for-height/length 816,026 55.8 140,307 55.5 137,517 54.5 16,973 52.0 7,717 42.0 90,577 49.7 1,209,117 55.0 Short stature 4 0.0 2 0.0 0 0.0 0 0.0 0 0.0 0 0.0 6 0.0 Inappropriate growth or weight
gain pattern 638,741 43.7
111,289 44.1
112,100 44.5
14,660 44.9
6,698 36.4
71,170 39.0
954,658 43.4 Other anthropometric risk 6 0.0 1 0.0 3 0.0 0 0.0 0 0.0 0 0.0 10 0.0
Biochemical 363,225 24.9 52,576 20.8 47,667 18.9 6,144 18.8 3,278 17.8 49,537 27.2 522,427 23.8 Hematocrit or hemoglobin below
FNS criteria 363,099 24.8
52,566 20.8
47,656 18.9
6,144 18.8
3,278 17.8
49,521 27.2
522,264 23.7 Other biochemical test results
that indicate nutritional abnormality 186 0.0
14 0.0
22 0.0
3 0.0
0 0.0
28 0.0
253 0.0
Clinical, Health, Medical 806,677 55.2 127,744 50.6 124,650 49.4 16,531 50.7 8,931 48.6 109,958 60.3 1,194,491 54.3 Pregnancy-induced conditions 109,110 7.5 20,074 7.9 20,311 8.1 2,408 7.4 1,163 6.3 12,857 7.1 165,923 7.5 Delivery of low birth weight or
premature infant 125,380 8.6
18,251 7.2
17,568 7.0
2,181 6.7
1,343 7.3
20,466 11.2
185,190 8.4 Prior stillbirth, fetal, or neonatal
death 44,241 3.0
7,960 3.2
8,155 3.2
1,105 3.4
580 3.2
6,777 3.7
68,818 3.1 General obstetrical risks 402,755 27.6 60,348 23.9 56,241 22.3 7,337 22.5 4,360 23.7 47,210 25.9 578,253 26.3 Nutrition-related risk conditions 277,067 19.0 46,516 18.4 47,610 18.9 6,227 19.1 2,928 15.9 43,844 24.0 424,193 19.3 Substance abuse 155,364 10.6 18,385 7.3 17,419 6.9 2,910 8.9 1,893 10.3 26,598 14.6 222,568 10.1 Other health risks 43,251 3.0 6,429 2.5 5,464 2.2 923 2.8 456 2.5 8,342 4.6 64,866 2.9
Dietary 618,775 42.3 107,098 42.4 104,430 41.4 11,640 35.7 6,695 36.4 55,389 30.4 904,028 41.1 Failure to meet Dietary
Guidelines for Americans 120,885 8.3
24,165 9.6
25,686 10.2
3,255 10.0
1,337 7.3
11,916 6.5
187,243 8.5 Inappropriate nutrition practices 506,920 34.7 84,537 33.5 80,465 31.9 8,526 26.1 5,406 29.4 44,292 24.3 730,148 33.2
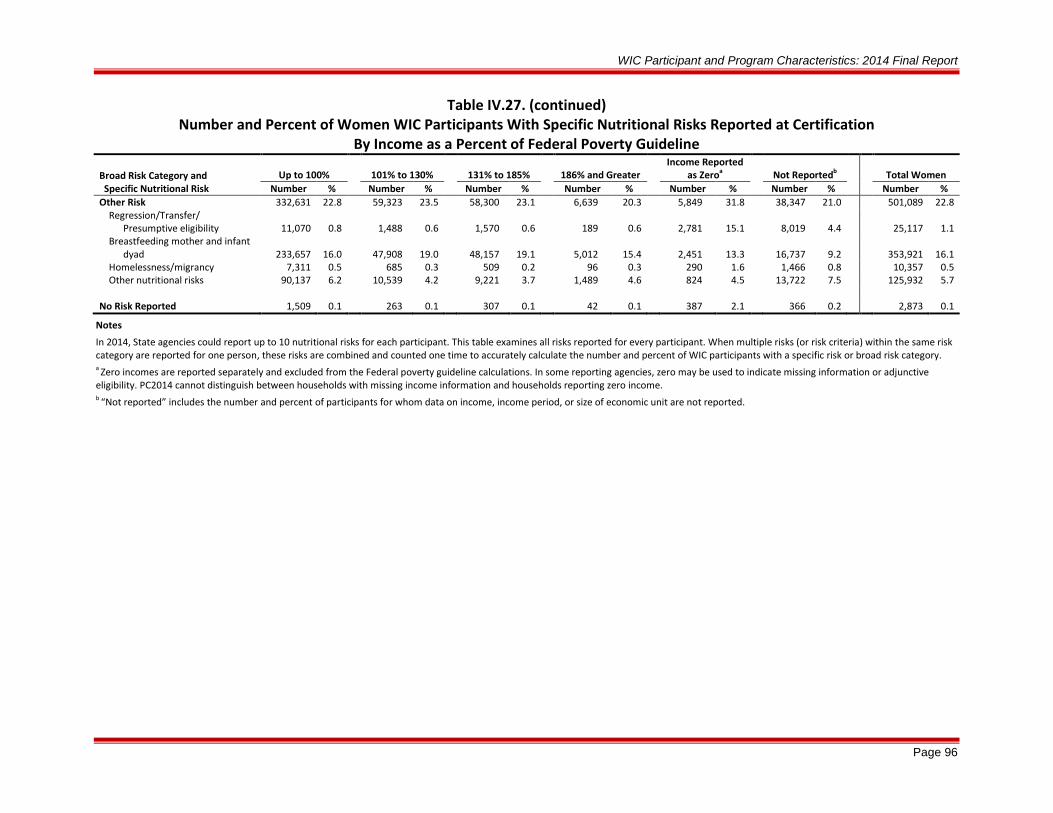
WIC Participant and Program Characteristics: 2014 Final Report
Page 96
Table IV.27. (continued) Number and Percent of Women WIC Participants With Specific Nutritional Risks Reported at Certification
By Income as a Percent of Federal Poverty Guideline
Broad Risk Category and Specific Nutritional Risk
Up to 100%
101% to 130%
131% to 185%
186% and Greater Income Reported
as Zeroa
Not Reportedb
Total Women Number % Number % Number % Number % Number % Number % Number %
Other Risk 332,631 22.8 59,323 23.5 58,300 23.1 6,639 20.3 5,849 31.8 38,347 21.0 501,089 22.8 Regression/Transfer/
Presumptive eligibility 11,070 0.8
1,488 0.6
1,570 0.6
189 0.6
2,781 15.1
8,019 4.4
25,117 1.1 Breastfeeding mother and infant
dyad 233,657 16.0
47,908 19.0
48,157 19.1
5,012 15.4
2,451 13.3
16,737 9.2
353,921 16.1 Homelessness/migrancy 7,311 0.5 685 0.3 509 0.2 96 0.3 290 1.6 1,466 0.8 10,357 0.5 Other nutritional risks 90,137 6.2 10,539 4.2 9,221 3.7 1,489 4.6 824 4.5 13,722 7.5 125,932 5.7
No Risk Reported 1,509 0.1 263 0.1 307 0.1 42 0.1 387 2.1 366 0.2 2,873 0.1
Notes
In 2014, State agencies could report up to 10 nutritional risks for each participant. This table examines all risks reported for every participant. When multiple risks (or risk criteria) within the same risk category are reported for one person, these risks are combined and counted one time to accurately calculate the number and percent of WIC participants with a specific risk or broad risk category. a Zero incomes are reported separately and excluded from the Federal poverty guideline calculations. In some reporting agencies, zero may be used to indicate missing information or adjunctive eligibility. PC2014 cannot distinguish between households with missing income information and households reporting zero income. b “Not reported” includes the number and percent of participants for whom data on income, income period, or size of economic unit are not reported.
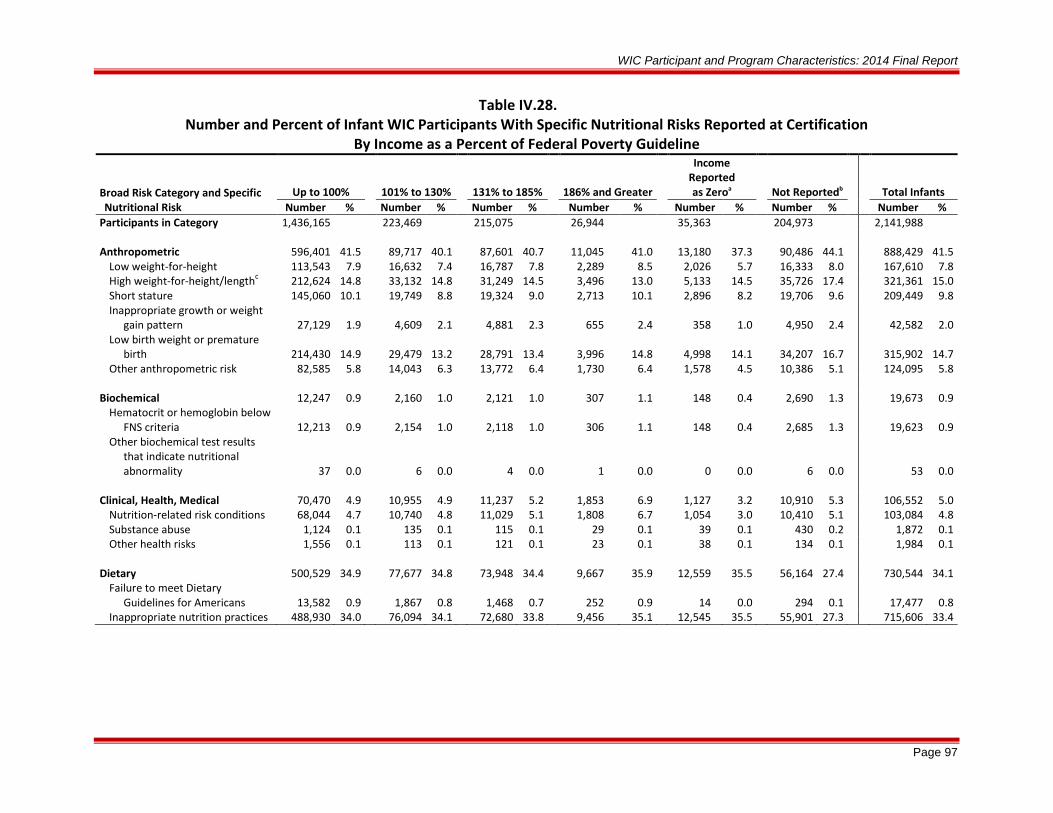
WIC Participant and Program Characteristics: 2014 Final Report
Page 97
Table IV.28. Number and Percent of Infant WIC Participants With Specific Nutritional Risks Reported at Certification
By Income as a Percent of Federal Poverty Guideline
Broad Risk Category and Specific Nutritional Risk
Up to 100%
101% to 130%
131% to 185%
186% and Greater
Income Reported as Zeroa
Not Reportedb
Total Infants Number % Number % Number % Number % Number % Number % Number %
Participants in Category 1,436,165
223,469
215,075
26,944
35,363
204,973
2,141,988
Anthropometric 596,401 41.5 89,717 40.1 87,601 40.7 11,045 41.0 13,180 37.3 90,486 44.1 888,429 41.5 Low weight-for-height 113,543 7.9 16,632 7.4 16,787 7.8 2,289 8.5 2,026 5.7 16,333 8.0 167,610 7.8 High weight-for-height/lengthc 212,624 14.8 33,132 14.8 31,249 14.5 3,496 13.0 5,133 14.5 35,726 17.4 321,361 15.0 Short stature 145,060 10.1 19,749 8.8 19,324 9.0 2,713 10.1 2,896 8.2 19,706 9.6 209,449 9.8 Inappropriate growth or weight
gain pattern 27,129 1.9
4,609 2.1
4,881 2.3
655 2.4
358 1.0
4,950 2.4
42,582 2.0 Low birth weight or premature
birth 214,430 14.9
29,479 13.2
28,791 13.4
3,996 14.8
4,998 14.1
34,207 16.7
315,902 14.7 Other anthropometric risk 82,585 5.8 14,043 6.3 13,772 6.4 1,730 6.4 1,578 4.5 10,386 5.1 124,095 5.8
Biochemical 12,247 0.9 2,160 1.0 2,121 1.0 307 1.1 148 0.4 2,690 1.3 19,673 0.9 Hematocrit or hemoglobin below
FNS criteria 12,213 0.9
2,154 1.0
2,118 1.0
306 1.1
148 0.4
2,685 1.3
19,623 0.9 Other biochemical test results
that indicate nutritional abnormality 37 0.0
6 0.0
4 0.0
1 0.0
0 0.0
6 0.0
53 0.0
Clinical, Health, Medical 70,470 4.9 10,955 4.9 11,237 5.2 1,853 6.9 1,127 3.2 10,910 5.3 106,552 5.0 Nutrition-related risk conditions 68,044 4.7 10,740 4.8 11,029 5.1 1,808 6.7 1,054 3.0 10,410 5.1 103,084 4.8 Substance abuse 1,124 0.1 135 0.1 115 0.1 29 0.1 39 0.1 430 0.2 1,872 0.1 Other health risks 1,556 0.1 113 0.1 121 0.1 23 0.1 38 0.1 134 0.1 1,984 0.1
Dietary 500,529 34.9 77,677 34.8 73,948 34.4 9,667 35.9 12,559 35.5 56,164 27.4 730,544 34.1 Failure to meet Dietary
Guidelines for Americans 13,582 0.9
1,867 0.8
1,468 0.7
252 0.9
14 0.0
294 0.1
17,477 0.8 Inappropriate nutrition practices 488,930 34.0 76,094 34.1 72,680 33.8 9,456 35.1 12,545 35.5 55,901 27.3 715,606 33.4

WIC Participant and Program Characteristics: 2014 Final Report
Page 98
Table IV.28. (continued) Number and Percent of Infant WIC Participants With Specific Nutritional Risks Reported at Certification
By Income as a Percent of Federal Poverty Guideline
Broad Risk Category and Specific Nutritional Risk
Up to 100%
101% to 130%
131% to 185%
186% and Greater
Income Reported as Zeroa
Not Reportedb
Total Infants Number % Number % Number % Number % Number % Number % Number %
Other Risk 1,232,454 85.8 191,535 85.7 180,498 83.9 22,038 81.8 30,878 87.3 167,813 81.9 1,825,216 85.2 Regression/Transfer/
Presumptive eligibility 11,352 0.8
1,159 0.5
1,188 0.6
168 0.6
4,766 13.5
13,738 6.7
32,371 1.5 Breastfeeding mother and infant
dyad 77,286 5.4
13,968 6.3
13,057 6.1
1,782 6.6
2,039 5.8
10,124 4.9
118,255 5.5 Infant of WIC-eligible or mother
at risk during pregnancy 1,190,421 82.9
186,576 83.5
175,629 81.7
21,129 78.4
25,865 73.1
148,162 72.3
1,747,783 81.6 Homelessness/migrancy 5,105 0.4 437 0.2 273 0.1 81 0.3 217 0.6 1,044 0.5 7,156 0.3 Other nutritional risk 74,488 5.2 7,354 3.3 5,980 2.8 1,333 4.9 1,969 5.6 15,857 7.7 106,980 5.0
No Risk Reported 2,447 0.2 408 0.2 447 0.2 34 0.1 523 1.5 1,523 0.7 5,383 0.3
Notes
In 2014, State agencies could report up to 10 nutritional risks for each participant. This table examines all risks reported for every participant. When multiple risks (or risk criteria) within the same risk category are reported for one person, these risks are combined and counted one time to accurately calculate the number and percent of WIC participants with a specific risk or broad risk category. a Zero incomes are reported separately and excluded from the Federal poverty guideline calculations. In some reporting agencies, zero may be used to indicate missing information or adjunctive eligibility. PC2014 cannot distinguish between households with missing income information and households reporting zero income. b “Not reported” includes the number and percent of participants for whom data on income, income period, or size of economic unit are not reported. c Starting in PC2014, this risk reflects infant length and weight measurements and parental (biological) obesity. Prior to 2014, this risk only reflected parental (biological) obesity.

WIC Participant and Program Characteristics: 2014 Final Report
Page 99
Table IV.29. Number and Percent of Child WIC Participants With Specific Nutritional Risks Reported at Certification
By Income as a Percent of Federal Poverty Guideline
Broad Risk Category and Specific Nutritional Risk
Up to 100%
101% to 130%
131% to 185%
186% and Greater
Income Reported as Zeroa
Not Reportedb
Total Children Number % Number % Number % Number % Number % Number % Number %
Participants in Category 3,367,514
566,233
549,119
71,523
30,463
376,953 4,961,804
Anthropometric 1,437,621 42.7 229,532 40.5 217,024 39.5 29,054 40.6 11,026 36.2 164,470 43.6 2,088,727 42.1 Low weight-for-height 157,140 4.7 27,145 4.8 27,950 5.1 3,491 4.9 1,379 4.5 18,222 4.8 235,327 4.7 High weight-for-height/lengthc 933,871 27.7 146,772 25.9 134,526 24.5 17,208 24.1 6,711 22.0 106,632 28.3 1,345,719 27.1 Short stature 269,366 8.0 41,714 7.4 40,663 7.4 6,121 8.6 2,352 7.7 27,859 7.4 388,075 7.8 Inappropriate growth or weight
gain pattern 96,995 2.9
16,855 3.0
15,971 2.9
2,320 3.2
717 2.4
10,755 2.9
143,612 2.9 Low birth weight or premature
birth 149,153 4.4
22,802 4.0
22,156 4.0
3,746 5.2
828 2.7
20,378 5.4
219,063 4.4 Other anthropometric risk 6,140 0.2 994 0.2 1,021 0.2 194 0.3 125 0.4 832 0.2 9,306 0.2
Biochemical 421,674 12.5 60,324 10.7 55,816 10.2 7,629 10.7 2,942 9.7 44,872 11.9 593,257 12.0 Hematocrit or hemoglobin below
FNS criteria 419,932 12.5
60,106 10.6
55,627 10.1
7,592 10.6
2,935 9.6
44,640 11.8
590,833 11.9 Other biochemical test results
that indicate nutritional abnormality 2,092 0.1
254 0.0
216 0.0
42 0.1
15 0.0
280 0.1
2,899 0.1
Clinical, Health, Medical 291,626 8.7 48,212 8.5 47,648 8.7 8,049 11.3 2,483 8.2 41,804 11.1 439,822 8.9 Nutrition-related risk conditions 230,070 6.8 39,029 6.9 39,724 7.2 6,921 9.7 2,077 6.8 34,396 9.1 352,216 7.1 Substance abuse 2,844 0.1 349 0.1 276 0.1 73 0.1 51 0.2 852 0.2 4,445 0.1 Other health risks 65,612 1.9 9,893 1.7 8,517 1.6 1,231 1.7 397 1.3 7,660 2.0 93,310 1.9
Dietary 2,563,394 76.1 443,386 78.3 431,392 78.6 54,546 76.3 16,711 54.9 253,822 67.3 3,763,252 75.8 Failure to meet Dietary
Guidelines for Americans 508,669 15.1
91,270 16.1
91,253 16.6
11,087 15.5
2,923 9.6
45,682 12.1
750,884 15.1 Inappropriate nutrition practices 2,111,288 62.7 361,870 63.9 350,086 63.8 44,577 62.3 14,108 46.3 213,493 56.6 3,095,422 62.4

WIC Participant and Program Characteristics: 2014 Final Report
Page 100
Table IV.29. (continued) Number and Percent of Child WIC Participants With Specific Nutritional Risks Reported at Certification
By Income as a Percent of Federal Poverty Guideline
Broad Risk Category and Specific Nutritional Risk
Up to 100%
101% to 130%
131% to 185%
186% and Greater
Income Reported as Zeroa
Not Reportedb
Total Children Number % Number % Number % Number % Number % Number % Number %
Other Risk 221,085 6.6 26,245 4.6 22,772 4.1 4,118 5.8 7,486 24.6 51,291 13.6 332,998 6.7 Regression/Transfer/
Presumptive eligibility 42,382 1.3
6,042 1.1
6,170 1.1
841 1.2
4,864 16.0
17,266 4.6
77,565 1.6 Breastfeeding mother and
infant dyad 339 0.0
63 0.0
63 0.0
10 0.0
1 0.0
18 0.0
494 0.0 Infant of WIC-eligible or mother
at risk during pregnancy 10,012 0.3
1,560 0.3
1,574 0.3
271 0.4
61 0.2
651 0.2
14,129 0.3 Homelessness/migrancy 13,015 0.4 1,119 0.2 723 0.1 210 0.3 342 1.1 2,180 0.6 17,589 0.4 Other nutritional risks 158,099 4.7 17,708 3.1 14,467 2.6 2,918 4.1 2,333 7.7 31,686 8.4 227,210 4.6
No Risk Reported 10,212 0.3 2,205 0.4 2,206 0.4 252 0.4 684 2.2 1,892 0.5 17,451 0.4
Notes
In 2014, State agencies could report up to 10 nutritional risks for each participant. This table examines all risks reported for every participant. When multiple risks (or risk criteria) within the same risk category are reported for one person, these risks are combined and counted one time to accurately calculate the number and percent of WIC participants with a specific risk or broad risk category. a Zero incomes are reported separately and excluded from the Federal poverty guideline calculations. In some reporting agencies, zero may be used to indicate missing information or adjunctive eligibility. PC2014 cannot distinguish between households with missing income information and households reporting zero income. b “Not reported” includes the number and percent of participants for whom data on income, income period, or size of economic unit are not reported. c Starting in PC2014, for 1-year-old children, this risk reflects child length and weight measurements and parental (biological) obesity. Prior to 2014, this risk only reflected parental (biological) obesity.
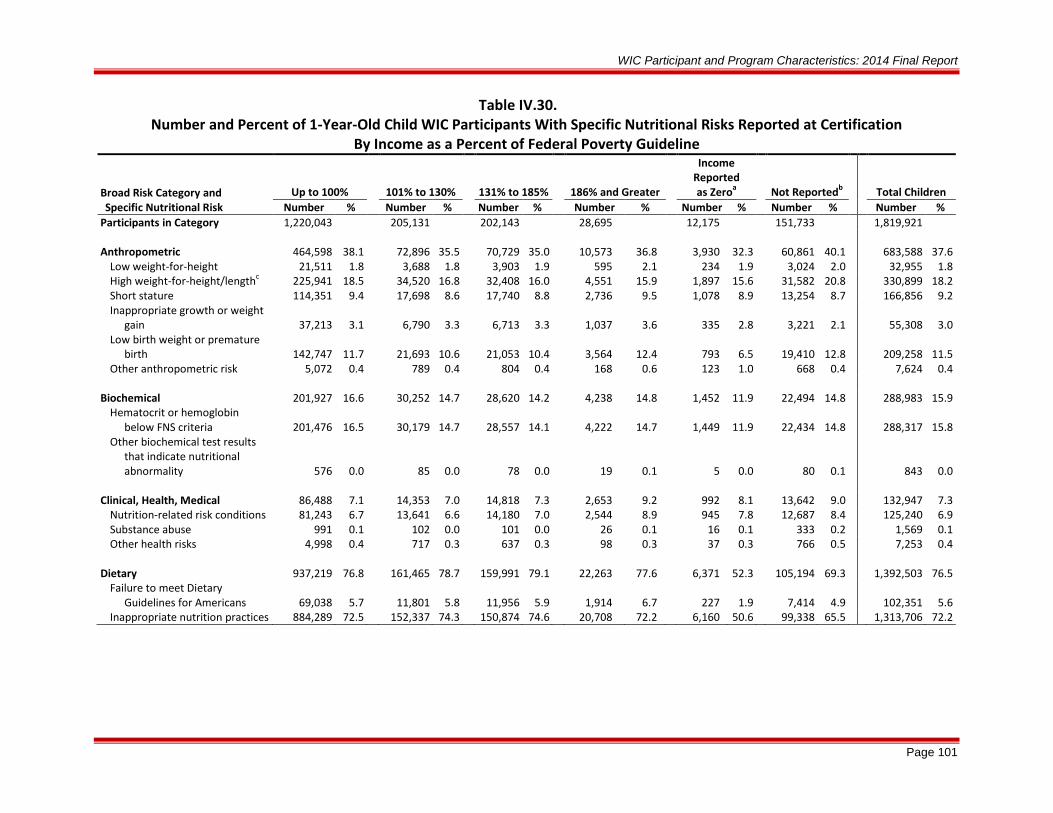
WIC Participant and Program Characteristics: 2014 Final Report
Page 101
Table IV.30. Number and Percent of 1-Year-Old Child WIC Participants With Specific Nutritional Risks Reported at Certification
By Income as a Percent of Federal Poverty Guideline
Broad Risk Category and Specific Nutritional Risk
Up to 100%
101% to 130%
131% to 185%
186% and Greater
Income Reported as Zeroa
Not Reportedb
Total Children Number % Number % Number % Number % Number % Number % Number %
Participants in Category 1,220,043
205,131
202,143
28,695
12,175
151,733
1,819,921
Anthropometric 464,598 38.1 72,896 35.5 70,729 35.0 10,573 36.8 3,930 32.3 60,861 40.1 683,588 37.6 Low weight-for-height 21,511 1.8 3,688 1.8 3,903 1.9 595 2.1 234 1.9 3,024 2.0 32,955 1.8 High weight-for-height/lengthc 225,941 18.5 34,520 16.8 32,408 16.0 4,551 15.9 1,897 15.6 31,582 20.8 330,899 18.2 Short stature 114,351 9.4 17,698 8.6 17,740 8.8 2,736 9.5 1,078 8.9 13,254 8.7 166,856 9.2 Inappropriate growth or weight
gain 37,213 3.1
6,790 3.3
6,713 3.3
1,037 3.6
335 2.8
3,221 2.1
55,308 3.0 Low birth weight or premature
birth 142,747 11.7
21,693 10.6
21,053 10.4
3,564 12.4
793 6.5
19,410 12.8
209,258 11.5 Other anthropometric risk 5,072 0.4 789 0.4 804 0.4 168 0.6 123 1.0 668 0.4 7,624 0.4
Biochemical 201,927 16.6 30,252 14.7 28,620 14.2 4,238 14.8 1,452 11.9 22,494 14.8 288,983 15.9 Hematocrit or hemoglobin
below FNS criteria 201,476 16.5
30,179 14.7
28,557 14.1
4,222 14.7
1,449 11.9
22,434 14.8
288,317 15.8 Other biochemical test results
that indicate nutritional abnormality 576 0.0
85 0.0
78 0.0
19 0.1
5 0.0
80 0.1
843 0.0
Clinical, Health, Medical 86,488 7.1 14,353 7.0 14,818 7.3 2,653 9.2 992 8.1 13,642 9.0 132,947 7.3 Nutrition-related risk conditions 81,243 6.7 13,641 6.6 14,180 7.0 2,544 8.9 945 7.8 12,687 8.4 125,240 6.9 Substance abuse 991 0.1 102 0.0 101 0.0 26 0.1 16 0.1 333 0.2 1,569 0.1 Other health risks 4,998 0.4 717 0.3 637 0.3 98 0.3 37 0.3 766 0.5 7,253 0.4
Dietary 937,219 76.8 161,465 78.7 159,991 79.1 22,263 77.6 6,371 52.3 105,194 69.3 1,392,503 76.5 Failure to meet Dietary
Guidelines for Americans 69,038 5.7
11,801 5.8
11,956 5.9
1,914 6.7
227 1.9
7,414 4.9
102,351 5.6 Inappropriate nutrition practices 884,289 72.5 152,337 74.3 150,874 74.6 20,708 72.2 6,160 50.6 99,338 65.5 1,313,706 72.2

WIC Participant and Program Characteristics: 2014 Final Report
Page 102
Table IV.30. (continued) Number and Percent of 1-Year-Old Child WIC Participants With Specific Nutritional Risks Reported at Certification
By Income as a Percent of Federal Poverty Guideline
Broad Risk Category and Specific Nutritional Risk
Up to 100%
101% to 130%
131% to 185%
186% and Greater
Income Reported as Zeroa
Not Reportedb
Total Children Number % Number % Number % Number % Number % Number % Number %
Other Risk 84,419 6.9 10,224 5.0 9,034 4.5 1,716 6.0 3,084 25.3 19,686 13.0 128,163 7.0 Regression/Transfer/
Presumptive eligibility 13,836 1.1
1,916 0.9
2,015 1.0
292 1.0
2,086 17.1
6,650 4.4
26,796 1.5 Breastfeeding mother and infant
dyad 317 0.0
60 0.0
62 0.0
10 0.0
1 0.0
17 0.0
467 0.0 Infant of WIC-eligible or mother
at risk during pregnancy 8,880 0.7
1,423 0.7
1,449 0.7
253 0.9
59 0.5
639 0.4
12,703 0.7 Homelessness/migrancy 4,502 0.4 391 0.2 247 0.1 71 0.2 130 1.1 870 0.6 6,211 0.3 Other nutritional risks 58,339 4.8 6,583 3.2 5,413 2.7 1,142 4.0 853 7.0 11,737 7.7 84,068 4.6
No Risk Reported 7,250 0.6 1,572 0.8 1,583 0.8 156 0.5 351 2.9 1,408 0.9 12,320 0.7
Notes
In 2014, State agencies could report up to 10 nutritional risks for each participant. This table examines all risks reported for every participant. When multiple risks (or risk criteria) within the same risk category are reported for one person, these risks are combined and counted one time to accurately calculate the number and percent of WIC participants with a specific risk or broad risk category. a Zero incomes are reported separately and excluded from the Federal poverty guideline calculations. In some reporting agencies, zero may be used to indicate missing information or adjunctive eligibility. PC2014 cannot distinguish between households with missing income information and households reporting zero income. b “Not reported” includes the number and percent of participants for whom data on income, income period, or size of economic unit are not reported. c Starting in PC2014, this risk reflects child length and weight measurements and parental (biological) obesity. Prior to 2014, this risk only reflected parental (biological) obesity.
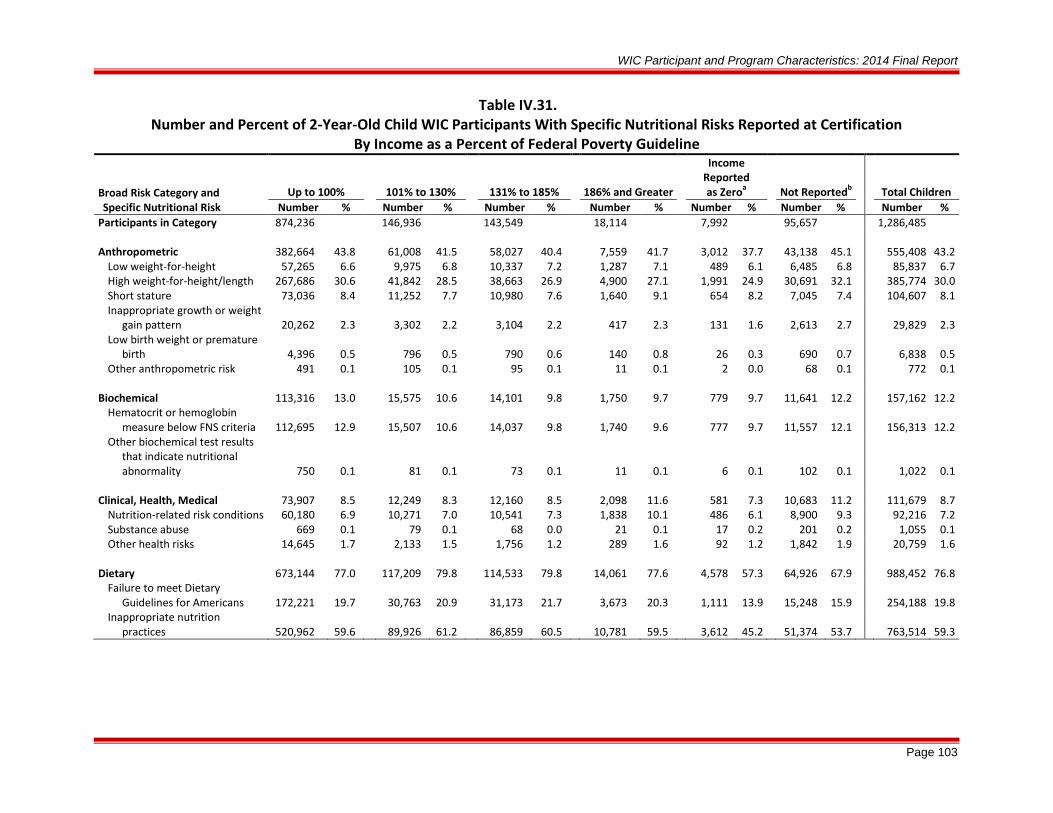
WIC Participant and Program Characteristics: 2014 Final Report
Page 103
Table IV.31. Number and Percent of 2-Year-Old Child WIC Participants With Specific Nutritional Risks Reported at Certification
By Income as a Percent of Federal Poverty Guideline
Broad Risk Category and Specific Nutritional Risk
Up to 100%
101% to 130%
131% to 185%
186% and Greater
Income Reported as Zeroa
Not Reportedb
Total Children Number % Number % Number % Number % Number % Number % Number %
Participants in Category 874,236
146,936
143,549
18,114
7,992
95,657 1,286,485
Anthropometric 382,664 43.8 61,008 41.5 58,027 40.4 7,559 41.7 3,012 37.7 43,138 45.1 555,408 43.2 Low weight-for-height 57,265 6.6 9,975 6.8 10,337 7.2 1,287 7.1 489 6.1 6,485 6.8 85,837 6.7 High weight-for-height/length 267,686 30.6 41,842 28.5 38,663 26.9 4,900 27.1 1,991 24.9 30,691 32.1 385,774 30.0 Short stature 73,036 8.4 11,252 7.7 10,980 7.6 1,640 9.1 654 8.2 7,045 7.4 104,607 8.1 Inappropriate growth or weight
gain pattern 20,262 2.3
3,302 2.2
3,104 2.2
417 2.3
131 1.6
2,613 2.7
29,829 2.3 Low birth weight or premature
birth 4,396 0.5
796 0.5
790 0.6
140 0.8
26 0.3
690 0.7
6,838 0.5 Other anthropometric risk 491 0.1 105 0.1 95 0.1 11 0.1 2 0.0 68 0.1 772 0.1
Biochemical 113,316 13.0 15,575 10.6 14,101 9.8 1,750 9.7 779 9.7 11,641 12.2 157,162 12.2 Hematocrit or hemoglobin
measure below FNS criteria 112,695 12.9
15,507 10.6
14,037 9.8
1,740 9.6
777 9.7
11,557 12.1
156,313 12.2 Other biochemical test results
that indicate nutritional abnormality 750 0.1
81 0.1
73 0.1
11 0.1
6 0.1
102 0.1
1,022 0.1
Clinical, Health, Medical 73,907 8.5 12,249 8.3 12,160 8.5 2,098 11.6 581 7.3 10,683 11.2 111,679 8.7 Nutrition-related risk conditions 60,180 6.9 10,271 7.0 10,541 7.3 1,838 10.1 486 6.1 8,900 9.3 92,216 7.2 Substance abuse 669 0.1 79 0.1 68 0.0 21 0.1 17 0.2 201 0.2 1,055 0.1 Other health risks 14,645 1.7 2,133 1.5 1,756 1.2 289 1.6 92 1.2 1,842 1.9 20,759 1.6
Dietary 673,144 77.0 117,209 79.8 114,533 79.8 14,061 77.6 4,578 57.3 64,926 67.9 988,452 76.8 Failure to meet Dietary
Guidelines for Americans 172,221 19.7
30,763 20.9
31,173 21.7
3,673 20.3
1,111 13.9
15,248 15.9
254,188 19.8 Inappropriate nutrition
practices 520,962 59.6
89,926 61.2
86,859 60.5
10,781 59.5
3,612 45.2
51,374 53.7
763,514 59.3

WIC Participant and Program Characteristics: 2014 Final Report
Page 104
Table IV.31. (continued) Number and Percent of 2-Year-Old Child WIC Participants With Specific Nutritional Risks Reported at Certification
By Income as a Percent of Federal Poverty Guideline
Broad Risk Category and Specific Nutritional Risk
Up to 100%
101% to 130%
131% to 185%
186% and Greater
Income Reported as Zeroa
Not Reportedb
Total Children Number % Number % Number % Number % Number % Number % Number %
Other Risks 55,865 6.4 6,454 4.4 5,559 3.9 1,012 5.6 1,970 24.6 13,184 13.8 84,045 6.5 Regression/Transfer/
Presumptive eligibility 11,456 1.3
1,619 1.1
1,710 1.2
221 1.2
1,270 15.9
4,576 4.8
20,852 1.6 Breastfeeding mother and
infant dyad 6 0.0
1 0.0
1 0.0
0 0.0
0 0.0
0 0.0
8 0.0 Infant of WIC-eligible mother or
mother at risk during pregnancy 472 0.1
51 0.0
48 0.0
9 0.0
. .
2 0.0
582 0.0 Homelessness/migrancy 3,539 0.4 297 0.2 201 0.1 62 0.3 98 1.2 605 0.6 4,802 0.4 Other nutritional risks 40,940 4.7 4,531 3.1 3,632 2.5 750 4.1 633 7.9 8,123 8.5 58,610 4.6
No Risk Reported 1,307 0.1 290 0.2 283 0.2 35 0.2 160 2.0 186 0.2 2,261 0.2
Notes
In 2014, State agencies could report up to 10 nutritional risks for each participant. This table examines all risks reported for every participant. When multiple risks (or risk criteria) within the same risk category are reported for one person, these risks are combined and counted one time to accurately calculate the number and percent of WIC participants with a specific risk or broad risk category. a Zero incomes are reported separately and excluded from the Federal poverty guideline calculations. In some reporting agencies, zero may be used to indicate missing information or adjunctive eligibility. PC2014 cannot distinguish between households with missing income information and households reporting zero income. b “Not reported” includes the number and percent of participants for whom data on income, income period, or size of economic unit are not reported.

WIC Participant and Program Characteristics: 2014 Final Report
Page 105
Table IV.32. Number and Percent of 3-Year-Old Child WIC Participants With Specific Nutritional Risks Reported at Certification
By Income as a Percent of Federal Poverty Guideline
Broad Risk Category and Specific Nutritional Risk
Up to 100%
101% to 130%
131% to 185%
186% and Greater
Income Reported as Zeroa
Not Reportedb
Total Children Number % Number % Number % Number % Number % Number % Number %
Participants in Category 786,329
131,485
125,822
15,319
6,296
82,023 1,147,273
Anthropometric 362,821 46.1 58,089 44.2 54,060 43.0 6,679 43.6 2,467 39.2 38,303 46.7 522,419 45.5 Low weight-for-height 50,389 6.4 8,596 6.5 8,745 7.0 1,013 6.6 403 6.4 5,652 6.9 74,798 6.5 High weight-for-height/length 267,620 34.0 42,232 32.1 38,449 30.6 4,718 30.8 1,719 27.3 27,728 33.8 382,466 33.3 Short stature 53,157 6.8 8,237 6.3 7,734 6.1 1,119 7.3 373 5.9 5,126 6.2 75,746 6.6 Inappropriate growth or weight
gain pattern 23,850 3.0
3,995 3.0
3,636 2.9
512 3.3
142 2.3
3,143 3.8
35,278 3.1 Low birth weight or premature
birth 1,185 0.2
191 0.1
181 0.1
25 0.2
5 0.1
164 0.2
1,752 0.2 Other anthropometric risk 377 0.0 67 0.1 87 0.1 7 0.0 0 0.0 66 0.1 604 0.1
Biochemical 74,013 9.4 10,124 7.7 9,101 7.2 1,138 7.4 482 7.7 7,661 9.3 102,519 8.9 Hematocrit or hemoglobin
measure below FNS criteria 73,536 9.4
10,069 7.7
9,062 7.2
1,129 7.4
480 7.6
7,601 9.3
101,877 8.9 Other biochemical test results
that indicate nutritional abnormality 558 0.1
63 0.0
42 0.0
9 0.1
4 0.1
67 0.1
743 0.1
Clinical, Health, Medical 78,518 10.0 12,863 9.8 12,244 9.7 1,979 12.9 513 8.1 10,711 13.1 116,829 10.2 Nutrition-related risk conditions 55,082 7.0 9,377 7.1 9,234 7.3 1,573 10.3 369 5.9 8,038 9.8 83,673 7.3 Substance abuse 673 0.1 93 0.1 59 0.0 9 0.1 9 0.1 189 0.2 1,032 0.1 Other health risks 25,382 3.2 3,778 2.9 3,289 2.6 461 3.0 146 2.3 2,890 3.5 35,945 3.1
Dietary 589,678 75.0 101,864 77.5 97,733 77.7 11,437 74.7 3,525 56.0 53,449 65.2 857,685 74.8 Failure to meet Dietary
Guidelines for Americans 166,655 21.2
30,123 22.9
29,856 23.7
3,444 22.5
949 15.1
14,698 17.9
245,726 21.4 Inappropriate nutrition practices 436,651 55.5 74,185 56.4 70,363 55.9 8,252 53.9 2,678 42.5 40,120 48.9 632,249 55.1

WIC Participant and Program Characteristics: 2014 Final Report
Page 106
Table IV.32. (continued) Number and Percent of 3-Year-Old Child WIC Participants With Specific Nutritional Risks Reported at Certification
By Income as a Percent of Federal Poverty Guidelines
Broad Risk Category and Specific Nutritional Risk
Up to 100%
101% to 130%
131% to 185%
186% and Greater
Income Reported as Zeroa
Not Reportedb
Total Children Number % Number % Number % Number % Number % Number % Number %
Other Risks 49,916 6.3 5,795 4.4 4,983 4.0 867 5.7 1,571 25.0 11,123 13.6 74,255 6.5 Regression/Transfer/
Presumptive eligibility 10,952 1.4
1,551 1.2
1,480 1.2
193 1.3
1,018 16.2
3,725 4.5
18,919 1.6 Breastfeeding mother and infant
dyad 7 0.0
2 0.0
0 0.0
0 0.0
0 0.0
0 0.0
9 0.0 Infant of WIC-eligible mother or
mother at risk during pregnancy 371 0.0
49 0.0
51 0.0
6 0.0
1 0.0
1 0.0
479 0.0 Homelessness/migrancy 3,100 0.4 265 0.2 172 0.1 48 0.3 66 1.0 466 0.6 4,117 0.4 Other nutritional risks 35,937 4.6 3,964 3.0 3,304 2.6 653 4.3 509 8.1 7,029 8.6 51,396 4.5
No Risk Reported 932 0.1 202 0.2 205 0.2 38 0.2 109 1.7 173 0.2 1,659 0.1
Notes
In 2014, State agencies could report up to 10 nutritional risks for each participant. This table examines all risks reported for every participant. When multiple risks (or risk criteria) within the same risk category are reported for one person, these risks are combined and counted one time to accurately calculate the number and percent of WIC participants with a specific risk or broad risk category. a Zero incomes are reported separately and excluded from the Federal poverty guideline calculations. In some reporting agencies, zero may be used to indicate missing information or adjunctive eligibility. PC2014 cannot distinguish between households with missing income information and households reporting zero income. b “Not reported” includes the number and percent of participants for whom data on income, income period, or size of economic unit are not reported.

WIC Participant and Program Characteristics: 2014 Final Report
Page 107
Table IV.33. Number and Percent of 4-Year-Old Child WIC Participants With Specific Nutritional Risks Reported at Certification
By Income as a Percent of Federal Poverty Guideline
Broad Risk Category and Specific Nutritional Risk
Up to 100%
101% to 130%
131% to 185%
186% and Greater
Income Reported as Zeroa
Not Reportedb
Total Children Number % Number % Number % Number % Number % Number % Number %
Participants in Category 483,958
82,393
77,315
9,362
3,985
47,483 704,497
Anthropometric 226,074 46.7 37,415 45.4 34,088 44.1 4,233 45.2 1,614 40.5 22,153 46.7 325,576 46.2 Low weight-for-height 27,819 5.7 4,868 5.9 4,945 6.4 596 6.4 253 6.3 3,060 6.4 41,541 5.9 High weight-for-height/length 171,658 35.5 28,109 34.1 24,924 32.2 3,031 32.4 1,102 27.7 16,623 35.0 245,447 34.8 Short stature 28,572 5.9 4,510 5.5 4,194 5.4 625 6.7 247 6.2 2,432 5.1 40,580 5.8 Inappropriate growth or weight
gain pattern 15,509 3.2
2,755 3.3
2,506 3.2
353 3.8
109 2.7
1,777 3.7
23,009 3.3 Low birth weight or premature
birth 636 0.1
100 0.1
117 0.2
17 0.2
3 0.1
111 0.2
985 0.1 Other anthropometric risk 190 0.0 34 0.0 36 0.0 8 0.1 0 0.0 29 0.1 297 0.0
Biochemical 32,009 6.6 4,341 5.3 3,958 5.1 498 5.3 228 5.7 3,072 6.5 44,105 6.3 Hematocrit or hemoglobin
measure below FNS criteria 31,816 6.6
4,320 5.2
3,935 5.1
496 5.3
228 5.7
3,044 6.4
43,838 6.2 Other biochemical test results
that indicate nutritional abnormality 209 0.0
25 0.0
23 0.0
3 0.0
0 0.0
31 0.1
291 0.0
Clinical, Health, Medical 52,459 10.8 8,722 10.6 8,405 10.9 1,314 14.0 397 10.0 6,767 14.3 78,063 11.1 Nutrition-related risk conditions 33,334 6.9 5,715 6.9 5,750 7.4 961 10.3 277 7.0 4,771 10.0 50,809 7.2 Substance abuse 510 0.1 75 0.1 48 0.1 17 0.2 9 0.2 129 0.3 788 0.1 Other health risks 20,562 4.2 3,263 4.0 2,832 3.7 383 4.1 122 3.1 2,163 4.6 29,325 4.2
Dietary 361,626 74.7 62,678 76.1 58,965 76.3 6,768 72.3 2,233 56.0 30,233 63.7 522,503 74.2 Failure to meet Dietary Guidelines
for Americans 100,375 20.7
18,548 22.5
18,217 23.6
2,053 21.9
636 16.0
8,317 17.5
148,145 21.0 Inappropriate nutrition practices 268,033 55.4 45,287 55.0 41,872 54.2 4,822 51.5 1,654 41.5 22,646 47.7 384,314 54.6

WIC Participant and Program Characteristics: 2014 Final Report
Page 108
Table IV.33. (continued) Number and Percent of 4-Year-Old Child WIC Participants WIC Specific Nutritional Risks Reported at Certification
By Income as a Percent of Federal Poverty Guidelines
Broad Risk Category and Specific Nutritional Risk
Up to 100%
101% to 130%
131% to 185%
186% and Greater
Income Reported as Zeroa
Not Reportedb
Total Children Number % Number % Number % Number % Number % Number % Number %
Other Risks 30,636 6.3 3,760 4.6 3,178 4.1 522 5.6 851 21.4 7,281 15.3 46,227 6.6 Regression/Transfer/Presumptive
eligibility 6,122 1.3
956 1.2
961 1.2
135 1.4
482 12.1
2,302 4.8
10,957 1.6 Breastfeeding mother and infant
dyad 5 0.0
0 0.0
0 0.0
0 0.0
0 0.0
0 0.0
5 0.0 Infant of WIC-eligible mother or
mother at risk during pregnancy 242 0.1
33 0.0
22 0.0
3 0.0
0 0.0
5 0.0
305 0.0 Homelessness/migrancy 1,870 0.4 166 0.2 103 0.1 29 0.3 47 1.2 239 0.5 2,454 0.3 Other nutritional risks 22,696 4.7 2,620 3.2 2,109 2.7 372 4.0 337 8.5 4,795 10.1 32,929 4.7
No Risk Reported 689 0.1 137 0.2 131 0.2 22 0.2 62 1.6 109 0.2 1,150 0.2
Notes
In 2014, State agencies could report up to 10 nutritional risks for each participant. This table examines all risks reported for every participant. When multiple risks (or risk criteria) within the same risk category are reported for one person, these risks are combined and counted one time to accurately calculate the number and percent of WIC participants with a specific risk or broad risk category. a Zero incomes are reported separately and excluded from the Federal poverty guideline calculations. In some reporting agencies, zero may be used to indicate missing information or adjunctive eligibility. PC2014 cannot distinguish between households with missing income information and households reporting zero income. b “Not reported” includes the number and percent of participants for whom data on income, income period, or size of economic unit are not reported.
WIC Participant and Program Characteristics: 2014 Final Report
Page 109
C. ANTHROPOMETRIC VALUES
Weight and height (or length) are measured and recorded during the eligibility determination process. Although State agencies have routinely collected these data for years, PC reporting has improved over time. Prior to the changes in nutritional risk standards implemented in 1999, each State agency set the criteria for determining overweight and underweight participants. Beginning in April 1999, State agencies were required to use, at a minimum, the FNS-issued definitions. State agencies could elect to implement stricter standards.
Measurements for WIC children aged 24 months and older have always been, and continue to be, compared with the statistical norms in the general population using National Center for Health Statistics-CDC (NCHS-CDC)30 standardized distributions. PC2014 is the first report to compare measurements for infants and children younger than 24 months of age against WHO growth charts. This change was prompted by updated anthropometric guidance provided in the May 2011 Memorandum. Prior to PC2014, growth percentiles for infants and 1-year-old children were calculated using the NCHS-CDC growth charts. Because of this change in standards, caution should be exercised in comparing growth percentile information in PC2014 with earlier PC reports.
The May 2011 Memorandum also introduced a new anthropometric risk criterion, high weight-for-length, for infants and children younger than 24 months of age. This new risk criterion is assigned to participants in this age range who are at or above the 97.7th percentile on gender-specific WHO growth charts. Previously, there was no criterion for this age group to classify a participant with excessive weight-for-length. The memorandum also revised the definitions for underweight/short stature and at risk for underweight/at risk of short stature to include infants and children younger than 24 months of age whose growth is less than or equal to the 2.3rd and 5th percentiles, respectively, on the WHO growth charts, rather than less than or equal to the 5th and 10th percentiles, respectively, on the CDC growth charts.
Tables IV.34 through IV.41 report information on anthropometric measures for infants and children. Tables IV.34 and IV.38 display percentages of infants and children who fell in the upper and lower limits of the standard distributions. The distributions of infant and child anthropometric data by race and ethnicity are presented in tables IV.35, IV.36, IV.39, and IV.40. Percentile categories presented in these tables have been updated to correspond to the revised criterion as described above. Table IV.37 shows the percent of infants and 1-year-old children who were considered underweight, to have high weight-for-length, and were of short stature according to FNS criteria, based on WHO standardized distributions. For children aged 2 or older, Table IV.41 shows those considered underweight and of short stature, as well as overweight (previously “at risk for overweight”) and obese (previously “overweight”). Table IV.41 categorizations are made according to FNS criteria, based on the NCHS-CDC standardized distributions.
30 The NCHS-CDC standardized distributions were updated in 2000 based on national surveys from 1963 to 1994. Participant characteristic reports prior to 2000 compared data on WIC participants with an earlier version of the NCHS-CDC standardized distribution that was produced in the 1970s and that did not use national data for infants. Because of these variations, caution should be exercised in comparing information from post-PC2000 reports with earlier PC reports.

WIC Participant and Program Characteristics: 2014 Final Report
Page 110
The change in percentile calculation (CDC versus WHO) and cutoff values for various anthropometric risks affected the categorization of infant and child participants. To aid in making accurate comparisons of WIC infant and child anthropometric measures over time, appendix C includes tabulations based on NCHS-CDC standardized distributions, and percentile categories based on nutritional risk growth criterion in place prior to PC2014. These appendix tables show anthropometric trends in the WIC infant and child population.
Based on FNS-issued criteria, in 2014, 5.8 percent of WIC infants were classified as underweight and 2.5 percent were at risk for becoming underweight, as shown in table IV.37. Table IV.37 also shows the percent of 1-year-old children categorized as underweight and at risk for becoming underweight was 0.6 percent for each category. As shown in appendix table C.IV.24, which compares trends in the infant WIC population over time, the small increase in infants in the lower percentiles for weight-for-length between 2010 and 2012 was balanced by a slight decrease in these percentiles for 2014, such that the 2014 levels are very similar to those for 2010. Appendix table C.IV.38 shows an increase in the percentage of 1-year-old children in the lower percentiles for weight-for-length between 2010 and 2014. The proportion of 1-year-old children at or below the 10th percentile increased from 5.0 percent in 2010 to 5.9 percent in 2014.
The percent of WIC infants and 1-year-old children classified as high weight-for-length, a new risk criterion for 2014, was 6.8 percent and 12.7 percent respectively (see table IV.37). Appendix Table C.IV.34 shows the percentage of infants in the higher weight-for-length percentiles in 2014 remained similar to that for 2012. There was a continued steady decrease in the percent of 1-year-old children in the higher percentiles between 2010 and 2014 (see appendix table C.IV.38). The proportion of 1-year-old children at or above the 97th percentile for weight-for-length increased from 11.6 percent in 2000 to a high of 12.1 percent in 2004, then remained constant through 2010 (12.0 percent). This proportion decreased to 10.2 percent between 2010 and 2014.
Table IV.37 shows 11.3 percent of infants and 6.4 percent of 1-year-old children were classified to be of short stature, and 6.6 percent of infants and 4.4 percent of 1-year-old children were classified at risk for short stature. These percentages, as well as the trend for stature in the WIC infant and child population (see appendix tables C.IV.34 and C.IV.38), remained relatively unchanged between 2010 and 2014.
In PC2014, 15.5 percent of children aged 2 and older were categorized as overweight (previously “at risk for overweight”) and an additional 13.9 percent were considered obese (previously “overweight”) (see table IV.41.). The proportion of children aged 2 and older with BMI percentile greater than or equal to 95 increased by 1.6 percentage points between 2002 and 2008. It has since decreased nearly 1 percentage point since 2008 (a decrease from 14.7 percent in 2008 to 14.6 percent in 2010, 14.0 percent in 2012, and 13.9 percent in 2014 (see table IV.38)). In 2014, 3.4 percent of children aged 2 and older were categorized as underweight and 2.7 percent were at risk of becoming underweight (see table IV.41). Appendix table C.IV.38 shows a nearly 1-percentage point increase since 2010 in the proportion of children aged 2 and older with BMI percentile at or below 10 (an increase from 5.5 percent in 2010 to 6.0 percent in 2012 and to 6.3 percent in 2014).

WIC Participant and Program Characteristics: 2014 Final Report
Page 111
Across racial categories, Black or African American Only infants and Asian Only 1-year-old children were most likely to fall at or below the 5th percentile for weight-for-length, and below the 10th percentile for weight-for-age. Black or African American Only infants and 1-year-old children, as well as Asian Only and White Only 1-year-old children, were most likely to be at or below the 5th percentile for length for age. Black or African American Only and Asian Only children aged 2 and older had the greatest likelihood of falling at or below the 10th percentile for weight-for-height. Asian Only children aged 2 and older were most likely to be below the 10th percentile for weight-for-age, and at or below the 10th percentile for height-for-age.
American Indian or Alaska Native Only and Native Hawaiian or Other Pacific Islander Only infants and 1-year-old children were most likely to fall at or above the 97.7th percentile for weight-for-length. Children aged 2 or older of these races were also more likely to fall at or above the 85th percentile for BMI, and at or above the 95th percentile for weight-for -age. Native Hawaiian or Other Pacific Islander infants and 1-year-old children had the greatest likelihood of falling at or above the 95th percentile for weight-for-age. In general, these findings on weight-for-age by race and weight-for-length by race replicate data presented in WIC PC reports since 1992.
Table IV.42 presents information on anthropometric measurements for breastfeeding and postpartum women. The table uses BMI values, based on the relationship of weight to height, and applies FNS-issued criteria (based on the National Heart, Lung, and Blood Institute standards for weight status (National Institutes of Health, 1998). The height and weight measurements used to calculate BMI in table IV.42 are the values reported by States for the PC study. These measurements represent a woman's weight and height as of the reported date of measurement, typically at certification or within the current certification. Breastfeeding women 6 or more months postpartum were determined to be at risk based on their current BMI calculation. Women with BMI values less than 18.5 are considered underweight and values greater than or equal to 25.0 are considered overweight. Using these BMI cutoffs, 72 percent of breastfeeding women and 73 percent of postpartum women were overweight. Just about 1 percent of women in both categories were considered underweight. Prior to 2004, participant characteristic reports defined underweight as having a BMI less than 19.8 and overweight as having a BMI greater than or equal to 26.1. Application of these more-stringent measures suggests comparisons of PC2014 with reports earlier than PC2004 should be made with caution.
Although more than 70 percent of postpartum and breastfeeding women are overweight according to anthropometric measures, only about half of those women were assigned nutritional risks related to being overweight (see table IV.6). These differences between the incidence of high weight-for-height in the anthropometric risks and the reported nutritional risks could be attributed to two factors. First, and more importantly, some participants might have been overweight according to FNS-issued criteria, and the risk might not have been recorded because other risks might have been considered more important or urgent. Similarly, we note that only around half of breastfeeding women were assigned the “part of a breastfeeding dyad” risk, when by definition all women in this category had that risk. Second, while most State agencies use the FNS overweight definition, some State agencies might have chosen to use higher percentile cutoffs than issued by FNS, which would lead to fewer participants classified as overweight in table IV.6 compared with table IV.42. Reported nutritional risks are based on State agency-specific criteria defining overweight, while the anthropometric data use the national standard.

WIC Participant and Program Characteristics: 2014 Final Report
Page 112
State agency-specific variations in overweight criteria coupled with State agency differences in the WIC population can lead to differences in the incidence of high weight-for-height between the two measures.

WIC Participant and Program Characteristics: 2014 Final Report
Page 113
Table IV.34. Distribution of Infanta WIC Participants According To
Selected Anthropometric Measures: 2014 WHO Percentilesb Percent by Percentilec Weight-for-Lengthd
≤ 2.3rd percentilef 5.8 ≤ 5thf 8.3 ≤ 10th 12.6 ≥ 90th 18.6 ≥ 95th 11.3 ≥ 97.7thf 6.8 Invalid or unreported anthropometric data 4.5
Weight-for-Agee < 3rd percentile 7.9
< 5th 9.9 < 10th 14.9 ≥ 90th 8.6 ≥ 95th 4.2 ≥ 97th 2.6 Invalid or unreported anthropometric data 1.9
Length-for-Aged e ≤ 2.3rd percentilef 11.3
≤ 5thf 16.4 ≤ 10th 22.9 Invalid or unreported anthropometric data 2.6
WIC Infants 2,141,988 Notes
Anthropometric criteria are calculated using programming code for pediatric anthropometry developed by the WHO based on WHO Child Growth Standards (2006). a An infant is defined as a participant who, at certification, is younger than 1 year of age and who would be classified as a child at the age of 366 days. b WHO = World Health Organization c Percentiles reported in this table are cumulative. For example, the <5th category includes those infants in the <=2.3rd percentile, and the ≥95th category includes those infants in the ≥97.7th percentile. d It is assumed that length for an infant is recumbent length. e Age is calculated in months using birth dates and dates length and weight are measured. f FNS-issued risk criteria.

WIC Participant and Program Characteristics: 2014 Final Report
Page 114
Table IV.35. Distribution of Infanta WIC Participants by Race According to Selected Anthropometric Measures
WHO Percentilesb
American Indian or Alaska Native
Only Asian Only Black or African American Only
Native Hawaiian or Other Pacific
Islander Only White Only Two or More
Races Race Not Reported
Weight-for-Lengthc ≤ 2.3rd percentilee 5.7 6.3 7.5 4.6 5.3 4.4 2.7
≤ 5the 8.1 9.0 10.3 6.8 7.7 6.6 4.0 ≤ 10the 12.1 14.0 15.2 9.9 11.9 10.5 6.2 ≥ 90th 21.4 16.3 17.3 23.9 18.5 19.8 12.3 ≥ 95th 13.4 9.6 10.6 15.3 11.2 12.1 7.7 ≥ 97.7the 8.4 5.7 6.6 9.2 6.7 7.3 5.1 Invalid or unreported anthropometric data 4.0 3.8 6.1 3.2 3.9 3.9 43.3
Weight-for-Aged < 3rd percentile 5.7 6.4 10.8 6.3 7.3 7.3 4.3
< 5th 7.4 8.3 13.3 7.7 9.2 9.2 5.4 < 10th 11.5 13.1 19.4 11.8 13.9 13.9 8.0 ≥ 90th 10.6 7.3 7.1 13.2 8.9 9.4 6.8 ≥ 95th 5.3 3.4 3.5 7.2 4.3 4.7 4.1 ≥ 97th 3.4 2.1 2.2 4.9 2.7 3.0 2.9 Invalid or unreported anthropometric data 1.8 1.3 2.0 1.2 1.8 1.7 41.7
Length-for-Agec d ≤ 2.3rd percentilee 8.6 9.3 14.5 10.2 10.7 11.2 6.5
≤ 5the 13.1 14.1 20.1 15.1 15.6 16.4 9.1 ≤ 10the 18.9 20.3 26.8 21.4 22.2 23.0 12.6 Invalid or unreported anthropometric data 2.5 2.2 3.3 1.8 2.3 2.3 42.8
WIC Infants 193,678 67,330 480,234 17,651 1,247,561 129,955 5,578
Notes
Anthropometric criteria are calculated using programming code for pediatric anthropometry developed by the WHO based on WHO Child Growth Standards (2006).
WHO reference curves are based on data from the WHO Multicenter Growth Reference Study conducted by WHO from 1997 to 2003.
Percentiles reported in this table are cumulative. For example, the <5th category includes those infants in the <=2.3rd percentile, and the ≥95th category includes those infants in the ≥97.7th percentile. a An infant is defined as a participant who, at certification, is younger than 1 year of age and who would be classified as a child at the age of 366 days. b WHO = World Health Organization c It is assumed that length for an infant is recumbent length. d Age is calculated in months using birth dates and dates length and weight are measured. e FNS-issued risk criteria.

WIC Participant and Program Characteristics: 2014 Final Report
Page 115
Table IV.36. Distribution of Infanta WIC Participants by Ethnicity According To
Selected Anthropometric Measures
WHO Percentilesb Hispanic Not Hispanic Ethnicity Not
Reported Weight-for-Lengthc
≤ 2.3rd percentilee 4.9 6.4 0.9 ≤ 5the 7.0 9.1 1.5 ≤ 10the 10.9 13.7 2.1 ≥ 90th 20.9 17.1 6.1 ≥ 95th 12.8 10.4 3.6 ≥ 97.7the 7.8 6.3 2.3 Invalid or unreported anthropometric data 3.8 4.8 71.5
Weight-for-Aged < 3rd percentile 6.0 9.0 2.7
< 5th 7.7 11.3 2.9 < 10th 11.8 16.7 4.2 ≥ 90th 9.7 8.0 2.7 ≥ 95th 4.7 3.9 1.6 ≥ 97th 2.9 2.5 0.7 Invalid or unreported anthropometric data 1.6 1.9 71.6
Length-for-Agec d
≤ 2.3rd percentilee 9.7 12.3 3.5 ≤ 5the 14.5 17.5 4.4 ≤ 10the 20.8 24.2 6.4 Invalid or unreported anthropometric data 2.1 2.9 71.6
WIC Infants 813,038 1,327,150 1,799 Notes
Anthropometric criteria are calculated using programming code for pediatric anthropometry developed by the WHO based on WHO Child Growth Standards (2006).
WHO reference curves are based on data from the WHO Multicentre Growth Reference Study conducted by WHO from 1997 to 2003.
Percentiles reported in this table are cumulative. For example, the <5th category includes those infants in the <=2.3rd percentile, and the ≥95th category includes those infants in the ≥97.7th percentile. a An infant is defined as a participant who, at certification, is younger than 1 year of age and who would be classified as a child at the age of 366 days. b WHO = World Health Organization c It is assumed that length for an infant is recumbent length. d Age is calculated in months using birth dates and dates length and weight are measured. e FNS-issued risk criteria.

WIC Participant and Program Characteristics: 2014 Final Report
Page 116
Table IV.37. Number and Percent of Infant and 1-Year-Old Child WIC Participants at Risk According To
FNS-Issued Nutritional Risk Criteria for Anthropometric Measures
Infants 1-Year-Old Children
FNS-Issued Nutritional Risk Criteria Number Percent Number Percent Weight-for-Lengtha
Underweight 123,828 5.8 11,427 0.6 At risk for underweight 53,610 2.5 11,541 0.6 High weight-for-length 146,671 6.8 231,045 12.7 Weight or length not reported 43,973 2.1 18,914 1.0 Weight and length not reported 27,782 1.3 15,523 0.9
Length-for-Ageb
Short stature 242,730 11.3 116,495 6.4
At risk for stature 107,702 5.0 80,068 4.4 Length not reported 40,065 1.9 17,630 1.0
Total in Age Group 2,141,988
1,819,921 Notes
Anthropometric criteria are calculated using programming code for pediatric anthropometry developed by WHO based on WHO Child Growth Standards (2006).
WHO reference curves are based on data from the WHO Multicentre Growth Reference Study conducted by WHO from 1997 to 2003.
Age is calculated in months using birth dates and dates length and weight are measured. a Infants and 1-year-old children falling at or below the 2.3rd percentile for weight-for- length meet the FNS-issued criteria for underweight for age or length. Infants and 1-year-old children falling above the 2.3rd percentile and at or below the 5th percentile are considered at risk for underweight. b Infants and 1-year-old children falling at or below the 2.3rd percentile for length-for-age meet the FNS-issued criteria for short stature. Infants and 1-year-old children falling above the 2.3rd percentile and at or below the 5th percentile are considered at risk for short stature.
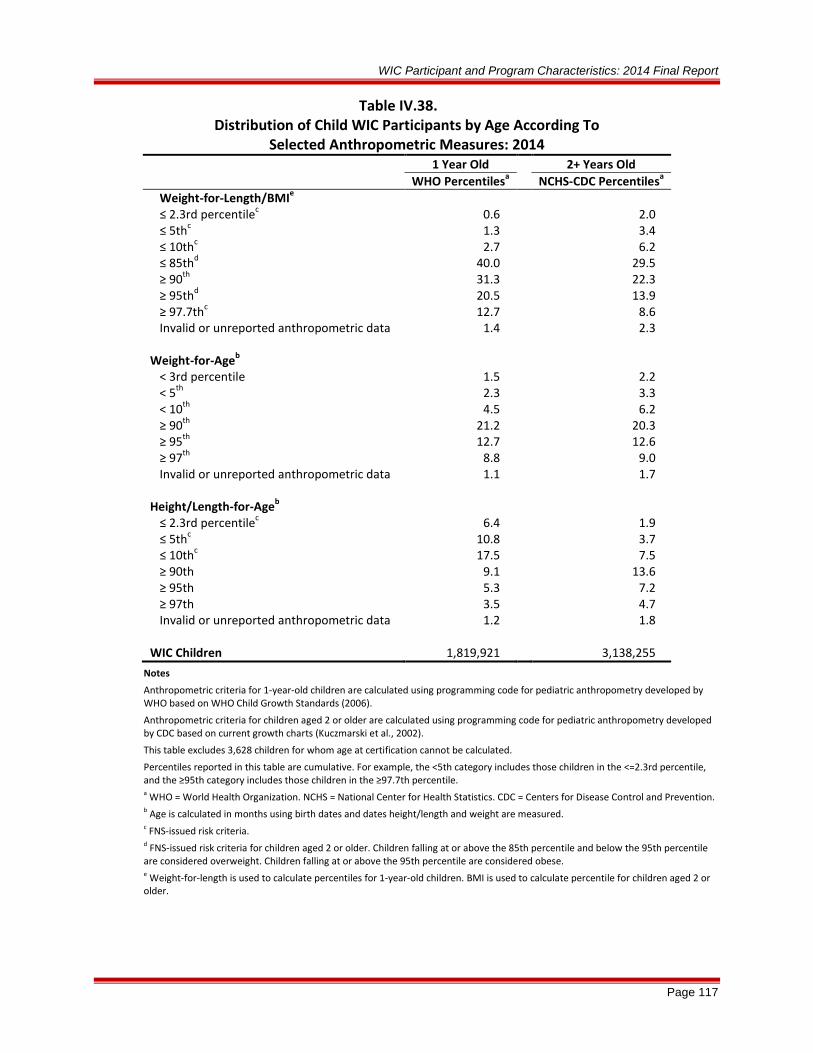
WIC Participant and Program Characteristics: 2014 Final Report
Page 117
Table IV.38. Distribution of Child WIC Participants by Age According To
Selected Anthropometric Measures: 2014
1 Year Old 2+ Years Old
WHO Percentilesa NCHS-CDC Percentilesa
Weight-for-Length/BMIe ≤ 2.3rd percentilec 0.6 2.0 ≤ 5thc 1.3 3.4 ≤ 10thc 2.7 6.2 ≤ 85thd 40.0 29.5 ≥ 90th 31.3 22.3 ≥ 95thd 20.5 13.9 ≥ 97.7thc 12.7 8.6 Invalid or unreported anthropometric data 1.4 2.3
Weight-for-Ageb
< 3rd percentile 1.5 2.2
< 5th 2.3 3.3 < 10th 4.5 6.2 ≥ 90th 21.2 20.3 ≥ 95th 12.7 12.6 ≥ 97th 8.8 9.0 Invalid or unreported anthropometric data 1.1 1.7
Height/Length-for-Ageb
≤ 2.3rd percentilec 6.4 1.9
≤ 5thc 10.8 3.7 ≤ 10thc 17.5 7.5 ≥ 90th 9.1 13.6 ≥ 95th 5.3 7.2 ≥ 97th 3.5 4.7 Invalid or unreported anthropometric data 1.2 1.8
WIC Children 1,819,921 3,138,255 Notes
Anthropometric criteria for 1-year-old children are calculated using programming code for pediatric anthropometry developed by WHO based on WHO Child Growth Standards (2006).
Anthropometric criteria for children aged 2 or older are calculated using programming code for pediatric anthropometry developed by CDC based on current growth charts (Kuczmarski et al., 2002).
This table excludes 3,628 children for whom age at certification cannot be calculated.
Percentiles reported in this table are cumulative. For example, the <5th category includes those children in the <=2.3rd percentile, and the ≥95th category includes those children in the ≥97.7th percentile. a WHO = World Health Organization. NCHS = National Center for Health Statistics. CDC = Centers for Disease Control and Prevention. b Age is calculated in months using birth dates and dates height/length and weight are measured. c FNS-issued risk criteria. d FNS-issued risk criteria for children aged 2 or older. Children falling at or above the 85th percentile and below the 95th percentile are considered overweight. Children falling at or above the 95th percentile are considered obese. e Weight-for-length is used to calculate percentiles for 1-year-old children. BMI is used to calculate percentile for children aged 2 or older.

WIC Participant and Program Characteristics: 2014 Final Report
Page 118
Table IV.39. Distribution of Child WIC Participants by Age and Race According to Selected Anthropometric Measures
American Indian or Alaska Native Only
Asian Only
Black or African American Only
Native Hawaiian or Other Pacific Islander Only
White Only
Two or More Races
Race Not Reported WHO/NCHS-CDC Percentilesa
1 Year
2+ Years
1 Year
2+ Years
1 Year
2+ Years
1 Year
2+ Years
1 Year
2+ Years
1 Year
2+ Years
1 Year
2+ Years
Weight-for-Length/BMIe ≤ 2.3rd percentilec 0.6 2.0 1.1 3.2 0.8 2.9 0.6 1.7 0.5 1.6 0.5 1.6 0.5 1.9 ≤ 5thc 1.4 3.3 2.3 5.3 1.7 4.9 1.0 2.9 1.0 2.8 1.0 3.0 0.9 3.3 ≤ 10thc 2.8 5.8 5.1 9.5 3.4 8.5 2.2 5.3 2.2 5.3 2.4 5.6 2.4 5.7 ≥ 85thd 41.0 33.7 27.2 22.7 37.3 25.0 44.0 32.7 41.2 30.2 40.7 29.1 31.3 26.8 ≥ 90th 32.7 26.1 20.3 16.8 29.1 18.5 35.0 24.9 32.3 22.8 32.0 21.9 24.9 20.9 ≥ 95thd 22.1 17.1 12.2 10.3 19.1 11.2 23.5 15.7 21.1 14.2 20.9 13.5 16.3 13.8 ≥ 97.7thc 14.0 10.9 7.1 6.3 11.9 6.7 14.9 9.7 12.9 8.7 12.9 8.2 10.4 8.9 Invalid or unreported
anthropometric data 2.1 3.3
1.2 1.7
1.2 1.7
1.0 2.0
1.2 2.1
1.3 2.4
22.5 18.8
Weight-for-Ageb < 3rd percentile 1.1 1.6 2.1 3.7 1.7 2.3 1.3 2.6 1.3 2.1 1.3 2.0 1.0 1.8 < 5th 1.8 2.6 3.5 5.8 2.6 3.5 2.1 3.9 2.1 3.3 2.1 3.1 1.4 2.9 < 10th 3.8 5.1 7.0 10.3 5.1 6.2 4.2 6.8 4.2 6.1 4.1 5.8 3.2 5.2 ≥ 90th 22.5 23.3 14.2 14.8 21.3 20.9 25.8 23.7 21.1 19.5 22.5 20.7 16.9 18.1 ≥ 95th 13.7 15.1 8.1 9.1 12.9 12.6 16.4 15.3 12.5 12.1 13.5 12.7 10.7 11.6 ≥ 97th 9.5 11.0 5.5 6.3 9.0 8.8 12.0 11.2 8.6 8.6 9.3 9.0 7.3 8.5 Invalid or unreported
anthropometric data 1.8 2.6
1.0 1.3
0.9 1.3
0.9 1.5
0.9 1.4
1.1 1.9
22.0 18.2

WIC Participant and Program Characteristics: 2014 Final Report
Page 119
Table IV.39. (continued) Distribution of Child WIC Participants by Age and Race According to Selected Anthropometric Measures
American Indian or Alaska Native Only
Asian Only
Black or African American Only
Native Hawaiian or Other Pacific Islander Only
White Only
Two or More Races
Race Not Reported WHO/NCHS-CDC Percentilesa
1 Year
2+ Years
1 Year
2+ Years
1 Year
2+ Years
1 Year
2+ Years
1 Year
2+ Years
1 Year
2+ Years
1 Year
2+ Years
Height/Length-for-Ageb ≤ 2.3rd percentilec 5.6 1.6 6.3 2.6 6.4 1.5 6.9 2.6 6.5 1.9 5.7 1.8 5.4 2.0 ≤ 5thc 9.8 3.3 11.0 5.1 10.4 2.9 11.5 5.0 11.1 3.9 9.8 3.5 9.2 3.7 ≤ 10thc 16.2 6.8 17.9 10.3 16.5 5.8 17.9 9.3 18.2 8.0 16.3 7.0 14.2 7.1 ≥ 90th 9.8 14.4 9.6 10.9 11.3 19.0 11.7 15.4 8.0 11.7 9.7 14.2 7.9 11.6 ≥ 95th 5.9 7.6 5.9 5.6 6.9 10.6 7.4 8.6 4.5 5.9 5.6 7.6 4.9 6.3 ≥ 97th 3.9 5.0 3.9 3.6 4.6 7.1 5.0 5.6 2.9 3.7 3.7 4.9 3.3 3.9 Invalid or unreported
anthropometric data 1.9 2.6
1.1 1.5
1.1 1.9
1.0 1.6
1.0 1.4
1.2 2.0
22.2 18.0
WIC Children 179,573 430,536 59,979 102,866 376,119 583,076 13,933 27,258 1,076,115 1,788,151 110,386 199,885 3,816 6,483
Notes
Anthropometric criteria for 1-year-old children are calculated using programming code for anthropometry developed by WHO based on WHO Child Growth Standards (2006).
WHO reference curves are based on data from the WHO Multicentre Growth Reference Study conducted by WHO from 1997 to 2003.
Anthropometric criteria for children aged 2 or older are calculated using programming code for pediatric anthropometry developed by CDC based on current growth charts (Kuczmarski et al., 2002).
NCHS-CDC reference curves are based on data from a series of national health examination surveys conducted by NCHS from 1963 to 1994.
Age is not reported for 106 American Indian or Alaska Native children, 50 Asian children, 1,399 Black or African American children, 5 Native Hawaiian or Other Pacific Islander children, 1,966 White children, 98 children reporting two or more races, and 4 children missing race information.
Percentiles reported in this table are cumulative. For example, the <5th category includes those children in the <=2.3rd percentile, and the ≥95th category includes those children in the ≥97.7th percentile. a WHO = World Health Organization. NCHS = National Center for Health Statistics. CDC = Centers for Disease Control and Prevention. b Age is calculated in months using birth dates and dates height/length and weight are measured. c FNS-issued risk criteria. d FNS-issued risk criteria for children aged 2 or older. Children at or above the 85th percentile and less than the 95th percentile are considered overweight. Children at or above the 95th percentile are considered obese. e Weight-for-length is used to calculate percentiles for 1-year-old children. BMI is used to calculate percentiles for children aged 2 or older.

WIC Participant and Program Characteristics: 2014 Final Report
Page 120
Table IV.40. Distribution of Child WIC Participants by Age and Ethnicity According To
Selected Anthropometric Measures
Hispanic
Not Hispanic
Ethnicity Not Reported
WHO/NCHS-CDC Percentilesa 1 Year 2+ Years 1 Year 2+ Years 1 Year 2+ Years Weight-for-Length/BMIe
≤ 2.3rd percentilec 0.4 1.5 0.7 2.3 0.4 2.2 ≤ 5thc 1.0 2.7 1.4 4.0 0.8 3.6 ≤ 10thc 2.1 5.0 2.9 7.1 2.2 6.0 ≥ 85thd 42.6 33.0 38.0 26.3 31.2 29.0 ≥ 90th 33.7 25.4 29.6 19.4 25.0 23.0 ≥ 95thd 22.4 16.4 19.1 11.6 16.2 15.3 ≥ 97.7thc 14.0 10.4 11.6 6.8 10.6 10.0 Invalid or unreported
anthropometric data 1.4 2.6
1.2 1.9
26.3 15.9
Weight-for-Ageb < 3rd percentile 1.1 1.8 1.6 2.4 0.8 1.8 < 5th 1.8 2.8 2.6 3.7 1.1 2.9 < 10th 3.7 5.5 5.0 6.7 2.5 5.4 ≥ 90th 22.1 21.8 20.5 18.9 16.7 20.1 ≥ 95th 13.3 14.0 12.2 11.3 10.2 12.9 ≥ 97th 9.3 10.2 8.4 7.9 6.8 9.5 Invalid or unreported
anthropometric data 1.1 1.9
0.9 1.4
25.7 15.2
Height/Length-for-Ageb ≤ 2.3rd percentilec 6.1 1.8 6.6 1.9 5.8 2.1 ≤ 5thc 10.6 3.6 10.9 3.7 9.5 3.9 ≤ 10thc 17.5 7.5 17.5 7.3 14.2 7.4 ≥ 90th 8.3 12.4 9.6 14.6 8.1 12.8 ≥ 95th 4.8 6.3 5.6 7.8 5.0 6.8 ≥ 97th 3.1 4.1 3.8 5.1 3.1 4.2 Invalid or unreported
anthropometric data 1.1 1.7
1.1 1.7
25.5 14.6
WIC Children 751,667 1,465,807 1,066,499 1,668,504 1,755 3,943
Notes
Anthropometric criteria for 1-year-old children are calculated using programming code for pediatric anthropometry developed by WHO based on WHO Child Growth Standards (2006).
WHO reference curves are based on data from the WHO Multicentre Growth Reference Study conducted by WHO from 1997 to 2003.
Anthropometric criteria for children aged 2 or older are calculated using programming code for pediatric anthropometry developed by CDC based on current growth charts (Kuczmarski et al., 2002).
NCHS-CDC reference curves are based on data from a series of national health examination surveys conducted by NCHS from 1963 to 1994.
Age is not reported for 871 Hispanic children, 2,754 non-Hispanic children, and 3 children missing ethnicity information.
Percentiles reported in this table are cumulative. For example, the <5th category includes those children in the <=2.3rd percentile, and the ≥95th category includes those children in the ≥97.7th percentile. a WHO = World Health Organization. NCHS = National Center for Health Statistics. CDC = Centers for Disease Control and Prevention. b Age is calculated in months using birth dates and dates height/length and weight are measured. c FNS-issued risk criteria. d FNS-issued risk criteria for children aged 2 or older. Children at or above the 85th percentile and less than the 95th percentile are considered overweight. Children at or above the 95th percentile are considered obese. e Weight-for-length is used to calculate percentiles for 1-year-old children. BMI is used to calculate percentiles for children aged 2 or older.

WIC Participant and Program Characteristics: 2014 Final Report
Page 121
Table IV.41. Number and Percent of Child WIC Participants Aged 2 or Older at Risk According To
FNS-Issued Nutritional Risk Criteria for Anthropometric Measures
2 Yearsc 3 Years 4 Years
Total Children Age 2 Years or Older
FNS-Issued Nutritional Risk Criteria Number % Number % Number % Number %
BMIa
Underweight 43,898 3.4 39,661 3.5 23,295 3.3 106,854 3.4
At risk for underweight 36,208 2.8 31,702 2.8 17,674 2.5 85,583 2.7 Overweight 196,121 15.2 178,272 15.5 113,471 16.1 487,863 15.5 Obese 164,216 12.8 163,668 14.3 108,425 15.4 436,310 13.9 Weight or height not reported 16,487 1.3 13,664 1.2 8,324 1.2 38,475 1.2 Weight and height not reported 13,136 1.0 11,124 1.0 7,164 1.0 31,424 1.0
Height-for-Ageb
Short stature 56,296 4.4 39,066 3.4 21,182 3.0 116,544 3.7
At risk for short stature 55,507 4.3 40,009 3.5 22,109 3.1 117,625 3.7 Height not reported 15,584 1.2 12,992 1.1 7,936 1.1 36,512 1.2
Children in Age Group 1,286,485
1,147,273
704,497
3,138,255 Notes
Anthropometric criteria are calculated using programming code for pediatric anthropometry developed by CDC based on current growth charts (Kuczmarski et al., 2002).
NCHS-CDC reference curves are based on data from a series of national health examination surveys conducted by NCHS from 1963 to 1994.
This table excludes 3,628 children for whom age at certification cannot be calculated. a Children falling at or below the 5th percentile for BMI meet the FNS-issued criteria for underweight for height. Children falling above the 5th percentile and at or below the 10th percentile are considered at risk for underweight. Children falling at or above the 85th percentile and below the 95th percentile are considered overweight. Children falling at or above the 95th percentile are considered obese. b Children falling at or below the 5th percentile for height-for-age meet the FNS-issued criteria for short stature. Children falling above the 5th percentile and at or below the 10th percentile are considered at risk for short stature. Age is calculated in months using birth dates and dates height and weight are measured. c Weight-for-length percentile is used for children aged 2 at certification who were younger than 24 months old at height/weight measurement.

WIC Participant and Program Characteristics: 2014 Final Report
Page 122
Table IV.42. Number and Percent of Breastfeeding and Postpartum Women WIC Participants at Risk
According to FNS-Issued Nutritional Risk Criteria for Anthropometric Measures
Breastfeeding Postpartum
FNS-Issued Nutritional Risk Criteria Number % Number % Current Weight-for-Height
Underweighta 5,120 0.7 5,819 0.9 Overweighta 494,872 72.0 450,129 73.1 Weight not reported 9,227 1.3 9,673 1.6 Height not reported 6,656 1.0 7,323 1.2 Weight or height not reported 10,745 1.6 10,582 1.7 Weight and height not reported 5,138 0.7 6,413 1.0
Women in Category 687,351
615,559 Notes
a Underweight is defined as BMI less than 18.5. Overweight is defined as BMI greater than or equal to 25.0. Prior to PC2004, reports defined underweight as BMI less than 19.8, and overweight as BMI greater than or equal to 26.1.

WIC Participant and Program Characteristics: 2014 Final Report
Page 123
D. BLOOD MEASURES
Beginning in April 1999, FNS established national standards for determining nutritional risk using hemoglobin and hematocrit measures based on recommendations from CDC. Table IV.43 reports the FNS-issued criteria for different categories of WIC participants. Comparisons of data from PC2000 and later years with prior participant characteristic reports should be made with caution due to two policy changes: (1) prior to 2000, State agencies could set their own criteria for hemoglobin and hematocrit measures, and (2) CDC cutoffs changed slightly between PC1998 and PC2000.
As part of the MDS for PC2014, State agencies reported hemoglobin and hematocrit values for women and children as well as for infants older than 9 months. Blood measures were reported for 68.2 percent of all participants (see table IV.44). Most of the missing values were for infants, who are not required to undergo hematological testing unless they are certified for WIC benefits when they are older than 9 months. In addition, Federal regulations allow for children aged 2 to 4 who had normal results at previous certification appointments to be tested annually. In these cases, State agency information systems may report blood measures as missing. Unreported blood measures for women reflect, in part, that WIC policy allows participants to complete blood tests within 90 days of certification.
Tables IV.45 and IV.46 provide information on numbers and proportions of WIC participants falling below the FNS-issued hematologic standards for anemia. One-quarter (25.1 percent) of all WIC women were anemic. Anemia rates for postpartum women were high (38.0 percent), but appear to be leveling off after a gradual increase from 35.3 percent in 2002 to 38.5 percent in 2012. Anemia rates for breastfeeding women increased at a higher rate, from 24.5 percent in 2002 to 34.2 percent in 2012, but appeared to be leveling off at 33.4 percent in 2014. For children, anemia rates decreased with age from 16.4 percent among 1-year-old children to 7.0 percent among 4-year-olds. Note that in computing table entries for both women and children, percentages below FNS standards were calculated by excluding women and children for whom data were not reported from numerators, but including them in denominators. While percentages reported here must be treated as representative of lower bound estimates of the prevalence of anemia in the WIC population, these estimates may be close to the true values. Since children aged 2 to 4 with normal hematocrit and hemoglobin values within the 6 months prior to certification are not required to be tested, unreported data are likely to be concentrated among children who had normal blood values.
Recent nationally representative data on the prevalence of iron deficiency among women during childbearing years from the National Health and Nutrition Examination Survey (NHANES) can be used as a basis for comparison between WIC participants and the U.S. population. Information from NHANES 2009–2012 indicated between 13 percent and 17 percent of nonpregnant women aged 15 to 45 displayed hemoglobin or hematocrit values below the FNS-issued cutoffs.31 WIC breastfeeding and postpartum women were therefore about twice as likely as the general population to show evidence of anemia. The rates of anemia in tables IV.45 and IV.46 are based on hematologic measurements reported by State agencies in the PC2014 data. A 31 There was an increase in anemia rates in the NHANES data between the 2005–2006 and 2007–2008 waves. A change in lab instrumentation between these waves may have contributed to the increase.

WIC Participant and Program Characteristics: 2014 Final Report
Page 124
portion of these data for breastfeeding and postpartum women were reported within the first 6 weeks of delivery and therefore contributed to a high level of anemia in these groups. Due to the impact of pregnancy and birth, it may take a woman 4–6 weeks postpartum to return to a prepregnancy level of iron. Anemia rates among WIC pregnant women in their first or second trimesters of pregnancy were similar to the national rates of nonpregnant women.
Information on anemia by race and ethnicity appears in tables IV.47 through IV.50. Interpretation of these data must include consideration of unreported data, which were higher for American Indian or Alaska Native Only and multiracial WIC women than for women in other racial and ethnic categories. In PC2014, as in previous reports, Black or African American Only women and children displayed the highest reported levels of anemia (38.5 percent of women and 20.3 percent of children). American Indian or Alaska Native Only, White Only, and multiracial WIC women participants and American Indian or Alaska Native Only child participants reported the lowest levels of anemia (19.4 percent, 21.8 percent, 22.2 percent, and 8.0 percent, respectively). Across racial and ethnic categories, the percentage of anemic children measured against FNS criteria was highest for 1-year-olds and then decreased with age.

WIC Participant and Program Characteristics: 2014 Final Report
Page 125
Table IV.43. FNS-Issued Nutritional Risk Eligibility For
Hemoglobin and Hematocrit Levels
Participant Category FNS-Issued
Nutritional Risk Criteria Hemoglobin
Pregnant Women First trimester 11.0
Second trimester 10.5 Third trimester 11.0
Breastfeeding Women and Postpartum Women Younger than 15 years old 11.8
15–17 years old 12.0 18 years and older 12.0
Children 1 year old 11.0
2–4 years old 11.1
Hematocrit Pregnant Women
First trimester 33.0 Second trimester 32.0 Third trimester 33.0
Breastfeeding Women and Postpartum Women Younger than 15 years old 35.7
15–17 years old 35.9 18 years and older 35.7
Children 1 year old 32.9
2–4 years old 33.0 Notes
FNS-issued nutritional risk criteria for hemoglobin and hematocrit values are based on CDC recommendations (HHS, 1998). Participants with blood measures below the cutoff values are considered to be at risk.
Hemoglobin values are reported in grams per deciliter. Hematocrit values are reported as percents. Values are reported for nonsmoking women with no adjustments for altitude. State agencies can choose to use values with adjustments for smoking and altitude.

WIC Participant and Program Characteristics: 2014 Final Report
Page 126
Table IV.44. Availability of Hematological Data for WIC Participants: Percent of WIC Participants
By Participant Category With Specific Types of Hematological Measures
Type of Measure Pregnant Women
Breastfeeding Women
Postpartum Women
Total Women
Infantsa
Children
Total WIC
Participants in Category 896,551 687,351 615,559 2,199,461 2,141,988 4,961,804 9,303,253
Participants With Test Report For...
Hemoglobin 77.1 77.2 81.1 78.2 4.2 76.0 60.0
Hematocrit 3.1 4.4 3.4 3.6 0.1 3.8 2.9 Hemoglobin and hematocrit 11.0 9.7 7.3 9.5 0.5 5.5 5.3
Blood Measure Not Reported 8.8 8.7 8.2 8.6 95.2 14.7 31.8
Total 100.0 100.0 100.0 100.0 100.0 100.0 100.0 Notes a An infant is defined as a participant who at certification is younger than 1 year of age and would be classified as a child at the age of 366 days. Federal WIC regulations permit State and local agencies to dispense with hematological testing for infants younger than 9 months of age as well as for children who are found to be within normal ranges at their last certification. However, blood tests should be performed on such children at least once in every 12-month period.

WIC Participant and Program Characteristics: 2014 Final Report
Page 127
Table IV.45. Number and Percent of Women WIC Participants Falling Below FNS-Issued Nutritional Risk Criteria for Hematologic Standards
Pregnant Women
First Trimester
Second Trimester
Third Trimester
Not Reporteda
Breastfeeding Women
Postpartum Women
Total Women
Hematologic Standard Number % Number % Number % Number % Number % Number % Number % Women in Category 509,194
301,089
84,324
1,943
687,351
615,559
2,199,461
FNS-Issued Nutritional Risk
Criteria
Hemoglobin 37,066 7.3 26,769 8.9 21,981 26.1 0 0.0 215,366 31.3 222,964 36.2 524,147 23.8 Hematocrit 995 0.2 1,240 0.4 997 1.2 0 0.0 14,531 2.1 10,920 1.8 28,683 1.3
Blood Measure Not Reportedb 43,215 8.5 27,433 9.1 8,013 9.5 621 31.9 60,460 8.8 51,198 8.3 190,940 8.7
Notes
Percent below FNS nutritional risk criteria includes in denominators women for whom no data were reported so the percentages reported here represent lower bounds.
Values reported here are additive; hemoglobin and hematocrit are mutually exclusive categories. For example, in April 2014, blood test values reported for 25.1% (or 552,830) of WIC women met the FNS-issued criteria for anemia.
FNS-issued nutritional risk criteria for hemoglobin and hematocrit values are based on CDC recommendations (HHS, 1998). (See table IV.43.) a “Not reported” indicates the number and percent of participants for whom data on expected date of delivery or weeks gestation were not reported. b “Not reported” indicates the number and percent of participants for whom data on blood measures were not reported.

WIC Participant and Program Characteristics: 2014 Final Report
Page 128
Table IV.46. Number and Percent of Child WIC Participants Falling Below FNS-Issued Nutritional Risk Criteria for Hematologic Standards
1 Year
2 Years
3 Years
4 Years
Age Not Reported
Total Children
Standard Number % Number % Number % Number % Number % Number % Children in Age Group 1,819,921
1,286,485
1,147,273
704,497
3,628
4,961,804
FNS-Issued Nutritional Risk Criteria
Hemoglobin 289,362 15.9 156,793 12.2 104,743 9.1 48,762 6.9 0 0.0 599,660 12.1 Hematocrit 9,790 0.5 4,310 0.3 2,871 0.3 897 0.1 0 0.0 17,868 0.4
Blood Measure Not Reporteda 241,561 13.3 202,890 15.8 172,195 15.0 109,738 15.6 609 16.8 726,993 14.7
Notes
Percent below FNS-issued nutritional risk criteria includes in denominators children for whom no data were reported, so the percentages reported here represent lower bounds.
Values reported here are additive; hemoglobin and hematocrit are mutually exclusive categories. For example, in April 2014, blood test values for 12.5% (or 617,528) of WIC children met the FNS-issued criteria for anemia.
Federal WIC regulations permit State and local agencies to dispense with hematological testing for infants younger than 9 months of age as well as for children who are found to be within normal ranges at their last certification. However, blood tests should be performed on such children at least once in every 12-month period.
FNS-issued nutritional risk criteria for hemoglobin and hematocrit values are based on CDC recommendations (HHS, 1998). a “Not reported” indicates the number and percent of participants for whom data on blood measures were not reported.

WIC Participant and Program Characteristics: 2014 Final Report
Page 129
Table IV.47. Number and Percent of Anemic Women WIC Participants by Participant Category and Race
American Indian or Alaska Native
Only
Asian Only
Black or African
American Only
Native Hawaiian or
Pacific Islander Only
White Only
Two or More Races
Race Not Reported
Total Women
Number % Number % Number % Number % Number % Number % Number % Number %
Women in Category 228,756
79,034
451,325
19,381
1,351,395
65,947
3,623
2,199,461 Below FNS-issued
nutritional risk criteria 44,271 19.4
20,104 25.4
173,973 38.5
5,071 26.2
294,338 21.8
14,657 22.2
415 11.5
552,830 25.1 Not reporteda 36,395 15.9 8,793 11.1 33,363 7.4 2,084 10.8 100,744 7.5 9,273 14.1 1,610 44.4 192,263 8.7
Pregnant Women 98,857
30,448
176,086
7,302
555,968
26,405
1,485
896,551 Below FNS-issued
nutritional risk criteria 5,475 5.5
2,692 8.8
35,080 19.9
729 10.0
42,909 7.7
2,082 7.9
81 5.4
89,049 9.9 Not reporteda 17,761 18.0 3,795 12.5 12,665 7.2 771 10.6 40,980 7.4 4,112 15.6 520 35.0 80,605 9.0
Breastfeeding Women 76,204
30,192
122,584
6,836
428,716
21,733
1,084
687,351 Below FNS-issued
nutritional risk criteria 22,165 29.1
10,469 34.7
58,662 47.9
2,323 34.0
129,700 30.3
6,397 29.4
181 16.7
229,897 33.4 Not reporteda 10,214 13.4 3,172 10.5 9,619 7.8 795 11.6 33,260 7.8 2,907 13.4 493 45.4 60,460 8.8
Postpartum Women 53,695
18,394
152,655
5,242
366,710
17,809
1,054
615,559 Below FNS-issued
nutritional risk criteria 16,631 31.0
6,943 37.7
80,231 52.6
2,019 38.5
121,729 33.2
6,179 34.7
154 14.6
233,884 38.0 Not reporteda 8,420 15.7 1,826 9.9 11,078 7.3 519 9.9 26,504 7.2 2,254 12.7 597 56.7 51,198 8.3
Notes
Percent below FNS-issued criteria includes in denominators women for whom no data were reported so the percentages reported here represent lower bounds. As noted in tables IV.45 and IV.46, estimates are additive.
FNS-issued nutritional risk criteria for hemoglobin and hematocrit values are based on CDC recommendations (HHS, 1998). a “Not reported” indicates the number and percent of participants, by participant category, for whom data on blood measures were not reported. For pregnant woman, also includes participants missing data on expected date of delivery or weeks gestation. For breastfeeding and postpartum women, includes participants missing data on age.
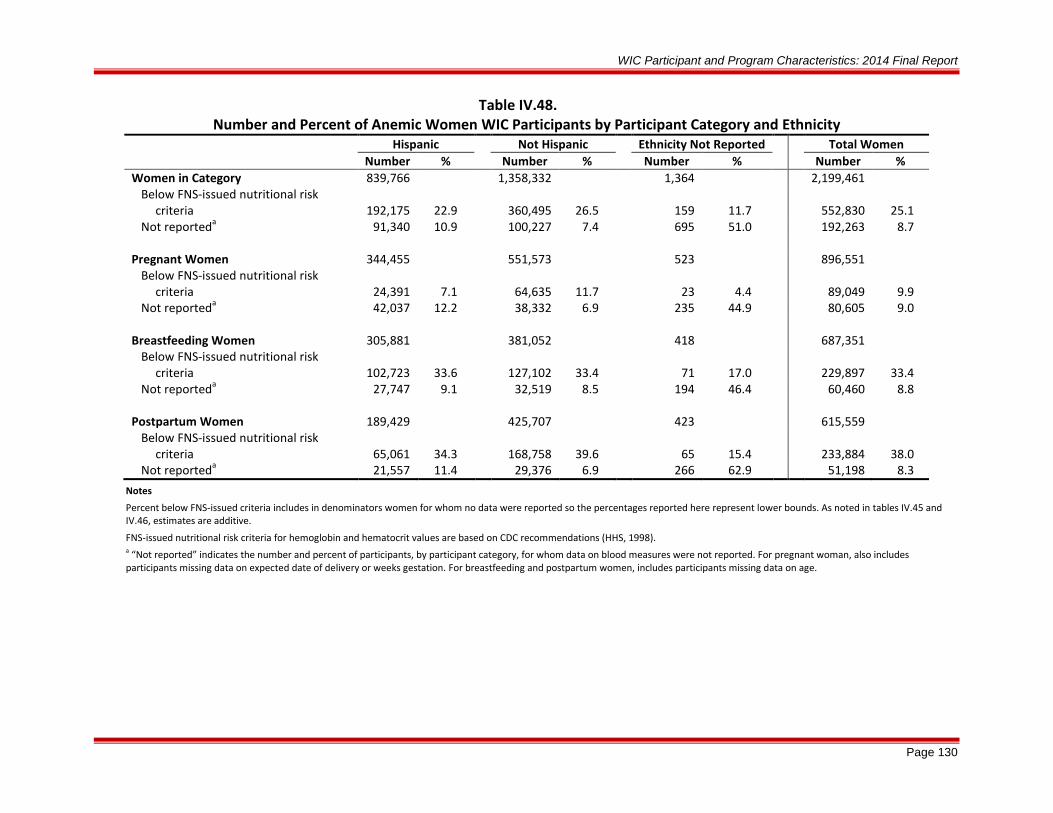
WIC Participant and Program Characteristics: 2014 Final Report
Page 130
Table IV.48. Number and Percent of Anemic Women WIC Participants by Participant Category and Ethnicity
Hispanic Not Hispanic Ethnicity Not Reported Total Women
Number % Number % Number % Number %
Women in Category 839,766
1,358,332
1,364
2,199,461 Below FNS-issued nutritional risk
criteria 192,175 22.9
360,495 26.5
159 11.7
552,830 25.1 Not reporteda 91,340 10.9 100,227 7.4 695 51.0 192,263 8.7
Pregnant Women 344,455
551,573
523
896,551 Below FNS-issued nutritional risk
criteria 24,391 7.1
64,635 11.7
23 4.4
89,049 9.9 Not reporteda 42,037 12.2 38,332 6.9 235 44.9 80,605 9.0
Breastfeeding Women 305,881
381,052
418
687,351 Below FNS-issued nutritional risk
criteria 102,723 33.6
127,102 33.4
71 17.0
229,897 33.4 Not reporteda 27,747 9.1 32,519 8.5 194 46.4 60,460 8.8
Postpartum Women 189,429
425,707
423
615,559 Below FNS-issued nutritional risk
criteria 65,061 34.3
168,758 39.6
65 15.4
233,884 38.0 Not reporteda 21,557 11.4 29,376 6.9 266 62.9 51,198 8.3
Notes
Percent below FNS-issued criteria includes in denominators women for whom no data were reported so the percentages reported here represent lower bounds. As noted in tables IV.45 and IV.46, estimates are additive.
FNS-issued nutritional risk criteria for hemoglobin and hematocrit values are based on CDC recommendations (HHS, 1998). a “Not reported” indicates the number and percent of participants, by participant category, for whom data on blood measures were not reported. For pregnant woman, also includes participants missing data on expected date of delivery or weeks gestation. For breastfeeding and postpartum women, includes participants missing data on age.
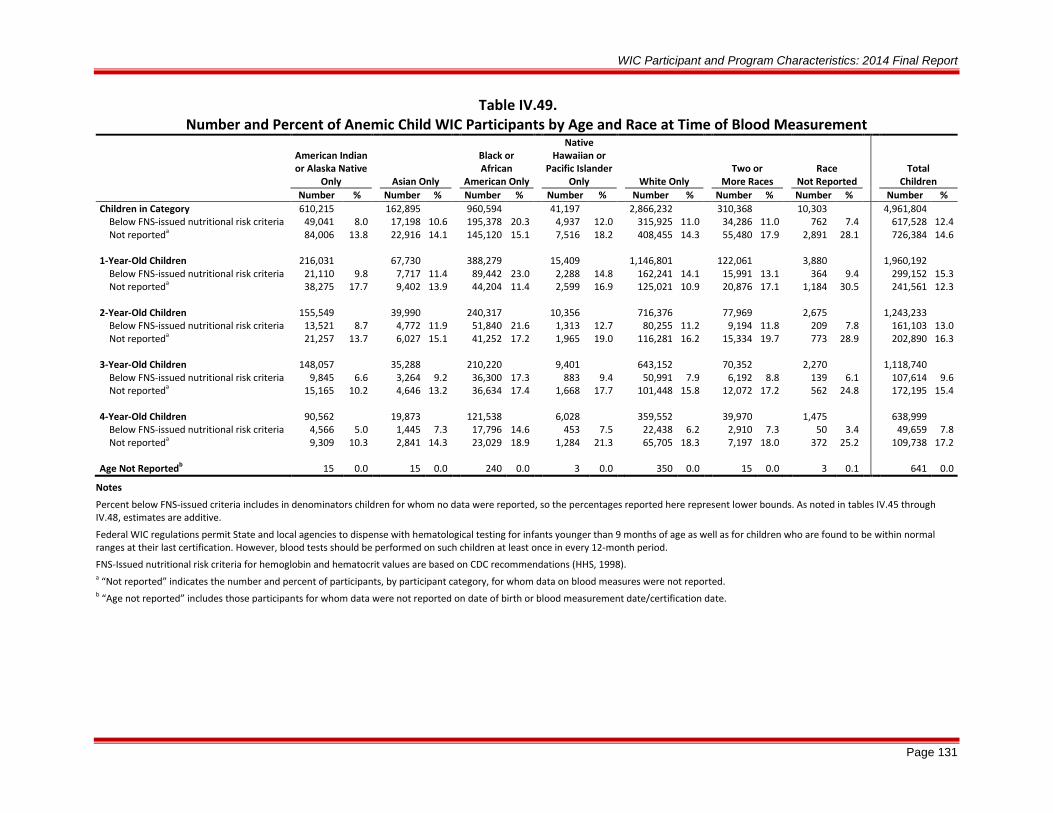
WIC Participant and Program Characteristics: 2014 Final Report
Page 131
Table IV.49. Number and Percent of Anemic Child WIC Participants by Age and Race at Time of Blood Measurement
American Indian or Alaska Native
Only
Asian Only
Black or African
American Only
Native Hawaiian or
Pacific Islander Only
White Only
Two or More Races
Race Not Reported
Total Children
Number % Number % Number % Number % Number % Number % Number % Number % Children in Category 610,215
162,895
960,594
41,197
2,866,232
310,368
10,303
4,961,804
Below FNS-issued nutritional risk criteria 49,041 8.0 17,198 10.6 195,378 20.3 4,937 12.0 315,925 11.0 34,286 11.0 762 7.4 617,528 12.4 Not reporteda 84,006 13.8 22,916 14.1 145,120 15.1 7,516 18.2 408,455 14.3 55,480 17.9 2,891 28.1 726,384 14.6
1-Year-Old Children 216,031
67,730
388,279
15,409
1,146,801
122,061
3,880
1,960,192 Below FNS-issued nutritional risk criteria 21,110 9.8 7,717 11.4 89,442 23.0 2,288 14.8 162,241 14.1 15,991 13.1 364 9.4 299,152 15.3
Not reporteda 38,275 17.7 9,402 13.9 44,204 11.4 2,599 16.9 125,021 10.9 20,876 17.1 1,184 30.5 241,561 12.3
2-Year-Old Children 155,549
39,990
240,317
10,356
716,376
77,969
2,675
1,243,233 Below FNS-issued nutritional risk criteria 13,521 8.7 4,772 11.9 51,840 21.6 1,313 12.7 80,255 11.2 9,194 11.8 209 7.8 161,103 13.0
Not reporteda 21,257 13.7 6,027 15.1 41,252 17.2 1,965 19.0 116,281 16.2 15,334 19.7 773 28.9 202,890 16.3
3-Year-Old Children 148,057
35,288
210,220
9,401
643,152
70,352
2,270
1,118,740 Below FNS-issued nutritional risk criteria 9,845 6.6 3,264 9.2 36,300 17.3 883 9.4 50,991 7.9 6,192 8.8 139 6.1 107,614 9.6
Not reporteda 15,165 10.2 4,646 13.2 36,634 17.4 1,668 17.7 101,448 15.8 12,072 17.2 562 24.8 172,195 15.4
4-Year-Old Children 90,562
19,873
121,538
6,028
359,552
39,970
1,475
638,999 Below FNS-issued nutritional risk criteria 4,566 5.0 1,445 7.3 17,796 14.6 453 7.5 22,438 6.2 2,910 7.3 50 3.4 49,659 7.8
Not reporteda 9,309 10.3 2,841 14.3 23,029 18.9 1,284 21.3 65,705 18.3 7,197 18.0 372 25.2 109,738 17.2
Age Not Reportedb 15 0.0 15 0.0 240 0.0 3 0.0 350 0.0 15 0.0 3 0.1 641 0.0
Notes
Percent below FNS-issued criteria includes in denominators children for whom no data were reported, so the percentages reported here represent lower bounds. As noted in tables IV.45 through IV.48, estimates are additive.
Federal WIC regulations permit State and local agencies to dispense with hematological testing for infants younger than 9 months of age as well as for children who are found to be within normal ranges at their last certification. However, blood tests should be performed on such children at least once in every 12-month period.
FNS-Issued nutritional risk criteria for hemoglobin and hematocrit values are based on CDC recommendations (HHS, 1998). a “Not reported” indicates the number and percent of participants, by participant category, for whom data on blood measures were not reported. b “Age not reported” includes those participants for whom data were not reported on date of birth or blood measurement date/certification date.

WIC Participant and Program Characteristics: 2014 Final Report
Page 132
Table IV.50. Number and Percent of Anemic Child WIC Participants by Age and Ethnicity at Time of Blood Measurement
Hispanic
Not Hispanic
Ethnicity Not Reported
Total Children
Number % Number % Number % Number %
Children in Ethnic Category 2,218,346
2,737,757
5,701
4,961,804 Below FNS-issued nutritional risk criteria 228,273 10.3 388,857 14.2 398 7.0 617,528 12.4
Not reporteda 283,166 12.8 441,974 16.1 1,244 21.8 726,384 14.6
1-Year-Old Children 838,625
1,119,700
1,867
1,960,192 Below FNS-issued nutritional risk criteria 108,371 12.9 190,612 17.0 169 9.1 299,152 15.3
Not reporteda 103,805 12.4 137,252 12.3 504 27.0 241,561 12.3
2-Year-Old Children 561,986
679,765
1,482
1,243,233 Below FNS-issued nutritional risk criteria 61,117 10.9 99,873 14.7 112 7.6 161,103 13.0
Not reporteda 75,723 13.5 126,841 18.7 326 22.0 202,890 16.3
3-Year-Old Children 522,552
594,844
1,343
1,118,740 Below FNS-issued nutritional risk criteria 41,069 7.9 66,461 11.2 84 6.3 107,614 9.6
Not reporteda 62,578 12.0 109,371 18.4 246 18.3 172,195 15.4
4-Year-Old Children 295,008
342,985
1,006
638,999 Below FNS-issued nutritional risk criteria 17,715 6.0 31,911 9.3 33 3.3 49,659 7.8
Not reporteda 41,060 13.9 68,510 20.0 168 16.7 109,738 17.2
Age not reportedb 175 0.0 463 0.0 3 0.1 641 0.0 Notes
Percent below FNS-issued criteria includes in denominators children for whom no data were reported, so the percentages reported here represent lower bounds. As noted in tables IV.45 through IV.49 estimates are additive.
Federal WIC regulations permit State and local agencies to dispense with hematological testing for infants younger than 9 months of age as well as for children who are found to be within normal ranges at their last certification. However, blood tests should be performed on such children at least once in every 12-month period.
FNS-issued nutritional risk criteria for hemoglobin and hematocrit values are based on CDC recommendations (HHS, 1998). a “Not reported” indicates the number and percent of participants, by participant category, for whom data on blood measures were not reported. b “Age not reported” includes those participants for whom data were not reported on date of birth or blood measurement date/certification date.

WIC Participant and Program Characteristics: 2014 Final Report
Page 133
V. RISK PRIORITY LEVELS
The number of participants served by WIC depends on the total funds available from Congress as well as on the allocation of these funds by FNS to individual State agencies. For each local agency, a maximum caseload is determined based on the agency’s funding level and predicted caseload turnover. When a local agency reaches the maximum participation level, caseload “slots” are allocated to eligible applicants according to their relative levels of risk, or Risk Priority levels. When funds are not sufficient to serve all eligible individuals who seek benefits, some agencies maintain waiting lists of eligible applicants to fill openings as they become available. At the time of PC2014 data collection, no agency exceeded its maximum participant capacity, so Risk Priority levels were not necessary for determining who would receive benefits.
This chapter presents data on the Risk Priority levels of WIC participants. Section A provides an overview of the system of Risk Priority levels established for WIC participants. Section B describes the distribution of priority levels of the WIC population in 2014. Section C compares Risk Priority levels of WIC participants in 2012 and 2014.
A. OVERVIEW OF RISK PRIORITY LEVELS
Federal regulations define seven levels of priority for service provision in local agencies. These levels are based on applicant categories and nutritional risk types (see table V.1). In general, precedence is given to medically based (anthropometric, biochemical, and medical) nutritional risks over risks based only on inadequate diet. Risk Priorities I through III are based on hematological or anthropometric measurements and medical conditions, while Risk Priorities IV through VI are based on dietary patterns. Furthermore, higher priority levels are assigned to infants, pregnant women, and breastfeeding women. State agencies may create subpriorities under any priority level using factors such as income or age, and they may expand Priority III, IV, or V to include high-risk postpartum women. In addition, State agencies have the option to assign Priority IV, V, or VI solely based on an applicant’s homeless or migrant status. Homeless or migrant participants with no other risks may be assigned to Priority VII regardless of their certification categories.

WIC Participant and Program Characteristics: 2014 Final Report
Page 134
Table V.1. WIC Risk Priorities
Priority Description I Pregnant women, breastfeeding women, and infants at nutritional risk as demonstrated by
hematological or anthropometric measurements, or other documented nutritionally related medical conditions that demonstrate the need for supplemental foods
II Except those infants who qualify for Priority I, infants up to 6 months of age of WIC program
participants who participated during pregnancy, and infants up to 6 months of age born of women who were not WIC program participants during pregnancy but whose medical records document they were at nutritional risk during pregnancy due to nutritional conditions detectable by biochemical or anthropometric measurements or other documented nutritionally related medical conditions that demonstrated the person’s need for supplemental foods
III Children at nutritional risk as demonstrated by hematological or anthropometric
measurements or other documented medical conditions that demonstrate the child’s need for supplemental foods
IV Pregnant women, breastfeeding women, and infants at nutritional risk because of an
inadequate dietary pattern V Children at nutritional risk because of an inadequate dietary pattern VI Postpartum women at nutritional risk VII Individuals certified for WIC solely due to homelessness or migrancy and, at State agency
option, in accordance with the provisions of paragraph (e)(1)(vi) of 7 C.F.R. § 246, previously certified participants who might regress in nutritional status without continued provision of supplemental foodsa
Notes a Source: Special Supplemental Nutrition Program for Women, Infants, and Children, 2014.
B. RISK PRIORITY LEVELS OF WIC PARTICIPANTS IN 2014
Risk Priority level distribution by participant category is presented in table V.2. State agencies reported priority levels for more than 99 percent of all WIC participants. Slightly less than one-third (31.4 percent) of the total WIC population was assigned to Priority I. An identical proportion (31.4 percent) was assigned to Priority III. Slightly less than one-quarter (23.9 percent) of the population was assigned to Priority V. Only 0.2 percent of the WIC population—the smallest proportion—was classified as Priority VII.
Approximately two-thirds of women (67.5 percent) and infants (65.8 percent) were considered highest priority and assigned to Priority I. Among women, the vast majority of pregnant and breastfeeding women (91.7 percent and 94.1 percent, respectively) were classified as Priority I. Most of the remainder of pregnant and breastfeeding women were assigned to Priority IV: 8.0 percent and 4.3 percent, respectively. Most of the remaining third of infants (28.7 percent) were assigned to Priority II, followed by 4.9 percent assigned to Priority IV.

WIC Participant and Program Characteristics: 2014 Final Report
Page 135
Postpartum women and children were less likely to be assigned medically based priorities and are thus more likely than other WIC participants are to be assigned dietary-based priorities. More than half of postpartum women (54.7 percent) were assigned to Priority VI, one-third (32.6 percent) to Priority III, and 6.5 percent to Priority V. More than half of children (54.8 percent) were assigned to Priority III, and most of the remainder of children (44.0 percent) were assigned to Priority V.
Tables V.3 and V.4 describe Risk Priority level distribution by age at certification for infants and children, respectively. Nearly two-thirds of infants in each age category were assigned to Priority I, including 66.0 percent of 0- to 3-month-olds and 9- to 11-month-olds, 61.1 percent of 4- to 5-month-olds, and 64.4 percent of 6- to 8-month-olds (see table V.3). Among the remainder of infants, the majority of infants younger than 6 months old at certification were assigned to Priority II, including 30.1 percent of 0- to 3-month-olds and 25.7 percent of 4- to 5-month-olds. The remaining proportion of infants aged 6 months and older at certification were assigned mostly to Priority IV, including 24.3 percent of 6- to 8-month-olds and 24.4 percent of 9- to 11-month-olds. Across all infants, the vast majority were 0 to 3 months old at certification.
Table V.4 shows slightly more than half of children at each year of age were assigned to medically based Priority III, with most of the remainder assigned to dietary-based Priority V. The proportion of children assigned to Priority III increased with age, from 51.0 percent of 1-year-old children to 57.1 percent of 4-year-old children. By complement, 46.6 percent of 1-year-old children and 42.3 percent of 4-year-old children were assigned to Priority V.

WIC Participant and Program Characteristics: 2014 Final Report
Page 136
Table V.2. Risk Priority Levels of All WIC Participants by Participant Category
Pregnant Women
Breastfeeding Women
Postpartum Women
Total Women
Infantsa
Children
Total WIC
Risk Priority Number % Number % Number % Number % Number % Number % Number % Risk Priority Reported
Ib 821,847 91.7 646,501 94.1 16,175 2.6 1,484,522 67.5 1,408,826 65.8 27,194 0.5 2,920,542 31.4 II 48 0.0 8,496 1.2 678 0.1 9,222 0.4 615,037 28.7 3,806 0.1 628,065 6.8 III 207 0.0 394 0.1 200,617 32.6 201,218 9.1 5,841 0.3 2,717,175 54.8 2,924,234 31.4 IV 72,065 8.0 29,768 4.3 20,211 3.3 122,043 5.5 104,904 4.9 5,249 0.1 232,196 2.5 V 176 0.0 297 0.0 40,095 6.5 40,568 1.8 2,195 0.1 2,181,980 44.0 2,224,743 23.9 VI 1,301 0.1 971 0.1 336,428 54.7 338,700 15.4 168 0.0 330 0.0 339,198 3.6 VII 166 0.0 311 0.0 355 0.1 832 0.0 1,083 0.1 19,963 0.4 21,878 0.2
No Risk Priority Reported 742 0.1
613 0.1
1,001 0.2
2,356 0.1
3,934 0.2
6,107 0.1
12,397 0.1
U.S. WIC 896,551
687,351
615,559
2,199,461
2,141,988
4,961,804
9,303,253
Notes
Percents may not add to 100.0% and subtotals may not add to totals due to rounding and to the use of weights in the case of several State agencies that either under- or overreported the number of participants.
Some 1-year-old children (2.45%) are 11-month-old infants who have been reclassified (though not formally recertified) as children. Overall, 0.02% of WIC participants who are classified as infants are participants more than 365 days old. a An infant is defined as a participant who at certification is younger than 1 year of age and would be classified as a child at the age of 366 days. b A small proportion of postpartum women and children may not have had their State agency-level records or priorities updated on State agency-maintained management information systems when they were certified for WIC benefits in different certification categories.
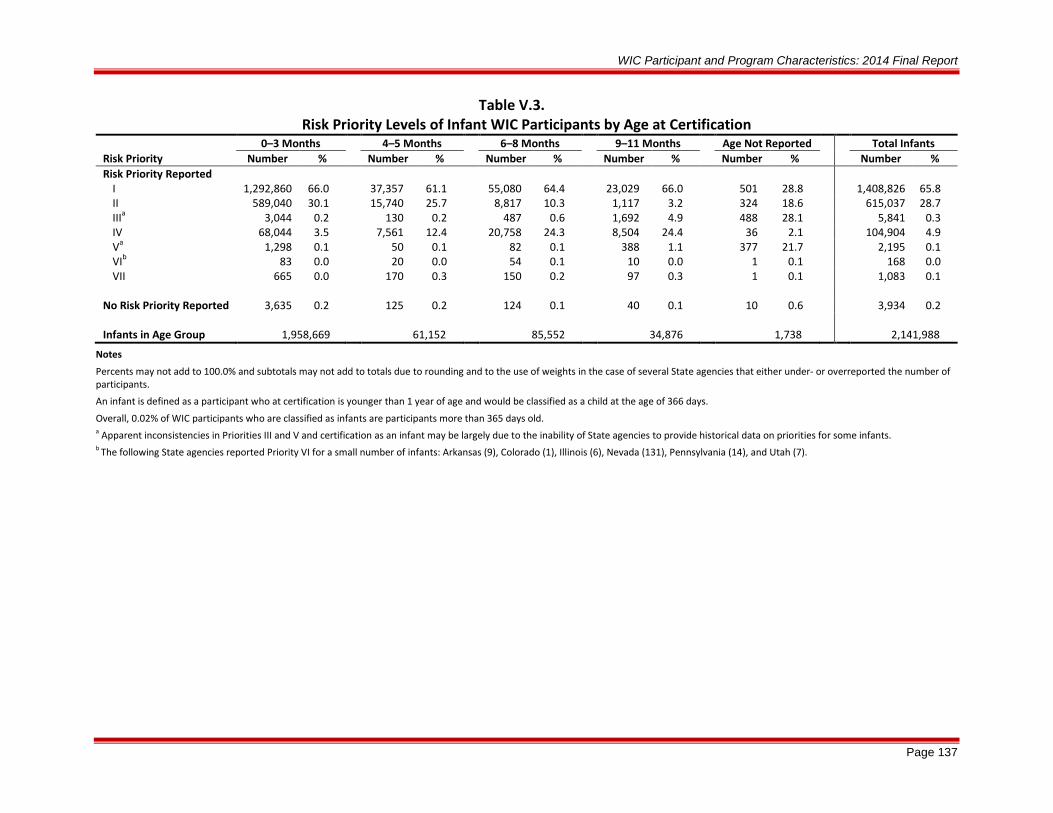
WIC Participant and Program Characteristics: 2014 Final Report
Page 137
Table V.3. Risk Priority Levels of Infant WIC Participants by Age at Certification
0–3 Months 4–5 Months 6–8 Months 9–11 Months Age Not Reported Total Infants Risk Priority Number % Number % Number % Number % Number % Number % Risk Priority Reported
I 1,292,860 66.0 37,357 61.1 55,080 64.4 23,029 66.0 501 28.8 1,408,826 65.8 II 589,040 30.1 15,740 25.7 8,817 10.3 1,117 3.2 324 18.6 615,037 28.7 IIIa 3,044 0.2 130 0.2 487 0.6 1,692 4.9 488 28.1 5,841 0.3 IV 68,044 3.5 7,561 12.4 20,758 24.3 8,504 24.4 36 2.1 104,904 4.9 Va 1,298 0.1 50 0.1 82 0.1 388 1.1 377 21.7 2,195 0.1 VIb 83 0.0 20 0.0 54 0.1 10 0.0 1 0.1 168 0.0 VII 665 0.0 170 0.3 150 0.2 97 0.3 1 0.1 1,083 0.1
No Risk Priority Reported 3,635 0.2 125 0.2 124 0.1 40 0.1 10 0.6 3,934 0.2
Infants in Age Group 1,958,669 61,152 85,552 34,876 1,738 2,141,988
Notes
Percents may not add to 100.0% and subtotals may not add to totals due to rounding and to the use of weights in the case of several State agencies that either under- or overreported the number of participants.
An infant is defined as a participant who at certification is younger than 1 year of age and would be classified as a child at the age of 366 days.
Overall, 0.02% of WIC participants who are classified as infants are participants more than 365 days old. a Apparent inconsistencies in Priorities III and V and certification as an infant may be largely due to the inability of State agencies to provide historical data on priorities for some infants. b The following State agencies reported Priority VI for a small number of infants: Arkansas (9), Colorado (1), Illinois (6), Nevada (131), Pennsylvania (14), and Utah (7).

WIC Participant and Program Characteristics: 2014 Final Report
Page 138
Table V.4. Risk Priority Levels of Child WIC Participants by Age at Certification
1 Year 2 Years 3 Years 4 Years Age Not Reported Total Children
Risk Priority Number % Number % Number % Number % Number % Number % Risk Priority Reported
Ia 25,092 1.4 1,041 0.1 644 0.1 395 0.1 22 0.6 27,194 0.5 IIa 3,722 0.2 42 0.0 22 0.0 15 0.0 5 0.1 3,806 0.1 III 928,682 51.0 725,420 56.4 658,270 57.4 402,603 57.1 2,200 60.6 2,717,175 54.8 IVa 5,199 0.3 30 0.0 13 0.0 7 0.0 0 0.0 5,249 0.1 V 848,146 46.6 553,009 43.0 481,315 42.0 298,148 42.3 1,362 37.5 2,181,980 44.0 VIb 195 0.0 46 0.0 50 0.0 38 0.0 1 0.0 330 0.0 VII 6,434 0.4 5,306 0.4 5,682 0.5 2,537 0.4 4 0.1 19,963 0.4
No Risk Priority Reported 2,451 0.1 1,591 0.1 1,278 0.1 753 0.1 34 0.9 6,107 0.1
Children in Age Group 1,819,921 1,286,485 1,147,273 704,497 3,628 4,961,804
Notes
Percents may not add to 100.0% and subtotals may not add to totals due to rounding and to the use of weights in the case of several State agencies that either under- or overreported the number of participants.
Some 1-year-old children (2.45%) are 11-month-old infants who have been reclassified (though not formally recertified) as children. Overall, 0.02% of WIC participants who are classified as infants are participants more than 365 days old. a Apparent inconsistencies in Priorities I, II, and IV and certification as a child may be largely due to State agency-level automated procedures, which routinely reassign infants as children at the age of 366 days without revising assigned priorities. b The following State agencies reported Priority VI for a small number of children: Arkansas (4), Colorado (1), Georgia (107), Illinois (9), Nevada (206), North Dakota (2), Utah (1).

WIC Participant and Program Characteristics: 2014 Final Report
Page 139
C. SHIFTS IN RISK PRIORITY LEVELS BETWEEN 2012 AND 2014
Table V.5 compares priority levels of WIC participants in 2012 and 2014. Overall, the distribution of Risk Priority levels in 2014 was very similar to the distribution in 2012. Within certification categories, a few very modest shifts are apparent, reflecting slight increases in medically based priorities and complementary decreases in dietary-based priorities.
The proportion of women WIC participants assigned to Priority I increased slightly from 66.4 percent in 2012 to 67.5 percent in 2014. Among postpartum women, the proportion assigned to Priority V decreased from 10.7 percent in 2012 to 6.5 percent in 2014, while the proportion assigned to Priority VI increased from 50.1 percent in 2012 to 54.7 percent in 2014.
The proportion of infants assigned to Priority I also increased slightly from 63.1 percent in 2012 to 65.8 percent in 2014, with corresponding decreases in the proportion of infants assigned to Priority II. Most of the increase in the proportion of infants assigned to Priority I occurred among 4- to 5-month-olds (from 52.3 percent to 61.1 percent) and 6- to 8-month-olds (from 56.8 percent to 64.4 percent). This increase since 2012 may result from the implementation of new nutritional risk criteria in October 2012. These new nutritional risks use WHO growth standards to identify infants and 1-year-old children with a low weight-for-height/length ratio or a high weight-for-height/length ratio. This pattern of an increasing proportion of infants assigned to the highest Risk Priority level also extends a trend observed since 2000, and may be due in part to the use of biological parent (mother or father) obesity as an anthropometric risk factor for infants—i.e., being at risk of becoming overweight.
Among children, the proportion assigned to medically based Priority III increased slightly from 52.0 percent in 2012 to 54.8 percent in 2014, extending a pattern observed since 2004. Most of this shift was concentrated among 1-year-old children, with the proportion increasing from 45.3 percent in 2012 to 51.0 percent in 2014.

WIC Participant and Program Characteristics: 2014 Final Report
Page 140
Table V.5. Risk Priority Levels by Participants Category: 2012, 2014
Pregnant Women
Breastfeeding Women
Postpartum Women
Total Women
Risk Priority 2012 2014 2012 2014 2012 2014 2012 2014 Risk Priority Reported
Ib 90.5 91.7 93.5 94.1 2.3 2.6 66.4 67.5 II 0.0 0.0 1.4 1.2 0.1 0.1 0.4 0.4 III 0.0 0.0 0.0 0.1 32.9 32.6 9.3 9.1 IV 9.2 8.0 4.7 4.3 3.6 3.3 6.3 5.5 V 0.0 0.0 0.0 0.0 10.7 6.5 3.0 1.8 VI 0.1 0.1 0.2 0.1 50.1 54.7 14.3 15.4 VII 0.0 0.0 0.0 0.0 0.1 0.1 0.1 0.0
No Risk Priority Reported 0.1 0.1 0.1 0.1 0.2 0.2 0.2 0.1 U.S. WIC 983,192 896,551 665,526 687,351 651,347 615,559 2,300,064 2,199,461
Infantsa Children Total WIC
Risk Priority 2012 2014 2012 2014 2012 2014 Risk Priority Reported
Ib 63.1 65.8 0.6 0.5 30.5 31.4 II 31.0 28.7 0.1 0.1 7.3 6.8 III 0.2 0.3 52.0 54.8 30.0 31.4 IV 5.1 4.9 0.1 0.1 2.7 2.5 V 0.1 0.1 46.6 44.0 25.6 23.9 VI 0.0 0.0 0.0 0.0 3.4 3.6 VII 0.0 0.1 0.5 0.4 0.3 0.2
No Risk Priority Reported 0.4 0.2 0.1 0.1 0.2 0.1 U.S. WIC 2,240,045 2,141,988 5,194,359 4,961,804 9,734,467 9,303,253
Notes
Percents may not add to 100.0% and subtotals may not add to totals due to rounding and to the use of weights in the case of several State agencies that either under- or overreported the number of participants.
Some 1-year-old children (2.45%) are 11-month-old infants who have been reclassified (though not formally recertified) as children. Overall, 0.02% of WIC participants who are classified as infants are participants more than 365 days old. a An infant is defined as a participant who at certification is younger than 1 year of age and would be classified as a child at the age of 366 days. b A small proportion of postpartum women and children may not have had their State agency-level records or priorities updated on State agency-maintained management information systems when they were certified for WIC benefits in different certification categories.

WIC Participant and Program Characteristics: 2014 Final Report
Page 141
VI. BREASTFEEDING OF WIC INFANTS
With the passage of the Child Nutrition and WIC Reauthorization Act (Pub. L. 101–147) in 1989, WIC strengthened its breastfeeding promotion efforts for pregnant and postpartum participants. The legislation earmarked a minimum of $8 million per year for breastfeeding promotion and support. State and local agencies developed a range of strategies to increase breastfeeding incidence and duration among WIC participants, including providing current, accurate breastfeeding information through individual or group education for participants and their families; sponsoring peer counselor programs, breast-pump loan programs, and support groups; creating breastfeeding-friendly clinic environments and community partnerships; and providing ongoing staff education and training.
The Healthy Meals for Healthy Americans Act (Pub. L. 103–448), passed in 1994, required USDA to begin reporting to Congress on incidence and duration of breastfeeding among WIC participants starting in 1998. This legislation also revised the funding formula for WIC breastfeeding promotion and support; in FY 2014, State agencies were required to spend $36.93 (adjusted annually for inflation) on each pregnant and breastfeeding woman in support of breastfeeding. Also under the Act, FNS, in conjunction with the National WIC Association and CDC, developed four new MDS items to collect data on breastfeeding. These MDS items, initially collected in 1998 for 7- to 11-month-old infants, gathered data on whether infants were currently breastfed (at time of data collection), whether infants were ever breastfed, the length of time infants breastfed (if not currently breastfed), and the date breastfeeding data were collected. Prior to 1998, State agencies were asked to report breastfeeding information only if their management information systems contained the data. National estimates could not be calculated because many State agencies were unable to report this information. In 1998, reporting of breastfeeding data improved significantly, and national estimates of breastfeeding initiation could be calculated. Beginning with PC2004, State agencies were asked to collect these data on infants and children aged 6 to 13 months in April of the study year. Until 2012, only individual State agency-specific estimates for breastfeeding duration could be produced because of the substantial amount of unreported data on variables needed to calculate duration. Beginning in 2012, national and State agency rates of breastfeeding initiation and duration have been reported.
This chapter presents data on breastfeeding initiation and duration among WIC infants and children aged 6 to 13 months. Section A presents national breastfeeding initiation rates and trends. Section B discusses national breastfeeding duration estimates by presenting the median duration, mean duration during the first 6 months, and a range for the percentage of infants and children breastfed for 6 or more months.
A. BREASTFEEDING INITIATION RATES
Table VI.1 presents data on breastfeeding initiation rates for 6- to-13-month-old infants and children.32 Reporting has improved substantially over time, and the PC2014 estimate of the rate of breastfeeding initiation is based on data from 83 State agencies, which served 99.1 percent of all WIC infants and children aged 6 to 13 months. The other seven State agencies reported
32 Appendix D presents comparable data on breastfeeding for 7-to 11-month-old infants to allow comparison with previous PC reports.

WIC Participant and Program Characteristics: 2014 Final Report
Page 142
information on less than 75 percent of infants and children in this age range and were excluded from these calculations. This chapter also excludes data for State agencies that reported information on between 75 percent and 85 percent of infants and children in this age range, although these data are included in the national estimate. The PC2014 estimates are based on data for 98.3 percent of all WIC infants and children aged 6 to 13 months.
In the 83 State agencies that reported sufficient breastfeeding data, 69.8 percent of all 6- to 13-month-old infants and children were currently breastfed or were breastfed at some time. There is substantial variation between State agencies, with breastfeeding initiation rates ranging from 24.3 percent to 94.4 percent. Nearly half of the State agencies (48.7 percent) had breastfeeding initiation rates of greater than or equal to 60 percent and less than 80 percent. Only 7.7 percent of agencies had initiation rates of less than 40 percent and only 5.1 percent of agencies had initiation rates of more than 90 percent.
Breastfeeding rates among WIC infants and children have increased steadily since 1998 (see table VI.2). Moreover, since 1998, reporting on breastfeeding has improved across several dimensions: the number of State agencies reporting breastfeeding data increased such that more than 90 percent of agencies have consistently reported breastfeeding data, the age range for reporting has been broadened, and agencies now report data on more infants and children in the relevant age range. To minimize bias in analyzing changes over time, the comparisons between pairs of years are restricted to State agencies reporting data during both periods and to participants in the more restrictive age range of the two comparison points. These trends are illustrated in appendix figure D.VI.2, which presents maps of State agency breastfeeding initiation rates for infants aged 7 to 11 months (1998–2014).
The PC1998 benchmark estimate of breastfeeding initiation was 41.5 percent. With the exception of 2006–2008, the breastfeeding initiation rate increased approximately 4 percentage points between each PC reporting period from 1998 to 2012. For PC2014, the increase in the breastfeeding initiation rate is slightly smaller, at 2.7 percentage points, from 67.1 percent in PC2012 to 69.8 in PC2014 (see table VI.2).

WIC Participant and Program Characteristics: 2014 Final Report
Page 143
Table VI.1. Breastfeeding Initiation Rates for WIC Infants and Children
Aged 6–13 Months in April 2014 by State
Region and State
WIC Infants in Age Range
Ever or Currently Breastfed Yes No Not Reported
Number Number % Number % Number % Total for State Agencies Reportinga 1,369,284 955,126 69.8 403,217 29.4 10,940 0.8
Northeast
Connecticut 9,579 7,111 74.2 2,393 25.0 75 0.8 Maine 3,769 2,729 72.4 1,040 27.6 0 0.0 Massachusetts 18,724 14,793 79.0 3,931 21.0 0 0.0 New Hampshire 2,926 2,194 75.0 732 25.0 0 0.0 New York 82,259 66,972 81.4 15,035 18.3 252 0.3 Rhode Island 3,851 2,635 68.4 1,204 31.3 12 0.3 Vermont 1,959 1,534 78.3 412 21.0 13 0.7 Indian Township (ME) 4 1 25.0 3 75.0 0 0.0
Mid-Atlantic Delaware 3,687 1,934 52.5 1,725 46.8 28 0.8 District of Columbia 3,206 1,882 58.7 1,156 36.1 168 5.2 Maryland 22,771 15,025 66.0 7,538 33.1 208 0.9 New Jersey 25,065 16,447 65.6 7,946 31.7 672 2.7 Pennsylvania 41,114 23,702 57.6 17,388 42.3 24 0.1 Puerto Rico 21,204 10,885 51.3 9,800 46.2 519 2.4 Virginia 25,478 14,539 57.1 10,902 42.8 37 0.1 Virgin Islands 651 547 84.0 102 15.7 2 0.3 West Virginia 8,585 4,347 50.6 4,238 49.4 0 0.0
Southeast Alabama 22,628 9,293 41.1 13,268 58.6 67 0.3 Florida 85,248 64,994 76.2 19,884 23.3 370 0.4 Georgia 50,869 32,326 63.5 18,540 36.4 3 0.0 Kentucky 23,929 11,809 49.4 12,120 50.6 0 0.0 Mississippi 12,727 3,471 27.3 9,256 72.7 0 0.0 North Carolina 42,505 28,991 68.2 13,514 31.8 0 0.0 South Carolina 22,709 12,472 54.9 9,747 42.9 490 2.2 Tennessee 29,507 14,823 50.2 14,684 49.8 0 0.0 Eastern Band Cherokee (NC) 104 68 65.4 36 34.6 0 0.0 Mississippi Choctaw (MS) 129 b b b b b b
Midwest
Illinois 48,433 34,005 70.2 14,185 29.3 243 0.5 Indiana 28,565 20,206 70.7 8,037 28.1 322 1.1 Michigan 41,317 26,149 63.3 14,868 36.0 300 0.7 Minnesota 19,296 14,770 76.5 4,526 23.5 0 0.0 Ohio 42,028 23,887 56.8 17,871 42.5 270 0.6 Wisconsin 18,159 13,156 72.4 4,933 27.2 70 0.4
Southwest Arkansas 15,696 7,914 50.4 7,782 49.6 0 0.0 Louisiana 26,344 10,259 38.9 16,004 60.8 81 0.3 New Mexico 9,139 6,610 72.3 1,881 20.6 648 7.1 Oklahoma 15,373 b b b b b b
Texas 153,346 126,087 82.2 26,976 17.6 283 0.2 Acoma, Canoncito, Laguna (NM) 86 78 90.7 8 9.3 0 0.0 Cherokee Nation (OK) 1,545 b b b b b b
Chickasaw Nation (OK) 706 471 66.7 235 33.3 0 0.0 Choctaw Nation (OK) 634 254 40.1 380 59.9 0 0.0 Citizen Potawatomi (OK) 255 62 24.3 193 75.7 0 0.0 Eight Northern Pueblos (NM) 52 41 77.5 12 22.5 0 0.0 Five Sandoval Pueblos (NM) 44 17 38.6 27 61.4 0 0.0

WIC Participant and Program Characteristics: 2014 Final Report
Page 144
Table VI.1. (continued) Breastfeeding Initiation Rates for WIC Infants and Children
Ages 6–13 Months in April 2014 by State
Region and State
WIC Infants in Age Range
Ever or Currently Breastfed Yes No Not Reported
Number Number % Number % Number % Southwest (continued)
Inter-Tribal Council Oklahoma 161 105 65.2 56 34.8 0 0.0 Muscogee Creek Nation (OK) 463 237 51.2 226 48.8 0 0.0 Osage Nation (OK) 529 264 49.9 265 50.1 0 0.0 Otoe Missouria (OK) 82 47 57.3 35 42.7 0 0.0 Pueblo of Isleta (NM) 208 165 79.3 26 12.5 17 8.2 Pueblo of San Felipe (NM) 36 34 94.4 2 5.6 0 0.0 Pueblo of Zuni (NM) 96 86 89.6 10 10.4 0 0.0 Santo Domingo (NM) 30 26 86.7 4 13.3 0 0.0 Wichita, Caddo, Delaware (OK) 622 369 59.3 253 40.7 0 0.0
Mountain Plains Colorado 16,145 13,011 80.6 3,076 19.1 58 0.4 Iowa 11,907 7,858 66.0 4,018 33.7 31 0.3 Kansas 11,860 8,476 71.5 2,838 23.9 546 4.6 Missouri 24,577 16,358 66.6 8,219 33.4 0 0.0 Montana 3,452 2,742 79.4 710 20.6 0 0.0 Nebraska 6,633 5,012 75.6 1,609 24.3 12 0.2 North Dakota 2,173 1,501 69.1 666 30.6 6 0.3 South Dakota 3,275 1,999 61.0 946 28.9 330 10.1 Utah 11,261 9,789 86.9 1,435 12.7 37 0.3 Wyoming 1,943 1,515 78.0 416 21.4 12 0.6 Cheyenne River Sioux (SD) 97 42 43.3 46 47.4 9 9.3 Omaha Nation (NE) 40 b b b b b b
Rosebud Sioux (SD) 158 110 69.6 44 27.8 4 2.5 Santee Sioux (NE) 18 5 27.8 12 66.7 1 5.6 Standing Rock Sioux (ND) 94 55 58.5 35 37.2 4 4.3 Ute Mountain Ute (CO) 34 31 91.2 1 2.9 2 5.9 Winnebago (NE) 44 b b b b b b
Western
Alaska 3,362 2,739 81.5 623 18.5 0 0.0 American Samoa 788 598 75.9 189 24.0 1 0.1 Arizona 29,771 19,005 63.8 10,750 36.1 16 0.1 California 192,237 151,106 78.6 41,128 21.4 3 0.0 Guam 1,398 937 67.0 461 33.0 0 0.0 Hawaii 6,120 5,353 87.5 683 11.2 84 1.4 Idaho 6,915 5,907 85.4 860 12.4 148 2.1 Oregon 15,256 13,791 90.4 1,252 8.2 213 1.4 Washington 27,327 24,085 88.1 3,051 11.2 191 0.7 Inter-Tribal Council Arizona 1,732 1,139 65.8 574 33.1 19 1.1 Navajo Nation (AZ) 1,727 1,374 79.6 350 20.3 3 0.2 Northern Mariana Islands 508 318 62.6 190 37.4 0 0.0
Notes
Percents may not add to 100.0% and subtotals may not add to totals due to rounding and to the use of weights in the case of several State agencies that either under- or overreported the number of participants. a Includes those State agencies reporting data on breastfeeding initiation for 75% or more of all infants aged 6–13 months. Agencies excluded are Nevada, Eastern Shoshone, Inter-Tribal Council Nevada, Northern Arapahoe, Pleasant Point, Seneca Nation, and Three Affiliated Tribes. These national estimates are based on information for 98.3% of all WIC infants aged 6–13 months. b State agency reported data on 75% or more, but less than 85%, of all WIC infants aged 6–13 months. All available data (including data for these State agencies) were used in establishing the PC2014 national breastfeeding initiation rate.

WIC Participant and Program Characteristics: 2014 Final Report
Page 145
Table VI.2. Changes in Breastfeeding Initiation Rates for WIC Infants in April: 1998–2014
Breastfeeding Initiation Ratesa
Year (participant age range) Number of
States Reporting Percent Ever or
Currently Breastfed 1998 (7–11 months) 63 41.5 2000 (7–11 months) 68 44.5 2002 (7–11 months) 68 48.3 2004 (6–13 months) 67 54.6 2006 (6–13 months) 75 57.7 2008 (6–13 months) 87 59.0 2010 (6–13 months) 87 63.1 2012 (6–13 months) 86 67.1 2014 (6–13 months) 83 69.8
Change in Breastfeeding Initiation Rates
Period (participant age range)
Number of States
Reporting in Both Years
Beginning of Period Rate
(%)
End of Period Rate
(%)
Change in Rate
(percentage points)
1998–2000 (7–11 months) 52 41.3 45.7 +4.4 2000–2002 (7–11 months) 59 44.4 48.2 +3.8 2002–2004 (7–11 months)b 64 50.0 54.4 +4.4 2004–2006 (6–13 months) 61c 54.6 58.3 +3.7 2006–2008 (6–13 months) 75 57.7 59.1 +1.4 2008–2010 (6–13 months) 84 58.7 63.0 +4.3 2010–2012 (6–13 months) 84 63.1 66.9 +3.8 2012–2014 (6–13 months) 82 67.1 69.8 +2.7
Notes
Percents may not add to 100.0% and subtotals may not add to totals due to rounding and to the use of weights in the case of several State agencies that either under- or overreported the number of participants. a Reported rates are not strictly comparable across years because of differences in the number of State agencies reporting; inconsistent State agency reporting (submitting one year but not the next); and variation in the ages of infants for whom data were to be reported. b Our best estimate of the change in breastfeeding rate between 2002 and 2004 uses information only for infants aged 7–11 months, and excludes California from the analysis. Prior to 2004, California’s reported initiation rate was a lower bound estimate based on the conservative assumption none of the infants for whom breastfeeding initiation data were missing (nearly half of those infants who were not currently breastfed) and had ever been breastfed. California’s reporting improved in 2004, resulting in a more accurate estimate of breastfeeding initiation. California’s data are excluded from the 2002–2004 calculation. c For PC2006, Omaha Santee Sioux split to form two separate State agencies. Hence, the number of common agencies is 61 in PC2004 and 62 in PC2006.

WIC Participant and Program Characteristics: 2014 Final Report
Page 146
B. BREASTFEEDING DURATION
State agencies were asked to provide information on the length of time infants were breastfed. Seventy State agencies were able to provide duration data for at least 75 percent of infants and children aged 6 to 13 months for whom breastfeeding was reportedly initiated. These State agencies are included in tables VI.3 and VI.4.33 Data are shown for the 64 State agencies that provided information on at least 85 percent of breastfed infants. Data for the remaining six State agencies are included in the total but are not displayed individually.
The breastfeeding duration data are “right censored”—that is, we do not know the full duration for infants who were still breastfeeding when data were collected. Calculating an arithmetic mean of reported duration for both currently and ever-breastfed infants would underestimate the duration for those infants currently breastfed. Instead, information on duration is summarized in three statistics virtually unaffected by this limitation:
• Median duration is calculated by State agency as well as for all reporting State agencies combined.34
• Mean duration during the first 6 months is calculated. This measure is known for all infants whose data were collected at 6 months of age or later, regardless of current breastfeeding status.
• The percent of infants who breastfed 6 months or more is examined. This measure is of special interest because of the health benefits that accrue to infants who are breastfed for at least 6 months.
Across the 70 State agencies reporting data, the median duration of breastfeeding was 13 weeks. Substantial variation exists among State agencies. In 26 State agencies, the median was less than 10 weeks. In another 20 State agencies, the median was between 10 and 19 weeks. Eighteen agencies reported median breastfeeding duration of 20 weeks or more. Medians are not presented for the six State agencies that were unable to provide duration data on at least 85 percent of breastfed infants.
Table VI.4 partially mitigates the effect of the missing data on initiation and duration of breastfeeding by estimating lower and upper bounds for the percentage of infants and children breastfed for 6 or more months. The lower bound estimate includes in the numerator only those infants for who 6 or more months of breastfeeding was reported. Breastfed infants for whom initiation or duration information were missing are assumed to have been breastfed for less than 6 months. The upper bound estimates include infants known to have been breastfed for at least 6 months as well as infants for whom initiation and duration of breastfeeding are not known. 33 Breastfeeding duration was counted as missing for the following participants: (1) currently breastfed infants and children for whom the date breastfeeding data was collected was not reported; (2) currently breastfed infants and children who were younger than 22 weeks old when data were collected, whose duration estimates could be substantially underreported; and (3) ever breastfed infants and children for whom duration was not reported. 34 Median duration is unaffected by right censoring because breastfeeding data are collected for infants who are at least 6 months (26 weeks) old and half or more of ever-breastfed infants had stopped breastfeeding by this age. For individual State agencies, median duration in most (56) was 26 weeks or less. For the eight remaining State agencies, we know the median duration was greater than 26 weeks, but we cannot measure this duration, so the median duration is reported as more than 26 (26+) weeks. Median duration in the six State agencies included in but not displayed individually in tables VI.3 and VI.4 is not more than 26 weeks.

WIC Participant and Program Characteristics: 2014 Final Report
Page 147
Across the 70 State agencies reporting breastfeeding duration data, the proportion of infants and children breastfed for 6 or more months ranged from a lower bound estimate of 23.3 percent to an upper bound estimate of 30.6 percent.

WIC Participant and Program Characteristics: 2014 Final Report
Page 148
Table VI.3. Breastfeeding Duration for WIC Infants and Children Aged 6–13 Months
In April 2014 by State
Region and State
WIC Infants in Age Range
Infants Breastfed
Breastfed WIC Infants With
Reported Breastfeeding
Duration
Median Duration in Weeks
Mean Duration
Within First 6 Months Number Number % Number %
Total for State Agencies Reportinga 1,158,882 800,557 69.1 736,709 92.0 13.0 13.9 Northeast
Connecticut 9,579 7,111 74.2 6,219 87.5 11.0 13.2 Maine 3,769 2,729 72.4 2,629 96.3 12.0 13.5 Massachusetts 18,724 14,793 79.0 14,632 98.9 12.0 13.3 New Hampshire 2,926 2,194 75.0 2,051 93.5 7.0 11.5 New York 82,259 66,972 81.4 59,353 88.6 22.0 15.9 Rhode Island 3,851 2,635 68.4 2,514 95.4 8.0 11.8 Vermont 1,959 1,534 78.3 1,502 97.9 19.0 15.6 Indian Township (ME) 4 1 25.0 1 100.0 26.0+ 26.0
Mid-Atlantic
Delaware 3,687 1,934 52.5 b b b b
District of Columbia 3,206 1,882 58.7 1,624 86.3 25.0 18.1 Maryland 22,771 15,025 66.0 12,899 85.9 13.0 14.1 New Jersey 25,065 16,447 65.6 15,228 92.6 26.0 17.8 Pennsylvania 41,114 23,702 57.6 22,623 95.4 5.0 10.6 Virginia 25,478 14,539 57.1 14,219 97.8 11.0 13.2 Virgin Islands 651 547 84.0 522 95.4 26.0+ 20.7
Southeast
Alabama 22,628 9,293 41.1 8,411 90.5 7.0 11.5 Florida 85,248 64,994 76.2 57,055 87.8 10.0 12.8 Georgia 50,869 32,326 63.5 29,563 91.5 10.0 12.8 Kentucky 23,929 11,809 49.4 11,809 100.0 26.0+ 15.7 North Carolina 42,505 28,991 68.2 b b b b
South Carolina 22,709 12,472 54.9 11,408 91.5 8.0 11.6 Tennessee 29,507 14,823 50.2 13,226 89.2 25.0 17.7 Eastern Band Cherokee (NC) 104 68 65.4 b b b b
Mississippi Choctaw (MS) 129 b b b b b b
Midwest
Illinois 48,433 34,005 70.2 29,538 86.9 9.0 12.0 Indiana 28,565 20,206 70.7 19,130 94.7 6.0 10.9 Michigan 41,317 26,149 63.3 23,637 90.4 6.0 11.0 Minnesota 19,296 14,770 76.5 13,960 94.5 15.0 15.0 Ohio 42,028 23,887 56.8 22,675 94.9 8.0 11.6 Wisconsin 18,159 13,156 72.4 11,485 87.3 5.0 9.7
Southwest
Arkansas 15,696 7,914 50.4 7,638 96.5 5.0 10.1 Louisiana 26,344 10,259 38.9 9,678 94.3 9.0 10.8 Oklahoma 15,373 b b b b b b
Acoma, Canoncito, Laguna (NM) 86 78 90.7 74 94.9 20.0 15.5 Chickasaw Nation (OK) 706 471 66.7 455 96.6 7.0 11.4 Choctaw Nation (OK) 634 254 40.1 246 96.9 6.0 10.4 Citizen Potawatomi (OK) 255 62 24.3 61 98.4 26.0+ 18.7 Eight Northern Pueblos (NM) 52 41 77.5 38 94.5 10.0 14.0 Five Sandoval Pueblos (NM) 44 17 38.6 16 94.1 22.5 18.1 Inter-Tribal Council Oklahoma 161 105 65.2 101 96.2 4.0 9.5 Muscogee Creek Nation (OK) 463 237 51.2 231 97.5 8.0 11.8 Osage Nation (OK) 529 264 49.9 259 98.1 7.0 10.8 Otoe Missouria (OK) 82 47 57.3 46 97.9 4.0 7.7 Pueblo of San Felipe (NM) 36 34 94.4 33 97.1 26.0+ 18.2

WIC Participant and Program Characteristics: 2014 Final Report
Page 149
Table VI.3. (continued) Breastfeeding Duration for WIC Infants and Children Aged 6–13 Months
In April 2014 by State
WIC Infants in
Age Range
Infants Breastfed
Breastfed WIC Infants With
Reported Breastfeeding
Duration
Median Duration in Weeks
Mean Duration
Within First 6 Months Region and State Number Number % Number %
Southwest (continued) Pueblo of Zuni (NM) 96 86 89.6 80 93.0 26.0+ 19.9 Santo Domingo (NM) 30 26 86.7 25 96.2 14.0 14.8 Wichita, Caddo, Delaware (OK) 622 369 59.3 352 95.4 6.0 11.2
Mountain Plains
Colorado 16,145 13,011 80.6 12,417 95.4 8.0 12.0 Iowa 11,907 7,858 66.0 7,541 96.0 7.0 11.4 Kansas 11,860 8,476 71.5 8,150 96.2 6.0 10.4 Missouri 24,577 16,358 66.6 15,833 96.8 7.0 11.4 Montana 3,452 2,742 79.4 2,629 95.9 13.0 14.1 Nebraska 6,633 5,012 75.6 b b b b
North Dakota 2,173 1,501 69.1 1,424 94.9 10.0 13.1 Utah 11,261 9,789 86.9 9,211 94.1 14.0 14.6 Wyoming 1,943 1,515 78.0 1,448 95.6 9.0 12.4 Santee Sioux (NE) 18 5 27.8 5 100.0 18.0 15.6 Standing Rock Sioux (ND) 94 55 58.5 53 96.4 3.0 5.6
Western
Alaska 3,362 2,739 81.5 2,548 93.0 16.0 15.1 American Samoa 788 598 75.9 591 98.8 26.0+ 23.1 Arizona 29,771 19,005 63.8 17,175 90.4 17.0 15.2 California 192,237 151,106 78.6 144,748 95.8 23.0 16.9 Guam 1,398 937 67.0 853 91.0 13.0 14.2 Hawaii 6,120 5,353 87.5 4,973 92.9 17.0 15.5 Idaho 6,915 5,907 85.4 5,734 97.1 26.0+ 17.5 Oregon 15,256 13,791 90.4 11,845 85.9 13.0 14.4 Washington 27,327 24,085 88.1 22,242 92.3 21.0 16.1 Inter-Tribal Council Arizona (AZ) 1,732 1,139 65.8 1,061 93.2 5.0 10.7 Navajo Nation (AZ) 1,727 1,374 79.6 1,246 90.7 26.0 17.3 Northern Mariana Islands 508 318 62.6 284 89.3 22.0 17.8
Notes
Percents may not add to 100.0% and subtotals may not add to totals due to rounding and to the use of weights in the case of several State agencies that either under- or overreported the number of participants.
In some State agencies, the median duration was greater than 26 weeks. Due to data limitations, medians over 26 weeks cannot be measured, so the median duration is reported as more than 26 (26+) weeks. a Includes the 70 State agencies reporting data on breastfeeding initiation for 75% or more of all infants aged 6–13 months and duration data for 75% or more of breastfed infants. These estimates are based on information for 83.9% of all WIC infants aged 6–13 months. State agencies excluded are Cherokee Nation, Cheyenne River Sioux, Eastern Shoshone, ITC-Nevada, Mississippi, Nevada, New Mexico, Northern Arapahoe, Omaha Nation, Pleasant Point, Pueblo of Isleta, Puerto Rico, Rosebud Sioux, Seneca, South Dakota, Texas, Three Affiliated, Ute Mountain Ute, West Virginia, and Winnebago. b State agency reported data on 75% or more, but less than 85%, of all WIC infants aged 6–13 months. All available data (including these State agencies) were used to calculate breastfeeding duration.
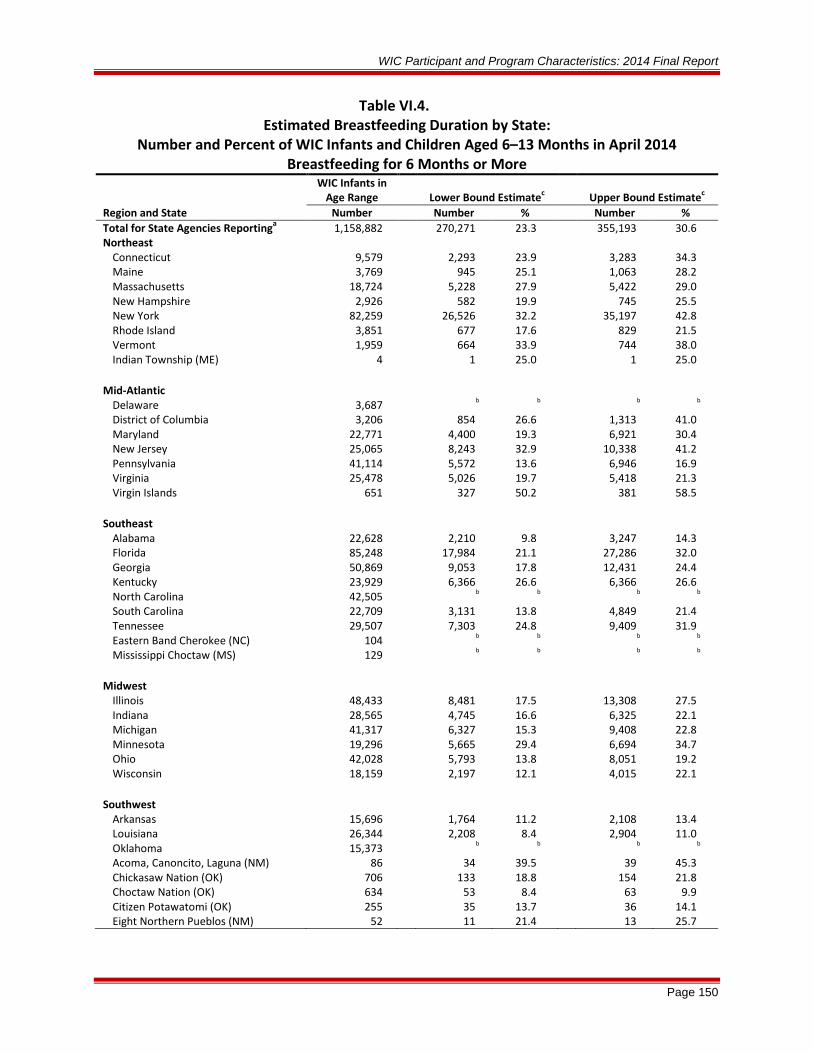
WIC Participant and Program Characteristics: 2014 Final Report
Page 150
Table VI.4. Estimated Breastfeeding Duration by State:
Number and Percent of WIC Infants and Children Aged 6–13 Months in April 2014 Breastfeeding for 6 Months or More
Region and State
WIC Infants in Age Range
Lower Bound Estimatec
Upper Bound Estimatec
Number Number % Number % Total for State Agencies Reportinga 1,158,882 270,271 23.3 355,193 30.6 Northeast
Connecticut 9,579 2,293 23.9 3,283 34.3 Maine 3,769 945 25.1 1,063 28.2 Massachusetts 18,724 5,228 27.9 5,422 29.0 New Hampshire 2,926 582 19.9 745 25.5 New York 82,259 26,526 32.2 35,197 42.8 Rhode Island 3,851 677 17.6 829 21.5 Vermont 1,959 664 33.9 744 38.0 Indian Township (ME) 4 1 25.0 1 25.0
Mid-Atlantic
Delaware 3,687 b b b b
District of Columbia 3,206 854 26.6 1,313 41.0 Maryland 22,771 4,400 19.3 6,921 30.4 New Jersey 25,065 8,243 32.9 10,338 41.2 Pennsylvania 41,114 5,572 13.6 6,946 16.9 Virginia 25,478 5,026 19.7 5,418 21.3 Virgin Islands 651 327 50.2 381 58.5
Southeast
Alabama 22,628 2,210 9.8 3,247 14.3 Florida 85,248 17,984 21.1 27,286 32.0 Georgia 50,869 9,053 17.8 12,431 24.4 Kentucky 23,929 6,366 26.6 6,366 26.6 North Carolina 42,505 b b b b
South Carolina 22,709 3,131 13.8 4,849 21.4 Tennessee 29,507 7,303 24.8 9,409 31.9 Eastern Band Cherokee (NC) 104 b b b b
Mississippi Choctaw (MS) 129 b b b b
Midwest
Illinois 48,433 8,481 17.5 13,308 27.5 Indiana 28,565 4,745 16.6 6,325 22.1 Michigan 41,317 6,327 15.3 9,408 22.8 Minnesota 19,296 5,665 29.4 6,694 34.7 Ohio 42,028 5,793 13.8 8,051 19.2 Wisconsin 18,159 2,197 12.1 4,015 22.1
Southwest
Arkansas 15,696 1,764 11.2 2,108 13.4 Louisiana 26,344 2,208 8.4 2,904 11.0 Oklahoma 15,373 b b b b
Acoma, Canoncito, Laguna (NM) 86 34 39.5 39 45.3 Chickasaw Nation (OK) 706 133 18.8 154 21.8 Choctaw Nation (OK) 634 53 8.4 63 9.9 Citizen Potawatomi (OK) 255 35 13.7 36 14.1 Eight Northern Pueblos (NM) 52 11 21.4 13 25.7

WIC Participant and Program Characteristics: 2014 Final Report
Page 151
Table VI.4. (continued) Estimated Breastfeeding Duration by State:
Number and Percent of WIC Infants and Children Aged 6–13 Months in April 2014 Breastfeeding for 6 Months or More
WIC Infants in
Age Range
Lower Bound Estimatec
Upper Bound Estimatec Region and State Number Number % Number % Southwest (continued)
Five Sandoval Pueblos (NM) 44 8 18.2 9 20.5 Inter-Tribal Council Oklahoma 161 19 11.8 23 14.3 Muscogee Creek Nation (OK) 463 66 14.3 72 15.6 Osage Nation (OK) 529 56 10.6 65 12.3 Otoe Missouria (OK) 82 7 8.5 8 9.8 Pueblo of San Felipe (NM) 36 20 55.6 21 58.3 Pueblo of Zuni (NM) 96 50 52.1 57 59.4 Santo Domingo (NM) 30 9 30.0 11 36.7 Wichita, Caddo, Delaware (OK) 622 99 15.9 119 19.1
Mountain Plains
Colorado 16,145 3,479 21.5 4,375 27.1 Iowa 11,907 1,998 16.8 2,487 20.9 Kansas 11,860 1,859 15.7 2,767 23.3 Missouri 24,577 4,217 17.2 4,847 19.7 Montana 3,452 963 27.9 1,093 31.7 Nebraska 6,633 b b b b
North Dakota 2,173 460 21.2 570 26.2 Utah 11,261 3,433 30.5 4,329 38.4 Wyoming 1,943 430 22.1 538 27.7 Santee Sioux (NE) 18 2 11.1 3 16.7 Standing Rock Sioux (ND) 94 6 6.4 12 12.8
Western
Alaska 3,362 1,118 33.3 1,327 39.5 American Samoa 788 472 59.9 488 61.9 Arizona 29,771 6,675 22.4 8,939 30.0 California 192,237 68,544 35.7 78,628 40.9 Guam 1,398 305 21.8 405 29.0 Hawaii 6,120 2,087 34.1 2,568 42.0 Idaho 6,915 3,331 48.2 3,723 53.8 Oregon 15,256 4,449 29.2 7,080 46.4 Washington 27,327 10,244 37.5 12,683 46.4 Inter-Tribal Council Arizona (AZ) 1,732 277 16.0 382 22.1 Navajo Nation (AZ) 1,727 649 37.6 793 45.9 Northern Mariana Islands 508 137 27.0 177 34.8
Notes
Percents may not add to 100.0% and subtotals may not add to totals due to rounding and to the use of weights in the case of several State agencies that either under- or overreported the number of participants. a Includes the 70 State agencies reporting data on breastfeeding initiation for 75% or more of all infants aged 6–13 months and duration data for 75% or more of breastfed infants. These estimates are based on information for 83.9% of all WIC infants aged 6–13 months. State agencies excluded are Cherokee Nation, Cheyenne River Sioux, Eastern Shoshone, ITC-Nevada, Mississippi, Nevada, New Mexico, Northern Arapahoe, Omaha Nation, Pleasant Point, Pueblo of Isleta, Puerto Rico, Rosebud Sioux, Seneca, South Dakota, Texas, Three Affiliated, Ute Mountain Ute, West Virginia, and Winnebago. b State agency reported data on 75% or more, but less than 85%, of all WIC infants aged 6–13 months. All available data (including these State agencies) were used to calculate breastfeeding duration. c The lower bound estimate counts only those infants for whom was reported 6 or more months of breastfeeding. The upper bound estimate includes infants known to have been breastfed for at least 6 months as well as infants for whom initiation and duration of breastfeeding are not known. It also counts currently breastfeeding infants who were aged 5–6 months when data were collected as having been breastfed for 6 months.

WIC Participant and Program Characteristics: 2014 Final Report
Page 152
VII. CHARACTERISTICS OF MIGRANT WIC PARTICIPANTS
Federal WIC regulations define a migrant as an individual whose principal employment is in agriculture on a seasonal basis, who has been so employed within the last 24 months, and who establishes a temporary abode for the purposes of such employment. State agencies are required to report migrant status for all WIC participants as part of the MDS.
This chapter reports data on these migrant participants. Sections A and B describe their demographic characteristics and income and poverty measures, respectively. Section C describes these participants’ nutritional risks. Section D describes their WIC priority levels.
A. DEMOGRAPHIC CHARACTERISTICS OF MIGRANT WIC PARTICIPANTS
In 2014, migrant participation was concentrated in a small number of State agencies: three-quarters (75.7 percent) of migrant participants were located in California, Florida, New York, and Texas (see figure VII.1; also see appendix table E.VII.1).
Figure VII.1. Distribution of Migrant WIC Participants by State, April 2014
Note
Percentages are based on total migrant WIC participation.

WIC Participant and Program Characteristics: 2014 Final Report
Page 153
WIC State agencies reported 39,071 individuals as members of migrant families in April 2014 (see table VII.1). This accounted for less than half of 1 percent of the Nation’s total WIC population, a proportion consistent with migrant status records since 1992.35
The certification categories of migrant WIC participants did not differ greatly from those for nonmigrant participants. A somewhat greater proportion of migrants were children (55.3 percent of migrants versus 53.2 percent of nonmigrants), while a lesser proportion were infants (20.0 percent versus 23.1 percent). Women made up about the same proportion of migrant participants as nonmigrant participants (24.7 percent and 23.7 percent, respectively), though a greater proportion of migrants were breastfeeding women and a lesser proportion were postpartum women.
Age composition at the time of certification was similar among migrants and nonmigrants (see table VII.2). Migrant women in each certification category were less likely to be aged 18 to 34 and more likely to be aged 35 or older; the largest gap in these age groups between migrant and nonmigrant populations occurred among pregnant women. Overall, compared to nonmigrant women, about 5 percentage points fewer migrant women were aged 18 to 34 and around 5 percentage points more migrant women were aged 35 or older. Nearly all migrant and nonmigrant infants were certified between the ages of 0 and 3 months (more than 91 percent in both cases). Migrant and nonmigrant children were certified at nearly the same ages, with a slightly higher proportion of migrant children being certified at older ages.
More than half of pregnant migrant women (54.2 percent) enrolled during their first trimesters of pregnancy and another 37.9 percent enrolled during their second trimesters (see table VII.3). Only 7.7 percent enrolled during their final trimesters of pregnancy. This pattern of enrollment parallels the overall WIC population for 2014 (see table II.4), but migrant women enrolled slightly later in pregnancy in 2014 compared to 2012, when 59.3 percent enrolled during their first trimesters.
35 Migrant data were missing for less than one-third of 1% of the entire WIC population in 2014—a nearly 2-percentage-point decrease in missing data compared to 2012 WIC migrant data.

WIC Participant and Program Characteristics: 2014 Final Report
Page 154
Table VII.1. Distribution of WIC Participants by Migrant Status and WIC Certification Category
Migrant
Nonmigrant
Migrant Status Not Reported
Total WIC
Participant Category Number % Number % Number % Number % Women
Pregnant women 3,864 9.9 891,072 9.7 1,615 4.9 896,551 9.6 Breastfeeding women 3,647 9.3 681,675 7.4 2,029 6.2 687,351 7.4 Postpartum women 2,159 5.5 612,975 6.6 425 1.3 615,559 6.6 Total women 9,669 24.7 2,185,723 23.7 4,069 12.4 2,199,461 23.6
Infantsa 7,801 20.0 2,130,922 23.1 3,265 9.9 2,141,988 23.0
Children 21,601 55.3 4,914,614 53.2 25,589 77.7 4,961,804 53.3
U.S. WIC 39,071
9,231,259
32,923
9,303,253 Notes
Percents may not add to 100.0% and subtotals may not add to totals due to rounding and to the use of weights in the case of several State agencies that either under- or overreported the number of participants. a An infant is defined as a participant who at certification is younger than 1 year of age and who will be classified as a child at the age of 366 days.

WIC Participant and Program Characteristics: 2014 Final Report
Page 155
Table VII.2. Distribution of Migrant WIC Participants By
Participant Category and Age at Certification Participant Category and Age at Certification Migrant Nonmigrant
Migrant Status Not Reported
Total WIC
Pregnant Women 3,864 891,072 1,615 896,551 Younger than 15 years 0.1 0.2 0.1 0.2 15–17 years 3.7 4.1 0.6 4.1 18–34 years 81.8 86.0 76.3 86 35 years or older 14.2 9.5 22.8 9.6 Age not reported 0.2 0.2 0.2 0.2
Breastfeeding Women 3,647 681,675 2,029 687,351 Younger than 15 years 0.1 0.1 0.0 0.1 15–17 years 2.4 2.1 0.3 2.1 18–34 years 80.0 84.4 74.3 84.4 35 years or older 17.3 13.3 25.2 13.4 Age not reported 0.1 0.1 0.1 0.1
Postpartum Women 2,159 612,975 425 615,559 Younger than 15 years 0.0 0.2 0.0 0.1 15–17 years 3.1 3.6 1.2 3.6 18–34 years 82.8 87.3 78.6 87.3 35 years or older 13.6 8.8 18.4 8.8 Age not reported 0.3 0.1 1.9 0.1
Total Women 9,669 2,185,723 4,069 2,199,461 Younger than 15 years 0.1 0.1 0.0 0.1 15–17 years 3.1 3.3 0.5 3.3 18–34 years 81.4 85.9 75.5 85.9 35 years or older 15.3 10.5 23.5 10.5 Age not reported 0.2 0.1 0.3 0.1
Infantsa 7,801 2,130,922 3,265 2,141,988 0–3 months 93.5 91.4 92.3 91.4 4–5 months 2.6 2.9 2.5 2.9 6–8 months 2.6 4.0 1.4 4.0 9–12 months 1.3 1.6 3.6 1.6 Age not reported 0.0 0.1 0.1 0.1
Children 21,601 4,914,614 25,589 4,961,804 1 year old 34.4 36.8 23.9 36.7 2 years old 26.4 25.9 29.7 25.9 3 years old 23.9 23.1 29.7 23.1 4 years old 15.3 14.2 16.5 14.2 Age not reported 0.0 0.1 0.1 0.1
U.S. WIC 39,071 9,231,259 32,923 9,303,253
Notes
Percents may not add to 100.0% and subtotals may not add to totals due to rounding and to the use of weights in the case of several State agencies that either under- or overreported the number of participants. a An infant is defined as a participant who at certification is younger than 1 year of age and who will be classified as a child at the age of 366 days.

WIC Participant and Program Characteristics: 2014 Final Report
Page 156
Table VII.3. Distribution of Migrant Pregnant Women WIC Participants
By Trimester of Enrollment Trimester of Enrollment Number Percent First Trimester 2,092 54.2 Second Trimester 1,464 37.9 Third Trimester 296 7.7 Trimester Not Reported 10 0.3 Total Migrant Pregnant Women 3,864 100.0
Note
Percents may not add to 100.0% and subtotals may not add to totals due to rounding and to the use of weights in the case of several State agencies that either under- or overreported the number of participants.

WIC Participant and Program Characteristics: 2014 Final Report
Page 157
B. INCOME OF MIGRANT WIC PARTICIPANTS
Migrant WIC participants had similar levels of participation in other assistance programs compared to those of nonmigrant participants (see figure VII.2; also see table VII.4). Overall, 70.3 percent of migrant WIC participants also participated in TANF, SNAP, or Medicaid as compared to 72.8 percent of overall WIC participants. These findings may underestimate other program participation, as discussed in chapter III.
Figure VII.2. Percent of Overall U.S. and Migrant WIC Participants
With Reported Participation in Other Programs
Notes
Alaska was unable to provide sufficient PC2014 data on participation in TANF, SNAP, and Medicaid (see table VII.4).
Migrant WIC participants’ mean annual income was very similar to that of nonmigrant participants ($17,296 and $17,370, respectively). The mean income of the entire WIC population increased between 2012 and 2014 by 3.2 percent. Migrant WIC participants experienced a somewhat greater increase—5.7 percent, from $16,363 to $17,296. As a result, the income gap between migrants and nonmigrants is smaller than it was in 2012 (2.9 percent) and much smaller than it was in 2010 (7.8 percent; see figure VII.3; see also table VII.5).

WIC Participant and Program Characteristics: 2014 Final Report
Page 158
Figure VII.3. Mean Annual Income for Migrant WIC Participants and Nonmigrant WIC Participants:
2010–2014
Although migrant and nonmigrant WIC families had similar mean incomes, a larger percent of migrant WIC participants had income at or below the Federal poverty guidelines (see table VII.6). More than three-quarters (76.1 percent) of migrants were living in poverty compared to slightly more than two-thirds (67.3 percent) of nonmigrants. Around one-third of both migrant and nonmigrant families had income equal to or less than 50 percent of the Federal poverty guideline (33.1 percent versus 34.4 percent, respectively). Similar proportions and differences were seen within certification categories of migrants and nonmigrants.

WIC Participant and Program Characteristics: 2014 Final Report
Page 159
Table VII.4. Number and Percent of Migrant WIC Participants With Reported Participation
In Other Programs at Certification
Number
% Migrant WIC
Migrant Participants Reporting Participation in Other Programs by Program TANF 2,256 5.8 SNAP 14,414 36.9 Medicaid 26,368 67.5 Any program other than WIC 27,467 70.3
Migrant Participants Reporting Participation in Other Programs by Combination of Programs
TANF, SNAP, and Medicaid 2,050 5.2 TANF and SNAP 56 0.1 TANF and Medicaid 109 0.3 SNAP and Medicaid 11,306 28.9 TANF only 41 0.1 SNAP only 1,002 2.6 Medicaid only 12,903 33.0 Do not participate in other programs 9,873 25.3 Not reporteda 1,731 4.4
U.S. Migrant WIC 39,071 100.0 Notes
Percents may not add to 100.0% and subtotals may not add to totals due to rounding and to the use of weights in the case of several State agencies that either under- or overreported the number of participants.
Changes in WIC income documentation requirements may have limited information system entries regarding participation in multiple programs.
Alaska was unable to provide sufficient PC2014 data on participation in TANF, SNAP, and Medicaid. a "Not reported" indicates the number and percentages of participants with data for one or more programs not reported. These participants are also excluded from the bar chart. Excluding only those participants for whom data are not reported on a single program changes the migrant percentages slightly or not at all: TANF (5.8%); SNAP (37.3%); Medicaid (67.7%).

WIC Participant and Program Characteristics: 2014 Final Report
Page 160
Table VII.5. Mean and Median Annualized Family or Economic Unit Income of WIC Participants by Participant Category and Migrant Status
Pregnant Women
Breastfeeding Women
Postpartum Women
Total Women
Infants Children
Total WIC
Migrants 3,864 3,647 2,159 9,669 7,801 21,601 39,071 Average (mean) income $17,067 $17,548 $16,088 $17,033 $16,668 $17,635 $17,296 Median income $15,600 $16,120 $15,340 $15,600 $15,600 $15,600 $15,600 Percent with income reported 94.6 94.8 93.4 94.4 92.9 94.9 94.4 Percent with income reported as zeroa 0.9 0.7 1.0 0.9 2.0 1.2 1.3 Percent with income not reportedb 4.5 4.5 5.7 4.8 5.1 3.9 4.3
Nonmigrants 891,072 681,675 612,975 2,185,723 2,130,922 4,914,614 9,231,259 Average (mean) income $16,820 $18,526 $15,160 $16,901 $16,448 $17,963 $17,370 Median income $15,000 $16,800 $12,996 $15,000 $14,400 $15,600 $15,522 Percent with income reported 91.5 91.7 89.0 90.9 88.8 91.8 90.9 Percent with income reported as zeroa 0.9 0.9 0.8 0.8 1.7 0.6 0.9 Percent with income not reportedb 7.7 7.4 10.2 8.3 9.6 7.6 8.2
Migrant Status Not Reported 1,615 2,029 425 4,069 3,265 25,589 32,923 Average (mean) income $17,911 $17,799 $18,598 $17,918 $18,166 $18,021 $18,023 Median income $15,600 $15,600 $15,600 $15,600 $15,600 $15,600 $15,600 Percent with income reported 94.4 95.9 84.5 94.1 92.8 95.4 95.0 Percent with income reported as zeroa 0.1 0.0 0.2 0.0 0.1 0.0 0.0 Percent with income not reportedb 5.6 4.1 15.3 5.8 7.0 4.6 5.0
U.S. WIC 896,551 687,351 615,559 2,199,461 2,141,988 4,961,804 9,303,253
Notes
Percents may not add to 100.0% and subtotals may not add to totals due to rounding and to the use of weights in the case of several State agencies that either under- or overreported the number of participants
State and local agencies may collect data on weekly, monthly, or annual incomes. For reporting and analysis, annualized incomes have been computed. Additionally, note that income calculations include only those participants for whom State agencies reported data on income, income period, and size of economic unit. In 2014, a State agency could report actual income or could report an income range. Both types of data are included in the calculations of mean and median incomes. a Incomes reported as zero are reported separately and excluded from these mean and median calculations. In some reporting agencies, zero may be used to indicate missing information or adjunctive eligibility. PC2014 cannot distinguish between households with missing income information and households reporting zero income. b “Not reported” indicates the percentage of participants by participant category for whom data on income, income period, or size of economic unit were not reported. They are excluded from mean and median calculations.

WIC Participant and Program Characteristics: 2014 Final Report
Page 161
Table VII.6. Distribution of Income as a Percent of Federal Poverty Guideline of WIC Participants
By Participant Category and Migrant Status
Pregnant Women
Breastfeeding Women
Postpartum Women
Total Women
Infants
Children
Total Participants
Percent of Federal Poverty Guideline %
Cum. %
%
Cum. %
%
Cum. %
%
Cum. %
%
Cum. %
%
Cum. %
%
Cum. %
Migrant
0–50 29.4 29.4 31.1 31.1 35.4 35.4 31.4 31.4 33.6 33.6 33.7 33.7 33.1 33.1
51–100 41.3 70.7 44.7 75.7 40.7 76.1 42.4 73.8 42.2 75.8 43.4 77.1 42.9 76.1 101–130 12.0 82.7 10.8 86.6 9.8 85.9 11.1 84.9 9.8 85.6 9.3 86.5 9.8 85.9 131–150 5.2 88.0 3.9 90.4 3.7 89.6 4.4 89.3 3.6 89.2 3.5 90.0 3.8 89.7 151–185 5.0 93.0 3.7 94.1 3.0 92.6 4.1 93.3 3.1 92.3 3.8 93.7 3.7 93.3 186–200 0.6 93.6 0.2 94.3 0.1 92.7 0.3 93.6 0.2 92.5 0.4 94.2 0.3 93.7 201–225 0.6 94.2 0.2 94.5 0.4 93.1 0.4 94.1 0.2 92.7 0.3 94.5 0.3 94.0 226–250 0.2 94.4 0.2 94.7 0.2 93.3 0.2 94.3 0.1 92.8 0.2 94.7 0.2 94.2 More than 250 0.2 94.6 0.1 94.8 0.0 93.4 0.1 94.4 0.1 92.9 0.2 94.9 0.2 94.4 Income reported as zeroa 0.9 95.5 0.7 95.5 1.0 94.3 0.9 95.2 2.0 94.9 1.2 96.1 1.3 95.7 Not reportedb c 4.5 100.0 4.5 100.0 5.7 100.0 4.8 100.0 5.1 100.0 3.9 100.0 4.3 100.0
Total Migrant WIC
3,864
3,647
2,159
9,669
7,801 21,601 39,071
Nonmigrant
0–50 33.1 33.1 30.4 30.4 40.5 40.5 34.3 34.3 36.3 36.3 33.5 33.5 34.4 34.4
51–100 32.0 65.2 34.6 65.0 29.2 69.7 32.0 66.4 30.7 67.0 34.3 67.8 32.9 67.3 101–130 12.0 77.2 12.7 77.7 9.5 79.1 11.5 77.9 10.4 77.4 11.4 79.2 11.2 78.5 131–150 5.6 82.8 5.7 83.4 4.1 83.3 5.2 83.1 4.6 82.1 5.1 84.4 5.1 83.5 151–185 6.8 89.7 6.9 90.3 4.6 87.9 6.2 89.4 5.4 87.5 6.0 90.3 5.9 89.4 186–200 0.6 90.2 0.4 90.7 0.3 88.2 0.5 89.8 0.4 87.9 0.4 90.8 0.4 89.9 201–225 0.6 90.8 0.4 91.2 0.3 88.5 0.5 90.3 0.4 88.2 0.4 91.2 0.4 90.3 226–250 0.3 91.1 0.2 91.4 0.2 88.7 0.2 90.5 0.2 88.4 0.2 91.4 0.2 90.5 More than 250 0.3 91.5 0.3 91.7 0.3 89.0 0.3 90.9 0.3 88.8 0.4 91.8 0.3 90.9 Income reported as zeroa 0.9 92.3 0.9 92.6 0.8 89.8 0.8 91.7 1.7 90.4 0.6 92.4 0.9 91.8 Not reportedb c 7.7 100.0 7.4 100.0 10.2 100.0 8.3 100.0 9.6 100.0 7.6 100.0 8.2 100.0
Total Nonmigrant WIC 891,072 681,675 612,975 2,185,723 2,130,922 4,914,614 9,231,259

WIC Participant and Program Characteristics: 2014 Final Report
Page 162
Table VII.6. (continued) Distribution of Income as a Percent of Federal Poverty Guideline of WIC Participants by Participant Category and Migrant Status
Pregnant Women
Breastfeeding Women
Postpartum Women
Total Women
Infants
Children
Total Participants
Percent of Federal Poverty Guideline %
Cum. %
%
Cum. %
%
Cum. %
%
Cum. %
%
Cum. %
%
Cum. %
%
Cum. %
Migrant Status Not Reported
0–50 44.5 44.5 49.1 49.1 34.1 34.1 45.7 45.7 44.9 44.9 36.1 36.1 38.2 38.2 51–100 37.0 81.4 35.3 84.4 32.2 66.4 35.6 81.3 34.6 79.5 41.2 77.3 39.8 78.0 101–130 6.3 87.7 6.7 91.1 7.1 73.4 6.5 87.9 6.7 86.2 9.1 86.3 8.5 86.5 131–150 3.0 90.7 3.0 94.0 6.8 80.2 3.4 91.3 3.8 90.0 4.1 90.4 4.0 90.5 151–185 3.4 94.1 1.7 95.7 3.5 83.8 2.6 93.8 2.5 92.5 4.3 94.8 3.9 94.4 186–200 0.2 94.2 0.1 95.8 0.0 83.8 0.1 93.9 0.1 92.6 0.1 94.9 0.1 94.6 201–225 0.1 94.3 0.1 95.9 0.5 84.2 0.1 94.1 0.2 92.7 0.2 95.1 0.2 94.7 226–250 0.1 94.4 0.0 95.9 0.0 84.2 0.0 94.1 0.0 92.8 0.1 95.2 0.1 94.8 More than 250 0.0 94.4 0.0 95.9 0.2 84.5 0.0 94.1 0.1 92.8 0.2 95.4 0.2 95.0 Income reported as zeroa 0.1 94.4 0.0 95.9 0.2 84.7 0.0 94.2 0.1 93.0 0.0 95.4 0.0 95.0 Not reportedb c 5.6 100.0 4.1 100.0 15.3 100.0 5.8 100.0 7.0 100.0 4.6 100.0 5.0 100.0
Total Migrant Status Not Reported for WIC
1,615
2,029
425
4,069
3,265
25,589
32,923
Notes
Percents may not add to 100.0% and subtotals may not add to totals due to rounding and to the use of weights in the case of several State agencies that either under- or overreported the number of participants.
Poverty-level calculations are based on income, income period, and household size as reported by State agencies. a Incomes reported as zero are reported separately and excluded from these income calculations. In some reporting agencies, zero may be used to indicate missing information or adjunctive eligibility. PC2014 cannot therefore distinguish between households with missing income information and households reporting zero income. b “Not reported” indicates the percentage of participants by participant category for whom data on income, income period, or size of economic unit are not reported. They are excluded from mean and median calculations. c Adjunct eligibles are income eligible for WIC due to certification for another means tested program such as SNAP, TANF, or Medicaid. The category "Not reported" indicates WIC did not obtain the additional income information requested for reporting characteristics in this report.

WIC Participant and Program Characteristics: 2014 Final Report
Page 163
C. NUTRITIONAL RISK CHARACTERISTICS OF MIGRANT WIC PARTICIPANTS
Table VII.7 presents the most common nutritional risks reported by migrant WIC participants, including the following:
• High weight-for-height/length was reported for more than half of migrant women in each certification category and for 32.1 percent of migrant children, which is higher for migrant children than for all children (27.1 percent).
• Inappropriate nutrition practices were reported for more than 30 percent of all migrants including 60.3 percent of migrant children; these levels are similar to those of the overall WIC population.
• Homelessness/migrancy was reported for approximately 40 percent of migrants in each category and reported at the highest rate for pregnant women (47.0 percent).
• Homelessness/migrancy was reported for 42.1 percent of migrant children. By definition, all migrants are at risk for homelessness/migrancy; variations in reporting can be explained partly by differences in State agency reporting policies. In contrast, in no certification category in the overall WIC population were more than 0.5 percent of participants assigned this nutritional risk.
• The percentage of migrant WIC participants reporting more than one nutritional risk was 69.5 percent in 201436 as compared to 46.0 percent for the overall WIC population (see table IV.2).
The breakdown of migrant participants’ nutritional risks in table VII.8 can be compared to similar tables for the total WIC population (see tables IV.6, IV.7, and IV.8). One noteworthy difference is that only 3.1 percent of migrant women reported substance abuse as a nutritional risk compared to 10.1 percent of all WIC women. Aside from homelessness/migrancy, the distributions of nutritional risks for migrants and nonmigrants were similar.
More than one-quarter (27.5 percent) of migrant women and 11.3 percent of migrant children had hemoglobin and hematocrit levels below FNS-issued nutritional risk criteria standards (see table VII.9). Compared to all WIC women (see table IV.47), pregnant migrant women were similarly likely to have anemia, but breastfeeding and postpartum migrant women were 5.8 and 2.4 percentage points more likely, respectively, to be anemic. Migrant WIC children were less likely to have anemia compared to all WIC children, though the differences were small (see table IV.49).
Table VII.10 displays the distribution of migrant infants and children in the upper and lower ranges of the NCHS-CDC and WHO growth charts. Migrant children were more likely to be overweight compared to WIC children overall (see table IV.38); 34.6 percent of 1-year-old children were at or above the 90th percentile on the weight-for-length growth chart and 27.7 percent of children aged 2 and older were at or above the 90th percentile on the BMI growth chart. This was a higher rate than among WIC children overall (see table IV.38); 31.3 percent of
36 Migrant WIC statistics from special tabulations not presented here.
WIC Participant and Program Characteristics: 2014 Final Report
Page 164
all 1-year-old children were at or above the weight-for-length 90th percentile and 22.3 percent of all children aged 2 and older were at or above the BMI 90th percentile.

WIC Participant and Program Characteristics: 2014 Final Report
Page 165
Table VII.7. Nutritional Risks Reported for at Least 15 Percent Of
Migrant WIC Participants by Participant Category Participant Category and Specific Risk Percent Pregnant Women 3,864
General obstetrical risks 34.2 Prepregnancy high weight-for-height 58.0 Homelessness/migrancy 47.0 Inappropriate growth or weight gain pattern 51.7 Inappropriate nutrition practices 38.3
Breastfeeding Women 3,647 Breastfeeding mother and infant dyad 53.6 General obstetrical risks 21.3 Hematocrit or hemoglobin below FNS criteria 36.7 High weight-for-height 56.8 Homelessness/migrancy 40.4 Inappropriate growth or weight gain pattern 25.3 Inappropriate nutrition practices 33.3 Nutrition-related risk conditions 18.6
Postpartum Women 2,159 General obstetrical risks 24.6 Hematocrit or hemoglobin below FNS criteria 37.5 High weight-for-height 57.9 Homelessness/migrancy 41.5 Inappropriate growth or weight gain pattern 25.7 Inappropriate nutrition practices 32.3 Nutrition-related risk conditions 20.4
Infants 7,801 Homelessness/migrancy 39.5 Inappropriate nutrition practices 31.8 Infant of a WIC-eligible mother or mother at risk during pregnancy 85.3
Children 21,601 Failure to meet Dietary Guidelines for Americans 15.4 High weight-for-height/length 32.1 Homelessness/migrancy 42.1 Inappropriate nutrition practices 60.3
Total Migrant WIC 39,071 Notes
Percents may not add to 100.0% and subtotals may not add to totals due to rounding and the use of weights in the case of several State agencies that either under-or overreported the number of participants.
Each risk shown represents 15% or more of all migrant WIC participants in the participant category.
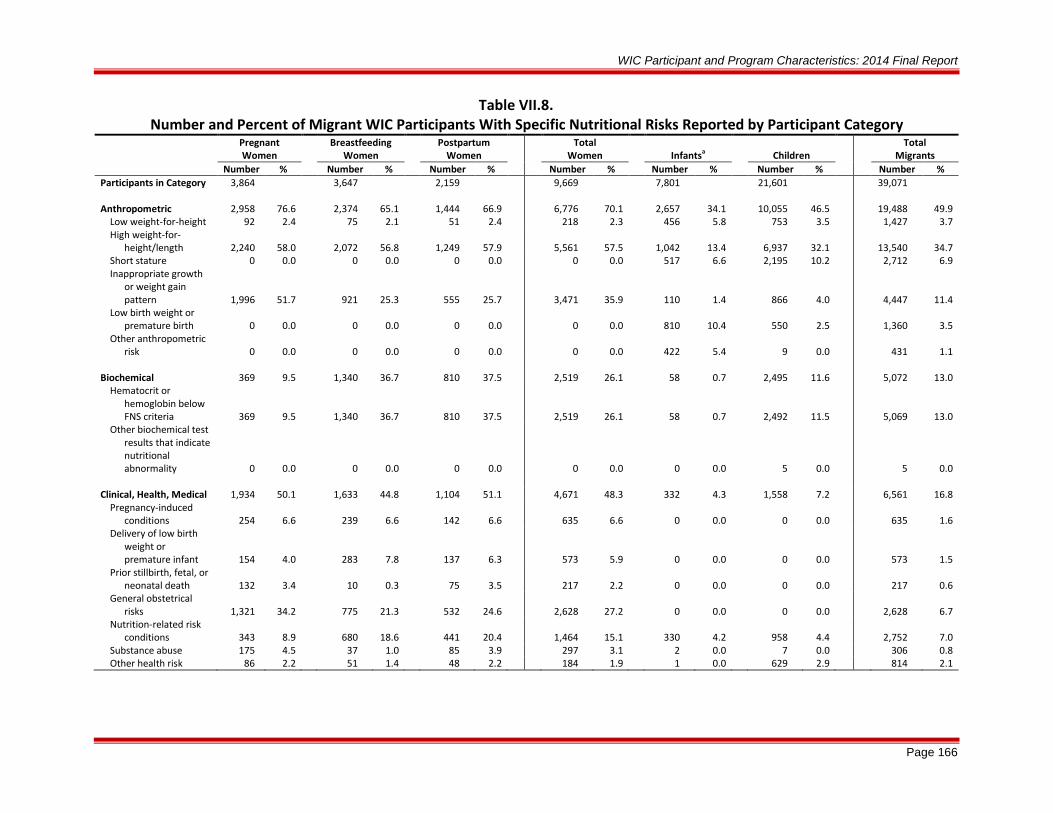
WIC Participant and Program Characteristics: 2014 Final Report
Page 166
Table VII.8. Number and Percent of Migrant WIC Participants With Specific Nutritional Risks Reported by Participant Category
Pregnant Women
Breastfeeding Women
Postpartum Women
Total Women
Infantsa
Children
Total Migrants
Number % Number % Number % Number % Number % Number % Number %
Participants in Category 3,864
3,647
2,159
9,669
7,801
21,601
39,071
Anthropometric 2,958 76.6 2,374 65.1 1,444 66.9 6,776 70.1 2,657 34.1 10,055 46.5 19,488 49.9 Low weight-for-height 92 2.4 75 2.1 51 2.4 218 2.3 456 5.8 753 3.5 1,427 3.7 High weight-for-
height/length 2,240 58.0
2,072 56.8
1,249 57.9
5,561 57.5
1,042 13.4
6,937 32.1
13,540 34.7 Short stature 0 0.0 0 0.0 0 0.0 0 0.0 517 6.6 2,195 10.2 2,712 6.9 Inappropriate growth
or weight gain pattern 1,996 51.7
921 25.3
555 25.7
3,471 35.9
110 1.4
866 4.0
4,447 11.4 Low birth weight or
premature birth 0 0.0
0 0.0
0 0.0
0 0.0
810 10.4
550 2.5
1,360 3.5 Other anthropometric
risk 0 0.0
0 0.0
0 0.0
0 0.0
422 5.4
9 0.0
431 1.1
Biochemical 369 9.5 1,340 36.7 810 37.5 2,519 26.1 58 0.7 2,495 11.6 5,072 13.0 Hematocrit or
hemoglobin below FNS criteria 369 9.5
1,340 36.7
810 37.5
2,519 26.1
58 0.7
2,492 11.5
5,069 13.0 Other biochemical test
results that indicate nutritional abnormality 0 0.0
0 0.0
0 0.0
0 0.0
0 0.0
5 0.0
5 0.0
Clinical, Health, Medical 1,934 50.1 1,633 44.8 1,104 51.1 4,671 48.3 332 4.3 1,558 7.2 6,561 16.8 Pregnancy-induced
conditions 254 6.6
239 6.6
142 6.6
635 6.6
0 0.0
0 0.0
635 1.6 Delivery of low birth
weight or premature infant 154 4.0
283 7.8
137 6.3
573 5.9
0 0.0
0 0.0
573 1.5 Prior stillbirth, fetal, or
neonatal death 132 3.4
10 0.3
75 3.5
217 2.2
0 0.0
0 0.0
217 0.6 General obstetrical
risks 1,321 34.2
775 21.3
532 24.6
2,628 27.2
0 0.0
0 0.0
2,628 6.7 Nutrition-related risk
conditions 343 8.9
680 18.6
441 20.4
1,464 15.1
330 4.2
958 4.4
2,752 7.0 Substance abuse 175 4.5 37 1.0 85 3.9 297 3.1 2 0.0 7 0.0 306 0.8 Other health risk 86 2.2 51 1.4 48 2.2 184 1.9 1 0.0 629 2.9 814 2.1
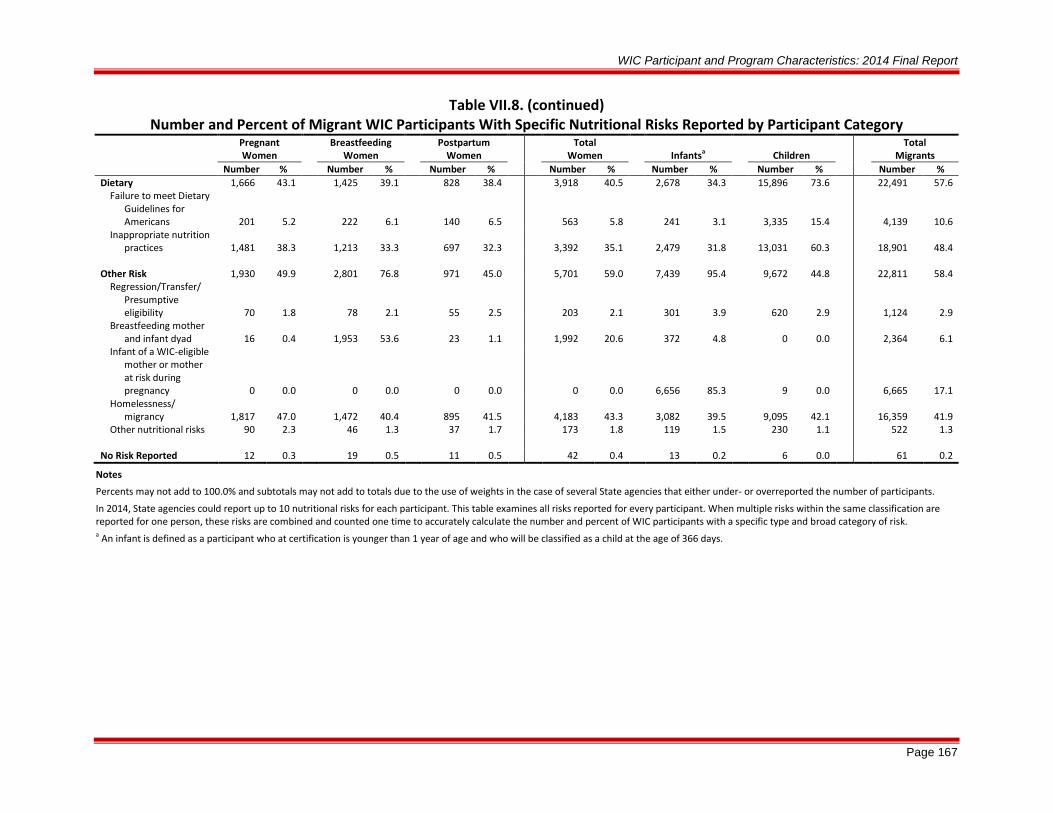
WIC Participant and Program Characteristics: 2014 Final Report
Page 167
Table VII.8. (continued) Number and Percent of Migrant WIC Participants With Specific Nutritional Risks Reported by Participant Category
Pregnant Women
Breastfeeding Women
Postpartum Women
Total Women
Infantsa
Children
Total Migrants
Number % Number % Number % Number % Number % Number % Number % Dietary 1,666 43.1 1,425 39.1 828 38.4 3,918 40.5 2,678 34.3 15,896 73.6 22,491 57.6
Failure to meet Dietary Guidelines for Americans 201 5.2
222 6.1
140 6.5
563 5.8
241 3.1
3,335 15.4
4,139 10.6 Inappropriate nutrition
practices 1,481 38.3
1,213 33.3
697 32.3
3,392 35.1
2,479 31.8
13,031 60.3
18,901 48.4
Other Risk 1,930 49.9 2,801 76.8 971 45.0 5,701 59.0 7,439 95.4 9,672 44.8 22,811 58.4 Regression/Transfer/
Presumptive eligibility 70 1.8
78 2.1
55 2.5
203 2.1
301 3.9
620 2.9
1,124 2.9 Breastfeeding mother
and infant dyad 16 0.4
1,953 53.6
23 1.1
1,992 20.6
372 4.8
0 0.0
2,364 6.1 Infant of a WIC-eligible
mother or mother at risk during pregnancy 0 0.0
0 0.0
0 0.0
0 0.0
6,656 85.3
9 0.0
6,665 17.1 Homelessness/
migrancy 1,817 47.0
1,472 40.4
895 41.5
4,183 43.3
3,082 39.5
9,095 42.1
16,359 41.9 Other nutritional risks 90 2.3 46 1.3 37 1.7 173 1.8 119 1.5 230 1.1 522 1.3
No Risk Reported 12 0.3 19 0.5 11 0.5 42 0.4 13 0.2 6 0.0 61 0.2
Notes
Percents may not add to 100.0% and subtotals may not add to totals due to the use of weights in the case of several State agencies that either under- or overreported the number of participants.
In 2014, State agencies could report up to 10 nutritional risks for each participant. This table examines all risks reported for every participant. When multiple risks within the same classification are reported for one person, these risks are combined and counted one time to accurately calculate the number and percent of WIC participants with a specific type and broad category of risk. a An infant is defined as a participant who at certification is younger than 1 year of age and who will be classified as a child at the age of 366 days.

WIC Participant and Program Characteristics: 2014 Final Report
Page 168
Table VII.9. Number and Percent of Anemic Migrant WIC Participants by Participant Category
Migrant WIC Participants
Number Percent
Migrant WIC Women
Total Women 9,669 Below FNS-issued nutritional risk criteriaa 2,662 27.5
Not reportedb 937 9.7 Pregnant Women 3,864
Below FNS-issued nutritional risk criteriaa 362 9.4 Not reportedb 389 10.1
Breastfeeding Women 3,647 Below FNS-issued nutritional risk criteriaa 1,429 39.2
Not reportedb 339 9.3 Postpartum Women 2,159
Below FNS-issued nutritional risk criteriaa 871 40.4 Not reportedb 209 9.7
Migrant WIC Children
Total Children 21,601 Below FNS-issued nutritional risk criteriaa 2,439 11.3
Not reportedb 2,954 13.7 1-Year-Old-Childrenc 8,180
Below FNS-issued nutritional risk criteriaa 1,164 14.2 Not reportedb 775 9.5
2-Year-Old-Childrenc 5,364 Below FNS-issued nutritional risk criteriaa 626 11.7
Not reportedb 860 16.0 3-Year-Old-Childrenc 5,015
Below FNS-issued nutritional risk criteriaa 443 8.8 Not reportedb 820 16.4
4-Year-Old-Childrenc 3,042 Below FNS-issued nutritional risk criteriaa 206 6.8
Not reportedb 499 16.4 Age Not Reported 1 0.0
Notes
Percents may not add to 100.0% and subtotals may not add to totals due to rounding and to the use of weights in the case of several State agencies that either under- or overreported the number of participants.
Percent below each standard includes in denominators WIC participants for whom no data were reported so the percentages reported here represent lower bounds.
Federal WIC regulations permit State and local agencies to dispense with hematological testing for infants younger than 6 months of age as well as for children who are found to be within normal ranges at their last certification. However, blood tests should be performed on such children at least once in every 12-month period. a Source: HHS, 1998. b “Not reported” indicates the percentage of participants, by participant category, for whom data on blood measure or expected date of delivery were not reported. c Age is calculated in months using birth date and date of blood measurement.

WIC Participant and Program Characteristics: 2014 Final Report
Page 169
Table VII.10. Distribution of Infant and Child Migrant WIC Participants According to
Selected Anthropometric Measures Percent by Percentilec
Infantsb Children
WHO/NCHS-CDC Percentilesa 1 Year 2+ Years Weight-for-Length/BMIdf
≤ 2.3rd percentile 5.3 0.3 1.2 ≤ 5th 7.6 0.8 2.1 ≤ 10th 11.7 1.7 4.1 ≥ 85th N/A N/A 35.5 ≥ 90th 19.5 34.6 27.7 ≥ 95th 11.8 23.0 18.0 ≥ 97.7th 7.6 14.7 11.2 Invalid or missing anthropometric data 5.3 2.3 3.7
Weight-for-Agee
< 3rd percentile 5.7 1.0 1.7
< 5th 6.9 1.7 2.8 < 10th 10.9 3.4 5.4 ≥ 90th 10.0 21.8 21.0 ≥ 95th 4.8 13.3 13.3 ≥ 97th 3.0 9.1 9.8 Invalid or missing anthropometric data 2.7 2.2 3.0
Height/Length-for-Agee ≤ 2.3rd percentile 9.0 6.7 2.4 ≤ 5th 13.1 11.8 4.9 ≤ 10th 18.2 19.2 9.2 ≥ 90th 11.5 7.8 10.2 ≥ 95th 7.9 4.8 5.2 ≥ 97th 4.7 3.1 3.5 Invalid or missing anthropometric data 3.3 2.2 2.7
WIC Migrant Participants 7,801 7,432 14,160
Notes
Percents may not add to 100.0% and subtotals may not add to totals due to rounding and to the use of weights in the case of several State agencies that either under- or overreported the number of participants.
Anthropometric criteria for infants and 1-year-old children are calculated using programming code for pediatric anthropometry developed by WHO based on WHO Child Growth Standards (2006).
WHO reference curves are based on data from the WHO Multicentre Growth Reference Study conducted by WHO from 1997 to 2003.
Anthropometric criteria for children aged 2 or older are calculated using programming code for pediatric anthropometry developed by CDC based on current growth charts (Kuczmarski et al., 2002).
NCHS-CDC reference curves are based on data from a series of national health examination surveys conducted by NCHS from 1963 to 1994.
Age is not reported for eight migrant children. a WHO = World Health Organization. NCHS = National Center for Health Statistics. CDC = Centers for Disease Control and Prevention. b An infant is defined as a participant who, at certification, is younger than 1 year of age and who will be classified as a child at the age of 366 days. c Percentiles reported in this table are cumulative. For example the <5th category includes those infants in the <=2.3rd percentile, and the ≥95th category includes those infants in the ≥97.7th percentile. d It is assumed that height for an infant is recumbent length. e Age is calculated in months using birth dates and dates of height/length and weight measurement. f Weight-for-length is used to calculate percentiles for infants and 1-year-old children. BMI is used to calculate percentiles for children aged 2 or older.

WIC Participant and Program Characteristics: 2014 Final Report
Page 170
D. WIC RISK PRIORITY LEVELS OF MIGRANT WIC PARTICIPANTS
More than two-thirds of migrant WIC participants (68.9 percent) were assigned to Risk Priorities I, II, or III, which are associated with anthropometric, biochemical, and clinical risks (see table VII.11). About one-quarter of migrant WIC participants (24.4 percent) were assigned to Risk Priority V, indicating inadequate dietary patterns. About the same proportion—nearly one-quarter—of participants in the overall WIC population were assigned to Risk Priority V (see table V.2).
Priority VII is for individuals certified solely due to migrancy, homelessness, or risk of regression and is used to ensure there is some way to certify migrants when they cannot be assigned to a higher priority level. Only 0.4 percent of all migrant participants were assigned to Priority VII, but this rate is twice as high as for the general WIC population.
All migrant participants had a nearly identical distribution of overall Risk Priorities as the overall WIC population. The differences were 2 percentage points or less across all certification categories, with the largest gap found in Priority II; 4.8 percent of migrants were in this category versus 6.8 percent of the general WIC population.

WIC Participant and Program Characteristics: 2014 Final Report
Page 171
Table VII.11. Risk Priority Levels of Migrant WIC Participants by Participant Category
Pregnant Women
Breastfeeding Women
Postpartum Women
Total Women
Infants
Children
Total Migrant WIC
Number % Number % Number % Number % Number % Number % Number %
Risk Priority Reported
Ia 3,429 88.7 3,388 92.9 40 1.9 6,856 70.9 5,439 69.7 18 0.1 12,313 31.5 II 0 0.0 50 1.4 1 0.0 51 0.5 1,832 23.5 1 0.0 1,884 4.8 III 0 0.0 1 0.0 656 30.4 657 6.8 0 0.0 12,084 55.9 12,741 32.6 IV 427 11.1 178 4.9 41 1.9 646 6.7 478 6.1 7 0.0 1,131 2.9 V 1 0.0 7 0.2 176 8.2 184 1.9 6 0.1 9,354 43.3 9,544 24.4 VI 0 0.0 9 0.2 1,233 57.1 1,242 12.8 0 0.0 1 0.0 1,243 3.2 VII 3 0.1 7 0.2 4 0.2 14 0.1 33 0.4 105 0.5 152 0.4
No Risk Priority Reported 4 0.1
7 0.2
7 0.3
18 0.2
13 0.2
32 0.1
63 0.2
U.S. Migrant WIC 3,864
3,647
2,159
9,669
7,801
21,601
39,071 Notes
Percents may not add to 100.0% and subtotals may not add to totals due to rounding and to the use of weights in the case of several State agencies that either under- or overreported the number of participants.
In the migrant WIC population, about 1.77% of 1-year-old children are 11-month-old infants who have been reclassified (though not formally recertified) as children. About 0.01% of WIC participants who are classified as infants are participants older than 366 days. a A small proportion of postpartum women and children may not have had their State agency-level records or priorities updated on State agency-maintained management information systems when they were certified for WIC benefits in different certification categories.

WIC Participant and Program Characteristics: 2014 Final Report
Page AA-1
ABBREVIATIONS AND ACRONYMS
BMI body mass index
CDC Centers for Disease Control and Prevention
CPS Current Population Survey
EBT electronic benefit transfer
FDPIR Food Distribution Program on Indian Reservations
FNS Food and Nutrition Service
FY fiscal year
HHS U.S. Department of Health and Human Services
IOM Institute of Medicine
ITO Indian tribal organization
MDS Minimum Data Set
NHANES National Health and Nutrition Examination Survey
OMB Office of Management and Budget
PC Participant and Program Characteristics
SDS Supplemental Data Set
SNAP Supplemental Nutrition Assistance Program
TANF Temporary Assistance to Needy Families
USDA U.S. Department of Agriculture
WHO World Health Organization
WIC Special Supplemental Nutrition Program for Women, Infants, and Children

WIC Participant and Program Characteristics: 2014 Final Report
Page R-1
REFERENCES
Cole, N., Hoaglin, D., & Kirlin, J. (2001). National survey of WIC Participants: Final report (Report No. WIC-01-NWSP, Nutrition Assistance Program Report Series). Retrieved from http://www.fns.usda.gov/sites/default/files/WICSurvey.pdf
Institute of Medicine. (1996). WIC nutrition risk criteria a scientific assessment. Washington DC: National Academy Press.
Kuczmarski, R. J., Ogden, C. L., Guo, S. S., Grummer-Strawn, L. M., Flegal, K. M., Mei, Z… Johnson, C.L. (2002). 2000 CDC growth charts for the United States: Methods and development (Vital Health Statistics, Series 11, No. 246). Retrieved from http://www.cdc.gov/growthcharts/2000growthchart-us.pdf
Martin, J. A., Hamilton, B. E., Osterman, M. J. K., Curtin, S. C., & Mathews, T. J. (2015). Births: Final data for 2013 (National Vital Statistics Reports, Vol. 64, No. 1). Retrieved from http://www.cdc.gov/nchs/data/nvsr/nvsr64/nvsr64_01.pdf
National Institutes of Health, National Heart, Lung, and Blood Institute. (1998). Clinical guidelines on the identification, evaluation, and treatment of overweight and obesity in adults (NIH Publication No. 98-4083). Bethesda, MD: National Heart, Lung, and Blood Institute.
Special Supplemental Nutrition Program for Women, Infants, and Children. 7 C.F.R. § 246.7 (2014).
U.S. Department of Agriculture, Food and Nutrition Service. (2005). WIC policy memorandum 98-9, revision 8 nutrition risk criteria. Alexandria, VA: Author.
U.S. Department of Agriculture, Food and Nutrition Service. (2007). WIC policy memorandum 98-9, revision 9 nutrition risk criteria. Alexandria, VA: Author.
U.S. Department of Agriculture, Food and Nutrition Service. (2009). WIC policy memorandum 98-9, revision 10 nutrition risk criteria. Alexandria, VA: Author.
U.S. Department of Agriculture, Food and Nutrition Service. (2014a). WIC income eligibility guidelines 2013–2014. Retrieved from http://www.fns.usda.gov/sites/default/files/FY2013-2014_WIC_IEGs_WEB.pdf
U.S. Department of Agriculture, Food and Nutrition Service. (2014b). WIC State agency EBT detail status report [Chart]. Retrieved from http://www.fns.usda.gov/sites/default/files/wic/WIC-detailebtstatusreport.pdf
U.S. Department of Agriculture & U.S. Department of Health and Human Services. (2010). Dietary guidelines for Americans (7th ed). Retrieved from http://health.gov/dietaryguidelines/dga2010/DietaryGuidelines2010.pdf

WIC Participant and Program Characteristics: 2014 Final Report
Page R-2
U.S. Department of Commerce, Census Bureau. (n.d.). 5-Year American Community Survey [Web page]. Data from 2009–2014. Retrieved from http://factfinder.census.gov/faces/tableservices/jsf/pages/productview.xhtml?pid=ACS_13_5YR_DP05&prodType=table
U.S. Department of Commerce, Census Bureau, & U.S. Department of Labor, Bureau of Labor Statistics. (2014). 2013 Poverty statistics from the Current Population Survey [Web page]. Retrieved from http://www.census.gov/hhes/www/cpstables/032014/pov/toc.htm
U.S. Department of Health and Human Services. (2014). 2014 poverty guidelines [Web page]. Retrieved from http://aspe.hhs.gov/poverty/14poverty.cfm#thresholds
U.S. Department of Health and Human Services, Centers for Disease Control and Prevention. (1998). Recommendations to prevent and control iron deficiency in the United States (Morbidity and Mortality Weekly Report, Vol. 47, No. RR-3). Retrieved from www.cdc.gov/mmwr/pdf/rr/rr4703.pdf
U.S. Department of Labor, Bureau of Labor Statistics. (n.d.). Labor force statistics from the Current Population Survey [Web page]. Data from 2007–2014. Retrieved from http://data.bls.gov/timeseries/LNS14000000
U.S. Department of Labor, Bureau of Labor Statistics. (2014, April). Consumer Price Index detailed report [Web page]. Retrieved from http://www.bls.gov/cpi/cpid1404.pdf

WIC Participant and Program Characteristics: 2014 Final Report
Page A-1
APPENDIX A: CHAPTER II SUPPLEMENTAL TABLES AND FIGURES
Table A.II.1. Number and Percent of WIC Participants by Participant Category and State
Region and State
Pregnant Women
Breastfeeding Women
Postpartum Women
Total Women
Infants
Children
Total Participants
Number % Number % Number % Number % Number % Number % Number % U.S. WIC 896,551 40.8 687,351 31.3 615,559 28.0 2,199,461 23.6 2,141,988 23.0 4,961,804 53.3 9,303,253 100.0
Northeast 75,915 38.8 74,742 38.2 44,901 23.0 195,558 23.1 192,390 22.8 457,710 54.1 845,658 100.0 Connecticut 6,260 47.1 4,038 30.4 2,995 22.5 13,293 22.2 14,525 24.2 32,178 53.6 59,996 100.0 Maine 2,126 38.5 1,636 29.7 1,754 31.8 5,516 22.0 5,384 21.4 14,206 56.6 25,106 100.0 Massachusetts 12,197 40.6 9,455 31.4 8,425 28.0 30,077 22.7 32,853 24.8 69,739 52.6 132,669 100.0 New Hampshire 1,625 38.6 1,167 27.7 1,419 33.7 4,211 24.5 4,239 24.6 8,756 50.9 17,206 100.0 New York 50,045 37.5 55,841 41.9 27,525 20.6 133,411 23.4 126,058 22.1 310,969 54.5 570,438 100.0 Rhode Island 2,370 40.9 1,339 23.1 2,092 36.1 5,801 22.9 6,421 25.3 13,145 51.8 25,367 100.0 Vermont 1,246 39.2 1,257 39.5 678 21.3 3,181 21.8 2,820 19.4 8,571 58.8 14,572 100.0 Indian Township
(ME) 13 68.4
3 15.8
3 15.8
19 25.3
12 16.0
44 58.7
75 100.0 Pleasant Point (ME) 10 76.9 0 0.0 3 23.1 13 16.3 22 27.5 45 56.3 80 100.0 Seneca Nation (NY) 23 63.9 6 16.7 7 19.4 36 24.2 56 37.6 57 38.3 149 100.0
Mid-Atlantic 91,452 40.1 67,886 29.8 68,780 30.2 228,118 22.4 238,402 23.5 549,963 54.1 1,016,483 100.0 Delaware 1,889 40.3 1,170 25.0 1,624 34.7 4,683 19.8 6,306 26.7 12,654 53.5 23,643 100.0 District of Columbia 1,501 35.8 1,397 33.3 1,298 30.9 4,196 25.2 4,932 29.6 7,551 45.3 16,679 100.0 Maryland 13,373 37.6 14,129 39.7 8,047 22.6 35,549 23.2 38,586 25.2 78,764 51.5 152,899 100.0 New Jersey 14,935 40.1 13,263 35.6 9,049 24.3 37,247 22.6 38,340 23.2 89,420 54.2 165,007 100.0 Pennsylvania 21,444 37.5 13,734 24.0 22,061 38.5 57,239 21.9 62,768 24.0 141,430 54.1 261,437 100.0 Puerto Rico 17,726 50.1 7,682 21.7 9,968 28.2 35,376 19.8 35,106 19.6 108,610 60.6 179,092 100.0 Virginia 15,392 37.0 13,795 33.2 12,380 29.8 41,567 25.2 39,091 23.7 84,051 51.0 164,709 100.0 Virgin Islands 288 25.3 740 65.0 110 9.7 1,138 23.0 1,067 21.6 2,737 55.4 4,942 100.0 West Virginia 4,904 44.1 1,976 17.8 4,243 38.1 11,123 23.1 12,206 25.4 24,746 51.5 48,075 100.0
Southeast 193,867 42.2 127,574 27.7 138,431 30.1 459,872 24.9 450,299 24.3 940,417 50.8 1,850,588 100.0 Alabama 16,121 46.7 4,760 13.8 13,660 39.5 34,541 24.7 35,693 25.5 69,692 49.8 139,926 100.0 Florida 54,967 39.9 48,893 35.5 33,962 24.6 137,822 24.2 133,082 23.3 299,533 52.5 570,437 100.0 Georgia 34,677 43.8 23,371 29.5 21,134 26.7 79,182 25.1 73,594 23.4 162,210 51.5 314,986 100.0 Kentucky 18,584 49.3 8,325 22.1 10,759 28.6 37,668 26.0 36,943 25.5 70,192 48.5 144,803 100.0 Mississippi 9,261 44.4 2,333 11.2 9,252 44.4 20,846 24.7 22,463 26.6 41,138 48.7 84,447 100.0 North Carolina 26,520 39.1 21,089 31.1 20,259 29.9 67,868 23.7 66,228 23.1 152,071 53.1 286,167 100.0 South Carolina 13,893 39.8 8,032 23.0 12,949 37.1 34,874 28.0 35,125 28.2 54,487 43.8 124,486 100.0 Tennessee 19,671 42.1 10,695 22.9 16,391 35.1 46,757 25.4 46,842 25.5 90,206 49.1 183,805 100.0

WIC Participant and Program Characteristics: 2014 Final Report
Page A-2
Table A.II.1. (continued) Number and Percent of WIC Participants by Participant Category by State
Pregnant Women Breastfeeding
Women Postpartum
Women Total
Women
Infants
Children Total
Participants Region and State Number % Number % Number % Number % Number % Number % Number % Southeast (continued)
Eastern Band Cherokee (NC) 70 40.9
67 39.2
34 19.9
171 23.3
146 19.9
418 56.9
735 100.0
Mississippi Choctaw (MS) 103 72.0
9 6.3
31 21.7
143 18.0
183 23.0
470 59.0
796 100.0
Midwest 120,345 40.7 71,923 24.3 103,308 35.0 295,576 23.2 302,523 23.8 673,978 53.0 1,272,077 100.0
Illinois 31,103 42.7 20,462 28.1 21,205 29.1 72,770 24.2 75,806 25.2 151,704 50.5 300,280 100.0 Indiana 16,053 38.8 9,986 24.1 15,359 37.1 41,398 24.2 44,756 26.2 84,800 49.6 170,954 100.0 Michigan 24,683 40.2 13,227 21.6 23,415 38.2 61,325 21.3 61,522 21.4 165,285 57.4 288,132 100.0 Minnesota 12,211 39.4 10,543 34.1 8,207 26.5 30,961 23.4 28,068 21.2 73,390 55.4 132,419 100.0 Ohio 25,496 41.1 11,475 18.5 25,029 40.4 62,000 23.7 63,539 24.3 136,266 52.0 261,805 100.0 Wisconsin 10,799 39.8 6,230 23.0 10,093 37.2 27,122 22.9 28,832 24.3 62,533 52.8 118,487 100.0
Southwest 142,717 38.5 136,952 36.9 91,350 24.6 371,019 24.8 355,372 23.8 769,275 51.4 1,495,666 100.0 Arkansas 10,616 43.7 3,329 13.7 10,321 42.5 24,266 25.7 23,863 25.3 46,264 49.0 94,393 100.0 Louisiana 14,498 39.9 5,080 14.0 16,739 46.1 36,317 25.2 41,054 28.5 66,863 46.4 144,234 100.0 New Mexico 7,229 47.5 5,422 35.6 2,559 16.8 15,210 24.2 14,329 22.8 33,249 53.0 62,788 100.0 Oklahoma 11,140 44.4 4,954 19.8 8,983 35.8 25,077 24.2 23,944 23.1 54,555 52.7 103,576 100.0 Texas 96,174 36.6 116,505 44.4 49,995 19.0 262,674 24.9 244,077 23.1 549,955 52.0 1,056,706 100.0 ACL (NM) 47 35.6 54 40.9 31 23.5 132 22.6 121 20.7 332 56.8 585 100.0 Cherokee Nation
(OK) 925 46.1
414 20.6
669 33.3
2,008 23.2
2,250 26.0
4,412 50.9
8,670 100.0 Chickasaw Nation
(OK) 407 38.7
257 24.4
389 36.9
1,053 23.7
1,063 23.9
2,332 52.4
4,448 100.0 Choctaw Nation
(OK) 325 40.3
133 16.5
348 43.2
806 20.1
929 23.2
2,269 56.7
4,004 100.0 Citizen Potawatomi
(OK) 152 46.2
64 19.5
113 34.3
329 23.7
352 25.3
710 51.0
1,391 100.0 Eight Northern
Pueblos (NM) 18 37.5
16 33.3
14 29.2
48 16.3
66 22.4
181 61.4
295 100.0 Five Sandoval
Pueblos (NM) 21 35.6
17 28.8
21 35.6
59 22.5
63 24.0
140 53.4
262 100.0 ITC Oklahoma 77 35.8 39 18.1 99 46.0 215 21.8 249 25.3 521 52.9 985 100.0 Muscogee Creek
Nation (OK) 268 40.6
112 17.0
280 42.4
660 20.7
660 20.7
1,872 58.6
3,192 100.0 Osage Nation (OK) 175 30.8 94 16.5 300 52.7 569 19.9 808 28.3 1,476 51.7 2,853 100.0 Otoe Missouria (OK) 48 45.7 17 16.2 40 38.1 105 19.3 107 19.7 332 61.0 544 100.0 Pueblo of Isleta
(NM) 94 33.0
133 46.7
58 20.4
285 23.8
311 25.9
604 50.3
1,200 100.0

WIC Participant and Program Characteristics: 2014 Final Report
Page A-3
Table A.II.1. (continued) Number and Percent of WIC Participants by Participant Category by State
Pregnant Women Breastfeeding
Women Postpartum
Women Total
Women
Infants
Children Total
Participants Region and State Number % Number % Number % Number % Number % Number % Number % Southwest (continued)
Pueblo of San Felipe (NM) 19 28.8
36 54.5
11 16.7
66 22.8
56 19.4
167 57.8
289 100.0
Pueblo of Zuni (NM) 68 38.9 83 47.4 24 13.7 175 21.1 140 16.9 513 62.0 828 100.0 Santo Domingo
(NM) 11 30.6
19 52.8
6 16.7
36 18.8
37 19.3
119 62.0
192 100.0 WCD (OK) 405 43.6 174 18.7 350 37.7 929 22.0 893 21.1 2,409 56.9 4,231 100.0
Mountain Plains 55,269 39.1 39,208 27.7 46,941 33.2 141,418 24.3 138,887 23.9 301,980 51.9 582,285 100.0 Colorado 9,490 38.6 7,391 30.1 7,679 31.3 24,560 24.4 23,447 23.3 52,742 52.3 100,749 100.0 Iowa 6,873 40.0 4,147 24.1 6,163 35.9 17,183 22.9 17,876 23.8 39,968 53.3 75,027 100.0 Kansas 7,161 39.8 4,925 27.4 5,909 32.8 17,995 23.9 17,995 23.9 39,426 52.3 75,416 100.0 Missouri 15,615 41.0 8,280 21.7 14,223 37.3 38,118 25.9 37,082 25.1 72,252 49.0 147,452 100.0 Montana 1,984 40.7 1,616 33.2 1,269 26.1 4,869 23.0 4,826 22.8 11,459 54.2 21,154 100.0 Nebraska 2,885 30.3 2,884 30.3 3,738 39.3 9,507 23.2 9,711 23.7 21,757 53.1 40,975 100.0 North Dakota 1,298 40.4 853 26.6 1,058 33.0 3,209 23.5 3,321 24.3 7,119 52.2 13,649 100.0 South Dakota 1,793 37.9 1,331 28.1 1,611 34.0 4,735 22.3 4,894 23.1 11,576 54.6 21,205 100.0 Utah 6,609 37.6 6,737 38.4 4,215 24.0 17,561 24.9 15,909 22.6 37,062 52.5 70,532 100.0 Wyoming 1,098 40.2 843 30.9 791 29.0 2,732 23.8 2,756 24.0 6,012 52.3 11,500 100.0 Cheyenne River
Sioux (SD) 68 49.3
22 15.9
48 34.8
138 19.1
156 21.6
429 59.3
723 100.0 Eastern Shoshone
(WY) 15 36.6
10 24.4
16 39.0
41 24.3
45 26.6
83 49.1
169 100.0 Northern Arapahoe
(WY) 38 37.6
32 31.7
31 30.7
101 22.4
118 26.2
231 51.3
450 100.0 Omaha Nation (NE) 30 71.4 2 4.8 10 23.8 42 12.4 66 19.5 231 68.1 339 100.0 Rosebud Sioux (ND) 113 41.5 88 32.4 71 26.1 272 21.7 273 21.8 709 56.5 1,254 100.0 Santee Sioux Nation
(NE) 17 63.0
2 7.4
8 29.6
27 21.8
30 24.2
67 54.0
124 100.0 Standing Rock Sioux
ND) 95 59.0
14 8.7
52 32.3
161 19.4
171 20.7
496 59.9
828 100.0 Three Affiliated (ND) 35 51.5 6 8.8 27 39.7 68 23.8 87 30.4 131 45.8 286 100.0 Ute Mountain Ute
(CO) 22 56.4
7 17.9
10 25.6
39 20.4
48 25.1
104 54.5
191 100.0 Winnebago (NE) 30 50.0 18 30.0 12 20.0 60 22.9 76 29.0 126 48.1 262 100.0

WIC Participant and Program Characteristics: 2014 Final Report
Page A-4
Table A.II.1. (continued) Number and Percent of WIC Participants by Participant Category by State
Pregnant Women Breastfeeding
Women Postpartum
Women Total
Women
Infants
Children Total
Participants Region and State Number % Number % Number % Number % Number % Number % Number % Western 216,986 42.7 169,066 33.3 121,848 24.0 507,900 22.7 464,115 20.7 1,268,481 56.6 2,240,496 100.0
Alaska 2,168 39.9 2,083 38.3 1,182 21.8 5,433 25.2 4,788 22.2 11,369 52.7 21,590 100.0 American Samoa 427 32.0 725 54.3 182 13.6 1,334 19.3 1,133 16.4 4,439 64.3 6,906 100.0 Arizona 17,274 37.5 14,432 31.3 14,357 31.2 46,063 26.5 47,320 27.3 80,142 46.2 173,525 100.0 California 144,444 43.2 111,545 33.3 78,755 23.5 334,744 21.9 299,844 19.6 896,951 58.6 1,531,539 100.0 Guam 644 31.7 703 34.6 686 33.7 2,033 24.1 2,182 25.8 4,236 50.1 8,451 100.0 Hawaii 3,427 36.1 4,003 42.1 2,068 21.8 9,498 24.5 9,045 23.3 20,277 52.2 38,820 100.0 Idaho 4,424 40.7 3,830 35.2 2,612 24.0 10,866 24.6 10,458 23.7 22,866 51.7 44,190 100.0 Nevada 6,466 34.8 5,036 27.1 7,073 38.1 18,575 24.0 17,557 22.7 41,145 53.2 77,277 100.0 Northern Mariana
Islands 340 40.9
288 34.6
204 24.5
832 20.6
735 18.2
2465 61.1
4,032 100.0 Oregon 11,285 43.5 9,724 37.5 4,941 19.0 25,950 24.1 22,936 21.3 58,826 54.6 107,712 100.0 Washington 23,675 50.6 14,932 31.9 8,196 17.5 46,803 23.2 42,592 21.1 112,687 55.8 202,082 100.0 ITC Arizona 979 38.8 592 23.4 954 37.8 2,525 22.3 2,667 23.5 6,137 54.2 11,329 100.0 ITC Nevada 136 40.0 106 31.2 98 28.8 340 22.7 333 22.2 826 55.1 1,499 100.0 Navajo Nation (AZ) 1,297 44.7 1,067 36.7 540 18.6 2,904 25.2 2,525 21.9 6,115 53.0 11,544 100.0

WIC Participant and Program Characteristics: 2014 Final Report
Page A-5
Table A.II.6. Distribution of Race for WIC Participants With Two or More Races Reported
Race Number
% of Two or More Races Population
Two Races 467,312 92.3 White; Black or African American 219,468 43.3 White; American Indian or Alaska Native 146,636 29.0 White; Asian 36,956 7.3 White; Native Hawaiian or Other Pacific Islander 14,928 2.9 Black or African American; American Indian or Alaska Native 20,092 4.0 Black or African American; Asian 8,878 1.8 Black or African American; Native Hawaiian or Other Pacific Islander 5,320 1.1 American Indian or Alaska Native; Asian 5,730 1.1 American Indian or Alaska Native; Native Hawaiian or Other Pacific Islander 2,659 0.5 Asian; Native Hawaiian or Other Pacific Islander 6,645 1.3
Three Races 35,348 7.0 White; Black or African American; American Indian or Alaska Native 13,686 2.7 White; Black or African American; Asian 3,567 0.7 White; Black or African American; Native Hawaiian or Other Pacific Islander 2,122 0.4 White; American Indian or Alaska Native; Asian 2,926 0.6 White; American Indian or Alaska Native; Native Hawaiian or Other Pacific Islander 1,556 0.3 White; Asian; Native Hawaiian or Other Pacific Islander 8,475 1.7 Black or African American; American Indian or Alaska Native; Asian 834 0.2 Black or African American; American Indian or Alaska Native; Native Hawaiian or Other Pacific Islander 483 0.1 Black or African American; Asian; Native Hawaiian or Other Pacific Islander 691 0.1 American Indian or Alaska Native; Asian; Native Hawaiian or Other Pacific Islander 1,009 0.2
Four Races 2,540 0.5 White; Black or African American; American Indian or Alaska Native; Asian 882 0.2 White; Black or African American; American Indian or Alaska Native; Native Hawaiian or Other Pacific Islander 466 0.1 White; Black or African American; Asian; Native Hawaiian or Other Pacific Islander 488 0.1 White; American Indian or Alaska Native; Asian; Native Hawaiian or Other Pacific Islander 443 0.1 Black or African American; American Indian or Alaska Native; Asian; Native Hawaiian or Other Pacific Islander 262 0.1
Five Races 1,071 0.2 White; Black or African American; American Indian or Alaska Native; Asian; Native Hawaiian or Other Pacific Islander 1,071 0.2
Two or More Races 506,271 100.0

WIC Participant and Program Characteristics: 2014 Final Report
Page A-6
Table A.II.7. Distribution of Racial and Ethnic Characteristics of WIC Women, Infants, and Children: 2010, 2012, 2014a
Women Infants Children Total WIC
Racial or Ethnic Characteristic 2010 2012 2014
2010 2012 2014
2010 2012 2014
2010 2012 2014
American Indian or
Alaska Native 1.7 1.7 1.7
1.7 1.7 1.7
1.7 1.8 1.8
1.7 1.8 1.7 Asian or Pacific
Islander 3.8 4.3 4.5
3.7 4.0 4.2
3.6 4.0 4.3
3.7 4.1 4.3 Black (non-
Hispanic) 19.1 19.9 20.6
22.8 23.4 24.1
19.3 20.0 20.7
20.1 20.7 21.5 Hispanic 39.1 37.7 38.1 37.9 37.3 37.9 45.0 44.8 44.6 41.9 41.1 41.5 White (non-
Hispanic) 35.5 35.6 34.9
33.1 32.8 31.9
29.6 28.7 28.4
31.8 31.3 30.7 Race or ethnicity
not reported 0.8 0.7 0.1
0.9 0.8 0.2
0.8 0.7 0.2
0.8 0.7 0.2
Total 100.0 100.0 100.0 100.0 100.0 100.0 100.0 100.0 100.0 100.0 100.0 100.0
U.S. WIC 2,356,367 2,300,065 2,199,461 2,366,706 2,240,045 2,141,988 5,298,063 5,194,358 4,961,804 10,021,136 9,734,468 9,303,253
Notes a To translate PC2010, PC2012, and PC2014 racial and ethnic data into the five categories used in previous years, three different hierarchy schemes were used, depending on the State. Each participant was designated to the highest category in the hierarchy with which the participant identified, regardless of other identifications. For Alaska and all ITOs, American Indian was highest, followed by Hispanic, Black, Asian, and White. For Hawaii and other Pacific Islands, Pacific Islander was highest, followed by Hispanic, Black, American Indian, Asian, and White. For all other States, Hispanic was highest, followed by Black, American Indian, Asian, and White.

WIC Participant and Program Characteristics: 2014 Final Report
Page A-7
Figure A.II.7. Distribution of Racial and Ethnic Characteristics of WIC Participants: 1992–2014a b
Notes a To translate PC2006, PC2008, PC2010, PC2012, and PC2014 racial and ethnic data into the five categories used in previous years, three different hierarchy schemes were used, depending on the State. Each participant was designated to the highest category in the hierarchy with which the participant identified, regardless of other identifications. For Alaska and all ITOs, American Indian was highest, followed by Hispanic, Black, Asian, and White. For Hawaii and other Pacific States, Hispanic was highest, followed by Black, American Indian, Asian, and White. b Four State agencies were unable to provide sufficient PC2002 data, and participants from these agencies were not included in 2002 totals. According to FNS administrative data from April 2002, participants from these agencies represent approximately 104,000 additional participants. Additionally, Guam was unable to provide sufficient PC2006 data, and participants from Guam are not included in 2006 totals. According to FNS administrative data from April 2006, participants from Guam represent approximately 6,000 additional participants.

WIC Participant and Program Characteristics: 2014 Final Report
Page A-8
Table A.II.8. Distribution of Race and Ethnicity of WIC Participants
Race Hispanic/
Latino Not Hispanic Ethnicity Not
Reported Total American Indian or Alaskan Native Only 927,392 105,257 1 1,032,650 Asian Only 13,373 295,885 2 309,259 Black or African American Only 101,456 1,790,676 22 1,892,154 Native Hawaiian or Other Pacific Islander Only 26,801 51,426 1 78,228 White Only 2,605,371 2,859,801 16 5,465,187 Two or more races 193,881 312,390 0 506,271 Race not reported 2,876 7,805 8,823 19,504
Total U.S. WIC 3,871,150 5,423,239 8,865 9,303,253
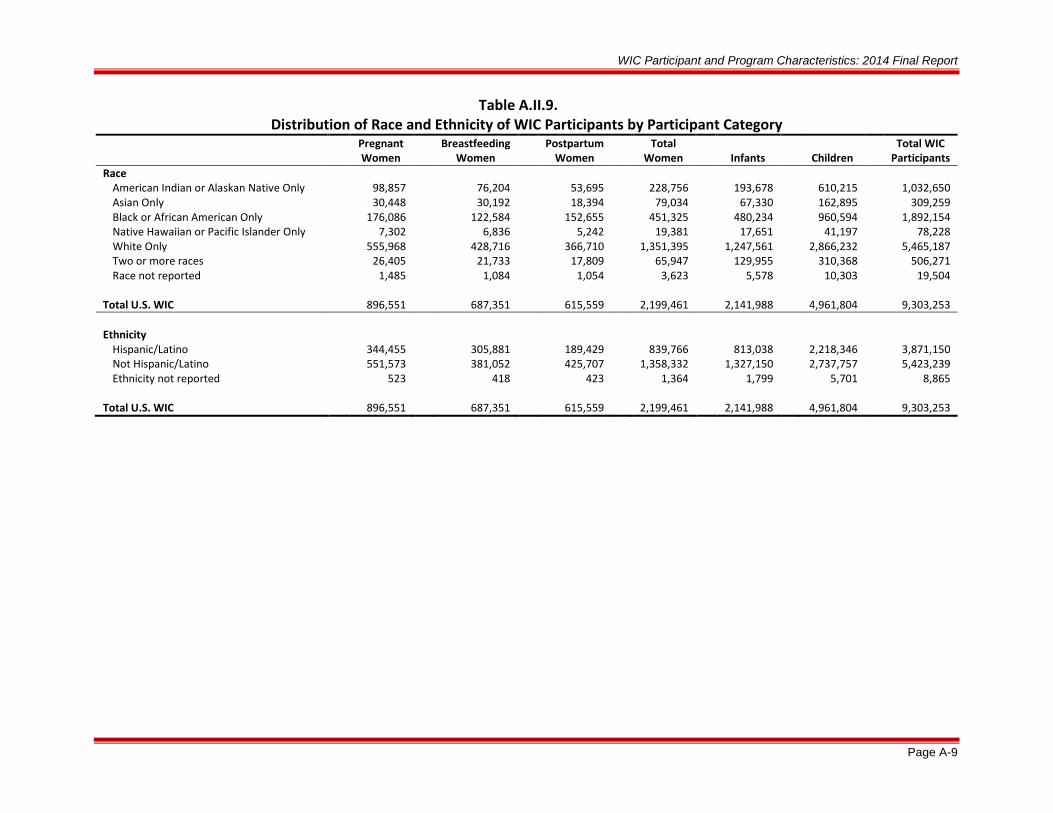
WIC Participant and Program Characteristics: 2014 Final Report
Page A-9
Table A.II.9. Distribution of Race and Ethnicity of WIC Participants by Participant Category
Pregnant
Women Breastfeeding
Women Postpartum
Women Total
Women
Infants
Children Total WIC
Participants Race
American Indian or Alaskan Native Only 98,857 76,204 53,695 228,756 193,678 610,215 1,032,650 Asian Only 30,448 30,192 18,394 79,034 67,330 162,895 309,259 Black or African American Only 176,086 122,584 152,655 451,325 480,234 960,594 1,892,154 Native Hawaiian or Pacific Islander Only 7,302 6,836 5,242 19,381 17,651 41,197 78,228 White Only 555,968 428,716 366,710 1,351,395 1,247,561 2,866,232 5,465,187 Two or more races 26,405 21,733 17,809 65,947 129,955 310,368 506,271 Race not reported 1,485 1,084 1,054 3,623 5,578 10,303 19,504
Total U.S. WIC 896,551 687,351 615,559 2,199,461 2,141,988 4,961,804 9,303,253
Ethnicity Hispanic/Latino 344,455 305,881 189,429 839,766 813,038 2,218,346 3,871,150 Not Hispanic/Latino 551,573 381,052 425,707 1,358,332 1,327,150 2,737,757 5,423,239 Ethnicity not reported 523 418 423 1,364 1,799 5,701 8,865
Total U.S. WIC 896,551 687,351 615,559 2,199,461 2,141,988 4,961,804 9,303,253
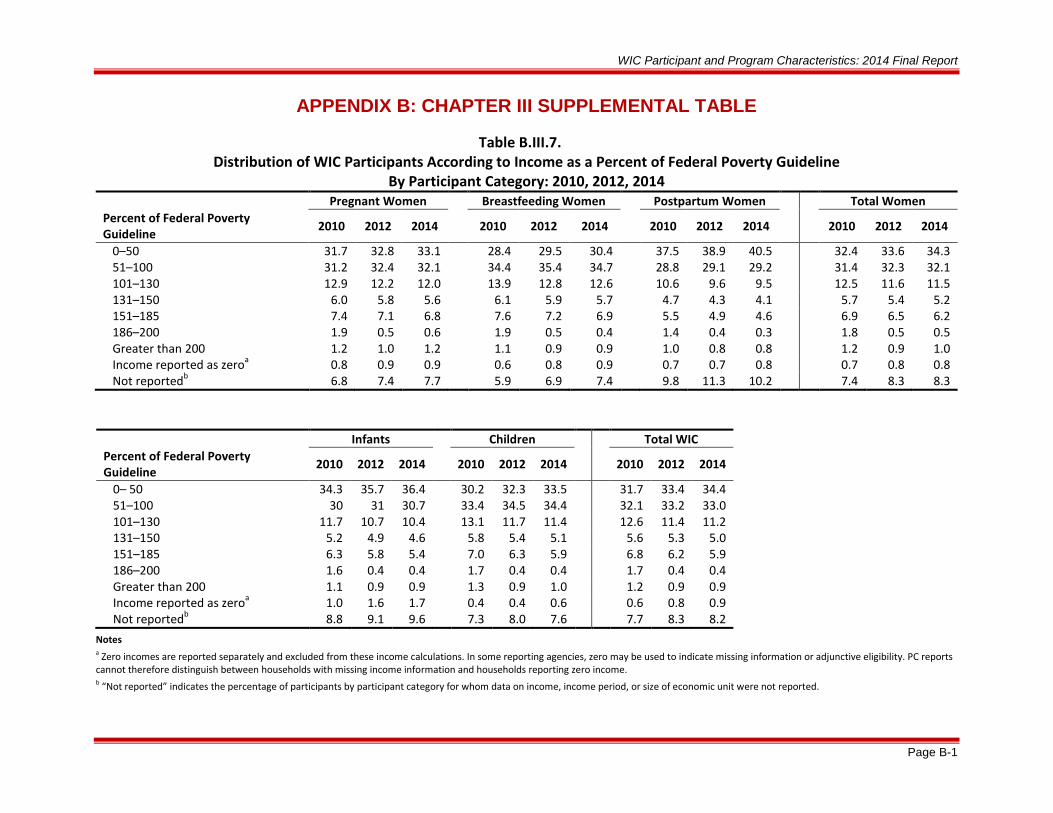
WIC Participant and Program Characteristics: 2014 Final Report
Page B-1
APPENDIX B: CHAPTER III SUPPLEMENTAL TABLE
Table B.III.7. Distribution of WIC Participants According to Income as a Percent of Federal Poverty Guideline
By Participant Category: 2010, 2012, 2014
Pregnant Women Breastfeeding Women Postpartum Women Total Women Percent of Federal Poverty Guideline 2010 2012 2014 2010 2012 2014 2010 2012 2014 2010 2012 2014
0–50 31.7 32.8 33.1
28.4 29.5 30.4
37.5 38.9 40.5
32.4 33.6 34.3 51–100 31.2 32.4 32.1
34.4 35.4 34.7
28.8 29.1 29.2
31.4 32.3 32.1
101–130 12.9 12.2 12.0
13.9 12.8 12.6
10.6 9.6 9.5
12.5 11.6 11.5 131–150 6.0 5.8 5.6
6.1 5.9 5.7
4.7 4.3 4.1
5.7 5.4 5.2
151–185 7.4 7.1 6.8
7.6 7.2 6.9
5.5 4.9 4.6
6.9 6.5 6.2 186–200 1.9 0.5 0.6
1.9 0.5 0.4
1.4 0.4 0.3
1.8 0.5 0.5
Greater than 200 1.2 1.0 1.2
1.1 0.9 0.9
1.0 0.8 0.8
1.2 0.9 1.0 Income reported as zeroa 0.8 0.9 0.9
0.6 0.8 0.9
0.7 0.7 0.8
0.7 0.8 0.8
Not reportedb 6.8 7.4 7.7 5.9 6.9 7.4 9.8 11.3 10.2 7.4 8.3 8.3
Infants
Children Total WIC Percent of Federal Poverty Guideline 2010 2012 2014
2010 2012 2014 2010 2012 2014
0– 50 34.3 35.7 36.4
30.2 32.3 33.5
31.7 33.4 34.4 51–100 30 31 30.7
33.4 34.5 34.4
32.1 33.2 33.0
101–130 11.7 10.7 10.4
13.1 11.7 11.4
12.6 11.4 11.2 131–150 5.2 4.9 4.6
5.8 5.4 5.1
5.6 5.3 5.0
151–185 6.3 5.8 5.4
7.0 6.3 5.9
6.8 6.2 5.9 186–200 1.6 0.4 0.4
1.7 0.4 0.4
1.7 0.4 0.4
Greater than 200 1.1 0.9 0.9
1.3 0.9 1.0
1.2 0.9 0.9 Income reported as zeroa 1.0 1.6 1.7
0.4 0.4 0.6
0.6 0.8 0.9
Not reportedb 8.8 9.1 9.6 7.3 8.0 7.6 7.7 8.3 8.2 Notes a Zero incomes are reported separately and excluded from these income calculations. In some reporting agencies, zero may be used to indicate missing information or adjunctive eligibility. PC reports cannot therefore distinguish between households with missing income information and households reporting zero income. b “Not reported” indicates the percentage of participants by participant category for whom data on income, income period, or size of economic unit were not reported.

WIC Participant and Program Characteristics: 2014 Final Report
Page C-1
APPENDIX C: CHAPTER IV SUPPLEMENTAL TABLES
Table C.IV.1. Broad Categories, Specific Nutritional Risks, and Risk Criteria
Anthropometric Low weight-for-height Underweight (Women) Underweight or At Risk of Underweight (Infants and Children) High weight-for-height/length Overweight (Women) Obese (Children aged 2–5) Overweight or At Risk of Overweight (Infants and Children) High Weight-for-Length (Infants and Children younger than 24 months of age) Short stature Short Stature or At Risk of Short Stature (Infants and Children) Inappropriate growth/weight gain pattern Low Maternal Weight Gain Maternal Weight Loss During Pregnancy High Maternal Weight Gain Failure to Thrive Inadequate Growth Low birth weight/premature birth Low Birth Weight Prematurity Other anthropometric risk Small for Gestational Age Low Head Circumference Large for Gestational Age Biochemical Hematocrit or hemoglobin below FNS criteria Low Hematocrit/Hemoglobin Other Biochemical Test Results That Indicate Nutritional Abnormality Elevated Blood Lead Levels Clinical/Health/Medical Pregnancy-induced conditions Hyperemesis Gravidarum Gestational Diabetes History of Gestational Diabetes History of Preeclampsia Delivery of low-birth weight or premature infant History of Preterm Delivery History of Low Birth Weight

WIC Participant and Program Characteristics: 2014 Final Report
Page C-2
Table C.IV.1. (continued) Broad Categories, Specific Nutritional Risks, and Risk Criteria
Clinical/Health/Medical (continued)
Prior stillbirth, fetal, or neonatal death
History of Fetal or Neonatal Loss General obstetrical risks Pregnancy at a Young Age Closely Spaced Pregnancies High Parity and Young Age Lack of Adequate Prenatal Care Multi-fetal Gestation Fetal Growth Restriction History of Birth of a Large for Gestational Age Infant Pregnant Woman Currently Breastfeeding History of Birth with Nutrition Related Congenital or Birth Defect Nutrition-related risk conditions (e.g., chronic disease, genetic disorder,
infection) Nutrient Deficiency Diseases Gastrointestinal Disorders Diabetes Mellitus Thyroid Disorders Hypertension and Prehypertension (Includes Chronic and Pregnancy Induced) Renal Disease Cancer Central Nervous System Disorders Genetic and Congenital Disorders Inborn Errors of Metabolism Infectious Diseases (Bronchiolitis added) Food Allergies Celiac Disease Lactose Intolerance Hypoglycemia Drug-Nutrient Interactions Eating Disorders Recent Major Surgery, Trauma, Burns Other Medical Conditions Depression Developmental, Sensory or Motor disabilities Interfering with the Ability to
Eat Pre-Diabetes Substance Abuse (Drugs, Alcohol, Tobacco) Maternal Smoking Alcohol and Illegal Drug Use Other Health Risks Dental Problems Fetal Alcohol Syndrome Dietary Failure to meet Dietary Guidelines for Americans Failure to Meet Dietary Guidelines for Americans
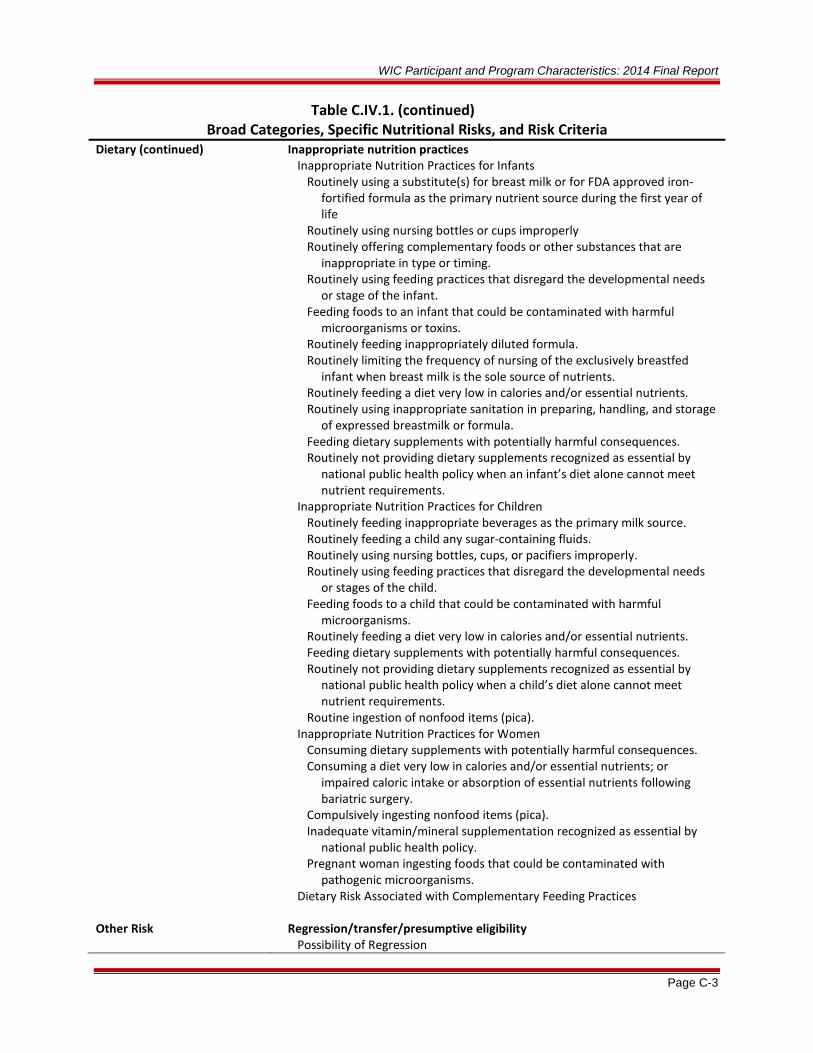
WIC Participant and Program Characteristics: 2014 Final Report
Page C-3
Table C.IV.1. (continued) Broad Categories, Specific Nutritional Risks, and Risk Criteria
Dietary (continued) Inappropriate nutrition practices Inappropriate Nutrition Practices for Infants Routinely using a substitute(s) for breast milk or for FDA approved iron-
fortified formula as the primary nutrient source during the first year of life
Routinely using nursing bottles or cups improperly Routinely offering complementary foods or other substances that are
inappropriate in type or timing. Routinely using feeding practices that disregard the developmental needs
or stage of the infant. Feeding foods to an infant that could be contaminated with harmful
microorganisms or toxins. Routinely feeding inappropriately diluted formula. Routinely limiting the frequency of nursing of the exclusively breastfed
infant when breast milk is the sole source of nutrients. Routinely feeding a diet very low in calories and/or essential nutrients. Routinely using inappropriate sanitation in preparing, handling, and storage
of expressed breastmilk or formula. Feeding dietary supplements with potentially harmful consequences. Routinely not providing dietary supplements recognized as essential by
national public health policy when an infant’s diet alone cannot meet nutrient requirements.
Inappropriate Nutrition Practices for Children Routinely feeding inappropriate beverages as the primary milk source. Routinely feeding a child any sugar-containing fluids. Routinely using nursing bottles, cups, or pacifiers improperly. Routinely using feeding practices that disregard the developmental needs
or stages of the child. Feeding foods to a child that could be contaminated with harmful
microorganisms. Routinely feeding a diet very low in calories and/or essential nutrients. Feeding dietary supplements with potentially harmful consequences. Routinely not providing dietary supplements recognized as essential by
national public health policy when a child’s diet alone cannot meet nutrient requirements.
Routine ingestion of nonfood items (pica). Inappropriate Nutrition Practices for Women Consuming dietary supplements with potentially harmful consequences. Consuming a diet very low in calories and/or essential nutrients; or
impaired caloric intake or absorption of essential nutrients following bariatric surgery.
Compulsively ingesting nonfood items (pica). Inadequate vitamin/mineral supplementation recognized as essential by
national public health policy. Pregnant woman ingesting foods that could be contaminated with
pathogenic microorganisms. Dietary Risk Associated with Complementary Feeding Practices Other Risk Regression/transfer/presumptive eligibility Possibility of Regression

WIC Participant and Program Characteristics: 2014 Final Report
Page C-4
Table C.IV.1. (continued) Broad Categories, Specific Nutritional Risks, and Risk Criteria
Other Risk (continued) Transfer of Certification Presumptive Eligibility for Pregnant Women Breastfeeding mother and infant dyad Breastfeeding Mother of Infant at Nutritional Risk Breastfeeding Complications (Women) Breastfeeding Complications (Infants) Infant of a WIC-eligible mother or mother at risk during pregnancy Infant Up to 6 Months Old of WIC Mother, or of a Woman Who Would Have
Been Eligible During Pregnancy Breastfeeding Infant of Woman at Nutritional Risk Infant Born of Woman with Mental Retardation or Alcohol or Drug Abuse
During Most Recent Pregnancy Homelessness/migrancy Homelessness Migrancy Other nutritional risks Recipient of Abuse Woman, or Infant/Child of Primary Caregiver with Limited Ability to Make
Feeding Decisions and/or Prepare Food Exposure to Environmental Tobacco Smoke

WIC Participant and Program Characteristics: 2014 Final Report
Page C-5
Table C.IV.34. Distribution of Infanta WIC Participants According To Selected Anthropometric Measures:
2010, 2012, 2014
Percent by Percentilec
NCHS-CDC Percentilesb 2010 2012 2014 Weight-for-Lengthd
< 3rd percentile 4.9 5.3 5.0 ≤ 5thf 6.7 7.2 6.8 ≤ 10thf 10.8 11.5 11.0 ≥ 90th 15.5 14.2 14.6 ≥ 95th 9.1 8.2 8.4 ≥ 97thf 6.0 5.4 5.5 Invalid or unreported anthropometric data 5.0 4.9 4.6
Weight-for-Agee < 3rd percentile 7.8 8.0 7.9
< 5th 10.5 10.7 10.6 < 10th 17.0 17.4 17.2 ≥ 90th 9.4 9.0 9.3 ≥ 95th 5.6 5.4 5.5 ≥ 97th 3.8 3.6 3.7 Invalid or unreported anthropometric data 2.2 2.2 1.9
Length-for-Aged,e < 3rd percentile 9.6 9.3 9.3
≤ 5thf 11.9 11.5 11.7 ≤ 10thf 18.8 18.1 18.2 Invalid or unreported anthropometric data 3.2 3.0 2.8
WIC Infants 2,366,706 2,240,045 2,141,988 Notes
Anthropometric criteria are calculated using programming code for pediatric anthropometry developed by CDC based on current growth charts (Kuczmarski et al., 2002). a An infant is defined as a participant who, at certification, is younger than 1 year of age and who would be classified as a child at the age of 366 days. b NCHS = National Center for Health Statistics. CDC = Centers for Disease Control and Prevention. c Percentiles reported in this table are cumulative. For example, the <5th category includes those infants in the <3rd percentile, and the ≥95th category includes those infants in the ≥97th percentile. d It is assumed that length for an infant is recumbent length. e Age is calculated in months using birth dates and dates length and weight are measured. f FNS-issued risk criteria.

WIC Participant and Program Characteristics: 2014 Final Report
Page C-6
Table C.IV.35. Distribution of Infanta WIC Participants by Race According To Selected Anthropometric Measures
NCHS-CDC Percentilesb
American Indian or
Alaska Native Only Asian Only
Black or African
American Only
Native Hawaiian or Other Pacific Islander Only White Only
Two or More Races
Race Not Reported
Weight-for-Lengthc < 3rd percentile 5.6 5.3 5.9 4.0 4.6 3.9 2.7
≤ 5the 7.3 7.4 8.1 5.7 6.5 5.5 3.6 ≤ 10the 11.2 12.3 12.7 8.9 10.5 9.3 5.8 ≥ 90th 17.3 12.6 13.6 19.6 14.5 15.8 10.5 ≥ 95th 10.4 7.0 7.9 11.4 8.2 9.1 6.4 ≥ 97th 6.9 4.5 5.3 7.6 5.4 6.0 4.5 Invalid or unreported anthropometric data 4.1 3.9 6.2 3.2 4.0 4.0 43.4
Weight-for-Aged < 3rd percentile 5.4 6.7 10.8 6.3 7.3 7.2 4.0
< 5th 7.6 9.3 14.3 8.6 9.9 9.7 5.6 < 10th 12.5 15.9 22.5 13.8 16.2 15.8 8.5 ≥ 90th 11.2 7.8 7.3 14.8 9.6 10.3 7.3 ≥ 95th 6.7 4.5 4.3 9.5 5.6 6.2 4.6 ≥ 97th 4.6 3.0 2.9 6.8 3.8 4.2 3.3 Invalid or unreported anthropometric data 1.8 1.3 1.9 1.3 1.8 1.7 41.9
Length-for-Agecd <3rd percentile 6.8 7.7 11.8 8.7 9.0 9.1 4.6
≤ 5the 8.5 9.7 14.1 11.1 11.4 11.5 6.1 ≤ 10the 14.6 16.0 21.4 17.2 17.7 18.1 9.6 Invalid or unreported anthropometric data 2.7 2.4 3.5 2.1 2.5 2.5 43.2
WIC Infants 193,678 67,330 480,234 17,650 1,247,560 129,955 5,578
Notes
Anthropometric criteria are calculated using programming code for pediatric anthropometry developed by CDC based on current growth charts (Kuczmarski et al., 2002).
NCHS-CDC reference curves are based on data from a series of national health examination surveys conducted by NCHS from 1963 to 1994.
Percentiles reported in this table are cumulative. For example, the <5th category includes those infants in the <3rd percentile, and the ≥95th category includes those infants in the ≥97th percentile. a An infant is defined as a participant who, at certification, is younger than 1 year of age and who would be classified as a child at the age of 366 days. b NCHS = National Center for Health Statistics. CDC = Centers for Disease Control and Prevention. c It is assumed that length for an infant is recumbent length. d Age is calculated in months using birth dates and dates length and weight are measured. e FNS-issued risk criteria.
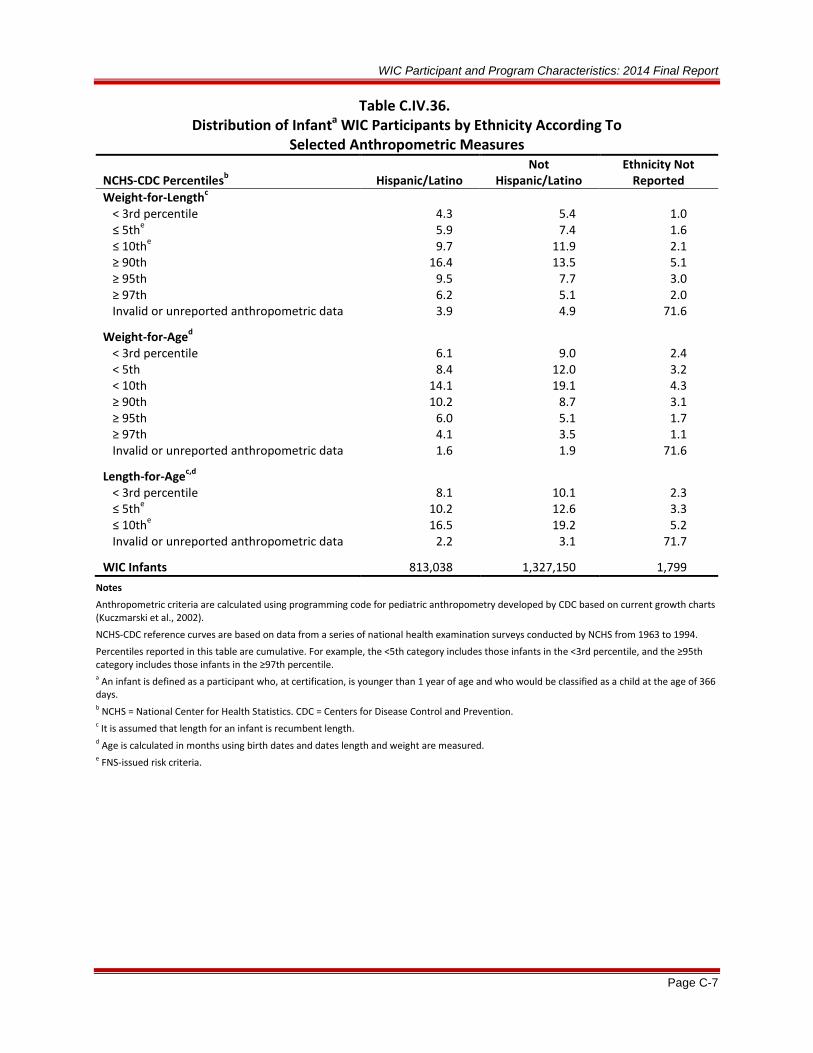
WIC Participant and Program Characteristics: 2014 Final Report
Page C-7
Table C.IV.36. Distribution of Infanta WIC Participants by Ethnicity According To
Selected Anthropometric Measures
NCHS-CDC Percentilesb Hispanic/Latino Not
Hispanic/Latino Ethnicity Not
Reported Weight-for-Lengthc
< 3rd percentile 4.3 5.4 1.0 ≤ 5the 5.9 7.4 1.6 ≤ 10the 9.7 11.9 2.1 ≥ 90th 16.4 13.5 5.1 ≥ 95th 9.5 7.7 3.0 ≥ 97th 6.2 5.1 2.0 Invalid or unreported anthropometric data 3.9 4.9 71.6
Weight-for-Aged < 3rd percentile 6.1 9.0 2.4
< 5th 8.4 12.0 3.2 < 10th 14.1 19.1 4.3 ≥ 90th 10.2 8.7 3.1 ≥ 95th 6.0 5.1 1.7 ≥ 97th 4.1 3.5 1.1 Invalid or unreported anthropometric data 1.6 1.9 71.6
Length-for-Agec,d < 3rd percentile 8.1 10.1 2.3
≤ 5the 10.2 12.6 3.3 ≤ 10the 16.5 19.2 5.2 Invalid or unreported anthropometric data 2.2 3.1 71.7
WIC Infants 813,038 1,327,150 1,799 Notes
Anthropometric criteria are calculated using programming code for pediatric anthropometry developed by CDC based on current growth charts (Kuczmarski et al., 2002).
NCHS-CDC reference curves are based on data from a series of national health examination surveys conducted by NCHS from 1963 to 1994.
Percentiles reported in this table are cumulative. For example, the <5th category includes those infants in the <3rd percentile, and the ≥95th category includes those infants in the ≥97th percentile. a An infant is defined as a participant who, at certification, is younger than 1 year of age and who would be classified as a child at the age of 366 days. b NCHS = National Center for Health Statistics. CDC = Centers for Disease Control and Prevention. c It is assumed that length for an infant is recumbent length. d Age is calculated in months using birth dates and dates length and weight are measured. e FNS-issued risk criteria.

WIC Participant and Program Characteristics: 2014 Final Report
Page C-8
Table C.IV.38. Distribution of Child WIC Participants by Age According To
Selected Anthropometric Measures: 2010, 2012, 2014
1 Year Old 2+ Years Old
NCHS-CDC Percentilesa 2010 2012 2014 2010 2012 2014 Weight-for-Length/BMIe
< 3rd percentile 1.8 2.0 2.1 2.1 2.3 2.4 ≤ 5thc 2.7 3.0 3.2 3.0 3.4 3.5 ≤ 10thc 5.0 5.6 5.9 5.5 6.0 6.3 ≥ 85thd 34.0 32.0 31.1 30.7 29.5 29.1 ≥ 90th 26.5 24.7 23.8 23.4 22.4 22.0 ≥ 95thd 16.7 15.3 14.6 14.6 14.0 13.7 ≥ 97th 12.0 10.9 10.2 10.6 10.1 9.9 Invalid or unreported anthropometric data 2.1 1.7 1.5 4.2 3.7 2.3
Weight-for-Ageb
< 3rd percentile 4.5 4.9 5.3 2.1 2.1 2.2
< 5th 6.6 7.0 7.6 3.1 3.2 3.4 < 10th 11.7 12.4 13.3 5.7 5.9 6.3 ≥ 90th 13.4 12.6 11.8 21.2 20.8 20.1 ≥ 95th 7.7 7.2 6.7 13.2 12.9 12.5 ≥ 97th 5.4 5.0 4.7 9.4 9.3 8.9 Invalid or unreported anthropometric data 1.4 1.1 1.1 1.9 1.5 1.7
Height/Length-for-Ageb
< 3rd percentile 4.0 3.8 4.0 2.4 2.2 2.2
≤ 5thc 6.0 5.8 6.1 3.7 3.6 3.6 ≤ 10thc 11.4 11.1 11.6 7.5 7.2 7.2 ≥ 90th 8.9 9.2 8.9 13.5 14.0 13.7 ≥ 95th 4.4 4.6 4.4 7.1 7.4 7.2 ≥ 97th 2.5 2.6 2.4 4.6 4.8 4.7 Invalid or unreported anthropometric data 2.1 1.8 1.1 2.0 1.6 1.3
WIC Children 1,844,473 1,809,781 1,819,921 3,451,161 3,382,087 3,138,255
Notes
Anthropometric criteria are calculated using programming code for pediatric anthropometry developed by CDC based on current growth charts (Kuczmarski et al., 2002).
This table excludes 3,628 children for whom age at certification cannot be calculated.
Percentiles reported in this table are cumulative. For example, the <5th category includes those children in the <3rd percentile, and the ≥95th category includes those children in the ≥97th percentile. a NCHS = National Center for Health Statistics. CDC = Centers for Disease Control and Prevention. b Age is calculated in months using birth dates and dates height/length and weight are measured. c FNS-issued risk criteria. d FNS-issued risk criteria for children aged 2 or older. Children falling at or above the 85th percentile and below the 95th percentile are considered overweight. Children falling at or above the 95th percentile are considered obese. e Weight-for-length is used to calculate percentiles for 1-year-old children. BMI is used to calculate percentile for children aged 2 or older.

WIC Participant and Program Characteristics: 2014 Final Report
Page C-9
Table C.IV.39. Distribution of Child WIC Participants by Age and Race According to Selected Anthropometric Measures
American Indian or Alaska Native
Only
Asian Only
Black or African American Only
Native Hawaiian or Other Pacific
Islander Only
White Only
Two or more races
Race Not Reported
NCHS-CDC Percentilesa 1
Year 2+
Years 1
Year 2+
Years 1
Year 2+
Years 1
Year 2+
Years 1
Year 2+
Years 1
Year 2+
Years 1
Year 2+
Years Weight-for-Length/BMIe
< 3rd percentile 2.3 2.4 4.0 4.0 2.8 3.5 1.9 2.0 1.7 1.9 1.8 2.0 1.8 2.4 ≤ 5thc 3.5 3.4 6.0 5.5 4.2 5.0 2.8 3.0 2.7 2.9 2.9 3.0 2.9 3.3 ≤ 10thc 6.1 6.0 10.5 9.8 7.4 8.6 5.2 5.4 5.1 5.4 5.5 5.8 5.3 5.7 ≥ 85thd 32.8 33.0 20.2 22.2 28.7 24.9 34.4 32.4 32.1 29.9 31.6 28.7 24.4 26.8 ≥ 90th 25.6 25.6 14.6 16.4 22.0 18.4 26.5 24.7 24.4 22.6 24.2 21.6 18.7 20.9 ≥ 95thd 16.0 16.6 8.4 10.1 13.5 11.2 16.8 15.5 14.9 14.0 14.7 13.3 11.5 13.8 ≥ 97th 11.2 12.4 5.6 7.3 9.6 7.9 12.0 11.3 10.4 10.1 10.3 9.5 8.8 10.2 Invalid or unreported
anthropometric data 2.2 3.3
1.3 1.7
1.4 1.7
1.1 2.0
1.3 2.1
1.4 2.4
22.7 18.8
Weight-for-Ageb
< 3rd percentile 4.8 1.8 8.3 3.9 6.0 2.3 5.3 2.7 5.0 2.1 5.0 2.1 3.6 1.8
< 5th 6.9 2.8 11.8 6.0 8.4 3.5 7.6 4.0 7.2 3.3 7.2 3.2 5.3 2.9 < 10th 12.2 5.4 19.7 10.8 14.4 6.3 13.2 7.0 12.8 6.2 12.5 6.1 10.0 5.3 ≥ 90th 12.6 22.8 7.6 14.5 12.0 20.8 15.0 23.5 11.7 19.3 12.4 20.4 9.9 18.1 ≥ 95th 7.1 14.8 4.1 8.9 6.9 12.6 9.3 15.2 6.6 12.0 7.0 12.5 6.1 11.6 ≥ 97th 5.0 10.8 2.8 6.2 4.9 8.8 6.5 11.2 4.6 8.6 4.9 8.9 4.4 8.5 Invalid or unreported
anthropometric data 1.8 2.6
1.0 1.3
0.9 1.3
0.9 1.5
0.9 1.4
1.1 1.9
22.0 18.2

WIC Participant and Program Characteristics: 2014 Final Report
Page C-10
Table C.IV.39. (continued) Distribution of Child WIC Participants by Age and Race According to Selected Anthropometric Measures
American Indian or Alaska Native
Only
Asian Only
Black or African American Only
Native Hawaiian or Other Pacific
Islander Only
White Only
Two or more races
Race Not Reported
NCHS-CDC Percentilesa 1
Year 2+
Years 1
Year 2+
Years 1
Year 2+
Years 1
Year 2+
Years 1
Year 2+
Years 1
Year 2+
Years 1
Year 2+
Years Height/Length-for-Ageb
< 3rd percentile 3.5 1.8 3.9 2.9 4.1 1.8 4.4 3.1 4.0 2.3 3.5 2.0 3.5 2.4 ≤ 5thc 5.3 2.9 6.0 4.8 6.1 2.9 6.6 4.9 6.2 3.8 5.4 3.3 5.4 3.6 ≤ 10thc 10.9 6.3 11.8 9.8 11.3 5.7 12.2 9.0 11.9 7.8 10.6 6.7 10.1 7.0 ≥ 90th 9.6 14.5 9.6 11.0 10.9 19.0 11.2 15.5 7.9 11.7 9.5 14.3 7.5 11.6 ≥ 95th 4.7 7.6 4.7 5.6 5.6 10.6 6.0 8.6 3.7 5.9 4.7 7.6 3.6 6.3 ≥ 97th 2.4 5.0 2.4 3.6 3.1 7.1 3.3 5.6 2.0 3.7 2.5 5.0 2.4 3.9 Invalid or unreported
anthropometric data 1.8 2.0
1.0 1.1
1.0 1.0
0.9 0.8
0.9 1.0
1.1 1.5
22.0 17.3
WIC Children 179,573 430,536 59,979 102,866 376,119 583,076 13,933 27,258 1,076,115 1,788,151 110,386 199,885 3,816 6,483
Notes
Anthropometric criteria are calculated using programming code for pediatric anthropometry developed by CDC based on current growth charts (Kuczmarski et al., 2002).
NCHS-CDC reference curves are based on data from a series of national health examination surveys conducted by NCHS from 1963 to 1994.
Age is not reported for 106 American Indian or Alaska Native children, 50 Asian children, 1,399 Black or African American children, 5 Native Hawaiian or Other Pacific Islander children, 1,966 White children, 98 children reporting two or more races, and 4 children missing race information.
Percentiles reported in this table are cumulative. For example, the <5th category includes those children in the <=3rd percentile, and the ≥95th category includes those children in the ≥97th percentile. a NCHS = National Center for Health Statistics. CDC = Centers for Disease Control and Prevention. b Age is calculated in months using birth dates and dates height/length and weight are measured. c FNS-issued risk criteria. d FNS-issued risk criteria for children aged 2 or older. Children at or above the 85th percentile and less than the 95th percentile are considered overweight. Children at or above the 95th percentile are considered obese. e Weight-for-length is used to calculate percentiles for 1-year-old children. BMI is used to calculate percentiles for children aged 2 or older.

WIC Participant and Program Characteristics: 2014 Final Report
Page C-11
Table C.IV.40. Distribution of Child WIC Participants by Age and Ethnicity According to
Selected Anthropometric Measures
Hispanic/Latino
Not Hispanic/Latino
Ethnicity Not Reported
NCHS-CDC Percentilesa 1 Year 2+ Years 1 Year 2+ Years 1 Year 2+ Years Weight-for-Length/BMIe
< 3rd percentile 1.7 1.9 2.3 2.8 1.8 2.6 ≤ 5thc 2.6 2.8 3.6 4.0 2.9 3.6 ≤ 10thc 4.9 5.2 6.5 7.2 5.5 6.0 ≥ 85thd 33.6 32.5 29.2 26.1 24.0 29.0 ≥ 90th 26.0 25.0 22.1 19.3 18.6 23.0 ≥ 95thd 16.1 16.1 13.4 11.5 11.6 15.3 ≥ 97th 11.3 11.9 9.3 8.1 9.0 11.4 Invalid or unreported
anthropometric data 1.5 2.6
1.3 1.9
26.3 15.9
Weight-for-Ageb
< 3rd percentile 4.4 1.9 5.9 2.4 2.8 1.8
< 5th 6.5 3.0 8.3 3.7 4.6 2.9 < 10th 11.8 5.7 14.3 6.8 9.3 5.4 ≥ 90th 12.5 21.5 11.3 18.8 9.1 20.0 ≥ 95th 7.1 13.8 6.3 11.2 5.3 12.8 ≥ 97th 5.1 10.1 4.4 7.8 4.1 9.5 Invalid or unreported
anthropometric data 1.1 1.9
1.0 1.4
25.7 15.2
Height/Length-for-Ageb
< 3rd percentilec 3.6 2.1 4.2 2.3 3.5 2.5
≤ 5thc 5.7 3.4 6.3 3.6 5.7 3.9 ≤ 10thc 11.3 7.2 11.7 7.2 10.2 7.4 ≥ 90th 8.2 12.4 9.3 14.7 7.5 12.9 ≥ 95th 3.9 6.3 4.6 7.8 3.5 6.8 ≥ 97th 2.0 4.1 2.5 5.1 2.5 4.2 Invalid or unreported
anthropometric data 1.0 1.3
1.0 1.1
25.2 13.8
WIC Children 751,667 1,465,807 1,066,499 1,668,504 1,755 3,943 Notes
Anthropometric criteria are calculated using programming code for pediatric anthropometry developed by CDC based on current growth charts (Kuczmarski et al., 2002).
NCHS-CDC reference curves are based on data from a series of national health examination surveys conducted by NCHS from 1963 to 1994.
Age is not reported for 871 Hispanic children, 2,754 non-Hispanic children, and 3 children missing ethnicity information.
Percentiles reported in this table are cumulative. For example, the <5th category includes those children in the <3rd percentile, and the ≥95th category includes those children in the ≥97th percentile. a NCHS = National Center for Health Statistics. CDC = Centers for Disease Control and Prevention. b Age is calculated in months using birth dates and dates height/length and weight are measured. c FNS-issued risk criteria. d FNS-issued risk criteria for children aged 2 or older. Children at or above the 85th percentile and less than the 95th percentile are considered overweight. Children at or above the 95th percentile are considered obese. e Weight-for-length is used to calculate percentiles for 1-year-old children. BMI is used to calculate percentiles for children aged 2 or older.

WIC Participant and Program Characteristics: 2014 Final Report
Page D-1
APPENDIX D: CHAPTER VI SUPPLEMENTAL TABLES
Table D.VI.1. Breastfeeding Initiation Rates for WIC Infants Aged 7–11 Months in April 2014 by State
Ever or Currently Breastfed
Region and State
WIC Infants in Age Range
Yes
No
Not Reported
Number Number % Number % Number % Total for State Agencies Reportinga 908,783 635,944 70.0 267,267 29.4 5572 0.6
Northeast Connecticut 6,332 4,693 74.1 1,607 25.4 32 0.5 Maine 2,446 1,781 72.8 665 27.2 0 0.0 Massachusetts 12,161 9,590 78.9 2,571 21.1 0 0.0 New Hampshire 1,913 1,441 75.3 472 24.7 0 0.0 New York 54,249 44,177 81.4 9,912 18.3 160 0.3 Rhode Island 2,517 1,719 68.3 791 31.4 7 0.3 Vermont 1,290 1,018 78.9 268 20.8 4 0.3 Indian Township (ME) 2 1 50.0 1 50.0 0 0.0
Mid-Atlantic
Delaware 2,461 1,307 53.1 1,136 46.2 18 0.7 District of Columbia 2,185 1,273 58.3 787 36.0 125 5.7 Maryland 15,158 9,990 65.9 5,072 33.5 96 0.6 New Jersey 16,738 10,992 65.7 5,396 32.2 350 2.1 Pennsylvania 27,568 15,944 57.8 11,623 42.2 1 0.0 Puerto Rico 13,393 6,738 50.3 6,297 47.0 358 2.7 Virginia 16,850 9,578 56.8 7,272 43.2 0 0.0 Virgin Islands 411 340 82.7 69 16.8 2 0.5 West Virginia 5,729 2,881 50.3 2,848 49.7 0 0.0
Southeast
Alabama 14,997 7,177 47.9 7,820 52.1 0 0.0 Florida 57,055 43,464 76.2 13,331 23.4 260 0.5 Georgia 33,479 21,620 64.6 11,856 35.4 3 0.0 Kentucky 15,896 7,992 50.3 7,904 49.7 0 0.0 Mississippi 8,339 2,314 27.7 6,025 72.3 0 0.0 North Carolina 28,126 19,171 68.2 8,955 31.8 0 0.0 South Carolina 15,459 8,634 55.9 6,680 43.2 145 0.9 Tennessee 20,029 10,132 50.6 9,897 49.4 0 0.0 Eastern Band Cherokee 65 47 72.3 18 27.7 0 0.0 Mississippi Band of Choctaw 70 26 37.1 36 51.4 8 11.4
Midwest
Illinois 32,696 22,843 69.9 9,674 29.6 179 0.5 Indiana 19,241 13,687 71.1 5,416 28.1 138 0.7 Michigan 27,228 17,280 63.5 9,830 36.1 118 0.4 Minnesota 12,829 9,763 76.1 3,066 23.9 0 0.0 Ohio 27,817 15,666 56.3 11,931 42.9 220 0.8 Wisconsin 11,963 8,681 72.6 3,249 27.2 33 0.3
Southwest
Arkansas 10,563 5,353 50.7 5,210 49.3 0 0.0 Louisiana 17,818 7,064 39.6 10,728 60.2 26 0.1 New Mexico 6,677 5,287 79.2 1,342 20.1 48 0.7 Oklahoma 10,172 b b b b b b
Texas 103,064 84,670 82.2 18,317 17.8 77 0.1 ACL (NM) 53 50 94.3 3 5.7 0 0.0 Cherokee Nation (OK) 1,016 570 56.1 406 40.0 40 3.9 Chickasaw Nation (OK) 494 326 66.0 168 34.0 0 0.0 Choctaw Nation of Oklahoma 406 161 39.7 245 60.3 0 0.0 Citizen Potawatomi (OK) 181 42 23.2 139 76.8 0 0.0 Eight Northern Pueblos (NM) 41 34 81.1 8 18.9 0 0.0 Five Sandoval Pueblos (NM) 30 12 40.0 18 60.0 0 0.0 ITC Oklahoma 120 81 67.5 39 32.5 0 0.0

WIC Participant and Program Characteristics: 2014 Final Report
Page D-2
Table D.VI.1. (continued) Breastfeeding Initiation Rates for WIC Infants Aged 7–11 Months in April 2014 by State
Ever or Currently Breastfed
WIC Infants in
Age Range
Yes
No
Not Reported Region and State Number Number % Number % Number % Total for State Agencies Reportinga
(continued)
Southwest (continued) Muscogee Creek Nation (OK) 293 145 49.5 148 50.5 0 0.0 Osage Nation (OK) 359 171 47.6 188 52.4 0 0.0 Otoe Missouria 50 30 60.0 20 40.0 0 0.0 Pueblo of Isleta 154 133 86.4 21 13.6 0 0.0 Pueblo of San Felipe 26 25 96.2 1 3.8 0 0.0 Pueblo of Zuni 62 56 90.3 6 9.7 0 0.0 Santo Domingo 20 17 85.0 3 15.0 0 0.0 WCD Enterprises (OK) 414 252 60.9 162 39.1 0 0.0
Mountain Plains
Colorado 10,774 8,756 81.3 2,008 18.6 10 0.1 Iowa 7,937 5,248 66.1 2,689 33.9 0 0.0 Kansas 7,909 5,620 71.1 1,927 24.4 362 4.6 Missouri 16,430 10,874 66.2 5,556 33.8 0 0.0 Montana 2,287 1,806 79.0 481 21.0 0 0.0 Nebraska 4,127 3,134 75.9 983 23.8 10 0.2 North Dakota 1,442 1,003 69.6 439 30.4 0 0.0 South Dakota 2,187 1,333 61.0 603 27.6 251 11.5 Utah 7,459 6,477 86.8 980 13.1 2 0.0 Wyoming 1,294 1,004 77.6 290 22.4 0 0.0 Cheyenne River Sioux Tribe 60 29 48.3 30 50.0 1 1.7 Omaha Nation 22 17 77.3 3 13.6 2 9.1 Rosebud Sioux 103 69 67.0 31 30.1 3 2.9 Santee Sioux Nation 8 2 25.0 5 62.5 1 12.5 Standing Rock Sioux (ND) 58 35 60.3 22 37.9 1 1.7 Three Affiliated (ND) 30 b b b b b b
Ute Mountain Ute (CO) 23 20 87.0 1 4.3 2 8.7
Winnebago 24 b b b b b b
Western
Alaska 2,230 1,824 81.8 406 18.2 0 0.0 American Samoa 494 377 76.3 116 23.5 1 0.2 Arizona 20,261 12,930 63.8 7,319 36.1 12 0.1 California 125,569 98,690 78.6 26,879 21.4 0 0.0 Guam 923 635 68.8 288 31.2 0 0.0 Hawaii 4,051 3,577 88.3 445 11.0 29 0.7 Idaho 4,415 3,775 85.5 537 12.2 103 2.3 Oregon 9,834 8,950 91.0 763 7.8 121 1.2 Washington 17,487 15,423 88.2 1,954 11.2 110 0.6 ITC Arizona 1,181 777 65.8 393 33.3 11 0.9 Navajo Nation (AZ) 1,147 922 80.4 223 19.4 2 0.2 Northern Mariana Islands 312 195 62.5 117 37.5 0 0.0
Notes
Percents may not add to 100.0% and subtotals may not add to totals due to rounding and to the use of weights in the case of several State agencies that either under- or overreported the number of participants. a Includes those State agencies reporting data on breastfeeding initiation for 75 percent or more of all 7- to 11-month-old infants. Agencies excluded are Nevada, Eastern Shoshone, ITC Nevada, Northern Arapahoe, Pleasant Point, and Seneca Nation. These national estimates are based on information for 98.5 percent of all WIC infants aged 7–11 months. b State agency reported data on 75 percent or more, but less than 85 percent, of all 7- to 11-month-old WIC infants. All available data (including data for these States) were used in establishing the PC2014 national breastfeeding initiation rate.

WIC Participant and Program Characteristics: 2014 Final Report
Page D-3
Figure D.VI.2. Breastfeeding Initiation Rates by State for WIC Infants Aged 7–11 Months in April, 1998–2014
1998

WIC Participant and Program Characteristics: 2014 Final Report
Page D-4
Figure D.VI.2. (continued) Breastfeeding Initiation Rates by State for WIC Infants Aged 7–11 Months in April, 1998–2014
2000

WIC Participant and Program Characteristics: 2014 Final Report
Page D-5
Figure D.VI.2. (continued) Breastfeeding Initiation Rates by State for WIC Infants Aged 7–11 Months in April, 1998–2014
2002
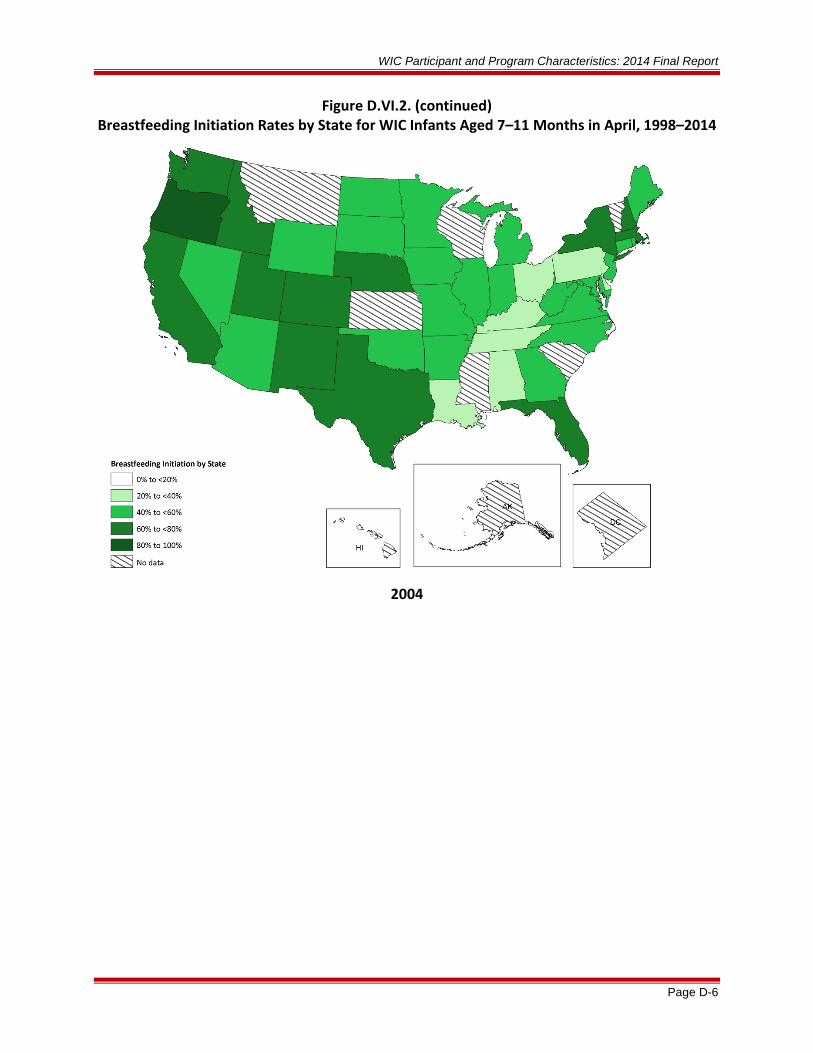
WIC Participant and Program Characteristics: 2014 Final Report
Page D-6
Figure D.VI.2. (continued) Breastfeeding Initiation Rates by State for WIC Infants Aged 7–11 Months in April, 1998–2014
2004
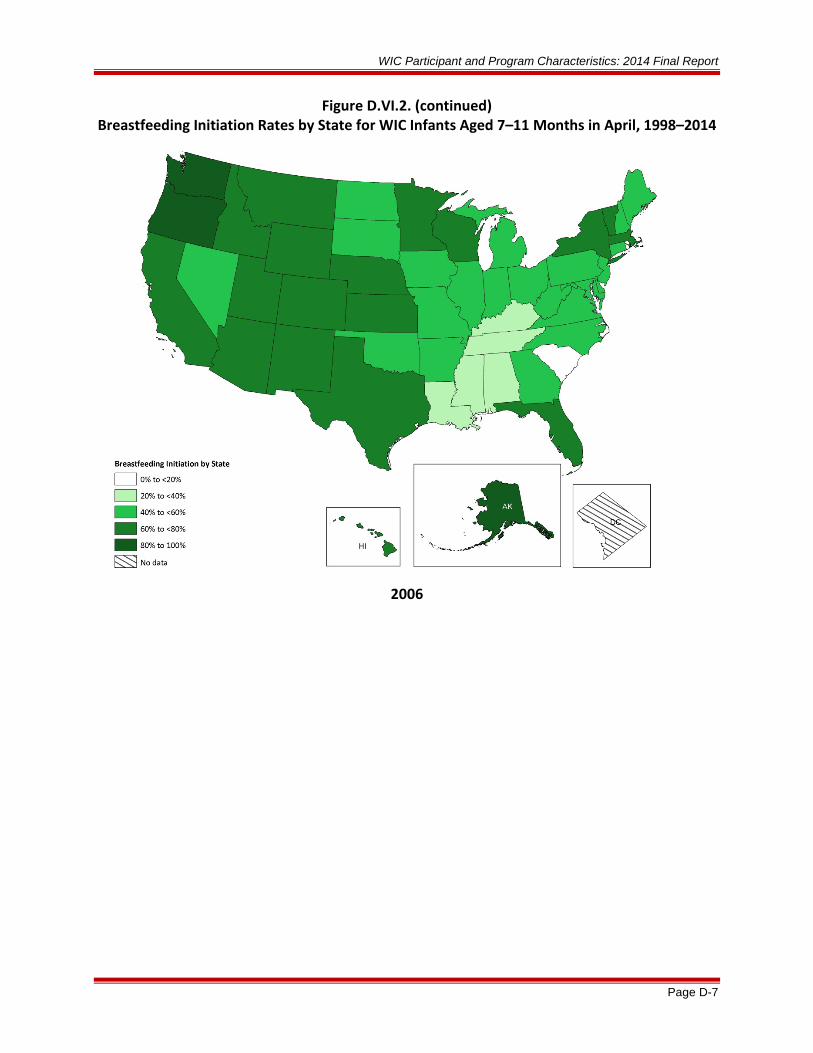
WIC Participant and Program Characteristics: 2014 Final Report
Page D-7
Figure D.VI.2. (continued) Breastfeeding Initiation Rates by State for WIC Infants Aged 7–11 Months in April, 1998–2014
2006

WIC Participant and Program Characteristics: 2014 Final Report
Page D-8
Figure D.VI.2. (continued) Breastfeeding Initiation Rates by State for WIC Infants Aged 7–11 Months in April, 1998–2014
2008

WIC Participant and Program Characteristics: 2014 Final Report
Page D-9
Figure D.VI.2. (continued) Breastfeeding Initiation Rates by State for WIC Infants Aged 7–11 Months in April, 1998–2014
2010

WIC Participant and Program Characteristics: 2014 Final Report
Page D-10
Figure D.VI.2. (continued) Breastfeeding Initiation Rates by State for WIC Infants Aged 7–11 Months in April,
1998–2014
2012

WIC Participant and Program Characteristics: 2014 Final Report
Page D-11
Figure D.VI.2. (continued) Breastfeeding Initiation Rates by State for WIC Infants Aged 7–11 Months in April, 1998–2014
2014
Notes
Data presented on this map can be found in table D.VI.1.

WIC Participant and Program Characteristics: 2014 Final Report
Page D-12
Table D.VI.3. Changes in Breastfeeding Initiation Rates for
WIC Infants Aged 7–11 Months in April, 1998–2014
Breastfeeding Initiation Ratesa
Year
Number of States Reporting
Percent Ever or Currently Breastfed
1998 63 41.5 2000 68 44.5 2002 68 48.3 2004 79 56.6 2006 84 59.6 2008 88 61.0 2010 88 63.9 2012 85 67.1 2014 84 70.0
Change in Breastfeeding Initiation Rates
Period
Number of States
Reporting in Both Years
Beginning of Period Rate
(%)
End of Period Rate
(%)
Change in Rate
(percentage points)
1998–2000 52 41.3 45.7 +4.4 2000–2002 59 44.4 48.2 +3.8 2002–2004b 64 50.0 54.4 +4.4 2004–2006 75c 56.6 60.2 +3.6 2006–2008 83 59.6 61.1 +1.5 2008–2010 86 60.8 63.9 +3.1 2010–2012 83 63.9 66.9 +3.0 2012–2014 82 67.1 70.0 +2.9
Notes
Percents may not add to 100.0% and subtotals may not add to totals due to rounding and to the use of weights in the case of several State agencies that either under- or over-reported the number of participants. a Reported rates are not strictly comparable across years because of differences in the number of State agencies reporting and inconsistent State reporting (submitting one year but not the next). b Our best estimate of the change in breastfeeding rate between 2002 and 2004 uses information only for infants aged 7–11 months and excludes California from the analysis. Prior to 2004, California’s reported initiation rate was a lower bound estimate based on the conservative assumption that none of the infants for whom breastfeeding initiation data were missing (nearly half of those infants who were not currently breastfed) had ever been breastfed. California’s reporting improved in 2004, resulting in a more accurate estimate of breastfeeding initiation. c For PC2006, Omaha Santee Sioux split to form two separate State agencies. Hence, the number of common agencies is 75 in PC2004 and 76 in PC2006.

WIC Participant and Program Characteristics: 2014 Final Report
Page D-13
Table D.VI.4. Breastfeeding Duration for WIC Infants Aged 7–11 Months in April 2014 by State
Region and State
WIC Infants in Age Range
Infants Breastfed
Breastfed WIC Infants With Reported
Breastfeeding Duration
Median
Duration in Weeks
Mean Duration
Within First 6 Months Number Number % Number %
Total for State Agencies Reportinga 767,979 531,851 69.3 494,379 93.0 13.0 14.0 Northeast
Connecticut 6,332 4,693 74.1 4,230 90.1 13.0 13.4 Maine 2,446 1,781 72.8 1,723 96.7 13.0 13.8 Massachusetts 12,161 9,590 78.9 9,513 99.2 12.0 13.3 New Hampshire 1,913 1,441 75.3 1,362 94.5 6.0 11.2 New York 54,249 44,177 81.4 39,890 90.3 22.0 16.1 Rhode Island 2,517 1,719 68.3 1,642 95.5 8.0 11.8 Vermont 1,290 1,018 78.9 1,010 99.2 17.0 15.5 Indian Township (ME) 2 1 50.0 1 100.0 26.0+ 26.0
Mid-Atlantic Delaware 2,461 1,307 53.1 b b b b
District of Columbia 2,185 1,273 58.3 1,124 88.3 26.0 18.3 Maryland 15,158 9,990 65.9 8,598 86.1 13.0 14.1 New Jersey 16,738 10,992 65.7 10,621 96.6 26.0 18.1 Pennsylvania 27,568 15,944 57.8 15,340 96.2 6.0 10.7 Virginia 16,850 9,578 56.8 9,381 97.9 10.0 13.1 Virgin Islands 411 340 82.7 331 97.4 26.0+ 20.7
Southeast Alabama 14,997 7,177 47.9 6,620 92.2 8.0 11.8 Florida 57,055 43,464 76.2 39,022 89.8 10.0 13.1 Georgia 33,479 21,620 64.6 19,627 90.8 10.0 12.8 Kentucky 15,896 7,992 50.3 7,992 100.0 26.0+ 15.9 North Carolina 28,126 19,171 68.2 b b b b
South Carolina 15,459 8,634 55.9 7,990 92.5 8.0 11.6 Tennessee 20,029 10,132 50.6 9,271 91.5 26.0+ 18.3 Mississippi Band of Choctaw 70 26 37.1 b b b b

WIC Participant and Program Characteristics: 2014 Final Report
Page D-14
Table D.VI.4. (continued) Breastfeeding Duration for WIC Infants Aged 7–11 Months in April 2014 by State
WIC Infants in
Age Range
Infants Breastfed
Breastfed WIC Infants With Reported
Breastfeeding Duration
Median
Duration in Weeks
Mean Duration
Within First 6 Months Region and State Number Number % Number %
Midwest Illinois 32,696 22,843 69.9 20,059 87.8 9.0 12.1 Indiana 19,241 13,687 71.1 13,085 95.6 6.0 11.0 Michigan 27,228 17,280 63.5 15,734 91.1 6.0 11.1 Minnesota 12,829 9,763 76.1 9,436 96.7 16.0 15.2 Ohio 27,817 15,666 56.3 15,022 95.9 8.0 11.5 Wisconsin 11,963 8,681 72.6 7,531 86.8 5.0 9.6
Southwest Arkansas 10,563 5,353 50.7 5,192 97.0 5.0 10.1 Louisiana 17,818 7,064 39.6 6,659 94.3 4.0 10.7 Oklahoma 10,172 b b b b b b
ACL (NM) 53 50 94.3 46 92.0 15.5 14.8 Chickasaw Nation (OK) 494 326 66.0 314 96.3 7.5 11.9 Choctaw Nation of Oklahoma 406 161 39.7 157 97.5 6.0 10.2 Citizen Potawatomi (OK) 181 42 23.2 41 97.6 26.0+ 20.4 Eight Northern Pueblos (NM) 41 34 81.1 31 93.3 10.5 14.7 Five Sandoval Pueblos (NM) 30 12 40.0 12 100.0 22.5 17.3 ITC Oklahoma 120 81 67.5 79 97.5 4.0 8.2 Muscogee Creek Nation (OK) 293 145 49.5 142 97.9 7.0 12.3 Osage Nation (OK) 359 171 47.6 169 98.8 6.0 10.5 Otoe Missouria 50 30 60.0 29 96.7 4.0 8.5 Pueblo of San Felipe 26 25 96.2 25 100.0 26.0+ 18.9 Pueblo of Zuni 62 56 90.3 52 92.9 26.0+ 19.9 Santo Domingo 20 17 85.0 16 94.1 11.5 12.8 WCD Enterprises (OK) 414 252 60.9 241 95.6 6.0 11.3
Mountain Plains Colorado 10,774 8,756 81.3 8,476 96.8 8.0 12.0 Iowa 7,937 5,248 66.1 5,025 95.8 7.0 11.3 Kansas 7,909 5,620 71.1 5,419 96.4 6.0 10.5 Missouri 16,430 10,874 66.2 10,582 97.3 7.0 11.3 Montana 2,287 1,806 79.0 1,729 95.7 13.0 14.1 Nebraska 4,127 3,134 75.9 b b b b
North Dakota 1,442 1,003 69.6 945 94.2 10.0 13.1

WIC Participant and Program Characteristics: 2014 Final Report
Page D-15
Table D.VI.4. (continued) Breastfeeding Duration for WIC Infants Aged 7–11 Months in April 2014 by State
WIC Infants in
Age Range
Infants Breastfed
Breastfed WIC Infants With Reported
Breastfeeding Duration
Median
Duration in Weeks
Mean Duration
Within First 6 Months Region and State Number Number % Number %
Mountain Plains (continued) Utah 7,459 6,477 86.8 6,201 95.7 14.0 14.5 Wyoming 1,294 1,004 77.6 958 95.4 9.0 12.6 Cheyenne River Sioux Tribe 60 29 48.3 b b b b
Omaha Nation 22 17 77.3 b b b b
Santee Sioux Nation 8 2 25.0 2 100.0 26.0+ 26.0 Standing Rock Sioux (ND) 58 35 60.3 33 94.3 4.0 6.2
Western
Alaska 2,230 1,824 81.8 1,693 92.8 16.0 15.0 American Samoa 494 377 76.3 371 98.4 26.0+ 23.3 Arizona 20,261 12,930 63.8 11,941 92.4 17.0 15.4 California 125,569 98,690 78.6 94,946 96.2 23.0 16.9 Hawaii 4,051 3,577 88.3 3,341 93.4 17.0 15.5 Idaho 4,415 3,775 85.5 3,697 97.9 26.0+ 17.9 Oregon 9,834 8,950 91.0 7,715 86.2 13.0 14.3 Washington 17,487 15,423 88.2 14,442 93.6 21.0 16.1 ITC Arizona 1,181 777 65.8 730 94.0 5.0 10.5 Navajo Nation (AZ) 1,147 922 80.4 837 90.8 26.0 17.2 Guam 923 635 68.8 578 91.0 13.0 14.0 Northern Mariana Islands 312 195 62.5 183 93.8 22.0 17.5
Notes
Percents may not add to 100.0% and subtotals may not add to totals due to rounding and to the use of weights in the case of several State agencies that either under- or overreported the number of participants.
In some State agencies, the median duration was greater than 26 weeks, but we cannot measure this duration, so the median duration is reported as more than 26 (26+) weeks.
a Includes the 71 State agencies reporting data on breastfeeding initiation for 75% or more of all 7-to-11-month-old infants and duration data for 75% or more of breastfed infants. These estimates are based on 83.8% of all WIC infants aged 7–11 months. State agencies excluded are Cherokee Nation, Eastern Band Cherokee, Eastern Shoshone, ITC-Nevada, Mississippi, Nevada, New Mexico, Northern Arapahoe, Pleasant Point, Pueblo of Isleta, Puerto Rico, Rosebud Sioux, Seneca Nation, South Dakota, Texas, Three Affiliated, Ute Mountain Ute, West Virginia, and Winnebago. b State agency reported data on 75% or more, but less than 85%, of all 7- to-11-month-old WIC infants. All available data (including these States) were used to calculate breastfeeding duration.

WIC Participant and Program Characteristics: 2014 Final Report
Page D-16
Table D.VI.5. Estimated Breastfeeding Duration by State: Number and Percent of WIC Infants
Aged 7–11 Months in April 2014 Breastfeeding for 6 Months or More
Region and State
WIC Infants in Age Range
Lower Boundc Upper Boundc
Number Number % Number % Total for State Agencies Reportinga 767,979 184,857 24.1 233,951 30.5
Northeast
Connecticut 6,332 1,597 25.2 2,107 33.3 Maine 2,446 651 26.6 713 29.1 Massachusetts 12,161 3,376 27.8 3,468 28.5 New Hampshire 1,913 379 19.8 473 24.7 New York 54,249 18,235 33.6 23,038 42.5 Rhode Island 2,517 458 18.2 549 21.8 Vermont 1,290 436 33.8 470 36.4 Indian Township (ME) 2 1 50.0 1 50.0
Mid-Atlantic
Delaware 2,461 b b b b
District of Columbia 2,185 605 27.7 898 41.1 Maryland 15,158 2,945 19.4 4,554 30.0 New Jersey 16,738 5,921 35.4 6,805 40.7 Pennsylvania 27,568 3,918 14.2 4,636 16.8 Virginia 16,850 3,284 19.5 3,507 20.8 Virgin Islands 411 217 52.8 234 56.9
Southeast Alabama 14,997 1,864 12.4 2,467 16.4 Florida 57,055 12,815 22.5 18,197 31.9 Georgia 33,479 6,079 18.2 8,523 25.5 Kentucky 15,896 4,457 28.0 4,457 28.0 North Carolina 28,126 b b b b
South Carolina 15,459 2,264 14.6 3,115 20.2 Tennessee 20,029 5,537 27.6 6,664 33.3 Mississippi Band of Choctaw 70 b b b b
Midwest
Illinois 32,696 5,864 17.9 8,902 27.2 Indiana 19,241 3,320 17.3 4,149 21.6 Michigan 27,228 4,287 15.7 6,148 22.6 Minnesota 12,829 3,964 30.9 4,409 34.4 Ohio 27,817 3,719 13.4 5,154 18.5 Wisconsin 11,963 1,385 11.6 2,616 21.9
Southwest Arkansas 10,563 1,229 11.6 1,423 13.5 Louisiana 17,818 1,469 8.2 1,924 10.8 Oklahoma 10,172 b b b b
ACL (NM) 53 21 39.6 25 47.2 Chickasaw Nation (OK) 494 102 20.6 115 23.3 Choctaw Nation of Oklahoma 406 34 8.4 39 9.6 Citizen Potawatomi (OK) 181 26 14.4 27 14.9 Eight Northern Pueblos (NM) 41 11 27.0 13 32.4 Five Sandoval Pueblos (NM) 30 6 20.0 6 20.0

WIC Participant and Program Characteristics: 2014 Final Report
Page D-17
Table D.VI.5. (continued) Estimated Breastfeeding Duration by State: Number and Percent of WIC Infants
and Children Aged 7–11 Months in April 2014 Breastfeeding for 6 Months or More
Region and State
WIC Infants in Age Range
Lower Bound Estimatec
Upper Bound Estimatec
Number Number % Number % Southwest (continued)
ITC Oklahoma 120 11 9.2 13 10.8 Muscogee Creek Nation (OK) 293 45 15.4 48 16.4 Osage Nation (OK) 359 35 9.7 39 10.9 Otoe Missouria 50 6 12.0 7 14.0 Pueblo of San Felipe 26 16 61.5 16 61.5 Pueblo of Zuni 62 34 54.8 38 61.3 Santo Domingo 20 4 20.0 5 25.0 WCD Enterprises (OK) 414 69 16.7 81 19.6
Mountain Plains Colorado 10,774 2,404 22.3 2,858 26.5 Iowa 7,937 1,330 16.8 1,632 20.6 Kansas 7,909 1,275 16.1 1,861 23.5 Missouri 16,430 2,837 17.3 3,161 19.2 Montana 2,287 633 27.7 715 31.3 Nebraska 4,127 b b b b
North Dakota 1,442 311 21.6 385 26.7 Utah 7,459 2,303 30.9 2,782 37.3 Wyoming 1,294 302 23.3 368 28.4 Cheyenne River Sioux Tribe 60 b b b b
Omaha Nation 22 b b b b
Santee Sioux Nation 8 2 25.0 3 37.5 Standing Rock Sioux (ND) 58 5 8.6 8 13.8
Western Alaska 2,230 747 33.5 883 39.6 American Samoa 494 302 61.1 310 62.8 Arizona 20,261 4,811 23.7 6,054 29.9 California 125,569 45,831 36.5 51,252 40.8 Guam 923 201 21.8 264 28.6 Hawaii 4,051 1,392 34.4 1,669 41.2 Idaho 4,415 2,268 51.4 2,472 56.0 Oregon 9,834 2,863 29.1 4,579 46.6 Washington 17,487 6,729 38.5 8,040 46.0 ITC Arizona 1,181 187 15.8 249 21.1 Navajo Nation (AZ) 1,147 435 37.9 532 46.4 Northern Mariana Islands 312 85 27.2 100 32.1
Notes
Percents may not add to 100.0% and subtotals may not add to totals due to rounding and to the use of weights in the case of several State agencies that either under- or overreported the number of participants. a Includes the 71 State agencies reporting data on breastfeeding initiation for 75% or more of all 7-to-11-month-old infants and duration data for 75% or more of breastfed infants. These estimates are based on information for 83.8% of all WIC infants aged 7–11 months. State agencies excluded are Cherokee Nation, Eastern Band Cherokee, Eastern Shoshone, ITC-Nevada, Mississippi, Nevada, New Mexico, Northern Arapahoe, Pleasant Point, Pueblo of Isleta, Puerto Rico, Rosebud Sioux, Seneca Nation, South Dakota, Texas, Three Affiliated, Ute Mountain Ute, West Virginia, and Winnebago. b State agency reported data on 75% or more, but less than 85%, of all 7-to-11-month-old WIC infants. All available data (including these States) were used to calculate breastfeeding duration. c The lower bound estimate counts only those infants for whom was reported 6 or more months of breastfeeding. The upper bound estimate includes infants known to have been breastfed for at least 6 months as well as infants for whom initiation and duration of breastfeeding are not known. It also counts currently breastfeeding infants who were aged 5–6 months when data were collected as having been breastfed for 6 months.
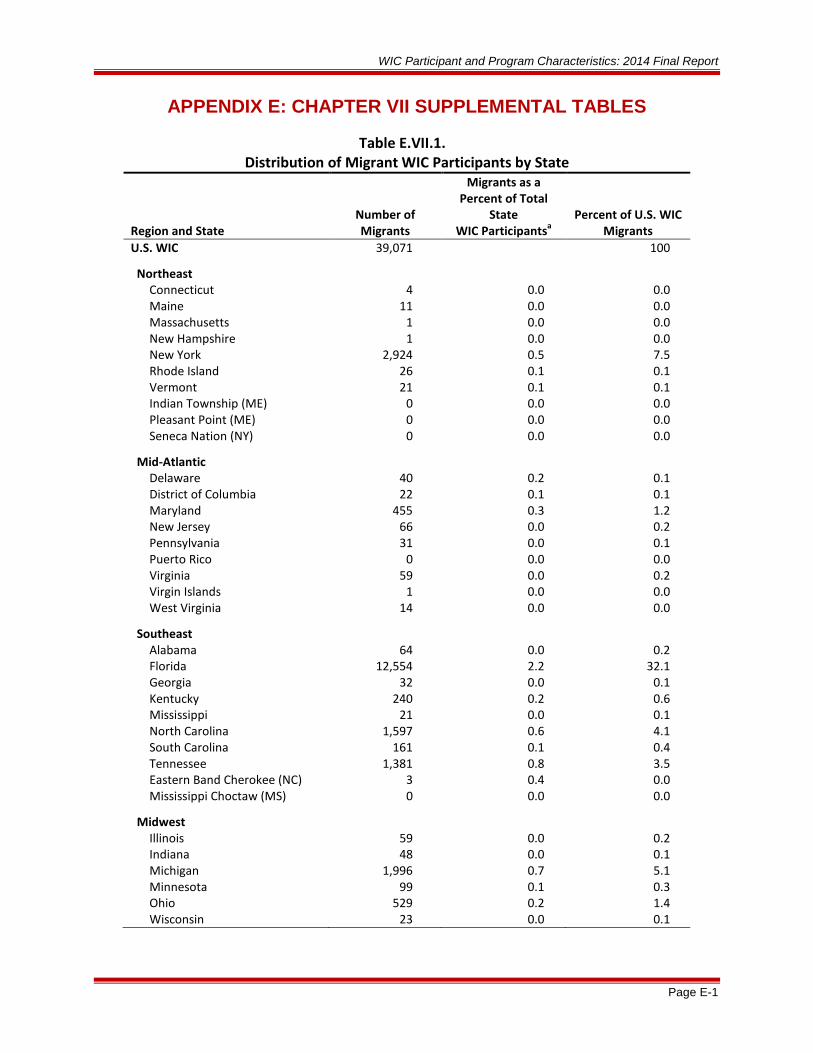
WIC Participant and Program Characteristics: 2014 Final Report
Page E-1
APPENDIX E: CHAPTER VII SUPPLEMENTAL TABLES
Table E.VII.1. Distribution of Migrant WIC Participants by State
Region and State Number of Migrants
Migrants as a Percent of Total
State WIC Participantsa
Percent of U.S. WIC Migrants
U.S. WIC 39,071
100
Northeast Connecticut 4 0.0 0.0 Maine 11 0.0 0.0 Massachusetts 1 0.0 0.0 New Hampshire 1 0.0 0.0 New York 2,924 0.5 7.5 Rhode Island 26 0.1 0.1 Vermont 21 0.1 0.1 Indian Township (ME) 0 0.0 0.0 Pleasant Point (ME) 0 0.0 0.0 Seneca Nation (NY) 0 0.0 0.0
Mid-Atlantic Delaware 40 0.2 0.1 District of Columbia 22 0.1 0.1 Maryland 455 0.3 1.2 New Jersey 66 0.0 0.2 Pennsylvania 31 0.0 0.1 Puerto Rico 0 0.0 0.0 Virginia 59 0.0 0.2 Virgin Islands 1 0.0 0.0 West Virginia 14 0.0 0.0
Southeast Alabama 64 0.0 0.2 Florida 12,554 2.2 32.1 Georgia 32 0.0 0.1 Kentucky 240 0.2 0.6 Mississippi 21 0.0 0.1 North Carolina 1,597 0.6 4.1 South Carolina 161 0.1 0.4 Tennessee 1,381 0.8 3.5 Eastern Band Cherokee (NC) 3 0.4 0.0 Mississippi Choctaw (MS) 0 0.0 0.0
Midwest Illinois 59 0.0 0.2 Indiana 48 0.0 0.1 Michigan 1,996 0.7 5.1 Minnesota 99 0.1 0.3 Ohio 529 0.2 1.4 Wisconsin 23 0.0 0.1

WIC Participant and Program Characteristics: 2014 Final Report
Page E-2
Table E.VII.1. (continued) Distribution of Migrant WIC Participants by State
Region and State Number of Migrants
Migrants as a Percent of Total
State WIC Participantsa
Percent of U.S. WIC Migrants
Southwest Arkansas 249 0.3 0.6 Louisiana 188 0.1 0.5 New Mexico 26 0.0 0.1 Oklahoma 3 0.0 0.0 Texas 2,311 0.2 5.9 ACL (NM) 0 0.0 0.0 Cherokee Nation (OK) 0 0.0 0.0 Chickasaw Nation (OK) 0 0.0 0.0 Choctaw Nation (OK) 1 0.0 0.0 Citizen Potawatomi (OK) 0 0.0 0.0 Eight Northern Pueblos (NM) 0 0.0 0.0 Five Sandoval Pueblos (NM) 0 0.0 0.0 ITC Oklahoma 0 0.0 0.0 Muscogee Creek Nation (OK) 0 0.0 0.0 Osage Nation (OK) 0 0.0 0.0 Otoe Missouria (OK) 0 0.0 0.0 Pueblo of Isleta (NM) 0 0.0 0.0 Pueblo of San Felipe (NM) 0 0.0 0.0 Pueblo of Zuni (NM) 0 0.0 0.0 Santo Domingo (NM) 0 0.0 0.0 WCD (OK) 0 0.0 0.0
Mountain Plains Colorado 5 0.0 0.0 Iowa 6 0.0 0.0 Kansas 29 0.0 0.1 Missouri 80 0.1 0.2 Montana 9 0.0 0.0 Nebraska 17 0.0 0.0 North Dakota 26 0.2 0.1 South Dakota 7 0.0 0.0 Utah 8 0.0 0.0 Wyoming 7 0.1 0.0 Cheyenne River Sioux (SD) 0 0.0 0.0 Eastern Shoshone (WY) 0 0.0 0.0 Northern Arapahoe (WY) 4 0.9 0.0 Omaha Nation (NE) 0 0.0 0.0 Rosebud Sioux (ND) 0 0.0 0.0 Santee Sioux Nation (NE) 0 0.0 0.0 Standing Rock Sioux (ND) 0 0.0 0.0 Three Affiliated (ND) 0 0.0 0.0 Ute Mountain Ute (CO) 0 0.0 0.0 Winnebago (NE) 0 0.0 0.0
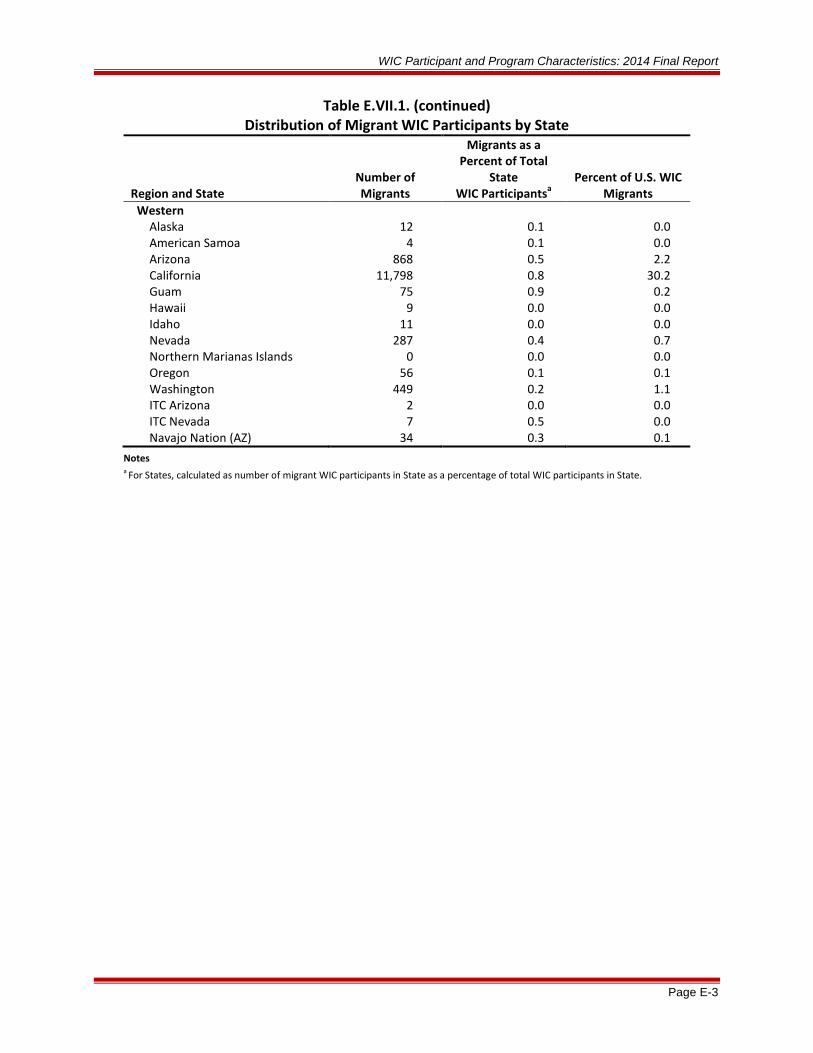
WIC Participant and Program Characteristics: 2014 Final Report
Page E-3
Table E.VII.1. (continued) Distribution of Migrant WIC Participants by State
Region and State Number of Migrants
Migrants as a Percent of Total
State WIC Participantsa
Percent of U.S. WIC Migrants
Western Alaska 12 0.1 0.0 American Samoa 4 0.1 0.0 Arizona 868 0.5 2.2 California 11,798 0.8 30.2 Guam 75 0.9 0.2 Hawaii 9 0.0 0.0 Idaho 11 0.0 0.0 Nevada 287 0.4 0.7 Northern Marianas Islands 0 0.0 0.0 Oregon 56 0.1 0.1 Washington 449 0.2 1.1 ITC Arizona 2 0.0 0.0 ITC Nevada 7 0.5 0.0 Navajo Nation (AZ) 34 0.3 0.1
Notes a For States, calculated as number of migrant WIC participants in State as a percentage of total WIC participants in State.

WIC Participant and Program Characteristics: 2014 Final Report
Page F-1
APPENDIX F: SUPPLEMENTAL DATA SET
Table F.1. States Reporting Supplemental Data Set Items
Northeast Southwest (continued) Connecticut Eight Northern Pueblos (NM) Maine Five Sandoval Pueblos (NM) Massachusetts ITC Oklahoma New Hampshire Muscogee Creek Nation (OK) Rhode Island Osage Nation (OK) Vermont Otoe Missouria (OK) Indian Township (ME) Pueblo of Isleta (NM) Pleasant Point (ME) Pueblo of San Felipe (NM) Seneca Nation (NY) Pueblo of Zuni (NM)
Santo Domingo (NM) Mid-Atlantic WCD (OK)
Delaware District of Columbia Mountain Plains Maryland Colorado New Jersey Iowa Pennsylvania Kansas Puerto Rico Missouri Virginia Montana Virgin Islands Nebraska West Virginia North Dakota
South Dakota Southeast Utah
Alabama Wyoming Florida Cheyenne River Sioux (SD) Georgia Eastern Shoshone (WY) Mississippi Northern Arapahoe (WY) North Carolina Omaha Nation (NE) South Carolina Rosebud Sioux (SD) Tennessee Santee Sioux (NE) Eastern Band Cherokee (NC) Standing Rock Sioux (ND) Mississippi Choctaw (MS) Three Affiliated (ND)
Ute Mountain Ute (CO) Midwest Winnebago (NE)
Illinois Indiana Western Michigan Alaska Minnesota American Samoa Wisconsin Arizona
Northern Mariana Islands Southwest Guam
Arkansas Hawaii Louisiana Idaho New Mexico Nevada Oklahoma Oregon Texas Washington ACL (NM) ITC Arizona (AZ) Chickasaw Nation (OK) ITC Nevada (NV) Choctaw Nation (OK) Navajo Nation (AZ) Citizen Potawatomi (OK)
Notes
The following five State agencies did not report sufficient SDS data to be included in the PC2014 report: California, Kentucky, New York, Ohio, and Cherokee Nation (OK).

WIC Participant and Program Characteristics: 2014 Final Report
Page F-2
Table F.2. Distribution of Birth Weights for Infant and Child WIC Participants by State
Very Low Birth Weight
Low Birth Weight
Normal Birth Weight
High Birth Weight
Birth Weight Not Reported
Total WIC
Infants Children Infants Children Infants Children Infants Children Infants Children Infants Children
Region and State Percent by State Number Number Northeast
Connecticut 1.0 0.9 7.5 7.4 83.7 78.2 6.3 6.5 1.5 6.9 14,525 32,178 Maine 0.8 0.8 7.8 6.5 80.1 75.1 9.3 9.4 2.0 8.3 5,384 14,206 Massachusetts 0.9 1.0 7.5 7.6 83.2 80.0 7.6 7.1 0.8 4.3 32,853 69,739 New Hampshire 0.5 0.7 5.5 4.9 74.0 53.0 8.0 6.0 11.9 35.4 4,239 8,756 Rhode Island 0.8 1.3 6.9 7.3 83.5 82.9 7.2 7.3 1.7 1.2 6,421 13,145 Vermont 0.6 0.9 7.5 6.5 81.7 75.7 8.6 8.9 1.6 8.0 2,820 8,571 Indian Township (ME) 0.0 0.0 8.3 0.0 16.7 6.8 0.0 0.0 75.0 93.2 12 44 Seneca Nation (NY) 1.8 0.0 5.4 0.0 44.6 12.3 3.6 8.8 44.6 78.9 56 57
Mid-Atlantic
Delaware 1.1 1.2 7.7 8.1 77.4 74.9 5.7 6.3 8.1 9.4 6,306 12,654
District of Columbia 1.4 1.4 9.3 9.7 81.8 81.2 5.5 5.9 2.0 1.8 4,932 7,551 Maryland 1.0 1.2 8.4 8.5 82.9 82.3 6.1 6.1 1.6 2.1 38,586 78,764 New Jersey 1.0 1.0 7.3 7.1 82.8 82.3 6.4 6.4 2.6 3.2 38,340 89,420 Pennsylvania 1.1 1.2 8.7 8.2 83.4 76.1 6.3 5.7 0.5 8.8 62,768 141,430 Virgin Islands 1.0 1.1 8.9 9.4 83.3 81.7 4.9 4.6 1.9 3.3 1,067 2,737 West Virginia 0.7 0.9 9.2 9.2 80.6 78.4 6.1 6.1 3.4 5.3 12,206 24,746
Southeast
Florida 1.0 1.1 8.1 8.2 83.5 83.1 6.2 6.0 1.2 1.5 133,082 299,533
Georgia 1.2 1.2 8.9 8.1 81.0 75.0 5.4 4.9 3.6 10.8 73,594 162,210 Mississippi 1.5 0.6 12.3 4.2 75.7 24.6 4.2 1.3 6.4 69.4 22,463 41,138 North Carolina 1.1 1.0 8.5 6.9 81.7 67.2 6.6 5.4 2.1 19.4 66,228 152,071 South Carolina 0.4 0.5 5.8 6.1 74.0 68.4 13.7 10.1 6.2 14.9 35,125 54,487 Tennessee 1.1 0.9 9.2 7.4 83.7 68.8 5.6 4.8 0.3 18.1 46,842 90,206 Eastern Band Cherokee (NC) 0.7 0.2 6.2 7.7 80.8 76.3 11.0 11.0 1.4 4.8 146 418 Mississippi Choctaw (MS) 0.5 0.0 6.0 2.1 67.8 17.9 12.0 1.9 13.7 78.1 183 470
Midwest
Illinois 0.9 1.0 8.2 7.5 82.9 79.4 7.0 6.9 1.0 5.2 75,806 151,704
Indiana 0.8 0.9 7.9 7.8 82.8 81.7 6.5 6.7 1.9 2.9 44,756 84,800 Michigan 1.0 1.1 8.1 8.1 82.1 80.3 6.9 6.9 2.0 3.6 61,522 165,285 Minnesota 0.8 0.8 6.4 5.9 81.0 76.2 9.6 8.4 2.2 8.8 28,068 73,390 Wisconsin 0.9 0.9 7.9 7.0 83.2 76.7 7.3 6.9 0.7 8.5 28,832 62,533

WIC Participant and Program Characteristics: 2014 Final Report
Page F-3
Table F.2. (continued) Distribution of Birth Weights for Infant and Child WIC Participants by State
Very Low
Birth Weight Low
Birth Weight Normal
Birth Weight High
Birth Weight Birth Weight
Not Reported
Total WIC Infants Children Infants Children Infants Children Infants Children Infants Children Infants Children Region and State Percent by State Number Number Southwest
Arkansas 0.9 1.1 8.1 8.5 82.6 81.7 5.8 5.8 2.7 2.9 23,863 46,264 Louisiana 0.7 0.0 7.0 0.0 36.1 0.0 1.6 0.0 54.5 100.0 41,054 66,863 Oklahoma 0.8 0.9 7.6 7.7 82.3 82.1 6.2 6.2 3.1 3.1 23,944 54,555 Texas 0.8 0.8 7.5 6.7 84.1 75.1 5.7 5.1 1.8 12.2 244,077 549,955 ACL (NM) 2.5 0.6 5.0 9.9 86.0 83.1 4.1 4.8 2.5 1.5 121 332 Chickasaw Nation (OK) 0.8 1.3 6.9 7.5 79.9 79.6 7.7 6.9 4.8 4.7 1,063 2,332 Choctaw Nation (OK) 1.4 1.0 6.9 6.7 79.8 84.8 6.9 5.5 5.1 2.0 929 2,269 Citizen Potawatomi (OK) 0.6 0.3 6.5 2.1 51.4 16.1 8.8 2.3 32.7 79.3 352 710 Eight Northern Pueblos (NM) 1.7 0.0 8.5 10.0 83.1 84.6 1.7 3.8 5.1 1.5 66 181 Five Sandoval Pueblos (NM) 0.0 0.7 7.9 5.0 69.8 85.7 4.8 3.6 17.5 5.0 63 140 ITC Oklahoma 1.6 1.3 7.2 7.7 74.3 80.8 8.4 6.9 8.4 3.3 249 521 Muscogee Creek Nation (OK) 0.3 1.2 7.0 8.0 78.6 78.2 5.6 8.3 8.5 4.4 660 1,872 Osage Nation (OK) 0.2 0.5 7.4 8.0 81.7 82.2 7.2 6.5 3.5 2.8 808 1,476 Otoe Missouria (OK) 1.9 0.3 3.7 5.4 74.8 79.5 12.1 11.1 7.5 3.6 107 332 Pueblo of San Felipe (NM) 0.0 0.0 3.6 7.8 87.5 88.0 7.1 3.6 1.8 0.6 56 167 Pueblo of Zuni (NM) 0.0 1.2 8.6 9.2 83.6 83.0 3.6 4.3 4.3 2.3 140 513 Santo Domingo (NM) 0.0 0.8 5.4 10.1 81.1 80.7 8.1 8.4 5.4 0.0 37 119 WCD (OK) 0.8 0.5 5.2 7.4 83.2 80.4 8.5 8.6 2.4 3.2 893 2,409
Mountain Plains
Colorado 0.9 1.0 9.0 7.9 85.0 79.7 4.4 4.7 0.8 6.7 23,447 52,742
Iowa 0.8 1.0 6.9 7.5 81.7 76.5 7.8 7.5 2.8 7.4 17,876 39,968 Kansas 0.9 0.9 6.8 6.8 81.3 77.4 6.5 6.3 4.5 8.5 17,995 39,426 Missouri 0.9 1.0 8.2 8.0 82.3 82.7 6.4 6.5 2.3 1.8 37,082 72,252 Montana 0.7 0.9 7.5 6.8 82.6 81.4 7.2 7.9 2.0 3.1 4,826 11,459 Nebraska 0.9 0.9 6.7 6.9 84.6 83.8 7.1 7.0 0.7 1.3 9,711 21,757 North Dakota 1.0 1.2 7.3 6.2 80.2 72.9 10.1 8.1 1.4 11.7 3,321 7,119 South Dakota 0.9 0.6 6.5 5.3 78.7 56.8 9.3 6.5 4.6 30.9 4,894 11,576 Utah 0.9 0.8 8.1 7.3 84.1 82.4 5.9 6.2 1.0 3.3 15,909 37,062 Wyoming 1.0 1.2 9.6 8.8 83.5 74.5 4.4 5.0 1.5 10.5 2,756 6,012 Cheyenne River Sioux (SD) 1.3 0.2 6.4 1.9 74.4 19.8 10.9 2.3 7.1 75.8 156 429 Eastern Shoshone (WY) 0.0 0.0 11.1 0.0 51.1 14.5 6.7 1.2 31.1 84.3 45 83 Northern Arapahoe (WY) 1.7 0.4 4.2 1.3 44.9 25.5 3.4 3.9 45.8 68.8 118 231 Omaha Nation (NE) 3.0 0.4 6.1 0.4 54.5 14.7 7.6 3.5 28.8 81.0 66 231 Rosebud Sioux (SD) 1.1 0.0 5.9 0.4 82.8 23.0 7.0 2.7 3.3 73.9 273 709 Santee Sioux (NE) 0.0 1.5 6.7 0.0 60.0 25.4 20.0 7.5 13.3 65.7 30 67 Standing Rock Sioux (ND) 1.8 0.0 5.3 1.8 71.3 22.4 11.7 2.6 9.9 73.2 171 496 Three Affiliated (ND) 0.0 0.0 3.4 0.0 64.4 19.8 14.9 3.1 17.2 77.1 87 131 Winnebago (NE) 0.0 0.8 1.3 1.6 38.2 7.1 2.6 5.6 57.9 84.9 76 126
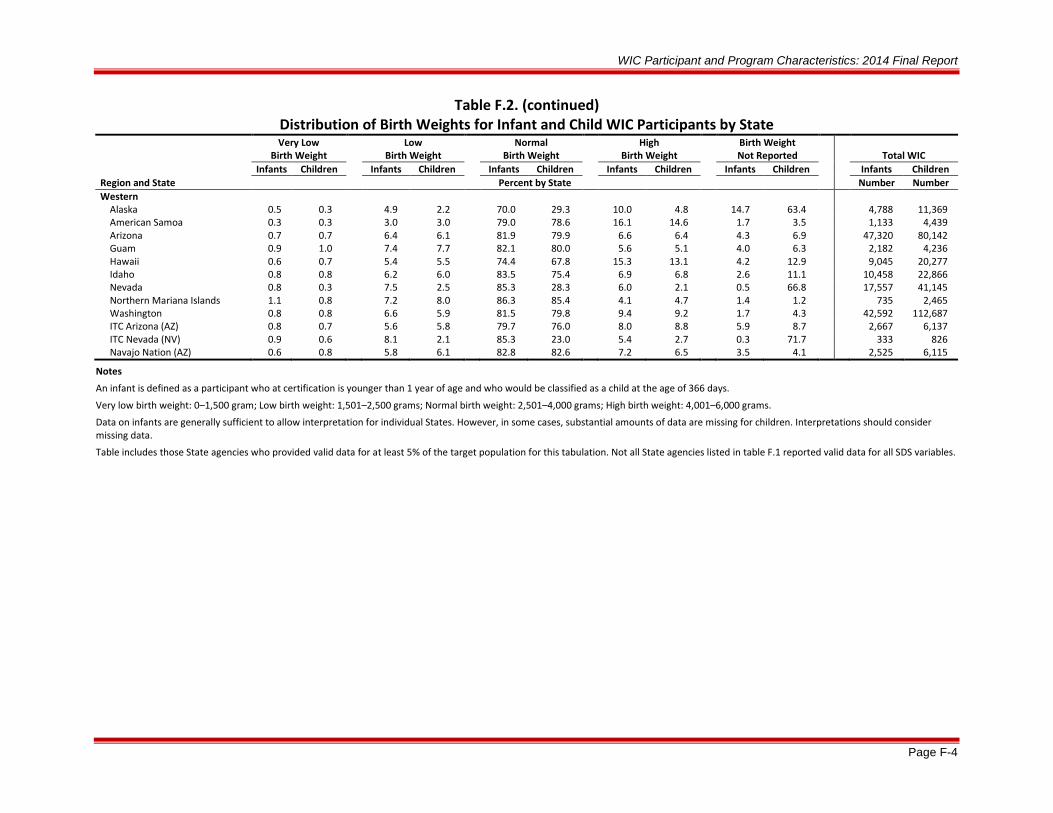
WIC Participant and Program Characteristics: 2014 Final Report
Page F-4
Table F.2. (continued) Distribution of Birth Weights for Infant and Child WIC Participants by State
Very Low
Birth Weight Low
Birth Weight Normal
Birth Weight High
Birth Weight Birth Weight
Not Reported
Total WIC Infants Children Infants Children Infants Children Infants Children Infants Children Infants Children Region and State Percent by State Number Number Western
Alaska 0.5 0.3 4.9 2.2 70.0 29.3 10.0 4.8 14.7 63.4 4,788 11,369 American Samoa 0.3 0.3 3.0 3.0 79.0 78.6 16.1 14.6 1.7 3.5 1,133 4,439 Arizona 0.7 0.7 6.4 6.1 81.9 79.9 6.6 6.4 4.3 6.9 47,320 80,142 Guam 0.9 1.0 7.4 7.7 82.1 80.0 5.6 5.1 4.0 6.3 2,182 4,236 Hawaii 0.6 0.7 5.4 5.5 74.4 67.8 15.3 13.1 4.2 12.9 9,045 20,277 Idaho 0.8 0.8 6.2 6.0 83.5 75.4 6.9 6.8 2.6 11.1 10,458 22,866 Nevada 0.8 0.3 7.5 2.5 85.3 28.3 6.0 2.1 0.5 66.8 17,557 41,145 Northern Mariana Islands 1.1 0.8 7.2 8.0 86.3 85.4 4.1 4.7 1.4 1.2 735 2,465 Washington 0.8 0.8 6.6 5.9 81.5 79.8 9.4 9.2 1.7 4.3 42,592 112,687 ITC Arizona (AZ) 0.8 0.7 5.6 5.8 79.7 76.0 8.0 8.8 5.9 8.7 2,667 6,137 ITC Nevada (NV) 0.9 0.6 8.1 2.1 85.3 23.0 5.4 2.7 0.3 71.7 333 826 Navajo Nation (AZ) 0.6 0.8 5.8 6.1 82.8 82.6 7.2 6.5 3.5 4.1 2,525 6,115
Notes
An infant is defined as a participant who at certification is younger than 1 year of age and who would be classified as a child at the age of 366 days.
Very low birth weight: 0–1,500 gram; Low birth weight: 1,501–2,500 grams; Normal birth weight: 2,501–4,000 grams; High birth weight: 4,001–6,000 grams.
Data on infants are generally sufficient to allow interpretation for individual States. However, in some cases, substantial amounts of data are missing for children. Interpretations should consider missing data.
Table includes those State agencies who provided valid data for at least 5% of the target population for this tabulation. Not all State agencies listed in table F.1 reported valid data for all SDS variables.

WIC Participant and Program Characteristics: 2014 Final Report
Page F-5
Table F.3. Distribution of Birth Weights for Infant and Child Migrant WIC Participants by State
Very Low Birth Weight
Low Birth Weight
Normal Birth Weight
High Birth Weight
Birth Weight Not Reported
Total WIC
Infants Children Infants Children Infants Children Infants Children Infants Children Infants Children
Region and State Percent by State Number Number Northeast
Connecticut 0.0 0.0 0.0 0.0 0.0 50.0 0.0 50.0 0.0 0.0 0 2 Maine 0.0 0.0 0.0 0.0 100.0 80.0 0.0 0.0 0.0 20.0 3 5 Massachusetts 0.0 0.0 100.0 0.0 0.0 0.0 0.0 0.0 0.0 0.0 1 0 Rhode Island 0.0 0.0 0.0 12.5 100.0 81.3 0.0 6.3 0.0 0.0 4 16 Vermont 0.0 0.0 0.0 0.0 100.0 63.6 0.0 0.0 0.0 36.4 4 11
Mid-Atlantic
Delaware 0.0 0.0 18.2 4.3 81.8 87.0 0.0 4.3 0.0 4.3 11 23
District of Columbia 0.0 0.0 0.0 0.0 83.3 100.0 0.0 0.0 16.7 0.0 6 11 Maryland 1.1 0.0 2.2 5.1 87.8 86.2 7.8 6.9 1.1 1.8 90 276 New Jersey 0.0 0.0 0.0 6.8 83.3 84.1 16.7 9.1 0.0 0.0 12 44 Pennsylvania 0.0 0.0 25.0 8.3 75.0 62.5 0.0 8.3 0.0 20.8 4 24 Virgin Islands 0.0 0.0 0.0 0.0 0.0 100.0 0.0 0.0 0.0 0.0 0 1 West Virginia 0.0 0.0 0.0 0.0 100.0 100.0 0.0 0.0 0.0 0.0 1 9
Southeast
Florida 0.6 0.9 4.7 6.5 86.9 84.8 6.8 6.6 1.0 1.1 2,443 7,234
Georgia 0.0 0.0 14.3 0.0 71.4 85.7 0.0 0.0 14.3 14.3 7 14 Mississippi 0.0 0.0 0.0 0.0 100.0 22.2 0.0 0.0 0.0 77.8 5 9 North Carolina 0.4 1.3 5.5 6.5 86.1 69.7 5.9 6.1 2.1 16.3 238 618 South Carolina 0.0 0.0 0.0 6.3 74.0 65.6 10.0 15.6 16.0 12.5 50 64 Tennessee 0.4 0.5 8.0 6.0 83.1 75.7 8.4 4.2 0.0 13.6 249 601 Eastern Band Cherokee (NC) 0.0 0.0 0.0 0.0 0.0 100.0 0.0 0.0 0.0 0.0 0 1
Midwest
Illinois 0.0 0.0 0.0 0.0 100.0 81.8 0.0 0.0 0.0 18.2 8 11
Indiana 0.0 0.0 18.2 0.0 72.7 88.0 0.0 12.0 9.1 0.0 11 25 Michigan 0.8 0.5 4.9 6.9 79.6 72.5 4.9 5.1 9.8 15.0 367 1,246 Minnesota 0.0 0.0 4.2 7.5 83.3 79.2 8.3 3.8 4.2 9.4 24 53 Wisconsin 0.0 0.0 20.0 0.0 80.0 90.9 0.0 0.0 0.0 9.1 5 11
Southwest
Arkansas 0.0 0.8 4.5 4.8 82.1 83.3 11.9 7.1 1.5 4.0 67 126
Louisiana 0.0 0.0 4.5 0.0 31.8 0.0 0.0 0.0 63.6 100.0 44 94

WIC Participant and Program Characteristics: 2014 Final Report
Page F-6
Table F.3. (continued) Distribution of Birth Weights for Infant and Child Migrant WIC Participants by State
Very Low
Birth Weight Low
Birth Weight Normal
Birth Weight High
Birth Weight Birth Weight
Not Reported
Total WIC Infants Children Infants Children Infants Children Infants Children Infants Children Infants Children
Region and State Percent by State Number Number Southwest (continued)
Oklahoma 0.0 0.0 0.0 0.0 100.0 100.0 0.0 0.0 0.0 0.0 2 1 Texas 0.9 0.5 6.2 5.7 80.9 64.1 5.1 4.4 6.9 25.3 450 1,326
Mountain Plains
Colorado 0.0 0.0 0.0 0.0 100.0 100.0 0.0 0.0 0.0 0.0 2 2
Iowa 0.0 0.0 0.0 0.0 100.0 50.0 0.0 0.0 0.0 50.0 1 4 Kansas 0.0 0.0 0.0 0.0 90.0 53.8 10.0 0.0 0.0 46.2 10 13 Missouri 0.0 2.4 5.6 14.3 94.4 76.2 0.0 2.4 0.0 4.8 18 42 Montana 0.0 0.0 0.0 0.0 100.0 66.7 0.0 16.7 0.0 16.7 1 6 Nebraska 0.0 0.0 100.0 14.3 0.0 71.4 0.0 0.0 0.0 14.3 1 14 North Dakota 0.0 0.0 14.3 0.0 85.7 87.5 0.0 0.0 0.0 12.5 7 16 South Dakota 0.0 0.0 0.0 100.0 66.7 0.0 0.0 0.0 33.3 0.0 3 1 Utah 0.0 0.0 0.0 28.6 0.0 57.1 0.0 0.0 0.0 14.3 0 7 Wyoming 0.0 0.0 0.0 0.0 100.0 100.0 0.0 0.0 0.0 0.0 1 4 Northern Arapahoe (WY) 0.0 0.0 0.0 0.0 50.0 0.0 0.0 0.0 50.0 100.0 2 1
Western
Alaska 0.0 0.0 0.0 0.0 66.7 42.9 33.3 0.0 0.0 57.1 3 7
American Samoa 0.0 0.0 0.0 0.0 0.0 50.0 0.0 50.0 0.0 0.0 0 4 Arizona 0.4 1.0 8.3 5.9 82.5 78.9 6.3 8.6 2.4 5.6 252 408 Guam 0.0 0.0 16.7 10.0 77.8 70.0 0.0 15.0 5.6 5.0 18 40 Hawaii 0.0 0.0 0.0 0.0 100.0 40.0 0.0 0.0 0.0 60.0 1 5 Idaho 0.0 0.0 100.0 10.0 0.0 40.0 0.0 30.0 0.0 20.0 1 10 Nevada 0.0 0.6 13.6 2.3 86.4 30.8 0.0 2.3 0.0 64.0 59 172 Washington 4.6 0.8 8.0 6.1 78.2 75.8 4.6 6.8 4.6 10.6 87 264 ITC Arizona (AZ) 0.0 0.0 0.0 0.0 100.0 100.0 0.0 0.0 0.0 0.0 1 1 ITC Nevada (NV) 0.0 0.0 0.0 25.0 100.0 25.0 0.0 0.0 0.0 50.0 2 4 Navajo Nation (NV) 0.0 0.0 16.7 13.3 83.3 80.0 0.0 0.0 0.0 6.7 12 15
Notes
An infant is defined as a participant who is younger than 1 year of age and who could be classified as a child at the age of 366 days.
Very low birth weight: 0–1,500 gram; Low birth weight: 1,501–2,500 grams; Normal birth weight: 2,501–4,000 grams; High birth weight: 4,001–6,000 gram.
Data on infants are generally sufficient to allow interpretation for individual States. However, in some cases, substantial amounts of data are missing for children. Interpretations should consider missing data.
Table includes those State agencies who provided valid data for at least 5% of the target population for this tabulation. Not all State agencies listed in table F.1 reported valid data for all SDS variables.

WIC Participant and Program Characteristics: 2014 Final Report
Page F-7
Table F.4. Mean Birth Weight in Grams of WIC Infants by Race and State
Region and State
American Indian or
Alaska Native Only Asian Only
Black or African
American Only
Native Hawaiian or Pacific Islander
Only White Only
Two or More Races
Race Not Reportedb
Total WIC Infants
Northeast
Connecticut
Infants in category Number 499 351 3,598 329 9,028 720 0 14,525 Percent reporting birth weight % 98.4 98.6 98.6 97.0 98.5 98.3 N/A 98.5 Mean Grams 3,342.1 3,172.2 3,153.4 3,220.3 3,273.3 3,253.7 N/A 3,241.3
Maine
Infants in category Number 30 52 308 9 4,593 362 30 5,384
Percent reporting birth weight % 100.0 98.1 95.1 100.0 98.6 96.7 46.7 98.0 Mean Grams 3,390.7 3,198.5 3,257.3 3,698.1 3,303.4 3,242.7 3,264.3 3,296.9
Massachusetts
Infants in category Number 109 1,861 6,889 98 22,707 1,189 0 32,853
Percent reporting birth weight % 99.1 99.8 99.1 100.0 99.1 99.1 N/A 99.2 Mean Grams 3,291.5 3,171.6 3,211.4 3,245.5 3,285.7 3,244.0 N/A 3,262.0
New Hampshire
Infants in category Number 13 95 151 30 3,804 146 0 4,239
Percent reporting birth weight % 84.6 80.0 81.5 83.3 88.8 84.2 N/A 88.1 Mean Grams 3,108.2 3,243.5 3,314.2 3,208.1 3,325.4 3,287.4 N/A 3,320.7
Rhode Island
Infants in category Number 20 234 1,045 86 4,463 541 32 6,421
Percent reporting birth weight % 100.0 98.7 98.2 97.7 98.8 99.6 6.3 98.3 Mean Grams 3,148.3 3,246.4 3,210.5 3,315.3 3,276.5 3,265.5 3,798.9 3,264.0
Vermont
Infants in category Number 7 66 64 7 2,227 81 368 2,820
Percent reporting birth weight % 100.0 100.0 93.8 100.0 98.7 100.0 97.0 98.4 Mean Grams 3,118.5 3,175.6 3,314.1 3,195.5 3,323.7 3,325.7 3,271.4 3,312.4
Indian Township (ME)
Infants in category Number 10 a a a a a 2 12
Percent reporting birth weight % 30.0 a a a a a N/A 25.0 Mean Grams 2,835.0 a a a a a N/A 2,835.0

WIC Participant and Program Characteristics: 2014 Final Report
Page F-8
Table F.4. (continued) Mean Birth Weight in Grams of WIC Infants by Race and State
Region and State
American Indian or
Alaska Native Only Asian Only
Black or African
American Only
Native Hawaiian or Pacific Islander
Only White Only
Two or More Races
Race Not Reportedb
Total WIC
Infants Northeast (continued)
Seneca Nation (NY)
Infants in category Number 53 0 0 0 a a 3 56
Percent reporting birth weight % 52.8 N/A N/A N/A a a 100.0 55.4 Mean Grams 3,227.9 N/A N/A N/A a a 3,780.0 3,281.3
Mid-Atlantic
Delaware
Infants in category Number 10 108 2,544 14 3,306 307 17 6,306
Percent reporting birth weight % 100.0 90.7 88.6 92.9 94.8 91.5 52.9 91.9 Mean Grams 3,098.7 3,145.7 3,128.3 3,439.1 3,290.2 3,197.2 2,775.2 3,219.5
District of Columbia
Infants in category Number a 51 3,832 9 978 23 39 4,932
Percent reporting birth weight % a 100.0 98.4 100.0 99.1 100.0 35.9 98.0 Mean Grams a 3,278.0 3,139.5 3,317.0 3,264.3 3,138.2 3,037.5 3,166.0
Maryland
Infants in category Number 1,314 1,234 17,769 174 15,200 2,764 131 38,586
Percent reporting birth weight % 98.9 98.8 98.4 98.9 98.7 99.0 41.2 98.4 Mean Grams 3,266.3 3,177.1 3,142.6 3,238.0 3,289.2 3,240.8 3,280.7 3,213.6
New Jersey
Infants in category Number 815 1,200 10,691 438 23,867 1,287 42 38,340
Percent reporting birth weight % 98.2 96.8 97.1 96.8 97.6 98.1 69.0 97.4 Mean Grams 3,282.2 3,169.3 3,155.2 3,252.7 3,283.6 3,239.3 3,187.9 3,242.4
Pennsylvania
Infants in category Number 794 1,646 17,458 1,848 38,249 2,773 0 62,768
Percent reporting birth weight % 99.1 99.6 99.4 99.4 99.6 99.5 N/A 99.5 Mean Grams 3,195.4 3,182.5 3,121.6 3,202.5 3,246.8 3,215.7 N/A 3,207.0
Virgin Islands
Infants in category Number a 0 1,020 0 33 a 14 1,067
Percent reporting birth weight % a N/A 98.7 N/A 97.0 a 57.1 98.1 Mean Grams a N/A 3,166.6 N/A 3,157.5 a 3,196.5 3,166.5
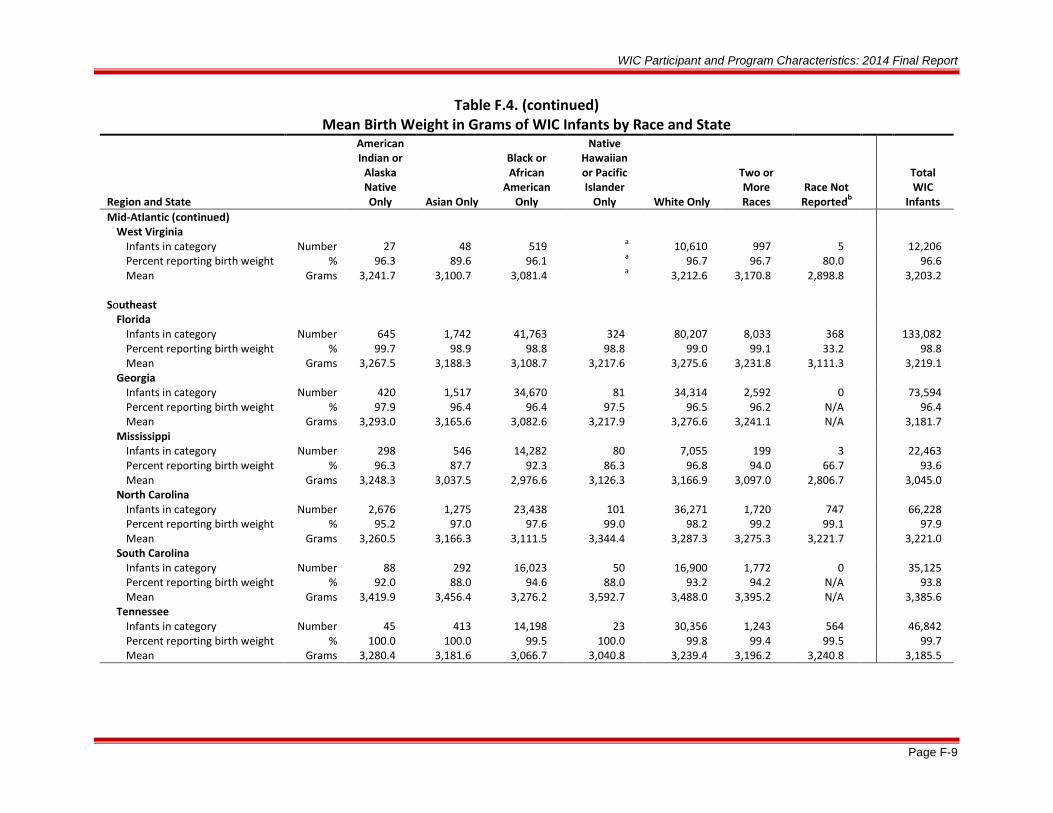
WIC Participant and Program Characteristics: 2014 Final Report
Page F-9
Table F.4. (continued) Mean Birth Weight in Grams of WIC Infants by Race and State
Region and State
American Indian or
Alaska Native Only Asian Only
Black or African
American Only
Native Hawaiian or Pacific Islander
Only White Only
Two or More Races
Race Not Reportedb
Total WIC
Infants Mid-Atlantic (continued)
West Virginia
Infants in category Number 27 48 519 a 10,610 997 5 12,206
Percent reporting birth weight % 96.3 89.6 96.1 a 96.7 96.7 80.0 96.6 Mean Grams 3,241.7 3,100.7 3,081.4 a 3,212.6 3,170.8 2,898.8 3,203.2
Southeast
Florida
Infants in category Number 645 1,742 41,763 324 80,207 8,033 368 133,082
Percent reporting birth weight % 99.7 98.9 98.8 98.8 99.0 99.1 33.2 98.8 Mean Grams 3,267.5 3,188.3 3,108.7 3,217.6 3,275.6 3,231.8 3,111.3 3,219.1
Georgia
Infants in category Number 420 1,517 34,670 81 34,314 2,592 0 73,594
Percent reporting birth weight % 97.9 96.4 96.4 97.5 96.5 96.2 N/A 96.4 Mean Grams 3,293.0 3,165.6 3,082.6 3,217.9 3,276.6 3,241.1 N/A 3,181.7
Mississippi
Infants in category Number 298 546 14,282 80 7,055 199 3 22,463
Percent reporting birth weight % 96.3 87.7 92.3 86.3 96.8 94.0 66.7 93.6 Mean Grams 3,248.3 3,037.5 2,976.6 3,126.3 3,166.9 3,097.0 2,806.7 3,045.0
North Carolina
Infants in category Number 2,676 1,275 23,438 101 36,271 1,720 747 66,228
Percent reporting birth weight % 95.2 97.0 97.6 99.0 98.2 99.2 99.1 97.9 Mean Grams 3,260.5 3,166.3 3,111.5 3,344.4 3,287.3 3,275.3 3,221.7 3,221.0
South Carolina
Infants in category Number 88 292 16,023 50 16,900 1,772 0 35,125
Percent reporting birth weight % 92.0 88.0 94.6 88.0 93.2 94.2 N/A 93.8 Mean Grams 3,419.9 3,456.4 3,276.2 3,592.7 3,488.0 3,395.2 N/A 3,385.6
Tennessee
Infants in category Number 45 413 14,198 23 30,356 1,243 564 46,842
Percent reporting birth weight % 100.0 100.0 99.5 100.0 99.8 99.4 99.5 99.7 Mean Grams 3,280.4 3,181.6 3,066.7 3,040.8 3,239.4 3,196.2 3,240.8 3,185.5

WIC Participant and Program Characteristics: 2014 Final Report
Page F-10
Table F.4. (continued) Mean Birth Weight in Grams of WIC Infants by Race and State
Region and State
American Indian or
Alaska Native Only Asian Only
Black or African
American Only
Native Hawaiian or Pacific Islander
Only White Only
Two or More Races
Race Not Reportedb
Total WIC
Infants Southeast (continued)
Eastern Band Cherokee (NC)
Infants in category Number 135 0 a 0 a 0 11 146
Percent reporting birth weight % 98.5 N/A a N/A a N/A 100.0 98.6 Mean Grams 3,359.4 N/A a N/A a N/A 3,337.6 3,357.7
Mississippi Choctaw (MS)
Infants in category Number 176 0 a 0 a a 7 183
Percent reporting birth weight % 85.8 N/A a N/A a a 100.0 86.3 Mean Grams 3,293.1 N/A a N/A a a 3,223.8 3,290.0
Midwest
Illinois
Infants in category Number 219 2,111 22,114 409 48,885 2,062 6 75,806
Percent reporting birth weight % 100.0 99.0 98.8 99.3 99.1 98.6 100.0 99.0 Mean Grams 3,245.3 3,195.9 3,095.9 3,278.4 3,293.9 3,206.0 3,759.5 3,231.0
Indiana
Infants in category Number 117 960 8,555 62 32,022 2,562 478 44,756
Percent reporting birth weight % 99.1 98.9 98.6 100.0 99.1 98.8 14.4 98.1 Mean Grams 3,225.3 3,236.7 3,114.2 3,120.3 3,268.3 3,220.4 3,276.7 3,235.0
Michigan
Infants in category Number 255 1,037 18,232 49 36,184 5,457 308 61,522
Percent reporting birth weight % 97.6 98.1 98.5 93.9 98.2 98.8 31.8 98.0 Mean Grams 3,388.2 3,148.1 3,095.7 3,169.7 3,300.8 3,250.5 3,233.9 3,232.8
Minnesota
Infants in category Number 1,239 2,557 5,965 74 14,803 3,173 257 28,068
Percent reporting birth weight % 96.4 99.3 97.7 95.9 98.8 98.1 36.6 97.8 Mean Grams 3,378.9 3,173.8 3,242.5 3,324.9 3,360.7 3,314.3 3,367.9 3,313.8
Wisconsin
Infants in category Number 658 1,519 6,293 52 18,107 2,203 0 28,832
Percent reporting birth weight % 99.5 99.3 99.0 96.2 99.4 99.4 N/A 99.3 Mean Grams 3,399.3 3,188.8 3,091.3 3,293.1 3,289.4 3,240.8 N/A 3,239.8

WIC Participant and Program Characteristics: 2014 Final Report
Page F-11
Table F.4. (continued) Mean Birth Weight in Grams of WIC Infants by Race and State
Region and State
American Indian or
Alaska Native Only Asian Only
Black or African
American Only
Native Hawaiian or Pacific Islander
Only White Only
Two or More Races
Race Not Reportedb
Total WIC
Infants Southwest
Arkansas
Infants in category Number 82 192 6,370 241 16,134 547 297 23,863
Percent reporting birth weight % 95.1 99.0 98.3 93.8 98.4 96.2 16.5 97.3 Mean Grams 3,363.8 3,147.4 3,067.0 3,063.1 3,262.9 3,202.7 3,252.2 3,206.1
Louisiana
Infants in category Number 280 482 22,109 185 17,110 888 0 41,054
Percent reporting birth weight % 47.5 50.8 49.3 47.0 40.6 38.5 N/A 45.5 Mean Grams 3,182.9 3,096.1 2,910.8 3,123.4 3,080.4 3,002.4 N/A 2,980.9
Oklahoma
Infants in category Number 1,066 414 2,909 173 16,402 2,980 0 23,944
Percent reporting birth weight % 94.8 95.7 96.5 94.2 97.2 96.8 N/A 96.9 Mean Grams 3,319.7 3,182.4 3,072.4 3,136.6 3,264.3 3,211.7 N/A 3,234.6
Texas
Infants in category Number 3,809 4,157 37,491 309 189,290 8,991 30 244,077
Percent reporting birth weight % 99.0 98.0 97.6 97.7 98.4 97.4 96.7 98.2 Mean Grams 3,264.3 3,139.0 3,093.2 3,279.8 3,249.8 3,208.2 3,292.5 3,222.8
ACL (NM)
Infants in category Number 117 0 0 0 a 0 4 121
Percent reporting birth weight % 100.0 N/A N/A N/A a N/A 25.0 97.5 Mean Grams 3,217.8 N/A N/A N/A a N/A 2,750.0 3,213.9
Chickasaw Nation (OK)
Infants in category Number 326 0 18 0 394 269 56 1,063
Percent reporting birth weight % 98.5 N/A 94.4 N/A 95.7 98.9 55.4 95.2 Mean Grams 3,309.9 N/A 3,276.9 N/A 3,258.1 3,269.3 3,231.9 3,277.0
Choctaw Nation (OK)
Infants in category Number 150 a 21 a 293 429 36 929
Percent reporting birth weight % 99.3 a 100.0 a 94.9 96.0 61.1 94.9 Mean Grams 3,210.4 a 2,998.4 a 3,206.1 3,323.5 3,143.0 3,255.1
Citizen Potawatomi (OK)
Infants in category Number 39 a 17 0 66 33 197 352
Percent reporting birth weight % 92.3 a 100.0 N/A 95.5 84.8 47.2 67.3 Mean Grams 3,472.9 a 2,820.0 N/A 3,295.4 3,452.6 3,241.3 3,285.6
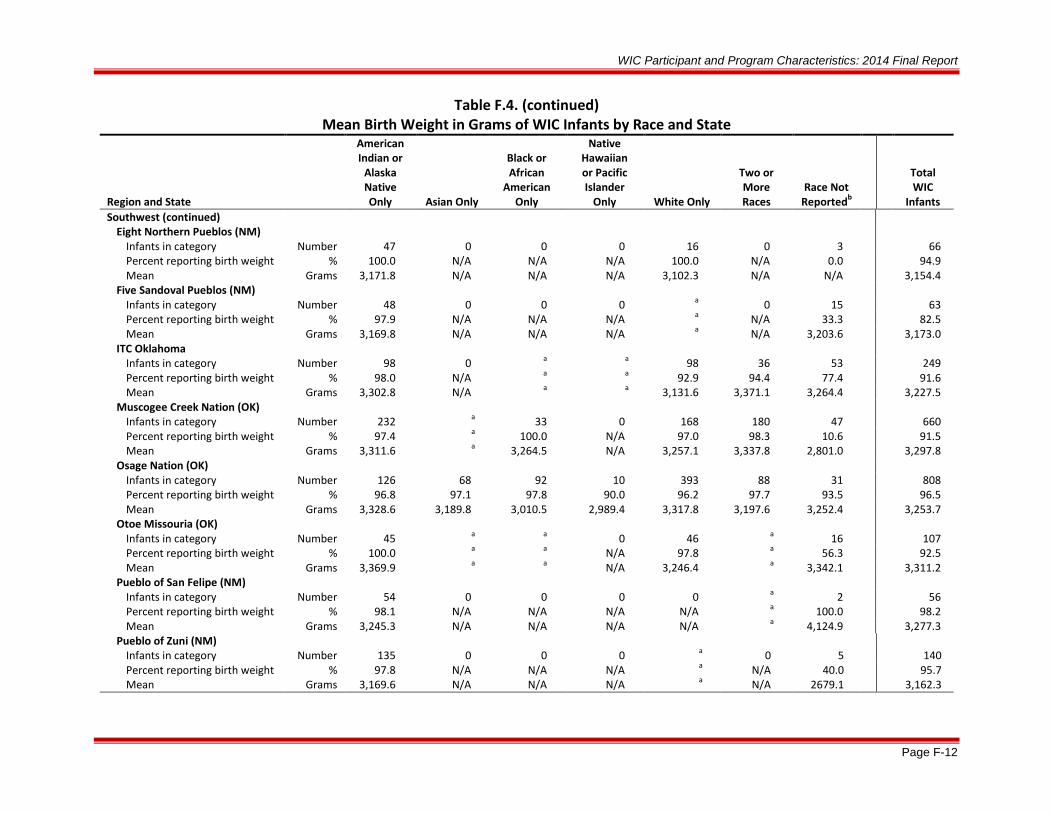
WIC Participant and Program Characteristics: 2014 Final Report
Page F-12
Table F.4. (continued) Mean Birth Weight in Grams of WIC Infants by Race and State
Region and State
American Indian or
Alaska Native Only Asian Only
Black or African
American Only
Native Hawaiian or Pacific Islander
Only White Only
Two or More Races
Race Not Reportedb
Total WIC
Infants Southwest (continued)
Eight Northern Pueblos (NM)
Infants in category Number 47 0 0 0 16 0 3 66
Percent reporting birth weight % 100.0 N/A N/A N/A 100.0 N/A 0.0 94.9 Mean Grams 3,171.8 N/A N/A N/A 3,102.3 N/A N/A 3,154.4
Five Sandoval Pueblos (NM)
Infants in category Number 48 0 0 0 a 0 15 63
Percent reporting birth weight % 97.9 N/A N/A N/A a N/A 33.3 82.5 Mean Grams 3,169.8 N/A N/A N/A a N/A 3,203.6 3,173.0
ITC Oklahoma
Infants in category Number 98 0 a a 98 36 53 249
Percent reporting birth weight % 98.0 N/A a a 92.9 94.4 77.4 91.6 Mean Grams 3,302.8 N/A a a 3,131.6 3,371.1 3,264.4 3,227.5
Muscogee Creek Nation (OK)
Infants in category Number 232 a 33 0 168 180 47 660
Percent reporting birth weight % 97.4 a 100.0 N/A 97.0 98.3 10.6 91.5 Mean Grams 3,311.6 a 3,264.5 N/A 3,257.1 3,337.8 2,801.0 3,297.8
Osage Nation (OK)
Infants in category Number 126 68 92 10 393 88 31 808
Percent reporting birth weight % 96.8 97.1 97.8 90.0 96.2 97.7 93.5 96.5 Mean Grams 3,328.6 3,189.8 3,010.5 2,989.4 3,317.8 3,197.6 3,252.4 3,253.7
Otoe Missouria (OK)
Infants in category Number 45 a a 0 46 a 16 107
Percent reporting birth weight % 100.0 a a N/A 97.8 a 56.3 92.5 Mean Grams 3,369.9 a a N/A 3,246.4 a 3,342.1 3,311.2
Pueblo of San Felipe (NM)
Infants in category Number 54 0 0 0 0 a 2 56
Percent reporting birth weight % 98.1 N/A N/A N/A N/A a 100.0 98.2 Mean Grams 3,245.3 N/A N/A N/A N/A a 4,124.9 3,277.3
Pueblo of Zuni (NM)
Infants in category Number 135 0 0 0 a 0 5 140
Percent reporting birth weight % 97.8 N/A N/A N/A a N/A 40.0 95.7 Mean Grams 3,169.6 N/A N/A N/A a N/A 2679.1 3,162.3

WIC Participant and Program Characteristics: 2014 Final Report
Page F-13
Table F.4. (continued) Mean Birth Weight in Grams of WIC Infants by Race and State
Region and State
American Indian or
Alaska Native Only Asian Only
Black or African
American Only
Native Hawaiian or Pacific Islander
Only White Only
Two or More Races
Race Not Reportedb
Total WIC
Infants Southwest (continued)
Santo Domingo (NM)
Infants in category Number 37 0 0 0 0 0 0 37
Percent reporting birth weight % 94.6 N/A N/A N/A N/A N/A N/A 94.6 Mean Grams 3,244.1 N/A N/A N/A N/A N/A N/A 3,244.1
WCD (OK)
Infants in category Number 296 a 58 87 300 136 16 893
Percent reporting birth weight % 99.0 a 98.3 98.9 98.0 97.8 56.3 97.6 Mean Grams 3,432.1 a 3,080.7 3,244.8 3,320.1 3,378.8 3,279.2 3,343.2
Mountain Plains
Colorado
Infants in category Number 5,467 538 1,929 177 13,417 1,910 9 23,447
Percent reporting birth weight % 99.3 98.7 98.9 98.3 99.2 99.2 100.0 99.2 Mean Grams 3,199.8 3,077.2 3,089.2 3,152.9 3,168.8 3,125.4 3,298.1 3,163.8
Iowa
Infants in category Number 117 439 1,760 68 14,075 1,267 150 17,876
Percent reporting birth weight % 96.6 97.0 95.8 97.1 98.2 98.3 5.3 97.2 Mean Grams 3,432.9 3,189.0 3,158.5 3,335.4 3,307.6 3,239.4 2,902.3 3,286.1
Kansas
Infants in category Number 611 420 2,078 41 13,112 1,733 0 17,995
Percent reporting birth weight % 96.4 92.1 94.9 85.4 95.6 96.3 N/A 95.5 Mean Grams 3,338.5 3,157.0 3,080.1 3,270.0 3,280.6 3,242.1 N/A 3,253.0
Missouri
Infants in category Number 36 422 9,231 182 24,765 2,446 0 37,082
Percent reporting birth weight % 94.4 97.4 97.8 96.2 97.8 97.5 N/A 97.7 Mean Grams 3,266.9 3,247.5 3,086.7 3,231.1 3,275.9 3,247.4 N/A 3,226.4
Montana
Infants in category Number 1,092 17 39 10 3,334 306 28 4,826
Percent reporting birth weight % 97.3 100.0 97.4 80.0 98.6 98.0 60.7 98.0 Mean Grams 3,319.5 3,301.9 3,048.4 3,270.9 3,246.1 3,252.4 3,328.6 3,261.9
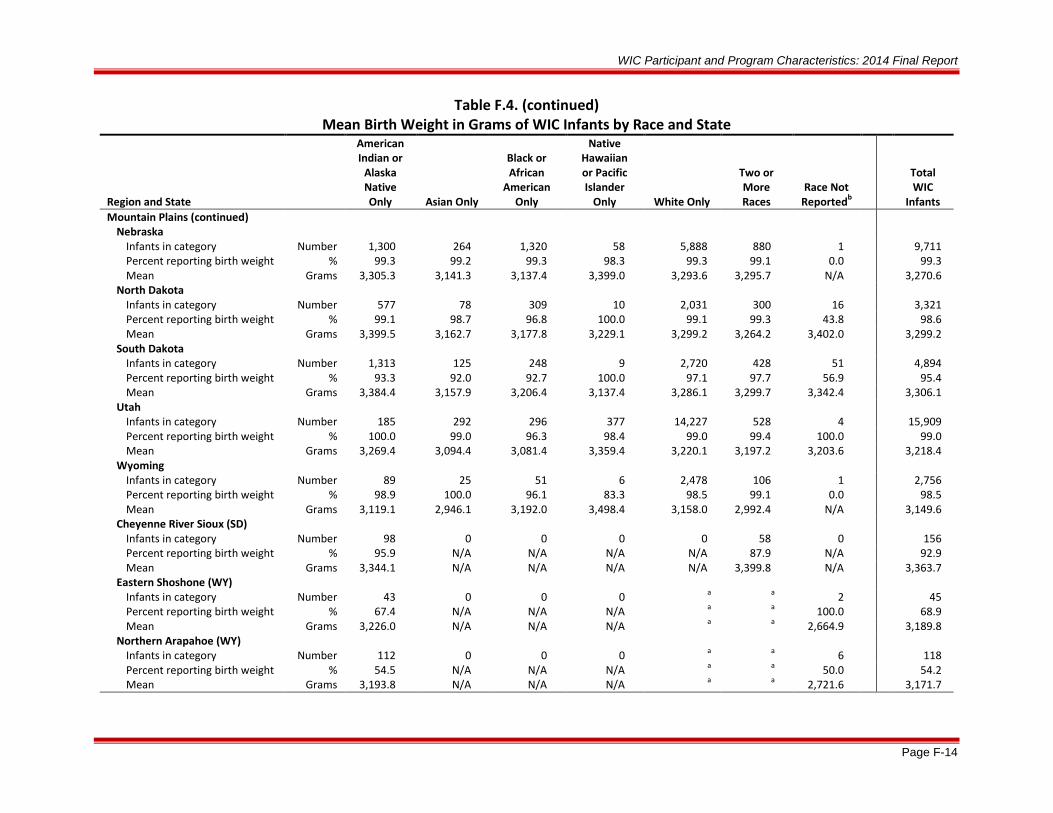
WIC Participant and Program Characteristics: 2014 Final Report
Page F-14
Table F.4. (continued) Mean Birth Weight in Grams of WIC Infants by Race and State
Region and State
American Indian or
Alaska Native Only Asian Only
Black or African
American Only
Native Hawaiian or Pacific Islander
Only White Only
Two or More Races
Race Not Reportedb
Total WIC
Infants Mountain Plains (continued)
Nebraska
Infants in category Number 1,300 264 1,320 58 5,888 880 1 9,711
Percent reporting birth weight % 99.3 99.2 99.3 98.3 99.3 99.1 0.0 99.3 Mean Grams 3,305.3 3,141.3 3,137.4 3,399.0 3,293.6 3,295.7 N/A 3,270.6
North Dakota
Infants in category Number 577 78 309 10 2,031 300 16 3,321
Percent reporting birth weight % 99.1 98.7 96.8 100.0 99.1 99.3 43.8 98.6 Mean Grams 3,399.5 3,162.7 3,177.8 3,229.1 3,299.2 3,264.2 3,402.0 3,299.2
South Dakota
Infants in category Number 1,313 125 248 9 2,720 428 51 4,894
Percent reporting birth weight % 93.3 92.0 92.7 100.0 97.1 97.7 56.9 95.4 Mean Grams 3,384.4 3,157.9 3,206.4 3,137.4 3,286.1 3,299.7 3,342.4 3,306.1
Utah
Infants in category Number 185 292 296 377 14,227 528 4 15,909
Percent reporting birth weight % 100.0 99.0 96.3 98.4 99.0 99.4 100.0 99.0 Mean Grams 3,269.4 3,094.4 3,081.4 3,359.4 3,220.1 3,197.2 3,203.6 3,218.4
Wyoming
Infants in category Number 89 25 51 6 2,478 106 1 2,756
Percent reporting birth weight % 98.9 100.0 96.1 83.3 98.5 99.1 0.0 98.5 Mean Grams 3,119.1 2,946.1 3,192.0 3,498.4 3,158.0 2,992.4 N/A 3,149.6
Cheyenne River Sioux (SD)
Infants in category Number 98 0 0 0 0 58 0 156
Percent reporting birth weight % 95.9 N/A N/A N/A N/A 87.9 N/A 92.9 Mean Grams 3,344.1 N/A N/A N/A N/A 3,399.8 N/A 3,363.7
Eastern Shoshone (WY)
Infants in category Number 43 0 0 0 a a 2 45
Percent reporting birth weight % 67.4 N/A N/A N/A a a 100.0 68.9 Mean Grams 3,226.0 N/A N/A N/A a a 2,664.9 3,189.8
Northern Arapahoe (WY)
Infants in category Number 112 0 0 0 a a 6 118
Percent reporting birth weight % 54.5 N/A N/A N/A a a 50.0 54.2 Mean Grams 3,193.8 N/A N/A N/A a a 2,721.6 3,171.7

WIC Participant and Program Characteristics: 2014 Final Report
Page F-15
Table F.4. (continued) Mean Birth Weight in Grams of WIC Infants by Race and State
Region and State
American Indian or
Alaska Native Only Asian Only
Black or African
American Only
Native Hawaiian or Pacific Islander
Only White Only
Two or More Races
Race Not Reportedb
Total WIC
Infants Mountain Plains (continued)
Omaha Nation (NE)
Infants in category Number 63 a a a a a 3 66
Percent reporting birth weight % 69.8 a a a a a 100.0 71.2 Mean Grams 3,518.0 a a a a a 2,948.4 3,481.6
Rosebud Sioux (SD)
Infants in category Number 264 0 0 0 a a 9 273
Percent reporting birth weight % 96.6 N/A N/A N/A a a 100.0 96.7 Mean Grams 3,362.9 N/A N/A N/A a a 3,200.4 3,357.3
Santee Sioux (NE)
Infants in category Number 27 a a a a a 3 30
Percent reporting birth weight % 85.2 a a a a a 100.0 86.7 Mean Grams 3,421.7 a a a a a 3,628.8 3,445.6
Standing Rock Sioux (ND)
Infants in category Number 162 0 0 0 a 6 3 171
Percent reporting birth weight % 89.5 N/A N/A N/A a 100.0 100.0 90.1 Mean Grams 3,376.2 N/A N/A N/A a 3,534.3 3,326.4 3,381.4
Three Affiliated (ND)
Infants in category Number 73 0 0 0 a 9 5 87
Percent reporting birth weight % 82.2 N/A N/A N/A a 77.8 100.0 82.8 Mean Grams 3,553.2 N/A N/A N/A a 3,904.2 3,197.9 3,562.7
Winnebago (NE)
Infants in category Number 74 0 a 0 0 a 2 76
Percent reporting birth weight % 41.9 N/A a N/A N/A a 50.0 42.1 Mean Grams 3,303.2 N/A a N/A N/A a 3,175.2 3,299.2
Western
Alaska
Infants in category Number 1,343 322 211 201 1,922 727 62 4,788 Percent reporting birth weight % 80.5 90.1 93.8 86.6 88.2 85.7 33.9 85.3 Mean Grams 3,409.9 3,168.7 3,297.2 3,523.2 3,393.1 3,379.7 3,404.7 3,380.5
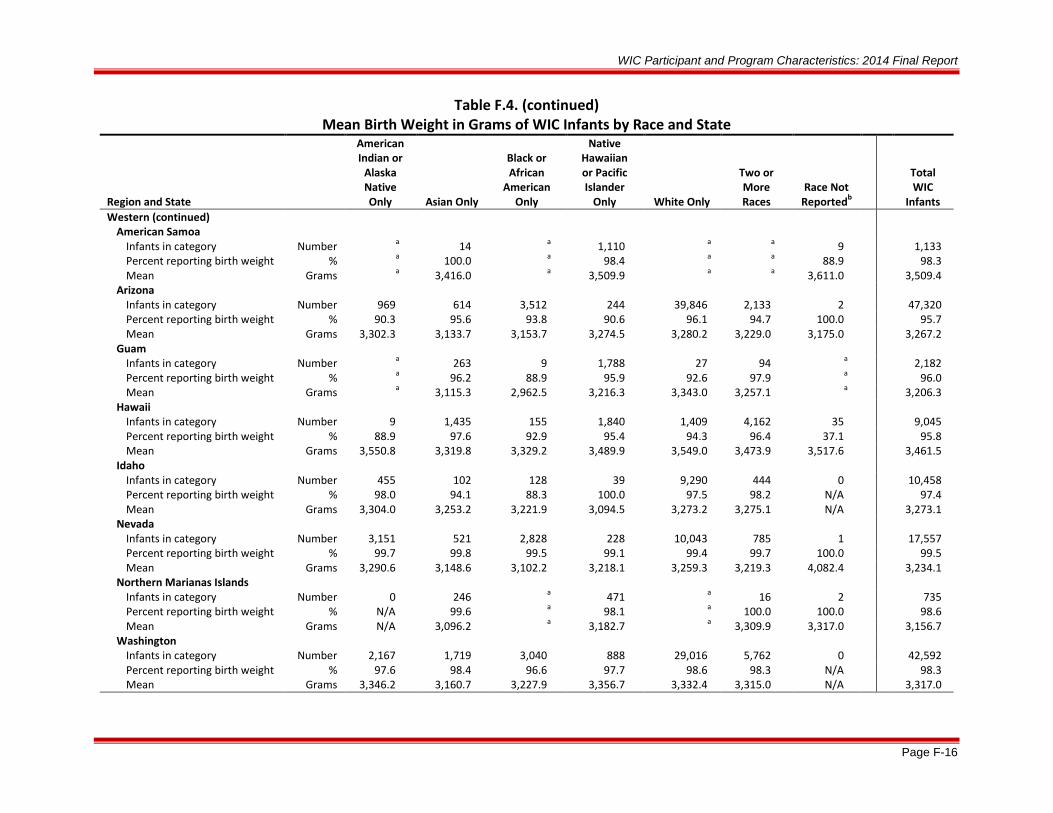
WIC Participant and Program Characteristics: 2014 Final Report
Page F-16
Table F.4. (continued) Mean Birth Weight in Grams of WIC Infants by Race and State
Region and State
American Indian or
Alaska Native Only Asian Only
Black or African
American Only
Native Hawaiian or Pacific Islander
Only White Only
Two or More Races
Race Not Reportedb
Total WIC
Infants Western (continued)
American Samoa
Infants in category Number a 14 a 1,110 a a 9 1,133
Percent reporting birth weight % a 100.0 a 98.4 a a 88.9 98.3 Mean Grams a 3,416.0 a 3,509.9 a a 3,611.0 3,509.4
Arizona
Infants in category Number 969 614 3,512 244 39,846 2,133 2 47,320
Percent reporting birth weight % 90.3 95.6 93.8 90.6 96.1 94.7 100.0 95.7 Mean Grams 3,302.3 3,133.7 3,153.7 3,274.5 3,280.2 3,229.0 3,175.0 3,267.2
Guam
Infants in category Number a 263 9 1,788 27 94 a 2,182
Percent reporting birth weight % a 96.2 88.9 95.9 92.6 97.9 a 96.0 Mean Grams a 3,115.3 2,962.5 3,216.3 3,343.0 3,257.1 a 3,206.3
Hawaii
Infants in category Number 9 1,435 155 1,840 1,409 4,162 35 9,045
Percent reporting birth weight % 88.9 97.6 92.9 95.4 94.3 96.4 37.1 95.8 Mean Grams 3,550.8 3,319.8 3,329.2 3,489.9 3,549.0 3,473.9 3,517.6 3,461.5
Idaho
Infants in category Number 455 102 128 39 9,290 444 0 10,458
Percent reporting birth weight % 98.0 94.1 88.3 100.0 97.5 98.2 N/A 97.4 Mean Grams 3,304.0 3,253.2 3,221.9 3,094.5 3,273.2 3,275.1 N/A 3,273.1
Nevada
Infants in category Number 3,151 521 2,828 228 10,043 785 1 17,557
Percent reporting birth weight % 99.7 99.8 99.5 99.1 99.4 99.7 100.0 99.5 Mean Grams 3,290.6 3,148.6 3,102.2 3,218.1 3,259.3 3,219.3 4,082.4 3,234.1
Northern Marianas Islands
Infants in category Number 0 246 a 471 a 16 2 735
Percent reporting birth weight % N/A 99.6 a 98.1 a 100.0 100.0 98.6 Mean Grams N/A 3,096.2 a 3,182.7 a 3,309.9 3,317.0 3,156.7
Washington
Infants in category Number 2,167 1,719 3,040 888 29,016 5,762 0 42,592
Percent reporting birth weight % 97.6 98.4 96.6 97.7 98.6 98.3 N/A 98.3 Mean Grams 3,346.2 3,160.7 3,227.9 3,356.7 3,332.4 3,315.0 N/A 3,317.0

WIC Participant and Program Characteristics: 2014 Final Report
Page F-17
Table F.4. (continued) Mean Birth Weight in Grams of WIC Infants by Race and State
Region and State
American Indian or
Alaska Native Only Asian Only
Black or African
American Only
Native Hawaiian or Pacific Islander
Only White Only
Two or More Races
Race Not Reportedb
Total WIC
Infants Western (continued)
ITC Arizona (AZ)
Infants in category Number 1,974 a 34 0 337 317 5 2,667
Percent reporting birth weight % 94.5 a 82.4 N/A 91.4 95.6 80.0 94.1 Mean Grams 3,328.1 a 3,071.9 N/A 3,297.2 3,335.3 3,203.6 3,322.1
ITC Nevada (NV)
Infants in category Number 68 a 6 a 235 19 5 333
Percent reporting birth weight % 100.0 a 100.0 a 99.6 100.0 100.0 99.7 Mean Grams 3,207.3 a 3,071.3 a 3,229.7 3,388.6 3,209.3 3,231.0
Navajo Nation (AZ)
Infants in category Number 2,412 a a a 40 65 8 2,525
Percent reporting birth weight % 96.7 a a a 92.5 95.4 62.5 96.5 Mean Grams 3,281.1 a a a 3,142.1 3,285.3 3084.4 3,278.7
Notes
An infant is defined as a participant who at certification is younger than 1 year of age and who would be classified as a child at the age of 366 days.
Table includes those State agencies who provided valid data for at least 5 % of the target population for this tabulation. Not all State agencies listed in table F.1 reported valid data for all SDS variables.
N/A indicates either not applicable or not available. a Data not reported due to small cell size. b Includes categories with cell sizes too small to be reported separately.

WIC Participant and Program Characteristics: 2014 Final Report
Page F-18
Table F.5. Mean Birth Weight in Grams of WIC Infants by Ethnicity and State
Region and State
Hispanic/Latino Not
Hispanic/Latino Ethnicity
Not Reportedb Total
WIC Infants Northeast
Connecticut Infants in category Number 7,010 7,515 0 14,525
Percent reporting birth weight % 98.2 98.7 N/A 98.5 Mean Grams 3,255.7 3,228.0 N/A 3,241.3
Maine Infants in category Number 206 5,148 30 5,384
Percent reporting birth weight % 97.6 98.3 46.7 98.0 Mean Grams 3,284.2 3,297.5 3,264.3 3,296.9
Massachusetts Infants in category Number 12,653 20,200 0 32,853
Percent reporting birth weight % 99.1 99.2 N/A 99.2 Mean Grams 3,260.4 3,263.0 N/A 3,262.0
New Hampshire Infants in category Number 598 3,641 0 4,239
Percent reporting birth weight % 89.0 88.0 N/A 88.1 Mean Grams 3,292.9 3,325.3 N/A 3,320.7
Rhode Island Infants in category Number 2,618 3,771 32 6,421
Percent reporting birth weight % 98.9 98.6 6.3 98.3 Mean Grams 3,279.9 3,252.6 3,798.9 3,264.0
Vermont Infants in category Number 40 2,780 0 2,820
Percent reporting birth weight % 100.0 98.4 N/A 98.4 Mean Grams 3,210.6 3,313.9 N/A 3,312.4
Indian Township (ME) Infants in category Number 0 12 0 12
Percent reporting birth weight % N/A 25.0 N/A 25.0 Mean Grams N/A 2,835.0 N/A 2,835.0
Seneca Nation (NY) Infants in category Number a 55 a 56
Percent reporting birth weight % a 56.4 a 55.4 Mean Grams a 3,281.3 a 3,281.3
Mid-Atlantic
Delaware Infants in category Number 1,443 4,863 0 6,306
Percent reporting birth weight % 95.5 90.9 N/A 91.9 Mean Grams 3,304.4 3,193.1 N/A 3,219.5
District of Columbia Infants in category Number 936 3,962 34 4,932
Percent reporting birth weight % 98.9 98.4 26.5 98.0 Mean Grams 3,263.9 3,142.9 3,096.5 3,166.0
Maryland Infants in category Number 10,040 28,546 0 38,586
Percent reporting birth weight % 98.5 98.4 N/A 98.4 Mean Grams 3,280.2 3,190.1 N/A 3,213.6
New Jersey Infants in category Number 18,455 19,843 42 38,340
Percent reporting birth weight % 97.4 97.5 69.0 97.4 Mean Grams 3,268.1 3,218.6 3,187.9 3,242.4

WIC Participant and Program Characteristics: 2014 Final Report
Page F-19
Table F.5. (continued) Mean Birth Weight in Grams of WIC Infants by Ethnicity and State
Region and State Hispanic/Latino Not
Hispanic/Latino Ethnicity
Not Reportedb Total
WIC Infants Mid-Atlantic (continued)
Pennsylvania Infants in category Number 12,606 50,162 0 62,768
Percent reporting birth weight % 99.5 99.5 N/A 99.5 Mean Grams 3,227.2 3,201.9 N/A 3,207.0
Virgin Islands Infants in category Number 229 838 0 1,067
Percent reporting birth weight % 97.8 98.2 N/A 98.1 Mean Grams 3,190.5 3,160.0 N/A 3,166.5
West Virginia Infants in category Number 335 11,871 0 12,206
Percent reporting birth weight % 93.4 96.7 N/A 96.6 Mean Grams 3,264.5 3,201.5 N/A 3,203.2
Southeast
Florida Infants in category Number 50,538 82,544 0 133,082
Percent reporting birth weight % 99.0 98.7 N/A 98.8 Mean Grams 3,272.4 3,186.3 N/A 3,219.1
Georgia Infants in category Number 13,299 60,285 10 73,594
Percent reporting birth weight % 97.2 96.3 90.0 96.4 Mean Grams 3,300.4 3,155.3 3,263.4 3,181.7
Mississippi Infants in category Number 830 21,630 3 22,463
Percent reporting birth weight % 96.1 93.5 66.7 93.6 Mean Grams 3,268.4 3,036.2 2,806.7 3,045.0
North Carolina Infants in category Number 12,540 53,688 0 66,228
Percent reporting birth weight % 97.8 97.9 N/A 97.9 Mean Grams 3,309.6 3,200.3 N/A 3,221.0
South Carolina Infants in category Number 4,158 30,967 0 35,125
Percent reporting birth weight % 92.2 94.1 N/A 93.8 Mean Grams 3,523.1 3,367.5 N/A 3,385.6
Tennessee Infants in category Number 5,500 41,342 0 46,842
Percent reporting birth weight % 99.9 99.6 N/A 99.7 Mean Grams 3,300.1 3,170.2 N/A 3,185.5
Eastern Band Cherokee (NC) Infants in category Number 0 146 0 146
Percent reporting birth weight % N/A 98.6 N/A 98.6 Mean Grams N/A 3,357.7 N/A 3,357.7
Mississippi Choctaw (MS) Infants in category Number 0 183 0 183
Percent reporting birth weight % N/A 86.3 N/A 86.3 Mean Grams N/A 3,290.0 N/A 3,290.0
Midwest
Illinois Infants in category Number 26,307 49,493 6 75,806
Percent reporting birth weight % 99.3 98.9 100.0 99.0 Mean Grams 3,301.0 3,193.6 3,759.5 3,231.0

WIC Participant and Program Characteristics: 2014 Final Report
Page F-20
Table F.5. (continued) Mean Birth Weight in Grams of WIC Infants by Ethnicity and State
Region and State Hispanic/Latino Not
Hispanic/Latino Ethnicity
Not Reportedb Total
WIC Infants Midwest (continued)
Indiana Infants in category Number 6,929 37,349 478 44,756
Percent reporting birth weight % 99.1 99.0 14.4 98.1 Mean Grams 3,299.5 3,222.9 3,276.7 3,235.0
Michigan Infants in category Number 7,254 54,268 0 61,522
Percent reporting birth weight % 98.4 98.0 N/A 98.0 Mean Grams 3,303.2 3,223.3 N/A 3,232.8
Minnesota Infants in category Number 4,612 23,199 257 28,068
Percent reporting birth weight % 98.7 98.3 36.6 97.8 Mean Grams 3,348.4 3,306.6 3,367.9 3,313.8
Wisconsin Infants in category Number 6,514 22,318 0 28,832
Percent reporting birth weight % 99.4 99.2 N/A 99.3 Mean Grams 3,293.5 3,224.1 N/A 3,239.8
Southwest
Arkansas Infants in category Number 3,439 20,127 297 23,863
Percent reporting birth weight % 98.6 98.2 16.5 97.3 Mean Grams 3,286.1 3,192.3 3,252.2 3,206.1
Louisiana Infants in category Number 3,336 37,718 0 41,054
Percent reporting birth weight % 50.1 45.0 N/A 45.5 Mean Grams 3,121.0 2,967.2 N/A 2,980.9
Oklahoma Infants in category Number 6,304 17,640 0 23,944
Percent reporting birth weight % 97.1 96.8 N/A 96.9 Mean Grams 3,275.8 3,219.9 N/A 3,234.6
Texas Infants in category Number 162,939 81,108 30 244,077
Percent reporting birth weight % 98.7 97.3 96.7 98.2 Mean Grams 3,245.8 3,175.8 3,292.5 3,222.8
ACL (NM) Infants in category Number a 117 4 121
Percent reporting birth weight % a 100.0 25.0 97.5 Mean Grams a 3,217.8 2,750.0 3,213.9
Chickasaw Nation (OK) Infants in category Number 96 911 56 1,063
Percent reporting birth weight % 97.9 97.4 55.4 95.2 Mean Grams 3,292.5 3,276.9 3,231.9 3,277.0
Choctaw Nation (OK) Infants in category Number 57 839 33 929
Percent reporting birth weight % 96.5 96.3 57.6 94.9 Mean Grams 3,390.1 3,247.9 3,170.7 3,255.1
Citizen Potawatomi (OK) Infants in category Number 28 129 195 352
Percent reporting birth weight % 92.9 92.2 47.2 67.3 Mean Grams 3,163.2 3,344.6 3,243.9 3,285.6

WIC Participant and Program Characteristics: 2014 Final Report
Page F-21
Table F.5. (continued) Mean Birth Weight in Grams of WIC Infants by Ethnicity and State
Region and State Hispanic/Latino Not
Hispanic/Latino Ethnicity
Not Reportedb Total
WIC Infants Southwest (continued)
Eight Northern Pueblos (NM) Infants in category Number 13 49 3 66
Percent reporting birth weight % 100.0 100.0 0.0 94.9 Mean Grams 3,021.6 3,190.7 N/A 3,154.4
Five Sandoval Pueblos (NM) Infants in category Number a 47 16 63
Percent reporting birth weight % a 100.0 31.3 82.5 Mean Grams a 3,172.8 3,175.2 3,173.0
ITC Oklahoma Infants in category Number 26 214 9 249
Percent reporting birth weight % 96.2 94.9 0.0 91.6 Mean Grams 3,089.0 3,244.6 N/A 3,227.5
Muscogee Creek Nation (OK) Infants in category Number 28 587 45 660
Percent reporting birth weight % 89.3 98.1 6.7 91.5 Mean Grams 3,421.3 3,293.7 3,042.9 3,297.8
Osage Nation (OK) Infants in category Number 205 572 31 808
Percent reporting birth weight % 94.6 97.4 93.5 96.5 Mean Grams 3,303.1 3,236.6 3,252.4 3,253.7
Otoe Missouria Infants in category Number 8 90 9 107
Percent reporting birth weight % 100.0 97.8 33.3 92.5 Mean Grams 3,033.5 3,346.9 3,005.1 3,311.2
Pueblo of San Felipe Infants in category Number a 55 a 56
Percent reporting birth weight % a 98.2 a 98.2 Mean Grams a 3,279.7 a 3,277.3
Pueblo of Zuni Infants in category Number 0 136 4 140
Percent reporting birth weight % N/A 97.8 25.0 95.7 Mean Grams N/A 3,167.5 2,466.5 3,162.3
Santo Domingo Infants in category Number 0 37 0 37
Percent reporting birth weight % N/A 94.6 N/A 94.6 Mean Grams N/A 3,244.1 N/A 3,244.1
WCD (OK) Infants in category Number 267 614 12 893
Percent reporting birth weight % 98.5 98.4 41.7 97.6 Mean Grams 3,340.7 3,344.5 3,311.3 3,343.2
Mountain Plains
Colorado Infants in category Number 12,665 10,782 0 23,447
Percent reporting birth weight % 99.4 98.9 N/A 99.2 Mean Grams 3,183.4 3,140.7 N/A 3,163.8
Iowa Infants in category Number 3,359 14,517 0 17,876
Percent reporting birth weight % 97.9 97.0 N/A 97.2 Mean Grams 3,311.9 3,280.0 N/A 3,286.1

WIC Participant and Program Characteristics: 2014 Final Report
Page F-22
Table F.5. (continued) Mean Birth Weight in Grams of WIC Infants by Ethnicity and State
Region and State Hispanic/Latino Not
Hispanic/Latino Ethnicity
Not Reportedb Total
WIC Infants Mountain Plains (continued)
Kansas Infants in category Number 5,709 12,286 0 17,995
Percent reporting birth weight % 95.8 95.3 N/A 95.5 Mean Grams 3,299.7 3,231.2 N/A 3,253.0
Missouri Infants in category Number 3,437 33,645 0 37,082
Percent reporting birth weight % 97.2 97.8 N/A 97.7 Mean Grams 3,291.5 3,219.8 N/A 3,226.4
Montana Infants in category Number 331 4,467 28 4,826
Percent reporting birth weight % 97.9 98.3 60.7 98.0 Mean Grams 3,269.9 3,261.1 3,328.6 3,261.9
Nebraska Infants in category Number 3,297 6,413 1 9,711
Percent reporting birth weight % 99.5 99.2 N/A 99.3 Mean Grams 3,302.4 3,254.2 N/A 3,270.6
North Dakota Infants in category Number 358 2,963 0 3,321
Percent reporting birth weight % 98.3 98.7 N/A 98.6 Mean Grams 3,281.3 3,301.4 N/A 3,299.2
South Dakota Infants in category Number 487 4,407 0 4,894
Percent reporting birth weight % 95.7 95.3 N/A 95.4 Mean Grams 3,280.1 3,309.0 N/A 3,306.1
Utah Infants in category Number 5,935 9,974 0 15,909
Percent reporting birth weight % 99.0 99.0 N/A 99.0 Mean Grams 3,202.4 3,227.9 N/A 3,218.4
Wyoming Infants in category Number 731 2,025 0 2,756
Percent reporting birth weight % 98.5 98.5 N/A 98.5 Mean Grams 3,158.0 3,146.6 N/A 3,149.6
Cheyenne River Sioux (SD) Infants in category Number a 155 a 156
Percent reporting birth weight % a 92.9 a 92.9 Mean Grams a 3,362.6 a 3,363.7
Eastern Shoshone (WY) Infants in category Number 0 45 0 45
Percent reporting birth weight % N/A 68.9 N/A 68.9 Mean Grams N/A 3,189.8 N/A 3,189.8
Northern Arapahoe (WY) Infants in category Number a 113 5 118
Percent reporting birth weight % a 54.0 60.0 54.2 Mean Grams a 3,173.3 3,137.4 3,171.7
Omaha Nation (NE) Infants in category Number 0 66 0 66
Percent reporting birth weight % N/A 71.2 N/A 71.2 Mean Grams N/A 3,481.6 N/A 3,481.6
Rosebud Sioux (SD) Infants in category Number a 270 3 273
Percent reporting birth weight % a 96.7 100.0 96.7 Mean Grams a 3,360.7 3,061.8 3,357.3

WIC Participant and Program Characteristics: 2014 Final Report
Page F-23
Table F.5. (continued) Mean Birth Weight in Grams of WIC Infants by Ethnicity and State
Region and State Hispanic/Latino Not
Hispanic/Latino Ethnicity
Not Reportedb Total
WIC Infants Mountain Plains (continued)
Santee Sioux (NE) Infants in category Number 0 30 0 30
Percent reporting birth weight % N/A 86.7 N/A 86.7 Mean Grams N/A 3,445.6 N/A 3,445.6
Standing Rock Sioux (NE) Infants in category Number a 170 1 171
Percent reporting birth weight % a 90.0 100.0 90.1 Mean Grams a 3,385.7 2,721.6 3,381.4
Three Affiliated (ND) Infants in category Number a 84 3 87
Percent reporting birth weight % a 83.3 66.7 82.8 Mean Grams a 3,565.6 3,458.7 3,562.7
Winnebago (NE) Infants in category Number a 73 3 76
Percent reporting birth weight % a 42.5 33.3 42.1 Mean Grams a 3,303.2 3,175.2 3,299.2
Western
Alaska Infants in category Number 472 4,254 62 4,788
Percent reporting birth weight % 87.7 85.8 33.9 85.3 Mean Grams 3,356.7 3,383.1 3,404.7 3,380.5
American Samoa Infants in category Number 8 1,125 0 1,133
Percent reporting birth weight % 100.0 98.3 N/A 98.3 Mean Grams 3,341.6 3,510.7 N/A 3,509.4
Arizona Infants in category Number 29,100 18,218 2 47,320
Percent reporting birth weight % 96.8 94.0 100.0 95.7 Mean Grams 3,282.3 3,242.5 3,175.0 3,267.2
Guam Infants in category Number 8 2,174 0 2,182
Percent reporting birth weight % 100.0 96.0 N/A 96.0 Mean Grams 3,561.4 3,204.9 N/A 3,206.3
Hawaii Infants in category Number 1,661 7,349 35 9,045
Percent reporting birth weight % 96.1 96.0 37.1 95.8 Mean Grams 3,467.8 3,459.9 3,517.6 3,461.5
Idaho Infants in category Number 3,274 7,184 0 10,458
Percent reporting birth weight % 97.3 97.5 N/A 97.4 Mean Grams 3,265.8 3,276.5 N/A 3,273.1
Nevada Infants in category Number 8,772 8,785 0 17,557
Percent reporting birth weight % 99.5 99.5 N/A 99.5 Mean Grams 3,272.8 3,195.3 N/A 3,234.1
Northern Mariana Islands Infants in category Number a 734 1 735
Percent reporting birth weight % a 98.6 100.0 98.6 Mean Grams a 3,157.1 2,863.0 3,156.7

WIC Participant and Program Characteristics: 2014 Final Report
Page F-24
Table F.5. (continued) Mean Birth Weight in Grams of WIC Infants by Ethnicity and State
Region and State Hispanic/Latino Not
Hispanic/Latino Ethnicity
Not Reportedb Total
WIC Infants Western (continued)
Washington Infants in category Number 15,246 27,346 0 42,592
Percent reporting birth weight % 98.7 98.1 N/A 98.3 Mean Grams 3,317.7 3,316.6 N/A 3,317.0
ITC Arizona (AZ) Infants in category Number 842 1,825 0 2,667
Percent reporting birth weight % 93.0 94.6 N/A 94.1 Mean Grams 3,341.3 3,313.4 N/A 3,322.1
ITC Nevada (NV) Infants in category Number 143 190 0 333
Percent reporting birth weight % 100.0 99.5 N/A 99.7 Mean Grams 3,254.9 3,213.0 N/A 3,231.0
Navajo Nation (AZ) Infants in category Number 104 2,421 0 2,525
Percent reporting birth weight % 91.3 96.7 N/A 96.5 Mean Grams 3,287.0 3,278.4 N/A 3,278.7
Notes
An infant is defined as a participant who at certification is younger than 1 year of age and who would be classified as a child at the age of 366 days.
Table includes those State agencies who provided valid data for at least 5% of the target population for this tabulation. Not all State agencies listed in table F.1 reported valid data for all SDS variables.
N/A indicates either not applicable or not available. a Data not reported due to small cell size. b Includes categories with cell sizes too small to be reported separately.

WIC Participant and Program Characteristics: 2014 Final Report
Page F-25
Table F.6. Mean Birth Weight in Grams of WIC Children by Race and State
Region and State
American Indian or
Alaska Native Only Asian Only
Black or African
American Only
Native Hawaiian or Pacific Islander
Only White Only Two or
More Races Race Not
Reportedb
Total WIC
Children Northeast
Connecticut
Children in category Number 1,387 839 7,533 430 20,627 1,360 2 32,178
Percent reporting birth weight % 94.2 90.9 93.6 85.6 93.1 92.6 0.0 93.1 Mean Grams 3,321.6 3,159.6 3,149.7 3,143.7 3,261.7 3,259.5 N/A 3,233.8
Maine
Children in category Number 88 171 1,181 a 11,761 983 22 14,206
Percent reporting birth weight % 96.6 74.9 73.4 a 94.0 90.5 27.3 91.7 Mean Grams 3,354.6 3,199.8 3,277.0 a 3,321.7 3,304.0 3,232.0 3,316.5
Massachusetts
Children in category Number 261 4,103 15,425 446 47,704 1,800 0 69,739
Percent reporting birth weight % 96.6 94.5 95.9 97.5 95.7 96.1 N/A 95.7 Mean Grams 3,192.5 3,183.9 3,210.2 3,229.4 3,272.0 3,250.7 N/A 3,252.0
New Hampshire
Children in category Number 105 219 414 68 7,642 308 0 8,756
Percent reporting birth weight % 63.8 52.1 50.7 41.2 65.8 67.9 N/A 64.6 Mean Grams 3,253.9 3,238.9 3,282.4 3,211.7 3,296.0 3,305.6 N/A 3,293.7
Rhode Island
Children in category Number 76 436 2,238 109 9,155 1,107 24 13,145
Percent reporting birth weight % 98.7 99.3 99.1 98.2 99.0 99.1 N/A 98.8 Mean Grams 3,342.3 3,163.1 3,177.9 3,187.1 3,264.5 3,275.8 N/A 3,247.1
Vermont
Children in category Number 16 212 275 17 7,482 348 221 8,571
Percent reporting birth weight % 93.8 75.9 86.2 100.0 92.8 90.5 87.8 92.0 Mean Grams 3,301.8 3,301.5 3,161.9 3,498.7 3,325.7 3,290.9 3,269.6 3,317.8
Indian Township (ME)
Children in category Number 19 0 0 0 a 20 5 44
Percent reporting birth weight % 10.5 N/A N/A N/A a 5.0 0.0 6.8 Mean Grams 3,572.1 N/A N/A N/A a 2,608.2 N/A 3,250.8
Seneca Nation (NY)
Children in category Number 51 0 0 0 a a 6 57
Percent reporting birth weight % 19.6 N/A N/A N/A a a 33.3 21.1 Mean Grams 3,878.3 N/A N/A N/A a a 3,685.5 3,846.2

WIC Participant and Program Characteristics: 2014 Final Report
Page F-26
Table F.6. (continued) Mean Birth Weight in Grams of WIC Children by Race and State
Region and State
American Indian or
Alaska Native Only Asian Only
Black or African
American Only
Native Hawaiian or Pacific Islander
Only White Only Two or
More Races Race Not
Reportedb
Total WIC
Children Mid-Atlantic
Delaware
Children in category Number 23 196 4,702 11 7,188 440 94 12,654
Percent reporting birth weight % 82.6 90.3 88.7 54.5 91.8 93.6 83.0 90.6 Mean Grams 3,217.0 3,179.4 3,108.4 3,231.9 3,289.2 3,187.6 3,227.9 3,217.5
District of Columbia
Children in category Number 14 93 5,079 17 2,307 31 10 7,551
Percent reporting birth weight % 100.0 97.8 98.2 100.0 98.6 100.0 0.0 98.2 Mean Grams 3,327.1 3,165.9 3,120.9 3,460.4 3,279.0 3,165.1 N/A 3,171.3
Maryland
Children in category Number 2,708 2,752 34,357 402 33,020 5,428 97 78,764
Percent reporting birth weight % 98.7 95.2 97.9 96.3 98.3 98.7 18.6 97.9 Mean Grams 3,260.8 3,147.5 3,128.5 3,250.3 3,284.6 3,248.0 3,356.3 3,208.4
New Jersey
Children in category Number 2,642 3,004 20,278 963 60,111 2,351 71 89,420
Percent reporting birth weight % 98.2 95.7 95.9 96.6 97.1 96.8 77.5 96.8 Mean Grams 3,265.1 3,166.6 3,134.8 3,245.5 3,277.9 3,214.0 3,219.5 3,239.6
Pennsylvania
Children in category Number 1,912 4,179 34,822 5,154 88,710 6,653 0 141,430
Percent reporting birth weight % 84.2 83.9 93.7 90.3 90.7 92.8 N/A 91.2 Mean Grams 3,217.5 3,175.9 3,110.8 3,199.2 3,235.2 3,205.6 N/A 3,199.2
Virgin Islands
Children in category Number 0 a 2,614 a 91 22 10 2,737
Percent reporting birth weight % N/A a 97.1 a 91.2 95.5 60.0 96.7 Mean Grams N/A a 3,134.7 a 3,236.0 2,987.6 3,113.8 3,136.7
West Virginia
Children in category Number 92 67 954 20 21,762 1,851 0 24,746
Percent reporting birth weight % 90.2 85.1 91.8 95.0 94.8 95.6 N/A 94.7 Mean Grams 3,271.5 3,147.3 3,093.0 3,322.9 3,202.0 3,171.1 N/A 3,195.8

WIC Participant and Program Characteristics: 2014 Final Report
Page F-27
Table F.6. (continued) Mean Birth Weight in Grams of WIC Children by Race and State
Region and State
American Indian or
Alaska Native Only Asian Only
Black or African
American Only
Native Hawaiian or Pacific Islander
Only White Only Two or
More Races Race Not
Reportedb
Total WIC
Children Southeast
Florida
Children in category Number 2,185 3,563 91,389 518 184,286 17,279 313 299,533
Percent reporting birth weight % 99.2 98.5 98.4 98.5 98.7 98.8 19.8 98.5 Mean Grams 3,231.1 3,152.5 3,100.5 3,231.2 3,261.1 3,222.6 3,168.8 3,208.4
Georgia
Children in category Number 977 3,833 71,651 301 80,550 4,898 0 162,210
Percent reporting birth weight % 88.7 82.8 89.3 83.7 89.6 88.0 N/A 89.2 Mean Grams 3,306.6 3,149.2 3,066.6 3,222.8 3,267.3 3,219.9 N/A 3,174.7
Mississippi
Children in category Number 497 664 26,272 132 13,014 556 3 41,138
Percent reporting birth weight % 36.6 49.1 28.9 37.9 32.9 29.0 0.0 30.6 Mean Grams 3,280.5 3,023.5 2,978.4 3,247.8 3,139.6 3,151.3 N/A 3,042.0
North Carolina
Children in category Number 7,668 2,860 50,085 347 87,024 3,153 934 152,071
Percent reporting birth weight % 74.0 70.9 79.2 76.9 81.9 92.3 80.6 80.6 Mean Grams 3,257.7 3,150.2 3,090.1 3,297.6 3,281.4 3,252.1 3,218.5 3,215.2
South Carolina
Children in category Number 181 510 24,987 76 26,378 2,355 0 54,487
Percent reporting birth weight % 84.0 66.1 89.0 60.5 81.9 85.0 N/A 85.1 Mean Grams 3,470.1 3,439.3 3,199.1 3,312.0 3,433.2 3,355.8 N/A 3,317.7
Tennessee
Children in category Number 179 785 22,970 33 62,476 2,498 1,265 90,206
Percent reporting birth weight % 84.4 68.3 78.2 69.7 83.6 82.3 71.1 81.9 Mean Grams 3,270.0 3,186.6 3,074.4 3,209.7 3,229.5 3,192.2 3,261.2 3,190.9
Eastern Band Cherokee (NC)
Children in category Number 411 0 0 0 a a 7 418
Percent reporting birth weight % 95.1 N/A N/A N/A a a 100.0 95.2 Mean Grams 3,311.8 N/A N/A N/A a a 3,175.2 3,309.4
Mississippi Choctaw (MS)
Children in category Number 457 0 a 0 a 8 7 470
Percent reporting birth weight % 22.3 N/A a N/A a 12.5 0.0 21.9 Mean Grams 3,195.2 N/A a N/A a 3,628.8 N/A 3,199.4

WIC Participant and Program Characteristics: 2014 Final Report
Page F-28
Table F.6. (continued) Mean Birth Weight in Grams of WIC Children by Race and State
Region and State
American Indian or
Alaska Native Only Asian Only
Black or African
American Only
Native Hawaiian or Pacific Islander
Only White Only Two or
More Races Race Not
Reportedb
Total WIC
Children Midwest
Illinois
Children in category Number 307 4,616 33,212 150 105,294 3,972 4,153 151,704
Percent reporting birth weight % 89.9 88.1 94.7 86.0 95.0 95.8 97.9 94.8 Mean Grams 3,226.3 3,136.9 3,084.2 3,243.4 3,287.5 3,228.0 3,295.6 3,237.3
Indiana
Children in category Number 239 2,474 14,624 154 61,916 5,122 271 84,800
Percent reporting birth weight % 94.6 90.1 96.8 94.8 97.8 97.7 1.1 97.1 Mean Grams 3,323.5 3,206.6 3,107.2 3,240.1 3,268.7 3,233.5 2,891.7 3,237.2
Michigan
Children in category Number 779 2,886 44,424 80 101,509 15,353 254 165,285
Percent reporting birth weight % 96.9 87.1 97.2 95.0 96.3 97.5 14.2 96.4 Mean Grams 3,383.9 3,114.1 3,086.0 3,167.0 3,297.6 3,237.8 3,241.4 3,232.1
Minnesota
Children in category Number 3,960 7,034 15,760 175 38,649 7,591 221 73,390
Percent reporting birth weight % 94.2 87.0 85.2 92.6 94.2 93.7 9.0 91.2 Mean Grams 3,368.1 3,175.1 3,268.4 3,248.4 3,345.1 3,302.7 3,027.8 3,310.6
Wisconsin
Children in category Number 1,564 3,649 11,708 124 40,813 4,675 0 62,533
Percent reporting birth weight % 93.5 89.6 92.3 83.1 91.2 93.2 N/A 91.5 Mean Grams 3,405.9 3,164.9 3,081.8 3,391.5 3,305.8 3,263.5 N/A 3,255.0
Southwest
Arkansas
Children in category Number 185 360 10,792 503 32,789 1,439 196 46,264
Percent reporting birth weight % 96.2 95.6 96.8 92.2 97.6 97.4 34.7 97.1 Mean Grams 3,314.7 3,072.9 3,029.7 3,071.1 3,247.9 3,188.1 3,110.6 3,192.2
Oklahoma
Children in category Number 2,812 1,079 6,113 307 37,927 6,317 0 54,555
Percent reporting birth weight % 95.5 91.8 96.7 93.5 97.2 97.5 N/A 96.9 Mean Grams 3,295.7 3,193.6 3,052.1 3,211.7 3,255.4 3,222.1 N/A 3,229.4

WIC Participant and Program Characteristics: 2014 Final Report
Page F-29
Table F.6. (continued) Mean Birth Weight in Grams of WIC Children by Race and State
Region and State
American Indian or
Alaska Native Only Asian Only
Black or African
American Only
Native Hawaiian or Pacific Islander
Only White Only Two or
More Races Race Not
Reportedb
Total WIC
Children Southwest (continued)
Texas
Children in category Number 9,250 8,104 69,391 723 444,719 17,735 33 549,955
Percent reporting birth weight % 90.9 74.1 83.6 68.3 88.8 82.2 12.1 87.8 Mean Grams 3,274.3 3,126.9 3,073.2 3,215.7 3,242.8 3,211.9 3,331.1 3,220.6
ACL (NM)
Children in category Number 324 0 0 0 7 0 1 332
Percent reporting birth weight % 98.8 N/A N/A N/A 100.0 N/A 0.0 98.5 Mean Grams 3,183.9 N/A N/A N/A 2,928.2 N/A N/A 3,178.4
Chickasaw Nation (OK)
Children in category Number 622 a 47 a 1,001 611 51 2,332
Percent reporting birth weight % 97.1 a 93.6 a 95.4 98.2 39.2 95.3 Mean Grams 3,268.9 a 3,137.8 a 3,208.7 3,264.3 3,494.1 3,241.2
Choctaw Nation(OK)
Children in category Number 425 6 36 a 749 1,032 21 2,269
Percent reporting birth weight % 98.6 100.0 100.0 a 98.4 98.5 42.9 98.0 Mean Grams 3,248.8 3,510.7 3,189.4 a 3,218.1 3,247.0 3,036.6 3,236.7
Citizen Potawatomi (OK)
Children in category Number 83 a 40 a 191 103 293 710
Percent reporting birth weight % 25.3 a 32.5 a 35.6 37.9 2.0 20.7 Mean Grams 3,622.1 a 3,026.9 a 3,226.5 3,255.9 3,562.7 3,286.9
Eight Northern Pueblos (NM)
Children in category Number 136 a a 0 36 a 8 181
Percent reporting birth weight % 100.0 a a N/A 96.2 a 87.5 98.5 Mean Grams 3,185.6 a a N/A 3,120.8 a 3,173.2 3,174.1
Five Sandoval Pueblos (NM)
Children in category Number 129 0 0 0 a 0 11 140
Percent reporting birth weight % 100.0 N/A N/A N/A a N/A 36.4 95.0 Mean Grams 3,194.8 N/A N/A N/A a N/A 3,097.2 3,191.8
ITC Oklahoma
Children in category Number 144 0 a 17 204 144 12 521
Percent reporting birth weight % 99.3 N/A a 100.0 96.6 100.0 25.0 96.7 Mean Grams 3,231.3 N/A a 3,191.9 3,213.8 3,290.4 2,494.8 3,235.6

WIC Participant and Program Characteristics: 2014 Final Report
Page F-30
Table F.6. (continued) Mean Birth Weight in Grams of WIC Children by Race and State
Region and State
American Indian or
Alaska Native Only Asian Only
Black or African
American Only
Native Hawaiian or Pacific Islander
Only White Only Two or
More Races Race Not
Reportedb
Total WIC
Children Southwest (continued)
Muscogee Creek Nation (OK)
Children in category Number 801 a 107 a 492 430 42 1,872
Percent reporting birth weight % 97.9 a 98.1 a 96.5 97.7 14.3 95.6 Mean Grams 3,329.1 a 3,026.2 a 3,171.6 3,268.4 2,924.8 3,253.9
Osage Nation (OK)
Children in category Number 304 121 137 10 758 133 13 1,476
Percent reporting birth weight % 99.3 94.2 97.1 90.0 97.6 95.5 69.2 97.2 Mean Grams 3,319.9 3,233.6 3,114.2 3,502.8 3,256.0 3,257.8 3,565.8 3,258.2
Otoe Missouria (OK)
Children in category Number 145 9 7 a 152 9 10 332
Percent reporting birth weight % 99.3 100.0 100.0 a 96.7 88.9 50.0 96.4 Mean Grams 3,481.9 3,247.7 3,863.7 a 3,213.0 3,203.6 3,016.5 3,345.9
Pueblo of San Felipe (NM)
Children in category Number 158 a a a a 8 a 167
Percent reporting birth weight % 100.0 a a a a 100.0 a 99.4 Mean Grams 3,195.5 a a a a 3,065.3 a 3,189.2
Pueblo of Zuni (NM)
Children in category Number 504 0 0 0 a a 9 513
Percent reporting birth weight % 99.0 N/A N/A N/A a a 22.2 97.7 Mean Grams 3,137.9 N/A N/A N/A a a 2,849.2 3,136.8
Santo Domingo (NM)
Children in category Number 117 0 0 0 a a 2 119
Percent reporting birth weight % 100.0 N/A N/A N/A a a 100.0 100.0 Mean Grams 3,238.0 N/A N/A N/A a a 3,430.4 3,241.2
WCD (OK)
Children in category Number 843 10 127 307 778 315 29 2,409
Percent reporting birth weight % 98.0 100.0 99.2 97.1 97.4 97.5 27.6 96.8 Mean Grams 3,400.1 2,996.6 2,956.3 3,291.6 3,262.4 3,253.9 3,614.6 3,297.3

WIC Participant and Program Characteristics: 2014 Final Report
Page F-31
Table F.6. (continued) Mean Birth Weight in Grams of WIC Children by Race and State
Region and State
American Indian or
Alaska Native Only Asian Only
Black or African
American Only
Native Hawaiian or Pacific Islander
Only White Only Two or
More Races Race Not
Reportedb
Total WIC
Children Mountain Plains
Colorado
Children in category Number 13,949 1,165 4,082 363 29,775 3,393 15 52,742
Percent reporting birth weight % 93.1 90.5 91.8 93.4 93.7 93.5 60.0 93.3 Mean Grams 3,209.9 3,055.6 3,096.6 3,189.4 3,186.7 3,147.9 3,020.9 3,180.6
Iowa
Children in category Number 263 1,023 3,932 181 31,739 2,823 7 39,968
Percent reporting birth weight % 89.0 83.0 84.6 88.4 93.8 94.7 0.0 92.6 Mean Grams 3,458.0 3,130.4 3,138.7 3,146.3 3,284.1 3,247.3 N/A 3,265.4
Kansas
Children in category Number 1,827 904 3,902 89 29,572 3,132 0 39,426
Percent reporting birth weight % 93.4 73.9 90.3 74.2 91.9 93.3 N/A 91.5 Mean Grams 3,315.4 3,125.3 3,089.8 3,290.7 3,268.5 3,210.6 N/A 3,246.0
Missouri
Children in category Number 129 967 14,860 338 51,824 4,134 0 72,252
Percent reporting birth weight % 95.3 95.6 97.5 93.8 98.5 98.5 N/A 98.2 Mean Grams 3,244.8 3,179.4 3,083.9 3,253.0 3,260.4 3,222.7 N/A 3,221.1
Montana
Children in category Number 2,795 52 104 25 7,508 941 34 11,459
Percent reporting birth weight % 96.9 96.2 98.1 96.0 97.2 96.9 52.9 96.9 Mean Grams 3,345.4 3,271.6 3,178.5 3,034.6 3,268.9 3,258.2 3,175.2 3,285.2
Nebraska
Children in category Number 3,777 694 2,593 155 12,836 1,695 7 21,757
Percent reporting birth weight % 99.3 95.8 97.5 100.0 98.9 98.9 28.6 98.7 Mean Grams 3,295.3 3,151.5 3,123.3 3,163.9 3,290.7 3,256.4 3,586.3 3,263.9
North Dakota
Children in category Number 1,497 168 693 20 4,125 607 9 7,119
Percent reporting birth weight % 95.0 74.4 77.1 75.0 87.9 93.2 0.0 88.3 Mean Grams 3,341.0 3,079.0 3,233.1 3,235.7 3,286.4 3,316.3 N/A 3,292.7

WIC Participant and Program Characteristics: 2014 Final Report
Page F-32
Table F.6. (continued) Mean Birth Weight in Grams of WIC Children by Race and State
Region and State
American Indian or
Alaska Native Only Asian Only
Black or African
American Only
Native Hawaiian or Pacific Islander
Only White Only Two or
More Races Race Not
Reportedb
Total WIC
Children Mountain Plains (continued)
South Dakota
Children in category Number 3,466 332 625 15 6,411 587 140 11,576
Percent reporting birth weight % 62.4 63.9 49.3 86.7 75.7 71.0 23.6 69.1 Mean Grams 3,384.8 3,106.3 3,226.2 3,203.6 3,276.7 3,256.4 3,122.8 3,297.7
Utah
Children in category Number 438 647 783 776 33,257 1,157 4 37,062
Percent reporting birth weight % 95.2 94.4 93.6 94.8 96.9 95.9 25.0 96.7 Mean Grams 3,246.3 3,056.6 3,128.7 3,376.5 3,239.0 3,245.1 3,458.7 3,236.8
Wyoming
Children in category Number 206 54 141 19 5,340 250 2 6,012
Percent reporting birth weight % 85.0 87.0 64.5 78.9 90.4 89.6 0.0 89.5 Mean Grams 3,254.9 3,034.1 3,135.9 3,454.9 3,161.8 3,106.6 N/A 3,161.8
Cheyenne River Sioux (SD)
Children in category Number 242 0 0 0 a 185 2 429
Percent reporting birth weight % 25.6 N/A N/A N/A a 22.2 50.0 24.2 Mean Grams 3,252.0 N/A N/A N/A a 3,454.6 3,742.2 3,336.6
Eastern Shoshone (WY)
Children in category Number 76 0 0 0 a a 7 83
Percent reporting birth weight % 14.5 N/A N/A N/A a a 28.6 15.7 Mean Grams 3,546.3 N/A N/A N/A a a 3,175.2 3,489.2
Northern Arapahoe (WY)
Children in category Number 223 0 0 0 a 6 2 231
Percent reporting birth weight % 31.8 N/A N/A N/A a 16.7 0.0 31.2 Mean Grams 3,496.2 N/A N/A N/A a 3,402.0 N/A 3,494.9
Omaha Nation (NE)
Children in category Number 228 0 0 0 a a 3 231
Percent reporting birth weight % 18.9 N/A N/A N/A a a 33.3 19.0 Mean Grams 3,626.2 N/A N/A N/A a a 2,835.0 3,608.2
Rosebud Sioux (SD)
Children in category Number 688 a a 0 8 11 2 709
Percent reporting birth weight % 26.0 a a N/A 25.0 27.3 50.0 26.1 Mean Grams 3,463.5 a a N/A 3,231.9 2,986.2 3,742.2 3,454.7

WIC Participant and Program Characteristics: 2014 Final Report
Page F-33
Table F.6. (continued) Mean Birth Weight in Grams of WIC Children by Race and State
Region and State
American Indian or
Alaska Native Only Asian Only
Black or African
American Only
Native Hawaiian or Pacific Islander
Only White Only Two or
More Races Race Not
Reportedb
Total WIC
Children Mountain Plains (continued)
Santee Sioux (NE)
Children in category Number 66 a a a a a 1 67
Percent reporting birth weight % 33.3 a a a a a 100.0 34.3 Mean Grams 3,577.3 a a a a a 3,742.2 3,584.4
Standing Rock Sioux (ND)
Children in category Number 479 0 0 0 11 6 0 496
Percent reporting birth weight % 26.5 N/A N/A N/A 45.5 16.7 N/A 26.8 Mean Grams 3,351.1 N/A N/A N/A 3,356.6 3,288.6 N/A 3,350.8
Three Affiliated (ND)
Children in category Number 97 0 a 0 a 30 4 131
Percent reporting birth weight % 20.6 N/A a N/A a 26.7 50.0 22.9 Mean Grams 3,447.4 N/A a N/A a 3,614.6 3,855.6 3,519.2
Winnebago (NE)
Children in category Number 122 0 0 0 a 0 4 126
Percent reporting birth weight % 15.6 N/A N/A N/A a N/A 0.0 15.1 Mean Grams 3,461.7 N/A N/A N/A a N/A N/A 3,461.7
Western
Alaska
Children in category Number 3,952 731 424 433 4,207 1,567 55 11,369
Percent reporting birth weight % 40.9 36.5 25.9 24.2 35.4 36.6 3.6 36.6 Mean Grams 3,462.8 3,186.7 3,366.2 3,515.1 3,363.9 3,369.3 3,529.6 3,395.6
American Samoa
Children in category Number a 32 a 4,396 a 7 4 4,439
Percent reporting birth weight % a 84.4 a 96.6 a 100.0 75.0 96.5 Mean Grams a 3,327.3 a 3,488.4 a 3,543.7 3,949.7 3,487.8
Arizona
Children in category Number 2,056 1,044 5,564 385 67,966 3,126 1 80,142
Percent reporting birth weight % 87.2 86.5 88.5 87.3 93.9 90.6 100.0 93.1 Mean Grams 3,299.4 3,136.1 3,143.9 3,252.3 3,277.5 3,237.4 3,090.0 3,265.8

WIC Participant and Program Characteristics: 2014 Final Report
Page F-34
Table F.6. (continued) Mean Birth Weight in Grams of WIC Children by Race and State
Region and State
American Indian or
Alaska Native Only Asian Only
Black or African
American Only
Native Hawaiian or Pacific Islander
Only White Only Two or
More Races Race Not
Reportedb
Total WIC
Children Western (continued)
Guam
Children in category Number a 591 14 3,383 69 175 4 4,236
Percent reporting birth weight % a 93.6 50.0 94.5 84.1 86.3 75.0 93.7 Mean Grams a 3,074.0 3,163.0 3,181.9 3,337.5 3,190.0 3,326.3 3,169.6
Hawaii
Children in category Number 30 3,430 299 3,932 3,180 9,354 52 20,277
Percent reporting birth weight % 80.0 87.5 64.5 88.2 75.1 91.6 44.2 87.1 Mean Grams 3,530.8 3,277.4 3,373.7 3,495.6 3,520.7 3,457.5 3,426.7 3,442.1
Idaho
Children in category Number 987 295 352 73 20,223 936 0 22,866
Percent reporting birth weight % 92.9 79.0 81.3 83.6 89.2 85.7 N/A 88.9 Mean Grams 3,292.1 3,173.3 3,235.7 3,213.8 3,280.7 3,240.2 N/A 3,277.5
Nevada
Children in category Number 8,775 1,129 5,089 527 23,636 1,988 1 41,145
Percent reporting birth weight % 27.4 37.6 35.8 36.6 34.9 29.5 0.0 33.2 Mean Grams 3,292.5 3,111.1 3,107.2 3,215.3 3,258.2 3,243.1 N/A 3,238.3
Northern Mariana Islands
Children in category Number a 1,012 a 1,332 7 111 3 2,465
Percent reporting birth weight % a 98.2 a 99.2 100.0 100.0 100.0 98.8 Mean Grams a 3,152.8 a 3,176.4 3,090.1 3,196.6 3,298.0 3,167.6
Washington
Children in category Number 10,617 4,507 7,867 1,895 73,091 14,710 0 112,687
Percent reporting birth weight % 96.5 93.1 91.1 93.0 96.2 96.0 N/A 95.7 Mean Grams 3,351.4 3,169.4 3,242.2 3,337.0 3,349.0 3,313.0 N/A 3,330.2
ITC Arizona (AZ)
Children in category Number 4,846 17 52 a 716 502 4 6,137
Percent reporting birth weight % 92.8 76.5 69.2 a 83.8 90.0 100.0 91.3 Mean Grams 3,329.5 3,127.2 3,105.1 a 3,298.3 3,384.0 3,387.8 3,328.7
ITC Nevada (AZ)
Children in category Number 185 12 8 11 549 61 0 826
Percent reporting birth weight % 29.7 33.3 25.0 18.2 29.1 18.0 N/A 28.3 Mean Grams 3,318.5 3,394.9 2,735.8 2,041.2 3,195.8 3,376.2 N/A 3,222.7
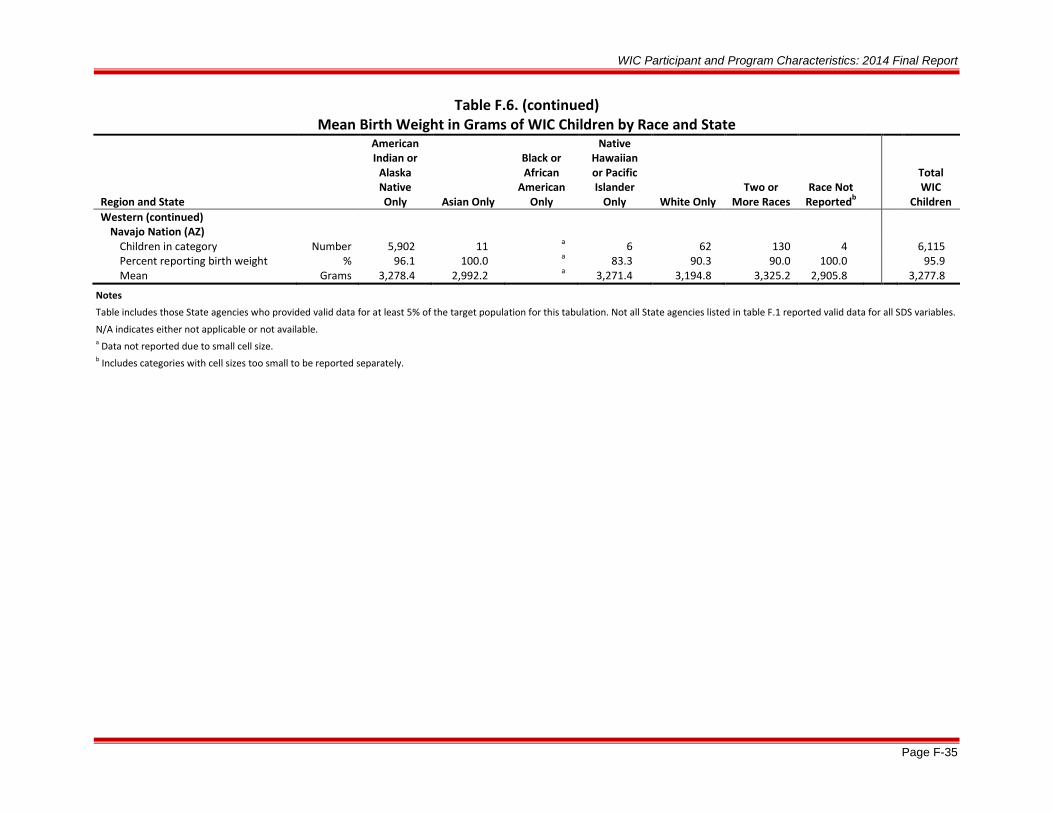
WIC Participant and Program Characteristics: 2014 Final Report
Page F-35
Table F.6. (continued) Mean Birth Weight in Grams of WIC Children by Race and State
Region and State
American Indian or
Alaska Native Only Asian Only
Black or African
American Only
Native Hawaiian or Pacific Islander
Only White Only Two or
More Races Race Not
Reportedb
Total WIC
Children Western (continued)
Navajo Nation (AZ)
Children in category Number 5,902 11 a 6 62 130 4 6,115
Percent reporting birth weight % 96.1 100.0 a 83.3 90.3 90.0 100.0 95.9 Mean Grams 3,278.4 2,992.2 a 3,271.4 3,194.8 3,325.2 2,905.8 3,277.8
Notes
Table includes those State agencies who provided valid data for at least 5% of the target population for this tabulation. Not all State agencies listed in table F.1 reported valid data for all SDS variables.
N/A indicates either not applicable or not available. a Data not reported due to small cell size. b Includes categories with cell sizes too small to be reported separately.

WIC Participant and Program Characteristics: 2014 Final Report
Page F-36
Table F.7. Mean Birth Weight in Grams of WIC Children by Ethnicity and State
Region and State
Hispanic/Latino Not
Hispanic/Latino Ethnicity
Not Reportedb Total WIC Children
Northeast Connecticut Children in category Number 16,780 15,396 2 32,178
Percent reporting birth weight % 92.4 93.9 0.0 93.1 Mean Grams 3,251.2 3,215.2 N/A 3,233.8
Maine Children in category Number 581 13,608 17 14,206
Percent reporting birth weight % 87.6 92.0 17.6 91.7 Mean Grams 3,321.1 3,316.3 3,222.5 3,316.5
Massachusetts Children in category Number 28,385 41,354 0 69,739
Percent reporting birth weight % 96.1 95.5 N/A 95.7 Mean Grams 3,244.7 3,257.1 N/A 3,252.0
New Hampshire Children in category Number 1,118 7,638 0 8,756
Percent reporting birth weight % 58.3 65.5 N/A 64.6 Mean Grams 3,255.7 3,298.7 N/A 3,293.7
Rhode Island Children in category Number 5,891 7,230 24 13,145
Percent reporting birth weight % 99.0 98.9 0.0 98.8 Mean Grams 3,252.7 3,242.6 N/A 3,247.1
Vermont Children in category Number 139 8,432 0 8,571
Percent reporting birth weight % 91.4 92.0 N/A 92.0 Mean Grams 3,273.6 3,318.6 N/A 3,317.8
Indian Township (ME) Children in category Number 0 44 0 44
Percent reporting birth weight % N/A 6.8 N/A 6.8 Mean Grams N/A 3,250.8 N/A 3,250.8
Seneca Nation (NY) Children in category Number 0 57 0 57
Percent reporting birth weight % N/A 21.1 N/A 21.1 Mean Grams N/A 3,846.2 N/A 3,846.2
Mid-Atlantic
Delaware Children in category Number 3,859 8,795 0 12,654
Percent reporting birth weight % 91.7 90.1 N/A 90.6 Mean Grams 3,285.6 3,187.0 N/A 3,217.5
District of Columbia Children in category Number 2,216 5,325 10 7,551
Percent reporting birth weight % 98.6 98.2 0.0 98.2 Mean Grams 3,277.9 3,126.7 N/A 3,171.3
Maryland Children in category Number 24,126 54,638 0 78,764
Percent reporting birth weight % 98.4 97.7 N/A 97.9 Mean Grams 3,276.3 3,178.2 N/A 3,208.4
New Jersey Children in category Number 47,315 42,034 71 89,420
Percent reporting birth weight % 97.0 96.6 77.5 96.8 Mean Grams 3,263.8 3,212.3 3,219.5 3,239.6

WIC Participant and Program Characteristics: 2014 Final Report
Page F-37
Table F.7. (continued) Mean Birth Weight in Grams of WIC Children by Ethnicity and State
Region and State Hispanic/Latino Not
Hispanic/Latino Ethnicity
Not Reportedb Total WIC Children
Mid-Atlantic (continued) Pennsylvania
Children in category Number 33,439 107,991 0 141,430 Percent reporting birth weight % 89.9 91.7 N/A 91.2 Mean Grams 3,222.3 3,192.1 N/A 3,199.2
Virgin Islands Children in category Number 539 2,198 0 2,737
Percent reporting birth weight % 97.2 96.6 N/A 96.7 Mean Grams 3,169.6 3,128.6 N/A 3,136.7
West Virginia Children in category Number 867 23,879 0 24,746
Percent reporting birth weight % 90.2 94.8 N/A 94.7 Mean Grams 3,241.6 3,194.2 N/A 3,195.8
Southeast
Florida Children in category Number 125,267 174,266 0 299,533
Percent reporting birth weight % 98.7 98.4 N/A 98.5 Mean Grams 3,254.4 3,175.2 N/A 3,208.4
Georgia Children in category Number 38,319 123,881 10 162,210
Percent reporting birth weight % 91.4 88.6 100.0 89.2 Mean Grams 3,296.0 3,136.0 3,115.7 3,174.7
Mississippi Children in category Number 2,639 38,496 3 41,138
Percent reporting birth weight % 24.4 31.1 0.0 30.6 Mean Grams 3,208.6 3,033.1 N/A 3,042.0
North Carolina Children in category Number 42,878 109,193 0 152,071
Percent reporting birth weight % 81.7 80.2 N/A 80.6 Mean Grams 3,307.5 3,178.2 N/A 3,215.2
South Carolina Children in category Number 9,094 45,393 0 54,487
Percent reporting birth weight % 82.2 85.7 N/A 85.1 Mean Grams 3,481.8 3,286.1 N/A 3,317.7
Tennessee Children in category Number 14,891 75,315 0 90,206
Percent reporting birth weight % 81.4 82.0 N/A 81.9 Mean Grams 3,282.9 3,172.8 N/A 3,190.9
Eastern Band Cherokee (NC) Children in category Number 16 402 0 418
Percent reporting birth weight % 93.8 95.3 N/A 95.2 Mean Grams 3,488.9 3,302.4 N/A 3,309.4
Mississippi Choctaw (MS) Children in category Number 0 470 0 470
Percent reporting birth weight % N/A 21.9 N/A 21.9 Mean Grams N/A 3,199.4 N/A 3,199.4
Midwest Illinois Children in category Number 62,006 85,545 4,153 151,704
Percent reporting birth weight % 96.4 93.5 97.9 94.8 Mean Grams 3,301.3 3,186.6 3,295.6 3,237.3

WIC Participant and Program Characteristics: 2014 Final Report
Page F-38
Table F.7. (continued) Mean Birth Weight in Grams of WIC Children by Ethnicity and State
Region and State Hispanic/Latino Not
Hispanic/Latino Ethnicity
Not Reportedb Total WIC Children
Midwest (continued) Indiana
Children in category Number 16,702 67,827 271 84,800 Percent reporting birth weight % 97.3 97.4 1.1 97.1 Mean Grams 3,302.4 3,221.1 2,891.7 3,237.2
Michigan Children in category Number 23,232 142,053 0 165,285
Percent reporting birth weight % 96.5 96.3 N/A 96.4 Mean Grams 3,295.1 3,221.8 N/A 3,232.1
Minnesota Children in category Number 13,476 59,693 221 73,390
Percent reporting birth weight % 93.3 91.1 9.0 91.2 Mean Grams 3,319.0 3,308.8 N/A 3,310.6
Wisconsin Children in category Number 17,364 45,169 0 62,533
Percent reporting birth weight % 93.0 90.9 N/A 91.5 Mean Grams 3,308.0 3,234.1 N/A 3,255.0
Southwest Arkansas Children in category Number 8,678 37,390 196 46,264
Percent reporting birth weight % 97.7 97.2 34.7 97.1 Mean Grams 3,282.4 3,171.3 3,110.6 3,192.2
Oklahoma Children in category Number 17,342 37,213 0 54,555
Percent reporting birth weight % 97.2 96.8 N/A 96.9 Mean Grams 3,279.0 3,206.2 N/A 3,229.4
Texas Children in category Number 408,135 141,787 33 549,955
Percent reporting birth weight % 90.9 78.8 12.1 87.8 Mean Grams 3,240.9 3,153.1 3,331.1 3,220.6
ACL (NM) Children in category Number 6 325 1 332
Percent reporting birth weight % 100.0 98.8 0.0 98.5 Mean Grams 2,801.9 3,185.4 N/A 3,178.4
Chickasaw Nation (OK) Children in category Number 214 2,074 44 2,332
Percent reporting birth weight % 96.7 96.6 29.5 95.3 Mean Grams 3,284.8 3,234.6 3,567.7 3,241.2
Choctaw Nation (OK) Children in category Number 170 2,081 18 2,269
Percent reporting birth weight % 99.4 98.5 33.3 98.0 Mean Grams 3,316.8 3,230.5 3,090.2 3,236.7
Citizen Potawatomi (OK) Children in category Number 121 302 287 710
Percent reporting birth weight % 37.2 31.8 2.1 20.7 Mean Grams 3,149.4 3,334.1 3,562.7 3,286.9
Eight Northern Pueblos (NM) Children in category Number 38 142 1 181
Percent reporting birth weight % 96.3 100.0 0.0 98.5 Mean Grams 3,101.1 3,192.7 N/A 3,174.1

WIC Participant and Program Characteristics: 2014 Final Report
Page F-39
Table F.7. (continued) Mean Birth Weight in Grams of WIC Children by Ethnicity and State
Region and State Hispanic/Latino Not
Hispanic/Latino Ethnicity
Not Reportedb Total WIC Children
Southwest (continued) Five Sandoval Pueblos (NM)
Children in category Number a 130 10 140 Percent reporting birth weight % a 99.2 40.0 95.0 Mean Grams a 3,187.9 3,317.0 3,191.8
ITC Oklahoma Children in category Number 47 465 9 521
Percent reporting birth weight % 97.9 98.5 0.0 96.7 Mean Grams 3,231.9 3,236.0 N/A 3,235.6
Muscogee Creek Nation (OK) Children in category Number 86 1,749 37 1,872
Percent reporting birth weight % 100.0 97.4 2.7 95.6 Mean Grams 3,326.2 3,250.7 2,608.2 3,253.9
Osage Nation (OK) Children in category Number 358 1,105 13 1,476
Percent reporting birth weight % 96.9 97.6 69.2 97.2 Mean Grams 3,253.4 3,257.1 3,565.8 3,258.2
Otoe Missouria (OK) Children in category Number 38 288 6 332
Percent reporting birth weight % 97.4 97.9 16.7 96.4 Mean Grams 3,280.9 3,356.5 2,778.3 3,345.9
Pueblo of San Felipe (NM) Children in category Number 7 159 1 167
Percent reporting birth weight % 100.0 100.0 0.0 99.4 Mean Grams 3,438.5 3,178.2 N/A 3,189.2
Pueblo of Zuni (NM) Children in category Number 0 506 7 513
Percent reporting birth weight % N/A 99.0 0.0 97.7 Mean Grams N/A 3,136.8 N/A 3,136.8
Santo Domingo (NM) Children in category Number 0 119 0 119
Percent reporting birth weight % N/A 100.0 N/A 100.0 Mean Grams N/A 3,241.2 N/A 3,241.2
WCD (OK) Children in category Number 787 1,593 29 2,409
Percent reporting birth weight % 97.8 97.6 27.6 96.8 Mean Grams 3,310.9 3,288.9 3,614.6 3,297.3
Mountain Plains
Colorado Children in category Number 29,688 23,054 0 52,742
Percent reporting birth weight % 93.8 92.7 N/A 93.3 Mean Grams 3,189.8 3,168.7 N/A 3,180.6
Iowa Children in category Number 8,683 31,285 0 39,968
Percent reporting birth weight % 93.2 92.5 N/A 92.6 Mean Grams 3,294.9 3,257.1 N/A 3,265.4
Kansas Children in category Number 14,755 24,671 0 39,426
Percent reporting birth weight % 92.2 91.0 N/A 91.5 Mean Grams 3,291.3 3,218.5 N/A 3,246.0

WIC Participant and Program Characteristics: 2014 Final Report
Page F-40
Table F.7. (continued) Mean Birth Weight in Grams of WIC Children by Ethnicity and State
Region and State Hispanic/Latino Not
Hispanic/Latino Ethnicity
Not Reportedb Total WIC Children
Southwest (continued) Missouri
Children in category Number 8,100 64,152 0 72,252 Percent reporting birth weight % 98.1 98.2 N/A 98.2 Mean Grams 3,288.0 3,212.6 N/A 3,221.1
Montana Children in category Number 800 10,625 34 11,459
Percent reporting birth weight % 96.3 97.1 52.9 96.9 Mean Grams 3,262.8 3,287.1 3,175.2 3,285.2
Nebraska Children in category Number 8,357 13,393 7 21,757
Percent reporting birth weight % 99.3 98.3 14.3 98.7 Mean Grams 3,299.2 3,241.7 3,175.2 3,263.9
North Dakota Children in category Number 709 6,410 0 7,119
Percent reporting birth weight % 83.6 88.8 N/A 88.3 Mean Grams 3,320.3 3,289.8 N/A 3,292.7
South Dakota Children in category Number 1,101 10,475 0 11,576
Percent reporting birth weight % 69.6 69.1 N/A 69.1 Mean Grams 3,287.2 3,298.8 N/A 3,297.7
Utah Children in category Number 15,178 21,884 0 37,062
Percent reporting birth weight % 97.2 96.3 N/A 96.7 Mean Grams 3,220.9 3,247.8 N/A 3,236.8
Wyoming Children in category Number 1,635 4,377 0 6,012
Percent reporting birth weight % 90.8 89.0 N/A 89.5 Mean Grams 3,153.5 3,165.0 N/A 3,161.8
Cheyenne River Sioux (SD) Children in category Number a 425 4 429
Percent reporting birth weight % a 24.0 50.0 24.2 Mean Grams a 3,332.0 3,572.1 3,336.6
Eastern Shoshone (WY) Children in category Number 0 83 0 83
Percent reporting birth weight % N/A 15.7 N/A 15.7 Mean Grams N/A 3,489.2 N/A 3,489.2
Northern Arapahoe (WY) Children in category Number 6 225 0 231
Percent reporting birth weight % 16.7 31.6 N/A 31.2 Mean Grams 3,402.0 3,496.2 N/A 3,494.9
Omaha Nation (NE) Children in category Number 6 225 0 231
Percent reporting birth weight % 16.7 19.1 N/A 19.0 Mean Grams 2,835.0 3,626.2 N/A 3,608.2
Rosebud Sioux (SD) Children in category Number a 704 5 709
Percent reporting birth weight % a 26.3 N/A 26.1 Mean Grams a 3,454.7 N/A 3,454.7
Santee Sioux (NE) Children in category Number a 65 2 67
Percent reporting birth weight % a 35.4 N/A 34.3 Mean Grams a 3,584.4 N/A 3,584.4

WIC Participant and Program Characteristics: 2014 Final Report
Page F-41
Table F.7. (continued) Mean Birth Weight in Grams of WIC Children by Ethnicity and State
Region and State Hispanic/Latino Not
Hispanic/Latino Ethnicity
Not Reportedb Total WIC Children
Southwest (continued) Standing Rock Sioux (ND)
Children in category Number a 493 3 496 Percent reporting birth weight % a 27.0 N/A 26.8 Mean Grams a 3,350.8 N/A 3,350.8
Three Affiliated (ND) Children in category Number 12 119 0 131
Percent reporting birth weight % 25.0 22.7 N/A 22.9 Mean Grams 4,309.2 3,431.4 N/A 3,519.2
Winnebago (NE) Children in category Number a 125 1 126
Percent reporting birth weight % a 15.2 N/A 15.1 Mean Grams a 3,461.7 N/A 3,461.7
Western
Alaska Children in category Number 1,075 10,239 55 11,369
Percent reporting birth weight % 31.9 37.3 3.6 36.6 Mean Grams 3,388.4 3,396.2 3,529.6 3,395.6
American Samoa Children in category Number 9 4,430 0 4,439
Percent reporting birth weight % 55.6 96.6 N/A 96.5 Mean Grams 3,594.6 3,487.7 N/A 3,487.8
Arizona Children in category Number 53,079 27,062 1 80,142
Percent reporting birth weight % 95.4 88.5 100.0 93.1 Mean Grams 3,278.5 3,239.0 3,090.0 3,265.8
Guam Children in category Number 22 4,214 0 4,236
Percent reporting birth weight % 77.3 93.8 N/A 93.7 Mean Grams 3,370.2 3,168.7 N/A 3,169.6
Hawaii Children in category Number 3,990 16,235 52 20,277
Percent reporting birth weight % 88.2 87.0 44.2 87.1 Mean Grams 3,442.4 3,442.0 3,426.7 3,442.1
Idaho Children in category Number 7,905 14,961 0 22,866
Percent reporting birth weight % 91.4 87.6 N/A 88.9 Mean Grams 3,269.4 3,282.0 N/A 3,277.5
Nevada Children in category Number 24,167 16,978 0 41,145
Percent reporting birth weight % 30.9 36.5 N/A 33.2 Mean Grams 3,282.7 3,184.7 N/A 3,238.3
Northern Mariana Islands Children in category Number a 2,463 2 2,465
Percent reporting birth weight % a 98.8 100.0 98.8 Mean Grams a 3,167.6 3,118.5 3,167.6
Washington Children in category Number 47,865 64,822 0 112,687
Percent reporting birth weight % 96.6 95.0 N/A 95.7 Mean Grams 3,326.5 3,333.0 N/A 3,330.2

WIC Participant and Program Characteristics: 2014 Final Report
Page F-42
Table F.7. (continued) Mean Birth Weight in Grams of WIC Children by Ethnicity and State
Region and State Hispanic/Latino Not
Hispanic/Latino Ethnicity
Not Reportedb Total WIC Children
Western (continued) ITC Arizona (AZ)
Children in category Number 1,889 4,248 0 6,137 Percent reporting birth weight % 89.8 91.9 N/A 91.3 Mean Grams 3,327.4 3,329.2 N/A 3,328.7
ITC Nevada (NV) Children in category Number 388 438 0 826
Percent reporting birth weight % 26.0 30.4 N/A 28.3 Mean Grams 3,240.9 3,208.9 N/A 3,222.7
Navajo Nation (AZ) Children in category Number 185 5,930 0 6,115
Percent reporting birth weight % 88.1 96.1 N/A 95.9 Mean Grams 3,145.4 3,281.5 N/A 3,277.8
Notes
Table includes those State agencies who provided valid data for at least 5% of the target population for this tabulation. Not all State agencies listed in table F.1 reported valid data for all SDS variables.
N/A indicates either not applicable or not available. a Data not reported due to small cell size. b Includes categories with cell sizes too small to be reported separately.

WIC Participant and Program Characteristics: 2014 Final Report
Page F-43
Table F.8. Length of Enrollment in WIC for Women WIC Participants for Most Recent Pregnancy
From First WIC Certification to April 30, 2014, by Participant Category and Statea
Region and State
Pregnant Women
Breastfeeding Women
Postpartum Women
Total WIC Women
Northeast
Connecticut
Women in category Number 6,260 4,038 2,995 13,293 Percent reporting first WIC certification date % 63.8 69.1 67.3 66.2 Mean Weeks 15 40 36 28 Mode Weeks 4 41 40 *
Maine
Women in category Number 2,126 1,636 1,754 5,516
Percent reporting first WIC certification date % 100.0 99.8 99.9 99.9 Mean Weeks 14 41 33 28 Mode Weeks * 31 33 14
Massachusetts
Women in category Number 12,197 9,455 8,425 30,077
Percent reporting first WIC certification date % 99.9 99.9 99.9 99.9 Mean Weeks 14 43 35 29 Mode Weeks 14 36 36 14
New Hampshire
Women in category Number 1,625 1,167 1,419 4,211
Percent reporting first WIC certification date % 100.0 100.0 100.0 100.0 Mean Weeks 14 42 32 28 Mode Weeks 6 39 45 6
Rhode Island
Women in category Number 2,370 1,339 2,092 5,801
Percent reporting first WIC certification date % 99.8 99.9 99.7 99.8 Mean Weeks 14 39 35 27 Mode Weeks 4 34 36 14
Vermont
Women in category Number 1,246 1,257 678 3,181
Percent reporting first WIC certification date % 97.1 98.6 96.3 97.5 Mean Weeks 15 19 16 17 Mode Weeks 3 6 10 3
Indian Township (ME) Women in category Number 13 3 3 19 Percent reporting first WIC certification date % 100.0 100.0 100.0 100.0 Mean Weeks 14 20 45 20 Mode Weeks * * * *

WIC Participant and Program Characteristics: 2014 Final Report
Page F-44
Table F.8. (continued) Length of Enrollment in WIC for Women WIC Participants for Most Recent Pregnancy
From First WIC Certification to April 30, 2014, by Participant Category and Statea
Region and State Pregnant Women
Breastfeeding Women
Postpartum Women
Total WIC Women
Northeast (continued) Pleasant Point (ME)
Women in category Number 10 0 3 13 Percent reporting first WIC certification date % 100.0 0.0 100.0 100.0 Mean Weeks 13 N/A 9 12 Mode Weeks * N/A * *
Seneca Nation (NY)
Women in category Number 23 6 7 36
Percent reporting first WIC certification date % 100.0 100.0 100.0 100.0 Mean Weeks 15 45 33 23 Mode Weeks 13 * * *
Mid-Atlantic
Delaware
Women in category Number 1,889 1,170 1,624 4,683 Percent reporting first WIC certification date % 100.0 100.0 100.0 100.0 Mean Weeks 14 38 31 26 Mode Weeks 12 37 37 12
District of Columbia
Women in category Number 1,501 1,397 1,298 4,196
Percent reporting first WIC certification date % 100.0 99.9 99.7 99.9 Mean Weeks 13 35 27 25 Mode Weeks 12 34 13 14
Maryland
Women in category Number 13,373 14,129 8,047 35,549
Percent reporting first WIC certification date % 99.9 100.0 100.0 100.0 Mean Weeks 13 42 32 29 Mode Weeks 1 40 38 14
New Jersey
Women in category Number 14,935 13,263 9,049 37,247
Percent reporting first WIC certification date % 99.9 99.1 99.0 99.4 Mean Weeks 13 37 28 25 Mode Weeks 8 36 16 10

WIC Participant and Program Characteristics: 2014 Final Report
Page F-45
Table F.8. (continued) Length of Enrollment in WIC for Women WIC Participants for Most Recent Pregnancy
From First WIC Certification to April 30, 2014, by Participant Category and Statea
Region and State Pregnant Women
Breastfeeding Women
Postpartum Women
Total WIC Women
Mid-Atlantic (continued) Pennsylvania
Women in category Number 21,444 13,734 22,061 57,239 Percent reporting first WIC certification date % 97.8 98.4 99.1 98.5 Mean Weeks 13 37 30 25 Mode Weeks 4 33 33 14
Virginia
Women in category Number 15,392 13,795 12,380 41,567
Percent reporting first WIC certification date % 58.8 69.9 61.2 63.2 Mean Weeks 16 26 21 21 Mode Weeks 8 11 11 11
Virgin Islands
Women in category Number 288 740 110 1,138
Percent reporting first WIC certification date % 100.0 100.0 100.0 100.0 Mean Weeks 12 38 27 31 Mode Weeks 9 33 * 33
West Virginia
Women in category Number 4,904 1,976 4,243 11,123
Percent reporting first WIC certification date % 99.9 99.9 100.0 99.9 Mean Weeks 15 41 33 27 Mode Weeks 5 39 37 13
Southeast
Alabama
Women in category Number 16,121 4,760 13,660 34,541 Percent reporting first WIC certification date % 56.3 60.0 56.6 56.9 Mean Weeks 14 40 38 27 Mode Weeks 3 32 38 16
Florida
Women in category Number 54,967 48,893 33,962 137,822
Percent reporting first WIC certification date % 99.9 100.0 100.0 99.9 Mean Weeks 15 44 34 30 Mode Weeks 4 39 39 4

WIC Participant and Program Characteristics: 2014 Final Report
Page F-46
Table F.8. (continued) Length of Enrollment in WIC for Women WIC Participants for Most Recent Pregnancy
From First WIC Certification to April 30, 2014, by Participant Category and Statea
Region and State Pregnant Women
Breastfeeding Women
Postpartum Women
Total WIC Women
Southeast (continued) Georgia
Women in category Number 34,677 23,371 21,134 79,182 Percent reporting first WIC certification date % 97.1 99.6 99.7 98.5 Mean Weeks 14 22 14 17 Mode Weeks 2 10 16 16
Mississippi
Women in category Number 9,261 2,333 9,252 20,846
Percent reporting first WIC certification date % 92.6 93.9 95.2 93.9 Mean Weeks 12 20 20 16 Mode Weeks 6 16 17 6
South Carolina
Women in category Number 13,893 8,032 12,949 34,874
Percent reporting first WIC certification date % 99.8 98.6 99.9 99.6 Mean Weeks 14 44 35 29 Mode Weeks 1 42 42 1
Mississippi Choctaw (MS)
Women in category Number 103 9 31 143
Percent reporting first WIC certification date % 100.0 88.9 100.0 99.3 Mean Weeks 17 35 43 23 Mode Weeks * 26 * *
Midwest
Illinois
Women in category Number 31,103 20,462 21,205 72,770 Percent reporting first WIC certification date % 100.0 100.0 100.0 100.0 Mean Weeks 14 22 14 16 Mode Weeks 6 4 16 4
Indiana
Women in category Number 16,053 9,986 15,359 41,398
Percent reporting first WIC certification date % 99.9 99.9 99.7 99.8 Mean Weeks 14 39 33 27 Mode Weeks 3 38 40 12
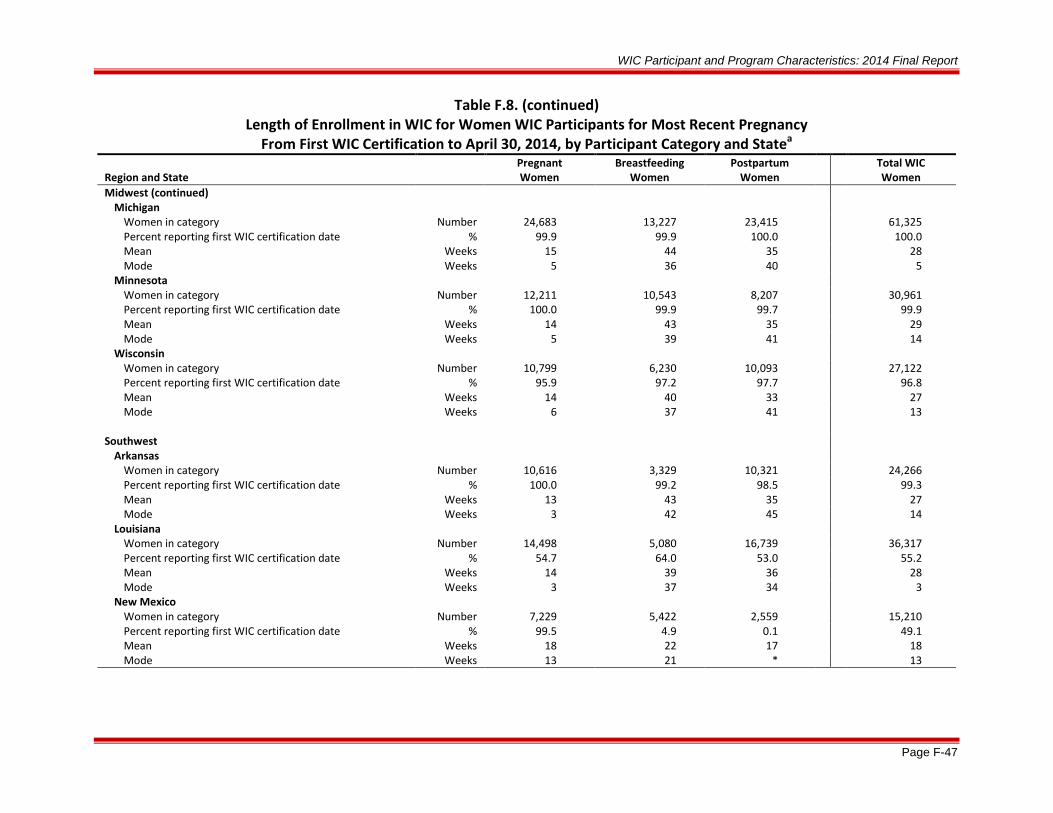
WIC Participant and Program Characteristics: 2014 Final Report
Page F-47
Table F.8. (continued) Length of Enrollment in WIC for Women WIC Participants for Most Recent Pregnancy
From First WIC Certification to April 30, 2014, by Participant Category and Statea
Region and State Pregnant Women
Breastfeeding Women
Postpartum Women
Total WIC Women
Midwest (continued) Michigan
Women in category Number 24,683 13,227 23,415 61,325 Percent reporting first WIC certification date % 99.9 99.9 100.0 100.0 Mean Weeks 15 44 35 28 Mode Weeks 5 36 40 5
Minnesota
Women in category Number 12,211 10,543 8,207 30,961
Percent reporting first WIC certification date % 100.0 99.9 99.7 99.9 Mean Weeks 14 43 35 29 Mode Weeks 5 39 41 14
Wisconsin
Women in category Number 10,799 6,230 10,093 27,122
Percent reporting first WIC certification date % 95.9 97.2 97.7 96.8 Mean Weeks 14 40 33 27 Mode Weeks 6 37 41 13
Southwest
Arkansas
Women in category Number 10,616 3,329 10,321 24,266 Percent reporting first WIC certification date % 100.0 99.2 98.5 99.3 Mean Weeks 13 43 35 27 Mode Weeks 3 42 45 14
Louisiana
Women in category Number 14,498 5,080 16,739 36,317
Percent reporting first WIC certification date % 54.7 64.0 53.0 55.2 Mean Weeks 14 39 36 28 Mode Weeks 3 37 34 3
New Mexico
Women in category Number 7,229 5,422 2,559 15,210
Percent reporting first WIC certification date % 99.5 4.9 0.1 49.1 Mean Weeks 18 22 17 18 Mode Weeks 13 21 * 13

WIC Participant and Program Characteristics: 2014 Final Report
Page F-48
Table F.8. (continued) Length of Enrollment in WIC for Women WIC Participants for Most Recent Pregnancy
From First WIC Certification to April 30, 2014, by Participant Category and Statea
Region and State Pregnant Women
Breastfeeding Women
Postpartum Women
Total WIC Women
Southwest (continued) Oklahoma
Women in category Number 11,140 4,954 8,983 25,077 Percent reporting first WIC certification date % 42.6 45.0 43.5 43.4 Mean Weeks 14 43 38 28 Mode Weeks 4 * 34 4
Texas
Women in category Number 96,174 116,505 49,995 262,674
Percent reporting first WIC certification date % 99.9 100.0 100.0 100.0 Mean Weeks 15 46 33 32 Mode Weeks 1 40 40 16
ACL (NM)
Women in category Number 47 54 31 132
Percent reporting first WIC certification date % 100.0 100.0 100.0 100.0 Mean Weeks 14 42 35 30 Mode Weeks 3 37 37 37
Chickasaw Nation (OK)
Women in category Number 407 257 389 1,053
Percent reporting first WIC certification date % 100.0 100.0 100.0 100.0 Mean Weeks 15 42 34 29 Mode Weeks * 36 41 16
Choctaw Nation (OK)
Women in category Number 325 133 348 806
Percent reporting first WIC certification date % 100.0 99.2 100.0 99.9 Mean Weeks 14 38 32 26 Mode Weeks 10 * 39 27
Citizen Potawatomi (OK)
Women in category Number 152 64 113 329
Percent reporting first WIC certification date % 100.0 100.0 100.0 100.0 Mean Weeks 11 16 17 14 Mode Weeks 20 21 21 21
Eight Northern Pueblos (NM)
Women in category Number 18 16 14 48
Percent reporting first WIC certification date % 100.0 100.0 100.0 100.0 Mean Weeks 16 40 25 27 Mode Weeks 6 * 8 6

WIC Participant and Program Characteristics: 2014 Final Report
Page F-49
Table F.8. (continued) Length of Enrollment in WIC for Women WIC Participants for Most Recent Pregnancy
From First WIC Certification to April 30, 2014, by Participant Category and Statea
Region and State Pregnant Women
Breastfeeding Women
Postpartum Women
Total WIC Women
Southwest (continued) Five Sandoval Pueblos (NM)
Women in category Number 21 17 21 59 Percent reporting first WIC certification date % 100.0 100.0 100.0 100.0 Mean Weeks 15 40 19 24 Mode Weeks 9 34 3 *
ITC Oklahoma
Women in category Number 77 39 99 215
Percent reporting first WIC certification date % 100.0 100.0 100.0 100.0 Mean Weeks 12 38 31 26 Mode Weeks 16 * 36 16
Muscogee Creek Nation (OK)
Women in category Number 268 112 280 660
Percent reporting first WIC certification date % 99.6 100.0 100.0 99.8 Mean Weeks 15 42 33 27 Mode Weeks 15 34 44 15
Osage Nation (OK)
Women in category Number 175 94 300 569
Percent reporting first WIC certification date % 100.0 100.0 100.0 100.0 Mean Weeks 13 32 26 23 Mode Weeks 1 * 20 16
Otoe Missouria (OK)
Women in category Number 48 17 40 105
Percent reporting first WIC certification date % 100.0 100.0 100.0 100.0 Mean Weeks 15 34 25 22 Mode Weeks 2 * * *
Pueblo of Isleta (NM)
Women in category Number 94 133 58 285
Percent reporting first WIC certification date % 98.9 3.8 0.0 34.4 Mean Weeks 19 19 N/A 19 Mode Weeks 14 * N/A 14
Pueblo of San Felipe (NM)
Women in category Number 19 36 11 66
Percent reporting first WIC certification date % 100.0 100.0 100.0 100.0 Mean Weeks 14 37 26 28 Mode Weeks 15 48 * 15

WIC Participant and Program Characteristics: 2014 Final Report
Page F-50
Table F.8. (continued) Length of Enrollment in WIC for Women WIC Participants for Most Recent Pregnancy
From First WIC Certification to April 30, 2014, by Participant Category and Statea
Region and State Pregnant Women
Breastfeeding Women
Postpartum Women
Total WIC Women
Southwest (continued) Pueblo of Zuni (NM)
Women in category Number 68 83 24 175 Percent reporting first WIC certification date % 100.0 100.0 100.0 100.0 Mean Weeks 14 42 33 30 Mode Weeks 10 34 * 16
Santo Domingo (NM)
Women in category Number 11 19 6 36
Percent reporting first WIC certification date % 100.0 100.0 100.0 100.0 Mean Weeks 18 41 26 31 Mode Weeks 21 * * *
WCD (OK)
Women in category Number 405 174 350 929
Percent reporting first WIC certification date % 100.0 100.0 100.0 100.0 Mean Weeks 13 42 31 25 Mode Weeks 3 * 42 3
Mountain Plains
Colorado
Women in category Number 9,490 7,391 7,679 24,560 Percent reporting first WIC certification date % 100.0 100.0 100.0 100.0 Mean Weeks 13 20 15 16 Mode Weeks 3 3 17 3
Iowa
Women in category Number 6,873 4,147 6,163 17,183
Percent reporting first WIC certification date % 99.9 100.0 100.0 99.9 Mean Weeks 14 39 32 27 Mode Weeks 1 34 36 14
Kansas
Women in category Number 7,161 4,925 5,909 17,995
Percent reporting first WIC certification date % 99.9 99.9 100.0 99.9 Mean Weeks 14 42 34 28 Mode Weeks 2 36 36 14

WIC Participant and Program Characteristics: 2014 Final Report
Page F-51
Table F.8. (continued) Length of Enrollment in WIC for Women WIC Participants for Most Recent Pregnancy
From First WIC Certification to April 30, 2014, by Participant Category and Statea
Region and State Pregnant Women
Breastfeeding Women
Postpartum Women
Total WIC Women
Mountain Plains (continued) Missouri
Women in category Number 15,615 8,280 14,223 38,118 Percent reporting first WIC certification date % 99.9 100.0 100.0 100.0 Mean Weeks 14 41 35 28 Mode Weeks 4 40 37 16
Montana
Women in category Number 1,984 1,616 1,269 4,869
Percent reporting first WIC certification date % 99.9 100.0 100.0 100.0 Mean Weeks 14 41 32 28 Mode Weeks 4 39 42 8
North Dakota
Women in category Number 1,298 853 1,058 3,209
Percent reporting first WIC certification date % 99.9 99.9 99.9 99.9 Mean Weeks 14 22 16 17 Mode Weeks 14 3 * 3
South Dakota
Women in category Number 1,793 1,331 1,611 4,735
Percent reporting first WIC certification date % 99.6 99.9 99.9 99.8 Mean Weeks 13 31 28 23 Mode Weeks 5 33 32 32
Utah
Women in category Number 6,609 6,737 4,215 17,561
Percent reporting first WIC certification date % 100.0 100.0 100.0 100.0 Mean Weeks 14 21 15 17 Mode Weeks 8 1 17 4
Wyoming
Women in category Number 1,098 843 791 2,732
Percent reporting first WIC certification date % 100.0 100.0 100.0 100.0 Mean Weeks 13 20 14 16 Mode Weeks 1 1 14 1
Cheyenne River Sioux (SD)
Women in category Number 68 22 48 138
Percent reporting first WIC certification date % 100.0 100.0 97.9 99.3 Mean Weeks 16 37 36 26 Mode Weeks 28 43 44 *

WIC Participant and Program Characteristics: 2014 Final Report
Page F-52
Table F.8. (continued) Length of Enrollment in WIC for Women WIC Participants for Most Recent Pregnancy
From First WIC Certification to April 30, 2014, by Participant Category and Statea
Region and State Pregnant Women
Breastfeeding Women
Postpartum Women
Total WIC Women
Mountain Plains (continued) Eastern Shoshone (WY)
Women in category Number 15 10 16 41 Percent reporting first WIC certification date % 100.0 100.0 100.0 100.0 Mean Weeks 15 19 14 16 Mode Weeks 14 16 * *
Northern Arapahoe (WY)
Women in category Number 38 32 31 101
Percent reporting first WIC certification date % 100.0 100.0 100.0 100.0 Mean Weeks 16 28 26 23 Mode Weeks * 13 7 13
Omaha Nation (NE)
Women in category Number 30 2 10 42
Percent reporting first WIC certification date % 100.0 100.0 100.0 100.0 Mean Weeks 17 49 38 24 Mode Weeks 9 * 27 9
Rosebud Sioux (SD)
Women in category Number 113 88 71 272
Percent reporting first WIC certification date % 100.0 100.0 100.0 100.0 Mean Weeks 13 26 18 18 Mode Weeks 5 20 * *
Santee Sioux (NE)
Women in category Number 17 2 8 27
Percent reporting first WIC certification date % 94.1 100.0 100.0 96.3 Mean Weeks 18 57 42 28 Mode Weeks * * * *
Standing Rock Sioux (ND)
Women in category Number 95 14 52 161
Percent reporting first WIC certification date % 98.9 100.0 98.1 98.8 Mean Weeks 14 32 34 22 Mode Weeks 6 53 * 16
Three Affiliated (ND)
Women in category Number 35 6 27 68
Percent reporting first WIC certification date % 100.0 100.0 96.3 98.5 Mean Weeks 17 33 21 20 Mode Weeks 13 * 24 *

WIC Participant and Program Characteristics: 2014 Final Report
Page F-53
Table F.8. (continued) Length of Enrollment in WIC for Women WIC Participants for Most Recent Pregnancy
From First WIC Certification to April 30, 2014, by Participant Category and Statea
Region and State Pregnant Women
Breastfeeding Women
Postpartum Women
Total WIC Women
Mountain Plains (continued) Ute Mountain Ute (CO)
Women in category Number 22 7 10 39 Percent reporting first WIC certification date % 100.0 100.0 100.0 100.0 Mean Weeks 14 56 32 26 Mode Weeks * * 45 *
Winnebago (NE)
Women in category Number 30 18 12 60
Percent reporting first WIC certification date % 93.3 100.0 91.7 95.0 Mean Weeks 20 26 38 26 Mode Weeks * 41 * 16
Western
Alaska
Women in category Number 2,168 2,083 1,182 5,433 Percent reporting first WIC certification date % 99.7 99.9 100.0 99.8 Mean Weeks 14 41 32 28 Mode Weeks 5 34 26 13
American Samoa
Women in category Number 427 725 182 1,334
Percent reporting first WIC certification date % 100.0 91.3 91.8 94.2 Mean Weeks 12 47 36 34 Mode Weeks 1 32 * 1
Arizona
Women in category Number 17,274 14,432 14,357 46,063
Percent reporting first WIC certification date % 99.9 95.8 95.9 97.4 Mean Weeks 14 43 36 30 Mode Weeks 1 36 40 14
Guam
Women in category Number 644 703 686 2,033
Percent reporting first WIC certification date % 99.8 92.7 92.4 94.9 Mean Weeks 12 40 35 29 Mode Weeks 7 39 * 13

WIC Participant and Program Characteristics: 2014 Final Report
Page F-54
Table F.8. (continued) Length of Enrollment in WIC for Women WIC Participants for Most Recent Pregnancy
From First WIC Certification to April 30, 2014, by Participant Category and Statea
Region and State Pregnant Women
Breastfeeding Women
Postpartum Women
Total WIC Women
Western (continued) Hawaii
Women in category Number 3,427 4,003 2,068 9,498 Percent reporting first WIC certification date % 100.0 74.3 75.1 83.7 Mean Weeks 14 45 38 30 Mode Weeks 1 42 36 14
Idaho
Women in category Number 4,424 3,830 2,612 10,866
Percent reporting first WIC certification date % 100.0 100.0 100.0 100.0 Mean Weeks 14 43 33 29 Mode Weeks 1 38 50 13
Nevada
Women in category Number 6,466 5,036 7,073 18,575
Percent reporting first WIC certification date % 55.7 61.0 62.2 59.6 Mean Weeks 13 39 36 29 Mode Weeks 1 33 34 14
Northern Mariana Islands
Women in category Number 340 288 204 832
Percent reporting first WIC certification date % 100.0 93.8 94.6 96.5 Mean Weeks 14 48 45 33 Mode Weeks 12 42 57 12
Washington
Women in category Number 23,675 14,932 8,196 46,803
Percent reporting first WIC certification date % 99.6 100.0 100.0 99.8 Mean Weeks 17 23 14 19 Mode Weeks 14 10 6 14
ITC Arizona (AZ)
Women in category Number 979 592 954 2,525
Percent reporting first WIC certification date % 99.8 99.7 100.0 99.8 Mean Weeks 14 42 32 27 Mode Weeks 14 * 40 14
ITC Nevada (NV)
Women in category Number 136 106 98 340
Percent reporting first WIC certification date % 52.9 56.6 52.0 53.8 Mean Weeks 14 39 36 28 Mode Weeks 3 32 34 *
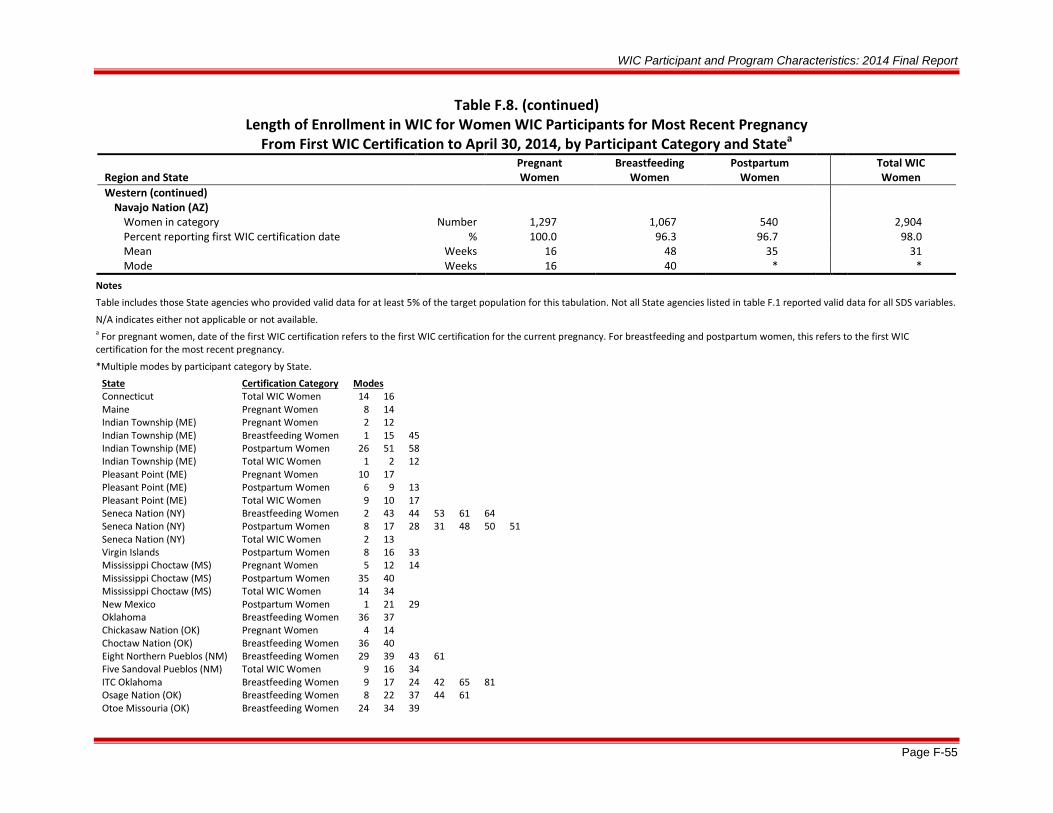
WIC Participant and Program Characteristics: 2014 Final Report
Page F-55
Table F.8. (continued) Length of Enrollment in WIC for Women WIC Participants for Most Recent Pregnancy
From First WIC Certification to April 30, 2014, by Participant Category and Statea
Region and State Pregnant Women
Breastfeeding Women
Postpartum Women
Total WIC Women
Western (continued) Navajo Nation (AZ)
Women in category Number 1,297 1,067 540 2,904 Percent reporting first WIC certification date % 100.0 96.3 96.7 98.0 Mean Weeks 16 48 35 31 Mode Weeks 16 40 * *
Notes
Table includes those State agencies who provided valid data for at least 5% of the target population for this tabulation. Not all State agencies listed in table F.1 reported valid data for all SDS variables.
N/A indicates either not applicable or not available. a For pregnant women, date of the first WIC certification refers to the first WIC certification for the current pregnancy. For breastfeeding and postpartum women, this refers to the first WIC certification for the most recent pregnancy.
*Multiple modes by participant category by State.
State Certification Category Modes Connecticut Total WIC Women 14 16
Maine Pregnant Women 8 14 Indian Township (ME) Pregnant Women 2 12 Indian Township (ME) Breastfeeding Women 1 15 45
Indian Township (ME) Postpartum Women 26 51 58 Indian Township (ME) Total WIC Women 1 2 12 Pleasant Point (ME) Pregnant Women 10 17
Pleasant Point (ME) Postpartum Women 6 9 13 Pleasant Point (ME) Total WIC Women 9 10 17 Seneca Nation (NY) Breastfeeding Women 2 43 44 53 61 64
Seneca Nation (NY) Postpartum Women 8 17 28 31 48 50 51 Seneca Nation (NY) Total WIC Women 2 13
Virgin Islands Postpartum Women 8 16 33 Mississippi Choctaw (MS) Pregnant Women 5 12 14 Mississippi Choctaw (MS) Postpartum Women 35 40
Mississippi Choctaw (MS) Total WIC Women 14 34 New Mexico Postpartum Women 1 21 29
Oklahoma Breastfeeding Women 36 37 Chickasaw Nation (OK) Pregnant Women 4 14 Choctaw Nation (OK) Breastfeeding Women 36 40 Eight Northern Pueblos (NM) Breastfeeding Women 29 39 43 61
Five Sandoval Pueblos (NM) Total WIC Women 9 16 34 ITC Oklahoma Breastfeeding Women 9 17 24 42 65 81
Osage Nation (OK) Breastfeeding Women 8 22 37 44 61 Otoe Missouria (OK) Breastfeeding Women 24 34 39

WIC Participant and Program Characteristics: 2014 Final Report
Page F-56
Otoe Missouria (OK) Postpartum Women 3 4 5 6 7 16 20 21 28 32 Otoe Missouria (OK) Total WIC Women 3 10
Pueblo of Isleta (NM) Breastfeeding Women 5 20 22 23 27 Pueblo of San Felipe (NM) Postpartum Women 8 9 12 15 16 21 25 34 35 51 55
Pueblo of Zuni (NM) Postpartum Women 16 25 41 42 52 Santo Domingo (NM) Breastfeeding Women 6 34 68
Santo Domingo (NM) Postpartum Women 5 8 21 34 38 48 Santo Domingo (NM) Total WIC Women 21 34
WCD (OK) Breastfeeding Women 33 40 41 North Dakota Postpartum Women 13 21
Cheyenne River Sioux (SD) Total WIC Women 13 17 Eastern Shoshone (WY) Postpartum Women 6 16 Eastern Shoshone (WY) Total WIC Women 14 16 Northern Arapahoe (WY) Pregnant Women 12 13 Omaha Nation (NE) Breastfeeding Women 39 58 Rosebud Sioux (SD) Postpartum Women 15 17 Rosebud Sioux (SD) Total WIC Women 15 17 Santee Sioux (NE) Pregnant Women 1 3 4 7 8 13 14 16 18 22 23 25 31 32 33 34
Santee Sioux (NE) Breastfeeding Women 47 66 Santee Sioux (NE) Postpartum Women 5 38 39 44 45 46 57 62
Santee Sioux (NE) Total WIC Women 1 3 4 5 7 8 13 14 16 18 22 23 25 31 32 33 34 38 39 44 45 46 47 57 62 66 Standing Rock Sioux (ND) Postpartum Women 33 41
Three Affiliated (ND) Breastfeeding Women 3 24 31 34 50 56 Three Affiliated (ND) Total WIC Women 8 13
Ute Mountain Ute (CO) Pregnant Women 7 17 Ute Mountain Ute (CO) Breastfeeding Women 24 45 46 48 72 75 80
Ute Mountain Ute (CO) Total WIC Women 7 17 45 Winnebago (NE) Pregnant Women 2 12 16 25 36
Winnebago (NE) Postpartum Women 10 11 22 26 32 37 45 46 52 55 77 American Samoa Postpartum Women 27 36
Guam Postpartum Women 24 36 ITC Arizona (AZ) Breastfeeding Women 36 48 ITC Nevada (NV) Total WIC Women 3 12 Navajo Nation (AZ) Postpartum Women 27 40 Navajo Nation (AZ) Total WIC Women 14 16
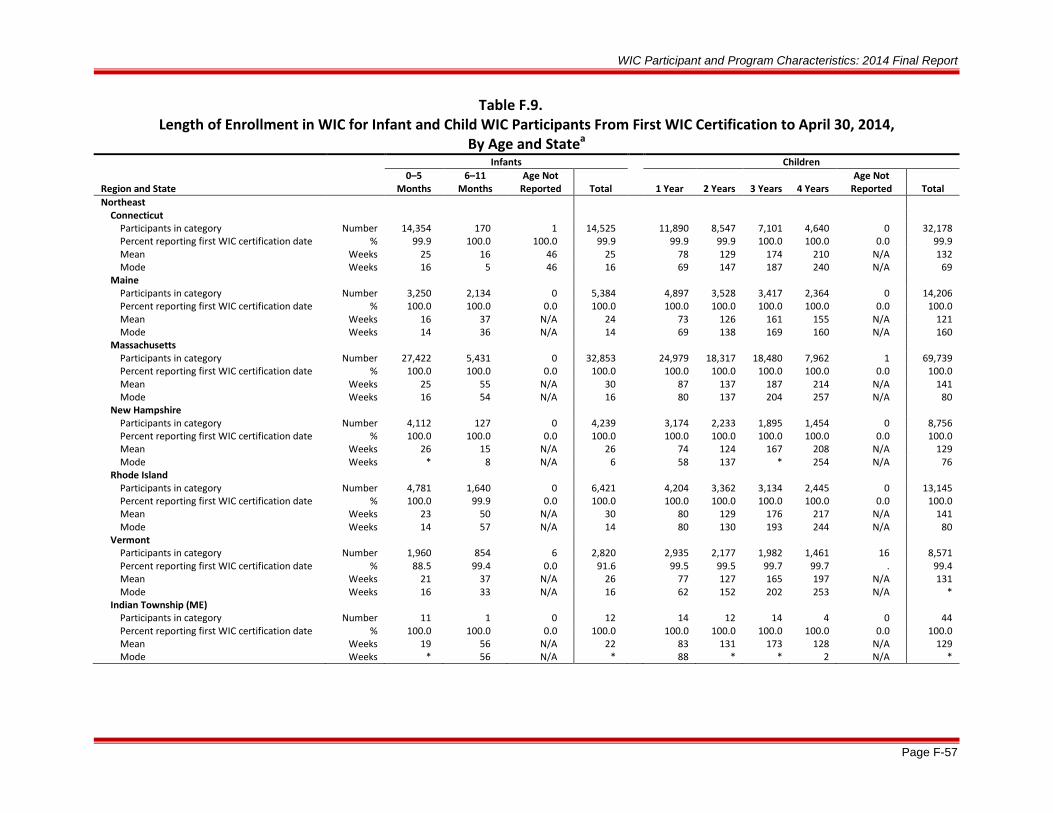
WIC Participant and Program Characteristics: 2014 Final Report
Page F-57
Table F.9. Length of Enrollment in WIC for Infant and Child WIC Participants From First WIC Certification to April 30, 2014,
By Age and Statea
Infants Children
Region and State
0–5 Months
6–11 Months
Age Not Reported Total
1 Year 2 Years 3 Years 4 Years
Age Not Reported Total
Northeast
Connecticut
Participants in category Number 14,354 170 1 14,525 11,890 8,547 7,101 4,640 0 32,178 Percent reporting first WIC certification date % 99.9 100.0 100.0 99.9 99.9 99.9 100.0 100.0 0.0 99.9 Mean Weeks 25 16 46 25 78 129 174 210 N/A 132 Mode Weeks 16 5 46 16 69 147 187 240 N/A 69
Maine
Participants in category Number 3,250 2,134 0 5,384 4,897 3,528 3,417 2,364 0 14,206
Percent reporting first WIC certification date % 100.0 100.0 0.0 100.0 100.0 100.0 100.0 100.0 0.0 100.0 Mean Weeks 16 37 N/A 24 73 126 161 155 N/A 121 Mode Weeks 14 36 N/A 14 69 138 169 160 N/A 160
Massachusetts
Participants in category Number 27,422 5,431 0 32,853 24,979 18,317 18,480 7,962 1 69,739
Percent reporting first WIC certification date % 100.0 100.0 0.0 100.0 100.0 100.0 100.0 100.0 0.0 100.0 Mean Weeks 25 55 N/A 30 87 137 187 214 N/A 141 Mode Weeks 16 54 N/A 16 80 137 204 257 N/A 80
New Hampshire
Participants in category Number 4,112 127 0 4,239 3,174 2,233 1,895 1,454 0 8,756
Percent reporting first WIC certification date % 100.0 100.0 0.0 100.0 100.0 100.0 100.0 100.0 0.0 100.0 Mean Weeks 26 15 N/A 26 74 124 167 208 N/A 129 Mode Weeks * 8 N/A 6 58 137 * 254 N/A 76
Rhode Island
Participants in category Number 4,781 1,640 0 6,421 4,204 3,362 3,134 2,445 0 13,145
Percent reporting first WIC certification date % 100.0 99.9 0.0 100.0 100.0 100.0 100.0 100.0 0.0 100.0 Mean Weeks 23 50 N/A 30 80 129 176 217 N/A 141 Mode Weeks 14 57 N/A 14 80 130 193 244 N/A 80
Vermont
Participants in category Number 1,960 854 6 2,820 2,935 2,177 1,982 1,461 16 8,571
Percent reporting first WIC certification date % 88.5 99.4 0.0 91.6 99.5 99.5 99.7 99.7 . 99.4 Mean Weeks 21 37 N/A 26 77 127 165 197 N/A 131 Mode Weeks 16 33 N/A 16 62 152 202 253 N/A *
Indian Township (ME)
Participants in category Number 11 1 0 12 14 12 14 4 0 44
Percent reporting first WIC certification date % 100.0 100.0 0.0 100.0 100.0 100.0 100.0 100.0 0.0 100.0 Mean Weeks 19 56 N/A 22 83 131 173 128 N/A 129 Mode Weeks * 56 N/A * 88 * * 2 N/A *

WIC Participant and Program Characteristics: 2014 Final Report
Page F-58
Table F.9. (continued) Length of Enrollment in WIC for Infant and Child WIC Participants From First WIC Certification to April 30, 2014,
By Age and Statea Infants Children
Region and State 0–5
Months 6–11
Months Age Not
Reported Total
1 Year 2 Years 3 Years 4 Years Age Not
Reported Total Northeast (continued)
Pleasant Point (ME)
Participants in category Number 21 1 0 22 22 7 6 10 0 45
Percent reporting first WIC certification date % 100.0 100.0 0.0 100.0 100.0 100.0 100.0 100.0 0.0 100.0 Mean Weeks 29 30 N/A 29 75 126 88 203 N/A 113 Mode Weeks * 30 N/A * * * * 241 N/A 91
Seneca Nation (NY)
Participants in category Number 41 15 0 56 21 17 10 9 0 57
Percent reporting first WIC certification date % 100.0 100.0 0.0 100.0 100.0 100.0 100.0 100.0 0.0 100.0 Mean Weeks 17 36 N/A 22 70 110 130 206 N/A 114 Mode Weeks 13 35 N/A 13 69 130 * * N/A *
Mid-Atlantic
Delaware
Participants in category Number 5,558 747 1 6,306 5,275 3,244 2,934 1,201 0 12,654 Percent reporting first WIC certification date % 100.0 100.0 100.0 100.0 100.0 100.0 100.0 100.0 0.0 100.0 Mean Weeks 26 62 52 30 76 80 83 87 N/A 80 Mode Weeks 12 70 52 12 73 78 73 82 N/A 73
District of Columbia
Participants in category Number 4,879 53 0 4,932 2,901 1,887 1,640 1,123 0 7,551
Percent reporting first WIC certification date % 100.0 100.0 0.0 100.0 100.0 100.0 100.0 100.0 0.0 100.0 Mean Weeks 26 12 N/A 26 76 128 171 216 N/A 130 Mode Weeks 20 3 N/A 20 64 136 181 237 N/A 64
Maryland
Participants in category Number 34,603 3,969 14 38,586 28,220 21,142 18,060 11,323 19 78,764
Percent reporting first WIC certification date % 100.0 100.0 0.0 100.0 100.0 100.0 100.0 100.0 5.3 100.0 Mean Weeks 26 62 N/A 30 83 134 181 219 199 139 Mode Weeks 14 66 N/A 14 69 118 188 240 199 69
New Jersey
Participants in category Number 22,978 15,362 0 38,340 31,882 22,763 20,152 14,623 0 89,420
Percent reporting first WIC certification date % 99.9 99.9 0.0 99.9 99.7 99.8 99.7 99.6 0.0 99.7 Mean Weeks 14 37 N/A 23 74 126 173 213 N/A 132 Mode Weeks 16 42 N/A 16 69 138 185 233 N/A 69
Pennsylvania
Participants in category Number 61,638 1,129 1 62,768 55,976 36,776 30,545 18,130 3 141,430
Percent reporting first WIC certification date % 98.6 98.9 0.0 98.6 99.2 99.2 99.3 99.5 0.0 99.2 Mean Weeks 25 22 N/A 25 67 89 100 108 N/A 85 Mode Weeks 14 5 N/A 14 56 14 14 8 N/A 14

WIC Participant and Program Characteristics: 2014 Final Report
Page F-59
Table F.9. (continued) Length of Enrollment in WIC for Infant and Child WIC Participants From First WIC Certification to April 30, 2014,
By Age and Statea Infants Children
Region and State 0–5
Months 6–11
Months Age Not
Reported Total
1 Year 2 Years 3 Years 4 Years Age Not
Reported Total Mid-Atlantic (continued)
Virginia
Participants in category Number 38,422 668 1 39,091 35,875 20,462 17,926 9,781 6 84,051
Percent reporting first WIC certification date % 100.0 100.0 100.0 100.0 100.0 100.0 100.0 100.0 0.0 100.0 Mean Weeks 24 18 41 24 79 131 176 207 N/A 127 Mode Weeks 8 1 41 8 59 155 199 251 N/A 59
Virgin Islands
Participants in category Number 1,033 34 0 1,067 893 718 613 513 0 2,737
Percent reporting first WIC certification date % 100.0 100.0 0.0 100.0 100.0 100.0 100.0 100.0 0.0 100.0 Mean Weeks 24 42 N/A 25 77 127 179 225 N/A 141 Mode Weeks 10 * N/A 10 81 137 184 236 N/A 81
West Virginia
Participants in category Number 11,958 248 0 12,206 9,762 5,967 5,398 3,618 1 24,746
Percent reporting first WIC certification date % 98.7 98.4 0.0 98.7 99.8 99.8 99.8 100.0 0.0 99.8 Mean Weeks 27 24 N/A 27 78 131 178 219 N/A 133 Mode Weeks 32 13 N/A 17 69 145 190 249 N/A 69
Southeast
Alabama
Participants in category Number 33,962 1,731 0 35,693 25,853 17,555 15,002 11,282 0 69,692 Percent reporting first WIC certification date % 100.0 100.0 0.0 100.0 100.0 100.0 100.0 100.0 0.0 100.0 Mean Weeks 25 34 N/A 25 75 123 166 205 N/A 128 Mode Weeks 16 53 N/A 13 69 * 190 242 N/A 69
Florida
Participants in category Number 129,649 3,431 2 133,082 114,186 81,731 66,607 37,009 0 299,533
Percent reporting first WIC certification date % 100.0 100.0 0.0 100.0 100.0 100.0 100.0 100.0 0.0 100.0 Mean Weeks 26 22 N/A 26 81 134 179 210 N/A 133 Mode Weeks 34 4 N/A 17 86 138 * 239 N/A 86
Georgia
Participants in category Number 71,852 876 866 73,594 70,593 37,290 33,044 19,484 1,799 162,210
Percent reporting first WIC certification date % 100.0 100.0 0.2 98.8 100.0 100.0 100.0 100.0 0.1 98.9 Mean Weeks 24 7 40 24 27 20 21 16 7 23 Mode Weeks 16 1 * 16 16 16 16 16 7 16
Mississippi
Participants in category Number 21,718 690 55 22,463 14,611 10,282 9,139 7,061 45 41,138
Percent reporting first WIC certification date % 98.0 99.9 1.8 97.8 99.9 100.0 100.0 100.0 11.1 99.9 Mean Weeks 24 23 171 24 24 26 28 27 52 26 Mode Weeks 6 28 171 6 17 16 16 20 * 16

WIC Participant and Program Characteristics: 2014 Final Report
Page F-60
Table F.9. (continued) Length of Enrollment in WIC for Infant and Child WIC Participants From First WIC Certification to April 30, 2014,
By Age and Statea Infants Children
Region and State 0–5
Months 6–11
Months Age Not
Reported Total
1 Year 2 Years 3 Years 4 Years Age Not
Reported Total Southeast (continued)
South Carolina
Participants in category Number 34,725 389 11 35,125 21,477 13,548 11,356 8,092 14 54,487
Percent reporting first WIC certification date % 100.0 100.0 36.4 100.0 100.0 100.0 100.0 100.0 0.0 100.0 Mean Weeks 27 22 40 26 78 130 176 217 N/A 132 Mode Weeks 34 12 * 34 69 141 189 242 N/A 69
Mississippi Choctaw (MS)
Participants in category Number 182 1 0 183 142 128 112 88 0 470
Percent reporting first WIC certification date % 100.0 100.0 0.0 100.0 100.0 100.0 100.0 100.0 0.0 100.0 Mean Weeks 28 52 N/A 28 82 132 186 238 N/A 150 Mode Weeks * 52 N/A * 61 * 186 * N/A *
Midwest
Illinois
Participants in category Number 74,967 834 5 75,806 52,833 45,919 33,698 19,254 0 151,704 Percent reporting first WIC certification date % 100.0 100.0 100.0 100.0 100.0 100.0 100.0 100.0 0.0 100.0 Mean Weeks 26.0 13.0 34.0 26.0 65.0 111.0 149.0 177.0 N/A 112.0 Mode Weeks 16 13 * 16 69 144 198 251 N/A 27
Indiana
Participants in category Number 43,333 1,422 1 44,756 29,727 21,625 19,108 14,340 0 84,800
Percent reporting first WIC certification date % 100.0 100.0 0.0 100.0 100.0 100.0 100.0 100.0 0.0 100.0 Mean Weeks 26 36 N/A 26 76 128 176 218 N/A 136 Mode Weeks 16 16 N/A 16 69 137 192 235 N/A 69
Michigan
Participants in category Number 60,662 859 1 61,522 74,131 40,197 36,629 14,264 64 165,285
Percent reporting first WIC certification date % 100.0 100.0 0.0 100.0 100.0 100.0 100.0 100.0 0.0 100.0 Mean Weeks 26 22 N/A 26 89 150 199 225 N/A 140 Mode Weeks 16 51 N/A 16 74 157 * 257 N/A 74
Minnesota
Participants in category Number 21,638 6,430 0 28,068 25,078 18,633 17,517 12,162 0 73,390
Percent reporting first WIC certification date % 100.0 100.0 0.0 100.0 100.0 100.0 100.0 100.0 0.0 100.0 Mean Weeks 20 39 N/A 24 75 126 175 216 N/A 135 Mode Weeks 16 44 N/A 26 69 138 189 238 N/A 86
Wisconsin
Participants in category Number 27,160 1,672 0 28,832 22,329 15,548 14,367 10,289 0 62,533
Percent reporting first WIC certification date % 97.8 98.5 0.0 97.8 99.3 99.5 99.5 99.6 0.0 99.5 Mean Weeks 25 47 N/A 26 72 104 128 150 N/A 105 Mode Weeks 16 * N/A 16 69 137 202 242 N/A 58

WIC Participant and Program Characteristics: 2014 Final Report
Page F-61
Table F.9. (continued) Length of Enrollment in WIC for Infant and Child WIC Participants From First WIC Certification to April 30, 2014,
By Age and Statea Infants Children
Region and State 0–5
Months 6–11
Months Age Not
Reported Total
1 Year 2 Years 3 Years 4 Years Age Not
Reported Total Southwest
Arkansas
Participants in category Number 22,135 1,728 0 23,863 17,307 11,724 10,094 7,138 1 46,264
Percent reporting first WIC certification date % 100.0 100.0 0.0 100.0 100.0 100.0 100.0 100.0 0.0 100.0 Mean Weeks 23.0 32.0 N/A 24.0 75.0 129.0 176.0 218.0 N/A 133.0 Mode Weeks 16 48 N/A 16 69 121 188 230 N/A 53
Louisiana
Participants in category Number 40,591 462 1 41,054 26,926 16,354 13,770 9,813 0 66,863
Percent reporting first WIC certification date % 100.0 100.0 100.0 100.0 100.0 100.0 100.0 100.0 0.0 100.0 Mean Weeks 25 19 24 25 77 132 180 222 N/A 133 Mode Weeks 16 4 24 16 69 136 180 241 N/A 69
New Mexico
Participants in category Number 14,080 248 1 14,329 12,394 8,672 7,531 4,645 7 33,249
Percent reporting first WIC certification date % 0.1 0.0 0.0 0.1 93.4 92.7 92.7 95.2 0.0 93.3 Mean Weeks 36 N/A N/A 36 81 135 184 222 N/A 138 Mode Weeks 40 N/A N/A 40 69 121 201 236 N/A 86
Oklahoma
Participants in category Number 23,682 259 3 23,944 19,697 17,301 12,259 5,296 2 54,555
Percent reporting first WIC certification date % 88.2 86.9 100.0 88.2 80.7 89.9 91.4 95.2 0.0 87.4 Mean Weeks 24 8 46 23 73 132 180 212 N/A 132 Mode Weeks 4 4 47 4 60 146 202 250 N/A 88
Texas
Participants in category Number 240,384 3,687 6 244,077 236,108 141,350 124,384 48,111 2 549,955
Percent reporting first WIC certification date % 100.0 100.0 0.0 100.0 100.0 100.0 100.0 100.0 0.0 100.0 Mean Weeks 27 11 N/A 27 90 146 193 208 N/A 138 Mode Weeks 16 1 N/A 16 86 171 223 262 N/A 86
ACL (NM)
Participants in category Number 93 28 0 121 111 75 89 57 0 332
Percent reporting first WIC certification date % 100.0 100.0 0.0 100.0 100.0 100.0 100.0 100.0 0.0 100.0 Mean Weeks 22 37 N/A 25 75 133 175 213 N/A 139 Mode Weeks 16 29 N/A 16 * 141 * 260 N/A *
Chickasaw Nation (OK)
Participants in category Number 691 372 0 1,063 835 612 553 332 0 2,332
Percent reporting first WIC certification date % 100.0 100.0 0.0 100.0 100.0 100.0 100.0 100.0 0.0 100.0 Mean Weeks 17 35 N/A 24 69 117 147 184 N/A 117 Mode Weeks 3 47 N/A 3 81 * 185 * N/A 81

WIC Participant and Program Characteristics: 2014 Final Report
Page F-62
Table F.9. (continued) Length of Enrollment in WIC for Infant and Child WIC Participants From First WIC Certification to April 30, 2014,
By Age and Statea Infants Children
Region and State 0–5
Months 6–11
Months Age Not
Reported Total
1 Year 2 Years 3 Years 4 Years Age Not
Reported Total Southwest (continued)
Choctaw Nation (OK)
Participants in category Number 554 375 0 929 833 567 516 353 0 2,269
Percent reporting first WIC certification date % 100.0 100.0 0.0 100.0 100.0 100.0 100.0 100.0 0.0 100.0 Mean Weeks 16 37 N/A 24 73 120 164 200 N/A 125 Mode Weeks 8 42 N/A * * 113 * 238 N/A 65
Citizen Potawatomi (OK)
Participants in category Number 279 73 0 352 269 192 148 101 0 710
Percent reporting first WIC certification date % 100.0 100.0 0.0 100.0 100.0 100.0 100.0 100.0 0.0 100.0 Mean Weeks 15 17 N/A 15 18 18 18 17 N/A 18 Mode Weeks 21 21 N/A 21 21 21 21 21 N/A 21
Eight Northern Pueblos (NM)
Participants in category Number 47 19 0 66 72 53 40 15 0 181
Percent reporting first WIC certification date % 100.0 100.0 0.0 100.0 100.0 100.0 100.0 100.0 0.0 100.0 Mean Weeks 21 31 N/A 24 74 124 146 218 N/A 117 Mode Weeks 31 39 N/A 39 96 150 178 257 N/A 96
Five Sandoval Pueblos (NM)
Participants in category Number 48 15 0 63 56 25 34 25 0 140
Percent reporting first WIC certification date % 100.0 100.0 0.0 100.0 100.0 100.0 100.0 100.0 0.0 100.0 Mean Weeks 19 27 N/A 21 70 127 155 205 N/A 125 Mode Weeks 12 38 N/A 12 73 * 212 * N/A 73
ITC Oklahoma
Participants in category Number 230 19 0 249 207 127 126 61 0 521
Percent reporting first WIC certification date % 100.0 100.0 0.0 100.0 100.0 100.0 100.0 100.0 0.0 100.0 Mean Weeks 24 35 N/A 25 75 122 168 193 N/A 123 Mode Weeks 4 43 N/A * 90 137 * 233 N/A *
Muscogee Creek Nation (OK)
Participants in category Number 398 262 0 660 649 454 490 279 0 1,872
Percent reporting first WIC certification date % 100.0 100.0 0.0 100.0 100.0 100.0 100.0 100.0 0.0 100.0 Mean Weeks 15 35 N/A 23 68 113 153 193 N/A 120 Mode Weeks 20 34 N/A * 78 * * * N/A 78
Osage Nation (OK)
Participants in category Number 692 116 0 808 590 415 312 159 0 1,476
Percent reporting first WIC certification date % 100.0 100.0 0.0 100.0 100.0 100.0 100.0 100.0 0.0 100.0 Mean Weeks 22 29 N/A 23 72 118 155 175 N/A 113 Mode Weeks 16 28 N/A 16 69 132 180 247 N/A 69
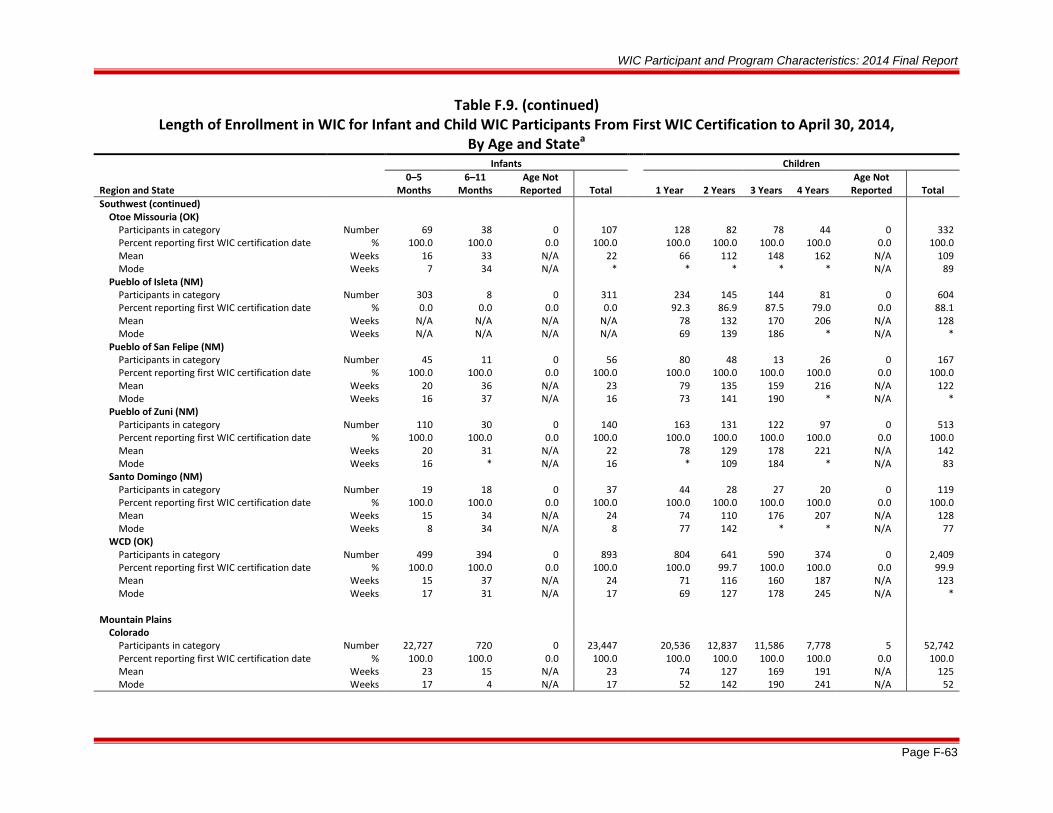
WIC Participant and Program Characteristics: 2014 Final Report
Page F-63
Table F.9. (continued) Length of Enrollment in WIC for Infant and Child WIC Participants From First WIC Certification to April 30, 2014,
By Age and Statea Infants Children
Region and State 0–5
Months 6–11
Months Age Not
Reported Total
1 Year 2 Years 3 Years 4 Years Age Not
Reported Total Southwest (continued)
Otoe Missouria (OK)
Participants in category Number 69 38 0 107 128 82 78 44 0 332
Percent reporting first WIC certification date % 100.0 100.0 0.0 100.0 100.0 100.0 100.0 100.0 0.0 100.0 Mean Weeks 16 33 N/A 22 66 112 148 162 N/A 109 Mode Weeks 7 34 N/A * * * * * N/A 89
Pueblo of Isleta (NM)
Participants in category Number 303 8 0 311 234 145 144 81 0 604
Percent reporting first WIC certification date % 0.0 0.0 0.0 0.0 92.3 86.9 87.5 79.0 0.0 88.1 Mean Weeks N/A N/A N/A N/A 78 132 170 206 N/A 128 Mode Weeks N/A N/A N/A N/A 69 139 186 * N/A *
Pueblo of San Felipe (NM)
Participants in category Number 45 11 0 56 80 48 13 26 0 167
Percent reporting first WIC certification date % 100.0 100.0 0.0 100.0 100.0 100.0 100.0 100.0 0.0 100.0 Mean Weeks 20 36 N/A 23 79 135 159 216 N/A 122 Mode Weeks 16 37 N/A 16 73 141 190 * N/A *
Pueblo of Zuni (NM)
Participants in category Number 110 30 0 140 163 131 122 97 0 513
Percent reporting first WIC certification date % 100.0 100.0 0.0 100.0 100.0 100.0 100.0 100.0 0.0 100.0 Mean Weeks 20 31 N/A 22 78 129 178 221 N/A 142 Mode Weeks 16 * N/A 16 * 109 184 * N/A 83
Santo Domingo (NM)
Participants in category Number 19 18 0 37 44 28 27 20 0 119
Percent reporting first WIC certification date % 100.0 100.0 0.0 100.0 100.0 100.0 100.0 100.0 0.0 100.0 Mean Weeks 15 34 N/A 24 74 110 176 207 N/A 128 Mode Weeks 8 34 N/A 8 77 142 * * N/A 77
WCD (OK)
Participants in category Number 499 394 0 893 804 641 590 374 0 2,409
Percent reporting first WIC certification date % 100.0 100.0 0.0 100.0 100.0 99.7 100.0 100.0 0.0 99.9 Mean Weeks 15 37 N/A 24 71 116 160 187 N/A 123 Mode Weeks 17 31 N/A 17 69 127 178 245 N/A *
Mountain Plains
Colorado
Participants in category Number 22,727 720 0 23,447 20,536 12,837 11,586 7,778 5 52,742 Percent reporting first WIC certification date % 100.0 100.0 0.0 100.0 100.0 100.0 100.0 100.0 0.0 100.0 Mean Weeks 23 15 N/A 23 74 127 169 191 N/A 125 Mode Weeks 17 4 N/A 17 52 142 190 241 N/A 52

WIC Participant and Program Characteristics: 2014 Final Report
Page F-64
Table F.9. (continued) Length of Enrollment in WIC for Infant and Child WIC Participants From First WIC Certification to April 30, 2014,
By Age and Statea Infants Children
Region and State 0–5
Months 6–11
Months Age Not
Reported Total
1 Year 2 Years 3 Years 4 Years Age Not
Reported Total Mountain Plains (continued)
Iowa
Participants in category Number 17,645 225 6 17,876 15,817 10,774 8,764 4,601 12 39,968
Percent reporting first WIC certification date % 100.0 100.0 66.7 100.0 100.0 100.0 100.0 100.0 0.0 100.0 Mean Weeks 26 18 38 26 54 73 79 75 N/A 67 Mode Weeks 34 6 * 34 54 * 16 16 N/A 16
Kansas
Participants in category Number 17,483 511 1 17,995 13,878 9,887 8,886 6,775 0 39,426
Percent reporting first WIC certification date % 100.0 100.0 0.0 100.0 100.0 100.0 100.0 100.0 0.0 100.0 Mean Weeks 25 15 N/A 25 75 125 170 210 N/A 132 Mode Weeks 16 6 N/A 16 66 132 185 240 N/A 66
Missouri
Participants in category Number 20,671 16,411 0 37,082 26,909 17,958 15,520 11,865 0 72,252
Percent reporting first WIC certification date % 100.0 100.0 0.0 100.0 100.0 100.0 100.0 100.0 0.0 100.0 Mean Weeks 15 36 N/A 24 74 127 174 217 N/A 132 Mode Weeks 16 42 N/A 16 69 142 183 242 N/A 69
Montana
Participants in category Number 2,990 1,836 0 4,826 4,075 2,968 2,644 1,772 0 11,459
Percent reporting first WIC certification date % 100.0 100.0 0.0 100.0 100.0 100.0 100.0 100.0 0.0 100.0 Mean Weeks 17 35 N/A 24 71 123 167 207 N/A 127 Mode Weeks * 37 N/A 37 52 138 188 230 N/A 52
North Dakota
Participants in category Number 3,251 68 2 3,321 2,603 2,078 1,548 887 3 7,119
Percent reporting first WIC certification date % 100.0 100.0 0.0 99.9 100.0 100.0 100.0 100.0 33.3 100.0 Mean Weeks 26 9 N/A 25 37 54 58 60 59 49 Mode Weeks 34 3 N/A 34 39 56 14 8 59 4
South Dakota
Participants in category Number 4,479 385 30 4,894 4,717 2,854 2,576 1,418 11 11,576
Percent reporting first WIC certification date % 100.0 100.0 0.0 99.4 100.0 100.0 100.0 100.0 0.0 99.9 Mean Weeks 23 26 N/A 23 38 36 36 34 N/A 37 Mode Weeks 33 33 N/A 33 33 33 33 33 N/A 33
Utah
Participants in category Number 15,413 496 0 15,909 14,938 9,090 8,219 4,815 0 37,062
Percent reporting first WIC certification date % 100.0 100.0 0.0 100.0 100.0 96.4 97.2 98.3 0.0 98.3 Mean Weeks 23 12 N/A 23 75 128 152 140 N/A 113 Mode Weeks 17 2 N/A 17 52 130 148 157 N/A 157
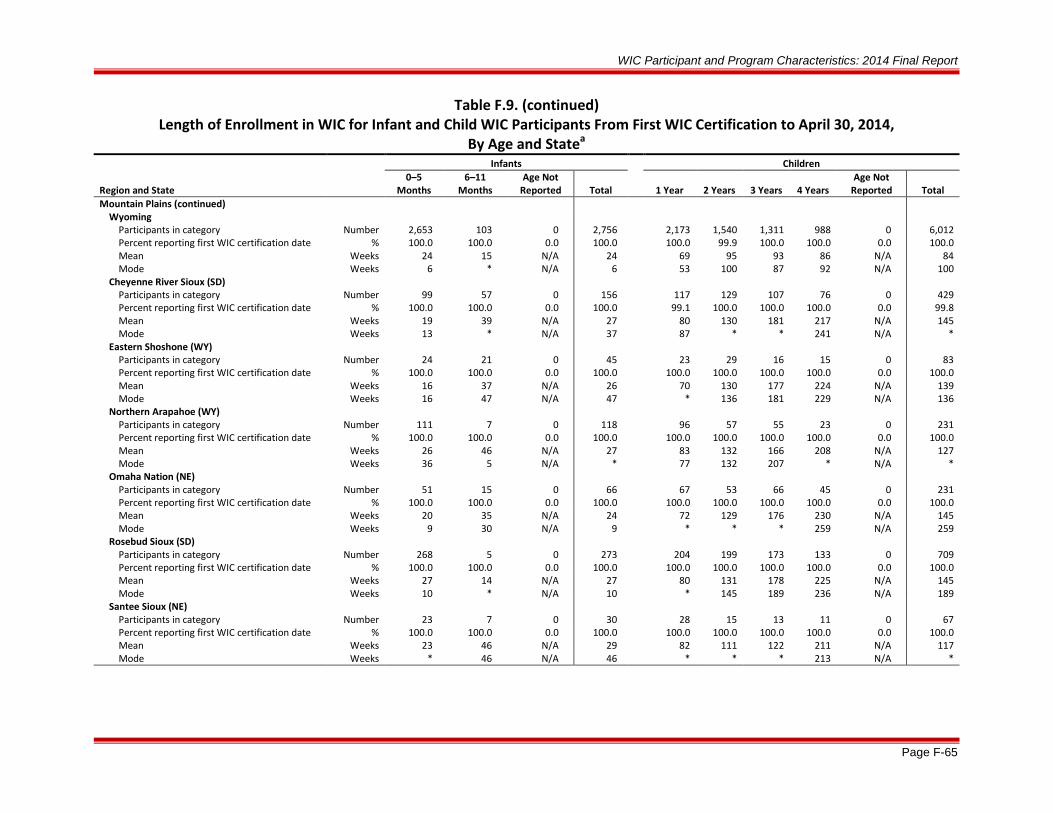
WIC Participant and Program Characteristics: 2014 Final Report
Page F-65
Table F.9. (continued) Length of Enrollment in WIC for Infant and Child WIC Participants From First WIC Certification to April 30, 2014,
By Age and Statea Infants Children
Region and State 0–5
Months 6–11
Months Age Not
Reported Total
1 Year 2 Years 3 Years 4 Years Age Not
Reported Total Mountain Plains (continued)
Wyoming
Participants in category Number 2,653 103 0 2,756 2,173 1,540 1,311 988 0 6,012
Percent reporting first WIC certification date % 100.0 100.0 0.0 100.0 100.0 99.9 100.0 100.0 0.0 100.0 Mean Weeks 24 15 N/A 24 69 95 93 86 N/A 84 Mode Weeks 6 * N/A 6 53 100 87 92 N/A 100
Cheyenne River Sioux (SD)
Participants in category Number 99 57 0 156 117 129 107 76 0 429
Percent reporting first WIC certification date % 100.0 100.0 0.0 100.0 99.1 100.0 100.0 100.0 0.0 99.8 Mean Weeks 19 39 N/A 27 80 130 181 217 N/A 145 Mode Weeks 13 * N/A 37 87 * * 241 N/A *
Eastern Shoshone (WY)
Participants in category Number 24 21 0 45 23 29 16 15 0 83
Percent reporting first WIC certification date % 100.0 100.0 0.0 100.0 100.0 100.0 100.0 100.0 0.0 100.0 Mean Weeks 16 37 N/A 26 70 130 177 224 N/A 139 Mode Weeks 16 47 N/A 47 * 136 181 229 N/A 136
Northern Arapahoe (WY)
Participants in category Number 111 7 0 118 96 57 55 23 0 231
Percent reporting first WIC certification date % 100.0 100.0 0.0 100.0 100.0 100.0 100.0 100.0 0.0 100.0 Mean Weeks 26 46 N/A 27 83 132 166 208 N/A 127 Mode Weeks 36 5 N/A * 77 132 207 * N/A *
Omaha Nation (NE)
Participants in category Number 51 15 0 66 67 53 66 45 0 231
Percent reporting first WIC certification date % 100.0 100.0 0.0 100.0 100.0 100.0 100.0 100.0 0.0 100.0 Mean Weeks 20 35 N/A 24 72 129 176 230 N/A 145 Mode Weeks 9 30 N/A 9 * * * 259 N/A 259
Rosebud Sioux (SD)
Participants in category Number 268 5 0 273 204 199 173 133 0 709
Percent reporting first WIC certification date % 100.0 100.0 0.0 100.0 100.0 100.0 100.0 100.0 0.0 100.0 Mean Weeks 27 14 N/A 27 80 131 178 225 N/A 145 Mode Weeks 10 * N/A 10 * 145 189 236 N/A 189
Santee Sioux (NE)
Participants in category Number 23 7 0 30 28 15 13 11 0 67
Percent reporting first WIC certification date % 100.0 100.0 0.0 100.0 100.0 100.0 100.0 100.0 0.0 100.0 Mean Weeks 23 46 N/A 29 82 111 122 211 N/A 117 Mode Weeks * 46 N/A 46 * * * 213 N/A *

WIC Participant and Program Characteristics: 2014 Final Report
Page F-66
Table F.9. (continued) Length of Enrollment in WIC for Infant and Child WIC Participants From First WIC Certification to April 30, 2014,
By Age and Statea Infants Children
Region and State 0–5
Months 6–11
Months Age Not
Reported Total
1 Year 2 Years 3 Years 4 Years Age Not
Reported Total Mountain Plains (continued)
Standing Rock Sioux (ND)
Participants in category Number 169 2 0 171 170 152 107 67 0 496
Percent reporting first WIC certification date % 99.4 100.0 0.0 99.4 100.0 100.0 100.0 100.0 0.0 100.0 Mean Weeks 24 21 N/A 24 76 136 176 218 N/A 135 Mode Weeks 13 * N/A 13 * * 211 * N/A 154
Three Affiliated (ND)
Participants in category Number 55 32 0 87 53 32 24 22 0 131
Percent reporting first WIC certification date % 100.0 100.0 0.0 100.0 100.0 100.0 100.0 100.0 0.0 100.0 Mean Weeks 15 35 N/A 23 71 112 154 162 N/A 112 Mode Weeks 15 33 N/A 15 64 * * 246 N/A 64
Ute Mountain Ute (CO)
Participants in category Number 26 22 0 48 48 27 13 16 0 104
Percent reporting first WIC certification date % 100.0 100.0 0.0 100.0 100.0 100.0 100.0 100.0 0.0 100.0 Mean Weeks 19 35 N/A 26 71 111 170 194 N/A 113 Mode Weeks 16 34 N/A 35 81 121 193 244 N/A *
Winnebago (NE)
Participants in category Number 55 21 0 76 49 33 27 17 0 126
Percent reporting first WIC certification date % 100.0 100.0 0.0 100.0 100.0 97.0 100.0 100.0 0.0 99.2 Mean Weeks 19 44 N/A 26 73 132 176 226 N/A 131 Mode Weeks * 52 N/A * 85 125 214 * N/A 85
Western
Alaska
Participants in category Number 3,268 1,520 0 4,788 4,147 2,799 2,522 1,901 0 11,369 Percent reporting first WIC certification date % 100.0 99.9 0.0 100.0 100.0 100.0 99.9 100.0 0.0 100.0 Mean Weeks 17 34 N/A 23 71 119 163 198 N/A 125 Mode Weeks 10 34 N/A 13 54 * 189 * N/A 54
American Samoa
Participants in category Number 1,058 75 0 1,133 1,240 1,153 1,061 985 0 4,439
Percent reporting first WIC certification date % 100.0 100.0 0.0 100.0 100.0 100.0 100.0 100.0 0.0 100.0 Mean Weeks 25 32 N/A 25 75 128 177 223 N/A 146 Mode Weeks * 49 N/A * 97 132 201 251 N/A 97
Arizona
Participants in category Number 44,139 3,181 0 47,320 26,581 19,464 17,660 16,437 0 80,142
Percent reporting first WIC certification date % 100.0 100.0 0.0 100.0 100.0 100.0 100.0 100.0 0.0 100.0 Mean Weeks 26 35 N/A 26 75 122 167 211 N/A 134 Mode Weeks 16 51 N/A 16 69 138 190 236 N/A 69
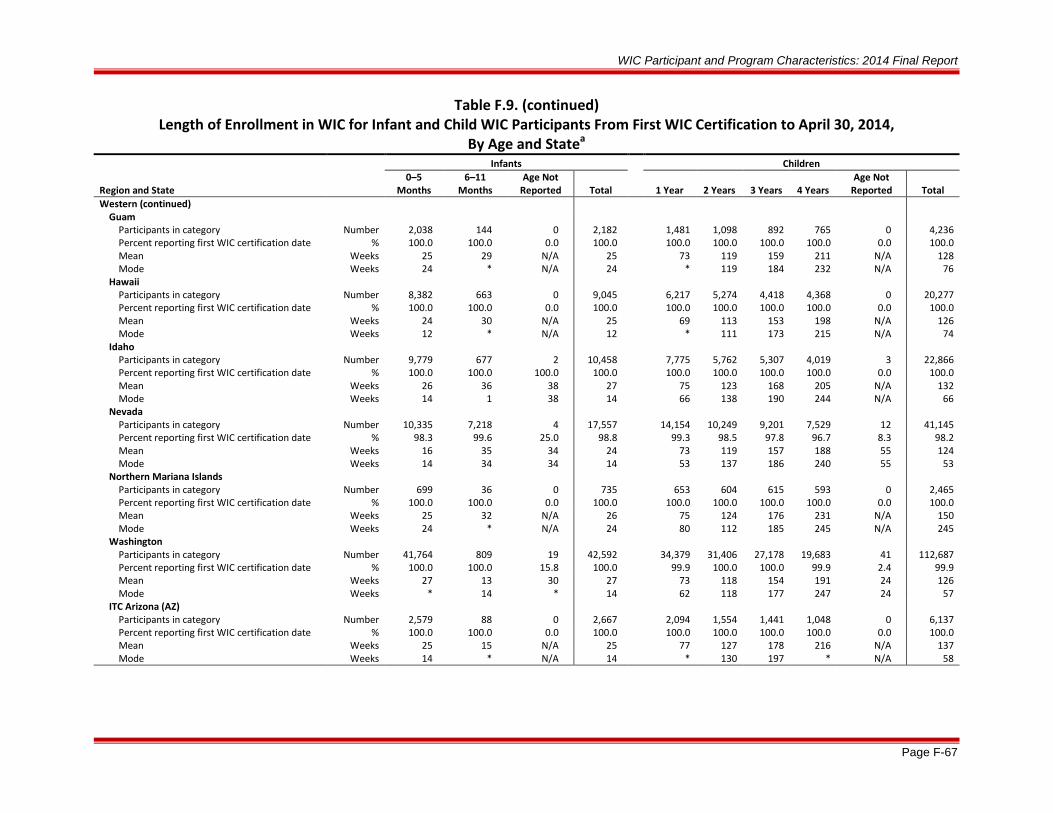
WIC Participant and Program Characteristics: 2014 Final Report
Page F-67
Table F.9. (continued) Length of Enrollment in WIC for Infant and Child WIC Participants From First WIC Certification to April 30, 2014,
By Age and Statea Infants Children
Region and State 0–5
Months 6–11
Months Age Not
Reported Total
1 Year 2 Years 3 Years 4 Years Age Not
Reported Total Western (continued)
Guam
Participants in category Number 2,038 144 0 2,182 1,481 1,098 892 765 0 4,236
Percent reporting first WIC certification date % 100.0 100.0 0.0 100.0 100.0 100.0 100.0 100.0 0.0 100.0 Mean Weeks 25 29 N/A 25 73 119 159 211 N/A 128 Mode Weeks 24 * N/A 24 * 119 184 232 N/A 76
Hawaii
Participants in category Number 8,382 663 0 9,045 6,217 5,274 4,418 4,368 0 20,277
Percent reporting first WIC certification date % 100.0 100.0 0.0 100.0 100.0 100.0 100.0 100.0 0.0 100.0 Mean Weeks 24 30 N/A 25 69 113 153 198 N/A 126 Mode Weeks 12 * N/A 12 * 111 173 215 N/A 74
Idaho
Participants in category Number 9,779 677 2 10,458 7,775 5,762 5,307 4,019 3 22,866
Percent reporting first WIC certification date % 100.0 100.0 100.0 100.0 100.0 100.0 100.0 100.0 0.0 100.0 Mean Weeks 26 36 38 27 75 123 168 205 N/A 132 Mode Weeks 14 1 38 14 66 138 190 244 N/A 66
Nevada
Participants in category Number 10,335 7,218 4 17,557 14,154 10,249 9,201 7,529 12 41,145
Percent reporting first WIC certification date % 98.3 99.6 25.0 98.8 99.3 98.5 97.8 96.7 8.3 98.2 Mean Weeks 16 35 34 24 73 119 157 188 55 124 Mode Weeks 14 34 34 14 53 137 186 240 55 53
Northern Mariana Islands
Participants in category Number 699 36 0 735 653 604 615 593 0 2,465
Percent reporting first WIC certification date % 100.0 100.0 0.0 100.0 100.0 100.0 100.0 100.0 0.0 100.0 Mean Weeks 25 32 N/A 26 75 124 176 231 N/A 150 Mode Weeks 24 * N/A 24 80 112 185 245 N/A 245
Washington
Participants in category Number 41,764 809 19 42,592 34,379 31,406 27,178 19,683 41 112,687
Percent reporting first WIC certification date % 100.0 100.0 15.8 100.0 99.9 100.0 100.0 99.9 2.4 99.9 Mean Weeks 27 13 30 27 73 118 154 191 24 126 Mode Weeks * 14 * 14 62 118 177 247 24 57
ITC Arizona (AZ)
Participants in category Number 2,579 88 0 2,667 2,094 1,554 1,441 1,048 0 6,137
Percent reporting first WIC certification date % 100.0 100.0 0.0 100.0 100.0 100.0 100.0 100.0 0.0 100.0 Mean Weeks 25 15 N/A 25 77 127 178 216 N/A 137 Mode Weeks 14 * N/A 14 * 130 197 * N/A 58
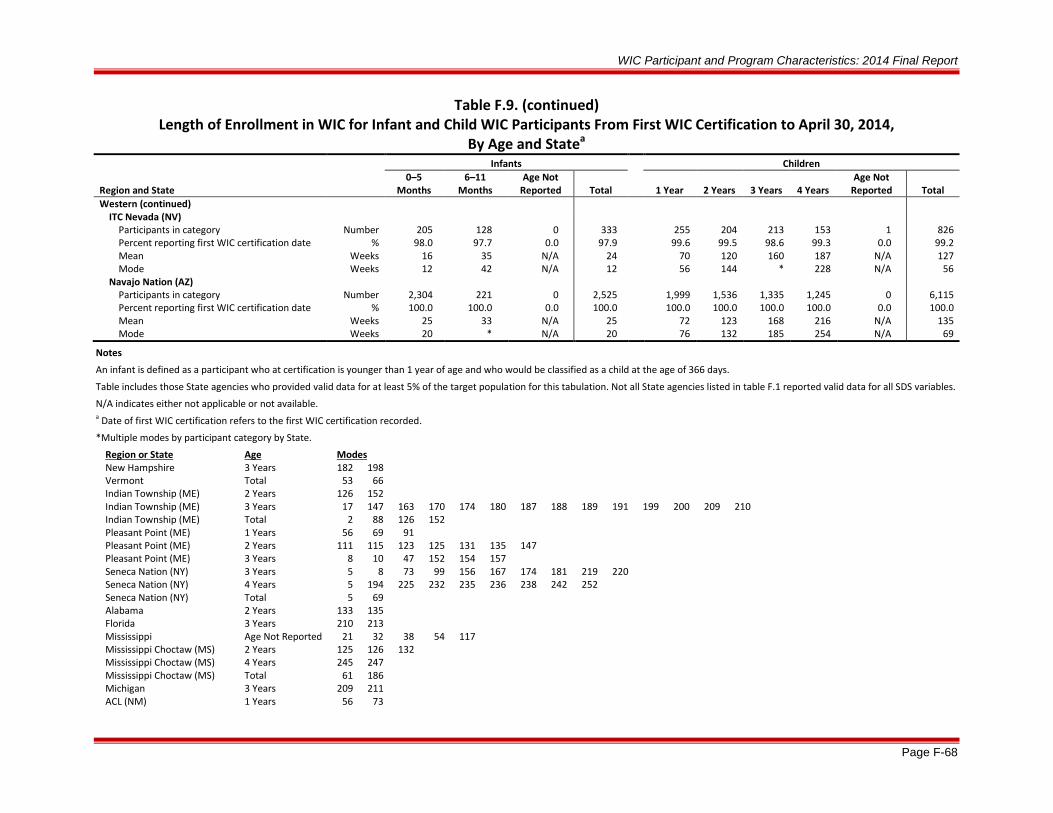
WIC Participant and Program Characteristics: 2014 Final Report
Page F-68
Table F.9. (continued) Length of Enrollment in WIC for Infant and Child WIC Participants From First WIC Certification to April 30, 2014,
By Age and Statea Infants Children
Region and State 0–5
Months 6–11
Months Age Not
Reported Total
1 Year 2 Years 3 Years 4 Years Age Not
Reported Total Western (continued)
ITC Nevada (NV)
Participants in category Number 205 128 0 333 255 204 213 153 1 826
Percent reporting first WIC certification date % 98.0 97.7 0.0 97.9 99.6 99.5 98.6 99.3 0.0 99.2 Mean Weeks 16 35 N/A 24 70 120 160 187 N/A 127 Mode Weeks 12 42 N/A 12 56 144 * 228 N/A 56
Navajo Nation (AZ)
Participants in category Number 2,304 221 0 2,525 1,999 1,536 1,335 1,245 0 6,115
Percent reporting first WIC certification date % 100.0 100.0 0.0 100.0 100.0 100.0 100.0 100.0 0.0 100.0 Mean Weeks 25 33 N/A 25 72 123 168 216 N/A 135 Mode Weeks 20 * N/A 20 76 132 185 254 N/A 69
Notes
An infant is defined as a participant who at certification is younger than 1 year of age and who would be classified as a child at the age of 366 days.
Table includes those State agencies who provided valid data for at least 5% of the target population for this tabulation. Not all State agencies listed in table F.1 reported valid data for all SDS variables.
N/A indicates either not applicable or not available. a Date of first WIC certification refers to the first WIC certification recorded.
*Multiple modes by participant category by State.
Region or State Age Modes New Hampshire 3 Years 182 198
Vermont Total 53 66 Indian Township (ME) 2 Years 126 152 Indian Township (ME) 3 Years 17 147 163 170 174 180 187 188 189 191 199 200 209 210
Indian Township (ME) Total 2 88 126 152 Pleasant Point (ME) 1 Years 56 69 91
Pleasant Point (ME) 2 Years 111 115 123 125 131 135 147 Pleasant Point (ME) 3 Years 8 10 47 152 154 157
Seneca Nation (NY) 3 Years 5 8 73 99 156 167 174 181 219 220 Seneca Nation (NY) 4 Years 5 194 225 232 235 236 238 242 252
Seneca Nation (NY) Total 5 69 Alabama 2 Years 133 135 Florida 3 Years 210 213 Mississippi Age Not Reported 21 32 38 54 117
Mississippi Choctaw (MS) 2 Years 125 126 132 Mississippi Choctaw (MS) 4 Years 245 247
Mississippi Choctaw (MS) Total 61 186 Michigan 3 Years 209 211 ACL (NM) 1 Years 56 73

WIC Participant and Program Characteristics: 2014 Final Report
Page F-69
ACL (NM) 3 Years 193 211 ACL (NM) Total 56 73 90 121 211
Chickasaw Nation (OK) 2 Years 121 126 132 141 Chickasaw Nation (OK) 4 Years 225 236 237 241 242 248
Choctaw Nation (OK) 1 Years 68 82 Choctaw Nation (OK) 3 Years 178 202 206
Five Sandoval Pueblos (NM) 2 Years 121 138 142 Five Sandoval Pueblos (NM) 4 Years 238 244
ITC Oklahoma 3 Years 183 201 ITC Oklahoma Total 52 74 Muscogee Creek Nation (OK) 2 Years 132 136 Muscogee Creek Nation (OK) 3 Years 168 199 Muscogee Creek Nation (OK) 4 Years 228 248 250
Otoe Missouria (OK) 1 Years 54 89 Otoe Missouria (OK) 2 Years 34 145 Otoe Missouria (OK) 3 Years 185 188 Otoe Missouria (OK) 4 Years 203 249 250 256
Pueblo of Isleta (NM) 4 Years 221 233 238 Pueblo of Isleta (NM) Total 52 88
Pueblo of San Felipe (NM) 4 Years 146 252 Pueblo of San Felipe (NM) Total 73 90 141 146
Pueblo of Zuni (NM) 1 Years 74 83 99 Pueblo of Zuni (NM) 4 Years 237 250
Santo Domingo (NM) 3 Years 168 194 Santo Domingo (NM) 4 Years 234 252 260
WCD (OK) Total 59 127 Iowa 2 Years 32 34 Cheyenne River Sioux (SD) 2 Years 112 128 144
Cheyenne River Sioux (SD) 3 Years 170 187 192 193 Cheyenne River Sioux (SD) Total 87 109 112 128 Eastern Shoshone (WY) 1 Years 50 63
Northern Arapahoe (WY) 4 Years 237 242 245 257 Northern Arapahoe (WY) Total 77 132 207
Omaha Nation (NE) 1 Years 88 98 Omaha Nation (NE) 2 Years 126 144 Omaha Nation (NE) 3 Years 178 196 203 207 215
Rosebud Sioux (SD) 1 Years 75 84 91 Santee Sioux (NE) 1 Years 82 107
Santee Sioux (NE) 2 Years 6 37 68 98 99 110 115 126 130 133 134 141 145 152 178 Santee Sioux (NE) 3 Years 172 200
Santee Sioux (NE) Total 6 37 68 82 101 107 152 172 200 213 Standing Rock Sioux (ND) 1 Years 68 88 90 93
Standing Rock Sioux (ND) 2 Years 133 137 Standing Rock Sioux (ND) 4 Years 228 245 Three Affiliated (ND) 2 Years 138 161 Three Affiliated (ND) 3 Years 171 185 193
Ute Mountain Ute (CO) Total 35 81

WIC Participant and Program Characteristics: 2014 Final Report
Page F-70
Winnebago (NE) 4 Years 244 246 248 255 Alaska 2 Years 124 130 133
Alaska 4 Years 240 246 Guam 1 Years 69 76 Hawaii 1 Years 66 74 ITC Arizona (AZ) 1 Years 68 69 79
ITC Arizona (AZ) 4 Years 235 242 ITC Nevada (NV) 3 Years 171 173 194
New Hampshire 0-5 Months 6 10 Indian Township (ME) 0-5 Months 1 4 8 12 15 16 18 25 30 44 45
Indian Township (ME) Total 1 4 8 12 15 16 18 25 30 44 45 56 Pleasant Point (ME) 0-5 Months 39 50
Pleasant Point (ME) Total 39 50 Virgin Islands 6-11 Months 14 16 40 44 55 60 63 69 73
Georgia Age NR 33 48 South Carolina Age NR 33 38 43 49
Mississippi Choctaw (MS) 0-5 Months 9 39 Mississippi Choctaw (MS) Total 9 39 Illinois Age NR 14 16 42 46 56
Wisconsin 6-11 Months 53 55 Choctaw Nation (OK) Total 8 17 ITC Oklahoma Total 4 34 Muscogee Creek Nation (OK) Total 8 20 34
Otoe Missouria (OK) Total 7 8 Pueblo of Zuni (NM) 6-11 Months 28 34 Iowa Age NR 29 35 38 50
Montana 0-5 Months 8 16 Wyoming 6-11 Months 1 8 Cheyenne River Sioux (WY) 6-11 Months 35 39 Northern Arapahoe (WY) Total 15 36 Rosebud Sioux (SD) 6-11 Months 2 9 10 20 33
Santee Sioux (NE) 0-5 Months 15 26 Standing Rock Sioux (ND) 6-11 Months 4 38 Winnebago (NE) 0-5 Months 3 16 25
Winnebago (NE) Total 3 16 25 American Samoa 0-5 Months 1 27
American Samoa Total 1 27 28 Guam 6-11 Months 11 40
Hawaii 6-11 Months 38 40 Northern Mariana Islands 6-11 Months 30 33 36 38 48
Washington 0-5 Months 10 14 Washington Age NR 26 31 35
ITC Arizona (AZ) 6-11 Months 5 7 Navajo Nation (AZ) 6-11 Months 40 47

WIC Participant and Program Characteristics: 2014 Final Report
Page F-71
Table F.10. Years of Education Reported by Women WIC Participants by Participant Category and State
Region and State
Pregnant Women Breastfeeding Women Postpartum Women Total WIC Women Northeast
Massachusetts
Women in category Number 12,197 9,455 8,425 30,077
Percent reporting education % 99.4 99.2 99.5 99.3 Median Years 12 12 12 12 Mode Years 12 12 12 12
New Hampshire
Women in category Number 1,625 1,167 1,419 4,211
Percent reporting education % 48.1 51.2 50.7 49.8 Median Years 12 12 12 12 Mode Years 12 12 12 12
Rhode Island
Women in category Number 2,370 1,339 2,092 5,801
Percent reporting education % 97.4 96.9 97.4 97.3 Median Years 12 12 12 12 Mode Years 12 12 12 12
Indian Township (ME)
Women in category Number 13 3 3 19
Percent reporting education % 38.5 33.3 0.0 31.6 Median Years 11 12 N/A 11 Mode Years 11 12 N/A *
Pleasant Point (ME)
Women in category Number 10 0 3 13
Percent reporting education % 90.0 0.0 66.7 84.6 Median Years 12 N/A 11 12 Mode Years 12 N/A * 12
Seneca Nation (NY)
Women in category Number 23 6 7 36
Percent reporting education % 78.3 100.0 85.7 83.3 Median Years 12 11 11 12 Mode Years 12 10 12 12

WIC Participant and Program Characteristics: 2014 Final Report
Page F-72
Table F.10. (continued) Years of Education Reported by Women WIC Participants by Participant Category and State
Region and State Pregnant Women Breastfeeding Women Postpartum Women Total WIC Women Mid-Atlantic
New Jersey
Women in category Number 14,935 13,263 9,049 37,247
Percent reporting education % 99.2 99.2 99.3 99.2 Median Years 12 12 12 12 Mode Years 12 12 12 12
Puerto Rico
Women in category Number 17,726 7,682 9,968 35,376
Percent reporting education % 63.6 15.3 14.5 39.3 Median Years 13 13 12 13 Mode Years 12 12 12 12
Virginia
Women in category Number 15,392 13,795 12,380 41,567
Percent reporting education % 97.3 95.5 97.3 96.7 Median Years 12 12 12 12 Mode Years 12 12 12 12
West Virginia
Women in category Number 4,904 1,976 4,243 11,123
Percent reporting education % 96.7 95.6 96.9 96.6 Median Years 12 12 12 12 Mode Years 12 12 12 12
Southeast
Alabama
Women in category Number 16,121 4,760 13,660 34,541 Percent reporting education % 7.2 6.5 7.2 7.1 Median Years 11 12 11 11 Mode Years 12 12 12 12
Georgia
Women in category Number 34,677 23,371 21,134 79,182
Percent reporting education % 97.8 96.3 98.0 97.4 Median Years 12 12 12 12 Mode Years 12 12 12 12
Mississippi
Women in category Number 9,261 2,333 9,252 20,846
Percent reporting education % 71.9 65.1 69.6 70.1 Median Years 12 12 12 12 Mode Years 12 12 12 12

WIC Participant and Program Characteristics: 2014 Final Report
Page F-73
Table F.10. (continued) Years of Education Reported by Women WIC Participants by Participant Category and State
Region and State Pregnant Women Breastfeeding Women Postpartum Women Total WIC Women Southeast (continued)
South Carolina
Women in category Number 13,893 8,032 12,949 34,874
Percent reporting education % 11.8 11.2 10.6 11.2 Median Years 12 12 12 12 Mode Years 12 12 12 12
Tennessee
Women in category Number 19,671 10,695 16,391 46,757
Percent reporting education % 100.0 100.0 100.0 100.0 Median Years 12 12 12 12 Mode Years 12 12 12 12
Mississippi Choctaw (MS)
Women in category Number 103 9 31 143
Percent reporting education % 87.4 100.0 96.8 90.2 Median Years 12 12 12 12 Mode Years 12 12 12 12
Midwest
Illinois
Women in category Number 31,103 20,462 21,205 72,770 Percent reporting education % 99.0 98.4 99.3 98.9 Median Years 12 12 12 12 Mode Years 12 12 12 12
Indiana
Women in category Number 16,053 9,986 15,359 41,398
Percent reporting education % 99.0 98.2 99.2 98.9 Median Years 12 12 12 12 Mode Years 12 12 12 12
Michigan
Women in category Number 24,683 13,227 23,415 61,325
Percent reporting education % 98.6 98.3 98.9 98.7 Median Years 12 12 12 12 Mode Years 12 12 12 12
Minnesota
Women in category Number 12,211 10,543 8,207 30,961
Percent reporting education % 49.9 50.8 56.4 51.9 Median Years 12 13 12 12 Mode Years 12 12 12 12

WIC Participant and Program Characteristics: 2014 Final Report
Page F-74
Table F.10. (continued) Years of Education Reported by Women WIC Participants by Participant Category and State
Region and State Pregnant Women Breastfeeding Women Postpartum Women Total WIC Women Midwest (continued)
Wisconsin
Women in category Number 10,799 6,230 10,093 27,122
Percent reporting education % 91.6 90.3 92.4 91.6 Median Years 12 12 12 12 Mode Years 12 12 12 12
Southwest
Arkansas
Women in category Number 10,616 3,329 10,321 24,266 Percent reporting education % 99.5 99.1 99.5 99.4 Median Years 12 12 12 12 Mode Years 12 12 12 12
New Mexico
Women in category Number 7,229 5,422 2,559 15,210
Percent reporting education % 98.9 98.6 99.1 98.8 Median Years 10 10 10 10 Mode Years 10 10 10 10
ACL (NM)
Women in category Number 47 54 31 132
Percent reporting education % 89.4 85.2 87.1 87.1 Median Years 12 12 12 12 Mode Years 12 12 12 12
Chickasaw Nation (OK)
Women in category Number 407 257 389 1,053
Percent reporting education % 16.7 15.2 17.5 16.6 Median Years 12 12 12 12 Mode Years 12 12 12 12
Citizen Potawatomi (OK)
Women in category Number 152 64 113 329
Percent reporting education % 90.1 90.6 92.0 90.9 Median Years 12 12 12 12 Mode Years 12 12 12 12
Eight Northern Pueblos (NM)
Women in category Number 18 16 14 48
Percent reporting education % 100.0 100.0 100.0 100.0 Median Years 12 12 12 12 Mode Years 12 12 12 12

WIC Participant and Program Characteristics: 2014 Final Report
Page F-75
Table F.10. (continued) Years of Education Reported by Women WIC Participants by Participant Category and State
Region and State Pregnant Women Breastfeeding Women Postpartum Women Total WIC Women Southwest (continued)
Five Sandoval Pueblos (NM)
Women in category Number 21 17 21 59
Percent reporting education % 95.2 94.1 95.2 94.9 Median Years 12 12 12 12 Mode Years 12 12 12 12
ITC Oklahoma
Women in category Number 77 39 99 215
Percent reporting education % 98.7 100.0 99.0 99.1 Median Years 12 12 12 12 Mode Years 12 12 12 12
Muscogee Creek Nation (OK)
Women in category Number 268 112 280 660
Percent reporting education % 89.6 91.1 92.9 91.2 Median Years 12 13 12 12 Mode Years 12 12 12 12
Osage Nation (OK)
Women in category Number 175 94 300 569
Percent reporting education % 97.7 96.8 98.0 97.7 Median Years 12 12 12 12 Mode Years 12 12 12 12
Otoe Missouria (OK)
Women in category Number 48 17 40 105
Percent reporting education % 100.0 100.0 100.0 100.0 Median Years 12 13 12 12 Mode Years 12 12 12 12
Pueblo of Isleta (NM)
Women in category Number 94 133 58 285
Percent reporting education % 100.0 100.0 100.0 100.0 Median Years 10 10 10 10 Mode Years 10 10 10 10
Pueblo of San Felipe (NM)
Women in category Number 19 36 11 66
Percent reporting education % 100.0 100.0 100.0 100.0 Median Years 12 12 12 12 Mode Years 12 12 12 12

WIC Participant and Program Characteristics: 2014 Final Report
Page F-76
Table F.10. (continued) Years of Education Reported by Women WIC Participants by Participant Category and State
Region and State Pregnant Women Breastfeeding Women Postpartum Women Total WIC Women Southwest (continued)
Pueblo of Zuni (NM)
Women in category Number 68 83 24 175
Percent reporting education % 97.1 98.8 91.7 97.1 Median Years 12 12 12 12 Mode Years 12 12 12 12
Santo Domingo (NM)
Women in category Number 11 19 6 36
Percent reporting education % 90.9 94.7 83.3 91.7 Median Years 12 12 12 12 Mode Years 12 12 12 12
WCD (OK)
Women in category Number 405 174 350 929
Percent reporting education % 97.5 97.7 98.9 98.1 Median Years 12 12 12 12 Mode Years 12 12 12 12
Mountain Plains
Colorado
Women in category Number 9,490 7,391 7,679 24,560 Percent reporting education % 84.1 83.9 84.9 84.3 Median Years 12 12 12 12 Mode Years 12 12 12 12
Iowa
Women in category Number 6,873 4,147 6,163 17,183
Percent reporting education % 92.0 90.9 93.4 92.2 Median Years 12 12 12 12 Mode Years 12 12 12 12
Kansas
Women in category Number 7,161 4,925 5,909 17,995
Percent reporting education % 98.8 98.3 99.1 98.7 Median Years 12 12 12 12 Mode Years 12 12 12 12
Missouri
Women in category Number 15,615 8,280 14,223 38,118
Percent reporting education % 99.5 99.4 99.6 99.5 Median Years 12 12 12 12 Mode Years 12 12 12 12

WIC Participant and Program Characteristics: 2014 Final Report
Page F-77
Table F.10. (continued) Years of Education Reported by Women WIC Participants by Participant Category and State
Region and State Pregnant Women Breastfeeding Women Postpartum Women Total WIC Women Mountain Plains (continued)
Montana
Women in category Number 1,984 1,616 1,269 4,869
Percent reporting education % 96.2 97.1 95.4 96.3 Median Years 12 12 12 12 Mode Years 12 12 12 12
Nebraska
Women in category Number 2,885 2,884 3,738 9,507
Percent reporting education % 99.0 99.0 99.2 99.1 Median Years 12 12 12 12 Mode Years 12 12 12 12
North Dakota
Women in category Number 1,298 853 1,058 3,209
Percent reporting education % 86.4 81.2 88.2 85.6 Median Years 12 12 12 12 Mode Years 12 12 12 12
Utah
Women in category Number 6,609 6,737 4,215 17,561
Percent reporting education % 99.2 99.0 99.3 99.1 Median Years 12 12 12 12 Mode Years 12 12 12 12
Wyoming
Women in category Number 1,098 843 791 2,732
Percent reporting education % 91.8 91.8 91.5 91.7 Median Years 12 12 12 12 Mode Years 12 12 12 12
Cheyenne River Sioux (SD)
Women in category Number 68 22 48 138
Percent reporting education % 97.1 100.0 93.8 96.4 Median Years 12 12 12 12 Mode Years 12 12 12 12
Eastern Shoshone (WY)
Women in category Number 15 10 16 41
Percent reporting education % 100.0 90.0 93.8 95.1 Median Years 12 12 12 12 Mode Years 12 12 12 12

WIC Participant and Program Characteristics: 2014 Final Report
Page F-78
Table F.10. (continued) Years of Education Reported by Women WIC Participants by Participant Category and State
Region and State Pregnant Women Breastfeeding Women Postpartum Women Total WIC Women Mountain Plains (continued)
Northern Arapahoe (WY)
Women in category Number 38 32 31 101
Percent reporting education % 63.2 96.9 83.9 80.2 Median Years 12 12 11 12 Mode Years 12 12 * 12
Omaha Nation (NE)
Women in category Number 30 2 10 42
Percent reporting education % 53.3 50.0 60.0 54.8 Median Years 12 8 11 12 Mode Years 12 8 12 12
Rosebud Sioux (SD)
Women in category Number 113 88 71 272
Percent reporting education % 100.0 100.0 98.6 99.6 Median Years 12 12 12 12 Mode Years 12 12 12 12
Santee Sioux (NE)
Women in category Number 17 2 8 27
Percent reporting education % 100.0 100.0 100.0 100.0 Median Years 12 13 12 12 Mode Years 12 * 12 12
Standing Rock Sioux (ND)
Women in category Number 95 14 52 161
Percent reporting education % 89.5 92.9 84.6 88.2 Median Years 12 12 12 12 Mode Years 12 12 12 12
Three Affiliated (ND)
Women in category Number 35 6 27 68
Percent reporting education % 97.1 100.0 100.0 98.5 Median Years 12 12 12 12 Mode Years 12 12 12 12
Ute Mountain Ute (CO)
Women in category Number 22 7 10 39
Percent reporting education % 68.2 71.4 100.0 76.9 Median Years 12 12 12 12 Mode Years 12 12 12 12

WIC Participant and Program Characteristics: 2014 Final Report
Page F-79
Table F.10. (continued) Years of Education Reported by Women WIC Participants by Participant Category and State
Region and State Pregnant Women Breastfeeding Women Postpartum Women Total WIC Women Mountain Plains (continued)
Winnebago (NE)
Women in category Number 30 18 12 60
Percent reporting education % 63.3 61.1 50.0 60.0 Median Years 12 12 12 12 Mode Years 12 12 12 12
Western
Alaska
Women in category Number 2,168 2,083 1,182 5,433 Percent reporting education % 95.2 94.8 95.2 95.0 Median Years 12 12 12 12 Mode Years 12 12 12 12
American Samoa
Women in category Number 427 725 182 1,334
Percent reporting education % 100.0 99.7 100.0 99.9 Median Years 12 12 12 12 Mode Years 12 12 12 12
Arizona
Women in category Number 17,274 14,432 14,357 46,063
Percent reporting education % 99.3 99.4 99.4 99.3 Median Years 12 12 12 12 Mode Years 12 12 12 12
Guam
Women in category Number 644 703 686 2,033
Percent reporting education % 99.7 99.3 100.0 99.7 Median Years 12 12 12 12 Mode Years 12 12 12 12
Hawaii
Women in category Number 3,427 4,003 2,068 9,498
Percent reporting education % 98.8 98.5 98.4 98.6 Median Years 12 12 12 12 Mode Years 12 12 12 12
Idaho
Women in category Number 4,424 3,830 2,612 10,866
Percent reporting education % 99.9 99.8 99.9 99.9 Median Years 12 12 12 12 Mode Years 12 12 12 12

WIC Participant and Program Characteristics: 2014 Final Report
Page F-80
Table F.10. (continued) Years of Education Reported by Women WIC Participants by Participant Category and State
Region and State Pregnant Women Breastfeeding Women Postpartum Women Total WIC Women Western (continued)
Northern Mariana Islands
Women in category Number 340 288 204 832
Percent reporting education % 100.0 100.0 99.5 99.9 Median Years 12 12 12 12 Mode Years 12 12 12 12
Oregon
Women in category Number 11,285 9,724 4,941 25,950
Percent reporting education % 97.6 97.2 97.2 97.4 Median Years 12 12 12 12 Mode Years 12 12 12 12
ITC Arizona (AZ)
Women in category Number 979 592 954 2,525
Percent reporting education % 98.7 99.5 99.1 99.0 Median Years 12 12 12 12 Mode Years 12 12 12 12
Navajo Nation (AZ)
Women in category Number 1,297 1,067 540 2,904
Percent reporting education % 99.9 99.8 100.0 99.9 Median Years 12 12 12 12 Mode Years 12 12 12 12
Notes
Table includes those State agencies who provided valid data for at least 5% of the target population for this tabulation. Not all State agencies listed in table F.1 reported valid data for all SDS variables.
N/A Indicates either not applicable or not available.
* Multiple modes by participant category by State.
State Certification Category Modes Indian Township (ME) Total WIC Women 11 12 Pleasant Point (ME) Postpartum Women 10 12 Northern Arapahoe (WY) Postpartum Women 10 12 Santee Sioux (NE) Breastfeeding Women 10 16

WIC Participant and Program Characteristics: 2014 Final Report
Page F-81
Table F.11. Distribution of Total Number of Pregnancies for Pregnant Women WIC Participants by State
Pregnancies
Total
Pregnant WIC
Women
One
Two
Three
Four
Five or More
Not Reported
Mean
Region and State Number % Number % Number % Number % Number % Number % Number Number Northeast
Connecticut 1,706 27.3 1,165 18.6 643 10.3 334 5.3 386 6.2 2,026 32.4 2.2 6,260 Maine 655 30.8 534 25.1 384 18.1 252 11.9 289 13.6 12 0.6 2.5 2,126 Massachusetts 3,809 31.2 3,565 29.2 2,152 17.6 1,287 10.6 1,351 11.1 33 0.3 2.4 12,197 New Hampshire 468 28.8 420 25.8 268 16.5 152 9.4 176 10.8 141 8.7 2.4 1,625 Rhode Island 0 0.0 756 31.9 603 25.4 458 19.3 551 23.2 2 0.1 3.3 2,370 Vermont 422 33.9 363 29.1 203 16.3 117 9.4 132 10.6 9 0.7 2.3 1,246 Indian Township (ME) 7 53.8 4 30.8 1 7.7 0 0.0 1 7.7 0 0.0 1.8 13 Pleasant Point (ME) 6 60.0 2 20.0 1 10.0 0 0.0 1 10.0 0 0.0 1.8 10 Seneca Nation (NY) 13 56.5 3 13.0 4 17.4 1 4.3 2 8.7 0 0.0 2.0 23
Mid-Atlantic
District of Columbia 419 27.9 417 27.8 290 19.3 149 9.9 224 14.9 2 0.1 2.6 1,501
New Jersey 4,102 27.5 2,680 17.9 1,314 8.8 637 4.3 676 4.5 5,526 37.0 2.1 14,935 Virginia 12,006 78.0 1,330 8.6 942 6.1 519 3.4 595 3.9 0 0.0 1.5 15,392
Southeast
Alabama 5,842 36.2 4,445 27.6 2,840 17.6 1,479 9.2 1,446 9.0 69 0.4 2.3 16,121
Georgia 8,070 23.3 5,911 17.0 3,856 11.1 1,924 5.5 1,522 4.4 13,394 38.6 2.2 34,677 Mississippi 2,392 25.8 1,739 18.8 1,197 12.9 743 8.0 694 7.5 2,496 27.0 2.4 9,261 South Carolina 4,953 35.7 3,681 26.5 2,372 17.1 1,415 10.2 1,319 9.5 153 1.1 2.3 13,893 Mississippi Choctaw (MS) 43 41.7 21 20.4 15 14.6 7 6.8 17 16.5 0 0.0 2.4 103
Midwest
Illinois 10,013 32.2 8,039 25.8 5,901 19.0 3,463 11.1 3,658 11.8 29 0.1 2.4 31,103
Indiana 5,431 33.8 4,038 25.2 2,876 17.9 1,742 10.9 1,961 12.2 5 0.0 2.4 16,053 Michigan 7,566 30.7 6,406 26.0 4,524 18.3 2,739 11.1 3,384 13.7 64 0.3 2.5 24,683 Minnesota 2,702 22.1 2,796 22.9 2,386 19.5 1,702 13.9 2,509 20.5 116 0.9 2.9 12,211 Wisconsin 3,177 29.4 2,677 24.8 1,941 18.0 1,314 12.2 1,617 15.0 73 0.7 2.6 10,799
Southwest
Arkansas 3,179 29.9 2,782 26.2 1,998 18.8 1,231 11.6 1,312 12.4 114 1.1 2.5 10,616
Louisiana 9,054 62.4 11 0.1 0 0.0 0 0.0 0 0.0 5,433 37.5 1.0 14,498 New Mexico 2,376 32.9 1,898 26.3 1,329 18.4 806 11.1 786 10.9 34 0.5 2.4 7,229 Oklahoma 2,886 25.9 2,070 18.6 1,166 10.5 598 5.4 654 5.9 3,766 33.8 2.2 11,140 Texas 27,630 28.7 23,798 24.7 19,079 19.8 12,216 12.7 13,375 13.9 76 0.1 2.6 96,174
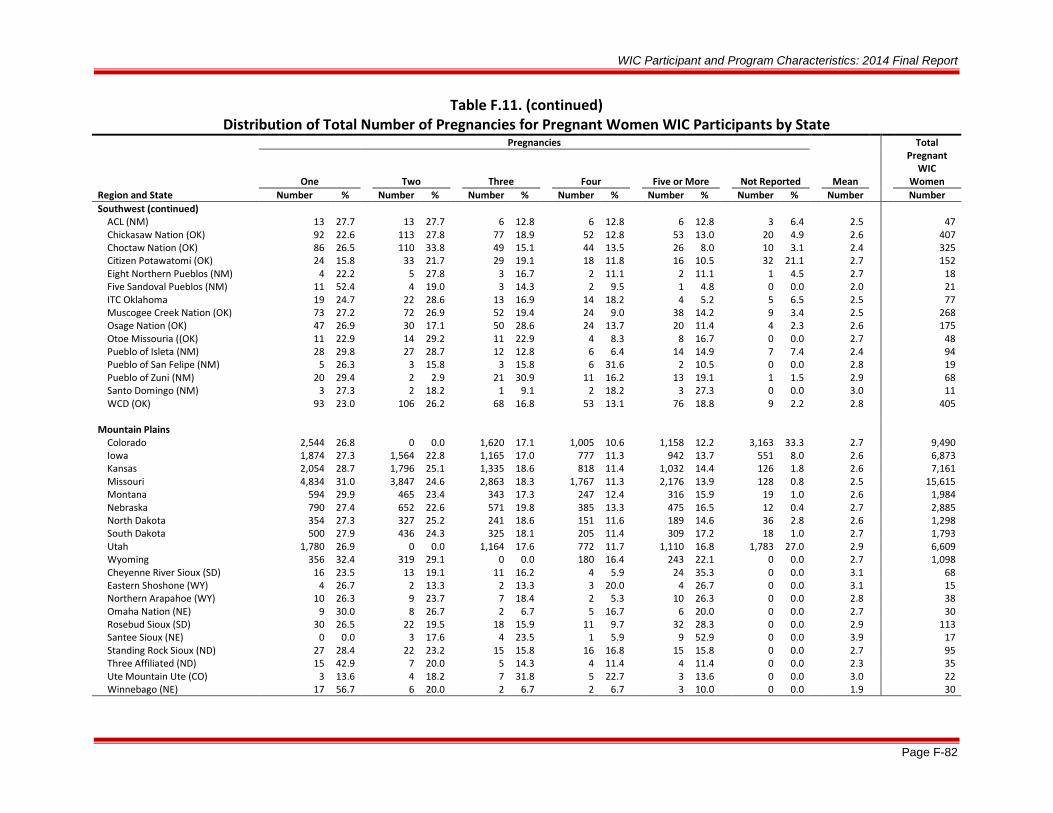
WIC Participant and Program Characteristics: 2014 Final Report
Page F-82
Table F.11. (continued) Distribution of Total Number of Pregnancies for Pregnant Women WIC Participants by State
Pregnancies Total Pregnant
WIC Women One
Two
Three
Four
Five or More
Not Reported
Mean
Region and State Number % Number % Number % Number % Number % Number % Number Number Southwest (continued)
ACL (NM) 13 27.7 13 27.7 6 12.8 6 12.8 6 12.8 3 6.4 2.5 47 Chickasaw Nation (OK) 92 22.6 113 27.8 77 18.9 52 12.8 53 13.0 20 4.9 2.6 407 Choctaw Nation (OK) 86 26.5 110 33.8 49 15.1 44 13.5 26 8.0 10 3.1 2.4 325 Citizen Potawatomi (OK) 24 15.8 33 21.7 29 19.1 18 11.8 16 10.5 32 21.1 2.7 152 Eight Northern Pueblos (NM) 4 22.2 5 27.8 3 16.7 2 11.1 2 11.1 1 4.5 2.7 18 Five Sandoval Pueblos (NM) 11 52.4 4 19.0 3 14.3 2 9.5 1 4.8 0 0.0 2.0 21 ITC Oklahoma 19 24.7 22 28.6 13 16.9 14 18.2 4 5.2 5 6.5 2.5 77 Muscogee Creek Nation (OK) 73 27.2 72 26.9 52 19.4 24 9.0 38 14.2 9 3.4 2.5 268 Osage Nation (OK) 47 26.9 30 17.1 50 28.6 24 13.7 20 11.4 4 2.3 2.6 175 Otoe Missouria ((OK) 11 22.9 14 29.2 11 22.9 4 8.3 8 16.7 0 0.0 2.7 48 Pueblo of Isleta (NM) 28 29.8 27 28.7 12 12.8 6 6.4 14 14.9 7 7.4 2.4 94 Pueblo of San Felipe (NM) 5 26.3 3 15.8 3 15.8 6 31.6 2 10.5 0 0.0 2.8 19 Pueblo of Zuni (NM) 20 29.4 2 2.9 21 30.9 11 16.2 13 19.1 1 1.5 2.9 68 Santo Domingo (NM) 3 27.3 2 18.2 1 9.1 2 18.2 3 27.3 0 0.0 3.0 11 WCD (OK) 93 23.0 106 26.2 68 16.8 53 13.1 76 18.8 9 2.2 2.8 405
Mountain Plains
Colorado 2,544 26.8 0 0.0 1,620 17.1 1,005 10.6 1,158 12.2 3,163 33.3 2.7 9,490
Iowa 1,874 27.3 1,564 22.8 1,165 17.0 777 11.3 942 13.7 551 8.0 2.6 6,873 Kansas 2,054 28.7 1,796 25.1 1,335 18.6 818 11.4 1,032 14.4 126 1.8 2.6 7,161 Missouri 4,834 31.0 3,847 24.6 2,863 18.3 1,767 11.3 2,176 13.9 128 0.8 2.5 15,615 Montana 594 29.9 465 23.4 343 17.3 247 12.4 316 15.9 19 1.0 2.6 1,984 Nebraska 790 27.4 652 22.6 571 19.8 385 13.3 475 16.5 12 0.4 2.7 2,885 North Dakota 354 27.3 327 25.2 241 18.6 151 11.6 189 14.6 36 2.8 2.6 1,298 South Dakota 500 27.9 436 24.3 325 18.1 205 11.4 309 17.2 18 1.0 2.7 1,793 Utah 1,780 26.9 0 0.0 1,164 17.6 772 11.7 1,110 16.8 1,783 27.0 2.9 6,609 Wyoming 356 32.4 319 29.1 0 0.0 180 16.4 243 22.1 0 0.0 2.7 1,098 Cheyenne River Sioux (SD) 16 23.5 13 19.1 11 16.2 4 5.9 24 35.3 0 0.0 3.1 68 Eastern Shoshone (WY) 4 26.7 2 13.3 2 13.3 3 20.0 4 26.7 0 0.0 3.1 15 Northern Arapahoe (WY) 10 26.3 9 23.7 7 18.4 2 5.3 10 26.3 0 0.0 2.8 38 Omaha Nation (NE) 9 30.0 8 26.7 2 6.7 5 16.7 6 20.0 0 0.0 2.7 30 Rosebud Sioux (SD) 30 26.5 22 19.5 18 15.9 11 9.7 32 28.3 0 0.0 2.9 113 Santee Sioux (NE) 0 0.0 3 17.6 4 23.5 1 5.9 9 52.9 0 0.0 3.9 17 Standing Rock Sioux (ND) 27 28.4 22 23.2 15 15.8 16 16.8 15 15.8 0 0.0 2.7 95 Three Affiliated (ND) 15 42.9 7 20.0 5 14.3 4 11.4 4 11.4 0 0.0 2.3 35 Ute Mountain Ute (CO) 3 13.6 4 18.2 7 31.8 5 22.7 3 13.6 0 0.0 3.0 22 Winnebago (NE) 17 56.7 6 20.0 2 6.7 2 6.7 3 10.0 0 0.0 1.9 30

WIC Participant and Program Characteristics: 2014 Final Report
Page F-83
Table F.11. (continued) Distribution of Total Number of Pregnancies for Pregnant Women WIC Participants by State
Pregnancies Total Pregnant
WIC Women One
Two
Three
Four
Five or More
Not Reported
Mean
Region and State Number % Number % Number % Number % Number % Number % Number Number Western
Alaska 442 20.4 371 17.1 323 14.9 202 9.3 338 15.6 492 22.7 2.8 2,168 Hawaii 1,283 37.4 993 29.0 576 16.8 303 8.8 214 6.2 58 1.7 2.2 3,427 Idaho 1,419 32.1 1,101 24.9 767 17.3 481 10.9 651 14.7 5 0.1 2.5 4,424 ITC Arizona (AZ) 200 20.4 224 22.9 142 14.5 94 9.6 190 19.4 129 13.2 2.8 979
Notes
Total number of pregnancies includes current pregnancy.
Gravidity is the term applied to total number of pregnancies; parity refers to total number of live births.
Table includes those State agencies who provided valid data for at least 5% of the target population for this tabulation. Not all State agencies listed in table F.1 reported valid data for all SDS variables.

WIC Participant and Program Characteristics: 2014 Final Report
Page F-84
Table F.12. Distribution of Total Number of Live Births for Pregnant Women WIC Participants by State
Live Births
Total
Pregnant WIC
Women
Zero
One
Two
Three
Four
Five or More
Not Reported
Mean
Region and State Number % Number % Number % Number % Number % Number % Number % Number Number Northeast
Connecticut 0 0.0 1,929 30.8 1,041 16.6 454 7.3 179 2.9 103 1.6 2,554 40.8 1.8 6,260 Maine 163 7.7 656 30.9 367 17.3 152 7.1 65 3.1 57 2.7 666 31.3 1.6 2,126 Massachusetts 4,820 39.5 3,885 31.9 1,890 15.5 749 6.1 264 2.2 206 1.7 383 3.1 1.0 12,197 Rhode Island 944 39.8 701 29.6 451 19.0 165 7.0 67 2.8 41 1.7 1 0.0 1.1 2,370 Vermont 506 40.6 393 31.5 193 15.5 93 7.5 29 2.3 23 1.8 9 0.7 1.0 1,246 Indian Township (ME) 0 0.0 1 7.7 2 15.4 0 0.0 1 7.7 0 0.0 9 69.2 2.3 13 Pleasant Point (ME) 1 10.0 1 10.0 0 0.0 0 0.0 1 10.0 0 0.0 7 70.0 1.7 10 Seneca Nation (NY) 4 17.4 1 4.3 1 4.3 2 8.7 1 4.3 0 0.0 14 60.9 1.4 23
Mid-Atlantic
District of Columbia 587 39.1 478 31.8 236 15.7 109 7.3 54 3.6 37 2.5 0 0.0 1.1 1,501
Virginia 2,171 14.1 1,473 9.6 870 5.7 373 2.4 131 0.9 90 0.6 10,284 66.8 1.0 15,392 West Virginia 1,993 40.6 1,464 29.9 755 15.4 274 5.6 87 1.8 56 1.1 275 5.6 1.0 4,904 Southeast
Alabama 6,845 42.5 4,843 30.0 2,660 16.5 1,113 6.9 395 2.5 264 1.6 1 0.0 1.0 16,121 Mississippi 840 9.1 2,079 22.4 1,153 12.5 502 5.4 185 2.0 122 1.3 4,380 47.3 1.5 9,261 South Carolina 6,054 43.6 3,886 28.0 2,224 16.0 976 7.0 362 2.6 247 1.8 144 1.0 1.0 13,893 Mississippi Choctaw (MS) 1 1.0 6 5.8 8 7.8 6 5.8 2 1.9 2 1.9 78 75.7 2.3 103
Midwest
Illinois 12,281 39.5 8,932 28.7 5,555 17.9 2,615 8.4 994 3.2 692 2.2 34 0.1 1.1 31,103
Indiana 6,394 39.8 4,649 29.0 2,797 17.4 1,330 8.3 527 3.3 352 2.2 4 0.0 1.1 16,053 Michigan 9,440 38.2 7,321 29.7 4,331 17.5 2,088 8.5 815 3.3 627 2.5 61 0.2 1.2 24,683 Minnesota 1,160 9.5 3,382 27.7 2,352 19.3 1,310 10.7 598 4.9 603 4.9 2,806 23.0 1.9 12,211
Southwest
Arkansas 1,199 11.3 3,004 28.3 1,780 16.8 815 7.7 318 3.0 208 2.0 3,292 31.0 1.5 10,616
Louisiana 0 0.0 5,609 38.7 1,902 13.1 434 3.0 63 0.4 14 0.1 6,476 44.7 1.4 14,498 New Mexico 2,413 33.4 2,024 28.0 1,348 18.6 641 8.9 208 2.9 144 2.0 451 6.2 1.2 7,229 Oklahoma 736 6.6 3,171 28.5 2,027 18.2 873 7.8 354 3.2 215 1.9 3,764 33.8 1.7 11,140 Texas 24,201 25.2 27,875 29.0 21,497 22.4 12,541 13.0 5,731 6.0 4,130 4.3 199 0.2 1.6 96,174 ACL (NM) 7 14.9 14 29.8 6 12.8 3 6.4 1 2.1 0 0.0 16 34.0 1.3 47 Chickasaw Nation (OK) 50 12.3 123 30.2 72 17.7 35 8.6 6 1.5 9 2.2 112 27.5 1.5 407 Choctaw Nation (OK) 37 11.4 110 33.8 48 14.8 25 7.7 4 1.2 5 1.5 96 29.5 1.4 325 Citizen Potawatomi (OK) 22 14.5 36 23.7 21 13.8 13 8.6 3 2.0 2 1.3 55 36.2 1.4 152 Eight Northern Pueblos (NM) 2 11.1 8 44.4 1 5.6 1 5.6 0 0.0 1 5.6 5 27.3 1.3 18 Five Sandoval Pueblos (NM) 2 9.5 3 14.3 3 14.3 1 4.8 1 4.8 0 0.0 11 52.4 1.6 21

WIC Participant and Program Characteristics: 2014 Final Report
Page F-85
Table F.12. (continued) Distribution of Total Number of Live Births for Pregnant Women WIC Participants by State
Live Births Total Pregnant
WIC Women Zero
One
Two
Three
Four
Five or More
Not Reported
Mean
Region and State Number % Number % Number % Number % Number % Number % Number % Number Number Southwest (continued)
ITC Oklahoma 4 5.2 25 32.5 14 18.2 7 9.1 3 3.9 0 0.0 24 31.2 1.6 77 Muscogee Creek Nation (OK) 11 4.1 83 31.0 52 19.4 24 9.0 10 3.7 7 2.6 81 30.2 1.8 268 Osage Nation (OK) 5 2.9 50 28.6 41 23.4 14 8.0 7 4.0 6 3.4 52 29.7 1.9 175 Otoe Missouria (OK) 4 8.3 20 41.7 4 8.3 5 10.4 2 4.2 2 4.2 11 22.9 1.6 48 Pueblo of Isleta (NM) 28 29.8 34 36.2 13 13.8 7 7.4 5 5.3 2 2.1 5 5.3 1.2 94 Pueblo of San Felipe (NM) 0 0.0 3 15.8 5 26.3 4 21.1 1 5.3 1 5.3 5 26.3 2.4 19 Pueblo of Zuni (NM) 3 4.4 17 25.0 15 22.1 8 11.8 1 1.5 3 4.4 21 30.9 1.9 68 Santo Domingo (NM) 0 0.0 2 18.2 2 18.2 3 27.3 0 0.0 1 9.1 3 27.3 2.5 11 WCD (OK) 32 7.9 119 29.4 68 16.8 46 11.4 22 5.4 17 4.2 101 24.9 1.9 405
Mountain Plains
Colorado 3,980 41.9 2,517 26.5 1,629 17.2 821 8.7 298 3.1 243 2.6 2 0.0 1.1 9,490 Iowa 451 6.6 1,836 26.7 1,174 17.1 569 8.3 233 3.4 175 2.5 2,435 35.4 1.7 6,873 Missouri 1,490 9.5 4,494 28.8 2,657 17.0 1,222 7.8 440 2.8 377 2.4 4,935 31.6 1.6 15,615 Montana 155 7.8 541 27.3 352 17.7 181 9.1 84 4.2 61 3.1 610 30.7 1.8 1,984 Nebraska 936 32.4 775 26.9 587 20.3 313 10.8 153 5.3 108 3.7 13 0.5 1.4 2,885 North Dakota 70 5.4 380 29.3 222 17.1 130 10.0 54 4.2 43 3.3 399 30.7 1.8 1,298 South Dakota 560 31.2 488 27.2 345 19.2 198 11.0 98 5.5 85 4.7 19 1.1 1.5 1,793 Utah 2,309 34.9 1,771 26.8 1,173 17.7 768 11.6 334 5.1 254 3.8 0 0.0 1.4 6,609 Wyoming 489 44.5 270 24.6 200 18.2 74 6.7 42 3.8 23 2.1 0 0.0 1.1 1,098 Cheyenne River Sioux (SD) 5 7.4 14 20.6 10 14.7 8 11.8 6 8.8 9 13.2 16 23.5 2.4 68 Eastern Shoshone (WY) 1 6.7 1 6.7 3 20.0 4 26.7 1 6.7 0 0.0 5 33.3 2.3 15 Northern Arapahoe (WY) 13 34.2 5 13.2 5 13.2 2 5.3 5 13.2 1 2.6 7 18.4 1.5 38 Omaha Nation (NE) 8 26.7 8 26.7 3 10.0 2 6.7 2 6.7 3 10.0 4 13.3 1.7 30 Rosebud Sioux (NE) 32 28.3 27 23.9 22 19.5 10 8.8 13 11.5 7 6.2 2 1.8 1.7 113 Santee Sioux (NE) 1 5.9 4 23.5 2 11.8 3 17.6 5 29.4 1 5.9 1 5.9 2.6 17 Standing Rock Sioux (ND) 19 20.0 19 20.0 17 17.9 15 15.8 4 4.2 10 10.5 11 11.6 2.0 95 Three Affiliated (ND) 8 22.9 8 22.9 7 20.0 0 0.0 0 0.0 3 8.6 9 25.7 1.4 35 Ute Mountain Ute (CO) 2 9.1 6 27.3 8 36.4 4 18.2 1 4.5 0 0.0 1 4.5 1.8 22 Winnebago (NE) 5 16.7 3 10.0 1 3.3 2 6.7 1 3.3 1 3.3 17 56.7 1.5 30

WIC Participant and Program Characteristics: 2014 Final Report
Page F-86
Table F.12. (continued) Distribution of Total Number of Live Births for Pregnant Women WIC Participants by State
Live Births Total Pregnant
WIC Women Zero
One
Two
Three
Four
Five or More
Not Reported
Mean
Region and State Number % Number % Number % Number % Number % Number % Number % Number Number Western
Alaska 211 9.7 545 25.1 391 18.0 198 9.1 108 5.0 113 5.2 602 27.8 1.9 2,168 Hawaii 3,369 98.3 0 0.0 0 0.0 0 0.0 0 0.0 0 0.0 58 1.7 0.0 3,427
Notes
Total number of pregnancies includes current pregnancy.
Gravidity is the term applied to total number of pregnancies; parity refers to total number of live births.
Table includes those State agencies who provided valid data for at least 5% of the target population for this tabulation. Not all State agencies listed in table F.1 reported valid data for all SDS variables.
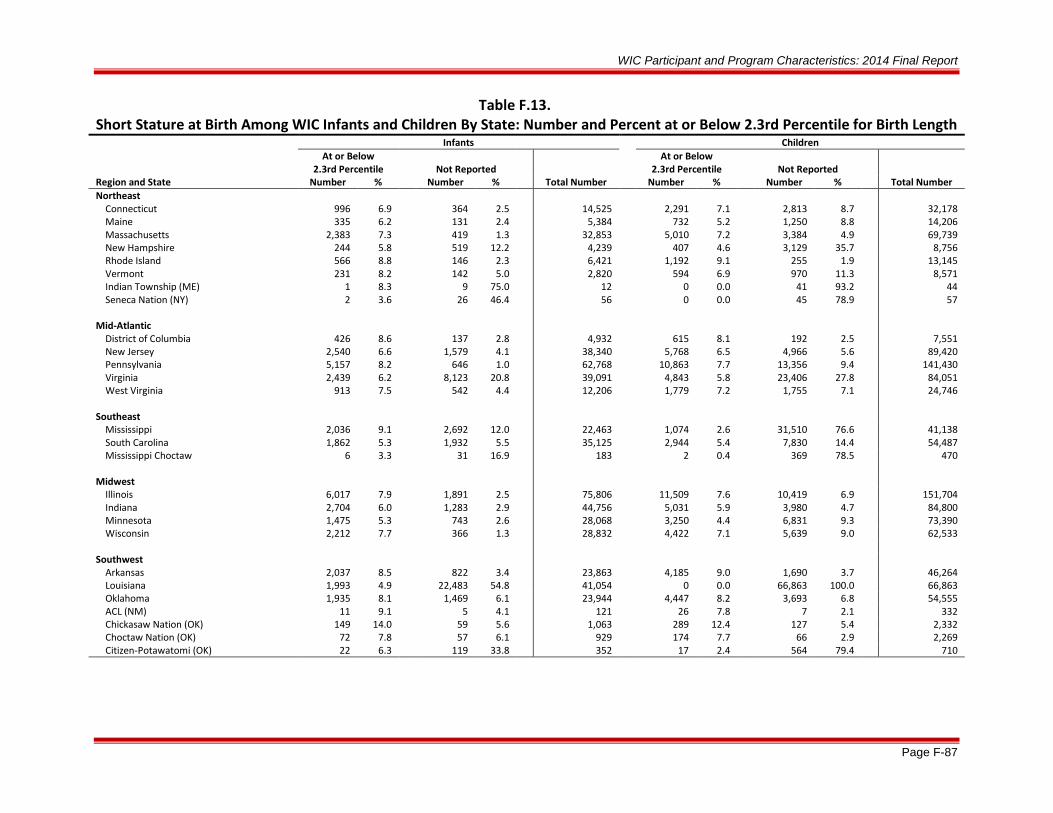
WIC Participant and Program Characteristics: 2014 Final Report
Page F-87
Table F.13. Short Stature at Birth Among WIC Infants and Children By State: Number and Percent at or Below 2.3rd Percentile for Birth Length
Infants Children
At or Below 2.3rd Percentile
Not Reported
At or Below 2.3rd Percentile
Not Reported
Region and State Number % Number % Total Number Number % Number % Total Number Northeast
Connecticut 996 6.9 364 2.5 14,525 2,291 7.1 2,813 8.7 32,178 Maine 335 6.2 131 2.4 5,384 732 5.2 1,250 8.8 14,206 Massachusetts 2,383 7.3 419 1.3 32,853 5,010 7.2 3,384 4.9 69,739 New Hampshire 244 5.8 519 12.2 4,239 407 4.6 3,129 35.7 8,756 Rhode Island 566 8.8 146 2.3 6,421 1,192 9.1 255 1.9 13,145 Vermont 231 8.2 142 5.0 2,820 594 6.9 970 11.3 8,571 Indian Township (ME) 1 8.3 9 75.0 12 0 0.0 41 93.2 44 Seneca Nation (NY) 2 3.6 26 46.4 56 0 0.0 45 78.9 57
Mid-Atlantic
District of Columbia 426 8.6 137 2.8 4,932 615 8.1 192 2.5 7,551 New Jersey 2,540 6.6 1,579 4.1 38,340 5,768 6.5 4,966 5.6 89,420 Pennsylvania 5,157 8.2 646 1.0 62,768 10,863 7.7 13,356 9.4 141,430 Virginia 2,439 6.2 8,123 20.8 39,091 4,843 5.8 23,406 27.8 84,051 West Virginia 913 7.5 542 4.4 12,206 1,779 7.2 1,755 7.1 24,746
Southeast
Mississippi 2,036 9.1 2,692 12.0 22,463 1,074 2.6 31,510 76.6 41,138 South Carolina 1,862 5.3 1,932 5.5 35,125 2,944 5.4 7,830 14.4 54,487 Mississippi Choctaw 6 3.3 31 16.9 183 2 0.4 369 78.5 470
Midwest
Illinois 6,017 7.9 1,891 2.5 75,806 11,509 7.6 10,419 6.9 151,704 Indiana 2,704 6.0 1,283 2.9 44,756 5,031 5.9 3,980 4.7 84,800 Minnesota 1,475 5.3 743 2.6 28,068 3,250 4.4 6,831 9.3 73,390 Wisconsin 2,212 7.7 366 1.3 28,832 4,422 7.1 5,639 9.0 62,533
Southwest
Arkansas 2,037 8.5 822 3.4 23,863 4,185 9.0 1,690 3.7 46,264 Louisiana 1,993 4.9 22,483 54.8 41,054 0 0.0 66,863 100.0 66,863 Oklahoma 1,935 8.1 1,469 6.1 23,944 4,447 8.2 3,693 6.8 54,555 ACL (NM) 11 9.1 5 4.1 121 26 7.8 7 2.1 332 Chickasaw Nation (OK) 149 14.0 59 5.6 1,063 289 12.4 127 5.4 2,332 Choctaw Nation (OK) 72 7.8 57 6.1 929 174 7.7 66 2.9 2,269 Citizen-Potawatomi (OK) 22 6.3 119 33.8 352 17 2.4 564 79.4 710

WIC Participant and Program Characteristics: 2014 Final Report
Page F-88
Table F.13. (continued) Short Stature at Birth Among WIC Infants and Children By State: Number and Percent at or Below 2.3rd Percentile for Birth Length
Infants Children
At or Below
2.3rd Percentile
Not Reported
At or Below
2.3rd Percentile
Not Reported
Region and State Number % Number % Total Number Number % Number % Total Number Southwest (continued)
Eight Northern Pueblos (NM) 8 11.9 3 5.1 66 18 10.0 3 1.5 181 Five Sandoval Pueblos (NM) 4 6.3 11 17.5 63 9 6.4 7 5.0 140 ITC-Oklahoma 15 6.0 22 8.8 249 34 6.5 20 3.8 521 Muscogee Creek Nation (OK) 47 7.1 56 8.5 660 162 8.7 99 5.3 1,872 Osage Nation (OK) 46 5.7 28 3.5 808 102 6.9 54 3.7 1,476 Otoe-Missouria (OK) 5 4.7 8 7.5 107 13 3.9 16 4.8 332 Pueblo of San Felipe (NM) 1 1.8 1 1.8 56 10 6.0 1 0.6 167 Pueblo of Zuni (NM) 8 5.7 6 4.3 140 36 7.0 16 3.1 513 Santo Domingo (NM) 0 0.0 1 2.7 37 5 4.2 2 1.7 119 WCD (OK) 77 8.6 24 2.7 893 255 10.6 86 3.6 2,409
Mountain Plains
Colorado 1,650 7.0 306 1.3 23,447 2,957 5.6 3,861 7.3 52,742 Iowa 1,093 6.1 789 4.4 17,876 2,400 6.0 3,666 9.2 39,968 Kansas 1,563 8.7 920 5.1 17,995 3,443 8.7 3,621 9.2 39,426 Missouri 2,467 6.7 1,050 2.8 37,082 5,109 7.1 2,030 2.8 72,252 Montana 337 7.0 110 2.3 4,826 782 6.8 414 3.6 11,459 North Dakota 182 5.5 105 3.2 3,321 317 4.5 1,048 14.7 7,119 Utah 1,245 7.8 242 1.5 15,909 2,546 6.9 1,696 4.6 37,062 Wyoming 242 8.8 55 2.0 2,756 435 7.2 741 12.3 6,012 Cheyenne River Sioux (SD) 9 5.8 11 7.1 156 6 1.4 325 75.8 429 Eastern Shoshone (WY) 5 11.1 15 33.3 45 0 0.0 71 85.5 83 Northern Arapahoe (WY) 11 9.3 55 46.6 118 5 2.2 160 69.3 231 Omaha Nation (NE) 4 6.1 20 30.3 66 1 0.4 188 81.4 231 Rosebud Sioux (SD) 17 6.2 14 5.1 273 8 1.1 524 73.9 709 Santee Sioux Nation (NE) 3 10.0 4 13.3 30 1 1.5 44 65.7 67 Standing Rock Sioux (ND) 4 2.3 20 11.7 171 3 0.6 365 73.6 496 Three Affiliated (ND) 2 2.3 18 20.7 87 1 0.8 101 77.1 131 Winnebago (NE) 3 3.9 44 57.9 76 0 0.0 108 85.7 126
Western
Alaska 179 3.7 1,289 26.9 4,788 174 1.5 8,004 70.4 11,369 American Samoa 26 2.3 36 3.2 1,133 111 2.5 253 5.7 4,439 Arizona 3,526 7.5 2,397 5.1 47,320 5,556 6.9 6,291 7.8 80,142 Guam 403 18.5 234 10.7 2,182 864 20.4 456 10.8 4,236 Hawaii 494 5.5 450 5.0 9,045 953 4.7 2,759 13.6 20,277

WIC Participant and Program Characteristics: 2014 Final Report
Page F-89
Table F.13. (continued) Short Stature at Birth Among WIC Infants and Children By State: Number and Percent at or Below 2.3rd Percentile for Birth Length
Infants Children
At or Below
2.3rd Percentile
Not Reported
At or Below
2.3rd Percentile
Not Reported
Region and State Number % Number % Total Number Number % Number % Total Number Western (continued)
Idaho 535 5.1 309 3.0 10,458 1,098 4.8 3,701 16.2 22,866 Northern Marianas Islands 24 3.3 19 2.6 735 107 4.3 48 1.9 2,465 Washington 3,496 8.2 4,127 9.7 42,592 7,772 6.9 14,323 12.7 112,687 ITC-Arizona 197 7.4 171 6.4 2,667 453 7.4 572 9.3 6,137 Navajo Nation (AZ) 145 5.7 94 3.7 2,525 345 5.6 290 4.7 6,115
Notes
An infant is defined as a participant who is younger than 1 year of age and who would be classified as a child at the age of 366 days.
The anthropometric criteria are calculated using programming code for pediatric anthropometry developed by WHO based on WHO Child Growth Standards (2006).
Table includes those State agencies who provided valid data for at least 5% of the target population for this tabulation. Not all State agencies listed in table F.1 reported valid data for all SDS variables.
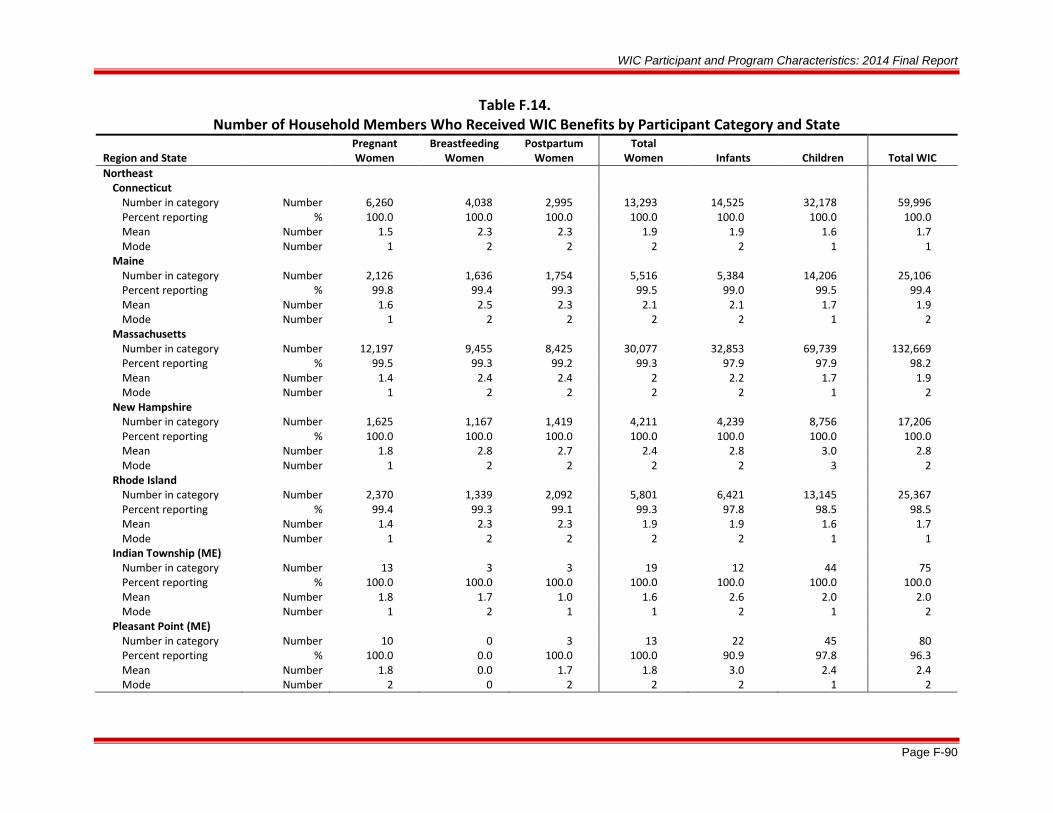
WIC Participant and Program Characteristics: 2014 Final Report
Page F-90
Table F.14. Number of Household Members Who Received WIC Benefits by Participant Category and State
Region and State
Pregnant Women
Breastfeeding Women
Postpartum Women
Total Women Infants Children Total WIC
Northeast Connecticut Number in category Number 6,260 4,038 2,995 13,293 14,525 32,178 59,996
Percent reporting % 100.0 100.0 100.0 100.0 100.0 100.0 100.0 Mean Number 1.5 2.3 2.3 1.9 1.9 1.6 1.7 Mode Number 1 2 2 2 2 1 1
Maine Number in category Number 2,126 1,636 1,754 5,516 5,384 14,206 25,106
Percent reporting % 99.8 99.4 99.3 99.5 99.0 99.5 99.4 Mean Number 1.6 2.5 2.3 2.1 2.1 1.7 1.9 Mode Number 1 2 2 2 2 1 2
Massachusetts Number in category Number 12,197 9,455 8,425 30,077 32,853 69,739 132,669
Percent reporting % 99.5 99.3 99.2 99.3 97.9 97.9 98.2 Mean Number 1.4 2.4 2.4 2 2.2 1.7 1.9 Mode Number 1 2 2 2 2 1 2
New Hampshire Number in category Number 1,625 1,167 1,419 4,211 4,239 8,756 17,206
Percent reporting % 100.0 100.0 100.0 100.0 100.0 100.0 100.0 Mean Number 1.8 2.8 2.7 2.4 2.8 3.0 2.8 Mode Number 1 2 2 2 2 3 2
Rhode Island Number in category Number 2,370 1,339 2,092 5,801 6,421 13,145 25,367
Percent reporting % 99.4 99.3 99.1 99.3 97.8 98.5 98.5 Mean Number 1.4 2.3 2.3 1.9 1.9 1.6 1.7 Mode Number 1 2 2 2 2 1 1
Indian Township (ME) Number in category Number 13 3 3 19 12 44 75
Percent reporting % 100.0 100.0 100.0 100.0 100.0 100.0 100.0 Mean Number 1.8 1.7 1.0 1.6 2.6 2.0 2.0 Mode Number 1 2 1 1 2 1 2
Pleasant Point (ME) Number in category Number 10 0 3 13 22 45 80
Percent reporting % 100.0 0.0 100.0 100.0 90.9 97.8 96.3 Mean Number 1.8 0.0 1.7 1.8 3.0 2.4 2.4 Mode Number 2 0 2 2 2 1 2

WIC Participant and Program Characteristics: 2014 Final Report
Page F-91
Table F.14. (continued) Number of Household Members Who Received WIC Benefits by Participant Category and State
Region and State Pregnant Women
Breastfeeding Women
Postpartum Women
Total Women Infants Children Total WIC
Northeast (continued) Seneca Nation (NY)
Number in category Number 23 6 7 36 56 57 149 Percent reporting % 100.0 100.0 100.0 100.0 96.4 100.0 98.7 Mean Number 1.5 1.5 1.7 1.5 2.4 1.9 2.0 Mode Number 1 * 1 1 2 1 2
Mid-Atlantic Delaware Number in category Number 1,889 1,170 1,624 4,683 6,306 12,654 23,643
Percent reporting % 99.7 99.6 99.2 99.5 99.5 99.5 99.5 Mean Number 1.5 2.4 2.3 2.0 1.9 1.6 1.8 Mode Number 1 2 2 2 2 1 1
District of Columbia Number in category Number 1,501 1,397 1,298 4,196 4,932 7,551 16,679
Percent reporting % 89.4 95.3 89.7 91.5 90.6 92.0 91.4 Mean Number 1.8 2.7 2.7 2.4 2.7 2.8 2.7 Mode Number 1 2 2 2 2 2 2
Maryland Number in category Number 13,373 14,129 8,047 35,549 38,586 78,764 152,899
Percent reporting % 99.9 97.5 96.8 98.2 99.5 99.3 99.1 Mean Number 1.4 2.4 2.4 2.0 2.0 1.7 1.8 Mode Number 1 2 2 2 2 1 1
New Jersey Number in category Number 14,935 13,263 9,049 37,247 38,340 89,420 165,007
Percent reporting % 99.4 99.0 98.6 99.1 98.7 99.1 99.0 Mean Number 1.4 2.5 2.3 2.0 2.0 1.7 1.9 Mode Number 1 2 2 2 2 1 1
Virginia Number in category Number 15,392 13,795 12,380 41,567 39,091 84,051 164,709
Percent reporting % 93.7 94.9 90.2 93.0 91.1 93.3 92.7 Mean Number 2.5 2.8 2.8 2.7 2.8 3.0 2.8 Mode Number 2 2 2 2 2 3 2
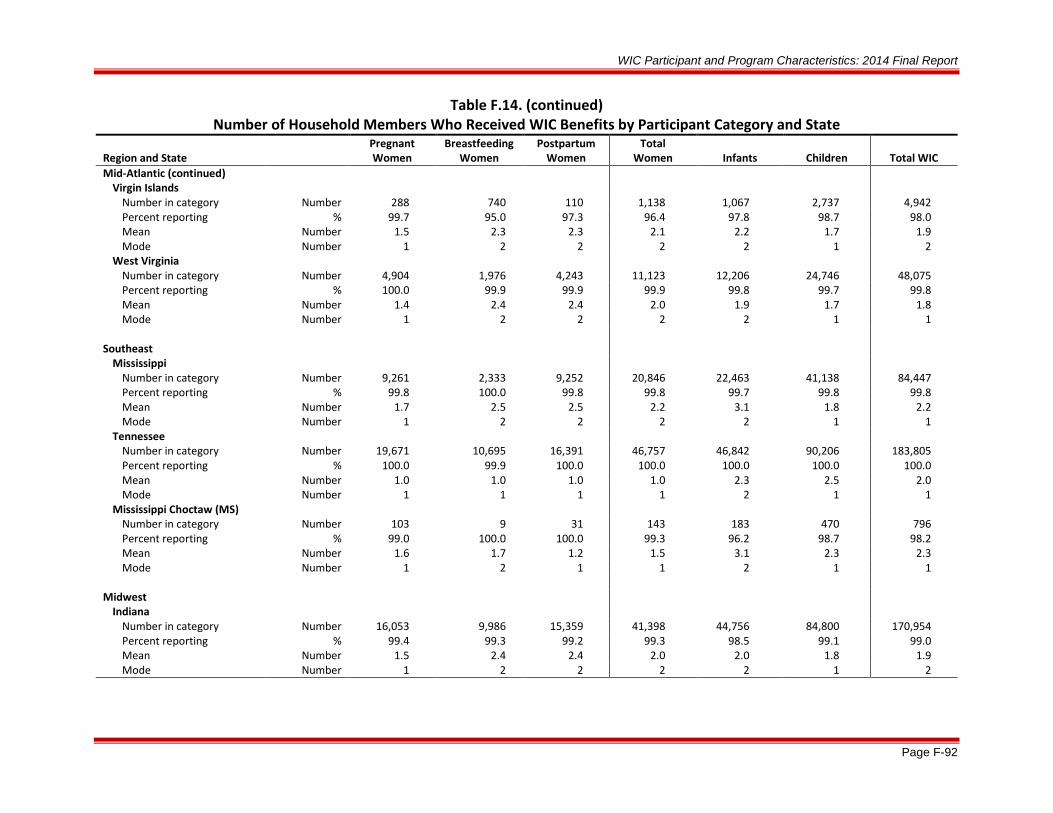
WIC Participant and Program Characteristics: 2014 Final Report
Page F-92
Table F.14. (continued) Number of Household Members Who Received WIC Benefits by Participant Category and State
Region and State Pregnant Women
Breastfeeding Women
Postpartum Women
Total Women Infants Children Total WIC
Mid-Atlantic (continued) Virgin Islands
Number in category Number 288 740 110 1,138 1,067 2,737 4,942 Percent reporting % 99.7 95.0 97.3 96.4 97.8 98.7 98.0 Mean Number 1.5 2.3 2.3 2.1 2.2 1.7 1.9 Mode Number 1 2 2 2 2 1 2
West Virginia Number in category Number 4,904 1,976 4,243 11,123 12,206 24,746 48,075
Percent reporting % 100.0 99.9 99.9 99.9 99.8 99.7 99.8 Mean Number 1.4 2.4 2.4 2.0 1.9 1.7 1.8 Mode Number 1 2 2 2 2 1 1
Southeast
Mississippi Number in category Number 9,261 2,333 9,252 20,846 22,463 41,138 84,447
Percent reporting % 99.8 100.0 99.8 99.8 99.7 99.8 99.8 Mean Number 1.7 2.5 2.5 2.2 3.1 1.8 2.2 Mode Number 1 2 2 2 2 1 1
Tennessee Number in category Number 19,671 10,695 16,391 46,757 46,842 90,206 183,805
Percent reporting % 100.0 99.9 100.0 100.0 100.0 100.0 100.0 Mean Number 1.0 1.0 1.0 1.0 2.3 2.5 2.0 Mode Number 1 1 1 1 2 1 1
Mississippi Choctaw (MS) Number in category Number 103 9 31 143 183 470 796
Percent reporting % 99.0 100.0 100.0 99.3 96.2 98.7 98.2 Mean Number 1.6 1.7 1.2 1.5 3.1 2.3 2.3 Mode Number 1 2 1 1 2 1 1
Midwest Indiana Number in category Number 16,053 9,986 15,359 41,398 44,756 84,800 170,954
Percent reporting % 99.4 99.3 99.2 99.3 98.5 99.1 99.0 Mean Number 1.5 2.4 2.4 2.0 2.0 1.8 1.9 Mode Number 1 2 2 2 2 1 2

WIC Participant and Program Characteristics: 2014 Final Report
Page F-93
Table F.14. (continued) Number of Household Members Who Received WIC Benefits by Participant Category and State
Region and State Pregnant Women
Breastfeeding Women
Postpartum Women
Total Women Infants Children Total WIC
Midwest (continued) Michigan
Number in category Number 24,683 13,227 23,415 61,325 61,522 165,285 288,132 Percent reporting % 99.9 99.1 99.0 99.4 99.1 99.3 99.3 Mean Number 1.5 2.4 2.3 2.0 2.0 1.7 1.8 Mode Number 1 2 2 2 2 1 1
Minnesota Number in category Number 12,211 10,543 8,207 30,961 28,068 73,390 132,419
Percent reporting % 99.5 99.3 99.1 99.3 98.8 99.3 99.2 Mean Number 1.7 2.6 2.5 2.2 2.2 1.9 2.1 Mode Number 1 2 2 2 2 1 2
Southwest Arkansas Number in category Number 10,616 3,329 10,321 24,266 23,863 46,264 94,393
Percent reporting % 99.3 98.9 98.9 99.1 98.3 99.2 98.9 Mean Number 1.4 2.4 2.3 1.9 1.9 1.8 1.9 Mode Number 1 2 2 2 2 1 2
Louisiana Number in category Number 14,498 5,080 16,739 36,317 41,054 66,863 144,234
Percent reporting % 97.3 98.8 99.2 98.4 99.2 98.4 98.6 Mean Number 3.3 3.8 3.9 3.6 3.8 4.0 3.9 Mode Number 3 3 3 3 3 4 3
New Mexico Number in category Number 7,229 5,422 2,559 15,210 14,329 33,249 62,788
Percent reporting % 90.8 96.9 93.5 93.4 96.0 97.5 96.2 Mean Number 1.6 2.4 2.6 2.1 2.2 1.7 1.9 Mode Number 1 2 2 2 2 1 1
Oklahoma Number in category Number 11,140 4,954 8,983 25,077 23,944 54,555 103,576
Percent reporting % 91.1 91.3 91.3 91.2 89.2 92.5 91.4 Mean Number 1.6 2.4 2.4 2.0 2.3 1.8 2.0 Mode Number 1 2 2 2 2 1 2

WIC Participant and Program Characteristics: 2014 Final Report
Page F-94
Table F.14. (continued) Number of Household Members Who Received WIC Benefits by Participant Category and State
Region and State Pregnant Women
Breastfeeding Women
Postpartum Women
Total Women Infants Children Total WIC
Southwest (continued) Texas
Number in category Number 96,174 116,505 49,995 262,674 244,077 549,955 1,056,706 Percent reporting % 100.0 100.0 100.0 100.0 100.0 100.0 100.0 Mean Number 1.7 2.4 2.5 2.2 2.2 1.8 2.0 Mode Number 1 2 2 2 2 1 2
ACL (NM) Number in category Number 47 54 31 132 121 332 585
Percent reporting % 95.7 96.3 93.5 95.5 95.0 93.1 94.0 Mean Number 1.3 2.4 2.2 2.0 2.1 1.7 1.8 Mode Number 1 2 2 2 2 1 2
Chickasaw Nation (OK) Number in category Number 407 257 389 1,053 1,063 2,332 4,448
Percent reporting % 95.8 96.9 94.9 95.7 93.3 97.3 96.0 Mean Number 1.5 2.4 2.4 2.1 2.1 1.8 2.0 Mode Number 1 2 2 2 2 1 2
Choctaw Nation (OK) Number in category Number 325 133 348 806 929 2,269 4,004
Percent reporting % 98.8 97.7 97.4 98.0 95.9 98.7 97.9 Mean Number 1.5 2.5 2.4 2.1 2.0 1.8 1.9 Mode Number 1 2 2 2 2 1 1
Citizen Potawatomi (OK) Number in category Number 152 64 113 329 352 710 1,391
Percent reporting % 82.2 68.8 79.6 78.7 48.3 61.7 62.3 Mean Number 1.5 2.5 2.4 2.0 2.3 1.9 2.0 Mode Number 1 2 2 2 2 2 2
Eight Northern Pueblos (NM) s Number in category Number 18 16 14 48 66 181 295
Percent reporting % 100.0 100.0 92.3 97.8 96.6 98.5 97.9 Mean Number 1.4 2.3 2.2 1.9 1.8 1.4 1.6 Mode Number 1 2 2 2 2 1 1
Five Sandoval Pueblos (NM) Number in category Number 21 17 21 59 63 140 262
Percent reporting % 100.0 100.0 66.7 88.1 87.3 96.4 92.4 Mean Number 1.2 2.1 2.4 1.8 1.8 1.4 1.6 Mode Number 1 2 2 2 2 1 1

WIC Participant and Program Characteristics: 2014 Final Report
Page F-95
Table F.14. (continued) Number of Household Members Who Received WIC Benefits by Participant Category and State
Region and State Pregnant Women
Breastfeeding Women
Postpartum Women
Total Women Infants Children Total WIC
Southwest (continued) ITC Oklahoma
Number in category Number 77 39 99 215 249 521 985 Percent reporting % 96.1 100.0 93.9 95.8 93.6 97.9 96.3 Mean Number 1.6 2.6 2.6 2.2 2.1 1.8 2 Mode Number 1 2 2 2 2 1 2
Muscogee Creek Nation (OK) Number in category Number 268 112 280 660 660 1,872 3,192
Percent reporting % 98.1 97.3 97.9 97.9 93.8 97.7 96.9 Mean Number 1.6 2.6 2.5 2.1 2.2 1.8 2.0 Mode Number 1 2 2 2 2 1 2
Osage Nation (OK) Number in category Number 175 94 300 569 808 1,476 2,853
Percent reporting % 98.3 94.7 98.0 97.5 95.8 98.2 97.4 Mean Number 1.7 2.6 2.5 2.3 2.0 1.9 2.0 Mode Number 1 2 2 2 2 1 2
Otoe Missouria (OK) Number in category Number 48 17 40 105 107 332 544
Percent reporting % 100.0 94.1 95.0 97.1 91.6 97.3 96.1 Mean Number 1.5 2.6 2.6 2.1 2.1 1.9 2.0 Mode Number 1 2 2 2 2 1 2
Pueblo of Isleta (NM) Number in category Number 94 133 58 285 311 604 1,200
Percent reporting % 89.4 98.5 94.8 94.7 95.2 96.7 95.8 Mean Number 1.9 2.5 2.6 2.3 2.2 1.8 2.0 Mode Number 1 2 2 2 2 1 2
Pueblo of San Felipe (NM) Number in category Number 19 36 11 66 56 167 289
Percent reporting % 100.0 100.0 100.0 100.0 100.0 98.2 99.0 Mean Number 1.5 2.4 2.3 2.1 2.2 1.5 1.8 Mode Number 1 2 2 2 2 1 1
Pueblo of Zuni (NM) Number in category Number 68 83 24 175 140 513 828
Percent reporting % 100.0 98.8 95.8 98.9 97.9 97.9 98.1 Mean Number 1.5 2.3 2.4 2.0 2.2 1.6 1.8 Mode Number 1 2 2 2 2 1 1

WIC Participant and Program Characteristics: 2014 Final Report
Page F-96
Table F.14. (continued) Number of Household Members Who Received WIC Benefits by Participant Category and State
Region and State Pregnant Women
Breastfeeding Women
Postpartum Women
Total Women Infants Children Total WIC
Southwest (continued) Santo Domingo (NM)
Number in category Number 11 19 6 36 37 119 192 Percent reporting % 100.0 94.7 100.0 97.2 97.3 99.2 98.4 Mean Number 1.7 2.4 1.8 2.1 1.8 1.6 1.7 Mode Number 1 2 2 2 2 1 1
WCD (OK) Number in category Number 405 174 350 929 893 2,409 4,231
Percent reporting % 99.0 99.4 97.4 98.5 96.6 96.9 97.2 Mean Number 1.6 2.5 2.5 2.1 2.1 1.8 1.9 Mode Number 1 2 2 2 2 1 2
Mountain Plains
Colorado Number in category Number 9,490 7,391 7,679 24,560 23,447 52,742 100,749
Percent reporting % 99.9 99.4 99.5 99.6 99.4 99.7 99.6 Mean Number 1.5 2.4 2.4 2.1 2.1 1.8 1.9 Mode Number 1 2 2 2 2 1 2
Iowa Number in category Number 6,873 4,147 6,163 17,183 17,876 39,968 75,027
Percent reporting % 99.7 99.4 99.4 99.5 98.3 98.6 98.7 Mean Number 1.6 2.5 2.4 2.1 2.1 1.8 1.9 Mode Number 1 2 2 2 2 1 2
Kansas Number in category Number 7,161 4,925 5,909 17,995 17,995 39,426 75,416
Percent reporting % 100.0 100.0 100.0 100.0 100.0 100.0 100.0 Mean Number 2.5 3.0 2.9 2.8 2.9 3.2 3.0 Mode Number 2 2 2 2 2 3 3
Missouri Number in category Number 15,615 8,280 14,223 38,118 37,082 72,252 147,452
Percent reporting % 99.5 99.1 98.8 99.2 98.7 99.2 99.1 Mean Number 1.5 2.4 2.4 2.0 2.0 1.8 1.9 Mode Number 1 2 2 2 2 1 2

WIC Participant and Program Characteristics: 2014 Final Report
Page F-97
Table F.14. (continued) Number of Household Members Who Received WIC Benefits by Participant Category and State
Region and State Pregnant Women
Breastfeeding Women
Postpartum Women
Total Women Infants Children Total WIC
Mountain Plains (continued) Montana
Number in category Number 1,984 1,616 1,269 4,869 4,826 11,459 21,154 Percent reporting % 99.3 99.4 99.0 99.3 98.6 98.9 98.9 Mean Number 1.6 2.5 2.4 2.1 2.1 1.8 1.9 Mode Number 1 2 2 2 2 1 2
Nebraska Number in category Number 2,885 2,884 3,738 9,507 9,711 21,757 40,975
Percent reporting % 100.0 99.9 99.9 99.9 99.9 99.9 99.9 Mean Number 1.5 2.4 2.3 2.1 2.1 1.8 1.9 Mode Number 1 2 2 2 2 1 2
North Dakota Number in category Number 1,298 853 1,058 3,209 3,321 7,119 13,649
Percent reporting % 99.5 99.9 99.4 99.6 98.0 97.9 98.3 Mean Number 1.7 2.5 2.5 2.2 2.1 1.9 2.0 Mode Number 1 2 2 2 2 1 2
South Dakota Number in category Number 1,793 1,331 1,611 4,735 4,894 11,576 21,205
Percent reporting % 100.0 99.4 98.8 99.4 99.3 99.6 99.5 Mean Number 1.6 2.4 2.3 2.0 2.0 1.8 1.9 Mode Number 1 2 2 2 2 1 2
Utah Number in category Number 6,609 6,737 4,215 17,561 15,909 37,062 70,532
Percent reporting % 99.8 99.5 99.3 99.6 99.3 99.7 99.6 Mean Number 1.7 2.6 2.5 2.2 2.2 2.0 2.1 Mode Number 1 2 2 2 2 2 2
Wyoming Number in category Number 1,098 843 791 2,732 2,756 6,012 11,500
Percent reporting % 99.9 99.2 98.1 99.2 98.9 99.5 99.3 Mean Number 1.6 2.5 2.4 2.1 2.1 1.9 2.0 Mode Number 1 2 2 2 2 1 2
Cheyenne River Sioux (SD) Number in category Number 68 22 48 138 156 429 723
Percent reporting % 100.0 100.0 100.0 100.0 94.9 98.8 98.2 Mean Number 1.8 1.6 1.9 1.8 3.0 2.2 2.3 Mode Number 2 2 2 2 2 1 1

WIC Participant and Program Characteristics: 2014 Final Report
Page F-98
Table F.14. (continued) Number of Household Members Who Received WIC Benefits by Participant Category and State
Region and State Pregnant Women
Breastfeeding Women
Postpartum Women
Total Women Infants Children Total WIC
Mountain Plains (continued) Eastern Shoshone (WY)
Number in category Number 15 10 16 41 45 83 169 Percent reporting % 100.0 90.0 100.0 97.6 93.3 96.4 95.9 Mean Number 1.7 1.3 1.8 1.7 3.2 2.6 2.5 Mode Number 1 1 1 1 2 1 2
Northern Arapahoe (WY) Number in category Number 38 32 31 101 118 231 450
Percent reporting % 100.0 100.0 100.0 100.0 94.1 99.1 98.0 Mean Number 1.4 1.2 1.3 1.3 2.9 2.4 2.3 Mode Number 1 1 1 1 2 2 2
Omaha Nation (NE) Number in category Number 30 2 10 42 66 231 339
Percent reporting % 96.7 100.0 90.0 95.2 84.8 92.2 91.2 Mean Number 2.2 2.5 2.1 2.2 3.1 2.1 2.3 Mode Number 2 * 2 2 2 1 1
Rosebud Sioux (SD) Number in category Number 113 88 71 272 273 709 1,254
Percent reporting % 97.3 100.0 100.0 98.9 94.9 96.3 96.6 Mean Number 1.3 1.4 1.4 1.4 2.9 2.4 2.3 Mode Number 1 1 1 1 2 2 2
Santee Sioux (NE) Number in category Number 17 2 8 27 30 67 124
Percent reporting % 82.4 100.0 100.0 88.9 96.7 92.5 92.7 Mean Number 2.1 1.5 1.5 1.8 3.2 2.1 2.3 Mode Number 2 * * 2 2 1 2
Standing Rock Sioux (ND) Number in category Number 95 14 52 161 171 496 828
Percent reporting % 98.9 100.0 100.0 99.4 88.3 95.0 94.4 Mean Number 1.6 1.4 1.4 1.5 2.9 2.4 2.3 Mode Number 1 1 1 1 3 2 2
Three Affiliated (ND) Number in category Number 35 6 27 68 87 131 286
Percent reporting % 100.0 100.0 100.0 100.0 97.7 98.5 98.6 Mean Number 1.8 1.7 1.7 1.7 2.6 2.1 2.2 Mode Number 1 1 * 1 2 1 2

WIC Participant and Program Characteristics: 2014 Final Report
Page F-99
Table F.14. (continued) Number of Household Members Who Received WIC Benefits by Participant Category and State
Region and State Pregnant Women
Breastfeeding Women
Postpartum Women
Total Women Infants Children Total WIC
Mountain Plains (continued) Ute Mountain Ute (CO)
Number in category Number 22 7 10 39 48 104 191 Percent reporting % 95.5 100.0 100.0 97.4 100.0 100.0 99.5 Mean Number 1.7 1.9 1.9 1.8 2.5 1.9 2.0 Mode Number 2 2 2 2 2 1 2
Winnebago (NE) Number in category Number 30 18 12 60 76 126 262
Percent reporting % 83.3 94.4 100.0 90.0 78.9 94.4 88.9 Mean Number 1.9 2.5 1.9 2.1 2.6 1.9 2.1 Mode Number 2 2 2 2 2 1 1
Western
Alaska Number in category Number 2,168 2,083 1,182 5,433 4,788 11,369 21,590
Percent reporting % 99.3 98.2 97.7 98.5 97.6 98.6 98.4 Mean Number 1.6 2.4 2.4 2.1 2.1 1.9 2.0 Mode Number 1 2 2 2 2 1 2
American Samoa Number in category Number 427 725 182 1,334 1,133 4,439 6,906
Percent reporting % 100.0 99.9 100.0 99.9 100.0 100.0 100.0 Mean Number 1.8 2.7 2.6 2.4 2.5 1.9 2.1 Mode Number 1 2 2 2 2 1 1
Arizona Number in category Number 17,274 14,432 14,357 46,063 47,320 80,142 173,525
Percent reporting % 100.0 99.6 100.0 99.9 100.0 100.0 100.0 Mean Number 1.5 2.4 2.4 2.0 2.0 1.8 1.9 Mode Number 1 2 2 2 2 1 2
Guam Number in category Number 644 703 686 2,033 2,182 4,236 8,451
Percent reporting % 100.0 99.6 100.0 99.9 100.0 100.0 100.0 Mean Number 1.6 2.6 2.6 2.3 2.3 2.1 2.2 Mode Number 1 2 2 2 2 1 2

WIC Participant and Program Characteristics: 2014 Final Report
Page F-100
Table F.14. (continued) Number of Household Members Who Received WIC Benefits by Participant Category and State
Region and State Pregnant Women
Breastfeeding Women
Postpartum Women
Total Women Infants Children Total WIC
Western (continued) Hawaii
Number in category Number 3,427 4,003 2,068 9,498 9,045 20,277 38,820 Percent reporting % 98.6 97.4 95.7 97.5 96.7 97.1 97.1 Mean Number 2.2 2.9 3.0 2.7 2.9 3.2 3.0 Mode Number 2 2 2 2 2 3 2
Idaho Number in category Number 4,424 3,830 2,612 10,866 10,458 22,866 44,190
Percent reporting % 99.7 98.9 98.9 99.2 98.7 98.7 98.8 Mean Number 1.6 2.5 2.4 2.1 2.1 1.9 2.0 Mode Number 1 2 2 2 2 1 2
Nevada Number in category Number 6,466 5,036 7,073 18,575 17,557 41,145 77,277
Percent reporting % 98.6 98.8 98.3 98.5 98.3 97.5 98.0 Mean Number 1.5 2.4 2.2 2.0 2.0 1.8 1.9 Mode Number 1 2 2 2 2 1 2
Northern Mariana Islands Number in category Number 340 288 204 832 735 2,465 4,032
Percent reporting % 100.0 99.7 100.0 99.9 100.0 100.0 100.0 Mean Number 1.6 2.5 2.5 2.1 2.2 1.7 1.9 Mode Number 1 2 2 2 2 1 1
Washington Number in category Number 23,675 14,932 8,196 46,803 42,592 112,687 202,082
Percent reporting % 100.0 100.0 100.0 100.0 100.0 100.0 100.0 Mean Number 1.7 2.5 2.4 2.1 2.1 1.8 1.9 Mode Number 1 2 2 2 2 1 2
ITC Arizona (AZ) Number in category Number 979 592 954 2,525 2,667 6,137 11,329
Percent reporting % 100.0 100.0 100.0 100.0 100.0 100.0 100.0 Mean Number 2.1 2.9 3.0 2.6 3.0 3.3 3.1 Mode Number 1 2 2 2 2 3 2
ITC Nevada (NV) Number in category Number 136 106 98 340 333 826 1,499
Percent reporting % 100.0 99.1 99.0 99.4 99.4 98.1 98.7 Mean Number 1.4 2.2 2.4 2.0 2.0 1.7 1.9 Mode Number 1 2 2 2 2 1 2

WIC Participant and Program Characteristics: 2014 Final Report
Page F-101
Table F.14. (continued) Number of Household Members Who Received WIC Benefits by Participant Category and State
Region and State Pregnant Women
Breastfeeding Women
Postpartum Women
Total Women Infants Children Total WIC
Western (continued) Navajo Nation (AZ)
Number in category Number 1,297 1,067 540 2,904 2,525 6,115 11,544 Percent reporting % 100.0 98.8 100.0 99.6 100.0 100.0 99.9 Mean Number 1.5 2.3 2.4 2.0 2.1 1.7 1.9 Mode Number 1 2 2 2 2 1 2
Notes
An infant is defined as a participant who at certification is younger than 1 year of age and who would be classified as a child at the age of 366 days.
Table includes those State agencies who provided valid data for at least 5% of the target population for this tabulation. Not all State agencies listed in table F.1 reported valid data for all SDS variables.
* Multiple modes by participant category by State.
Region or State Participant Category Modes Seneca Nation Breastfeeding Women 1 2 Omaha Nation Breastfeeding Women 2 3 Santee Sioux Nation Breastfeeding Women 1 2 Santee Sioux Nation Postpartum Women 1 2 Three Affiliated Postpartum Women 1 2

WIC Participant and Program Characteristics: 2014 Final Report
Page F-102
Table F.15a. Prepregnant Body Mass Index for Pregnant Women WIC Participants
By State Weight Categories in Effect Prior to Revision 10 to the Nutritional Risk Criteria
Very Underweight
Underweight
Normal Weight
Overweight
Obese
Not Reported
Total
Number Region and State Number % Number % Number % Number % Number % Number % Northeast
Connecticut 137 2.2 317 5.1 2,484 39.7 1,050 16.8 2,247 35.9 25 0.4 6,260 Maine 62 2.9 144 6.8 775 36.5 298 14.0 842 39.6 5 0.2 2,126 Massachusetts 298 2.4 749 6.1 5,229 42.9 1,964 16.1 3,951 32.4 6 0.0 12,197 New Hampshire 45 2.8 110 6.8 648 39.9 240 14.8 574 35.3 8 0.5 1,625 Rhode Island 55 2.3 131 5.5 982 41.4 370 15.6 820 34.6 12 0.5 2,370 Vermont 30 2.4 73 5.9 478 38.4 186 14.9 455 36.5 24 1.9 1,246 Indian Township (ME) 0 0.0 0 0.0 0 0.0 0 0.0 2 15.4 11 84.6 13 Pleasant Point (ME) 0 0.0 1 10.0 1 10.0 0 0.0 3 30.0 5 50.0 10 Seneca Nation (NY) 0 0.0 0 0.0 4 17.4 1 4.3 6 26.1 12 52.2 23
Mid-Atlantic
Delaware 34 1.8 105 5.6 700 37.1 268 14.2 643 34.0 139 7.4 1,889
District of Columbia 33 2.2 77 5.1 551 36.7 234 15.6 602 40.1 4 0.3 1,501 Maryland 274 2.0 642 4.8 4,740 35.4 2,112 15.8 4,448 33.3 1,157 8.7 13,373 New Jersey 315 2.1 829 5.6 6,428 43.0 2,601 17.4 4,667 31.2 95 0.6 14,935 Pennsylvania 611 2.8 1,406 6.6 8,503 39.7 3,175 14.8 7,733 36.1 16 0.1 21,444 Virginia 433 2.8 974 6.3 5,912 38.4 2,324 15.1 5,401 35.1 347 2.3 15,392 Virgin Islands 12 4.2 17 5.9 89 30.9 34 11.8 87 30.2 49 17.0 288 West Virginia 196 4.0 401 8.2 1,758 35.8 683 13.9 1,856 37.8 10 0.2 4,904
Southeast
Alabama 238 1.5 875 5.4 5,623 34.9 2,289 14.2 6,462 40.1 634 3.9 16,121
Florida 1,548 2.8 3,674 6.7 22,291 40.6 8,317 15.1 17,651 32.1 1,486 2.7 54,967 Georgia 895 2.6 2,103 6.1 12,524 36.1 5,147 14.8 13,348 38.5 660 1.9 34,677 Mississippi 252 2.7 529 5.7 2,966 32.0 1,194 12.9 3,648 39.4 672 7.3 9,261 North Carolina 616 2.3 1,343 5.1 8,444 31.8 3,566 13.4 9,128 34.4 3,423 12.9 26,520 South Carolina 447 3.2 904 6.5 4,799 34.5 1,959 14.1 5,519 39.7 265 1.9 13,893 Eastern Band Cherokee (NC) 0 0.0 2 2.9 14 20.0 3 4.3 24 34.3 27 38.6 70 Mississippi Choctaw (MS) 1 1.0 1 1.0 14 13.6 12 11.7 53 51.5 22 21.4 103
Midwest
Illinois 795 2.6 1,834 5.9 11,994 38.6 4,936 15.9 11,153 35.9 391 1.3 31,103
Indiana 486 3.0 1,064 6.6 6,053 37.7 2,302 14.3 6,036 37.6 112 0.7 16,053 Michigan 561 2.3 1,456 5.9 8,544 34.6 3,242 13.1 8,203 33.2 2,677 10.8 24,683 Minnesota 262 2.1 738 6.0 4,828 39.5 2,011 16.5 4,303 35.2 69 0.6 12,211 Wisconsin 228 2.1 677 6.3 4,012 37.2 1,643 15.2 4,199 38.9 40 0.4 10,799

WIC Participant and Program Characteristics: 2014 Final Report
Page F-103
Table F.15a. (continued) Prepregnant Body Mass Index for Pregnant Women WIC Participants
By State Weight Categories in Effect Prior to Revision 10 to the Nutritional Risk Criteria
Very
Underweight
Underweight Normal
Weight
Overweight
Obese Not
Reported
Total Number Region and State Number % Number % Number % Number % Number % Number %
Southwest
Arkansas 306 2.9 719 6.8 3,882 36.6 1,515 14.3 4,100 38.6 94 0.9 10,616
Louisiana 416 2.9 956 6.6 5,356 36.9 2,040 14.1 5,636 38.9 94 0.6 14,498 New Mexico 187 2.6 440 6.1 2,877 39.8 1,167 16.1 2,385 33.0 173 2.4 7,229 Oklahoma 320 2.9 735 6.6 4,238 38.0 1,648 14.8 4,015 36.0 184 1.7 11,140 Texas 2,089 2.2 5,087 5.3 35,688 37.1 15,927 16.6 36,242 37.7 1,141 1.2 96,174 ACL (NM) 2 4.3 2 4.3 14 29.8 10 21.3 17 36.2 2 4.3 47 Chickasaw Nation (OK) 10 2.5 26 6.4 146 35.9 52 12.8 159 39.1 14 3.4 407 Choctaw Nation (OK) 4 1.2 21 6.5 117 36.0 45 13.8 131 40.3 7 2.2 325 Citizen Potawatomi (OK) 3 2.0 3 2.0 49 32.2 21 13.8 46 30.3 30 19.7 152 Eight Northern Pueblos (NM) 1 4.5 1 4.5 5 27.3 2 9.1 9 50.0 1 4.5 18 Five Sandoval Pueblos (NM) 0 0.0 1 4.8 3 14.3 2 9.5 15 71.4 0 0.0 21 ITC Oklahoma 2 2.6 6 7.8 19 24.7 16 20.8 30 39.0 4 5.2 77 Muscogee Creek Nation (OK) 7 2.6 13 4.9 97 36.2 40 14.9 103 38.4 8 3.0 268 Osage Nation (OK) 5 2.9 5 2.9 66 37.7 28 16.0 68 38.9 3 1.7 175 Otoe Missouria (OK) 1 2.1 1 2.1 15 31.3 6 12.5 25 52.1 0 0.0 48 Pueblo of Isleta (NM) 2 2.1 3 3.2 40 42.6 14 14.9 30 31.9 5 5.3 94 Pueblo of San Felipe (NM) 2 10.5 0 0.0 5 26.3 2 10.5 10 52.6 0 0.0 19 Pueblo of Zuni (NM) 1 1.5 1 1.5 18 26.5 18 26.5 28 41.2 2 2.9 68 Santo Domingo (NM) 0 0.0 0 0.0 5 45.5 0 0.0 6 54.5 0 0.0 11 WCD (OK) 12 3.0 21 5.2 131 32.3 60 14.8 174 43.0 7 1.7 405
Mountain Plains
Colorado 266 2.8 636 6.7 3,960 41.7 1,400 14.8 3,111 32.8 117 1.2 9,490
Iowa 131 1.9 354 5.2 2,422 35.2 935 13.6 2,804 40.8 227 3.3 6,873 Kansas 194 2.7 455 6.4 2,733 38.2 1,087 15.2 2,656 37.1 36 0.5 7,161 Missouri 451 2.9 1,115 7.1 5,820 37.3 2,200 14.1 5,757 36.9 272 1.7 15,615 Montana 60 3.0 132 6.7 793 40.0 271 13.7 706 35.6 22 1.1 1,984 Nebraska 59 2.0 163 5.6 1,039 36.0 466 16.2 1,124 39.0 34 1.2 2,885 North Dakota 35 2.7 85 6.5 477 36.7 198 15.3 485 37.4 18 1.4 1,298 South Dakota 46 2.6 103 5.7 703 39.2 260 14.5 615 34.3 66 3.7 1,793 Utah 148 2.2 431 6.5 2,728 41.3 998 15.1 2,144 32.4 160 2.4 6,609 Wyoming 46 4.2 76 6.9 412 37.5 156 14.2 372 33.9 36 3.3 1,098 Cheyenne River Sioux (SD) 1 1.5 4 5.9 23 33.8 13 19.1 25 36.8 2 2.9 68 Eastern Shoshone (WY) 0 0.0 0 0.0 1 6.7 2 13.3 12 80.0 0 0.0 15 Northern Arapahoe (WY) 0 0.0 3 7.9 12 31.6 3 7.9 13 34.2 7 18.4 38 Omaha Nation (NE) 0 0.0 1 3.3 3 10.0 4 13.3 21 70.0 1 3.3 30 Rosebud Sioux (SD) 3 2.7 7 6.2 48 42.5 19 16.8 35 31.0 1 0.9 113 Santee Sioux (NE) 0 0.0 0 0.0 5 29.4 3 17.6 8 47.1 1 5.9 17 Standing Rock Sioux (ND) 2 2.1 5 5.3 33 34.7 14 14.7 41 43.2 0 0.0 95

WIC Participant and Program Characteristics: 2014 Final Report
Page F-104
Table F.15a. (continued) Prepregnant Body Mass Index for Pregnant Women WIC Participants
By State Weight Categories in Effect Prior to Revision 10 to the Nutritional Risk Criteria
Very
Underweight
Underweight Normal
Weight
Overweight
Obese Not
Reported
Total Number Region and State Number % Number % Number % Number % Number % Number %
Mountain Plains (continued) Three Affiliated (ND) 0 0.0 3 8.6 11 31.4 3 8.6 15 42.9 3 8.6 35 Ute Mountain Ute (CO) 0 0.0 0 0.0 3 13.6 2 9.1 16 72.7 1 4.5 22 Winnebago (NE) 0 0.0 0 0.0 9 30.0 4 13.3 8 26.7 9 30.0 30
Western
Alaska 26 1.2 91 4.2 744 34.3 291 13.4 605 27.9 411 19.0 2,168
American Samoa 1 0.2 6 1.4 45 10.5 25 5.9 115 26.9 235 55.0 427 Arizona 457 2.6 1,093 6.3 6,830 39.5 2,872 16.6 5,901 34.2 121 0.7 17,274 Guam 23 3.6 37 5.7 250 38.8 95 14.8 236 36.6 3 0.5 644 Hawaii 107 3.1 256 7.5 1,490 43.5 447 13.0 1,075 31.4 52 1.5 3,427 Idaho 104 2.4 295 6.7 1,802 40.7 662 15.0 1,556 35.2 5 0.1 4,424 Nevada 150 2.3 386 6.0 2,641 40.8 981 15.2 2,141 33.1 167 2.6 6,466 Northern Mariana Islands 10 2.9 26 7.6 185 54.4 42 12.4 76 22.4 1 0.3 340 Washington 379 1.6 1,084 4.6 8,394 35.5 3,414 14.4 7,965 33.6 2,439 10.3 23,675 ITC Arizona (AZ) 8 0.8 36 3.7 276 28.2 154 15.7 499 51.0 6 0.6 979 ITC Nevada (NV) 2 1.5 10 7.4 65 47.8 9 6.6 50 36.8 0 0.0 136 Navajo Nation (AZ) 23 1.8 62 4.8 428 33.0 203 15.7 573 44.2 8 0.6 1,297
Notes
Very Underweight = BMI 10.0–17.9
Underweight = BMI 18.0–19.7
Normal Weight = BMI 19.8–26.0
Overweight = BMI 26.1–29.0
Obese = BMI 29.1–74.9
BMI equals kilograms/meters2.
"Not reported" indicates number and percent of pregnant women for whom no data were reported on pregnancy weight and height.
Table includes those State agencies who provided valid data for at least 5% of the target population for this tabulation. Not all State agencies listed in table F.1 reported valid data for all SDS variables.
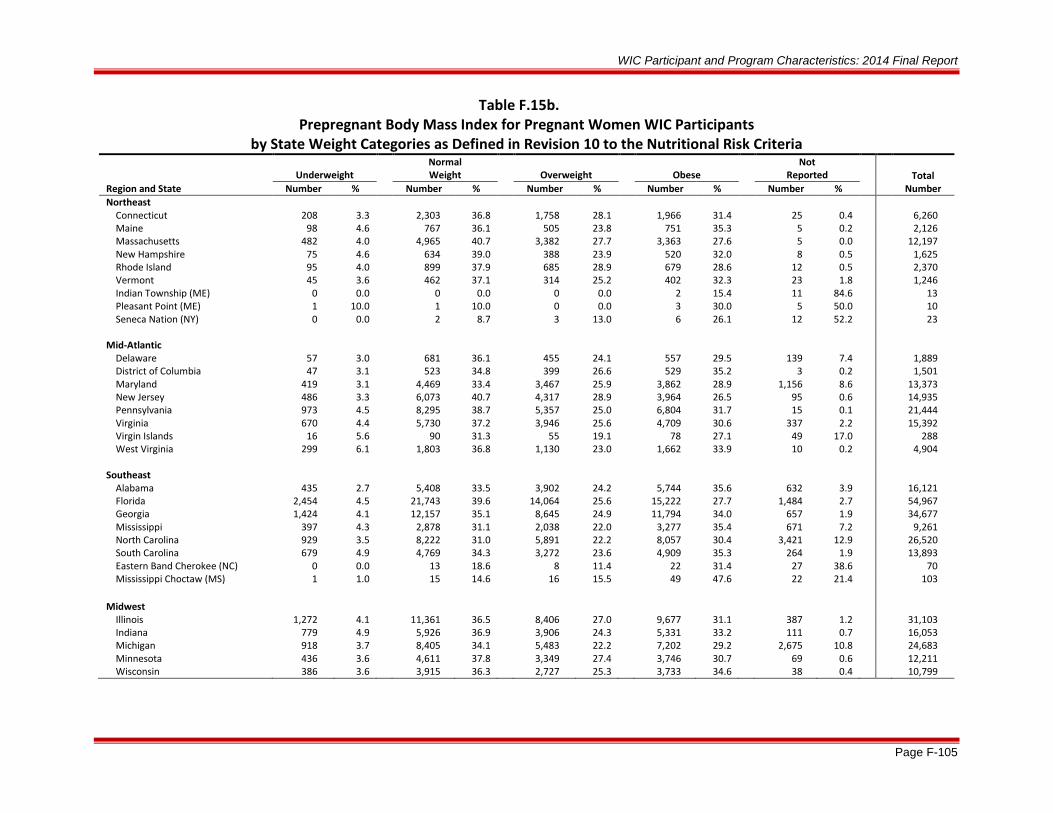
WIC Participant and Program Characteristics: 2014 Final Report
Page F-105
Table F.15b. Prepregnant Body Mass Index for Pregnant Women WIC Participants
by State Weight Categories as Defined in Revision 10 to the Nutritional Risk Criteria
Underweight
Normal Weight
Overweight
Obese
Not Reported
Total
Number Region and State Number % Number % Number % Number % Number % Northeast
Connecticut 208 3.3 2,303 36.8 1,758 28.1 1,966 31.4 25 0.4 6,260 Maine 98 4.6 767 36.1 505 23.8 751 35.3 5 0.2 2,126 Massachusetts 482 4.0 4,965 40.7 3,382 27.7 3,363 27.6 5 0.0 12,197 New Hampshire 75 4.6 634 39.0 388 23.9 520 32.0 8 0.5 1,625 Rhode Island 95 4.0 899 37.9 685 28.9 679 28.6 12 0.5 2,370 Vermont 45 3.6 462 37.1 314 25.2 402 32.3 23 1.8 1,246 Indian Township (ME) 0 0.0 0 0.0 0 0.0 2 15.4 11 84.6 13 Pleasant Point (ME) 1 10.0 1 10.0 0 0.0 3 30.0 5 50.0 10 Seneca Nation (NY) 0 0.0 2 8.7 3 13.0 6 26.1 12 52.2 23
Mid-Atlantic
Delaware 57 3.0 681 36.1 455 24.1 557 29.5 139 7.4 1,889
District of Columbia 47 3.1 523 34.8 399 26.6 529 35.2 3 0.2 1,501 Maryland 419 3.1 4,469 33.4 3,467 25.9 3,862 28.9 1,156 8.6 13,373 New Jersey 486 3.3 6,073 40.7 4,317 28.9 3,964 26.5 95 0.6 14,935 Pennsylvania 973 4.5 8,295 38.7 5,357 25.0 6,804 31.7 15 0.1 21,444 Virginia 670 4.4 5,730 37.2 3,946 25.6 4,709 30.6 337 2.2 15,392 Virgin Islands 16 5.6 90 31.3 55 19.1 78 27.1 49 17.0 288 West Virginia 299 6.1 1,803 36.8 1,130 23.0 1,662 33.9 10 0.2 4,904
Southeast
Alabama 435 2.7 5,408 33.5 3,902 24.2 5,744 35.6 632 3.9 16,121
Florida 2,454 4.5 21,743 39.6 14,064 25.6 15,222 27.7 1,484 2.7 54,967 Georgia 1,424 4.1 12,157 35.1 8,645 24.9 11,794 34.0 657 1.9 34,677 Mississippi 397 4.3 2,878 31.1 2,038 22.0 3,277 35.4 671 7.2 9,261 North Carolina 929 3.5 8,222 31.0 5,891 22.2 8,057 30.4 3,421 12.9 26,520 South Carolina 679 4.9 4,769 34.3 3,272 23.6 4,909 35.3 264 1.9 13,893 Eastern Band Cherokee (NC) 0 0.0 13 18.6 8 11.4 22 31.4 27 38.6 70 Mississippi Choctaw (MS) 1 1.0 15 14.6 16 15.5 49 47.6 22 21.4 103
Midwest Illinois 1,272 4.1 11,361 36.5 8,406 27.0 9,677 31.1 387 1.2 31,103 Indiana 779 4.9 5,926 36.9 3,906 24.3 5,331 33.2 111 0.7 16,053 Michigan 918 3.7 8,405 34.1 5,483 22.2 7,202 29.2 2,675 10.8 24,683 Minnesota 436 3.6 4,611 37.8 3,349 27.4 3,746 30.7 69 0.6 12,211 Wisconsin 386 3.6 3,915 36.3 2,727 25.3 3,733 34.6 38 0.4 10,799

WIC Participant and Program Characteristics: 2014 Final Report
Page F-106
Table F.15b. (continued) Prepregnant Body Mass Index for Pregnant Women WIC Participants
by State Weight Categories as Defined in Revision 10 to the Nutritional Risk Criteria
Underweight Normal
Weight
Overweight
Obese Not
Reported
Total Number Region and State Number % Number % Number % Number % Number %
Southwest
Arkansas 469 4.4 3,841 36.2 2,524 23.8 3,691 34.8 91 0.9 10,616
Louisiana 654 4.5 5,310 36.6 3,399 23.4 5,042 34.8 93 0.6 14,498 New Mexico 300 4.1 2,767 38.3 1,935 26.8 2,054 28.4 173 2.4 7,229 Oklahoma 501 4.5 4,147 37.2 2,763 24.8 3,547 31.8 182 1.6 11,140 Texas 3,315 3.4 33,631 35.0 26,493 27.5 31,620 32.9 1,115 1.2 96,174 ACL (NM) 2 4.3 14 29.8 15 31.9 14 29.8 2 4.3 47 Chickasaw Nation (OK) 20 4.9 136 33.4 95 23.3 142 34.9 14 3.4 407 Choctaw Nation (OK) 9 2.8 118 36.3 85 26.2 106 32.6 7 2.2 325 Citizen Potawatomi (OK) 5 3.3 43 28.3 37 24.3 37 24.3 30 19.7 152 Eight Northern Pueblos (NM) 1 4.5 5 27.3 4 22.7 7 40.9 1 4.5 18 Five Sandoval Pueblos (NM) 0 0.0 4 19.0 3 14.3 14 66.7 0 0.0 21 ITC Oklahoma 3 3.9 19 24.7 27 35.1 24 31.2 4 5.2 77 Muscogee Creek Nation (OK) 12 4.5 88 32.8 66 24.6 94 35.1 8 3.0 268 Osage Nation (OK) 7 4.0 55 31.4 51 29.1 59 33.7 3 1.7 175 Otoe Missouria (OK) 2 4.2 14 29.2 7 14.6 25 52.1 0 0.0 48 Pueblo of Isleta (NM) 2 2.1 38 40.4 21 22.3 28 29.8 5 5.3 94 Pueblo of San Felipe (NM) 2 10.5 3 15.8 4 21.1 10 52.6 0 0.0 19 Pueblo of Zuni (NM) 1 1.5 17 25.0 22 32.4 26 38.2 2 2.9 68 Santo Domingo (NM) 0 0.0 4 36.4 2 18.2 5 45.5 0 0.0 11 WCD (OK) 16 4.0 128 31.6 96 23.7 158 39.0 7 1.7 405
Mountain Plains
Colorado 425 4.5 3,829 40.3 2,410 25.4 2,709 28.5 117 1.2 9,490
Iowa 214 3.1 2,302 33.5 1,635 23.8 2,495 36.3 227 3.3 6,873 Kansas 306 4.3 2,666 37.2 1,833 25.6 2,320 32.4 36 0.5 7,161 Missouri 744 4.8 5,839 37.4 3,620 23.2 5,141 32.9 271 1.7 15,615 Montana 91 4.6 769 38.8 485 24.4 617 31.1 22 1.1 1,984 Nebraska 95 3.3 1,011 35.0 766 26.6 979 33.9 34 1.2 2,885 North Dakota 54 4.2 476 36.7 305 23.5 445 34.3 18 1.4 1,298 South Dakota 69 3.8 680 37.9 438 24.4 540 30.1 66 3.7 1,793 Utah 262 4.0 2,673 40.4 1,636 24.8 1,878 28.4 160 2.4 6,609 Wyoming 61 5.6 420 38.3 255 23.2 326 29.7 36 3.3 1,098 Cheyenne River Sioux (SD) 1 1.5 23 33.8 21 30.9 21 30.9 2 2.9 68 Eastern Shoshone (WY) 0 0.0 1 6.7 4 26.7 10 66.7 0 0.0 15 Northern Arapahoe (WY) 0 0.0 13 34.2 6 15.8 12 31.6 7 18.4 38 Omaha Nation (NE) 0 0.0 3 10.0 7 23.3 19 63.3 1 3.3 30 Rosebud Sioux (SD) 7 6.2 48 42.5 25 22.1 32 28.3 1 0.9 113

WIC Participant and Program Characteristics: 2014 Final Report
Page F-107
Table F.15b. (continued) Prepregnant Body Mass Index for Pregnant Women WIC Participants
by State Weight Categories as Defined in Revision 10 to the Nutritional Risk Criteria
Underweight Normal
Weight
Overweight
Obese Not
Reported
Total Number Region and State Number % Number % Number % Number % Number %
Mountain Plains (continued) Santee Sioux (NE) 0 0.0 4 23.5 5 29.4 7 41.2 1 5.9 17 Standing Rock Sioux (ND) 2 2.1 31 32.6 24 25.3 38 40.0 0 0.0 95 Three Affiliated (ND) 2 5.7 11 31.4 6 17.1 13 37.1 3 8.6 35 Ute Mountain Ute (CO) 0 0.0 2 9.1 5 22.7 14 63.6 1 4.5 22 Winnebago (NE) 0 0.0 7 23.3 7 23.3 7 23.3 9 30.0 30
Western
Alaska 47 2.2 715 33.0 468 21.6 527 24.3 411 19.0 2,168
American Samoa 3 0.7 31 7.3 53 12.4 105 24.6 235 55.0 427 Arizona 738 4.3 6,645 38.5 4,592 26.6 5,180 30.0 119 0.7 17,274 Guam 30 4.7 231 35.9 169 26.2 211 32.8 3 0.5 644 Hawaii 154 4.5 1,471 42.9 816 23.8 934 27.3 52 1.5 3,427 Idaho 178 4.0 1,749 39.5 1,126 25.5 1,366 30.9 5 0.1 4,424 Nevada 250 3.9 2,503 38.7 1,683 26.0 1,865 28.8 165 2.6 6,466 Northern Mariana Islands 12 3.5 185 54.4 78 22.9 64 18.8 1 0.3 340 Washington 651 2.7 7,888 33.3 5,753 24.3 6,945 29.3 2,438 10.3 23,675 ITC Arizona (AZ) 17 1.7 266 27.2 244 24.9 446 45.6 6 0.6 979 ITC Nevada (NV) 4 2.9 63 46.3 23 16.9 46 33.8 0 0.0 136 Navajo Nation (AZ) 36 2.8 400 30.8 368 28.4 485 37.4 8 0.6 1,297
Notes
Underweight = BMI < 18.5
Normal Weight = BMI 18.5–24.9
Overweight = BMI 25.0–29.9
Obese = BMI >= 30.0
BMI equals kilograms/meters2.
"Not reported" indicates number and percent of pregnant women for whom no data were reported on pregnancy weight and height.
Table includes those State agencies who provided valid data for at least 5% of the target population for this tabulation. Not all State agencies listed in table F.1 reported valid data for all SDS variables.

WIC Participant and Program Characteristics: 2014 Final Report
Page F-108
Table F.16. Mean Weight Gain During Pregnancy for Mothers Who Received WIC by Race and State
Region and State
American Indian or
Alaska Native Only Asian Only
Black or African
American Only
Native Hawaiian or Pacific Islander
Only White Only
Two or More Races
Race Not Reportedb
Total WIC Mothers
Northeast
Connecticut
Women in category Number 342 219 1,601 127 4,558 185 1 7,033 Percent reporting weight gain % 95.3 96.3 94.8 95.3 94.3 93.5 N/A 94.5 Mean Pounds 26.8 27.6 29.0 31.1 29.9 29.1 N/A 29.5
Maine
Women in category Number 32 51 248 a 2,961 82 16 3,390
Percent reporting weight gain % 96.9 100.0 91.9 a 96.2 100.0 25.0 95.7 Mean Pounds 34.2 28.1 24.3 a 32.1 34.6 29.5 31.5
Massachusetts
Women in category Number 113 1,095 4,254 75 12,121 220 2 17,880
Percent reporting weight gain % 99.1 99.2 98.3 100.0 98.8 100.0 100.0 98.8 Mean Pounds 27.7 28.4 28.2 31.8 30.8 32.9 34.5 30.1
New Hampshire
Women in category Number 30 86 91 19 2,339 21 0 2,586
Percent reporting weight gain % 86.7 98.8 95.6 100.0 97.1 95.2 N/A 97.0 Mean Pounds 27.2 29.0 28.3 29.6 32.6 36.0 N/A 32.3
Rhode Island
Women in category Number 25 133 612 47 2,425 178 11 3,431
Percent reporting weight gain % 100.0 99.2 97.5 95.7 98.4 98.3 0.0 98.0 Mean Pounds 23.8 28.9 30.1 26.9 30.7 31.3 N/A 30.5
Vermont
Women in category Number 9 62 63 a 1,704 33 64 1,935
Percent reporting weight gain % 100.0 85.5 79.4 a 86.8 78.8 90.6 86.6 Mean Pounds 42.7 28.5 25.5 a 31.9 35.9 35.7 31.9
Pleasant Point (ME)
Women in category Number a 0 0 0 0 0 3 3
Percent reporting weight gain % a N/A N/A N/A N/A N/A 66.7 66.7 Mean Pounds a N/A N/A N/A N/A N/A 51.5 51.5

WIC Participant and Program Characteristics: 2014 Final Report
Page F-109
Table F.16. (continued) Mean Weight Gain During Pregnancy for Mothers Who Received WIC by Race and State
Region and State
American Indian or
Alaska Native Only Asian Only
Black or African
American Only
Native Hawaiian or Pacific Islander
Only White Only
Two or More Races
Race Not Reportedb
Total WIC Mothers
Mid-Atlantic
Delaware
Women in category Number a 59 1,022 a 1,674 30 9 2,794 Percent reporting weight gain % a 69.5 71.8 a 73.7 80.0 44.4 72.9 Mean Pounds a 29.2 31.6 a 31.1 35.2 23.8 31.3
District of Columbia
Women in category Number 11 29 1,959 6 680 9 1 2,695
Percent reporting weight gain % 100.0 100.0 98.7 100.0 96.3 100.0 100.0 98.1 Mean Pounds 23.5 26.3 29.6 22.5 24.2 25.4 43.0 28.2
Maryland
Women in category Number 909 859 9,781 171 9,730 681 45 22,176
Percent reporting weight gain % 78.4 73.8 76.1 83.6 79.1 79.6 4.4 77.5 Mean Pounds 27.1 29.3 31.2 28.0 30.6 31.5 19.0 30.7
New Jersey
Women in category Number 524 805 5,657 323 14,608 351 44 22,312
Percent reporting weight gain % 96.8 97.9 94.7 98.1 97.4 97.2 50.0 96.6 Mean Pounds 26.3 28.8 30.1 28.7 29.7 31.5 31.2 29.7
Pennsylvania
Women in category Number 484 1,032 9,369 1,064 22,982 864 0 35,795
Percent reporting weight gain % 96.3 97.5 96.1 97.4 97.7 96.3 N/A 97.2 Mean Pounds 28.3 28.0 29.2 28.4 30.9 29.8 N/A 30.3
Virginia
Women in category Number 296 954 8,462 69 15,618 574 202 26,175
Percent reporting weight gain % 74.3 79.0 72.9 76.7 75.4 79.1 6.0 74.2 Mean Pounds 15.0 15.4 18.2 18.0 16.7 17.9 19.0 17.2
Virgin Islands
Women in category Number a a 806 a 30 a 14 850
Percent reporting weight gain % a a 30.5 a 43.3 a 35.7 31.1 Mean Pounds a a 27.6 a 31.4 a 26.6 27.8
West Virginia
Women in category Number 17 37 315 8 5,678 164 0 6,219
Percent reporting weight gain % 94.1 100.0 95.9 100.0 95.6 98.2 N/A 95.7 Mean Pounds 23.7 27.4 31.3 28.8 31.3 32.3 N/A 31.3
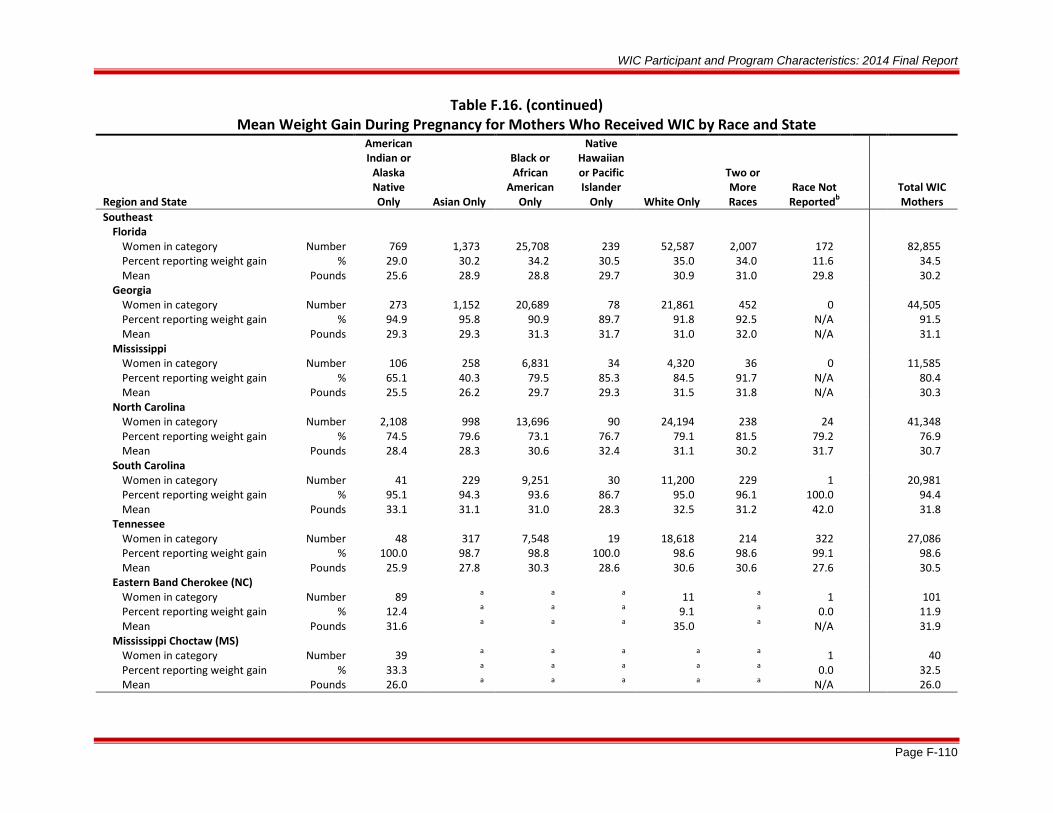
WIC Participant and Program Characteristics: 2014 Final Report
Page F-110
Table F.16. (continued) Mean Weight Gain During Pregnancy for Mothers Who Received WIC by Race and State
Region and State
American Indian or
Alaska Native Only Asian Only
Black or African
American Only
Native Hawaiian or Pacific Islander
Only White Only
Two or More Races
Race Not Reportedb
Total WIC Mothers
Southeast
Florida
Women in category Number 769 1,373 25,708 239 52,587 2,007 172 82,855 Percent reporting weight gain % 29.0 30.2 34.2 30.5 35.0 34.0 11.6 34.5 Mean Pounds 25.6 28.9 28.8 29.7 30.9 31.0 29.8 30.2
Georgia
Women in category Number 273 1,152 20,689 78 21,861 452 0 44,505
Percent reporting weight gain % 94.9 95.8 90.9 89.7 91.8 92.5 N/A 91.5 Mean Pounds 29.3 29.3 31.3 31.7 31.0 32.0 N/A 31.1
Mississippi
Women in category Number 106 258 6,831 34 4,320 36 0 11,585
Percent reporting weight gain % 65.1 40.3 79.5 85.3 84.5 91.7 N/A 80.4 Mean Pounds 25.5 26.2 29.7 29.3 31.5 31.8 N/A 30.3
North Carolina
Women in category Number 2,108 998 13,696 90 24,194 238 24 41,348
Percent reporting weight gain % 74.5 79.6 73.1 76.7 79.1 81.5 79.2 76.9 Mean Pounds 28.4 28.3 30.6 32.4 31.1 30.2 31.7 30.7
South Carolina
Women in category Number 41 229 9,251 30 11,200 229 1 20,981
Percent reporting weight gain % 95.1 94.3 93.6 86.7 95.0 96.1 100.0 94.4 Mean Pounds 33.1 31.1 31.0 28.3 32.5 31.2 42.0 31.8
Tennessee
Women in category Number 48 317 7,548 19 18,618 214 322 27,086
Percent reporting weight gain % 100.0 98.7 98.8 100.0 98.6 98.6 99.1 98.6 Mean Pounds 25.9 27.8 30.3 28.6 30.6 30.6 27.6 30.5
Eastern Band Cherokee (NC)
Women in category Number 89 a a a 11 a 1 101
Percent reporting weight gain % 12.4 a a a 9.1 a 0.0 11.9 Mean Pounds 31.6 a a a 35.0 a N/A 31.9
Mississippi Choctaw (MS)
Women in category Number 39 a a a a a 1 40
Percent reporting weight gain % 33.3 a a a a a 0.0 32.5 Mean Pounds 26.0 a a a a a N/A 26.0

WIC Participant and Program Characteristics: 2014 Final Report
Page F-111
Table F.16. (continued) Mean Weight Gain During Pregnancy for Mothers Who Received WIC by Race and State
Region and State
American Indian or
Alaska Native Only Asian Only
Black or African
American Only
Native Hawaiian or Pacific Islander
Only White Only
Two or More Races
Race Not Reportedb
Total WIC Mothers
Midwest
Illinois
Women in category Number 116 1,505 10,410 138 29,086 311 101 41,667 Percent reporting weight gain % 92.2 93.5 90.2 86.2 92.0 92.3 89.1 91.6 Mean Pounds 27.9 29.2 31.1 26.6 30.1 31.3 25.4 30.3
Indiana
Women in category Number 103 715 4,607 41 19,209 534 136 25,345
Percent reporting weight gain % 99.0 99.3 97.9 100.0 98.4 97.2 2.9 97.8 Mean Pounds 29.6 27.2 31.1 26.3 31.5 32.8 25.8 31.3
Michigan
Women in category Number 205 812 10,439 29 23,611 1,426 120 36,642
Percent reporting weight gain % 84.9 70.4 83.7 89.7 83.7 84.6 0.0 83.2 Mean Pounds 30.4 27.5 31.5 30.6 32.1 32.5 N/A 31.8
Minnesota
Women in category Number 925 1,823 4,270 56 10,648 883 145 18,750
Percent reporting weight gain % 97.8 98.5 97.1 98.2 97.1 96.9 37.9 96.8 Mean Pounds 29.3 26.0 27.3 31.1 31.1 30.3 31.1 29.6
Wisconsin
Women in category Number 463 893 3,359 48 11,028 532 0 16,323
Percent reporting weight gain % 86.0 74.6 85.9 83.3 79.4 81.2 N/A 80.7 Mean Pounds 27.3 24.9 28.9 26.5 30.2 29.9 N/A 29.5
Southwest
Arkansas
Women in category Number 69 139 3,367 144 9,738 112 81 13,650
Percent reporting weight gain % 95.7 99.3 96.7 98.6 96.6 95.5 11.1 96.1 Mean Pounds 29.2 28.4 31.0 26.9 32.0 34.2 21.8 31.7
Louisiana
Women in category Number 183 284 11,467 131 9,545 209 0 21,819
Percent reporting weight gain % 18.0 31.7 13.1 35.1 20.5 23.0 N/A 16.9 Mean Pounds 21.6 17.3 19.5 16.1 18.2 18.4 N/A 18.7

WIC Participant and Program Characteristics: 2014 Final Report
Page F-112
Table F.16. (continued) Mean Weight Gain During Pregnancy for Mothers Who Received WIC by Race and State
Region and State
American Indian or
Alaska Native Only Asian Only
Black or African
American Only
Native Hawaiian or Pacific Islander
Only White Only
Two or More Races
Race Not Reportedb
Total WIC Mothers
Southwest (continued) Oklahoma
Women in category Number 702 326 1,689 107 10,440 673 0 13,937 Percent reporting weight gain % 95.9 92.0 95.9 93.5 95.3 96.1 N/A 95.4 Mean Pounds 32.0 27.9 31.7 27.6 31.2 32.4 N/A 31.3
Texas
Women in category Number 2,865 3,516 24,132 292 133,655 2,008 32 166,500
Percent reporting weight gain % 95.1 94.6 93.9 93.5 94.5 93.1 96.9 94.4 Mean Pounds 28.6 28.8 32.1 30.7 29.2 32.3 26.9 29.7
ACL (NM)
Women in category Number 81 0 0 0 a 0 4 85
Percent reporting weight gain % 92.6 N/A N/A N/A a N/A 75.0 91.8 Mean Pounds 26.1 N/A N/A N/A a N/A 29.7 26.2
Chickasaw Nation (OK)
Women in category Number 171 a 14 a 315 126 20 646
Percent reporting weight gain % 93.6 a 100.0 a 93.3 97.6 25.0 92.3 Mean Pounds 35.8 a 28.2 a 32.2 35.9 20.4 33.8
Choctaw Nation (OK)
Women in category Number 67 0 9 a 227 171 7 481
Percent reporting weight gain % 95.5 N/A 88.9 a 93.0 97.7 14.3 93.8 Mean Pounds 32.3 N/A 28.1 a 31.7 34.9 15.0 32.9
Citizen Potawatomi (OK)
Women in category Number 30 a 16 0 69 22 40 177
Percent reporting weight gain % 86.7 a 100.0 N/A 95.7 81.8 7.5 72.9 Mean Pounds 43.1 a 30.5 N/A 33.1 38.3 29.0 35.4
Eight Northern Pueblos (NM)
Women in category Number 21 a a a 8 a a 30
Percent reporting weight gain % 100.0 a a a 100.0 a a 96.4 Mean Pounds 26.0 a a a 32.2 a a 27.6
Five Sandoval Pueblos (NM)
Women in category Number 28 0 0 0 a 0 10 38
Percent reporting weight gain % 96.4 N/A N/A N/A a N/A 10.0 73.7 Mean Pounds 25.2 N/A N/A N/A a N/A 15.0 24.9

WIC Participant and Program Characteristics: 2014 Final Report
Page F-113
Table F.16. (continued) Mean Weight Gain During Pregnancy for Mothers Who Received WIC by Race and State
Region and State
American Indian or
Alaska Native Only Asian Only
Black or African
American Only
Native Hawaiian or Pacific Islander
Only White Only
Two or More Races
Race Not Reportedb
Total WIC Mothers
Southwest (continued) ITC Oklahoma
Women in category Number 26 0 a a 77 27 8 138 Percent reporting weight gain % 100.0 N/A a a 98.7 96.3 37.5 94.9 Mean Pounds 38.2 N/A a a 29.0 27.3 20.7 30.3
Muscogee Creek Nation (OK)
Women in category Number 135 a 19 a 150 78 10 392
Percent reporting weight gain % 93.3 a 94.7 a 98.7 97.4 20.0 94.4 Mean Pounds 33.0 a 29.4 a 32.5 34.5 25.0 32.9
Osage Nation (OK)
Women in category Number 43 39 48 a 227 20 17 394
Percent reporting weight gain % 95.3 89.7 91.7 a 87.2 95.0 5.9 85.8 Mean Pounds 29.1 23.0 28.0 a 29.3 30.9 70.0 28.7
Otoe Missouria (OK)
Women in category Number 29 0 a a 22 a 6 57
Percent reporting weight gain % 96.6 N/A a a 95.5 a 66.7 93.0 Mean Pounds 28.8 N/A a a 29.9 a 31.5 29.4
Pueblo of San Felipe (NM)
Women in category Number 46 a a a a a 1 47
Percent reporting weight gain % 95.7 a a a a a 100.0 95.7 Mean Pounds 28.0 a a a a a 50.0 28.5
Pueblo of Zuni (NM)
Women in category Number 105 0 0 0 0 a 2 107
Percent reporting weight gain % 95.2 N/A N/A N/A N/A a 100.0 95.3 Mean Pounds 24.9 N/A N/A N/A N/A a 25.0 24.9
Santo Domingo (NM)
Women in category Number 25 0 0 0 0 0 0 25
Percent reporting weight gain % 92.0 N/A N/A N/A N/A N/A N/A 92.0 Mean Pounds 26.2 N/A N/A N/A N/A N/A N/A 26.2
WCD (OK)
Women in category Number 206 a 32 56 200 24 6 524
Percent reporting weight gain % 98.1 a 100.0 98.2 96.0 95.8 16.7 96.4 Mean Pounds 33.2 a 29.8 28.5 31.8 34.0 30.0 32.0

WIC Participant and Program Characteristics: 2014 Final Report
Page F-114
Table F.16. (continued) Mean Weight Gain During Pregnancy for Mothers Who Received WIC by Race and State
Region and State
American Indian or
Alaska Native Only Asian Only
Black or African
American Only
Native Hawaiian or Pacific Islander
Only White Only
Two or More Races
Race Not Reportedb
Total WIC Mothers
Mountain Plains
Colorado
Women in category Number 3,338 438 1,207 131 9,379 575 2 15,070 Percent reporting weight gain % 96.6 97.7 97.3 97.7 96.0 95.7 100.0 96.3 Mean Pounds 28.3 27.6 30.0 29.6 31.2 31.3 37.5 30.4
Iowa
Women in category Number 71 330 1,005 49 8,619 222 14 10,310
Percent reporting weight gain % 93.0 98.2 92.3 93.9 95.0 94.1 0.0 94.7 Mean Pounds 28.4 29.0 28.9 27.5 30.9 33.3 N/A 30.6
Kansas
Women in category Number 407 308 1,188 33 8,640 258 0 10,834
Percent reporting weight gain % 98.8 97.4 98.1 100.0 97.6 98.4 N/A 97.7 Mean Pounds 28.8 27.3 31.1 30.6 30.4 34.1 N/A 30.4
Missouri
Women in category Number 43 363 5,370 137 16,239 351 0 22,503
Percent reporting weight gain % 90.7 97.5 96.6 93.4 96.4 97.2 N/A 96.4 Mean Pounds 36.0 28.5 31.7 30.7 31.9 34.6 N/A 31.8
Montana
Women in category Number 537 19 22 7 2,137 157 6 2,885
Percent reporting weight gain % 98.5 100.0 100.0 100.0 97.1 98.7 0.0 97.3 Mean Pounds 30.8 31.4 42.0 30.0 32.4 30.4 N/A 32.0
Nebraska
Women in category Number 1,120 231 877 43 4,204 144 3 6,622
Percent reporting weight gain % 94.8 97.0 93.4 97.7 95.8 96.5 33.3 95.3 Mean Pounds 25.3 27.0 29.3 26.5 31.5 32.2 35.0 30.0
North Dakota
Women in category Number 324 74 218 6 1,231 54 4 1,911
Percent reporting weight gain % 95.4 98.6 95.9 100.0 95.0 94.4 50.0 95.2 Mean Pounds 30.1 29.1 26.0 30.8 32.7 37.2 21.0 31.5
South Dakota
Women in category Number 769 95 142 6 1,821 81 28 2,942
Percent reporting weight gain % 83.6 82.1 88.0 100.0 87.8 90.1 10.7 85.9 Mean Pounds 30.2 26.7 29.6 33.2 31.5 33.2 29.7 31.0

WIC Participant and Program Characteristics: 2014 Final Report
Page F-115
Table F.16. (continued) Mean Weight Gain During Pregnancy for Mothers Who Received WIC by Race and State
Region and State
American Indian or
Alaska Native Only Asian Only
Black or African
American Only
Native Hawaiian or Pacific Islander
Only White Only
Two or More Races
Race Not Reportedb
Total WIC Mothers
Mountain Plains (continued) Utah
Women in category Number 151 239 219 233 9,991 118 1 10,952 Percent reporting weight gain % 99.3 99.6 95.0 94.4 96.2 97.5 100.0 96.3 Mean Pounds 30.0 28.6 29.0 33.6 30.0 31.6 45.0 30.0
Wyoming
Women in category Number 46 26 35 a 1,501 21 5 1,634
Percent reporting weight gain % 97.8 100.0 94.3 a 95.7 90.5 100.0 95.7 Mean Pounds 30.0 27.2 30.2 a 32.0 29.7 46.2 31.8
Cheyenne River Sioux (SD)
Women in category Number 44 0 0 0 0 26 0 70
Percent reporting weight gain % 18.2 N/A N/A N/A N/A 42.3 N/A 27.1 Mean Pounds 28.4 N/A N/A N/A N/A 29.6 N/A 29.1
Eastern Shoshone (WY)
Women in category Number 24 0 0 0 a a 2 26
Percent reporting weight gain % 95.8 N/A N/A N/A a a 100.0 96.2 Mean Pounds 31.2 N/A N/A N/A a a 16.5 30.0
Northern Arapahoe (WY)
Women in category Number 59 0 0 0 a a 4 63
Percent reporting weight gain % 33.9 N/A N/A N/A a a 25.0 33.3 Mean Pounds 28.8 N/A N/A N/A a a 52.0 29.9
Omaha Nation (NE)
Women in category Number 12 0 0 0 0 0 0 12
Percent reporting weight gain % 83.3 N/A N/A N/A N/A N/A N/A 83.3 Mean Pounds 27.8 N/A N/A N/A N/A N/A N/A 27.8
Rosebud Sioux (SD)
Women in category Number 154 0 0 0 a a 5 159
Percent reporting weight gain % 67.5 N/A N/A N/A a a 40.0 66.7 Mean Pounds 24.5 N/A N/A N/A a a 6.0 24.1
Santee Sioux (NE)
Women in category Number 9 a a a a a 1 10
Percent reporting weight gain % 77.8 a a a a a 100.0 80.0 Mean Pounds 21.3 a a a a a 24.0 21.6

WIC Participant and Program Characteristics: 2014 Final Report
Page F-116
Table F.16. (continued) Mean Weight Gain During Pregnancy for Mothers Who Received WIC by Race and State
Region and State
American Indian or
Alaska Native Only Asian Only
Black or African
American Only
Native Hawaiian or Pacific Islander
Only White Only
Two or More Races
Race Not Reportedb
Total WIC Mothers
Mountain Plains (continued) Standing Rock Sioux (ND)
Women in category Number 64 0 0 0 0 a 2 66 Percent reporting weight gain % 82.8 N/A N/A N/A N/A a 100.0 83.3 Mean Pounds 27.7 N/A N/A N/A N/A a 39.5 28.2
Three Affiliated (ND)
Women in category Number 25 0 0 0 a a 8 33
Percent reporting weight gain % 16.0 N/A N/A N/A a a 25.0 18.2 Mean Pounds 38.0 N/A N/A N/A a a 25.5 33.8
Ute Mountain Ute (CO)
Women in category Number 17 0 0 0 0 0 0 17
Percent reporting weight gain % 11.8 N/A N/A N/A N/A N/A N/A 11.8 Mean Pounds -1.3 N/A N/A N/A N/A N/A N/A -1.3
Western
Alaska
Women in category Number 1,008 234 154 128 1,488 228 25 3,265
Percent reporting weight gain % 81.5 96.6 94.8 91.4 90.4 89.9 16.0 87.7 Mean Pounds 25.5 28.0 32.7 33.7 30.2 30.9 25.5 29.0
Arizona
Women in category Number 676 459 2,049 161 24,871 573 0 28,789
Percent reporting weight gain % 64.6 52.5 57.5 49.7 58.0 59.5 N/A 58.0 Mean Pounds 29.3 29.2 30.4 33.3 30.3 35.0 N/A 30.4
Guam
Women in category Number a 198 a 1,040 28 117 6 1,389
Percent reporting weight gain % a 47.5 a 48.8 60.7 47.0 83.3 48.9 Mean Pounds a 28.4 a 30.2 24.3 24.4 38.4 29.4
Hawaii
Women in category Number 11 1,299 125 1,262 1,237 2,121 16 6,071
Percent reporting weight gain % 100.0 97.2 93.6 96.2 96.3 97.6 50.0 96.7 Mean Pounds 35.8 29.8 32.3 32.0 32.2 32.8 37.4 31.9

WIC Participant and Program Characteristics: 2014 Final Report
Page F-117
Table F.16. (continued) Mean Weight Gain During Pregnancy for Mothers Who Received WIC by Race and State
Region and State
American Indian or
Alaska Native Only Asian Only
Black or African
American Only
Native Hawaiian or Pacific Islander
Only White Only
Two or More Races
Race Not Reportedb
Total WIC Mothers
Western (continued) Idaho
Women in category Number 276 106 85 37 5,812 126 0 6,442 Percent reporting weight gain % 90.9 94.3 96.5 89.2 93.2 91.3 N/A 93.1 Mean Pounds 27.2 28.2 28.7 30.5 29.3 28.3 N/A 29.2
Northern Mariana Islands
Women in category Number a 182 a 301 a a 9 492
Percent reporting weight gain % a 7.1 a 8.3 a a 0.0 7.7 Mean Pounds a 25.9 a 32.6 a a N/A 30.3
ITC Arizona (AZ)
Women in category Number 1,234 a 12 a 225 71 4 1,546
Percent reporting weight gain % 98.5 a 91.7 a 97.3 98.6 100.0 98.3 Mean Pounds 28.1 a 34.4 a 30.5 29.4 39.0 28.5
Navajo Nation (AZ)
Women in category Number 1,562 a 0 a 25 15 5 1,607
Percent reporting weight gain % 28.7 a N/A a 28.0 6.7 0.0 28.4 Mean Pounds 28.0 a N/A a 33.4 37.0 N/A 28.1
Notes
Table includes those State agencies who provided valid data for at least 5% of the target population for this tabulation. Not all State agencies listed in table F.1 reported valid data for all SDS variables.
N/A indicates either not applicable or not available.
The group labeled WIC Mothers is comprised of all women certified as breastfeeding or postpartum. a Data not reported due to small cell size. b Includes categories with cell sizes too small to be reported separately.
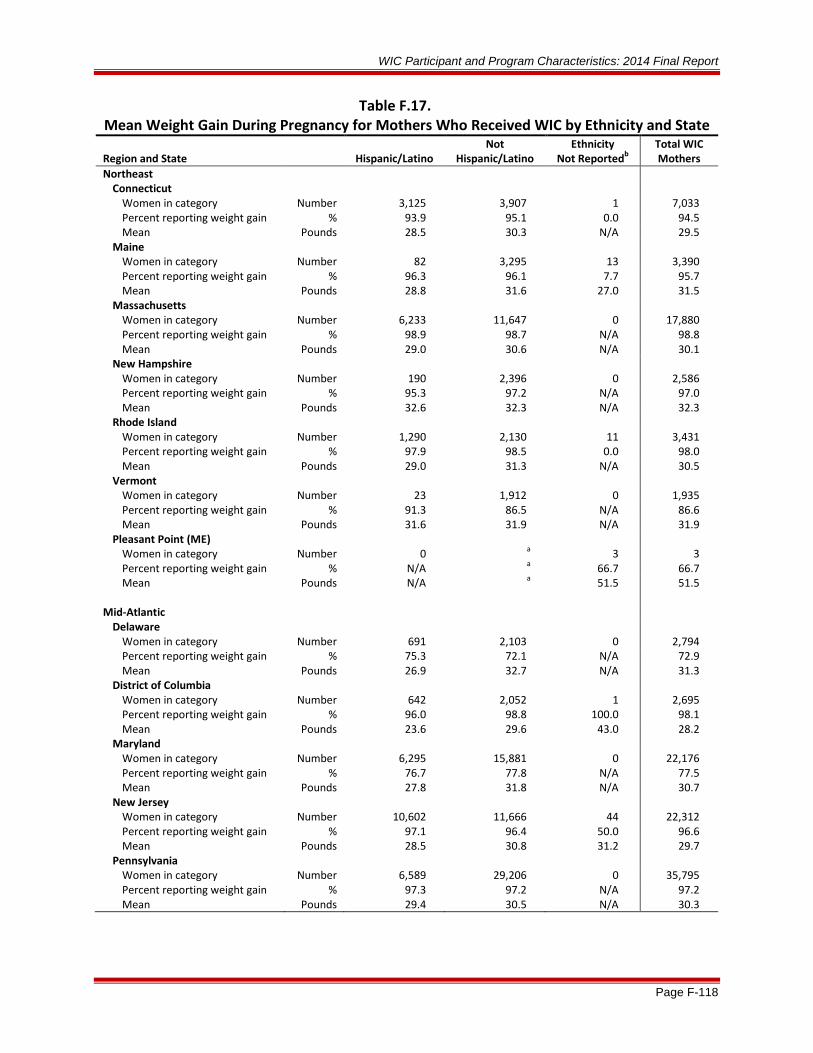
WIC Participant and Program Characteristics: 2014 Final Report
Page F-118
Table F.17. Mean Weight Gain During Pregnancy for Mothers Who Received WIC by Ethnicity and State
Region and State Hispanic/Latino Not
Hispanic/Latino Ethnicity
Not Reportedb Total WIC Mothers
Northeast
Connecticut
Women in category Number 3,125 3,907 1 7,033 Percent reporting weight gain % 93.9 95.1 0.0 94.5 Mean Pounds 28.5 30.3 N/A 29.5
Maine Women in category Number 82 3,295 13 3,390
Percent reporting weight gain % 96.3 96.1 7.7 95.7 Mean Pounds 28.8 31.6 27.0 31.5
Massachusetts Women in category Number 6,233 11,647 0 17,880
Percent reporting weight gain % 98.9 98.7 N/A 98.8 Mean Pounds 29.0 30.6 N/A 30.1
New Hampshire Women in category Number 190 2,396 0 2,586
Percent reporting weight gain % 95.3 97.2 N/A 97.0 Mean Pounds 32.6 32.3 N/A 32.3
Rhode Island Women in category Number 1,290 2,130 11 3,431
Percent reporting weight gain % 97.9 98.5 0.0 98.0 Mean Pounds 29.0 31.3 N/A 30.5
Vermont Women in category Number 23 1,912 0 1,935
Percent reporting weight gain % 91.3 86.5 N/A 86.6 Mean Pounds 31.6 31.9 N/A 31.9
Pleasant Point (ME) Women in category Number 0 a 3 3
Percent reporting weight gain % N/A a 66.7 66.7 Mean Pounds N/A a 51.5 51.5
Mid-Atlantic Delaware Women in category Number 691 2,103 0 2,794
Percent reporting weight gain % 75.3 72.1 N/A 72.9 Mean Pounds 26.9 32.7 N/A 31.3
District of Columbia Women in category Number 642 2,052 1 2,695
Percent reporting weight gain % 96.0 98.8 100.0 98.1 Mean Pounds 23.6 29.6 43.0 28.2
Maryland Women in category Number 6,295 15,881 0 22,176
Percent reporting weight gain % 76.7 77.8 N/A 77.5 Mean Pounds 27.8 31.8 N/A 30.7
New Jersey Women in category Number 10,602 11,666 44 22,312
Percent reporting weight gain % 97.1 96.4 50.0 96.6 Mean Pounds 28.5 30.8 31.2 29.7
Pennsylvania Women in category Number 6,589 29,206 0 35,795
Percent reporting weight gain % 97.3 97.2 N/A 97.2 Mean Pounds 29.4 30.5 N/A 30.3

WIC Participant and Program Characteristics: 2014 Final Report
Page F-119
Table F.17. (continued) Mean Weight Gain During Pregnancy for Mothers Who Received WIC by Ethnicity and State
Region and State Hispanic/Latino Not
Hispanic/Latino Ethnicity
Not Reportedb Total WIC Mothers
Mid-Atlantic (continued) Virginia
Women in category Number 5,883 20,292 0 26,175 Percent reporting weight gain % 74.5 74.1 N/A 74.2 Mean Pounds 15.2 17.7 N/A 17.2
Virgin Islands Women in category Number 169 681 0 850
Percent reporting weight gain % 36.1 29.8 N/A 31.1 Mean Pounds 28.4 27.6 N/A 27.8
West Virginia Women in category Number 149 6,070 0 6,219
Percent reporting weight gain % 98.0 95.7 N/A 95.7 Mean Pounds 28.5 31.4 N/A 31.3
Southeast Florida Women in category Number 30,796 52,059 0 82,855
Percent reporting weight gain % 39.3 31.7 N/A 34.5 Mean Pounds 29.7 30.5 N/A 30.2
Georgia Women in category Number 8,128 36,368 9 44,505
Percent reporting weight gain % 93.5 91.0 55.6 91.5 Mean Pounds 27.3 31.9 25.0 31.1
Mississippi Women in category Number 526 11,059 0 11,585
Percent reporting weight gain % 89.4 80.0 N/A 80.4 Mean Pounds 26.3 30.6 N/A 30.3
North Carolina Women in category Number 8,698 32,650 0 41,348
Percent reporting weight gain % 73.9 77.7 N/A 76.9 Mean Pounds 26.7 31.7 N/A 30.7
South Carolina Women in category Number 2,433 18,548 0 20,981
Percent reporting weight gain % 94.7 94.4 N/A 94.4 Mean Pounds 27.4 32.4 N/A 31.8
Tennessee Women in category Number 3,545 23,541 0 27,086
Percent reporting weight gain % 99.2 98.6 N/A 98.6 Mean Pounds 26.0 31.1 N/A 30.5
Eastern Band Cherokee (NC) Women in category Number a 99 2 101
Percent reporting weight gain % a 12.1 0.0 11.9 Mean Pounds a 31.9 N/A 31.9
Mississippi Choctaw (MS) Women in category Number 0 40 0 40
Percent reporting weight gain % N/A 32.5 N/A 32.5 Mean Pounds N/A 26.0 N/A 26.0

WIC Participant and Program Characteristics: 2014 Final Report
Page F-120
Table F.17. (continued) Mean Weight Gain During Pregnancy for Mothers Who Received WIC by Ethnicity and State
Region and State Hispanic/Latino Not
Hispanic/Latino Ethnicity
Not Reportedb Total WIC Mothers
Midwest Illinois Women in category Number 15,323 26,243 101 41,667
Percent reporting weight gain % 91.8 91.5 89.1 91.6 Mean Pounds 27.6 31.9 25.4 30.3
Indiana Women in category Number 3,758 21,451 136 25,345
Percent reporting weight gain % 98.6 98.2 2.9 97.8 Mean Pounds 27.8 31.9 25.8 31.3
Michigan Women in category Number 3,558 33,084 0 36,642
Percent reporting weight gain % 78.6 83.7 N/A 83.2 Mean Pounds 28.2 32.2 N/A 31.8
Minnesota Women in category Number 2,694 15,911 145 18,750
Percent reporting weight gain % 97.6 97.3 37.9 96.8 Mean Pounds 27.1 30.0 31.1 29.6
Wisconsin Women in category Number 3,305 13,018 0 16,323
Percent reporting weight gain % 84.4 79.8 N/A 80.7 Mean Pounds 27.0 30.2 N/A 29.5
Southwest Arkansas Women in category Number 1,906 11,663 81 13,650
Percent reporting weight gain % 97.1 96.6 11.1 96.1 Mean Pounds 28.2 32.3 21.8 31.7
Louisiana Women in category Number 1,771 20,048 0 21,819
Percent reporting weight gain % 29.7 15.7 N/A 16.9 Mean Pounds 17.0 19.0 N/A 18.7
Oklahoma Women in category Number 3,371 10,566 0 13,937
Percent reporting weight gain % 95.1 95.5 N/A 95.4 Mean Pounds 28.1 32.3 N/A 31.3
Texas Women in category Number 112,541 53,927 32 166,500
Percent reporting weight gain % 94.6 94.1 96.9 94.4 Mean Pounds 28.2 32.6 26.9 29.7
ACL (NM) Women in category Number a 81 4 85
Percent reporting weight gain % a 92.6 75.0 91.8 Mean Pounds a 26.1 29.7 26.2
Chickasaw Nation (OK) Women in category Number 51 580 15 646
Percent reporting weight gain % 98.0 94.1 0.0 92.3 Mean Pounds 29.5 34.1 N/A 33.8
Choctaw Nation (OK) Women in category Number 16 459 6 481
Percent reporting weight gain % 100.0 94.8 0.0 93.8 Mean Pounds 31.1 32.9 N/A 32.9

WIC Participant and Program Characteristics: 2014 Final Report
Page F-121
Table F.17. (continued) Mean Weight Gain During Pregnancy for Mothers Who Received WIC by Ethnicity and State
Region and State Hispanic/Latino Not
Hispanic/Latino Ethnicity
Not Reportedb Total WIC Mothers
Southwest (continued) Citizen Potawatomi (OK)
Women in category Number 16 122 39 177 Percent reporting weight gain % 93.8 91.8 5.1 72.9 Mean Pounds 27.8 36.4 35.0 35.4
Eight Northern Pueblos (NM) Women in category Number 6 23 1 30
Percent reporting weight gain % 100.0 100.0 0.0 96.4 Mean Pounds 31.1 26.8 N/A 27.6
Five Sandoval Pueblos (NM) Women in category Number 0 30 8 38
Percent reporting weight gain % N/A 93.3 0.0 73.7 Mean Pounds N/A 24.9 N/A 24.9
ITC Oklahoma Women in category Number 17 116 5 138
Percent reporting weight gain % 94.1 99.1 0.0 94.9 Mean Pounds 24.9 31.0 N/A 30.3
Muscogee Creek Nation (OK) Women in category Number 21 363 8 392
Percent reporting weight gain % 100.0 96.1 0.0 94.4 Mean Pounds 33.0 32.9 N/A 32.9
Osage Nation (OK) Women in category Number 93 285 16 394
Percent reporting weight gain % 86.0 90.5 0.0 85.8 Mean Pounds 23.7 30.2 N/A 28.7
Otoe Missouria (OK) Women in category Number a 53 4 57
Percent reporting weight gain % a 96.2 50.0 93.0 Mean Pounds a 30.0 15.5 29.4
Pueblo of San Felipe (NM) Women in category Number a 46 a 47
Percent reporting weight gain % a 95.7 a 95.7 Mean Pounds a 28.0 a 28.5
Pueblo of Zuni (NM) Women in category Number 0 107 0 107
Percent reporting weight gain % N/A 95.3 N/A 95.3 Mean Pounds N/A 24.9 N/A 24.9
Santo Domingo (NM) Women in category Number 0 25 0 25
Percent reporting weight gain % N/A 92.0 N/A 92.0 Mean Pounds N/A 26.2 N/A 26.2
WCD (OK) Women in category Number 120 399 5 524
Percent reporting weight gain % 97.5 97.2 0.0 96.4 Mean Pounds 29.4 32.7 N/A 32.0

WIC Participant and Program Characteristics: 2014 Final Report
Page F-122
Table F.17. (continued) Mean Weight Gain During Pregnancy for Mothers Who Received WIC by Ethnicity and State
Region and State Hispanic/Latino Not
Hispanic/Latino Ethnicity
Not Reportedb Total WIC Mothers
Mountain Plains Colorado Women in category Number 7,059 8,011 0 15,070
Percent reporting weight gain % 96.1 96.5 N/A 96.3 Mean Pounds 28.6 31.9 N/A 30.4
Iowa Women in category Number 1,727 8,583 0 10,310
Percent reporting weight gain % 94.6 94.7 N/A 94.7 Mean Pounds 27.5 31.3 N/A 30.6
Kansas Women in category Number 3,135 7,699 0 10,834
Percent reporting weight gain % 98.0 97.6 N/A 97.7 Mean Pounds 27.9 31.4 N/A 30.4
Missouri Women in category Number 1,791 20,712 0 22,503
Percent reporting weight gain % 95.9 96.5 N/A 96.4 Mean Pounds 28.1 32.1 N/A 31.8
Montana Women in category Number 147 2,732 6 2,885
Percent reporting weight gain % 97.3 97.5 0.0 97.3 Mean Pounds 33.7 31.9 N/A 32.0
Nebraska Women in category Number 2,075 4,545 2 6,622
Percent reporting weight gain % 95.2 95.4 50.0 95.3 Mean Pounds 26.8 31.5 27.0 30.0
North Dakota Women in category Number 174 1,737 0 1,911
Percent reporting weight gain % 92.0 95.5 N/A 95.2 Mean Pounds 31.6 31.5 N/A 31.5
South Dakota Women in category Number 228 2,714 0 2,942
Percent reporting weight gain % 92.1 85.4 N/A 85.9 Mean Pounds 28.4 31.3 N/A 31.0
Utah Women in category Number 3,554 7,398 0 10,952
Percent reporting weight gain % 95.9 96.5 N/A 96.3 Mean Pounds 27.6 31.2 N/A 30.0
Wyoming Women in category Number 323 1,311 0 1,634
Percent reporting weight gain % 94.7 96.0 N/A 95.7 Mean Pounds 31.3 31.9 N/A 31.8
Cheyenne River Sioux (SD) Women in category Number a 69 a 70
Percent reporting weight gain % a 27.5 a 27.1 Mean Pounds a 29.1 a 29.1
Eastern Shoshone (WY) Women in category Number 0 26 0 26
Percent reporting weight gain % N/A 96.2 N/A 96.2 Mean Pounds N/A 30.0 N/A 30.0
Northern Arapahoe (WY) Women in category Number a 61 2 63
Percent reporting weight gain % a 34.4 0.0 33.3 Mean Pounds a 29.9 N/A 29.9

WIC Participant and Program Characteristics: 2014 Final Report
Page F-123
Table F.17. (continued) Mean Weight Gain During Pregnancy for Mothers Who Received WIC by Ethnicity and State
Region and State Hispanic/Latino Not
Hispanic/Latino Ethnicity
Not Reportedb Total WIC Mothers
Mountain Plains (continued) Omaha Nation (NE)
Women in category Number 0 12 0 12 Percent reporting weight gain % N/A 83.3 N/A 83.3 Mean Pounds N/A 27.8 N/A 27.8
Rosebud Sioux (SD) Women in category Number a 157 2 159
Percent reporting weight gain % a 66.9 50.0 66.7 Mean Pounds a 24.5 -12.0 24.1
Santee Sioux (NE) Women in category Number 0 10 0 10
Percent reporting weight gain % N/A 80.0 N/A 80.0 Mean Pounds N/A 21.6 N/A 21.6
Standing Rock Sioux (ND) Women in category Number a 65 a 66
Percent reporting weight gain % a 83.1 a 83.3 Mean Pounds a 28.4 a 28.2
Three Affiliated (ND) Women in category Number a 31 2 33
Percent reporting weight gain % a 19.4 0.0 18.2 Mean Pounds a 33.8 N/A 33.8
Ute Mountain Ute (CO) Women in category Number 0 17 0 17
Percent reporting weight gain % N/A 11.8 N/A 11.8 Mean Pounds N/A -1.3 N/A -1.3
Western
Alaska Women in category Number 225 3,015 25 3,265
Percent reporting weight gain % 95.6 87.8 16.0 87.7 Mean Pounds 30.6 28.8 25.5 29.0
Arizona Women in category Number 17,056 11,733 0 28,789
Percent reporting weight gain % 57.2 59.2 N/A 58.0 Mean Pounds 29.1 32.2 N/A 30.4
Guam Women in category Number 7 1,382 0 1,389
Percent reporting weight gain % 57.1 48.8 N/A 48.9 Mean Pounds 28.2 29.4 N/A 29.4
Hawaii Women in category Number 896 5,159 16 6,071
Percent reporting weight gain % 97.2 96.8 50.0 96.7 Mean Pounds 31.7 31.9 37.4 31.9
Idaho Women in category Number 1,702 4,740 0 6,442
Percent reporting weight gain % 94.1 92.8 N/A 93.1 Mean Pounds 27.1 30.0 N/A 29.2
Northern Mariana Islands Women in category Number a 491 a 492
Percent reporting weight gain % a 7.7 a 7.7 Mean Pounds a 30.3 a 30.3

WIC Participant and Program Characteristics: 2014 Final Report
Page F-124
Table F.17. (continued) Mean Weight Gain During Pregnancy for Mothers Who Received WIC by Ethnicity and State
Region and State Hispanic/Latino Not
Hispanic/Latino Ethnicity
Not Reportedb Total WIC Mothers
Western (continued) ITC Arizona (AZ)
Women in category Number 372 1,174 0 1,546 Percent reporting weight gain % 96.8 98.7 N/A 98.3 Mean Pounds 29.1 28.4 N/A 28.5
Navajo Nation (AZ) Women in category Number 36 1,571 0 1,607
Percent reporting weight gain % 16.7 28.7 N/A 28.4 Mean Pounds 34.5 28.1 N/A 28.1
Notes
Table includes those State agencies who provided valid data for at least 5% of the target population for this tabulation. Not all State agencies listed in table F.1 reported valid data for all SDS variables.
N/A indicates either not applicable or not available.
The group labeled WIC Mothers is comprised of all women certified as breastfeeding or postpartum. a Data not reported due to small cell size. b Includes categories with cell sizes too small to be reported separately.

WIC Participant and Program Characteristics: 2014 Final Report
Page F-125
Table F.18. Lapsed Time in Months Between Last and Current Pregnancies for Pregnant Women WIC Participants by State
Fewer Than 6 Months
6–11 Months
12–16 Months
17–23 Months
2 or More Years
No Previous Pregnancy Reported*
Exp. Date or
Gestation Not Reported
Certification
Date Not Reported
Total Pregnant
WIC Women
Region and State Number % Number % Number % Number % Number % Number % Number % Number % Number Northeast
Connecticut 416 6.6 485 7.7 339 5.4 378 6.0 2,474 39.5 2,145 34.3 23 0.4 0 0.0 6,260 Maine 195 9.2 203 9.5 162 7.6 155 7.3 715 33.6 696 32.7 0 0.0 0 0.0 2,126 Massachusetts 874 7.2 1,071 8.8 699 5.7 790 6.5 4,787 39.2 3,970 32.5 4 0.0 2 0.0 12,197 New Hampshire 96 5.9 136 8.4 83 5.1 71 4.4 362 22.3 877 54.0 0 0.0 0 0.0 1,625 Rhode Island 128 5.4 149 6.3 116 4.9 146 6.2 908 38.3 914 38.6 9 0.4 0 0.0 2,370 Indian Township (ME) 0 0.0 1 7.7 0 0.0 0 0.0 3 23.1 9 69.2 0 0.0 0 0.0 13 Pleasant Point (ME) 0 0.0 0 0.0 1 10.0 2 20.0 2 20.0 5 50.0 0 0.0 0 0.0 10 Seneca Nation (NY) 0 0.0 1 4.3 1 4.3 0 0.0 3 13.0 18 78.3 0 0.0 0 0.0 23
Mid-Atlantic
Delaware 84 4.4 143 7.6 104 5.5 112 5.9 733 38.8 713 37.7 0 0.0 0 0.0 1,889
District of Columbia 96 6.4 112 7.5 87 5.8 83 5.5 616 41.0 506 33.7 1 0.1 0 0.0 1,501 Maryland 576 4.3 808 6.0 604 4.5 681 5.1 4,938 36.9 5,766 43.1 0 0.0 0 0.0 13,373 New Jersey 644 4.3 1,080 7.2 902 6.0 928 6.2 5,553 37.2 5,790 38.8 37 0.2 1 0.0 14,935 Virginia 430 2.8 417 2.7 284 1.8 345 2.2 1,774 11.5 12,138 78.9 2 0.0 1 0.0 15,392 Virgin Islands 9 3.1 15 5.2 14 4.9 24 8.3 99 34.4 127 44.1 0 0.0 0 0.0 288
Southeast
Alabama 708 4.4 1,041 6.5 753 4.7 895 5.6 5,883 36.5 6,773 42.0 68 0.4 0 0.0 16,121
Florida 1,793 3.3 2,318 4.2 1,727 3.1 1,915 3.5 11,287 20.5 35,916 65.3 10 0.0 1 0.0 54,967 Georgia 875 2.5 1,353 3.9 1,055 3.0 1,343 3.9 7,824 22.6 21,284 61.4 24 0.1 919 2.7 34,677 Mississippi 469 5.1 549 5.9 380 4.1 417 4.5 2,506 27.1 4,714 50.9 219 2.4 7 0.1 9,261 South Carolina 134 1.0 255 1.8 224 1.6 261 1.9 2,219 16.0 10,654 76.7 139 1.0 7 0.1 13,893 Mississippi Choctaw
(MS) 2 1.9
12 11.7
7 6.8
6 5.8
39 37.9
36 35.0
1 1.0
0 0.0
103
Midwest
Illinois 980 3.2 1,852 6.0 1,580 5.1 1,778 5.7 12,227 39.3 12,640 40.6 46 0.1 0 0.0 31,103
Indiana 1,119 7.0 1,382 8.6 991 6.2 1,137 7.1 4,940 30.8 6,474 40.3 10 0.1 0 0.0 16,053 Michigan 1,655 6.7 2,166 8.8 1,668 6.8 1,840 7.5 7,773 31.5 9,579 38.8 0 0.0 2 0.0 24,683 Minnesota 1,236 10.1 1,447 11.8 979 8.0 1,041 8.5 4,021 32.9 3,487 28.6 0 0.0 0 0.0 12,211 Wisconsin 993 9.2 1,084 10.0 764 7.1 866 8.0 3,770 34.9 3,320 30.7 2 0.0 0 0.0 10,799
Southwest
Arkansas 880 8.3 946 8.9 678 6.4 712 6.7 3,459 32.6 3,940 37.1 1 0.0 0 0.0 10,616
Louisiana 114 0.8 199 1.4 159 1.1 215 1.5 2,959 20.4 10,827 74.7 0 0.0 25 0.2 14,498 New Mexico 80 1.1 68 0.9 58 0.8 38 0.5 529 7.3 6,450 89.2 1 0.0 5 0.1 7,229

WIC Participant and Program Characteristics: 2014 Final Report
Page F-126
Table F.18. (continued) Lapsed Time in Months Between Last and Current Pregnancies for Pregnant Women WIC Participants by State
Fewer Than 6
Months
6–11 Months
12–16 Months
17–23 Months
2 or More Years
No Previous Pregnancy Reported*
Exp. Date or
Gestation Not Reported
Certification
Date Not Reported
Total Pregnant
WIC Women
Region and State Number % Number % Number % Number % Number % Number % Number % Number % Number Southwest (continued)
Oklahoma 909 8.2 1,084 9.7 727 6.5 760 6.8 3,865 34.7 3,795 34.1 0 0.0 0 0.0 11,140 Texas 4,057 4.2 7,552 7.9 5,596 5.8 6,055 6.3 24,734 25.7 48,156 50.1 18 0.0 6 0.0 96,174 ACL (NM) 3 6.4 3 6.4 0 0.0 4 8.5 19 40.4 18 38.3 0 0.0 0 0.0 47 Chickasaw Nation (OK) 38 9.3 37 9.1 23 5.7 25 6.1 129 31.7 155 38.1 0 0.0 0 0.0 407 Choctaw Nation (OK) 30 9.2 43 13.2 22 6.8 23 7.1 94 28.9 113 34.8 0 0.0 0 0.0 325 Citizen Potawatomi
(OK) 12 7.9
16 10.5
4 2.6
11 7.2
39 25.7
70 46.1
0 0.0
0 0.0
152 Eight Northern
Pueblos(NM) 2 9.1
2 9.1
0 0.0
2 9.1
7 36.4
7 36.4
0 0.0
0 0.0
18 Five Sandoval Pueblos
(NM) 0 0.0
0 0.0
0 0.0
0 0.0
10 47.6
11 52.4
0 0.0
0 0.0
21 ITC Oklahoma 8 10.4 11 14.3 5 6.5 4 5.2 25 32.5 24 31.2 0 0.0 0 0.0 77 Muscogee Creek
Nation (OK) 18 6.7
38 14.2
18 6.7
22 8.2
88 32.8
84 31.3
0 0.0
0 0.0
268 Osage Nation (OK) 19 10.9 24 13.7 11 6.3 20 11.4 50 28.6 51 29.1 0 0.0 0 0.0 175 Otoe Missouria (OK) 4 8.3 5 10.4 4 8.3 6 12.5 12 25.0 17 35.4 0 0.0 0 0.0 48 Pueblo of Isleta (NM) 2 2.1 2 2.1 0 0.0 1 1.1 5 5.3 84 89.4 0 0.0 0 0.0 94 Pueblo of San Felipe
(NM) 1 5.3
1 5.3
1 5.3
2 10.5
9 47.4
5 26.3
0 0.0
0 0.0
19 Pueblo of Zuni (NM) 3 4.4 10 14.7 2 2.9 0 0.0 32 47.1 21 30.9 0 0.0 0 0.0 68 Santo Domingo (NM) 0 0.0 3 27.3 1 9.1 0 0.0 4 36.4 3 27.3 0 0.0 0 0.0 11 WCD (OK) 45 11.1 42 10.4 30 7.4 31 7.7 137 33.8 120 29.6 0 0.0 0 0.0 405
Mountain Plains
Colorado 508 5.4 567 6.0 409 4.3 448 4.7 2,283 24.1 5,275 55.6 0 0.0 0 0.0 9,490
Iowa 628 9.1 658 9.6 464 6.8 472 6.9 2,031 29.6 2,545 37.0 74 1.1 1 0.0 6,873 Kansas 687 9.6 687 9.6 481 6.7 557 7.8 2,371 33.1 2,331 32.6 47 0.7 0 0.0 7,161 Missouri 1,449 9.3 1,516 9.7 1,080 6.9 1,105 7.1 5,055 32.4 5,407 34.6 3 0.0 0 0.0 15,615 Montana 186 9.4 205 10.3 156 7.9 166 8.4 592 29.8 679 34.2 0 0.0 0 0.0 1,984 Nebraska 251 8.7 322 11.2 233 8.1 245 8.5 957 33.2 860 29.8 11 0.4 6 0.2 2,885 North Dakota 142 10.9 128 9.9 129 9.9 109 8.4 342 26.3 446 34.4 2 0.2 0 0.0 1,298 South Dakota 137 7.6 192 10.7 133 7.4 126 7.0 509 28.4 690 38.5 0 0.0 6 0.3 1,793 Utah 413 6.2 441 6.7 377 5.7 360 5.4 1,285 19.4 3,733 56.5 0 0.0 0 0.0 6,609 Wyoming 76 6.9 60 5.5 50 4.6 46 4.2 178 16.2 688 62.7 0 0.0 0 0.0 1,098 Cheyenne River Sioux
(SD) 10 14.7
9 13.2
3 4.4
8 11.8
21 30.9
17 25.0
0 0.0
0 0.0
68 Eastern Shoshone (WY) 0 0.0 1 6.7 0 0.0 0 0.0 5 33.3 9 60.0 0 0.0 0 0.0 15
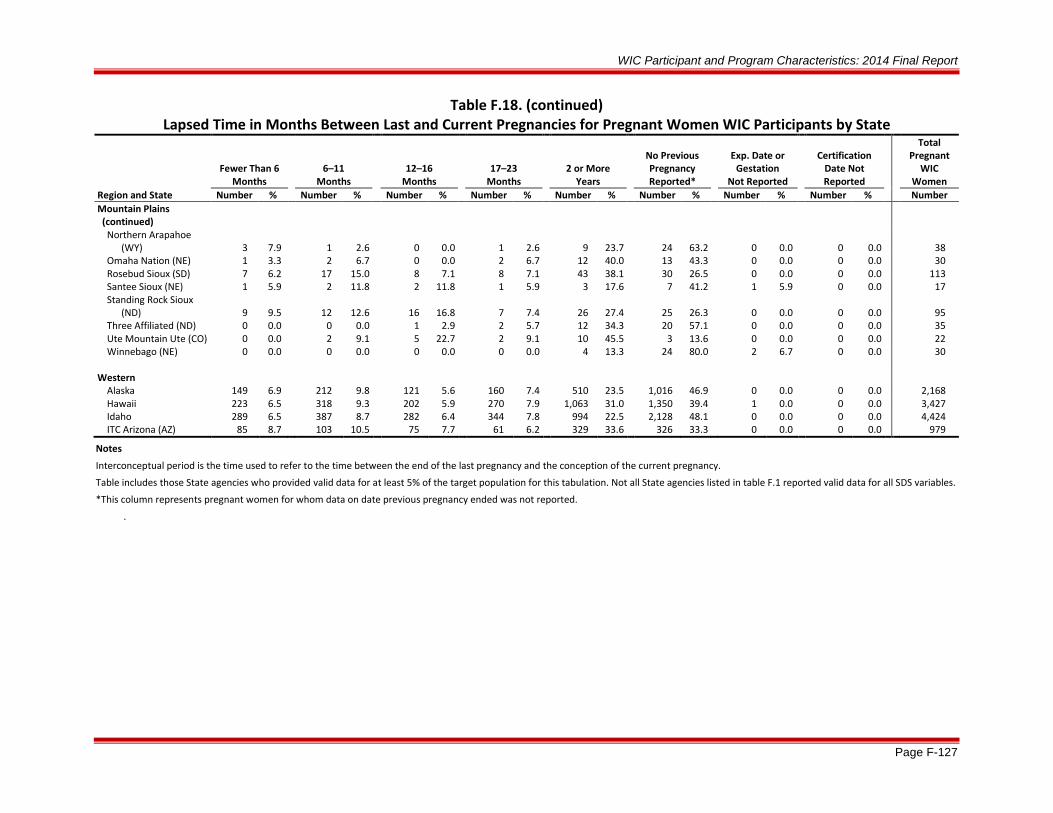
WIC Participant and Program Characteristics: 2014 Final Report
Page F-127
Table F.18. (continued) Lapsed Time in Months Between Last and Current Pregnancies for Pregnant Women WIC Participants by State
Fewer Than 6
Months
6–11 Months
12–16 Months
17–23 Months
2 or More Years
No Previous Pregnancy Reported*
Exp. Date or
Gestation Not Reported
Certification
Date Not Reported
Total Pregnant
WIC Women
Region and State Number % Number % Number % Number % Number % Number % Number % Number % Number Mountain Plains (continued)
Northern Arapahoe (WY) 3 7.9
1 2.6
0 0.0
1 2.6
9 23.7
24 63.2
0 0.0
0 0.0
38
Omaha Nation (NE) 1 3.3 2 6.7 0 0.0 2 6.7 12 40.0 13 43.3 0 0.0 0 0.0 30 Rosebud Sioux (SD) 7 6.2 17 15.0 8 7.1 8 7.1 43 38.1 30 26.5 0 0.0 0 0.0 113 Santee Sioux (NE) 1 5.9 2 11.8 2 11.8 1 5.9 3 17.6 7 41.2 1 5.9 0 0.0 17 Standing Rock Sioux
(ND) 9 9.5
12 12.6
16 16.8
7 7.4
26 27.4
25 26.3
0 0.0
0 0.0
95 Three Affiliated (ND) 0 0.0 0 0.0 1 2.9 2 5.7 12 34.3 20 57.1 0 0.0 0 0.0 35 Ute Mountain Ute (CO) 0 0.0 2 9.1 5 22.7 2 9.1 10 45.5 3 13.6 0 0.0 0 0.0 22 Winnebago (NE) 0 0.0 0 0.0 0 0.0 0 0.0 4 13.3 24 80.0 2 6.7 0 0.0 30
Western
Alaska 149 6.9 212 9.8 121 5.6 160 7.4 510 23.5 1,016 46.9 0 0.0 0 0.0 2,168
Hawaii 223 6.5 318 9.3 202 5.9 270 7.9 1,063 31.0 1,350 39.4 1 0.0 0 0.0 3,427 Idaho 289 6.5 387 8.7 282 6.4 344 7.8 994 22.5 2,128 48.1 0 0.0 0 0.0 4,424 ITC Arizona (AZ) 85 8.7 103 10.5 75 7.7 61 6.2 329 33.6 326 33.3 0 0.0 0 0.0 979
Notes
Interconceptual period is the time used to refer to the time between the end of the last pregnancy and the conception of the current pregnancy.
Table includes those State agencies who provided valid data for at least 5% of the target population for this tabulation. Not all State agencies listed in table F.1 reported valid data for all SDS variables.
*This column represents pregnant women for whom data on date previous pregnancy ended was not reported.
.