Embed Size (px)
Citation preview
Wi-Fi Location-Based Services—Design and Deployment Considerations
ContentsExecutive Summary 3
Target Audience 3
Introduction 3
Overview 4
Objectives 4
Reference Publications 5
Hardware/Software 6
Location Tracking Approaches 6
Cell of Origin 7
Distance-Based (Lateration) Techniques 8
Angle-Based (Angulation) Techniques 14
Location Patterning (Pattern Recognition) Techniques 15
Cisco Location-Based Services Architecture 18
RF Fingerprinting 18
Overall Solution Architecture 20
Role of the Location Appliance 23
Location Tracking without a Location Appliance 24
Solution Performance 24
The Meaning of Accuracy and Precision 24
Accuracy and Precision of the Cisco LBS Solution 25
Which Devices Can Be Tracked 25
WLAN Clients 25
802.11 Active RFID Tags (L2 Multicast) 31
Corporate Headquarters:
Copyright © 2006 Cisco Systems, Inc. All rights reserved.
Cisco Systems, Inc., 170 West Tasman Drive, San Jose, CA 95134-1706 USA
Contents
Rogue Access Points 35
Rogue Clients 39
Installation and Configuration 41
Installing and Configuring the Location Appliance 41
Configuring the Wireless Control System for Location Tracking 41
Configuring Location Server History Parameters 41
Configuring Location Server Advanced Parameters 43
Configuring Location Server Location Parameters 45
Configuring Location Server Notification Parameters 46
Location Appliance Dual Ethernet Operation 47
Changing Default Passwords for the Location Appliance 47
Changing the “root” User Linux System Password 47
Changing the “admin” Location Server Application Password 47
Location Appliance Time Synchronization 49
Quiescing the Location Appliance 50
Deployment Best Practices 51
“Location-Aware” WLAN Design Considerations 51
Minimum Signal Level Thresholds 51
Access Point Placement Considerations 54
Access Point Density Considerations 55
Determining Location Readiness 57
Avoiding Excessive Co-Channel Interference 60
Avoiding Location Display Jitter with Location Smoothing 61
Avoiding Location Misdetection in Multi-Floor Structures 62
Using Multiple Location Appliances in Larger Designs 65
Antenna Considerations 70
Site Calibration 72
Location Tracking Challenges 80
Outdoor Environments 80
Non-Uniform Environments 80
Small Sites 81
Antenna Installation Height 81
Traffic Considerations 82
Traffic Between the Location Appliance and WLAN Controllers 82
Traffic Between the Location Appliance and WCS 85
RFID Tag Considerations 86
RFID Tag Technology 86
Passive RFID Tags 87
Active RFID Tags 91
2Wi-Fi Location-Based Services—Design and Deployment Considerations
OL-11612-01
Executive Summary
Using Wi-Fi RFID Tags with the Cisco Location Appliance 94
Compatible RFID Tags 94
Using 802.11b Tags in an 802.11g Environment 95
Enabling Asset Tag Tracking for L2 Multicasting Asset Tags 96
Configuring Asset Tags 99
The SOAP/XML Application Programming Interface 104
SOAP/XML Partner Location Client Example—PanGo Locator 105
Caveats 108
CSCse14724—Degraded Location Accuracy with Monitor Mode APs 109
CSCse15237—Calibration Data Point Locations Mismatched with Cross-Hair Locations 109
Appendix A—Polling Traffic 2700 <-> 4400 WLAN Controller 110
Appendix B—AeroScout Tag Manager Version 2.1 111
Appendix C—Large Site Traffic Analysis 117
Appendix D—PanGo Locator LAN Tag Association and Signaling 118
Executive Summary
Target AudienceThis white paper is intended for individuals interested in designing and deploying indoor Cisco wireless LAN (WLAN) solutions that include the Cisco Wireless Location Appliance, the Cisco Wireless Control System (WCS), and other components of the Cisco Unified Wireless Network (UWN).
Introduction802.11 wireless has truly blossomed in the past decade, moving from a technology that was primarily a productivity enhancement for verticalized industries to one now pervasive in the modern technology-aware society. The wide-spread acceptance of Wi-Fi networks has fueled this dramatic adoption, from deployments in offices and distribution centers to homes and ever-multiplying wireless metropolitan areas. Maturing rapidly and reaching critical mass, this widespread adoption has driven down the cost of wireless infrastructure dramatically and has resulted in the availability of higher quality equipment at lower cost.
The rapid increase in the adoption rate of Wi-Fi coupled with the availability of high quality infrastructure at reasonable cost are key factors behind the flurry of commercial and academic activity regarding Wi-Fi location-based services. Not to be confused with passive RFID solutions or solutions using non-802.11 active RF tags and readers, research and development progress in Wi-Fi location prediction techniques have facilitated the emergence of indoor RF location tracking systems based entirely on IEEE 802.11 infrastructure. In combination with the frenetic race to implement RFID systems in the consumer and distribution supply chains, these have all combined to form a “perfect storm” of sorts, transforming what was once a general market passing interest in location-based services into one that looks upon 802.11-based Location-Based Services (LBS) as potentially the next “killer application” for Wi-Fi wireless.
3Wi-Fi Location-Based Services—Design and Deployment Considerations
OL-11612-01
Overview
It is not hard to understand why this is so. With integrated location tracking, enterprise wireless LANs become much more valuable as a corporate business asset. Enterprise network administrators, security personnel, and others directly responsible for the health and well-being of business-class networks have expressed great interest in LBS to allow them to better address issues in their environments, such as the following:
• The need to quickly and efficiently locate valuable assets and key personnel
• Improving productivity via effective asset and personnel allocation
• Reducing loss because of the unauthorized removal of assets from company premises
• Improving customer satisfaction by rapid location of critical service-impacting assets
• Improving WLAN planning and tuning capabilities
• Coordinating Wi-Fi device location with security policy enforcement
• Meeting regulatory requirements for E911 calls
This white paper comprehensively discusses the Cisco Location-Based Service solution and the recommended best practices for design, configuration, installation, and deployment. References to applicable existing documentation are made throughout this document. A wealth of new material is provided that addresses such topics as the following:
• The fundamentals of positioning technologies including lateration, angulation, and pattern recognition approaches
• How Cisco RF Fingerprinting operates and how it compares to other approaches
• Traffic flow analysis between the location appliance and other network components
• In-depth discussion of various RFID tag technologies including vendor-specific configuration information
• The location appliance Simple Object Access Protocol (SOAP)/eXtensible Markup Language (XML) API along with an example of a successful implementation
This document ends with several appendices and a section detailing caveats encountered during production.
Overview
ObjectivesThis white paper is intended to accomplish the following objectives:
• Providing the reader unfamiliar with location-based services with a basic foundation in technical aspects of location tracking and positioning systems. Location Tracking Approaches, page 6, provides substantial background information on positioning systems such as cell of origin, time of arrival, time difference of arrival, angle of arrival, and pattern recognition.
• Describing and defining RF Fingerprinting, the technology at the heart of the Cisco LBS solution. Cisco Location-Based Services Architecture, page 18, discusses the similarities and differences between RF Fingerprinting and the approaches described in Location Tracking Approaches, page 6, and how RF Fingerprinting addresses the deployment of cost-effective indoor Wi-Fi location tracking solutions. This knowledge is useful when comparing the Cisco LBS solution to other approaches for indoor location tracking.
4Wi-Fi Location-Based Services—Design and Deployment Considerations
OL-11612-01
Overview
• Reviewing the procedures required to install and configure a Cisco LBS solution consisting of LWAPP-enabled access points, WLAN controllers, WCS, and the location appliance. Installation and Configuration, page 41, provides information that aids in competently installing the solution and responding to questions regarding some of the more unusual parameters used.
• Describing best practices that should be followed in designing and deploying location-aware wireless LANs. Deployment Best Practices, page 51, focuses on a variety of topics from client signal thresholds, inter-access point spacing, and access point density to calibration, traffic analysis, and challenging location environments. All the information contained in this section aids in optimizing location-aware designs for improved location fidelity.
• Providing the reader having limited exposure to RFID tag technology with a basic understanding of how these various types of tags can or cannot interact with the Cisco LBS solution. RFID Tag Considerations, page 87, provides details regarding RFID asset tags and how these products are configured. This section also places considerable emphasis on the proper configuration of Cisco WLAN controllers, the WCS, and the location appliance when using RFID tags.
• Describing the architecture available to Cisco Technology Partners interfacing to the Cisco LBS solution via the Location Appliance SOAP/XML Application Programming Interface (API). The SOAP/XML Application Programming Interface, page 105, discusses this and presents information that is useful to readers wishing to better understand how location solutions from Cisco Technology Partners fit into the Cisco Unified Wireless Network (UWN), thereby enhancing the total value of a Cisco location-aware WLAN solution.
Reference PublicationsIt is assumed the reader is familiar with the following technical documents:
• Release Notes for Cisco Wireless Location Appliance— http://www.cisco.com/en/US/products/ps6386/prod_release_note09186a00806b5ec7.html
• Cisco Wireless Location Appliance: Installation Guide— http://www.cisco.com/en/US/products/ps6386/products_installation_and_configuration_guide_book09186a00804fa761.html
• Cisco Wireless Location Appliance: Configuration Guide— http://www.cisco.com/en/US/products/ps6386/products_configuration_guide_book09186a00806b5745.html
• Cisco Wireless Location Appliance: Deployment Guide— http://www.cisco.com/en/US/products/ps6386/prod_technical_reference09186a008059ce31.html
• Cisco Wireless Control System Release Notes, Release 4.0— http://www.cisco.com/en/US/products/ps6305/prod_release_note09186a00806b0811.html
• Cisco Wireless Control System Configuration Guide, Release 4.0— http://www.cisco.com/en/US/products/ps6305/products_configuration_guide_book09186a00806b57ec.html
Cisco also recommends that readers review the “WLAN Management” chapter of the Cisco Unified Wireless Network Solutions Reference Design Guide 3.0.
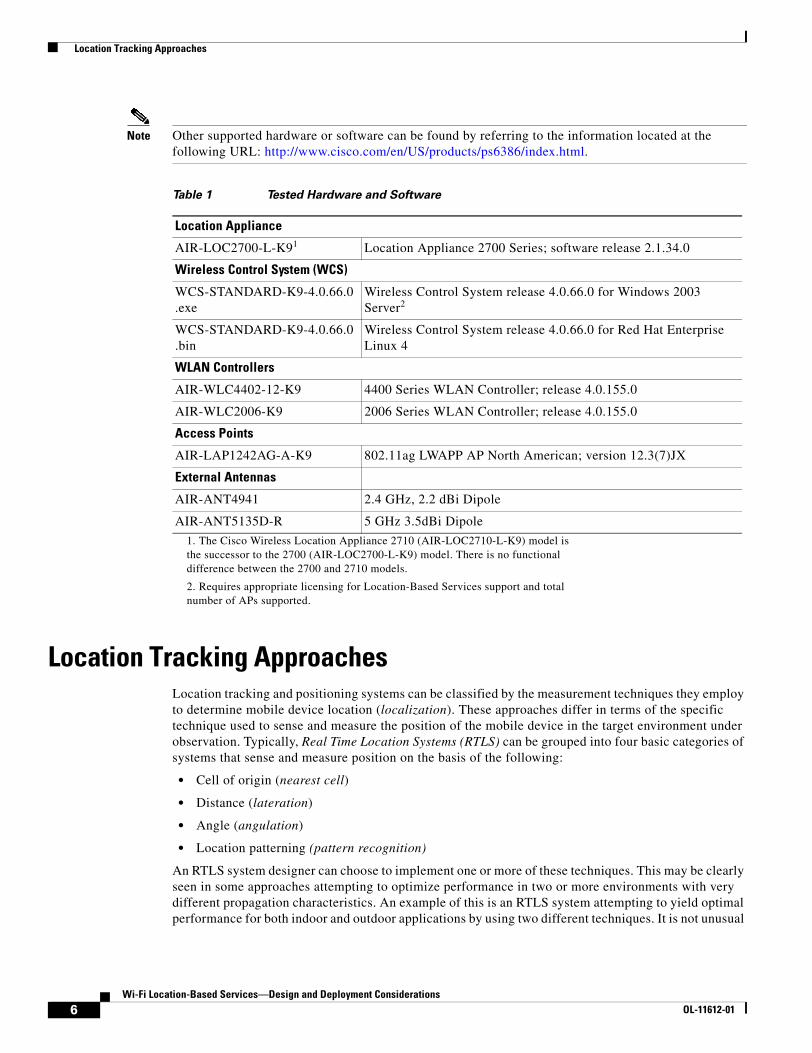
Hardware/SoftwareThis document describes the use of the hardware and software listed in Table 1.
5Wi-Fi Location-Based Services—Design and Deployment Considerations
OL-11612-01
Location Tracking Approaches
Note Other supported hardware or software can be found by referring to the information located at the following URL: http://www.cisco.com/en/US/products/ps6386/index.html.
Location Tracking ApproachesLocation tracking and positioning systems can be classified by the measurement techniques they employ to determine mobile device location (localization). These approaches differ in terms of the specific technique used to sense and measure the position of the mobile device in the target environment under observation. Typically, Real Time Location Systems (RTLS) can be grouped into four basic categories of systems that sense and measure position on the basis of the following:
• Cell of origin (nearest cell)
• Distance (lateration)
• Angle (angulation)
• Location patterning (pattern recognition)
An RTLS system designer can choose to implement one or more of these techniques. This may be clearly seen in some approaches attempting to optimize performance in two or more environments with very different propagation characteristics. An example of this is an RTLS system attempting to yield optimal performance for both indoor and outdoor applications by using two different techniques. It is not unusual
Table 1 Tested Hardware and Software
Location Appliance
AIR-LOC2700-L-K91
1. The Cisco Wireless Location Appliance 2710 (AIR-LOC2710-L-K9) model is the successor to the 2700 (AIR-LOC2700-L-K9) model. There is no functional difference between the 2700 and 2710 models.
Location Appliance 2700 Series; software release 2.1.34.0
Wireless Control System (WCS)
WCS-STANDARD-K9-4.0.66.0.exe
Wireless Control System release 4.0.66.0 for Windows 2003 Server2
2. Requires appropriate licensing for Location-Based Services support and total number of APs supported.
WCS-STANDARD-K9-4.0.66.0.bin
Wireless Control System release 4.0.66.0 for Red Hat Enterprise Linux 4
WLAN Controllers
AIR-WLC4402-12-K9 4400 Series WLAN Controller; release 4.0.155.0
AIR-WLC2006-K9 2006 Series WLAN Controller; release 4.0.155.0
Access Points
AIR-LAP1242AG-A-K9 802.11ag LWAPP AP North American; version 12.3(7)JX
External Antennas
AIR-ANT4941 2.4 GHz, 2.2 dBi Dipole
AIR-ANT5135D-R 5 GHz 3.5dBi Dipole
6Wi-Fi Location-Based Services—Design and Deployment Considerations
OL-11612-01
Location Tracking Approaches
to hear arguments supporting the case that a fifth category should exist to include those RTLS systems that sense and measure position using a combination of at least two of the four techniques mentioned above.
Keep in mind that regardless of the underlying positioning technology, the “real-time” nature of an RTLS is only as real-time as the most current timestamps, signal strengths, or angle-of-incidence measurements. The timing of probe responses, beaconing rates, and location server polling intervals can influence discrepancies seen between actual and reported device position from reporting interval to reporting interval.
Cell of Origin
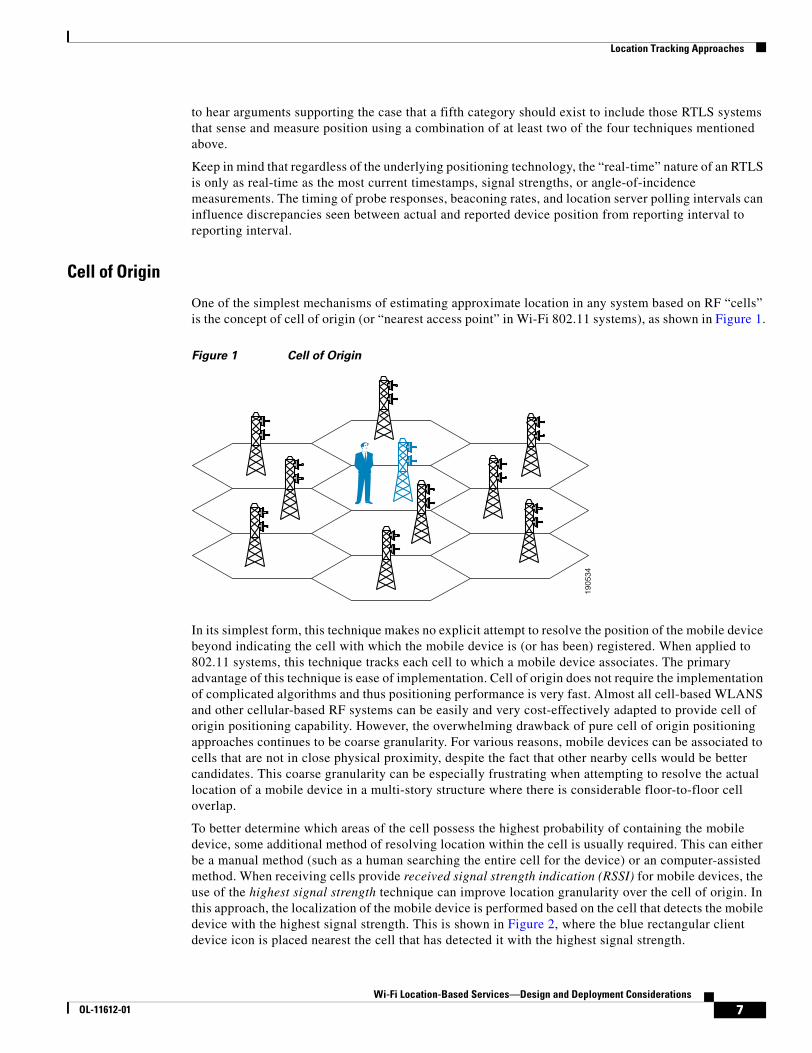
One of the simplest mechanisms of estimating approximate location in any system based on RF “cells” is the concept of cell of origin (or “nearest access point” in Wi-Fi 802.11 systems), as shown in Figure 1.
Figure 1 Cell of Origin
In its simplest form, this technique makes no explicit attempt to resolve the position of the mobile device beyond indicating the cell with which the mobile device is (or has been) registered. When applied to 802.11 systems, this technique tracks each cell to which a mobile device associates. The primary advantage of this technique is ease of implementation. Cell of origin does not require the implementation of complicated algorithms and thus positioning performance is very fast. Almost all cell-based WLANS and other cellular-based RF systems can be easily and very cost-effectively adapted to provide cell of origin positioning capability. However, the overwhelming drawback of pure cell of origin positioning approaches continues to be coarse granularity. For various reasons, mobile devices can be associated to cells that are not in close physical proximity, despite the fact that other nearby cells would be better candidates. This coarse granularity can be especially frustrating when attempting to resolve the actual location of a mobile device in a multi-story structure where there is considerable floor-to-floor cell overlap.
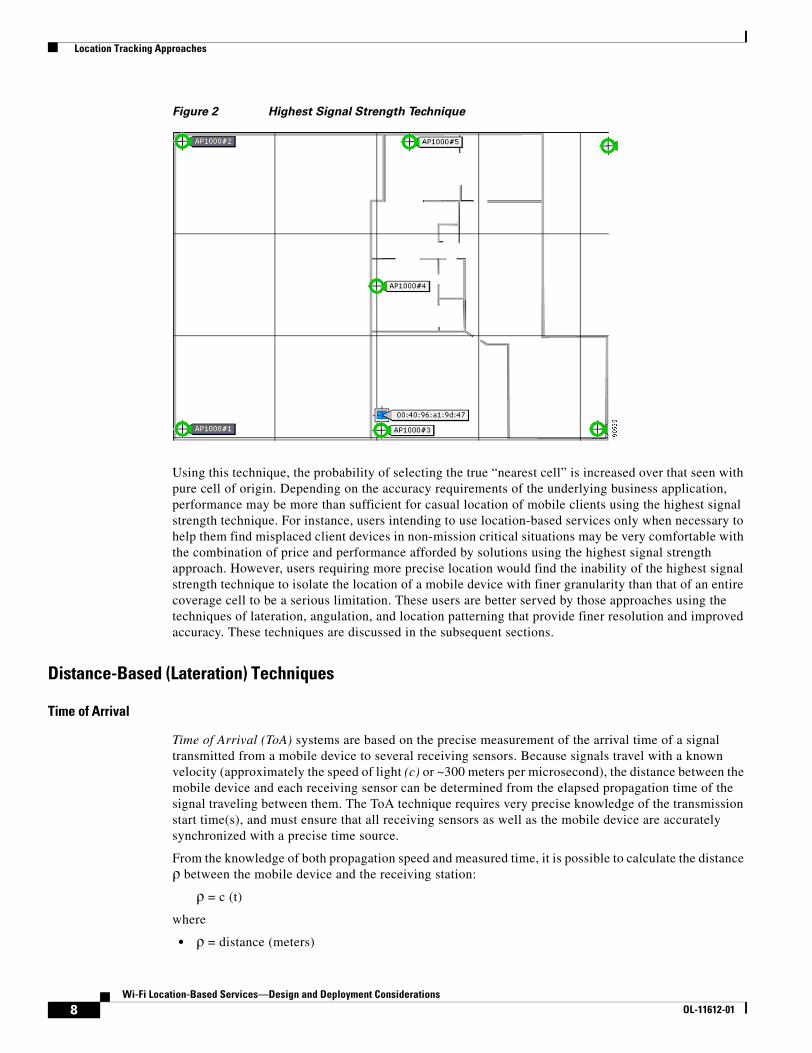
To better determine which areas of the cell possess the highest probability of containing the mobile device, some additional method of resolving location within the cell is usually required. This can either be a manual method (such as a human searching the entire cell for the device) or an computer-assisted method. When receiving cells provide received signal strength indication (RSSI) for mobile devices, the use of the highest signal strength technique can improve location granularity over the cell of origin. In this approach, the localization of the mobile device is performed based on the cell that detects the mobile device with the highest signal strength. This is shown in Figure 2, where the blue rectangular client device icon is placed nearest the cell that has detected it with the highest signal strength.
1905
34
7Wi-Fi Location-Based Services—Design and Deployment Considerations
OL-11612-01
Location Tracking Approaches
Figure 2 Highest Signal Strength Technique
Using this technique, the probability of selecting the true “nearest cell” is increased over that seen with pure cell of origin. Depending on the accuracy requirements of the underlying business application, performance may be more than sufficient for casual location of mobile clients using the highest signal strength technique. For instance, users intending to use location-based services only when necessary to help them find misplaced client devices in non-mission critical situations may be very comfortable with the combination of price and performance afforded by solutions using the highest signal strength approach. However, users requiring more precise location would find the inability of the highest signal strength technique to isolate the location of a mobile device with finer granularity than that of an entire coverage cell to be a serious limitation. These users are better served by those approaches using the techniques of lateration, angulation, and location patterning that provide finer resolution and improved accuracy. These techniques are discussed in the subsequent sections.
Distance-Based (Lateration) Techniques
Time of Arrival
Time of Arrival (ToA) systems are based on the precise measurement of the arrival time of a signal transmitted from a mobile device to several receiving sensors. Because signals travel with a known velocity (approximately the speed of light (c) or ~300 meters per microsecond), the distance between the mobile device and each receiving sensor can be determined from the elapsed propagation time of the signal traveling between them. The ToA technique requires very precise knowledge of the transmission start time(s), and must ensure that all receiving sensors as well as the mobile device are accurately synchronized with a precise time source.
From the knowledge of both propagation speed and measured time, it is possible to calculate the distance ρ between the mobile device and the receiving station:
ρ = c (t)
where
• ρ = distance (meters)
8Wi-Fi Location-Based Services—Design and Deployment Considerations
OL-11612-01
Location Tracking Approaches
• c = propagation speed of ~ 300 meters / microsecond
• t = time in microseconds
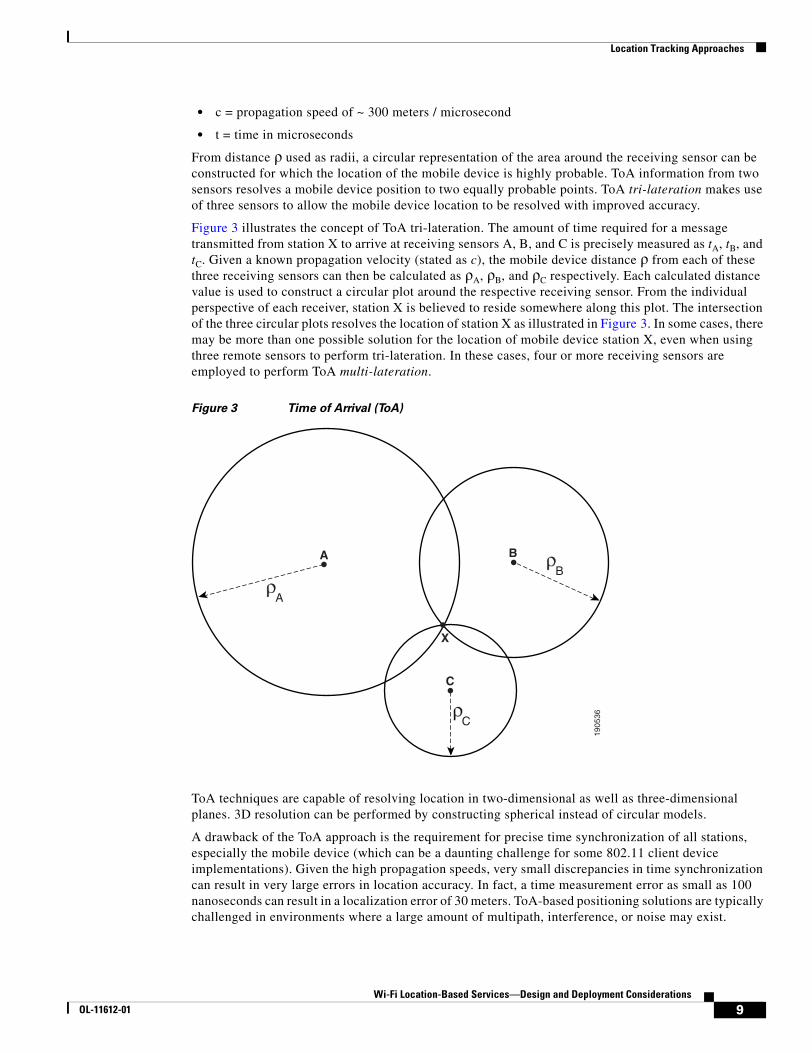
From distance ρ used as radii, a circular representation of the area around the receiving sensor can be constructed for which the location of the mobile device is highly probable. ToA information from two sensors resolves a mobile device position to two equally probable points. ToA tri-lateration makes use of three sensors to allow the mobile device location to be resolved with improved accuracy.
Figure 3 illustrates the concept of ToA tri-lateration. The amount of time required for a message transmitted from station X to arrive at receiving sensors A, B, and C is precisely measured as tA, tB, and tC. Given a known propagation velocity (stated as c), the mobile device distance ρ from each of these three receiving sensors can then be calculated as ρA, ρB, and ρC respectively. Each calculated distance value is used to construct a circular plot around the respective receiving sensor. From the individual perspective of each receiver, station X is believed to reside somewhere along this plot. The intersection of the three circular plots resolves the location of station X as illustrated in Figure 3. In some cases, there may be more than one possible solution for the location of mobile device station X, even when using three remote sensors to perform tri-lateration. In these cases, four or more receiving sensors are employed to perform ToA multi-lateration.
Figure 3 Time of Arrival (ToA)
ToA techniques are capable of resolving location in two-dimensional as well as three-dimensional planes. 3D resolution can be performed by constructing spherical instead of circular models.
A drawback of the ToA approach is the requirement for precise time synchronization of all stations, especially the mobile device (which can be a daunting challenge for some 802.11 client device implementations). Given the high propagation speeds, very small discrepancies in time synchronization can result in very large errors in location accuracy. In fact, a time measurement error as small as 100 nanoseconds can result in a localization error of 30 meters. ToA-based positioning solutions are typically challenged in environments where a large amount of multipath, interference, or noise may exist.
1905
36
A
A
C
B
B
C
X
9Wi-Fi Location-Based Services—Design and Deployment Considerations
OL-11612-01
Location Tracking Approaches
The Global Positioning System (GPS) is a example of a well-known ToA system where precision timing is provided by atomic clocks.
Time Difference of Arrival (TDoA)
Time Difference of Arrival (TDoA) techniques use relative time measurements at each receiving sensor in place of absolute time measurements. Because of this, TDoA does not require coordination of received timestamps with a precision time source at the point of transmission to locate the mobile device. With TDoA, a transmission with an unknown starting time is received at various receiving sensors, with only the receivers requiring time synchronization.
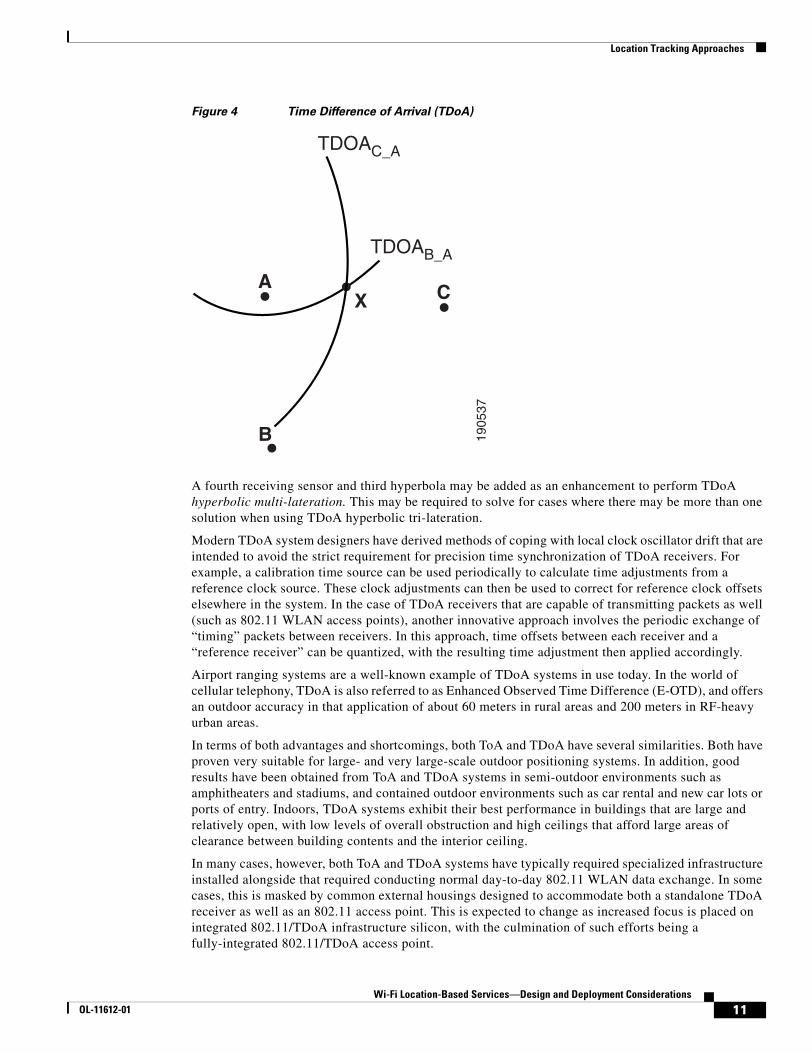
TDoA is commonly implemented via a mathematical process known as hyperbolic lateration. In this approach, at least three time-synchronized receiving sensors A, B, and C are required. In Figure 4, assume that when station X transmits a message, this message arrives at receiving sensor A with time TA and at receiving station B with time TB. Calculate the time difference of arrival for this message between the locations of sensors B and A as the positive constant k:
TDoAB-A = | TB – TA | = k
You can use the value of TDoAB-A to construct a hyperbola with foci at the locations of both receiving sensors A and B. This hyperbola represents the locus of all the points in the x-y plane, the difference of whose distances from the two foci is equal to k(c) meters. Mathematically, this represents all possible locations of mobile device X such that:
| DXB – DXA | = k(c)
The probable location of mobile station X can then be represented by a point along this hyperbola. To further resolve the location of station X, a third receiving sensor at location C is used to calculate the message time difference of arrival between sensors C and A, or:
TDoAC-A = | TC – TA | = k1
Knowledge of constant k1 allows you to construct a second hyperbola representing the locus of all the points in the x-y plane, the difference of whose distances from the two foci (that is, the two receiving sensors A and C) is equal to k1(c) meters. Mathematically, this can be seen as representing all possible locations of mobile device X such that:
| DXC – DXA | = k1(c)
Figure 4 illustrates how the intersection of the two hyperbolas TDoAC-A and TDoAB-A is used to resolve the position of station X.
10Wi-Fi Location-Based Services—Design and Deployment Considerations
OL-11612-01
Location Tracking Approaches
Figure 4 Time Difference of Arrival (TDoA)
A fourth receiving sensor and third hyperbola may be added as an enhancement to perform TDoA hyperbolic multi-lateration. This may be required to solve for cases where there may be more than one solution when using TDoA hyperbolic tri-lateration.
Modern TDoA system designers have derived methods of coping with local clock oscillator drift that are intended to avoid the strict requirement for precision time synchronization of TDoA receivers. For example, a calibration time source can be used periodically to calculate time adjustments from a reference clock source. These clock adjustments can then be used to correct for reference clock offsets elsewhere in the system. In the case of TDoA receivers that are capable of transmitting packets as well (such as 802.11 WLAN access points), another innovative approach involves the periodic exchange of “timing” packets between receivers. In this approach, time offsets between each receiver and a “reference receiver” can be quantized, with the resulting time adjustment then applied accordingly.
Airport ranging systems are a well-known example of TDoA systems in use today. In the world of cellular telephony, TDoA is also referred to as Enhanced Observed Time Difference (E-OTD), and offers an outdoor accuracy in that application of about 60 meters in rural areas and 200 meters in RF-heavy urban areas.
In terms of both advantages and shortcomings, both ToA and TDoA have several similarities. Both have proven very suitable for large- and very large-scale outdoor positioning systems. In addition, good results have been obtained from ToA and TDoA systems in semi-outdoor environments such as amphitheaters and stadiums, and contained outdoor environments such as car rental and new car lots or ports of entry. Indoors, TDoA systems exhibit their best performance in buildings that are large and relatively open, with low levels of overall obstruction and high ceilings that afford large areas of clearance between building contents and the interior ceiling.
In many cases, however, both ToA and TDoA systems have typically required specialized infrastructure installed alongside that required conducting normal day-to-day 802.11 WLAN data exchange. In some cases, this is masked by common external housings designed to accommodate both a standalone TDoA receiver as well as an 802.11 access point. This is expected to change as increased focus is placed on integrated 802.11/TDoA infrastructure silicon, with the culmination of such efforts being a fully-integrated 802.11/TDoA access point.
1905
37
A
B
CX
TDOAC_A
TDOAB_A
11Wi-Fi Location-Based Services—Design and Deployment Considerations
OL-11612-01
Location Tracking Approaches
In close, confined indoor areas, both ToA and TDoA have traditionally suffered from less than optimal performance, especially in situations where the mobile station is likely to be surrounded by objects that promote multi-angular RF scattering and reflection. Interestingly, the effects experienced under such conditions appear to worsen with narrow-band implementations of TDoA versus wider band implementations such as WLANs. Capitalizing on this phenomena, alternative methods of implementing TDoA such as the 2.4 GHz approach described in ANSI INCITS 371.1/ISO24370 have been developed. ANSI INCITS 371.1 implements 2.4 GHz Binary Phase Shift Keying/Direct Sequence Spread Spectrum (BPSK/DSSS) with an occupied bandwidth of 60 MHz, allowing for improved TDoA performance under adverse multipath conditions.
Received Signal Strength (RSS)
This guide has now discussed two lateration techniques (ToA and TDoA) that use elapsed time to measure distance. Lateration can also be performed by using received signal strength (RSS) in place of time. With this approach, RSS is measured by either the mobile device or the receiving sensor. Knowledge of the transmitter output power, cable losses, and antenna gains as well as the appropriate path loss model allows you to solve for the distance between the two stations.
The following is an example of a common path loss model used for indoor propagation at 2.4 GHz:
PL = PL1meter + 10log(Dn) + S
In this model:
• PL represents the total path loss experienced between the receiver and sender in dB.
• PL1meter represents the reference path loss in dB when the receiver-to-transmitter distance is 1 meter.
• D represents the distance between the transmitter and receiver in meters.
• n represents the path loss exponent for the environment.
• S represents the degree of shadow fading present in the environment in dB.
Path loss (PL) is the difference between transmitted power and received power, and represents the level of signal attenuation present because of the effects of free space propagation, reflection, diffraction, and scattering. The path loss exponent (n) is a function of frequency, environment, and obstructions. Commonly-used path loss exponents range from a value of 2 for open free space to values greater than 2 in environments where obstructions are present. At 2.4 GHz, for example, a typical path loss exponent for an indoor office environment is 3.3, and for a more dense home environment is 4.5.
S represents the degree of shadow fading associated with the environment. Indoor shadow fading varies depending on the number of obstructions present. In an environment with many partitions, walls, or other obstructions interfering with line of sight between the mobile device and each receiver, S may be in the range of ± 7dB and sometimes more.
Using the standard practice for calculating receiver signal strength given known quantities for transmit power, path, antenna, and cable losses, you have the following:
RXPWR = TXPWR – LossTX + GainTX – PL + GainRX – LossRX
Directly substituting the path loss model for PL in the equation above allows you to solve for distance D assuming all other variables are known:
where the meaning of the terms in the equation above are:
• RxPWR represents the detected receive signal strength in dB.
n GainLossSPLGainLossTXRXinvD RXRXmeterTXTXPWRPWR
10log 1
−−+−+−+−
=
12Wi-Fi Location-Based Services—Design and Deployment Considerations
OL-11612-01
Location Tracking Approaches
• TxPWR represents the transmitter output power in dB.
• LossTX represents the sum of all transmit-side cable and connector losses in dB.
• GainTX represents the transmit-side antenna gain in dBi.
• LossRX represents the sum of all receive-side cable and connector losses in dB.
• GainRX represents the receive-side antenna gain in dBi.
Solving for distance between the receiver and mobile device allows you to plot a circular area around the location of the receiver. The location of the mobile device is believed to be somewhere on this circular plot. As in other techniques, input from other receivers in other cells (in this case, signal strength information or RSSI) can be used to perform RSS tri-lateration or RSS multi-lateration to further refine location accuracy.
The signal strength information used to determine position can be obtained from one of two sources. Location positioning systems can determine position based on one of the following:
• The network infrastructure reporting the received signal strength at which it receives mobile device transmissions (“network-side”)
• The mobile device reporting the signal strength at which it receives transmissions from the network (“client-side”)
In 802.11 WLANs, the granularity with which RSSI is reported typically varies from radio vendor to radio vendor. In fact, 802.11 client devices produced by different silicon manufacturers may report received signal strength using inconsistent metrics. This can result in degraded and inconsistent location tracking performance.
To avoid this situation, there are two basic options:
• Deploy a location tracking solution that relies on “network-side” RSSI measurements.
Because most deployments of 802.11 WLANs are standardized on IEEE 802.11 access points from a single vendor, this is a very straightforward solution and is typically the solution most often chosen.
• Deploy a location tracking solution that relies on “client-side” RSSI measurements.
Because it is not practical to assume that every client device in an enterprise WLAN is from the same vendor, this option necessarily requires a means of providing “equalization” for each specific client hardware model from each vendors to some “reference” hardware model with which the location solution is designed to perform most accurately. For example, if positioning system software is designed to expect RSSI in a range from -127dBm to +127dBm in 254 1dBm increments, some level of mathematical equalization is required if some clients are capable of reporting RSSI in this format while others can only report RSSI in a range from -111dBm to +111 dBm in 74 3dBm increments. Typically, the responsibility for providing this means of equalizing RSSI reporting across one or more hardware vendors (and maintaining pace with the various new revisions of hardware that each major vendor produces) belongs to the location solution vendor.
To date, implementations using RSS lateration have enjoyed a cost advantage by not requiring specialized hardware at the mobile device or network infrastructure locations. This makes signal strength-based lateration techniques very attractive from a cost-performance standpoint to designers of 802.11-based WLAN systems wishing to offer integrated lateration-based positioning solutions. However, a known drawback to pure RSS lateration is that propagation anomalies brought about by anisotropic conditions in the environment may degrade accuracy significantly. This is because in reality, propagation in any cell is far from an ideal circular pattern based on an ideal path loss model. Signal levels vary significantly because of multipath, interference, occlusion, and attenuation. This is not typically taken into account when designing systems using “textbook” theoretical RSS lateration models in their purest form.
13Wi-Fi Location-Based Services—Design and Deployment Considerations
OL-11612-01
Location Tracking Approaches
Pure RSS-based lateration techniques that do not take additional steps to account for attenuation and multipath in the environment rarely produce acceptable results except in very controlled situations. This includes those controlled situations where there is always established clear line-of-sight between the mobile device and the receiving sensors, with little attenuation with which to be concerned other than free-space path loss (FPL) and little to no concern of multipath.
Angle-Based (Angulation) Techniques
Angle of Arrival (AoA)
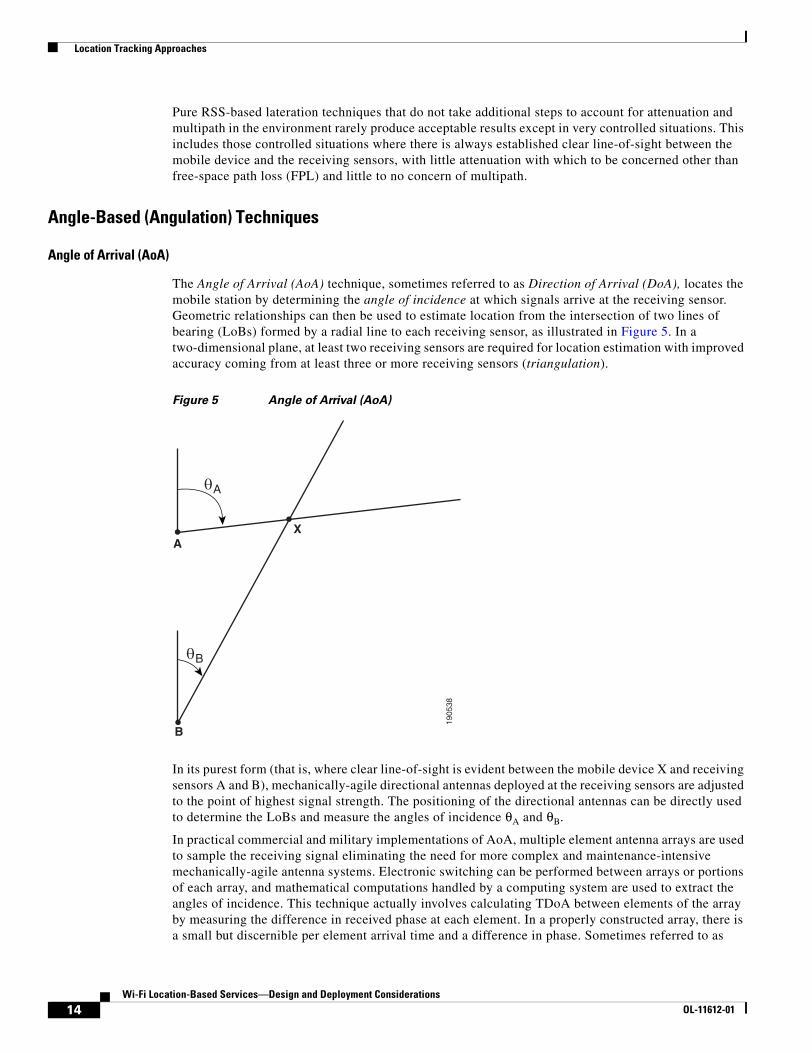
The Angle of Arrival (AoA) technique, sometimes referred to as Direction of Arrival (DoA), locates the mobile station by determining the angle of incidence at which signals arrive at the receiving sensor. Geometric relationships can then be used to estimate location from the intersection of two lines of bearing (LoBs) formed by a radial line to each receiving sensor, as illustrated in Figure 5. In a two-dimensional plane, at least two receiving sensors are required for location estimation with improved accuracy coming from at least three or more receiving sensors (triangulation).
Figure 5 Angle of Arrival (AoA)
In its purest form (that is, where clear line-of-sight is evident between the mobile device X and receiving sensors A and B), mechanically-agile directional antennas deployed at the receiving sensors are adjusted to the point of highest signal strength. The positioning of the directional antennas can be directly used to determine the LoBs and measure the angles of incidence θA and θB.
In practical commercial and military implementations of AoA, multiple element antenna arrays are used to sample the receiving signal eliminating the need for more complex and maintenance-intensive mechanically-agile antenna systems. Electronic switching can be performed between arrays or portions of each array, and mathematical computations handled by a computing system are used to extract the angles of incidence. This technique actually involves calculating TDoA between elements of the array by measuring the difference in received phase at each element. In a properly constructed array, there is a small but discernible per element arrival time and a difference in phase. Sometimes referred to as
1905
38
A
B
X
0A
0B
14Wi-Fi Location-Based Services—Design and Deployment Considerations
OL-11612-01
Location Tracking Approaches
“reverse beam-forming”, this technique involves directly measuring the arrival time of the signal at each element, computing the TDoA between array elements, and converting this information to an AoA measurement. This is made possible because of the fact that in beam-forming, the signal from each element is time-delayed (phase shifted) to “steer” the gain of the antenna array.
A well-known implementation of AoA is the VOR (VHF Omnidirectional Range) system used for aircraft navigation from 108.1 to 117.95 MHz. VOR beacons around the country transmit multiple VHF “radials” with each radial emanating at a different angle of incidence. The VOR receiver in an aircraft can determine the radial on which the aircraft is situated as it is approaching the VOR beacon and thus its angle of incidence with respect to the beacon. Using a minimum of two VOR beacons, the aircraft navigator is able to use onboard AoA ranging equipment to conduct angulation (or tri-angulation using three VOR beacons) and determine the position of the aircraft.
AoA techniques have also been applied in the cellular industry in early efforts to provide location tracking services for mobile phone users. This was primarily intended to comply with regulations requiring cell systems to report the location of a user placing an emergency (911) call. Multiple tower sites calculate the AoA of the signal of the cellular user, and use this information to perform tri-angulation. That information is relayed to switching processors that calculate the user location and convert the AoA data to latitude and longitude coordinates, which in turn is provided to emergency responder dispatch systems.
A common drawback that AoA shares with some of the other techniques mentioned is its susceptibility to multipath interference. As stated earlier, AoA works well in situations with direct line of sight, but suffers from decreased accuracy and precision when confronted with signal reflections from surrounding objects. Unfortunately, in dense urban areas, AoA becomes barely usable because line of sight to two or more base stations is seldom present. This also makes AoA not practical for deployment in most indoor environments.
Location Patterning (Pattern Recognition) Techniques
Location patterning refers to a technique that is based on the sampling and recording of radio signal behavior patterns in specific environments. Technically speaking, a location patterning solution does not require specialized hardware in either the mobile device or the receiving sensor (although at least one well-known location patterning-based RTLS requires proprietary RFID tags and software on each client device to enable “client-side” reporting of RSSI to its location positioning server). Location patterning may be implemented totally in software, which can reduce complexity and cost significantly compared to angulation or purely time-based lateration systems.
Location patterning techniques fundamentally assume the following:
• That each potential device location ideally possesses a distinctly unique RF “signature”. The closer reality is to this ideal, the better the performance of the location patterning solution.
• That each floor, building, or campus possesses unique signal propagation characteristics. Despite all efforts at identical equipment placement, no two floors, buildings, or campuses are truly identical from the perspective of a pattern recognition RTLS solution.
Although most commercially location patterning solutions typically base such signatures on received signal strength (RSSI), pattern recognition can be extended to include ToA, AoA or TDoA-based RF signatures as well. Deployment of patterning-based positioning systems can typically be divided into two phases:
• Calibration phase
• Operation phase
15Wi-Fi Location-Based Services—Design and Deployment Considerations
OL-11612-01
Location Tracking Approaches
Calibration Phase
During the calibration phase, data is accumulated by performing a walk-around of the target environment with a mobile device and allowing multiple receiving sensors (access points in the case of 802.11 WLANs) to sample the signal strength of the mobile device (this refers to a “network-side” implementation of location patterning).
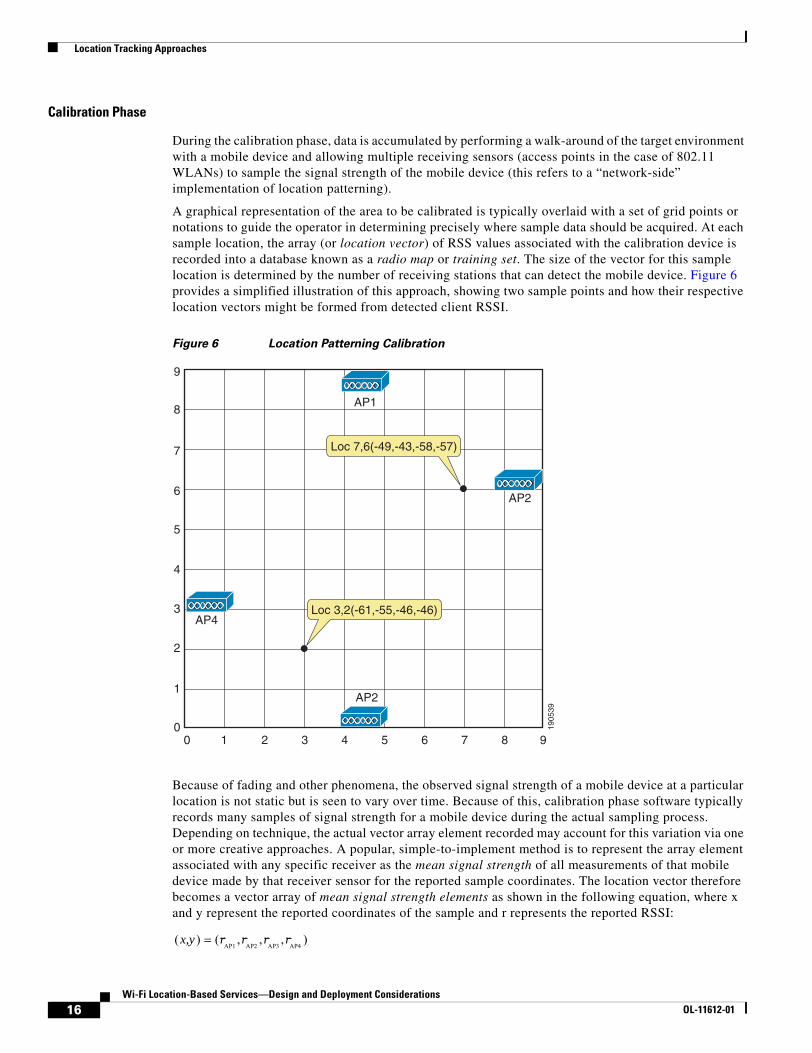
A graphical representation of the area to be calibrated is typically overlaid with a set of grid points or notations to guide the operator in determining precisely where sample data should be acquired. At each sample location, the array (or location vector) of RSS values associated with the calibration device is recorded into a database known as a radio map or training set. The size of the vector for this sample location is determined by the number of receiving stations that can detect the mobile device. Figure 6 provides a simplified illustration of this approach, showing two sample points and how their respective location vectors might be formed from detected client RSSI.
Figure 6 Location Patterning Calibration
Because of fading and other phenomena, the observed signal strength of a mobile device at a particular location is not static but is seen to vary over time. Because of this, calibration phase software typically records many samples of signal strength for a mobile device during the actual sampling process. Depending on technique, the actual vector array element recorded may account for this variation via one or more creative approaches. A popular, simple-to-implement method is to represent the array element associated with any specific receiver as the mean signal strength of all measurements of that mobile device made by that receiver sensor for the reported sample coordinates. The location vector therefore becomes a vector array of mean signal strength elements as shown in the following equation, where x and y represent the reported coordinates of the sample and r represents the reported RSSI:
00
1
2
3
4
5
6
7
8
9
1 2 3 4 5 6 7 8 9
1905
39
Loc 7,6(-49,-43,-58,-57)
Loc 3,2(-61,-55,-46,-46)
AP1
AP4
AP2
AP2
),,,()(AP4AP3AP2AP1
rrrrx,y =
16Wi-Fi Location-Based Services—Design and Deployment Considerations
OL-11612-01
Location Tracking Approaches
Operational Phase
In the operational phase, a group of receiving sensors provide signal strength measurements pertaining to a tracked mobile device (network-side reporting implementation) and forwards that information to a location tracking server. The location server uses a complex positioning algorithm and the radio map database to estimate the location of the mobile device. The server then reports the location estimate to the location client application requesting the positioning information.
Location patterning positioning algorithms can be classified into three basic groups:
• Deterministic algorithms attempt to find minimum statistical signal distance between a detected RSSI location vector and the location vectors of the various calibration sample points. This may or may not be equal to the minimum physical distance between the actual device physical location and the recorded location of the calibration sample. The sample point with the minimum statistical signal distance between itself and the detected location vector is generally regarded as the best raw location estimate contained in the calibration database. Examples of deterministic algorithms are those based on the computation of Euclidean, Manhattan, or Mahalanobis distances.
• Probabilistic algorithms use probability inferences to determine the likelihood of a particular location given that a particular location vector array has already been detected. The calibration database itself is considered as an a priori conditional probability distribution by the algorithm to determine the likelihood of a particular location occurrence. Examples of such approaches include those using Bayesian probability inferences.
• Other techniques go outside the boundaries of deterministic and probabilistic approaches. One such approach involves the assumption that location patterning is far too complex to be analyzed mathematically and requires the application of non-linear discriminant functions for classification (neural networks). Another technique, known as support vector modeling or SVM, is based on risk minimization and combines statistics, machine learning, and the principles of neural networks.
To gain insight into how such location patterning algorithms operate, a very simple example is provided of the use of a deterministic algorithm, the Euclidean distance. As stated earlier, deterministic algorithms compute the minimum statistical signal distance, which may or may not be equal to the minimum physical distance between the actual device physical location and the recorded location of the calibration sample.
For example, assume two access points X and Y and a mobile device Z. Access point X reports mobile device Z with an RSS sample of x1. Almost simultaneously, access point Y reports mobile device Z with an RSS sample of y1. These two RSS reports can be represented as location vector of (x1,y1). Assume that during the calibration phase, a large population of location vectors of the format F(x2,y2) were populated into the location server calibration database, where F represents the actual physical coordinates of the recorded location. The location server can calculate the Euclidean distance d between the currently reported location vector (x1,y1) and each location vector in the calibration radio map as follows:
The physical coordinates F associated with the database location vector possessing the minimum Euclidean distance from the reported location vector of the mobile device is generally regarded as being the correct estimate of the position of the mobile device.
In a similar fashion to RSS lateration solutions, real-time location systems using location patterning typically allow vendors to make good use of existing wireless infrastructure. This can often be an advantage over AoA, ToA, and TDoA approaches, depending on the particular implementation. Location patterning solutions are capable of providing very good performance in indoor environments, with a
212
212
)y(y)x(xd −+−=
17Wi-Fi Location-Based Services—Design and Deployment Considerations
OL-11612-01
Cisco Location-Based Services Architecture
minimum of three reporting receivers required to be in range of mobile devices at all times. Increased accuracy and performance (including exceeding 5 meters accuracy) is possible when six to ten receivers are in range of the mobile device.
Location patterning applications perform well when there are sufficient array entries per location vector to allow individual locations to be readily distinguishable by the positioning application. However, this requirement can also contribute to some less-than-desirable deployment characteristics. With location patterning, achieving high performance levels typically requires not only higher numbers of receivers (or access points for 802.11) but also much tighter spacing. In large areas where it is possible for clients to move about almost anywhere, calibration times can take significantly longer than in other approaches. For this reason, some commercial implementations of location patterning allow the user to segment the target location environment into areas where client movement is likely and those where client movement is possible but significantly less likely. The amount of calibration as well as computational resources allocated to these two classes of areas is adjusted by the positioning application according to the relative probability of a client being located there.
The radio maps or calibration databases used by pattern recognition positioning engines tend to be very specific to the campus, building, site, or floor, with little opportunity for re-use. The likelihood is very low that any two areas, no matter how identical they may seem in construction and layout, will yield identical calibration data sets. Because of this, it is not possible to use the same calibration data set for multiple floors of a high-rise office building, for example, because despite their similarity, the location vectors that are seen at similar positions on each floor will not be identical.
All other variables being equal, location patterning accuracy typically reaches its zenith immediately after a calibration. At that time, the information is very current and indicative of conditions within the environment. As time progresses and changes occur that affect RF propagation, accuracy degradation can be expected to degrade in accordance with the level of environmental change. For example, in an active logistics shipping and receiving area such as a large scale crossdocking facility, accuracy degradation of 20 percent can reasonably be expected in a thirty day period. Because calibration data maps degrade over time, if a high degree of consistent accuracy is necessary, location patterning solutions require periodic re-verification and possible re-calibration. For example, it is not unreasonable to expect to re-verify calibration data accuracy quarterly and to plan for a complete re-calibration semi-annually.
Cisco Location-Based Services Architecture
RF FingerprintingCisco RF Fingerprinting refers to a new and innovative approach that significantly improves the accuracy and precision of traditional signal strength lateration techniques. Cisco RF Fingerprinting offers the simplicity of an RSSI-based lateration approach with the customized calibration capabilities and indoor performance previously available only in location patterning solutions.
RF Fingerprinting significantly enhances RSS lateration by using RF propagation models developed from radio propagation data gathered directly from the target environment or environments very similar to it. RF Fingerprinting offers the ability to calibrate an RF model to a particular environment in a fashion similar to (but more expeditious than) that described for location patterning. However, unlike location patterning, a unique calibration is not always required, especially in situations where multiple floors of similar construction, contents, and layout are deployed. In these cases, a common RF model may apply and is the reason why several known office environment RF models (that is, drywall offices only and drywall offices combined with cubicles) are pre-packaged with the Cisco LBS solution. These
18Wi-Fi Location-Based Services—Design and Deployment Considerations
OL-11612-01
Cisco Location-Based Services Architecture
pre-packaged models enable calibration-less deployment in common office environments, which is a significant advantage over approaches such as location patterning, especially in cases where easy and rapid deployment is the primary concern.
In addition to the use of pre-packaged propagation models, RF Fingerprinting offers the ability to develop a customized propagation model that enhances the default path-loss models based on an on-site calibration phase. This process allows for the overall attenuation characteristics of the actual environment to be taken into consideration during the calculation of both 2.4 GHz and 5 GHz path loss exponents. For each calibration grid location, the physical location coordinates of the calibration client (provided by the calibration operator) are recorded along with the client RSSI from three or more LWAPP-enabled access points. This is performed until 150 location-to-access point measurements are recorded per band from 50 distinct locations in the target environment.
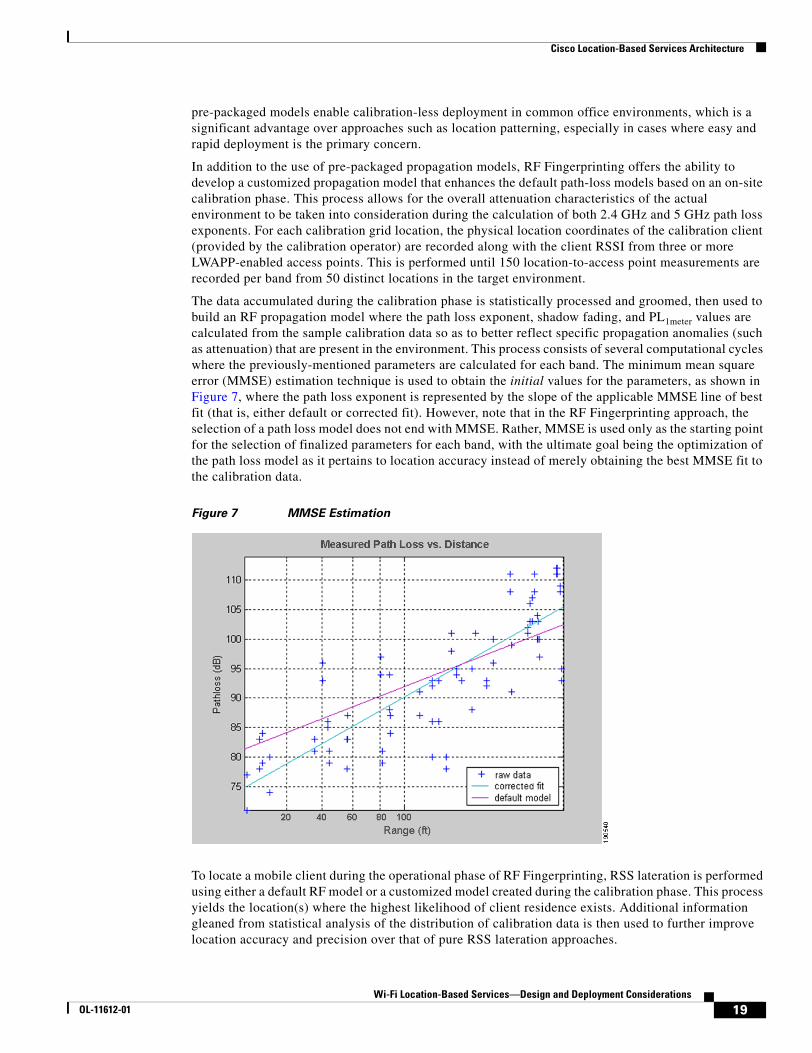
The data accumulated during the calibration phase is statistically processed and groomed, then used to build an RF propagation model where the path loss exponent, shadow fading, and PL1meter values are calculated from the sample calibration data so as to better reflect specific propagation anomalies (such as attenuation) that are present in the environment. This process consists of several computational cycles where the previously-mentioned parameters are calculated for each band. The minimum mean square error (MMSE) estimation technique is used to obtain the initial values for the parameters, as shown in Figure 7, where the path loss exponent is represented by the slope of the applicable MMSE line of best fit (that is, either default or corrected fit). However, note that in the RF Fingerprinting approach, the selection of a path loss model does not end with MMSE. Rather, MMSE is used only as the starting point for the selection of finalized parameters for each band, with the ultimate goal being the optimization of the path loss model as it pertains to location accuracy instead of merely obtaining the best MMSE fit to the calibration data.
Figure 7 MMSE Estimation
To locate a mobile client during the operational phase of RF Fingerprinting, RSS lateration is performed using either a default RF model or a customized model created during the calibration phase. This process yields the location(s) where the highest likelihood of client residence exists. Additional information gleaned from statistical analysis of the distribution of calibration data is then used to further improve location accuracy and precision over that of pure RSS lateration approaches.
19Wi-Fi Location-Based Services—Design and Deployment Considerations
OL-11612-01
Cisco Location-Based Services Architecture
Cisco RF Fingerprinting offers several key advantages over traditional approaches:
• Uses existing LWAPP-enabled Cisco Unified Networking Components—Unlike some other solutions, Cisco LBS with RF Fingerprinting is a 100 percent Wi-Fi RTLS without the need for specialized time-based receivers or other specialized hardware. The Cisco Location Appliance is added to support location and statistics history and serves as a centralized positioning engine for the simultaneous tracking of up to 2500 devices per appliance.
• No proprietary client hardware or software required—The Cisco RF Fingerprinting-based LBS solution is implemented as a network-side model and not client-side. Because of this, Cisco RF Fingerprinting can provide location tracking for a wide variety of industry-standard Wi-Fi clients (not just WinXP/2000/PPC) without the need to load proprietary client tracking software or wireless drivers in each client. This includes popular VoIP handsets such as the Cisco 7920 and others, devices for which proprietary location tracking client software is not readily available.
• Supports popular Wi-Fi active RFID asset tags—Because the Cisco LBS solution implements RF Fingerprinting as a network-side model, there is no dependency on proprietary software being resident in RFID asset tags. This enables the Cisco LBS solution to interoperate with active RFID asset tags from popular vendors including AeroScout and PanGo Networks. Cisco also makes available a complete RFID tag specification to Cisco Technology Partners and encourages the development of interoperable active RFID tag hardware. The Cisco LBS solution is capable of tracking other Wi-Fi active RFID tags that can be configured to authenticate/associate to the underlying installed Cisco centralized WLAN infrastructure as a WLAN client.
• Better accuracy and precision—The Cisco RF Fingerprinting approach yields significantly better performance than solutions employing pure triangulation or RSS lateration techniques. These techniques typically do not account for effects of attenuation in the environment, making them highly susceptible to reductions in performance. The advantages of Cisco RF Fingerprinting technology start where these traditional approaches leave off. Cisco RF Fingerprinting begins with a significantly better understanding of RF propagation as it relates specifically to the environment in question. With the exception of the calibration phase in location patterning, none of the traditional lateration or angulation approaches discussed in Distance-Based (Lateration) Techniques, page 8 and Angle-Based (Angulation) Techniques, page 14 take environmental considerations directly into account in this manner. RF Fingerprinting then goes a step further, by applying statistical analysis techniques to the set of collected calibration data. This allows the Cisco Location Appliance to further refine predicted location possibilities for mobile clients, culling out illogical or improbable possibilities and refining accuracy. The net result of these efforts is not only better accuracy but significantly improved precision over traditional solutions.
• Reduced calibration effort—The Cisco RF Fingerprinting technology offers the key advantages of an indoor location patterning solution but with significantly less effort required for system calibration. Although both solutions support on-site calibration, the Cisco RF Fingerprinting approach offers less frequent re-calibration and can operate with a larger inter-access point spacing than location patterning solutions. Cisco RF Fingerprinting can also share RF models among similar types of environments and includes pre-packaged calibration models that can facilitate rapid deployment in typical indoor office environments.
Overall Solution ArchitectureThe overall architecture of the Cisco LBS solution can be seen in Figure 8:
20Wi-Fi Location-Based Services—Design and Deployment Considerations
OL-11612-01
Cisco Location-Based Services Architecture
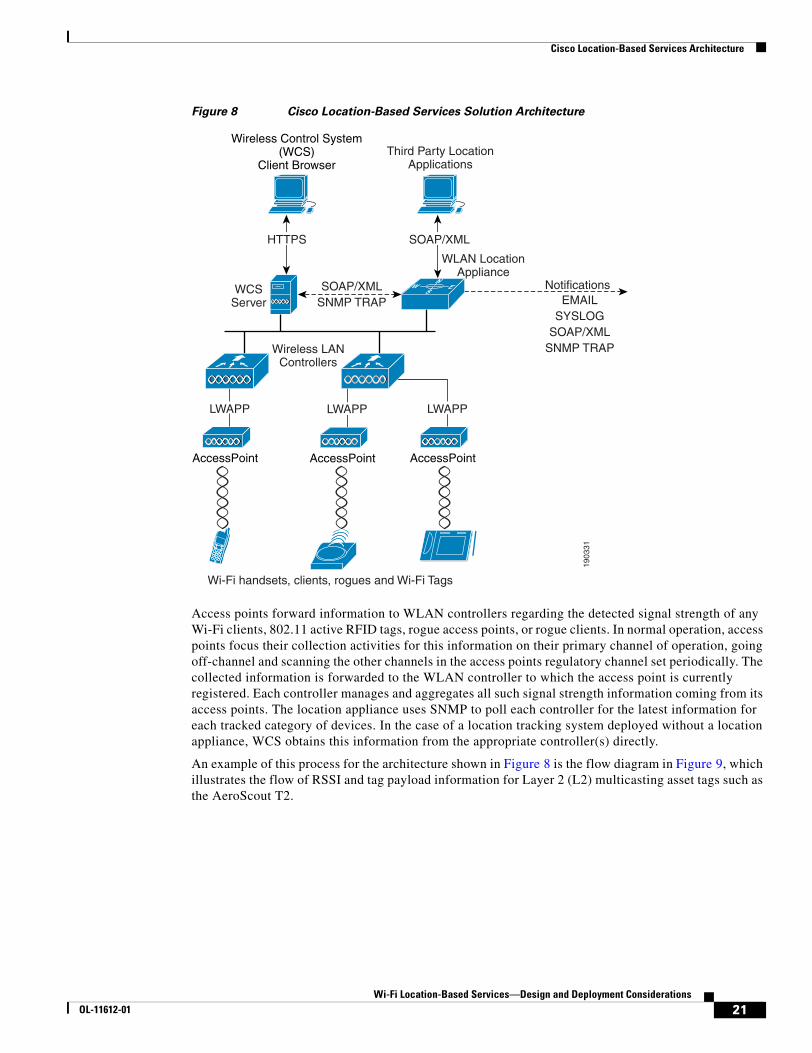
Figure 8 Cisco Location-Based Services Solution Architecture
Access points forward information to WLAN controllers regarding the detected signal strength of any Wi-Fi clients, 802.11 active RFID tags, rogue access points, or rogue clients. In normal operation, access points focus their collection activities for this information on their primary channel of operation, going off-channel and scanning the other channels in the access points regulatory channel set periodically. The collected information is forwarded to the WLAN controller to which the access point is currently registered. Each controller manages and aggregates all such signal strength information coming from its access points. The location appliance uses SNMP to poll each controller for the latest information for each tracked category of devices. In the case of a location tracking system deployed without a location appliance, WCS obtains this information from the appropriate controller(s) directly.
An example of this process for the architecture shown in Figure 8 is the flow diagram in Figure 9, which illustrates the flow of RSSI and tag payload information for Layer 2 (L2) multicasting asset tags such as the AeroScout T2.
1903
31
Wireless Control System(WCS)
Client Browser
NW E
S
AccessPoint
Third Party LocationApplications
WCSServer
WLAN LocationAppliance
SOAP/XMLSNMP TRAP
NotificationsEMAIL
SYSLOGSOAP/XML
SNMP TRAP
AccessPoint AccessPoint
Wi-Fi handsets, clients, rogues and Wi-Fi Tags
HTTPS SOAP/XML
LWAPP LWAPP LWAPP
Wireless LANControllers
21Wi-Fi Location-Based Services—Design and Deployment Considerations
OL-11612-01
Cisco Location-Based Services Architecture
Figure 9 Information Flow for Asset Tag RSSI Data
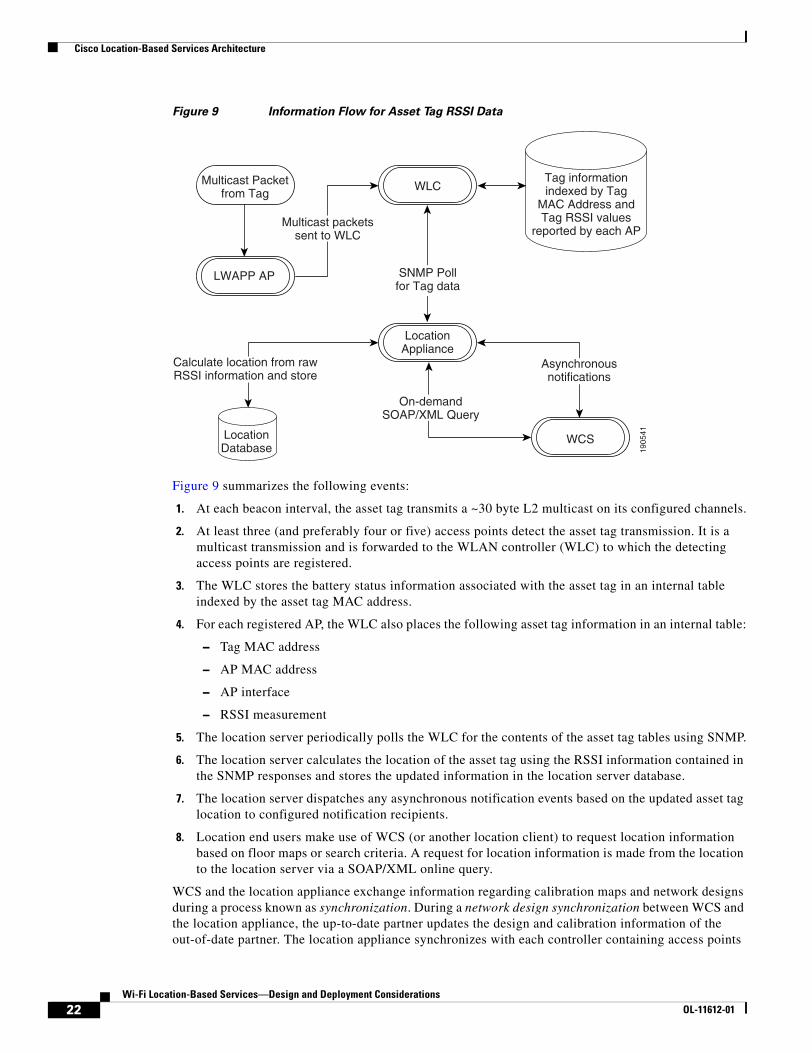
Figure 9 summarizes the following events:
1. At each beacon interval, the asset tag transmits a ~30 byte L2 multicast on its configured channels.
2. At least three (and preferably four or five) access points detect the asset tag transmission. It is a multicast transmission and is forwarded to the WLAN controller (WLC) to which the detecting access points are registered.
3. The WLC stores the battery status information associated with the asset tag in an internal table indexed by the asset tag MAC address.
4. For each registered AP, the WLC also places the following asset tag information in an internal table:
– Tag MAC address
– AP MAC address
– AP interface
– RSSI measurement
5. The location server periodically polls the WLC for the contents of the asset tag tables using SNMP.
6. The location server calculates the location of the asset tag using the RSSI information contained in the SNMP responses and stores the updated information in the location server database.
7. The location server dispatches any asynchronous notification events based on the updated asset tag location to configured notification recipients.
8. Location end users make use of WCS (or another location client) to request location information based on floor maps or search criteria. A request for location information is made from the location to the location server via a SOAP/XML online query.
WCS and the location appliance exchange information regarding calibration maps and network designs during a process known as synchronization. During a network design synchronization between WCS and the location appliance, the up-to-date partner updates the design and calibration information of the out-of-date partner. The location appliance synchronizes with each controller containing access points
1905
41
Multicast Packetfrom Tag
WLCTag informationindexed by Tag
MAC Address andTag RSSI values
reported by each AP
LWAPP AP
LocationAppliance
LocationDatabase
WCS
Multicast packetssent to WLC
SNMP Pollfor Tag data
Calculate location from rawRSSI information and store
On-demandSOAP/XML Query
Asynchronousnotifications
22Wi-Fi Location-Based Services—Design and Deployment Considerations
OL-11612-01

Cisco Location-Based Services Architecture
participating in location tracking during controller synchronization. Synchronization occurs either on-demand or as a scheduled task, the timing of which is determined by the Administration > Scheduled Tasks main menu option under the Cisco Wireless Control System (WCS).
Location information is displayed to the end user using a location client application in conjunction with the Cisco Wireless Location Appliance. Typically this role is fulfilled by the Cisco WCS, which, as is explained in subsequent sections of this document, is capable of displaying a wide multitude of information regarding the location of clients, asset tags, rogue access points, and rogue clients.
Note For important information regarding compatibility between versions of WCS and the Cisco Wireless Location Appliance, see “Release Notes for Cisco Wireless Location Appliance” at the following URL: http://www.cisco.com/en/US/products/ps6386/prod_release_note09186a00806b5ec7.html.
Location client functionality is not limited to the WCS, because other third-party applications written in accordance with the Cisco Location Appliance Application Programming Interface (API) and using the SOAP/XML protocol can also serve as a location client to the Wireless Location Appliance (as shown in Figure 8). The Cisco Location Appliance is also capable of issuing notifications to external systems via email (SMTP), syslog, SNMP traps, or the SOAP/XML protocol. These notifications can be issued depending on the occurrence of a variety of events, as is discussed in subsequent sections of this document.
Role of the Location ApplianceWhen a Cisco Location Appliance is added to a Cisco LWAPP-enabled Unified Wireless Network with a location-enabled WCS, the location appliance assumes responsibility for several important tasks. Key among these are the execution of positioning algorithms, maintenance of calibration information, triggering and dispatch of location notifications, and the ongoing processing of historical location and statistics information. WCS acts in concert with the location appliance by serving as the user interface (UI) for the services provided by the location appliance. Although it is possible to access the location appliance directly via SSH or a console session, all end user interaction with the location appliance is typically via WCS or a third-party location client application (except for initial setup of the location appliance and whenever it is necessary to quiesce the appliance).
The integration of a Cisco Location Appliance into a Cisco Unified Wireless Network architecture immediately enables improvements in the location capabilities of the network, such as the following:
• Scalability—Adding a Cisco Location Appliance greatly increases the scalability of the Cisco LBS solution from on-demand tracking of a single device to a maximum capacity of 2500 devices (WLAN clients, RFID tags, rogue access points, and rogue clients). For deployments requiring support of a greater number of devices, additional location appliances can be deployed and managed under a common WCS.
• Historical and statistics trending—The appliance records and maintains historical location and statistics information, which is available for viewing via WCS.
• Location notifications—The Cisco Location Appliance can dispatch location-based event notifications via email (SMTP), syslog, SNMP traps, and SOAP/XML directly to specified destinations. These notifications can be triggered simply if the client or asset location changes, strays beyond set distances from pre-determined marker locations, or otherwise becomes missing or enters/leaves coverage areas. Notifications can also be generated for asset tag battery levels (that is, low battery notification).
23Wi-Fi Location-Based Services—Design and Deployment Considerations
OL-11612-01
Cisco Location-Based Services Architecture
• SOAP/XML Location Application Programming Interface (API)—The Location Appliance API allows customers and partners to create customized location-based programs that interface with the Cisco Wireless Location Appliance. These programs can be developed to support a variety of unique and innovative applications including real-time location-based data retrieval, telemetric device management, workflow automation, enhanced WLAN security, and people or device tracking. The API provides a mechanism for inserting, retrieving, updating, and removing data from the Cisco Wireless Location Appliance configuration database using a SOAP/XML interface. Developers can access the Cisco Wireless Location Appliance provisioning services using XML and exchange data in XML format. The location appliance API is available and licensable to the Cisco development community along with tools to facilitate solution development. Integration support is available via the Cisco Developer Services Program, a subscription-based service.
Note For complete details, see the following URL: http://www.cisco.com/go/developersupport.
Location Tracking without a Location Appliance
To use any RF Fingerprinting-based location tracking solutions in a Cisco LWAPP-based wireless LAN, a version of WCS that is licensed for use with the Cisco Wireless Location Server is required. When a location appliance is not used as part of the solution, RF Fingerprinting location tracking services are available only as an on-demand service and only for a single device at a time. In addition, there is no historical trending of data nor any capability to interface to external third-party applications via the SOAP/XML API without the use of a location appliance.
If only base WCS functionality has been licensed (WCS-Base), WCS provides a basic set of location services that does not employ RF Fingerprinting for localization. In this case, on-demand location for a single device is performed based on the access point that is detecting the mobile device with the highest signal strength (see Cell of Origin, page 7 and Figure 2). The Cisco Wireless Location Appliance cannot be used with WCS when only base WCS functionality has been licensed (WCS must be licensed for location, otherwise referred to as WCS-Location).
Further information regarding the basic location capabilities of WCS can be found in the “WLAN Management” chapter of the Cisco Unified Wireless Network Solutions Design Guide v3.0.
Solution Performance
The Meaning of Accuracy and Precision
For most users, the performance metric having the most familiarity and significance is accuracy, which typically refers to the quality of the information you are receiving. Location accuracy refers specifically to the quantifiable error distance between the estimated location and the actual location of the mobile device.
In most real-world applications, however, a statement of location accuracy has little value without the ability of the solution to repeatedly and reliably perform at this level. Precision is a direct measure reflecting on the reproducibility of the stated location accuracy. Any indication of location accuracy should therefore include an indication of the confidence interval or percentage of successful location detection as well, otherwise known as the location precision.
24Wi-Fi Location-Based Services—Design and Deployment Considerations
OL-11612-01
Cisco Location-Based Services Architecture
Accuracy and Precision of the Cisco LBS Solution
With proper deployment according to the best practices outlined both in this white paper as well as those contained within the documents referenced in Reference Publications, page 5, the accuracy and precision of the Cisco LBS solution in indoor deployments is represented as follows:
• Accuracy of less than or equal to 10 meters, with 90 percent precision
• Accuracy of less than or equal to 5 meters, with 50 percent precision
In other words, given proper design and deployment of the system, the error distance between the reported device location and the actual location should, in 90 percent of all reporting instances, be 10 meters or less. In the remaining 10 percent of all reporting instances, the error distance may be expected to exceed 10 meters. Note that these specifications apply only to solutions using RF Fingerprinting; namely, the use of a WCS licensed for location usage (with or without a location appliance).
For applications that require better performance than an accuracy of 10 meters with 90 percent precision, the Cisco LBS solution can deliver accuracy of 5 meters or less but with 50 percent precision. Stated another way, in 50 percent of all reporting instances, it can be reasonably expected that the error distance between the reported and the actual location exceeds 5 meters. The location inspection tool can display various levels of accuracy and precision from 2 m to 100 m along with which areas of your environment can meet these accuracy levels. The location inspection tool is discussed in Inspecting Location Quality, page 78.
Which Devices Can Be Tracked
WLAN Clients
WLAN clients or Wi-Fi 802.11 active RFID tags that are probing and are associated or attempting association with your location-aware LWAPP enabled wireless LAN infrastructure can be tracked with the Cisco LBS solution. This includes asset tags such as PanGo Locator LAN RFID tags.
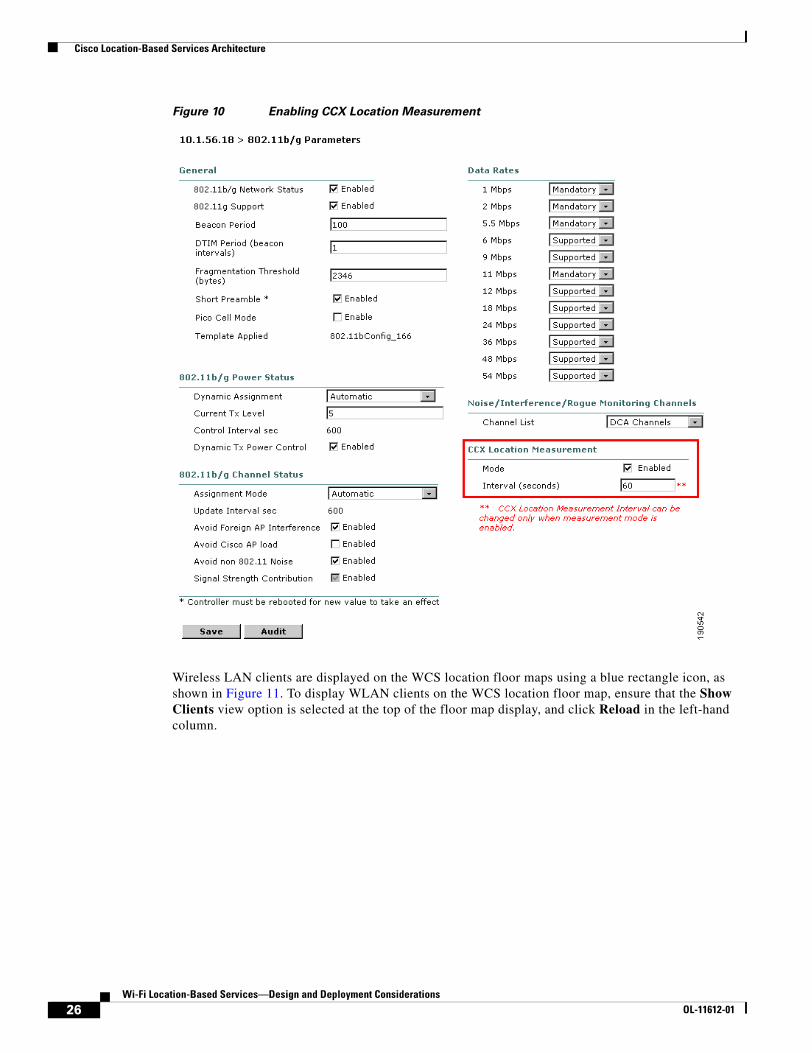
Keep in mind that client behavior has a significant impact on the ability of the location appliance to provide accurate location tracking. The more consistent the client is in transmitting probe responses, the better the ability of the system to provide accurate location tracking. If a client suspends transmitting probe requests across all channels, or transmits them at abnormally low or abnormally high power, location accuracy can be degraded. One way of minimizing exposure to this type of unpredictable client behavior is to standardize on clients that have been certified as complying with the client CCX specification version 2 or better, and enabling the use of CCX Location Measurement on all controllers, as shown in Figure 10. Enabling CCX Location Measurement enables access points to transmit broadcast messages that cause CCX clients to reliably transmit probe requests, facilitating the ability of the system to accurately track these devices in a consistent fashion.
25Wi-Fi Location-Based Services—Design and Deployment Considerations
OL-11612-01
Cisco Location-Based Services Architecture
Figure 10 Enabling CCX Location Measurement
Wireless LAN clients are displayed on the WCS location floor maps using a blue rectangle icon, as shown in Figure 11. To display WLAN clients on the WCS location floor map, ensure that the Show Clients view option is selected at the top of the floor map display, and click Reload in the left-hand column.
26Wi-Fi Location-Based Services—Design and Deployment Considerations
OL-11612-01
Cisco Location-Based Services Architecture
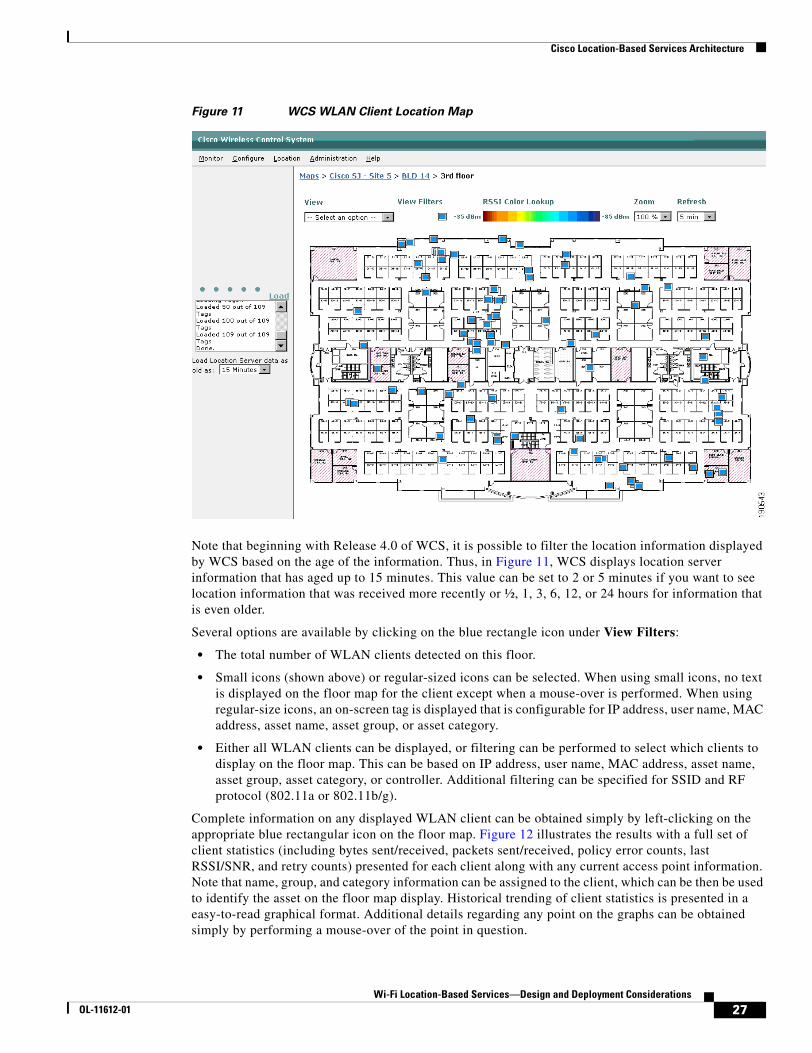
Figure 11 WCS WLAN Client Location Map
Note that beginning with Release 4.0 of WCS, it is possible to filter the location information displayed by WCS based on the age of the information. Thus, in Figure 11, WCS displays location server information that has aged up to 15 minutes. This value can be set to 2 or 5 minutes if you want to see location information that was received more recently or ½, 1, 3, 6, 12, or 24 hours for information that is even older.
Several options are available by clicking on the blue rectangle icon under View Filters:
• The total number of WLAN clients detected on this floor.
• Small icons (shown above) or regular-sized icons can be selected. When using small icons, no text is displayed on the floor map for the client except when a mouse-over is performed. When using regular-size icons, an on-screen tag is displayed that is configurable for IP address, user name, MAC address, asset name, asset group, or asset category.
• Either all WLAN clients can be displayed, or filtering can be performed to select which clients to display on the floor map. This can be based on IP address, user name, MAC address, asset name, asset group, asset category, or controller. Additional filtering can be specified for SSID and RF protocol (802.11a or 802.11b/g).
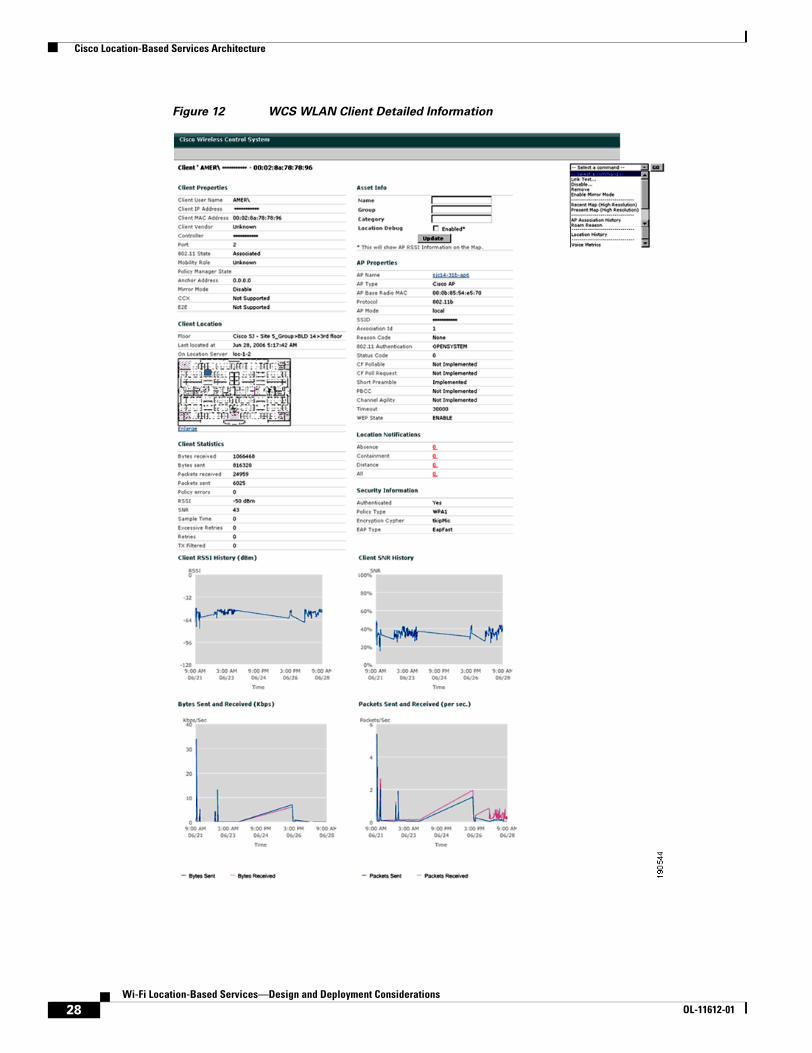
Complete information on any displayed WLAN client can be obtained simply by left-clicking on the appropriate blue rectangular icon on the floor map. Figure 12 illustrates the results with a full set of client statistics (including bytes sent/received, packets sent/received, policy error counts, last RSSI/SNR, and retry counts) presented for each client along with any current access point information. Note that name, group, and category information can be assigned to the client, which can be then be used to identify the asset on the floor map display. Historical trending of client statistics is presented in a easy-to-read graphical format. Additional details regarding any point on the graphs can be obtained simply by performing a mouse-over of the point in question.
27Wi-Fi Location-Based Services—Design and Deployment Considerations
OL-11612-01
Cisco Location-Based Services Architecture
Figure 12 WCS WLAN Client Detailed Information
28Wi-Fi Location-Based Services—Design and Deployment Considerations
OL-11612-01
Cisco Location-Based Services Architecture
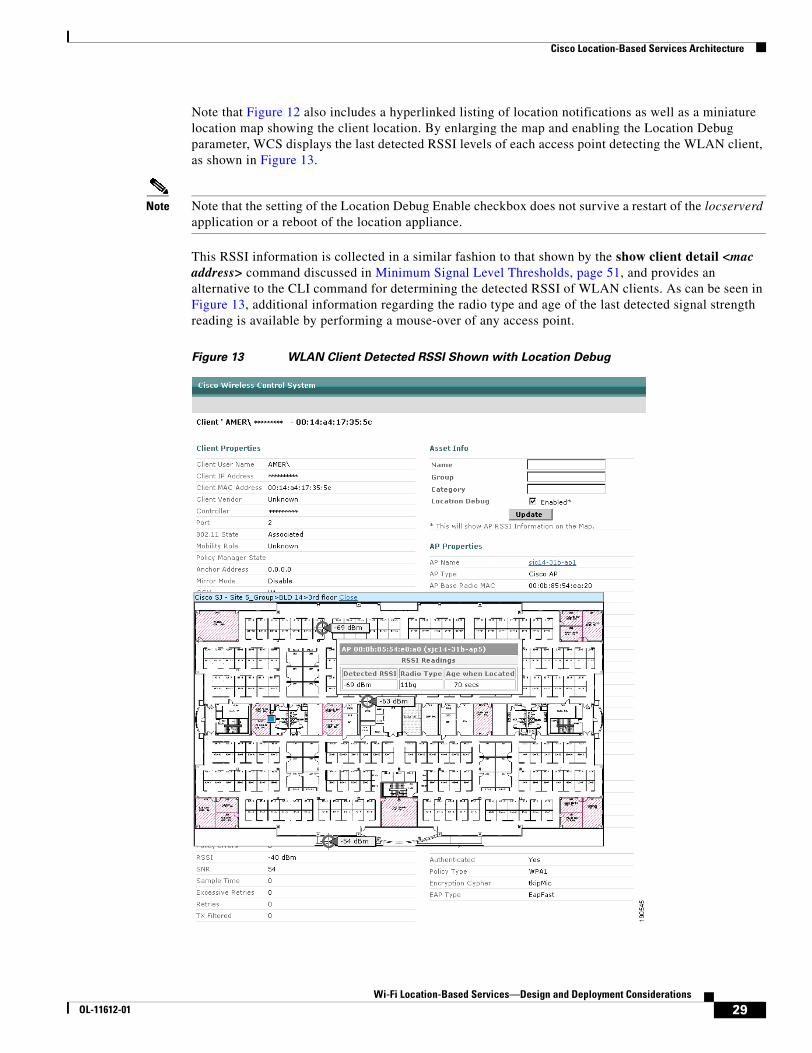
Note that Figure 12 also includes a hyperlinked listing of location notifications as well as a miniature location map showing the client location. By enlarging the map and enabling the Location Debug parameter, WCS displays the last detected RSSI levels of each access point detecting the WLAN client, as shown in Figure 13.
Note Note that the setting of the Location Debug Enable checkbox does not survive a restart of the locserverd application or a reboot of the location appliance.
This RSSI information is collected in a similar fashion to that shown by the show client detail <mac address> command discussed in Minimum Signal Level Thresholds, page 51, and provides an alternative to the CLI command for determining the detected RSSI of WLAN clients. As can be seen in Figure 13, additional information regarding the radio type and age of the last detected signal strength reading is available by performing a mouse-over of any access point.
Figure 13 WLAN Client Detected RSSI Shown with Location Debug
29Wi-Fi Location-Based Services—Design and Deployment Considerations
OL-11612-01
Cisco Location-Based Services Architecture
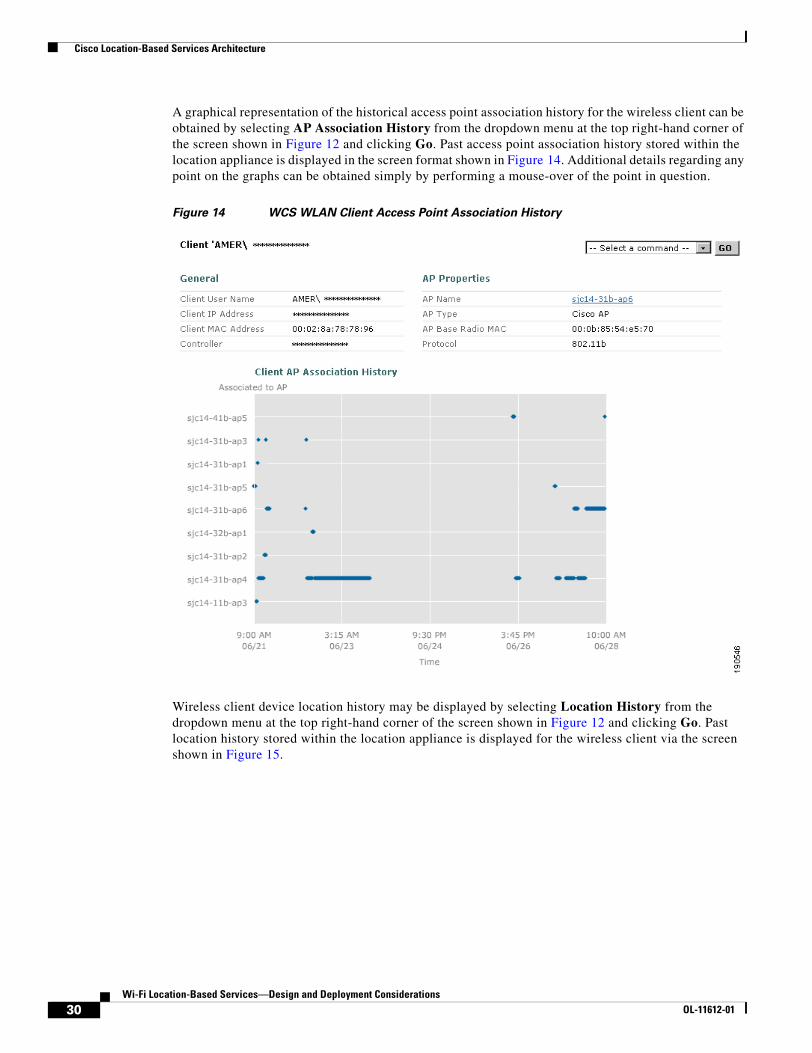
A graphical representation of the historical access point association history for the wireless client can be obtained by selecting AP Association History from the dropdown menu at the top right-hand corner of the screen shown in Figure 12 and clicking Go. Past access point association history stored within the location appliance is displayed in the screen format shown in Figure 14. Additional details regarding any point on the graphs can be obtained simply by performing a mouse-over of the point in question.
Figure 14 WCS WLAN Client Access Point Association History
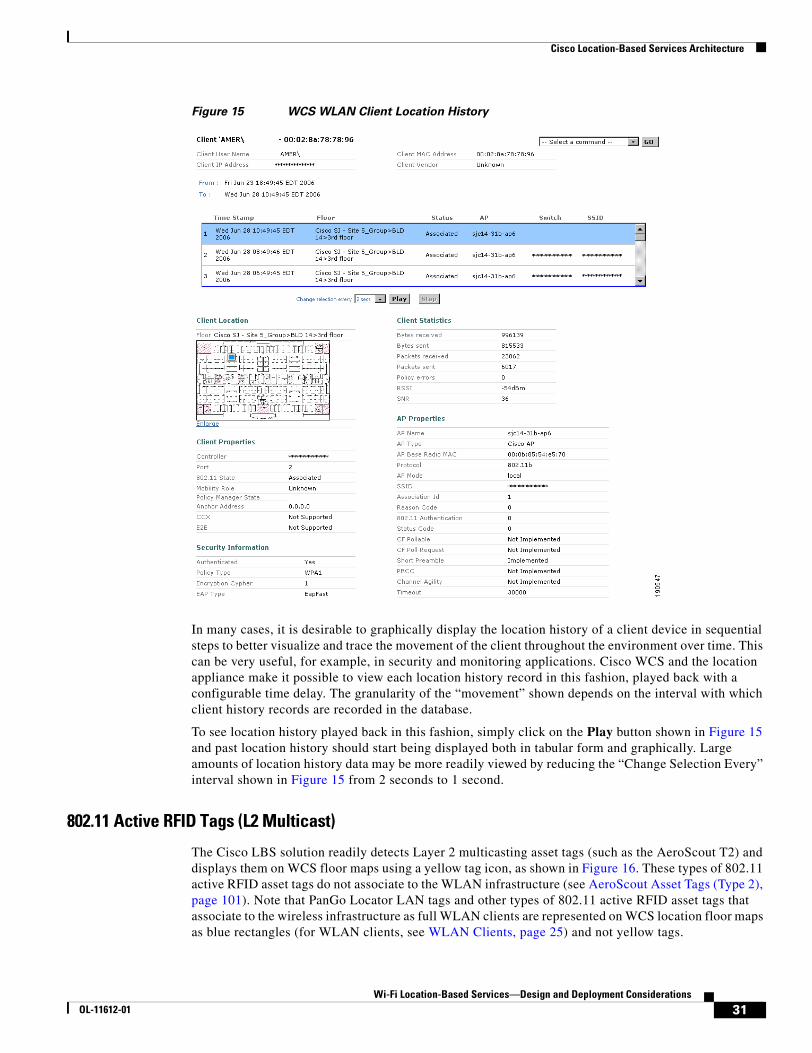
Wireless client device location history may be displayed by selecting Location History from the dropdown menu at the top right-hand corner of the screen shown in Figure 12 and clicking Go. Past location history stored within the location appliance is displayed for the wireless client via the screen shown in Figure 15.
30Wi-Fi Location-Based Services—Design and Deployment Considerations
OL-11612-01
Cisco Location-Based Services Architecture
Figure 15 WCS WLAN Client Location History
In many cases, it is desirable to graphically display the location history of a client device in sequential steps to better visualize and trace the movement of the client throughout the environment over time. This can be very useful, for example, in security and monitoring applications. Cisco WCS and the location appliance make it possible to view each location history record in this fashion, played back with a configurable time delay. The granularity of the “movement” shown depends on the interval with which client history records are recorded in the database.
To see location history played back in this fashion, simply click on the Play button shown in Figure 15 and past location history should start being displayed both in tabular form and graphically. Large amounts of location history data may be more readily viewed by reducing the “Change Selection Every” interval shown in Figure 15 from 2 seconds to 1 second.
802.11 Active RFID Tags (L2 Multicast)
The Cisco LBS solution readily detects Layer 2 multicasting asset tags (such as the AeroScout T2) and displays them on WCS floor maps using a yellow tag icon, as shown in Figure 16. These types of 802.11 active RFID asset tags do not associate to the WLAN infrastructure (see AeroScout Asset Tags (Type 2), page 101). Note that PanGo Locator LAN tags and other types of 802.11 active RFID asset tags that associate to the wireless infrastructure as full WLAN clients are represented on WCS location floor maps as blue rectangles (for WLAN clients, see WLAN Clients, page 25) and not yellow tags.
31Wi-Fi Location-Based Services—Design and Deployment Considerations
OL-11612-01
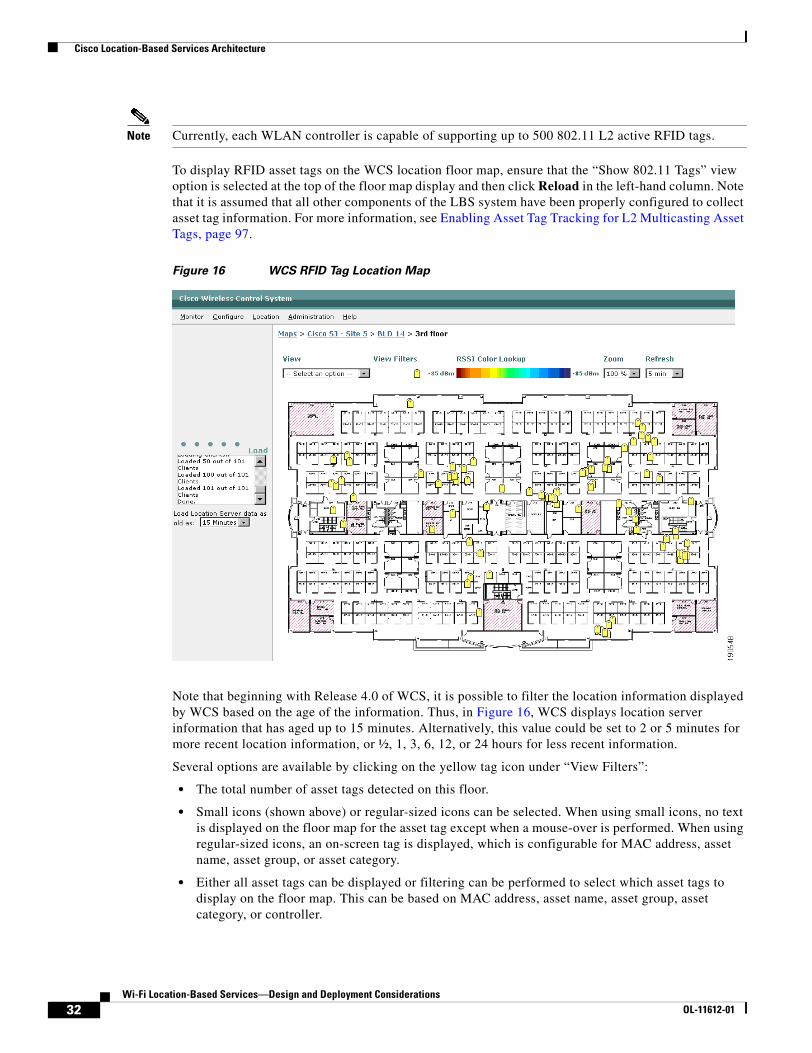
Cisco Location-Based Services Architecture
Note Currently, each WLAN controller is capable of supporting up to 500 802.11 L2 active RFID tags.
To display RFID asset tags on the WCS location floor map, ensure that the “Show 802.11 Tags” view option is selected at the top of the floor map display and then click Reload in the left-hand column. Note that it is assumed that all other components of the LBS system have been properly configured to collect asset tag information. For more information, see Enabling Asset Tag Tracking for L2 Multicasting Asset Tags, page 97.
Figure 16 WCS RFID Tag Location Map
Note that beginning with Release 4.0 of WCS, it is possible to filter the location information displayed by WCS based on the age of the information. Thus, in Figure 16, WCS displays location server information that has aged up to 15 minutes. Alternatively, this value could be set to 2 or 5 minutes for more recent location information, or ½, 1, 3, 6, 12, or 24 hours for less recent information.
Several options are available by clicking on the yellow tag icon under “View Filters”:
• The total number of asset tags detected on this floor.
• Small icons (shown above) or regular-sized icons can be selected. When using small icons, no text is displayed on the floor map for the asset tag except when a mouse-over is performed. When using regular-sized icons, an on-screen tag is displayed, which is configurable for MAC address, asset name, asset group, or asset category.
• Either all asset tags can be displayed or filtering can be performed to select which asset tags to display on the floor map. This can be based on MAC address, asset name, asset group, asset category, or controller.
32Wi-Fi Location-Based Services—Design and Deployment Considerations
OL-11612-01
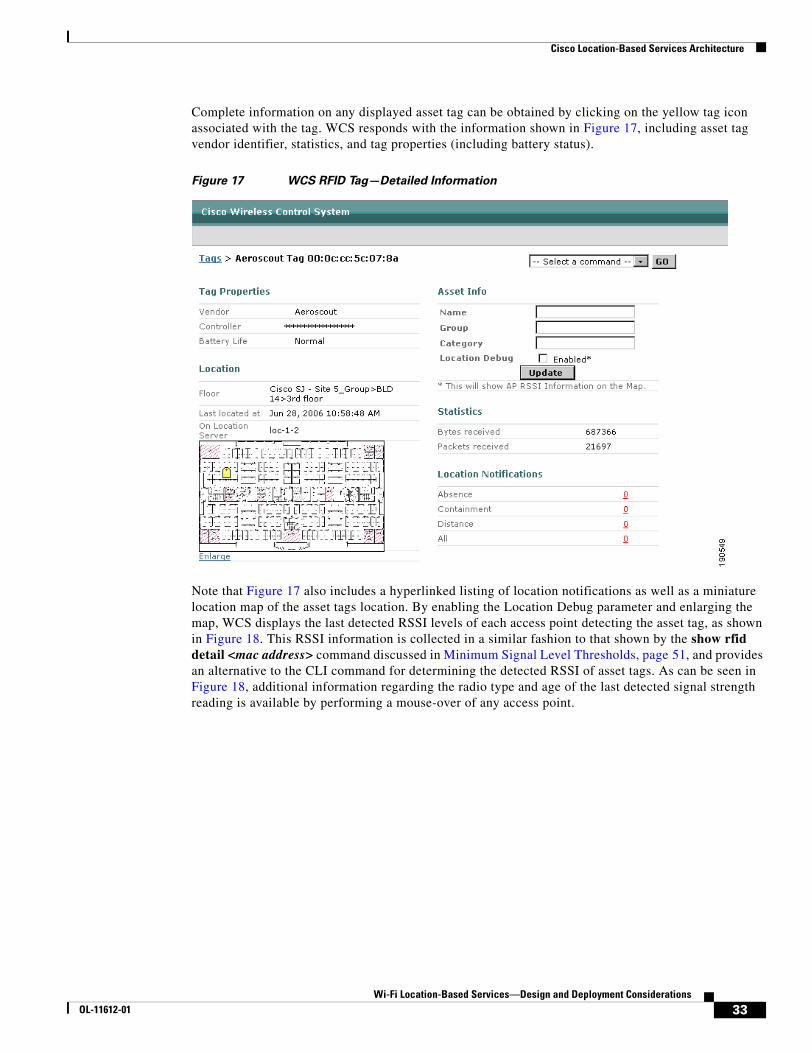
Cisco Location-Based Services Architecture
Complete information on any displayed asset tag can be obtained by clicking on the yellow tag icon associated with the tag. WCS responds with the information shown in Figure 17, including asset tag vendor identifier, statistics, and tag properties (including battery status).
Figure 17 WCS RFID Tag—Detailed Information
Note that Figure 17 also includes a hyperlinked listing of location notifications as well as a miniature location map of the asset tags location. By enabling the Location Debug parameter and enlarging the map, WCS displays the last detected RSSI levels of each access point detecting the asset tag, as shown in Figure 18. This RSSI information is collected in a similar fashion to that shown by the show rfid detail <mac address> command discussed in Minimum Signal Level Thresholds, page 51, and provides an alternative to the CLI command for determining the detected RSSI of asset tags. As can be seen in Figure 18, additional information regarding the radio type and age of the last detected signal strength reading is available by performing a mouse-over of any access point.
33Wi-Fi Location-Based Services—Design and Deployment Considerations
OL-11612-01
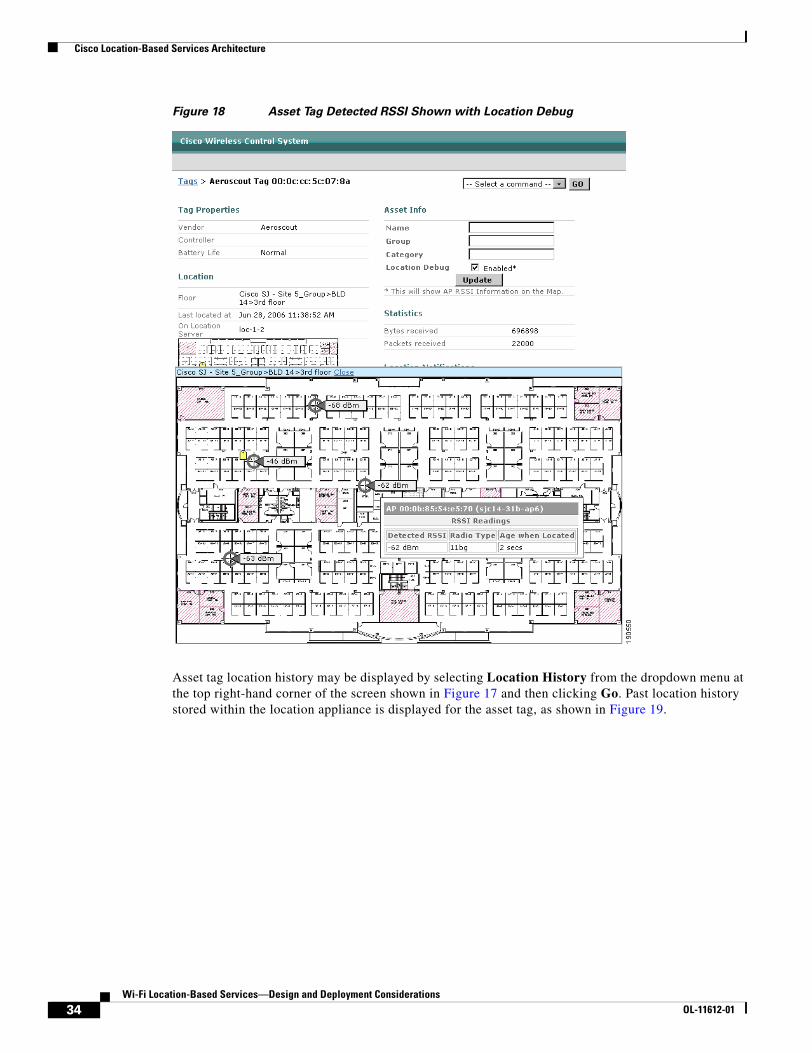
Cisco Location-Based Services Architecture
Figure 18 Asset Tag Detected RSSI Shown with Location Debug
Asset tag location history may be displayed by selecting Location History from the dropdown menu at the top right-hand corner of the screen shown in Figure 17 and then clicking Go. Past location history stored within the location appliance is displayed for the asset tag, as shown in Figure 19.
34Wi-Fi Location-Based Services—Design and Deployment Considerations
OL-11612-01
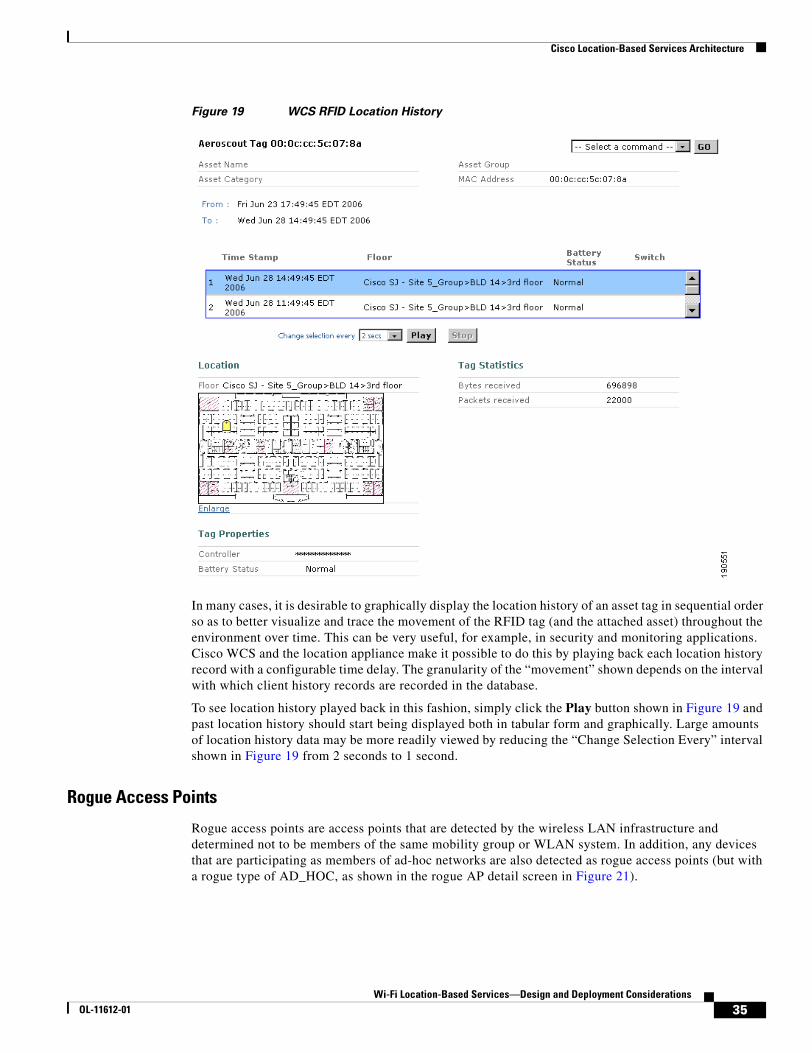
Cisco Location-Based Services Architecture
Figure 19 WCS RFID Location History
In many cases, it is desirable to graphically display the location history of an asset tag in sequential order so as to better visualize and trace the movement of the RFID tag (and the attached asset) throughout the environment over time. This can be very useful, for example, in security and monitoring applications. Cisco WCS and the location appliance make it possible to do this by playing back each location history record with a configurable time delay. The granularity of the “movement” shown depends on the interval with which client history records are recorded in the database.
To see location history played back in this fashion, simply click the Play button shown in Figure 19 and past location history should start being displayed both in tabular form and graphically. Large amounts of location history data may be more readily viewed by reducing the “Change Selection Every” interval shown in Figure 19 from 2 seconds to 1 second.
Rogue Access Points
Rogue access points are access points that are detected by the wireless LAN infrastructure and determined not to be members of the same mobility group or WLAN system. In addition, any devices that are participating as members of ad-hoc networks are also detected as rogue access points (but with a rogue type of AD_HOC, as shown in the rogue AP detail screen in Figure 21).
35Wi-Fi Location-Based Services—Design and Deployment Considerations
OL-11612-01
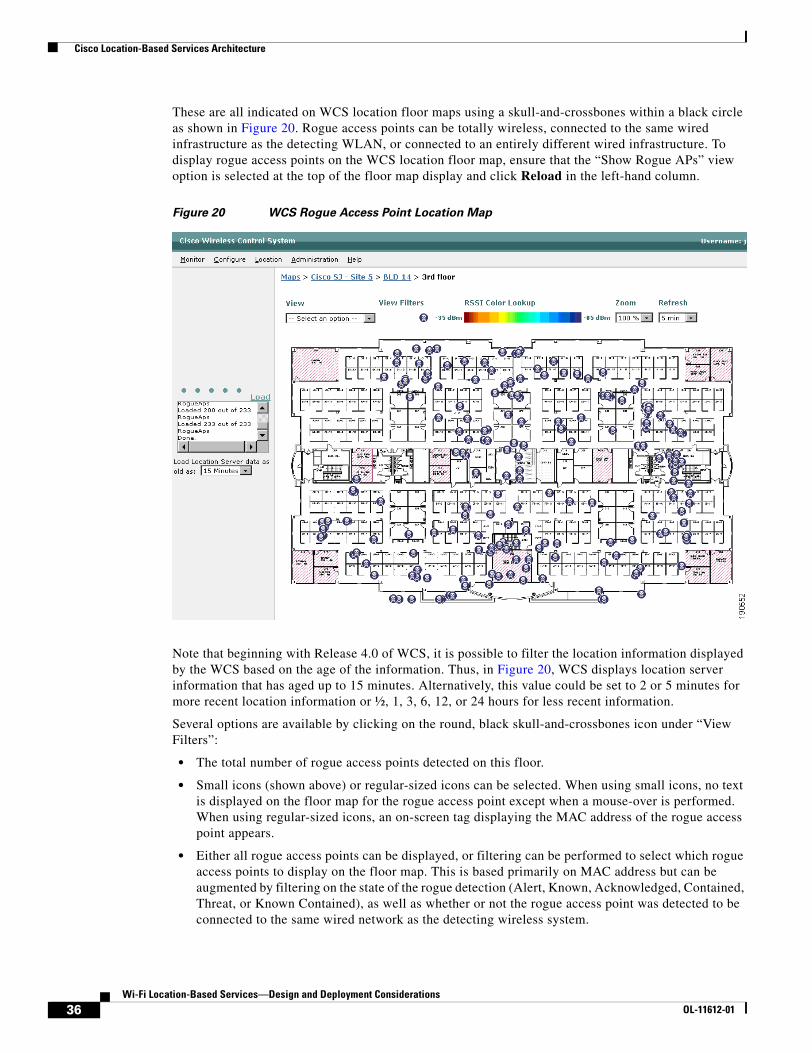
Cisco Location-Based Services Architecture
These are all indicated on WCS location floor maps using a skull-and-crossbones within a black circle as shown in Figure 20. Rogue access points can be totally wireless, connected to the same wired infrastructure as the detecting WLAN, or connected to an entirely different wired infrastructure. To display rogue access points on the WCS location floor map, ensure that the “Show Rogue APs” view option is selected at the top of the floor map display and click Reload in the left-hand column.
Figure 20 WCS Rogue Access Point Location Map
Note that beginning with Release 4.0 of WCS, it is possible to filter the location information displayed by the WCS based on the age of the information. Thus, in Figure 20, WCS displays location server information that has aged up to 15 minutes. Alternatively, this value could be set to 2 or 5 minutes for more recent location information or ½, 1, 3, 6, 12, or 24 hours for less recent information.
Several options are available by clicking on the round, black skull-and-crossbones icon under “View Filters”:
• The total number of rogue access points detected on this floor.
• Small icons (shown above) or regular-sized icons can be selected. When using small icons, no text is displayed on the floor map for the rogue access point except when a mouse-over is performed. When using regular-sized icons, an on-screen tag displaying the MAC address of the rogue access point appears.
• Either all rogue access points can be displayed, or filtering can be performed to select which rogue access points to display on the floor map. This is based primarily on MAC address but can be augmented by filtering on the state of the rogue detection (Alert, Known, Acknowledged, Contained, Threat, or Known Contained), as well as whether or not the rogue access point was detected to be connected to the same wired network as the detecting wireless system.
36Wi-Fi Location-Based Services—Design and Deployment Considerations
OL-11612-01
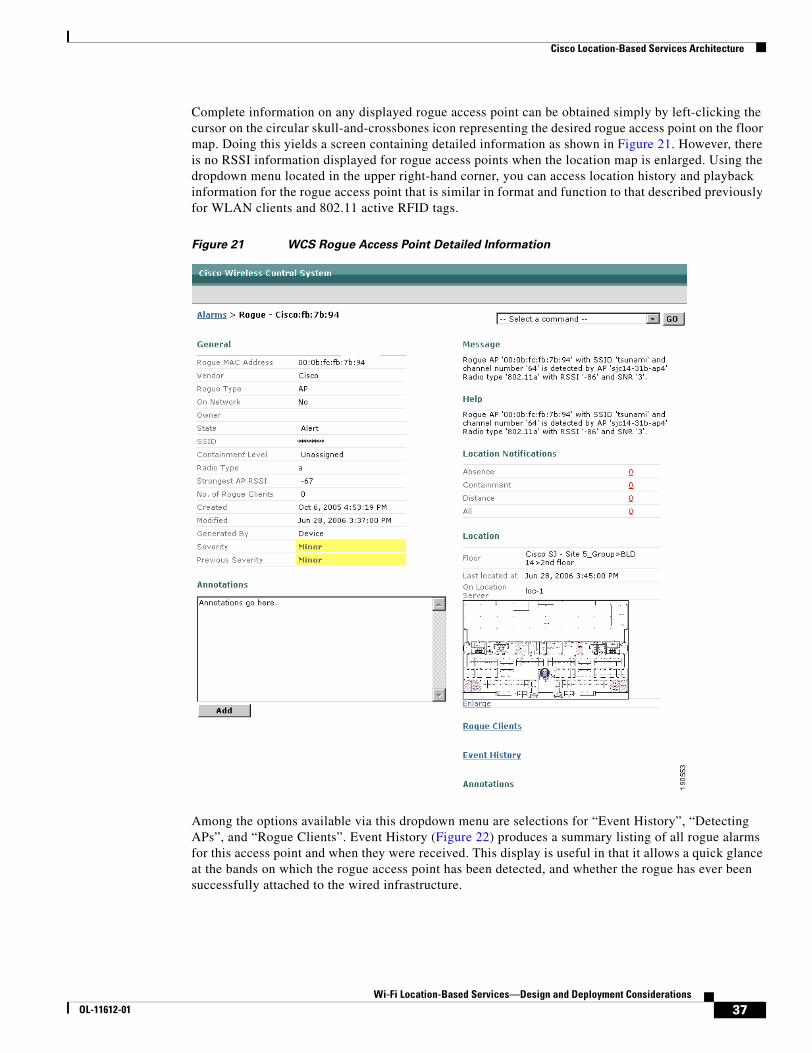
Cisco Location-Based Services Architecture
Complete information on any displayed rogue access point can be obtained simply by left-clicking the cursor on the circular skull-and-crossbones icon representing the desired rogue access point on the floor map. Doing this yields a screen containing detailed information as shown in Figure 21. However, there is no RSSI information displayed for rogue access points when the location map is enlarged. Using the dropdown menu located in the upper right-hand corner, you can access location history and playback information for the rogue access point that is similar in format and function to that described previously for WLAN clients and 802.11 active RFID tags.
Figure 21 WCS Rogue Access Point Detailed Information
Among the options available via this dropdown menu are selections for “Event History”, “Detecting APs”, and “Rogue Clients”. Event History (Figure 22) produces a summary listing of all rogue alarms for this access point and when they were received. This display is useful in that it allows a quick glance at the bands on which the rogue access point has been detected, and whether the rogue has ever been successfully attached to the wired infrastructure.
37Wi-Fi Location-Based Services—Design and Deployment Considerations
OL-11612-01
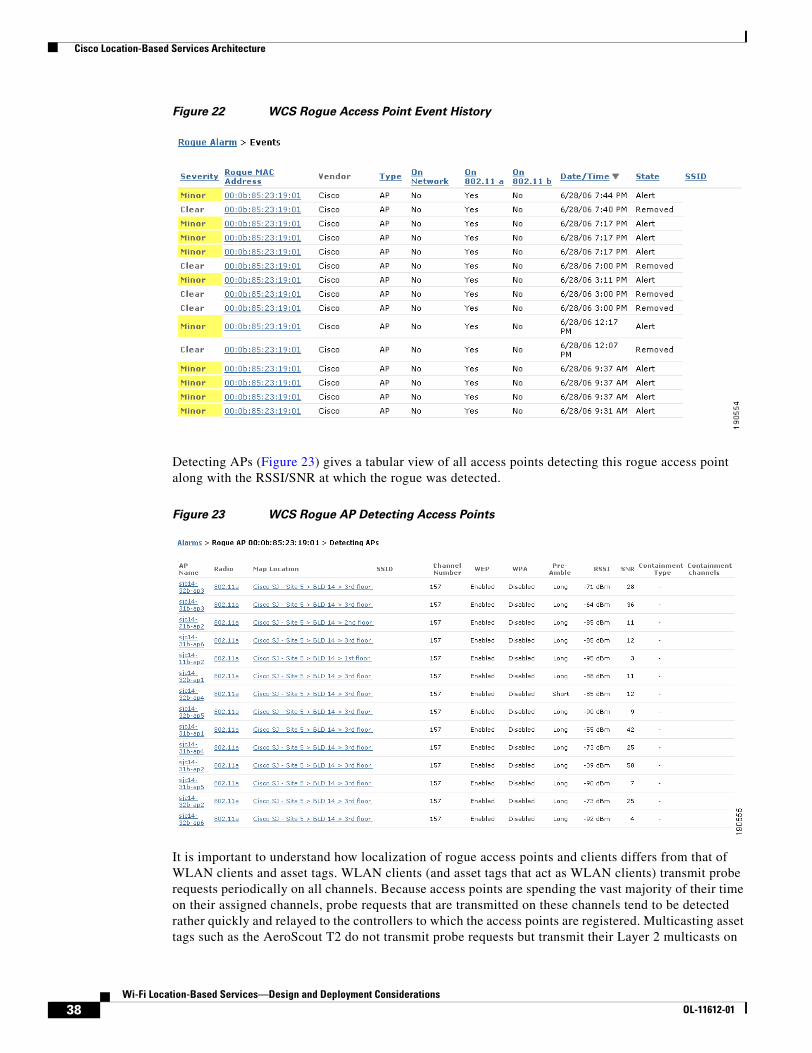
Cisco Location-Based Services Architecture
Figure 22 WCS Rogue Access Point Event History
Detecting APs (Figure 23) gives a tabular view of all access points detecting this rogue access point along with the RSSI/SNR at which the rogue was detected.
Figure 23 WCS Rogue AP Detecting Access Points
It is important to understand how localization of rogue access points and clients differs from that of WLAN clients and asset tags. WLAN clients (and asset tags that act as WLAN clients) transmit probe requests periodically on all channels. Because access points are spending the vast majority of their time on their assigned channels, probe requests that are transmitted on these channels tend to be detected rather quickly and relayed to the controllers to which the access points are registered. Multicasting asset tags such as the AeroScout T2 do not transmit probe requests but transmit their Layer 2 multicasts on
38Wi-Fi Location-Based Services—Design and Deployment Considerations
OL-11612-01
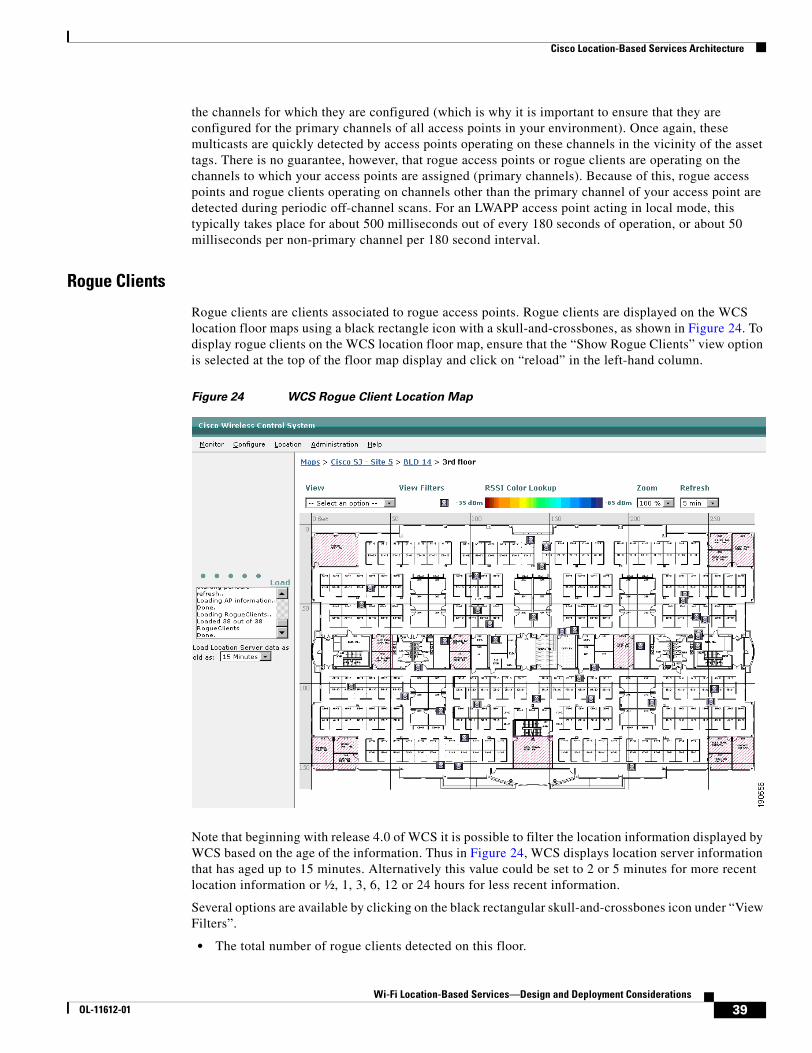
Cisco Location-Based Services Architecture
the channels for which they are configured (which is why it is important to ensure that they are configured for the primary channels of all access points in your environment). Once again, these multicasts are quickly detected by access points operating on these channels in the vicinity of the asset tags. There is no guarantee, however, that rogue access points or rogue clients are operating on the channels to which your access points are assigned (primary channels). Because of this, rogue access points and rogue clients operating on channels other than the primary channel of your access point are detected during periodic off-channel scans. For an LWAPP access point acting in local mode, this typically takes place for about 500 milliseconds out of every 180 seconds of operation, or about 50 milliseconds per non-primary channel per 180 second interval.
Rogue Clients
Rogue clients are clients associated to rogue access points. Rogue clients are displayed on the WCS location floor maps using a black rectangle icon with a skull-and-crossbones, as shown in Figure 24. To display rogue clients on the WCS location floor map, ensure that the “Show Rogue Clients” view option is selected at the top of the floor map display and click on “reload” in the left-hand column.
Figure 24 WCS Rogue Client Location Map
Note that beginning with release 4.0 of WCS it is possible to filter the location information displayed by WCS based on the age of the information. Thus in Figure 24, WCS displays location server information that has aged up to 15 minutes. Alternatively this value could be set to 2 or 5 minutes for more recent location information or ½, 1, 3, 6, 12 or 24 hours for less recent information.
Several options are available by clicking on the black rectangular skull-and-crossbones icon under “View Filters”.
• The total number of rogue clients detected on this floor.
39Wi-Fi Location-Based Services—Design and Deployment Considerations
OL-11612-01
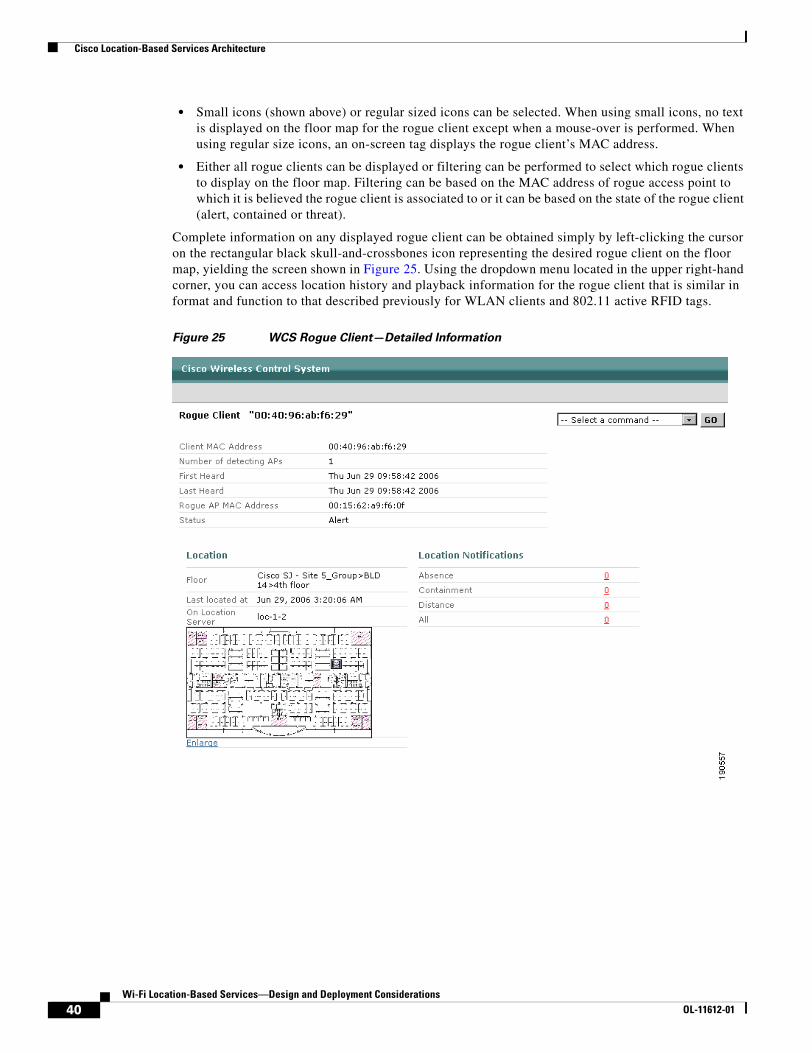
Cisco Location-Based Services Architecture
• Small icons (shown above) or regular sized icons can be selected. When using small icons, no text is displayed on the floor map for the rogue client except when a mouse-over is performed. When using regular size icons, an on-screen tag displays the rogue client’s MAC address.
• Either all rogue clients can be displayed or filtering can be performed to select which rogue clients to display on the floor map. Filtering can be based on the MAC address of rogue access point to which it is believed the rogue client is associated to or it can be based on the state of the rogue client (alert, contained or threat).
Complete information on any displayed rogue client can be obtained simply by left-clicking the cursor on the rectangular black skull-and-crossbones icon representing the desired rogue client on the floor map, yielding the screen shown in Figure 25. Using the dropdown menu located in the upper right-hand corner, you can access location history and playback information for the rogue client that is similar in format and function to that described previously for WLAN clients and 802.11 active RFID tags.
Figure 25 WCS Rogue Client—Detailed Information
40Wi-Fi Location-Based Services—Design and Deployment Considerations
OL-11612-01
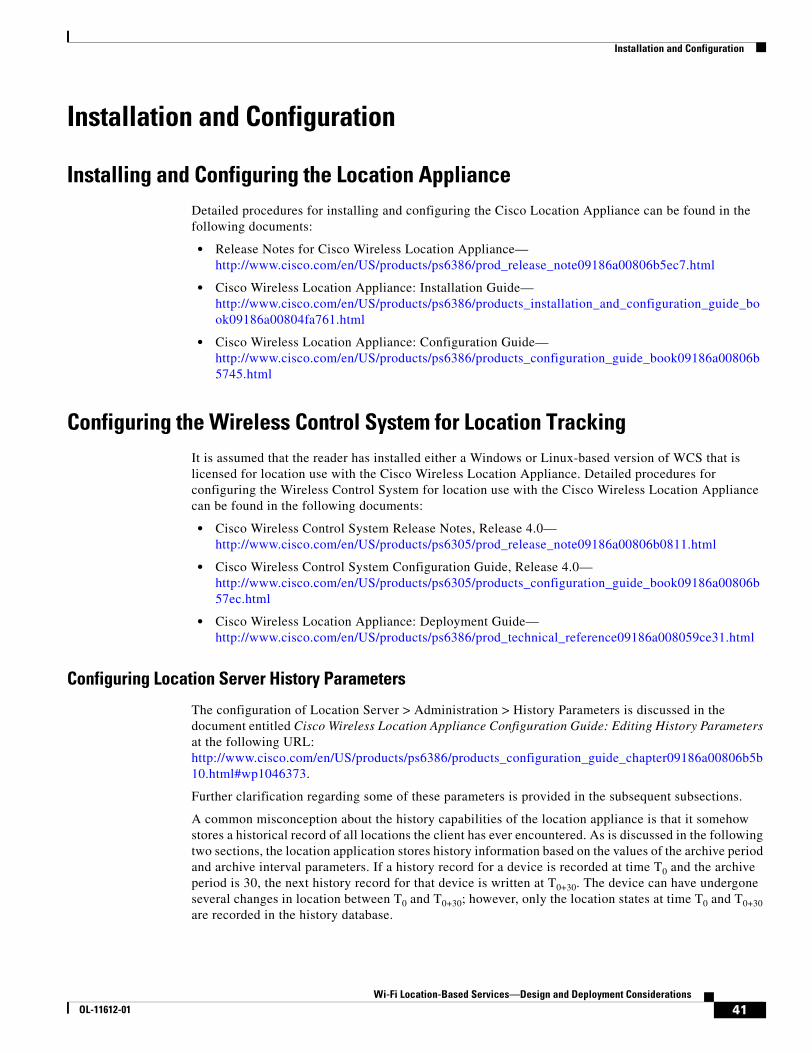
Installation and Configuration
Installation and Configuration
Installing and Configuring the Location ApplianceDetailed procedures for installing and configuring the Cisco Location Appliance can be found in the following documents:
• Release Notes for Cisco Wireless Location Appliance— http://www.cisco.com/en/US/products/ps6386/prod_release_note09186a00806b5ec7.html
• Cisco Wireless Location Appliance: Installation Guide— http://www.cisco.com/en/US/products/ps6386/products_installation_and_configuration_guide_book09186a00804fa761.html
• Cisco Wireless Location Appliance: Configuration Guide— http://www.cisco.com/en/US/products/ps6386/products_configuration_guide_book09186a00806b5745.html
Configuring the Wireless Control System for Location TrackingIt is assumed that the reader has installed either a Windows or Linux-based version of WCS that is licensed for location use with the Cisco Wireless Location Appliance. Detailed procedures for configuring the Wireless Control System for location use with the Cisco Wireless Location Appliance can be found in the following documents:
• Cisco Wireless Control System Release Notes, Release 4.0— http://www.cisco.com/en/US/products/ps6305/prod_release_note09186a00806b0811.html
• Cisco Wireless Control System Configuration Guide, Release 4.0— http://www.cisco.com/en/US/products/ps6305/products_configuration_guide_book09186a00806b57ec.html
• Cisco Wireless Location Appliance: Deployment Guide— http://www.cisco.com/en/US/products/ps6386/prod_technical_reference09186a008059ce31.html
Configuring Location Server History Parameters
The configuration of Location Server > Administration > History Parameters is discussed in the document entitled Cisco Wireless Location Appliance Configuration Guide: Editing History Parameters at the following URL: http://www.cisco.com/en/US/products/ps6386/products_configuration_guide_chapter09186a00806b5b10.html#wp1046373.
Further clarification regarding some of these parameters is provided in the subsequent subsections.
A common misconception about the history capabilities of the location appliance is that it somehow stores a historical record of all locations the client has ever encountered. As is discussed in the following two sections, the location application stores history information based on the values of the archive period and archive interval parameters. If a history record for a device is recorded at time T0 and the archive period is 30, the next history record for that device is written at T0+30. The device can have undergone several changes in location between T0 and T0+30; however, only the location states at time T0 and T0+30 are recorded in the history database.
41Wi-Fi Location-Based Services—Design and Deployment Considerations
OL-11612-01
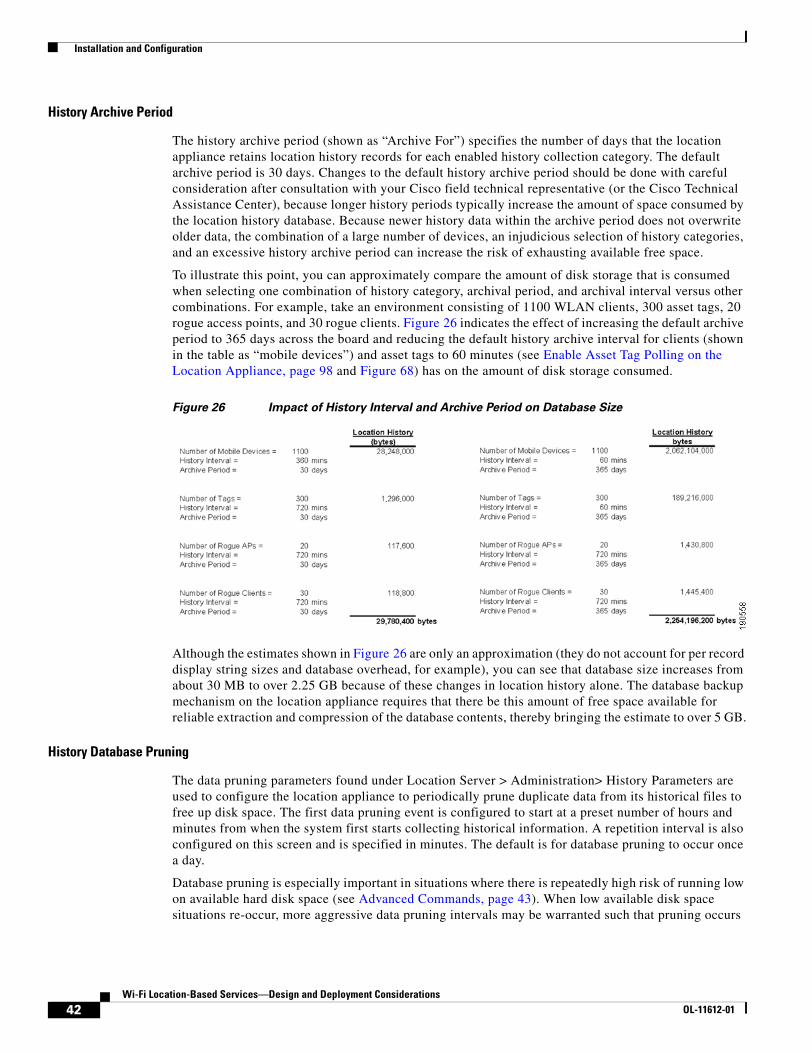
Installation and Configuration
History Archive Period
The history archive period (shown as “Archive For”) specifies the number of days that the location appliance retains location history records for each enabled history collection category. The default archive period is 30 days. Changes to the default history archive period should be done with careful consideration after consultation with your Cisco field technical representative (or the Cisco Technical Assistance Center), because longer history periods typically increase the amount of space consumed by the location history database. Because newer history data within the archive period does not overwrite older data, the combination of a large number of devices, an injudicious selection of history categories, and an excessive history archive period can increase the risk of exhausting available free space.
To illustrate this point, you can approximately compare the amount of disk storage that is consumed when selecting one combination of history category, archival period, and archival interval versus other combinations. For example, take an environment consisting of 1100 WLAN clients, 300 asset tags, 20 rogue access points, and 30 rogue clients. Figure 26 indicates the effect of increasing the default archive period to 365 days across the board and reducing the default history archive interval for clients (shown in the table as “mobile devices”) and asset tags to 60 minutes (see Enable Asset Tag Polling on the Location Appliance, page 98 and Figure 68) has on the amount of disk storage consumed.
Figure 26 Impact of History Interval and Archive Period on Database Size
Although the estimates shown in Figure 26 are only an approximation (they do not account for per record display string sizes and database overhead, for example), you can see that database size increases from about 30 MB to over 2.25 GB because of these changes in location history alone. The database backup mechanism on the location appliance requires that there be this amount of free space available for reliable extraction and compression of the database contents, thereby bringing the estimate to over 5 GB.
History Database Pruning
The data pruning parameters found under Location Server > Administration> History Parameters are used to configure the location appliance to periodically prune duplicate data from its historical files to free up disk space. The first data pruning event is configured to start at a preset number of hours and minutes from when the system first starts collecting historical information. A repetition interval is also configured on this screen and is specified in minutes. The default is for database pruning to occur once a day.
Database pruning is especially important in situations where there is repeatedly high risk of running low on available hard disk space (see Advanced Commands, page 43). When low available disk space situations re-occur, more aggressive data pruning intervals may be warranted such that pruning occurs
42Wi-Fi Location-Based Services—Design and Deployment Considerations
OL-11612-01
Installation and Configuration
more frequently and in advance of a low disk space situation. These aggressive data pruning intervals may need to be combined with a shorter history archive interval if the low disk free space situation is not addressed.
Configuring Location Server Advanced Parameters
The configuration of Location Server > Administration > Advanced Parameters is discussed in the document entitled Cisco Wireless Location Appliance Configuration Guide: Editing Advanced Parameters at the following URL: http://www.cisco.com/en/US/products/ps6386/products_configuration_guide_chapter09186a00806b5b10.html#wp1046730.
Further clarification regarding some of these parameters is provided in the following subsections.
Absent Data Cleanup Interval
The “Absent Data Cleanup Interval” specifies the amount of time that an entry is kept for a discovered entity (station, tag, rogue AP, or client) in the “live” (as opposed to the “historical”) location before the entry is discarded. Therefore, if a station was last seen two days ago and the cleanup interval is set to a value of 1440 minutes (1 day), the station is removed from the “live” server database. The default value for absent data cleanup interval is 1440 minutes.
Memory Information
• DB Disk Memory—This name does not refer to “memory” on the location appliance at all, but rather this value displays the amount of disk space that has been consumed by the location server database. This information is useful when determining whether a database de-fragmentation should be performed (see Advanced Commands, page 43) because de-fragmentations have been found to be particularly helpful in restoring lost performance, especially when database sizes tend to get large (> 1 GB).
• Run Java GC—This command runs memory clean-up immediately. Normally, memory cleanup is initiated by the system automatically and thus does not require manual initiation. Therefore, Java General Cleanup need only be run when directed by the Cisco Technical Assistance Center (TAC) or Cisco Engineering.
Advanced Commands
The Defragment Database advanced command defragments the location database and reclaims allocated but unused disk space. A database defragmentation can be beneficial if free disk space on the location appliance is running low because of large database size, or if the response time of the location appliance is noticeably slower when data is requested from it by WCS.
To determine how much free space is currently available on the location appliance, it is necessary to log into the location appliance via either the CLI serial console or an SSH session. When logged in, use the Linux command df -H to display disk free space, as follows:
[root@AeS_Loc root]# df -H
Filesystem Size Used Avail Use% Mounted on/dev/sda2 77G 3.2G 70G 5% //dev/sda1 104M 16M 83M 16% /bootnone 526M 0 526M 0% /dev/shm
[root@AeS_Loc root]#
43Wi-Fi Location-Based Services—Design and Deployment Considerations
OL-11612-01
Installation and Configuration
Note The df –H command is used here because it is a commonplace practice for most computer disk manufacturers to assume 1 GB = 1,000,000,000 bytes. The –H option displays output as powers of 1000 rather than 1024. Use df –h if your preference is for the contrary.
The df display output shown here is for a location appliance containing a hard disk drive with an unformatted capacity of 80 GB. Notice that there are two main file systems defined: /dev/sda1, which is the Linux boot file system; and /dev/sda2, which contains the root directory as well as the location application and all databases. You can clearly see from the display above that only 5 percent of all available space on /dev/sda2 is currently being used. That being the case, there is an abundance of free space available and probably no need to defragment at this time.
You can use the information in the df output along with the knowledge of the size of the location database (from DB Disk Memory described in Memory Information, page 43) to approximate the maximum recommended size to which the location server database should be allowed to grow. At first glance, this may appear intuitive; that is, max recommended database size = total available disk space – (OS size + location application size). However, you should also account for the creation of a flat file that is used during the database backup process. Using the formula below, you can calculate the maximum recommended size of the location database including this additional free space plus a small additional amount to account for system overhead (such as the downloading of an location appliance upgrade image):
Where:
• MaxDatabaseSize is the maximum recommended size of the database in bytes
Note MaxDatabaseSize assumes the user has performed a cleanup of any residual location server upgrade images. Multiple residual upgrade images may consume additional free space exceeding these allotments.
• TotalSpace is the total amount of available space on /dev/sda2 in GB.
• OSApplSpace is the amount of space occupied by the Linux OS and the location server application on /dev/sda2. This can be calculated for the example shown above as:
((the amount of used disk space in Gigabytes) – (the current size of the location server database in Gigabytes)).
The current size of the location server database can be found at WCS > Location Server > Advanced Parameters > DB Disk Memory. In the case of the system used for this example, DB Disk Memory = 24,608,768 bytes or .024608768 GB. Thus, OSApplSpace = (3.2 - .024608768 GB) or 3.175391232 GB.
Substituting these values for TotalSpace and OSApplSpace into the equation, you can calculate the maximum recommended size to which the location server should be allowed to grow as (77 GB – 3.175 GB) / 2.3 = 73.825 / 2.3 = 32.099 GB. Therefore, to ensure proper operation of the database backup mechanism in a location appliance with an 80 GB unformatted capacity hard disk drive, the maximum recommended size of the location database (as indicated by DB Disk Memory) should not be allowed to exceed approximately 32 GB.
3.2eOSApplSpacTotalSpaceeSizeMaxDatabas −=
44Wi-Fi Location-Based Services—Design and Deployment Considerations
OL-11612-01
Installation and Configuration
Configuring Location Server Location Parameters
The configuration of Location Server > Administration > Location Parameters is discussed in Cisco Wireless Location Appliance Configuration Guide: Editing Location Parameters at the following URL: http://www.cisco.com/en/US/products/ps6386/products_configuration_guide_chapter09186a00806b5b10.html#wp1046431.
Further clarification regarding some of these parameters is provided in subsequent sections.
Enable Calculation Time
The “enable calculation time” location parameter refers to an advanced debugging option that enables logging of the amount of time that internal localization calculations consume. It is disabled by default and should be enabled only on the recommendation of the Cisco Technical Assistance Center (TAC) or Cisco Engineering, because it adds overhead to the overall location calculation.
Enable OW Location
This parameter was intended to allow obstacles and heavy wall attenuation values to be factored into the positioning algorithm by the location server. The location appliance uses up to 50 heavy walls that have been defined in the WCS Map Editor when evaluating path loss models and conducting positioning calculations. Heavy walls are those defined in the Map Editor with attenuation values of 13 dB.
In Release 4.0, Enable OW Location has been superseded by a more advanced technique where the location server decides whether location accuracy would be improved or degraded by the inclusion of any heavy walls that are defined via the Map Editor (Monitor > Maps > Properties >Wall Usage Calibration). When set to Auto, the location appliance dynamically establishes whether the inclusion of heavy walls in the calibration would improve location accuracy. The use of heavy walls can be forced by setting this parameter to “Use Walls” or disabled by setting it to “Do Not Use Walls”.
“Enable OW Location” is disabled by default, and Cisco recommends that it be kept in the disabled state unless instructed otherwise by Cisco TAC.
RSSI Discard Times
• Relative RSSI Discard Time—This parameter denotes the relative boundary of RSSI sample times used in location calculations. It specifies the time between the most recent RSS sample and the oldest usable RSS sample. The default relative RSSI discard time is 3 minutes. During normal operation of the location appliance, this parameter should be left at the default value and should not changed except on the advice and recommendation of the Cisco Technical Assistance Center (TAC) or Cisco Engineering.
• Absolute RSSI Discard Time—This parameter denotes the absolute boundary of RSSI sample times used in location calculations. The default is 60 minutes, which means that RSSI samples older than 60 minutes are not used in location calculations, regardless of relative RSSI discard time. During normal operation of the location appliance, this parameter should be left at the default value and should not be changed except on advice of the Cisco Technical Assistance Center (TAC) or Cisco Engineering.
45Wi-Fi Location-Based Services—Design and Deployment Considerations
OL-11612-01
Installation and Configuration
RSSI Cutoff
In addition to enforcing the aforementioned relative and absolute time constraints against received RSSI reports, the location appliance also applies a parameter known as the RSSI cutoff. Subject to the time constraints described in RSSI Discard Times, page 45, the location appliance retains the four highest signal strength reports plus any signal strength reports that meet or exceed the value specified for RSSI cutoff. The default value for RSSI cutoff is -75 dBm.
The application of RSSI cutoff is illustrated in the following examples (assume the default RSSI cutoff value):
• Four RSSI reports of -68dBm, -70dBm, -72dBm, and -80dBm—All four reports are retained because they are the four highest reports.
• Five RSSI reports of -66dBm, -68dBm, -70dBm, -72dBm, and -74dBm—All five reports are retained because they all meet or exceed the RSSI cutoff.
• Five RSSI reports of -66dBm, -68dBm, -70dBm, -72dBm, and -80dBm—The first four reports are retained, the fifth report of -80dBm is discarded because it does not meet the RSSI cutoff of -75 dBm and there are four other signal reports that meet or exceed the RSSI cutoff.
Configuring Location Server Notification Parameters
The configuration of Location Server > Administration > Notification Parameters is discussed in Cisco Wireless Location Appliance Configuration Guide: Configuring Notification Parameters at the following URL: http://www.cisco.com/en/US/products/ps6386/products_configuration_guide_chapter09186a00806b5d5b.html#wp1053921.
Further clarification regarding some of these parameters is provided in the following sections.
Queue Limit
The Queue Limit parameter specifies the size of the output notification queue of the location server. This value normally defaults to 500. The location server drops any outbound notifications above this limit if the output notification queue size is exceeded. Therefore, if you notice that some outbound notifications are being dropped (via the Notifications Dropped field), you may want to increase the queue limit size.
Retry Limit
The retry limit specifies the number of times an event notification is generated during each refresh cycle. This parameter can be used to generate more than one copy of an event notification, providing an additional level of message redundancy to counter any message loss experienced en route to WCS. Keep in mind that copies of transmitted event notifications are not retained by the location appliance; that is, each copy of an event notification is “fired and forgotten” by the location appliance. The default is to send one event notification copy each refresh cycle.
Refresh Time
Refresh time specifies the time interval the location server waits before restarting the notification event refresh cycle. If the condition that caused the original notification event is still present when the event refresh cycle is restarted, the location server once again sends the number of notification event messages specified by the retry limit (see Retry Limit, page 46). This continues until the condition that caused the event to be sent originally is cleared.
46Wi-Fi Location-Based Services—Design and Deployment Considerations
OL-11612-01
Installation and Configuration
Location Appliance Dual Ethernet Operation
The Cisco Wireless Location Appliance is equipped with two 10/100/1000BASE-T Gigabit Ethernet ports that can be used to connect the location to two different IP networks such that it is easily accessible from either network. This makes it a simple affair, for example, to configure a location appliance for service on network A while affording it the capability to be managed out-of-band on network B if the need arises. Complete step-by-step guidelines to accomplish this are available in Cisco Wireless Location Appliance Installation Guide: Configuring the Location Appliance at the following URL: http://www.cisco.com/en/US/products/ps6386/products_installation_and_configuration_guide_chapter09186a00804fab8e.html#wp1040488.
Particular attention should be paid to the fact that the dual onboard Ethernet controllers on the location appliance are not intended for redundant or simultaneous connection to the same IP network. Configurations aimed at establishing parallel, load balancing, or redundant Ethernet connections to the same IP network are not recommended at this time.
Changing Default Passwords for the Location Appliance
Changing the “root” User Linux System Password
The location appliance ships with the root system password defaulted to password. To change the password for the root user to some other less well-known value, it is necessary to log into the location appliance as root using the CLI from either the serial console port or an SSH session.
Note Note that beginning with Release 2.1, SSH 1.0 is no longer supported by the location appliance because of known security concerns. See Release Notes for Cisco Wireless Location Appliance at the following URL: http://www.cisco.com/en/US/products/ps6386/prod_release_note09186a00806b5ec7.html
When logged in, the Linux command passwd can be used to change the root system password as follows:
AeS_Loc login: rootPassword:Last login: Thu Oct 22 09:53:21 on ttyS0[root@AeS_Loc root]# passwdChanging password for user root.New password:Retype new password:passwd: all authentication tokens updated successfully.[root@AeS_Loc root]#
The Linux operating system cautions the user if a password is chosen that is considered a commonly found dictionary word or if it contain too few characters. It still enacts the change despite the warnings.
Changing the “admin” Location Server Application Password
The location server application on the location appliance ships with an administrator user account and group predefined. The userid is admin and the password is admin. This account is typically used by WCS to access the location server software application that is running on the location appliance. After WCS has successfully contacted the location server application using the factory default administrator credentials, the default password on the admin account can be changed to a less well-known value via the WCS menu Location > Accounts > Users menu. Begin by clicking on the admin userid, as shown in Figure 27.
47Wi-Fi Location-Based Services—Design and Deployment Considerations
OL-11612-01
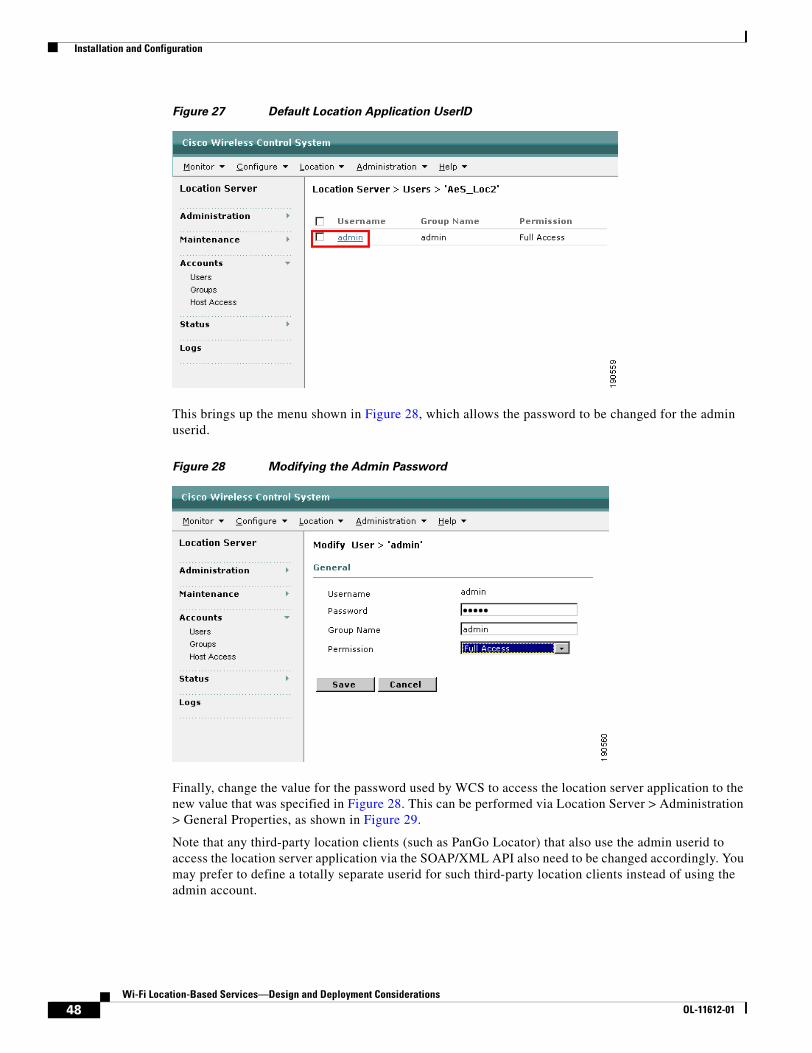
Installation and Configuration
Figure 27 Default Location Application UserID
This brings up the menu shown in Figure 28, which allows the password to be changed for the admin userid.
Figure 28 Modifying the Admin Password
Finally, change the value for the password used by WCS to access the location server application to the new value that was specified in Figure 28. This can be performed via Location Server > Administration > General Properties, as shown in Figure 29.
Note that any third-party location clients (such as PanGo Locator) that also use the admin userid to access the location server application via the SOAP/XML API also need to be changed accordingly. You may prefer to define a totally separate userid for such third-party location clients instead of using the admin account.
48Wi-Fi Location-Based Services—Design and Deployment Considerations
OL-11612-01
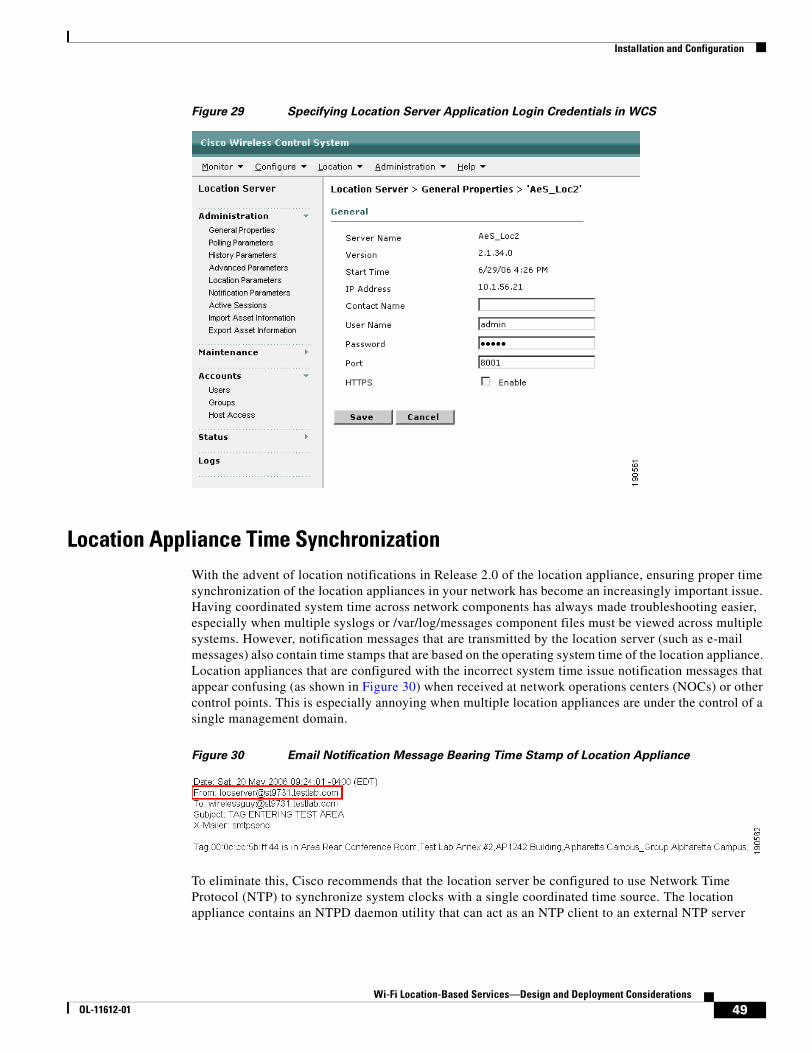
Installation and Configuration
Figure 29 Specifying Location Server Application Login Credentials in WCS
Location Appliance Time SynchronizationWith the advent of location notifications in Release 2.0 of the location appliance, ensuring proper time synchronization of the location appliances in your network has become an increasingly important issue. Having coordinated system time across network components has always made troubleshooting easier, especially when multiple syslogs or /var/log/messages component files must be viewed across multiple systems. However, notification messages that are transmitted by the location server (such as e-mail messages) also contain time stamps that are based on the operating system time of the location appliance. Location appliances that are configured with the incorrect system time issue notification messages that appear confusing (as shown in Figure 30) when received at network operations centers (NOCs) or other control points. This is especially annoying when multiple location appliances are under the control of a single management domain.
Figure 30 Email Notification Message Bearing Time Stamp of Location Appliance
To eliminate this, Cisco recommends that the location server be configured to use Network Time Protocol (NTP) to synchronize system clocks with a single coordinated time source. The location appliance contains an NTPD daemon utility that can act as an NTP client to an external NTP server
49Wi-Fi Location-Based Services—Design and Deployment Considerations
OL-11612-01
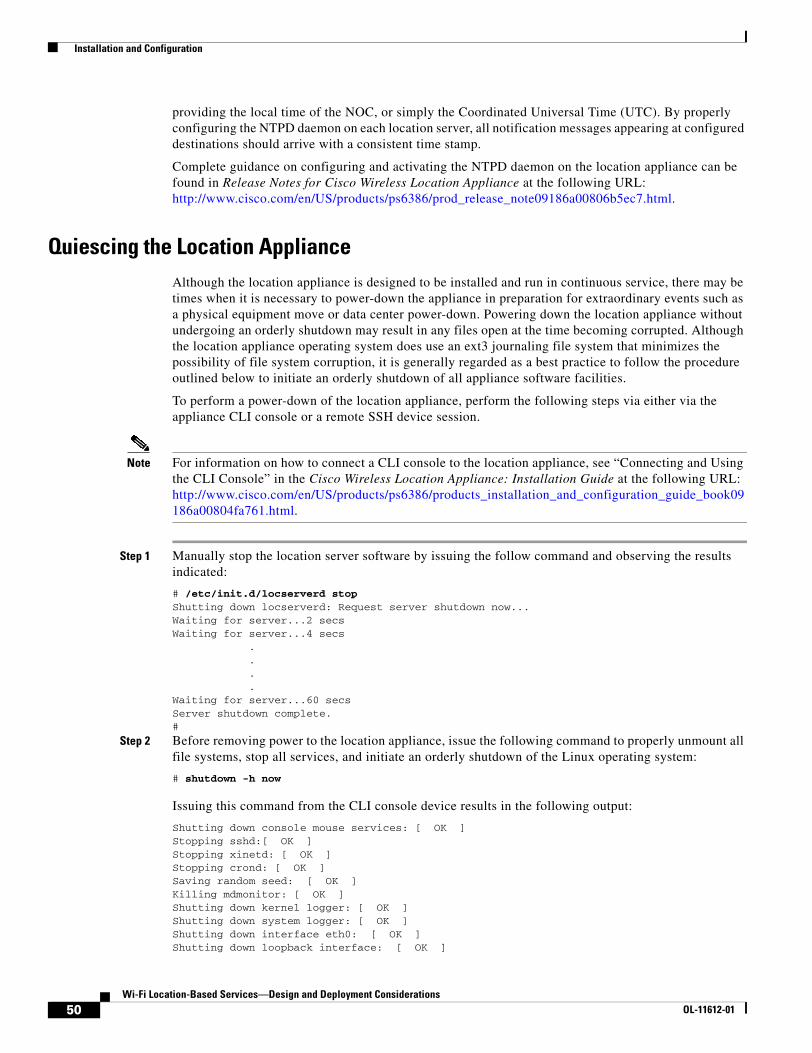
Installation and Configuration
providing the local time of the NOC, or simply the Coordinated Universal Time (UTC). By properly configuring the NTPD daemon on each location server, all notification messages appearing at configured destinations should arrive with a consistent time stamp.
Complete guidance on configuring and activating the NTPD daemon on the location appliance can be found in Release Notes for Cisco Wireless Location Appliance at the following URL: http://www.cisco.com/en/US/products/ps6386/prod_release_note09186a00806b5ec7.html.
Quiescing the Location ApplianceAlthough the location appliance is designed to be installed and run in continuous service, there may be times when it is necessary to power-down the appliance in preparation for extraordinary events such as a physical equipment move or data center power-down. Powering down the location appliance without undergoing an orderly shutdown may result in any files open at the time becoming corrupted. Although the location appliance operating system does use an ext3 journaling file system that minimizes the possibility of file system corruption, it is generally regarded as a best practice to follow the procedure outlined below to initiate an orderly shutdown of all appliance software facilities.
To perform a power-down of the location appliance, perform the following steps via either via the appliance CLI console or a remote SSH device session.
Note For information on how to connect a CLI console to the location appliance, see “Connecting and Using the CLI Console” in the Cisco Wireless Location Appliance: Installation Guide at the following URL: http://www.cisco.com/en/US/products/ps6386/products_installation_and_configuration_guide_book09186a00804fa761.html.
Step 1 Manually stop the location server software by issuing the follow command and observing the results indicated:
# /etc/init.d/locserverd stopShutting down locserverd: Request server shutdown now...Waiting for server...2 secsWaiting for server...4 secs . . . .Waiting for server...60 secsServer shutdown complete.#
Step 2 Before removing power to the location appliance, issue the following command to properly unmount all file systems, stop all services, and initiate an orderly shutdown of the Linux operating system:
# shutdown -h now
Issuing this command from the CLI console device results in the following output:
Shutting down console mouse services: [ OK ]Stopping sshd:[ OK ]Stopping xinetd: [ OK ]Stopping crond: [ OK ]Saving random seed: [ OK ]Killing mdmonitor: [ OK ]Shutting down kernel logger: [ OK ]Shutting down system logger: [ OK ]Shutting down interface eth0: [ OK ]Shutting down loopback interface: [ OK ]
50Wi-Fi Location-Based Services—Design and Deployment Considerations
OL-11612-01
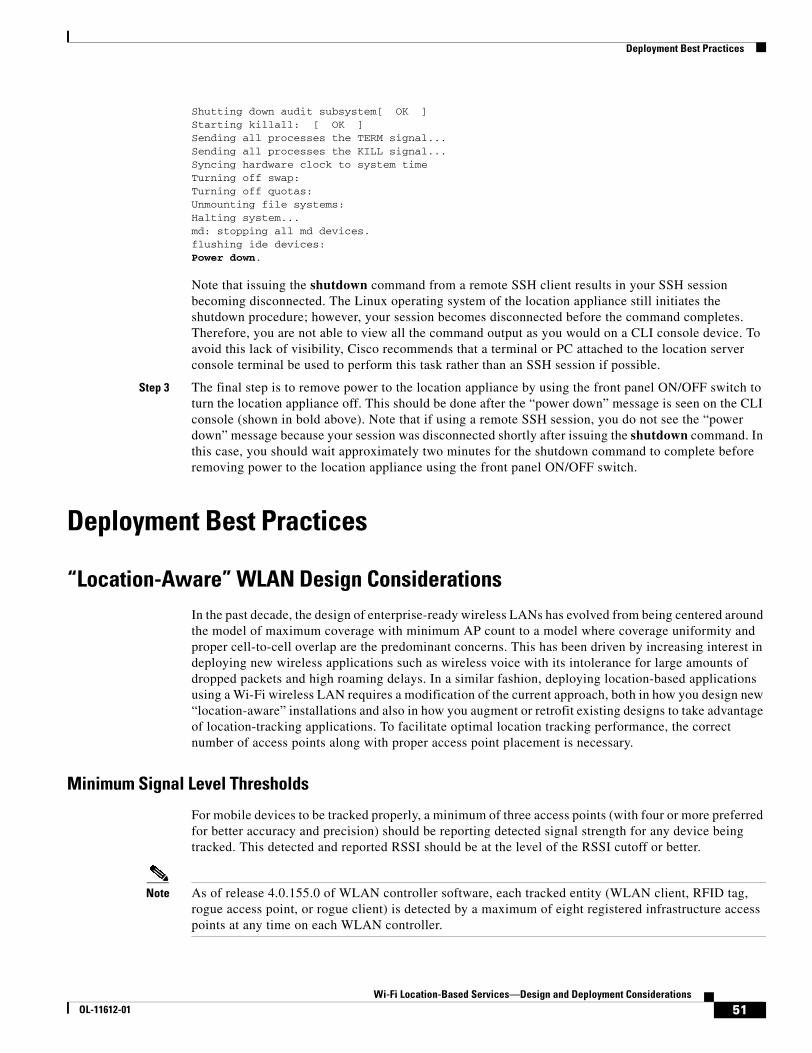
Deployment Best Practices
Shutting down audit subsystem[ OK ]Starting killall: [ OK ]Sending all processes the TERM signal... Sending all processes the KILL signal... Syncing hardware clock to system time Turning off swap: Turning off quotas: Unmounting file systems: Halting system...md: stopping all md devices.flushing ide devices: Power down.
Note that issuing the shutdown command from a remote SSH client results in your SSH session becoming disconnected. The Linux operating system of the location appliance still initiates the shutdown procedure; however, your session becomes disconnected before the command completes. Therefore, you are not able to view all the command output as you would on a CLI console device. To avoid this lack of visibility, Cisco recommends that a terminal or PC attached to the location server console terminal be used to perform this task rather than an SSH session if possible.
Step 3 The final step is to remove power to the location appliance by using the front panel ON/OFF switch to turn the location appliance off. This should be done after the “power down” message is seen on the CLI console (shown in bold above). Note that if using a remote SSH session, you do not see the “power down” message because your session was disconnected shortly after issuing the shutdown command. In this case, you should wait approximately two minutes for the shutdown command to complete before removing power to the location appliance using the front panel ON/OFF switch.
Deployment Best Practices
“Location-Aware” WLAN Design ConsiderationsIn the past decade, the design of enterprise-ready wireless LANs has evolved from being centered around the model of maximum coverage with minimum AP count to a model where coverage uniformity and proper cell-to-cell overlap are the predominant concerns. This has been driven by increasing interest in deploying new wireless applications such as wireless voice with its intolerance for large amounts of dropped packets and high roaming delays. In a similar fashion, deploying location-based applications using a Wi-Fi wireless LAN requires a modification of the current approach, both in how you design new “location-aware” installations and also in how you augment or retrofit existing designs to take advantage of location-tracking applications. To facilitate optimal location tracking performance, the correct number of access points along with proper access point placement is necessary.
Minimum Signal Level Thresholds
For mobile devices to be tracked properly, a minimum of three access points (with four or more preferred for better accuracy and precision) should be reporting detected signal strength for any device being tracked. This detected and reported RSSI should be at the level of the RSSI cutoff or better.
Note As of release 4.0.155.0 of WLAN controller software, each tracked entity (WLAN client, RFID tag, rogue access point, or rogue client) is detected by a maximum of eight registered infrastructure access points at any time on each WLAN controller.
51Wi-Fi Location-Based Services—Design and Deployment Considerations
OL-11612-01
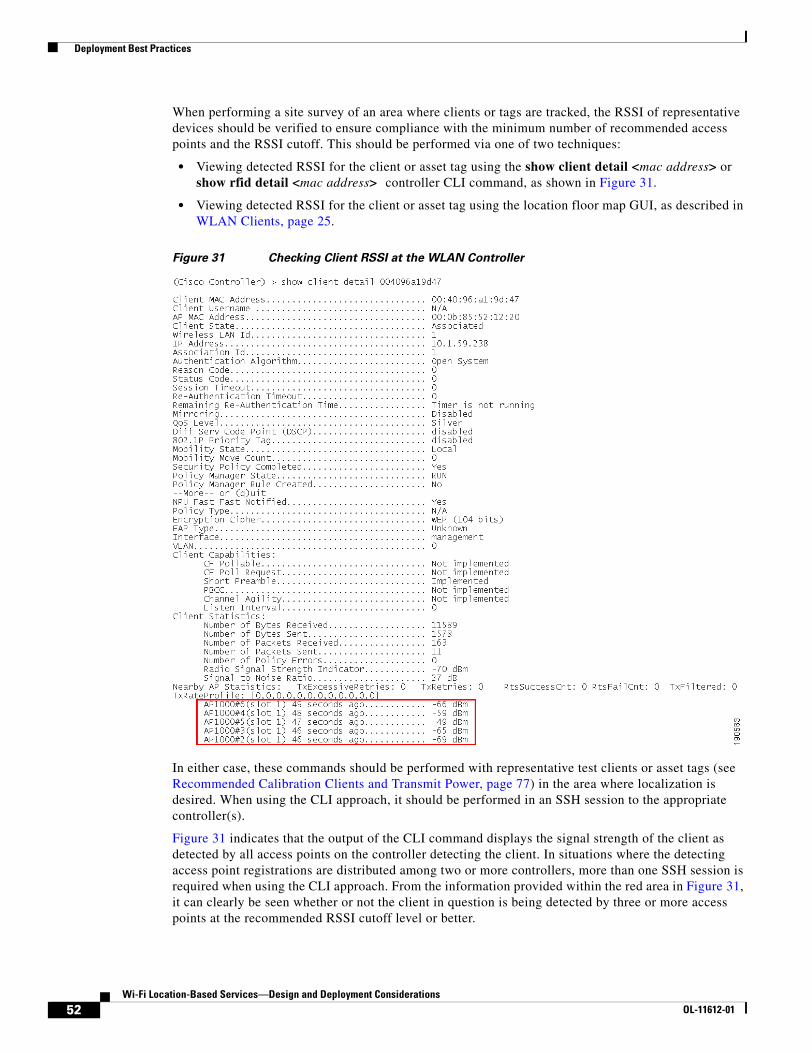
Deployment Best Practices
When performing a site survey of an area where clients or tags are tracked, the RSSI of representative devices should be verified to ensure compliance with the minimum number of recommended access points and the RSSI cutoff. This should be performed via one of two techniques:
• Viewing detected RSSI for the client or asset tag using the show client detail <mac address> or show rfid detail <mac address> controller CLI command, as shown in Figure 31.
• Viewing detected RSSI for the client or asset tag using the location floor map GUI, as described in WLAN Clients, page 25.
Figure 31 Checking Client RSSI at the WLAN Controller
In either case, these commands should be performed with representative test clients or asset tags (see Recommended Calibration Clients and Transmit Power, page 77) in the area where localization is desired. When using the CLI approach, it should be performed in an SSH session to the appropriate controller(s).
Figure 31 indicates that the output of the CLI command displays the signal strength of the client as detected by all access points on the controller detecting the client. In situations where the detecting access point registrations are distributed among two or more controllers, more than one SSH session is required when using the CLI approach. From the information provided within the red area in Figure 31, it can clearly be seen whether or not the client in question is being detected by three or more access points at the recommended RSSI cutoff level or better.
52Wi-Fi Location-Based Services—Design and Deployment Considerations
OL-11612-01
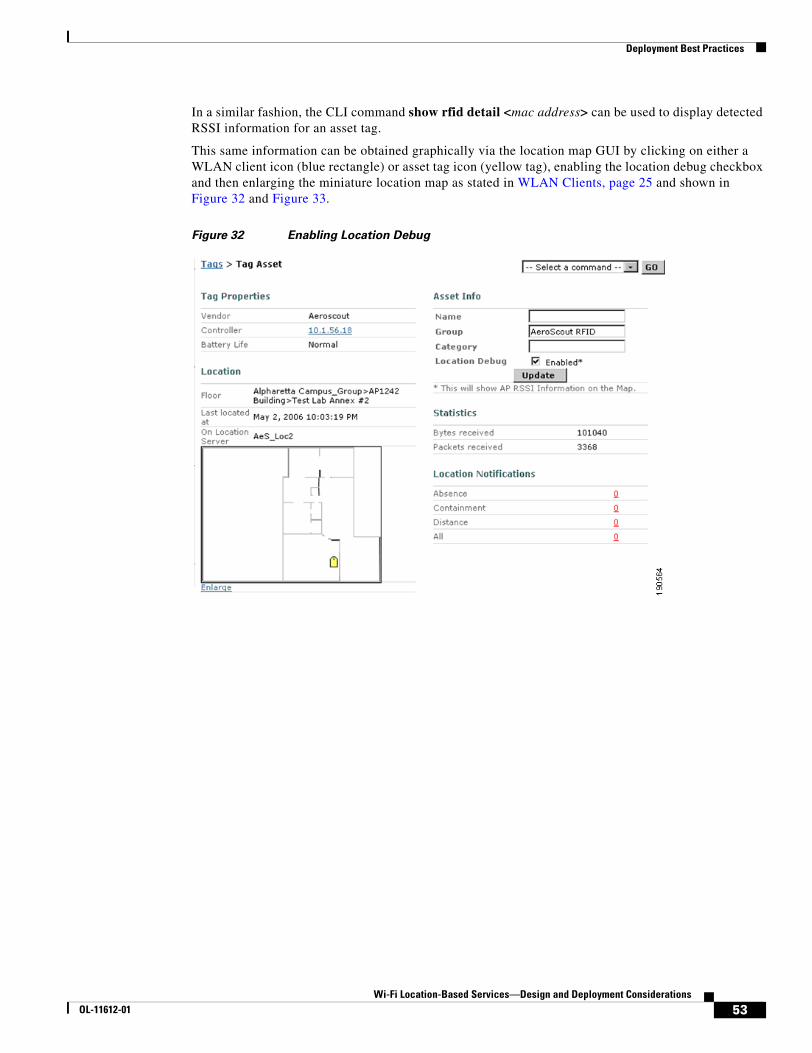
Deployment Best Practices
In a similar fashion, the CLI command show rfid detail <mac address> can be used to display detected RSSI information for an asset tag.
This same information can be obtained graphically via the location map GUI by clicking on either a WLAN client icon (blue rectangle) or asset tag icon (yellow tag), enabling the location debug checkbox and then enlarging the miniature location map as stated in WLAN Clients, page 25 and shown in Figure 32 and Figure 33.
Figure 32 Enabling Location Debug
53Wi-Fi Location-Based Services—Design and Deployment Considerations
OL-11612-01
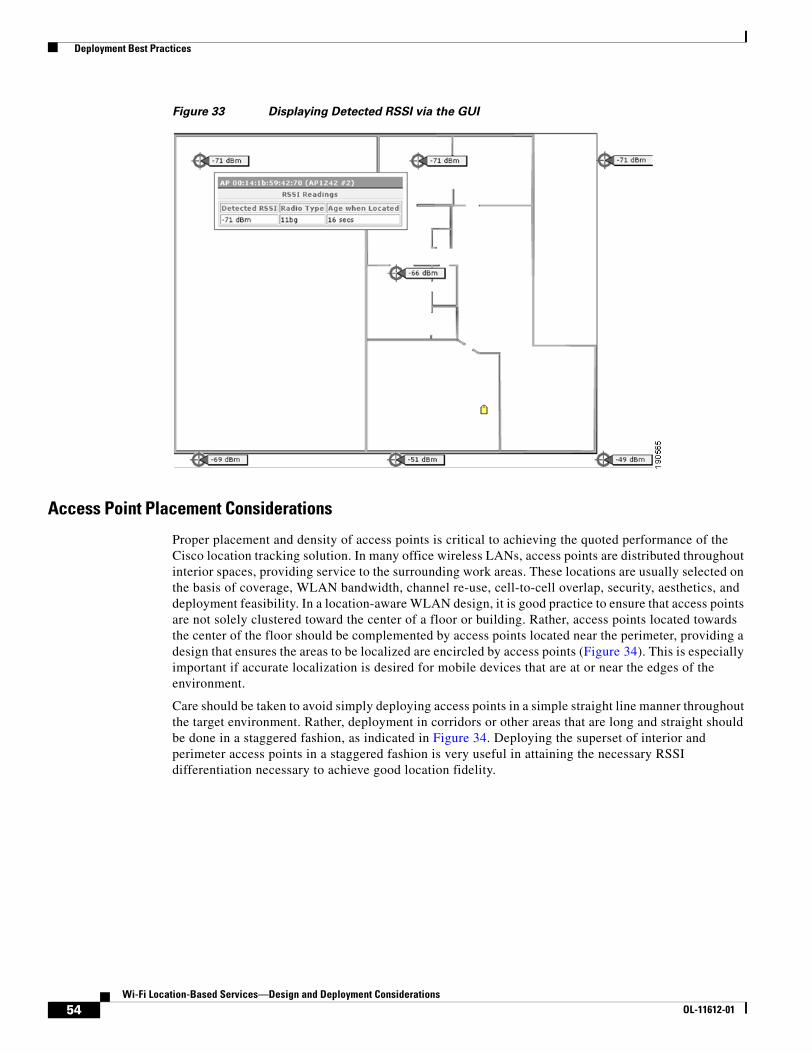
Deployment Best Practices
Figure 33 Displaying Detected RSSI via the GUI
Access Point Placement Considerations
Proper placement and density of access points is critical to achieving the quoted performance of the Cisco location tracking solution. In many office wireless LANs, access points are distributed throughout interior spaces, providing service to the surrounding work areas. These locations are usually selected on the basis of coverage, WLAN bandwidth, channel re-use, cell-to-cell overlap, security, aesthetics, and deployment feasibility. In a location-aware WLAN design, it is good practice to ensure that access points are not solely clustered toward the center of a floor or building. Rather, access points located towards the center of the floor should be complemented by access points located near the perimeter, providing a design that ensures the areas to be localized are encircled by access points (Figure 34). This is especially important if accurate localization is desired for mobile devices that are at or near the edges of the environment.
Care should be taken to avoid simply deploying access points in a simple straight line manner throughout the target environment. Rather, deployment in corridors or other areas that are long and straight should be done in a staggered fashion, as indicated in Figure 34. Deploying the superset of interior and perimeter access points in a staggered fashion is very useful in attaining the necessary RSSI differentiation necessary to achieve good location fidelity.
54Wi-Fi Location-Based Services—Design and Deployment Considerations
OL-11612-01
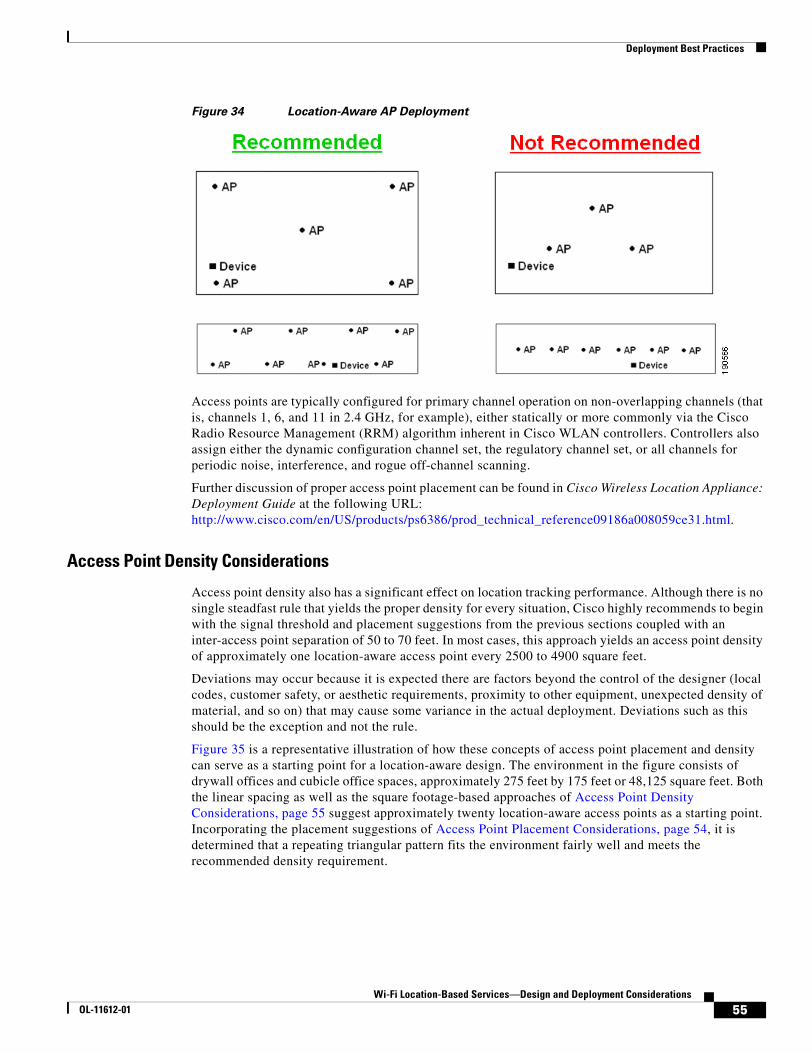
Deployment Best Practices
Figure 34 Location-Aware AP Deployment
Access points are typically configured for primary channel operation on non-overlapping channels (that is, channels 1, 6, and 11 in 2.4 GHz, for example), either statically or more commonly via the Cisco Radio Resource Management (RRM) algorithm inherent in Cisco WLAN controllers. Controllers also assign either the dynamic configuration channel set, the regulatory channel set, or all channels for periodic noise, interference, and rogue off-channel scanning.
Further discussion of proper access point placement can be found in Cisco Wireless Location Appliance: Deployment Guide at the following URL: http://www.cisco.com/en/US/products/ps6386/prod_technical_reference09186a008059ce31.html.
Access Point Density Considerations
Access point density also has a significant effect on location tracking performance. Although there is no single steadfast rule that yields the proper density for every situation, Cisco highly recommends to begin with the signal threshold and placement suggestions from the previous sections coupled with an inter-access point separation of 50 to 70 feet. In most cases, this approach yields an access point density of approximately one location-aware access point every 2500 to 4900 square feet.
Deviations may occur because it is expected there are factors beyond the control of the designer (local codes, customer safety, or aesthetic requirements, proximity to other equipment, unexpected density of material, and so on) that may cause some variance in the actual deployment. Deviations such as this should be the exception and not the rule.
Figure 35 is a representative illustration of how these concepts of access point placement and density can serve as a starting point for a location-aware design. The environment in the figure consists of drywall offices and cubicle office spaces, approximately 275 feet by 175 feet or 48,125 square feet. Both the linear spacing as well as the square footage-based approaches of Access Point Density Considerations, page 55 suggest approximately twenty location-aware access points as a starting point. Incorporating the placement suggestions of Access Point Placement Considerations, page 54, it is determined that a repeating triangular pattern fits the environment fairly well and meets the recommended density requirement.
55Wi-Fi Location-Based Services—Design and Deployment Considerations
OL-11612-01
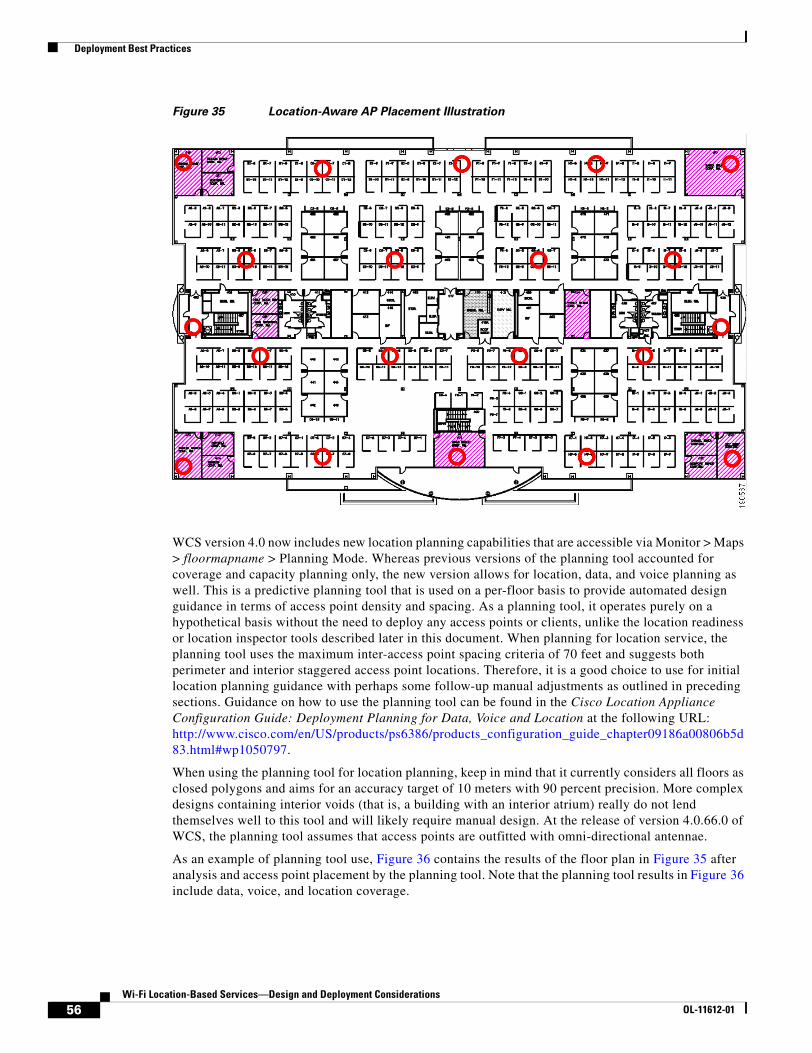
Deployment Best Practices
Figure 35 Location-Aware AP Placement Illustration
WCS version 4.0 now includes new location planning capabilities that are accessible via Monitor > Maps > floormapname > Planning Mode. Whereas previous versions of the planning tool accounted for coverage and capacity planning only, the new version allows for location, data, and voice planning as well. This is a predictive planning tool that is used on a per-floor basis to provide automated design guidance in terms of access point density and spacing. As a planning tool, it operates purely on a hypothetical basis without the need to deploy any access points or clients, unlike the location readiness or location inspector tools described later in this document. When planning for location service, the planning tool uses the maximum inter-access point spacing criteria of 70 feet and suggests both perimeter and interior staggered access point locations. Therefore, it is a good choice to use for initial location planning guidance with perhaps some follow-up manual adjustments as outlined in preceding sections. Guidance on how to use the planning tool can be found in the Cisco Location Appliance Configuration Guide: Deployment Planning for Data, Voice and Location at the following URL: http://www.cisco.com/en/US/products/ps6386/products_configuration_guide_chapter09186a00806b5d83.html#wp1050797.
When using the planning tool for location planning, keep in mind that it currently considers all floors as closed polygons and aims for an accuracy target of 10 meters with 90 percent precision. More complex designs containing interior voids (that is, a building with an interior atrium) really do not lend themselves well to this tool and will likely require manual design. At the release of version 4.0.66.0 of WCS, the planning tool assumes that access points are outfitted with omni-directional antennae.
As an example of planning tool use, Figure 36 contains the results of the floor plan in Figure 35 after analysis and access point placement by the planning tool. Note that the planning tool results in Figure 36 include data, voice, and location coverage.
56Wi-Fi Location-Based Services—Design and Deployment Considerations
OL-11612-01
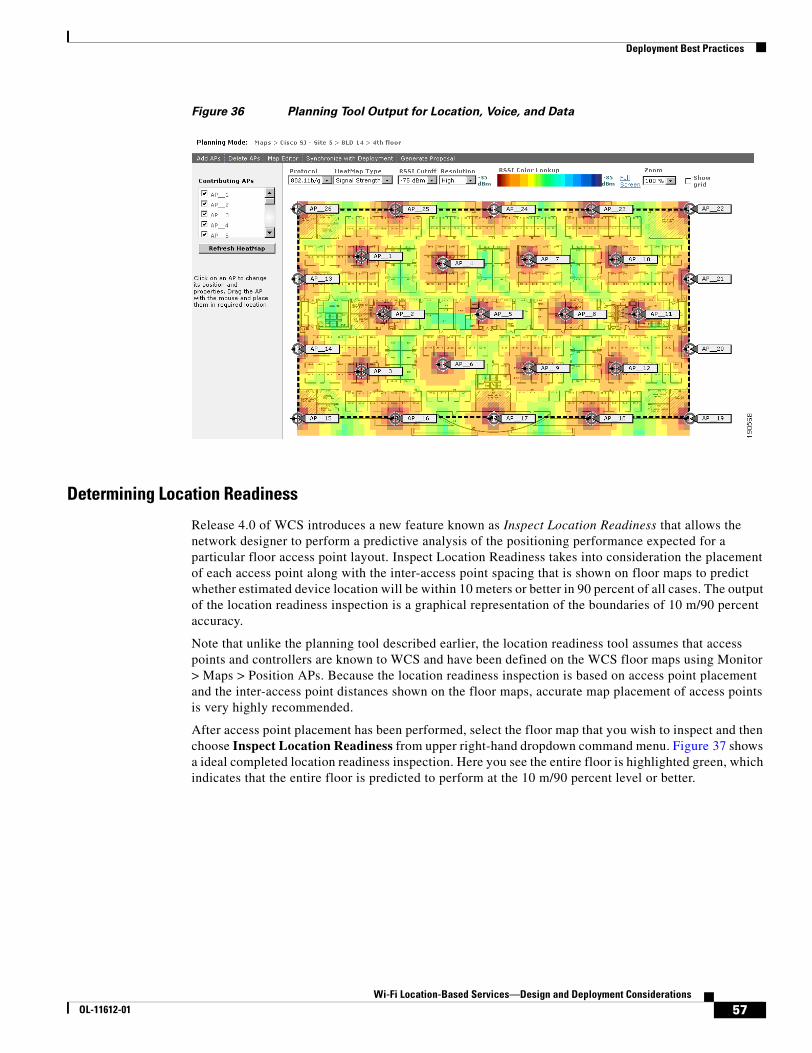
Deployment Best Practices
Figure 36 Planning Tool Output for Location, Voice, and Data
Determining Location Readiness
Release 4.0 of WCS introduces a new feature known as Inspect Location Readiness that allows the network designer to perform a predictive analysis of the positioning performance expected for a particular floor access point layout. Inspect Location Readiness takes into consideration the placement of each access point along with the inter-access point spacing that is shown on floor maps to predict whether estimated device location will be within 10 meters or better in 90 percent of all cases. The output of the location readiness inspection is a graphical representation of the boundaries of 10 m/90 percent accuracy.
Note that unlike the planning tool described earlier, the location readiness tool assumes that access points and controllers are known to WCS and have been defined on the WCS floor maps using Monitor > Maps > Position APs. Because the location readiness inspection is based on access point placement and the inter-access point distances shown on the floor maps, accurate map placement of access points is very highly recommended.
After access point placement has been performed, select the floor map that you wish to inspect and then choose Inspect Location Readiness from upper right-hand dropdown command menu. Figure 37 shows a ideal completed location readiness inspection. Here you see the entire floor is highlighted green, which indicates that the entire floor is predicted to perform at the 10 m/90 percent level or better.
57Wi-Fi Location-Based Services—Design and Deployment Considerations
OL-11612-01
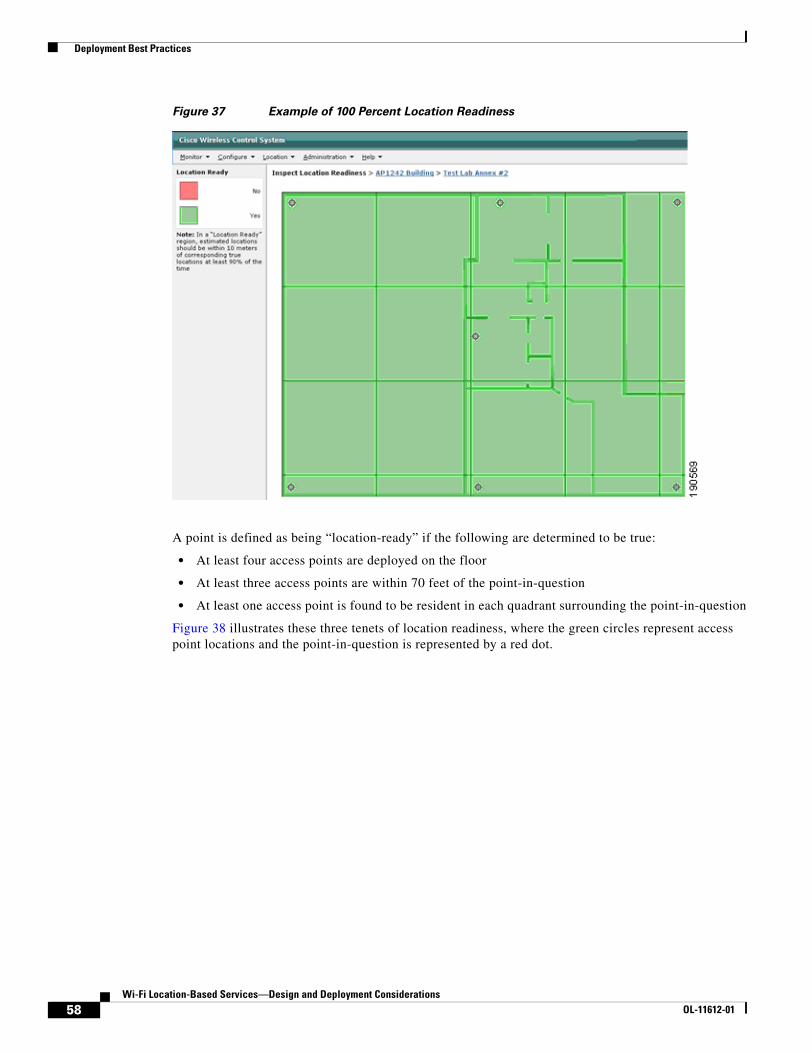
Deployment Best Practices
Figure 37 Example of 100 Percent Location Readiness
A point is defined as being “location-ready” if the following are determined to be true:
• At least four access points are deployed on the floor
• At least three access points are within 70 feet of the point-in-question
• At least one access point is found to be resident in each quadrant surrounding the point-in-question
Figure 38 illustrates these three tenets of location readiness, where the green circles represent access point locations and the point-in-question is represented by a red dot.
58Wi-Fi Location-Based Services—Design and Deployment Considerations
OL-11612-01
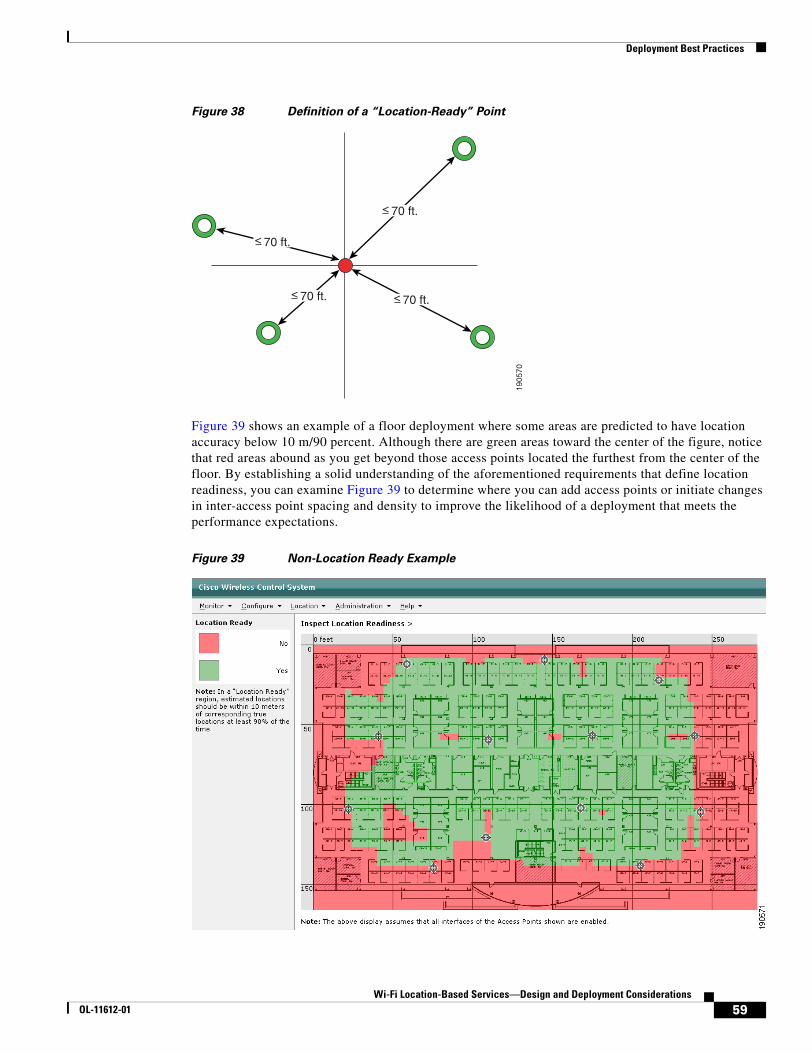
Deployment Best Practices
Figure 38 Definition of a “Location-Ready” Point
Figure 39 shows an example of a floor deployment where some areas are predicted to have location accuracy below 10 m/90 percent. Although there are green areas toward the center of the figure, notice that red areas abound as you get beyond those access points located the furthest from the center of the floor. By establishing a solid understanding of the aforementioned requirements that define location readiness, you can examine Figure 39 to determine where you can add access points or initiate changes in inter-access point spacing and density to improve the likelihood of a deployment that meets the performance expectations.
Figure 39 Non-Location Ready Example
1905
70
< 70 ft.
< 70 ft.
< 70 ft.
< 70 ft.
59Wi-Fi Location-Based Services—Design and Deployment Considerations
OL-11612-01
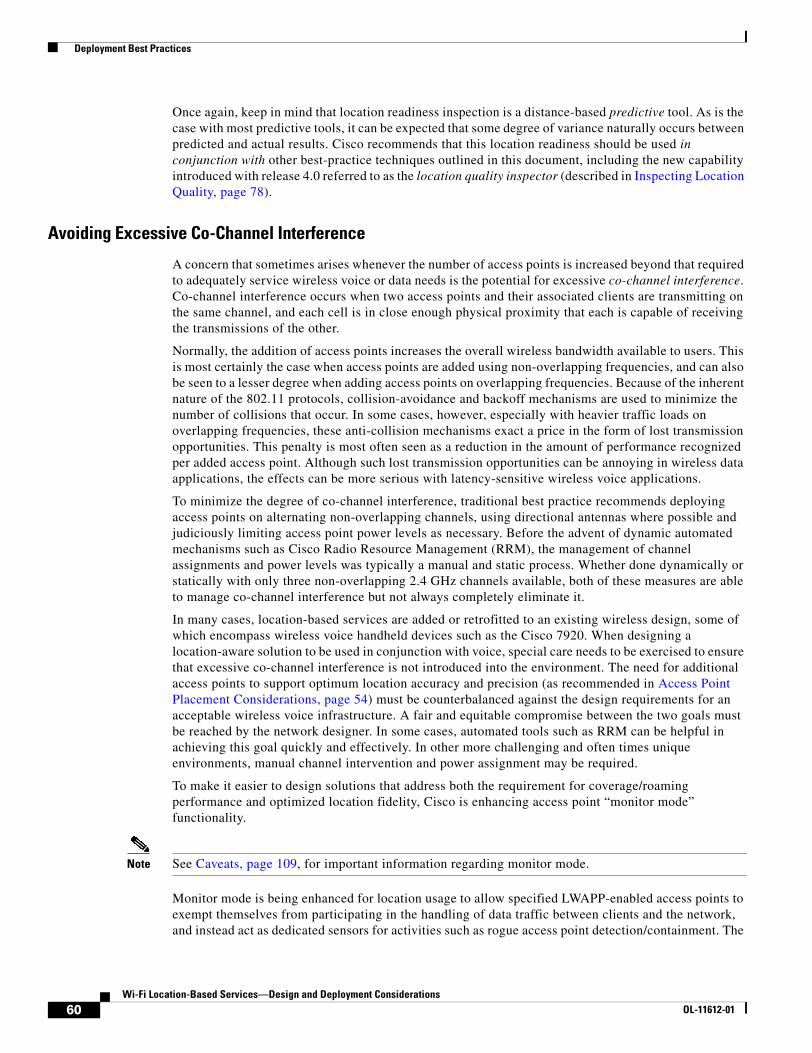
Deployment Best Practices
Once again, keep in mind that location readiness inspection is a distance-based predictive tool. As is the case with most predictive tools, it can be expected that some degree of variance naturally occurs between predicted and actual results. Cisco recommends that this location readiness should be used in conjunction with other best-practice techniques outlined in this document, including the new capability introduced with release 4.0 referred to as the location quality inspector (described in Inspecting Location Quality, page 78).
Avoiding Excessive Co-Channel Interference
A concern that sometimes arises whenever the number of access points is increased beyond that required to adequately service wireless voice or data needs is the potential for excessive co-channel interference. Co-channel interference occurs when two access points and their associated clients are transmitting on the same channel, and each cell is in close enough physical proximity that each is capable of receiving the transmissions of the other.
Normally, the addition of access points increases the overall wireless bandwidth available to users. This is most certainly the case when access points are added using non-overlapping frequencies, and can also be seen to a lesser degree when adding access points on overlapping frequencies. Because of the inherent nature of the 802.11 protocols, collision-avoidance and backoff mechanisms are used to minimize the number of collisions that occur. In some cases, however, especially with heavier traffic loads on overlapping frequencies, these anti-collision mechanisms exact a price in the form of lost transmission opportunities. This penalty is most often seen as a reduction in the amount of performance recognized per added access point. Although such lost transmission opportunities can be annoying in wireless data applications, the effects can be more serious with latency-sensitive wireless voice applications.
To minimize the degree of co-channel interference, traditional best practice recommends deploying access points on alternating non-overlapping channels, using directional antennas where possible and judiciously limiting access point power levels as necessary. Before the advent of dynamic automated mechanisms such as Cisco Radio Resource Management (RRM), the management of channel assignments and power levels was typically a manual and static process. Whether done dynamically or statically with only three non-overlapping 2.4 GHz channels available, both of these measures are able to manage co-channel interference but not always completely eliminate it.
In many cases, location-based services are added or retrofitted to an existing wireless design, some of which encompass wireless voice handheld devices such as the Cisco 7920. When designing a location-aware solution to be used in conjunction with voice, special care needs to be exercised to ensure that excessive co-channel interference is not introduced into the environment. The need for additional access points to support optimum location accuracy and precision (as recommended in Access Point Placement Considerations, page 54) must be counterbalanced against the design requirements for an acceptable wireless voice infrastructure. A fair and equitable compromise between the two goals must be reached by the network designer. In some cases, automated tools such as RRM can be helpful in achieving this goal quickly and effectively. In other more challenging and often times unique environments, manual channel intervention and power assignment may be required.
To make it easier to design solutions that address both the requirement for coverage/roaming performance and optimized location fidelity, Cisco is enhancing access point “monitor mode” functionality.
Note See Caveats, page 109, for important information regarding monitor mode.
Monitor mode is being enhanced for location usage to allow specified LWAPP-enabled access points to exempt themselves from participating in the handling of data traffic between clients and the network, and instead act as dedicated sensors for activities such as rogue access point detection/containment. The
60Wi-Fi Location-Based Services—Design and Deployment Considerations
OL-11612-01
Deployment Best Practices
intent of monitor mode in this situation is to allow designated Cisco LWAPP-enabled access points to monitor the air space without transmitting any radio traffic, effectively eliminating their contribution to co-channel interference.
Monitor mode is currently being revised to increase its usefulness in situations where added access point density is necessary for optimum location tracking performance but the potential risk of upsetting a carefully crafted existing wireless voice network design is high. Using monitor mode, the designer will be able to add monitor mode access points as necessary to achieve the recommended access point density without risk of increased co-channel interference. Monitor mode will also be helpful when addressing multi-floor structures as well, to help assure that access points placed on a floor directly above or below the current floor do not contribute excessive cross-channel interference in the current floor cells.
Access points in monitor mode provide client, asset tag, and rogue signal strength information to attached controllers. This information is subsequently collected by the location appliance during polling cycles and used during the localization of these tags. Monitor mode can be enabled via the WCS or controller-based GUI interfaces or via the controller CLI on a per-access point basis (note that access points reboot when transitioning from local to monitor mode and vice versa).
For further details regarding best practice voice design and deployment recommendations specifically for the Cisco 7920, see the Cisco Wireless IP Phone 7920 Design and Deployment Guide at the following URL: http://www.cisco.com/en/US/products/hw/phones/ps379/products_implementation_design_guide_book09186a00802a029a.html.
For further details regarding best practice voice design and deployment recommendations specifically for Spectralink wireless telephony products, see the SpectraLink Phone Design and Deployment Guide located at the following URL: http://www.cisco.com/en/US/tech/tk722/tk809/technologies_tech_note09186a00806d11cb.shtml.
Additional information regarding deployment guidelines and best practices can be found in the Cisco Wireless Location Appliance: Deployment Guide at the following URL: http://www.cisco.com/en/US/products/ps6386/prod_technical_reference09186a008059ce31.html.
Avoiding Location Display Jitter with Location Smoothing
In release 4.0 of WCS and release 2.1 of the location appliance, Location Smoothing was introduced to enable the network administrator to compensate for cases of location instability sometimes seen with clients that are not actually experiencing any change in movement. This observed instability can be because of a variety of factors, including the following:
• Variances in client transmit power resulting in detected RSSI changes
• Environmental changes including changes in obstructions resulting in variations in attenuation and multi-path
• Changes in client orientation including in-place rotation, especially with clients possessing embedded antennas in components such as laptop screens
Location smoothing allows you to apply a damping factor to the displayed location when changes are observed between the recorded (previous) position of a client and a new position that is based on RSSI information received from WLCs. Smoothing factors are set in Location > Location Server > Administration > Location Parameters via the Smooth Location Positions parameter, as shown in Figure 40.
61Wi-Fi Location-Based Services—Design and Deployment Considerations
OL-11612-01
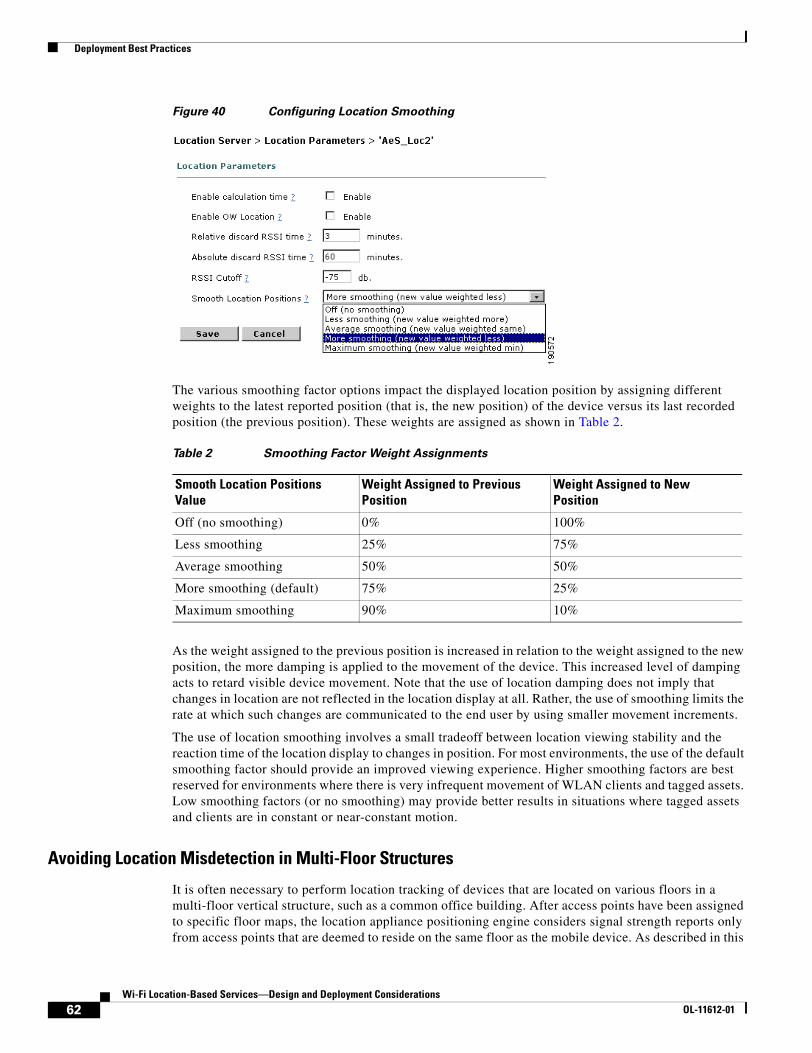
Deployment Best Practices
Figure 40 Configuring Location Smoothing
The various smoothing factor options impact the displayed location position by assigning different weights to the latest reported position (that is, the new position) of the device versus its last recorded position (the previous position). These weights are assigned as shown in Table 2.
As the weight assigned to the previous position is increased in relation to the weight assigned to the new position, the more damping is applied to the movement of the device. This increased level of damping acts to retard visible device movement. Note that the use of location damping does not imply that changes in location are not reflected in the location display at all. Rather, the use of smoothing limits the rate at which such changes are communicated to the end user by using smaller movement increments.
The use of location smoothing involves a small tradeoff between location viewing stability and the reaction time of the location display to changes in position. For most environments, the use of the default smoothing factor should provide an improved viewing experience. Higher smoothing factors are best reserved for environments where there is very infrequent movement of WLAN clients and tagged assets. Low smoothing factors (or no smoothing) may provide better results in situations where tagged assets and clients are in constant or near-constant motion.
Avoiding Location Misdetection in Multi-Floor Structures
It is often necessary to perform location tracking of devices that are located on various floors in a multi-floor vertical structure, such as a common office building. After access points have been assigned to specific floor maps, the location appliance positioning engine considers signal strength reports only from access points that are deemed to reside on the same floor as the mobile device. As described in this
Table 2 Smoothing Factor Weight Assignments
Smooth Location Positions Value
Weight Assigned to Previous Position
Weight Assigned to New Position
Off (no smoothing) 0% 100%
Less smoothing 25% 75%
Average smoothing 50% 50%
More smoothing (default) 75% 25%
Maximum smoothing 90% 10%
62Wi-Fi Location-Based Services—Design and Deployment Considerations
OL-11612-01
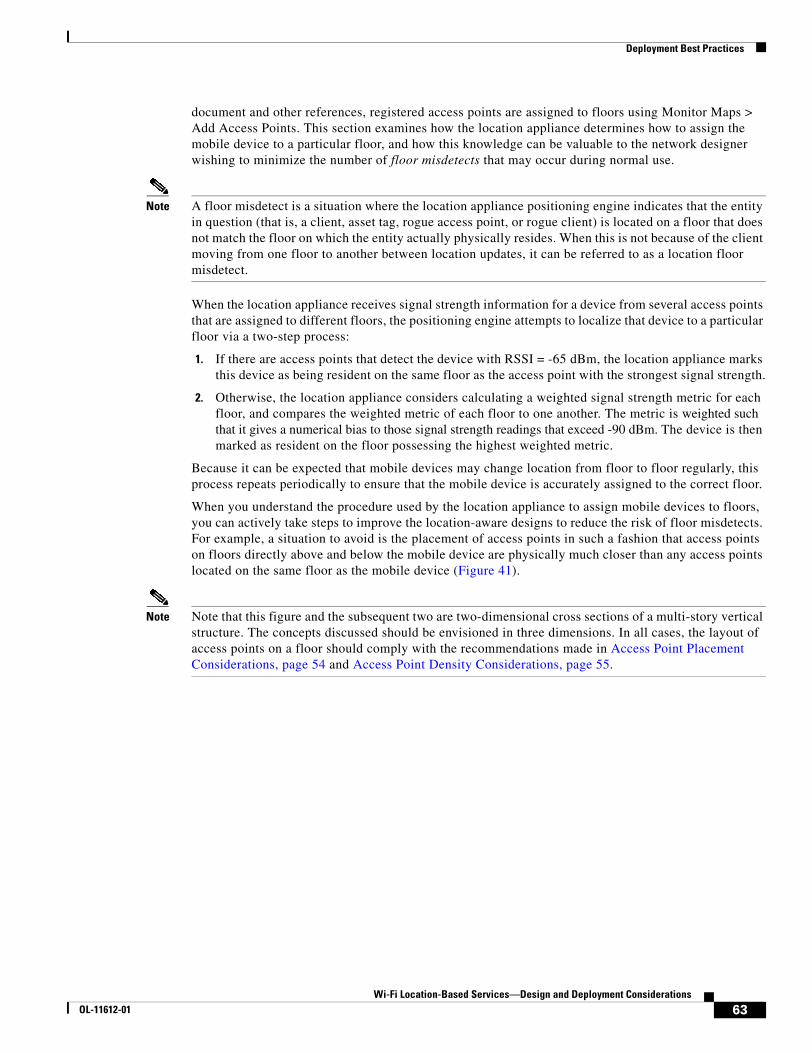
Deployment Best Practices
document and other references, registered access points are assigned to floors using Monitor Maps > Add Access Points. This section examines how the location appliance determines how to assign the mobile device to a particular floor, and how this knowledge can be valuable to the network designer wishing to minimize the number of floor misdetects that may occur during normal use.
Note A floor misdetect is a situation where the location appliance positioning engine indicates that the entity in question (that is, a client, asset tag, rogue access point, or rogue client) is located on a floor that does not match the floor on which the entity actually physically resides. When this is not because of the client moving from one floor to another between location updates, it can be referred to as a location floor misdetect.
When the location appliance receives signal strength information for a device from several access points that are assigned to different floors, the positioning engine attempts to localize that device to a particular floor via a two-step process:
1. If there are access points that detect the device with RSSI = -65 dBm, the location appliance marks this device as being resident on the same floor as the access point with the strongest signal strength.
2. Otherwise, the location appliance considers calculating a weighted signal strength metric for each floor, and compares the weighted metric of each floor to one another. The metric is weighted such that it gives a numerical bias to those signal strength readings that exceed -90 dBm. The device is then marked as resident on the floor possessing the highest weighted metric.
Because it can be expected that mobile devices may change location from floor to floor regularly, this process repeats periodically to ensure that the mobile device is accurately assigned to the correct floor.
When you understand the procedure used by the location appliance to assign mobile devices to floors, you can actively take steps to improve the location-aware designs to reduce the risk of floor misdetects. For example, a situation to avoid is the placement of access points in such a fashion that access points on floors directly above and below the mobile device are physically much closer than any access points located on the same floor as the mobile device (Figure 41).
Note Note that this figure and the subsequent two are two-dimensional cross sections of a multi-story vertical structure. The concepts discussed should be envisioned in three dimensions. In all cases, the layout of access points on a floor should comply with the recommendations made in Access Point Placement Considerations, page 54 and Access Point Density Considerations, page 55.
63Wi-Fi Location-Based Services—Design and Deployment Considerations
OL-11612-01
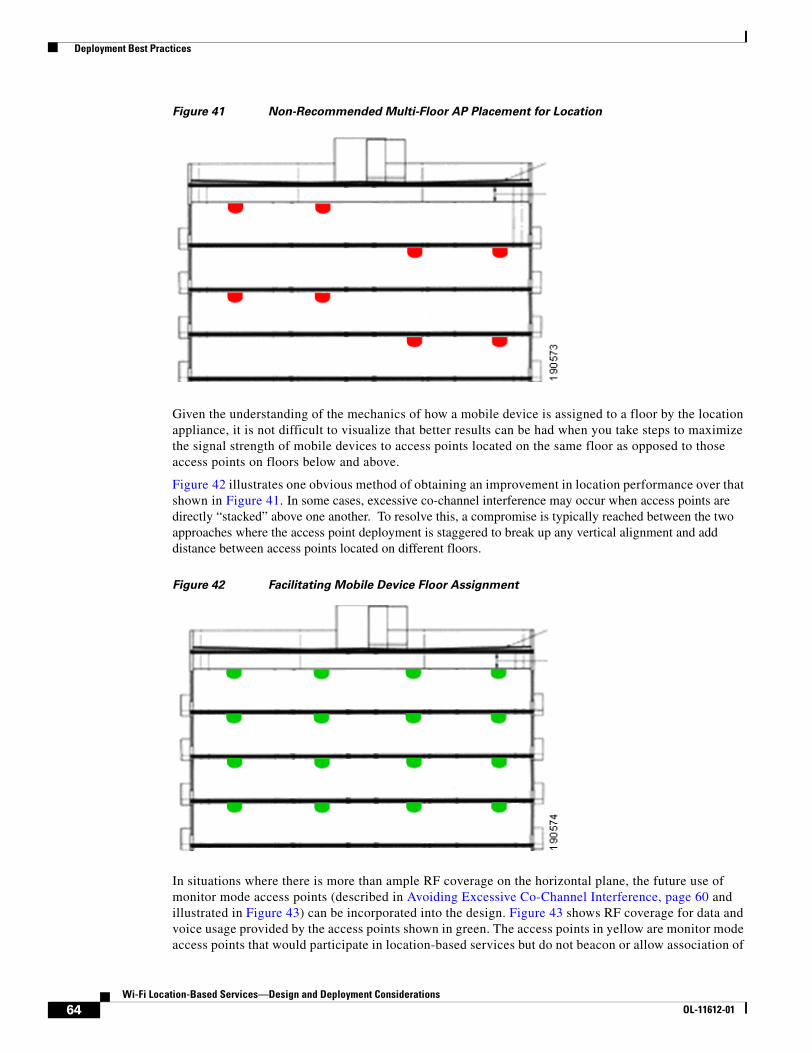
Deployment Best Practices
Figure 41 Non-Recommended Multi-Floor AP Placement for Location
Given the understanding of the mechanics of how a mobile device is assigned to a floor by the location appliance, it is not difficult to visualize that better results can be had when you take steps to maximize the signal strength of mobile devices to access points located on the same floor as opposed to those access points on floors below and above.
Figure 42 illustrates one obvious method of obtaining an improvement in location performance over that shown in Figure 41. In some cases, excessive co-channel interference may occur when access points are directly “stacked” above one another. To resolve this, a compromise is typically reached between the two approaches where the access point deployment is staggered to break up any vertical alignment and add distance between access points located on different floors.
Figure 42 Facilitating Mobile Device Floor Assignment
In situations where there is more than ample RF coverage on the horizontal plane, the future use of monitor mode access points (described in Avoiding Excessive Co-Channel Interference, page 60 and illustrated in Figure 43) can be incorporated into the design. Figure 43 shows RF coverage for data and voice usage provided by the access points shown in green. The access points in yellow are monitor mode access points that would participate in location-based services but do not beacon or allow association of
64Wi-Fi Location-Based Services—Design and Deployment Considerations
OL-11612-01
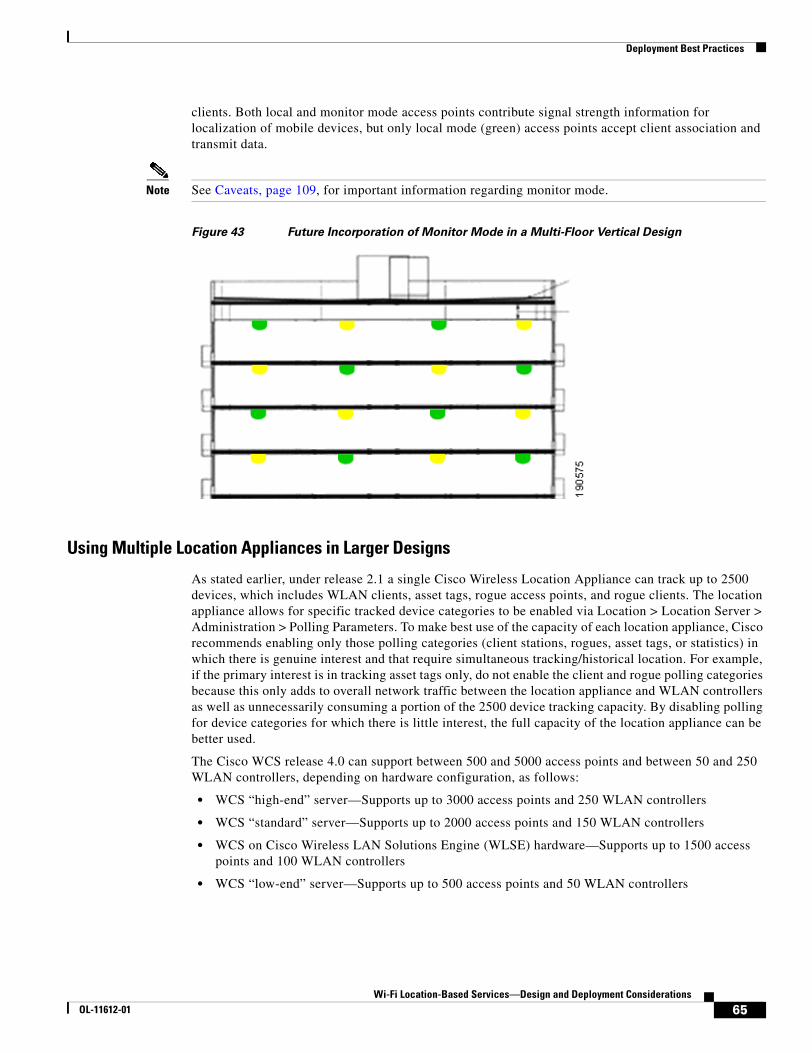
Deployment Best Practices
clients. Both local and monitor mode access points contribute signal strength information for localization of mobile devices, but only local mode (green) access points accept client association and transmit data.
Note See Caveats, page 109, for important information regarding monitor mode.
Figure 43 Future Incorporation of Monitor Mode in a Multi-Floor Vertical Design
Using Multiple Location Appliances in Larger Designs
As stated earlier, under release 2.1 a single Cisco Wireless Location Appliance can track up to 2500 devices, which includes WLAN clients, asset tags, rogue access points, and rogue clients. The location appliance allows for specific tracked device categories to be enabled via Location > Location Server > Administration > Polling Parameters. To make best use of the capacity of each location appliance, Cisco recommends enabling only those polling categories (client stations, rogues, asset tags, or statistics) in which there is genuine interest and that require simultaneous tracking/historical location. For example, if the primary interest is in tracking asset tags only, do not enable the client and rogue polling categories because this only adds to overall network traffic between the location appliance and WLAN controllers as well as unnecessarily consuming a portion of the 2500 device tracking capacity. By disabling polling for device categories for which there is little interest, the full capacity of the location appliance can be better used.
The Cisco WCS release 4.0 can support between 500 and 5000 access points and between 50 and 250 WLAN controllers, depending on hardware configuration, as follows:
• WCS “high-end” server—Supports up to 3000 access points and 250 WLAN controllers
• WCS “standard” server—Supports up to 2000 access points and 150 WLAN controllers
• WCS on Cisco Wireless LAN Solutions Engine (WLSE) hardware—Supports up to 1500 access points and 100 WLAN controllers
• WCS “low-end” server—Supports up to 500 access points and 50 WLAN controllers
65Wi-Fi Location-Based Services—Design and Deployment Considerations
OL-11612-01
Deployment Best Practices
Note For complete details, see Cisco Wireless Control System Configuration Guide, System Requirements at the following URL: http://www.cisco.com/en/US/products/ps6305/products_configuration_guide_chapter09186a00806b71e8.html#wp1061082
From this information, you can see that the maximum size of the WCS management domain (that is, the total number of devices managed by a single WCS) is limited by the choice of server platform. In very large networks, it may be necessary to partition the network into multiple management domains, each with a WCS governing it. The management chapter of the Cisco Unified Wireless Network Solutions Reference Design Guide contains additional considerations you should keep in mind for single and multiple management domain designs.
Note Keep in mind that as of release 4.0.155.0, WLAN controllers each support a maximum of 500 L2 active 802.11 RFID tags. Each controller is capable of detecting the RSSI of each tracked device from a maximum of eight access points at any time.
Although the maximum size of the management domain is limited by the capacity of WCS, the maximum size of the location domain (that is, the number of devices tracked by a single location appliance) is limited by the tracked device capacity of the location appliance. In most cases, the standard deployment model of a single WCS management domain combined with a single location domain (Figure 44) meets the raw tracking needs of the majority of users.
66Wi-Fi Location-Based Services—Design and Deployment Considerations
OL-11612-01
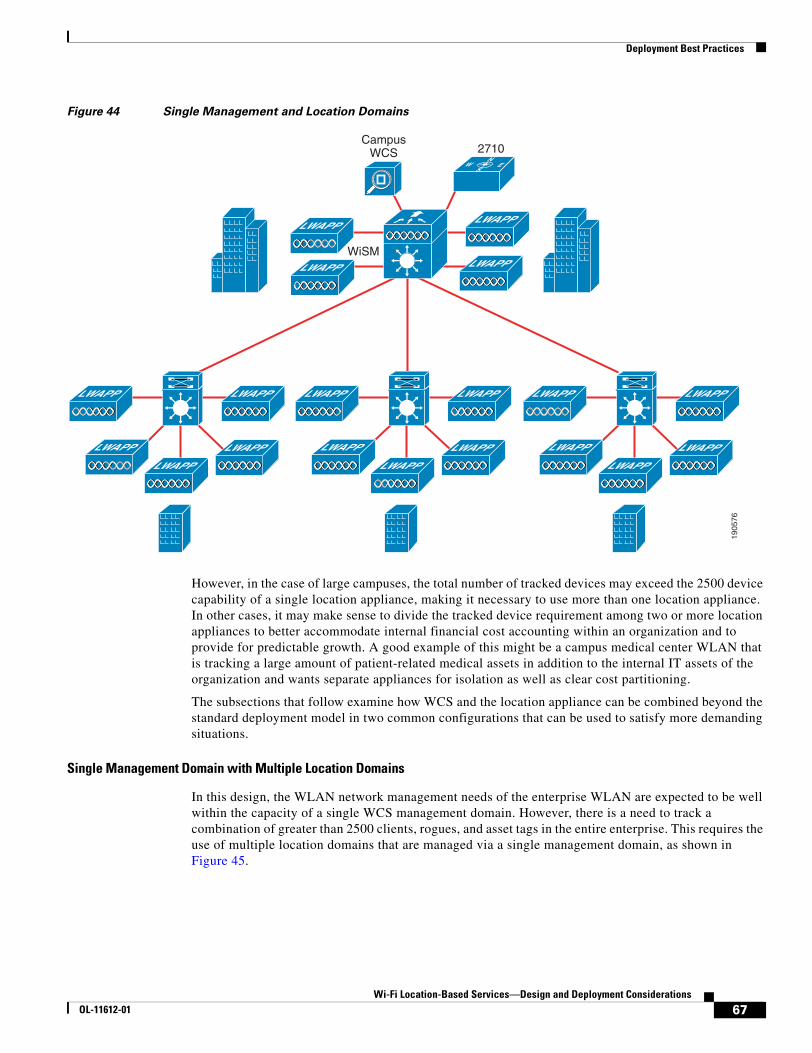
Deployment Best Practices
Figure 44 Single Management and Location Domains
However, in the case of large campuses, the total number of tracked devices may exceed the 2500 device capability of a single location appliance, making it necessary to use more than one location appliance. In other cases, it may make sense to divide the tracked device requirement among two or more location appliances to better accommodate internal financial cost accounting within an organization and to provide for predictable growth. A good example of this might be a campus medical center WLAN that is tracking a large amount of patient-related medical assets in addition to the internal IT assets of the organization and wants separate appliances for isolation as well as clear cost partitioning.
The subsections that follow examine how WCS and the location appliance can be combined beyond the standard deployment model in two common configurations that can be used to satisfy more demanding situations.
Single Management Domain with Multiple Location Domains
In this design, the WLAN network management needs of the enterprise WLAN are expected to be well within the capacity of a single WCS management domain. However, there is a need to track a combination of greater than 2500 clients, rogues, and asset tags in the entire enterprise. This requires the use of multiple location domains that are managed via a single management domain, as shown in Figure 45.
1905
76
CampusWCS 2710
WiSMLWAPP
LWAPPLWAPP
LWAPP
LWAPP
LWAPP LWAPP
W ESN
LWAPP
LWAPP
LWAPPLWAPP
LWAPP
LWAPP
LWAPP
LWAPPLWAPP
LWAPP
LWAPP
LWAPP
67Wi-Fi Location-Based Services—Design and Deployment Considerations
OL-11612-01
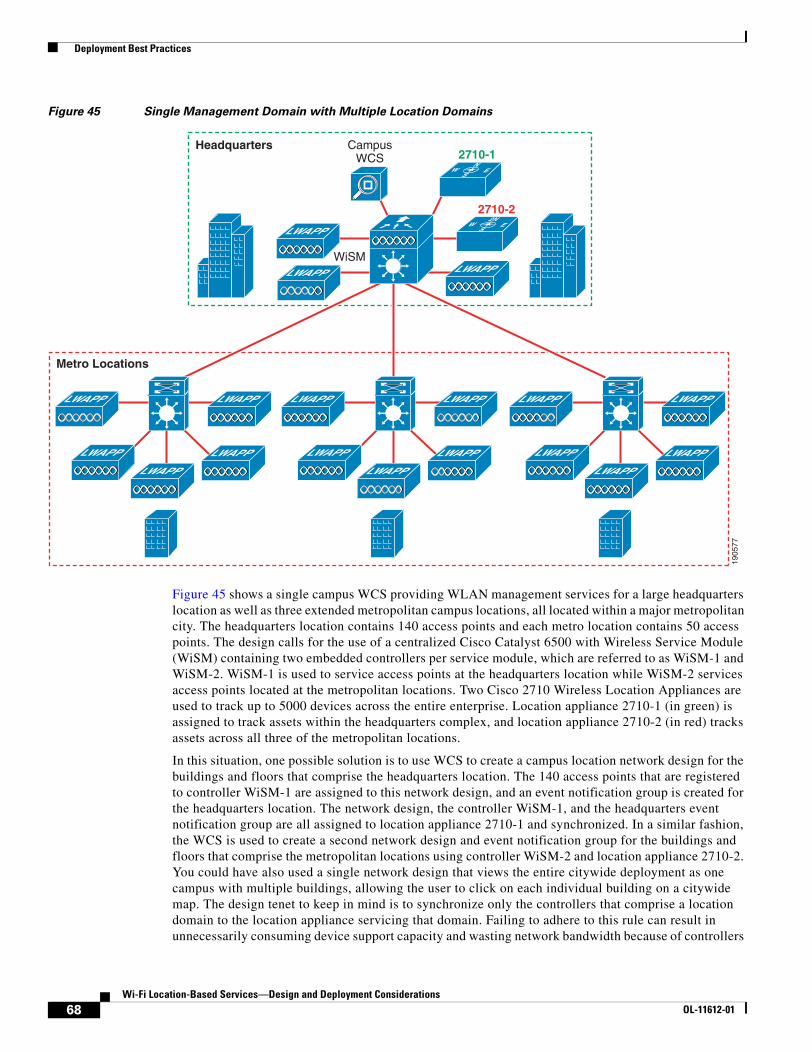
Deployment Best Practices
Figure 45 Single Management Domain with Multiple Location Domains
Figure 45 shows a single campus WCS providing WLAN management services for a large headquarters location as well as three extended metropolitan campus locations, all located within a major metropolitan city. The headquarters location contains 140 access points and each metro location contains 50 access points. The design calls for the use of a centralized Cisco Catalyst 6500 with Wireless Service Module (WiSM) containing two embedded controllers per service module, which are referred to as WiSM-1 and WiSM-2. WiSM-1 is used to service access points at the headquarters location while WiSM-2 services access points located at the metropolitan locations. Two Cisco 2710 Wireless Location Appliances are used to track up to 5000 devices across the entire enterprise. Location appliance 2710-1 (in green) is assigned to track assets within the headquarters complex, and location appliance 2710-2 (in red) tracks assets across all three of the metropolitan locations.
In this situation, one possible solution is to use WCS to create a campus location network design for the buildings and floors that comprise the headquarters location. The 140 access points that are registered to controller WiSM-1 are assigned to this network design, and an event notification group is created for the headquarters location. The network design, the controller WiSM-1, and the headquarters event notification group are all assigned to location appliance 2710-1 and synchronized. In a similar fashion, the WCS is used to create a second network design and event notification group for the buildings and floors that comprise the metropolitan locations using controller WiSM-2 and location appliance 2710-2. You could have also used a single network design that views the entire citywide deployment as one campus with multiple buildings, allowing the user to click on each individual building on a citywide map. The design tenet to keep in mind is to synchronize only the controllers that comprise a location domain to the location appliance servicing that domain. Failing to adhere to this rule can result in unnecessarily consuming device support capacity and wasting network bandwidth because of controllers
1905
77
CampusWCS 2710-1
WiSM
Headquarters
Metro Locations
2710-2
LWAPP
LWAPPLWAPP
LWAPP
LWAPP
LWAPP
W ESN
LWAPP
LWAPP
LWAPPLWAPP
LWAPP
LWAPP
LWAPP
LWAPPLWAPP
LWAPP
LWAPP
LWAPP
W ES2N
68Wi-Fi Location-Based Services—Design and Deployment Considerations
OL-11612-01
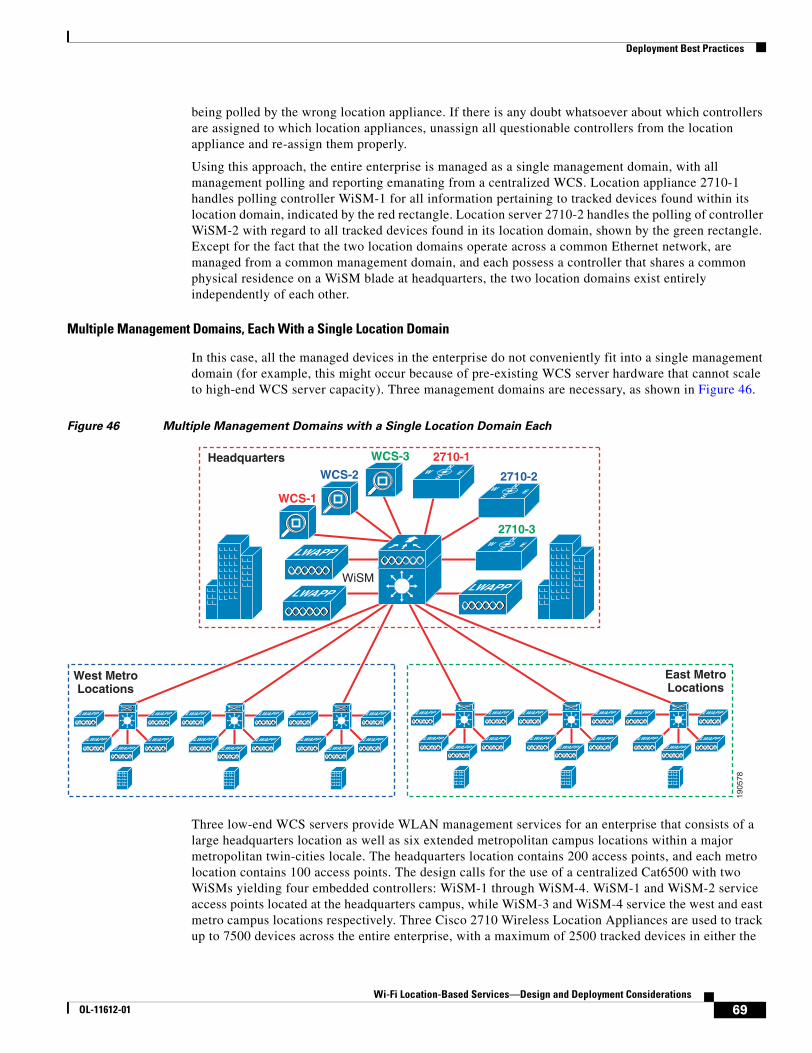
Deployment Best Practices
being polled by the wrong location appliance. If there is any doubt whatsoever about which controllers are assigned to which location appliances, unassign all questionable controllers from the location appliance and re-assign them properly.
Using this approach, the entire enterprise is managed as a single management domain, with all management polling and reporting emanating from a centralized WCS. Location appliance 2710-1 handles polling controller WiSM-1 for all information pertaining to tracked devices found within its location domain, indicated by the red rectangle. Location server 2710-2 handles the polling of controller WiSM-2 with regard to all tracked devices found in its location domain, shown by the green rectangle. Except for the fact that the two location domains operate across a common Ethernet network, are managed from a common management domain, and each possess a controller that shares a common physical residence on a WiSM blade at headquarters, the two location domains exist entirely independently of each other.
Multiple Management Domains, Each With a Single Location Domain
In this case, all the managed devices in the enterprise do not conveniently fit into a single management domain (for example, this might occur because of pre-existing WCS server hardware that cannot scale to high-end WCS server capacity). Three management domains are necessary, as shown in Figure 46.
Figure 46 Multiple Management Domains with a Single Location Domain Each
Three low-end WCS servers provide WLAN management services for an enterprise that consists of a large headquarters location as well as six extended metropolitan campus locations within a major metropolitan twin-cities locale. The headquarters location contains 200 access points, and each metro location contains 100 access points. The design calls for the use of a centralized Cat6500 with two WiSMs yielding four embedded controllers: WiSM-1 through WiSM-4. WiSM-1 and WiSM-2 service access points located at the headquarters campus, while WiSM-3 and WiSM-4 service the west and east metro campus locations respectively. Three Cisco 2710 Wireless Location Appliances are used to track up to 7500 devices across the entire enterprise, with a maximum of 2500 tracked devices in either the
1905
78
2710-2
WiSM
Headquarters
West MetroLocations
LWAPP LWAPP
LWAPP
W ESN
2710-1
W ESN
LWAPPLWAPP
LWAPP
LWAPP
LWAPP
LWAPPLWAPP
LWAPP
LWAPP
LWAPP
LWAPPLWAPP
LWAPP
LWAPP
LWAPP
LWAPPLWAPP
LWAPP
LWAPP
LWAPP
LWAPPLWAPP
LWAPP
LWAPP
LWAPP
LWAPPLWAPP
LWAPP
LWAPP
LWAPP
East MetroLocations
2710-3
W ESN
WCS-2
WCS-1
WCS-3
69Wi-Fi Location-Based Services—Design and Deployment Considerations
OL-11612-01
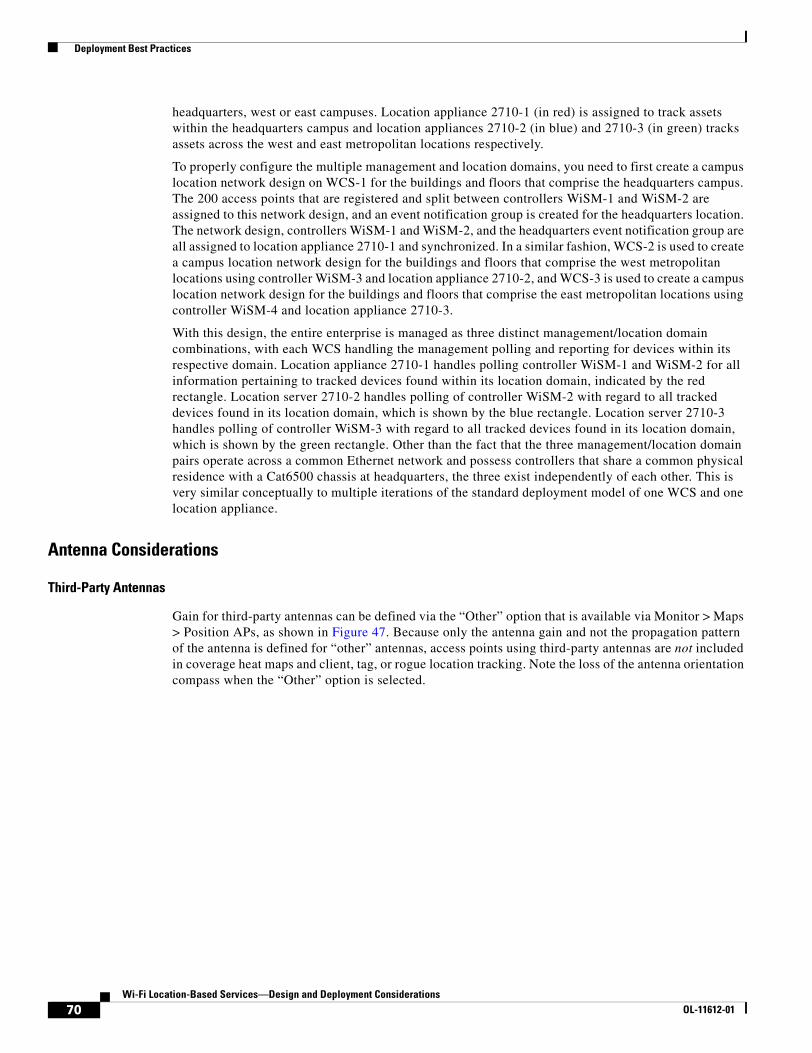
Deployment Best Practices
headquarters, west or east campuses. Location appliance 2710-1 (in red) is assigned to track assets within the headquarters campus and location appliances 2710-2 (in blue) and 2710-3 (in green) tracks assets across the west and east metropolitan locations respectively.
To properly configure the multiple management and location domains, you need to first create a campus location network design on WCS-1 for the buildings and floors that comprise the headquarters campus. The 200 access points that are registered and split between controllers WiSM-1 and WiSM-2 are assigned to this network design, and an event notification group is created for the headquarters location. The network design, controllers WiSM-1 and WiSM-2, and the headquarters event notification group are all assigned to location appliance 2710-1 and synchronized. In a similar fashion, WCS-2 is used to create a campus location network design for the buildings and floors that comprise the west metropolitan locations using controller WiSM-3 and location appliance 2710-2, and WCS-3 is used to create a campus location network design for the buildings and floors that comprise the east metropolitan locations using controller WiSM-4 and location appliance 2710-3.
With this design, the entire enterprise is managed as three distinct management/location domain combinations, with each WCS handling the management polling and reporting for devices within its respective domain. Location appliance 2710-1 handles polling controller WiSM-1 and WiSM-2 for all information pertaining to tracked devices found within its location domain, indicated by the red rectangle. Location server 2710-2 handles polling of controller WiSM-2 with regard to all tracked devices found in its location domain, which is shown by the blue rectangle. Location server 2710-3 handles polling of controller WiSM-3 with regard to all tracked devices found in its location domain, which is shown by the green rectangle. Other than the fact that the three management/location domain pairs operate across a common Ethernet network and possess controllers that share a common physical residence with a Cat6500 chassis at headquarters, the three exist independently of each other. This is very similar conceptually to multiple iterations of the standard deployment model of one WCS and one location appliance.
Antenna Considerations
Third-Party Antennas
Gain for third-party antennas can be defined via the “Other” option that is available via Monitor > Maps > Position APs, as shown in Figure 47. Because only the antenna gain and not the propagation pattern of the antenna is defined for “other” antennas, access points using third-party antennas are not included in coverage heat maps and client, tag, or rogue location tracking. Note the loss of the antenna orientation compass when the “Other” option is selected.
70Wi-Fi Location-Based Services—Design and Deployment Considerations
OL-11612-01
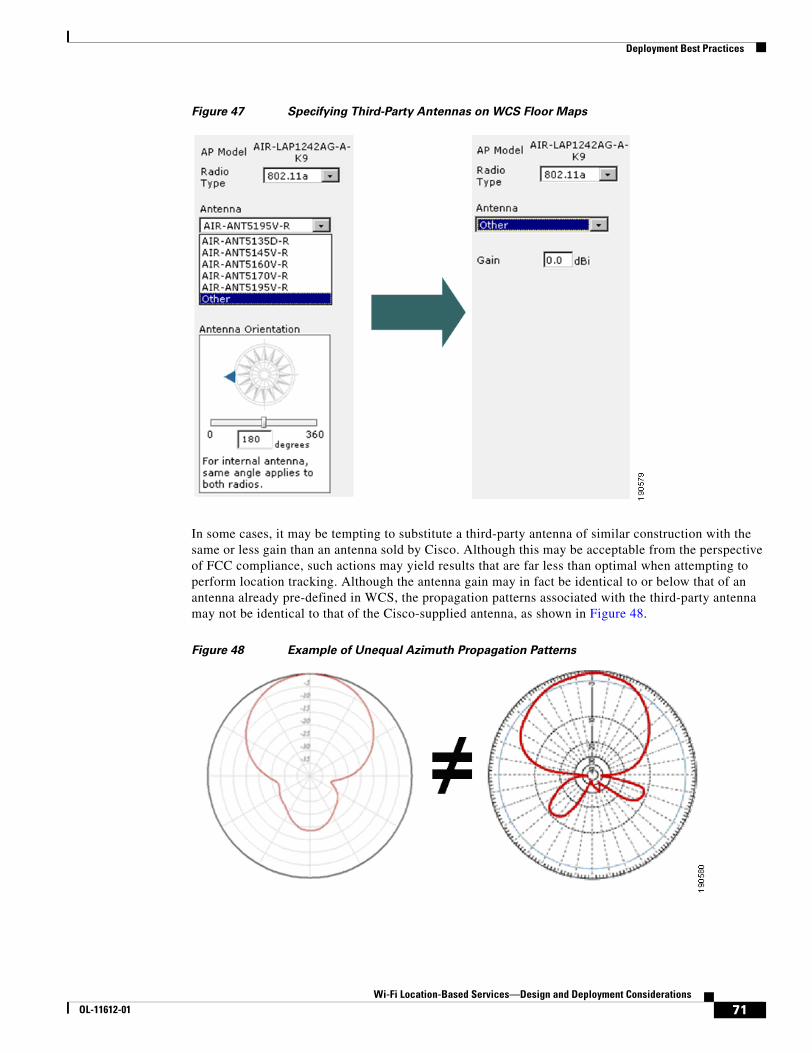
Deployment Best Practices
Figure 47 Specifying Third-Party Antennas on WCS Floor Maps
In some cases, it may be tempting to substitute a third-party antenna of similar construction with the same or less gain than an antenna sold by Cisco. Although this may be acceptable from the perspective of FCC compliance, such actions may yield results that are far less than optimal when attempting to perform location tracking. Although the antenna gain may in fact be identical to or below that of an antenna already pre-defined in WCS, the propagation patterns associated with the third-party antenna may not be identical to that of the Cisco-supplied antenna, as shown in Figure 48.
Figure 48 Example of Unequal Azimuth Propagation Patterns
71Wi-Fi Location-Based Services—Design and Deployment Considerations
OL-11612-01
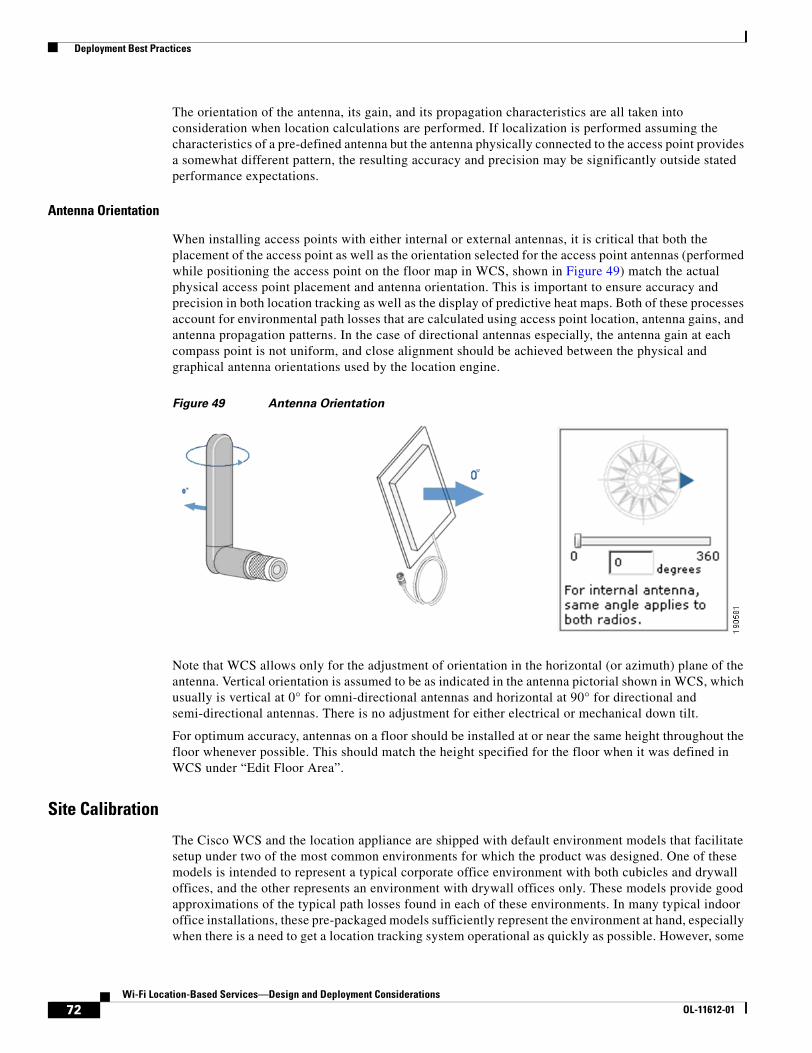
Deployment Best Practices
The orientation of the antenna, its gain, and its propagation characteristics are all taken into consideration when location calculations are performed. If localization is performed assuming the characteristics of a pre-defined antenna but the antenna physically connected to the access point provides a somewhat different pattern, the resulting accuracy and precision may be significantly outside stated performance expectations.
Antenna Orientation
When installing access points with either internal or external antennas, it is critical that both the placement of the access point as well as the orientation selected for the access point antennas (performed while positioning the access point on the floor map in WCS, shown in Figure 49) match the actual physical access point placement and antenna orientation. This is important to ensure accuracy and precision in both location tracking as well as the display of predictive heat maps. Both of these processes account for environmental path losses that are calculated using access point location, antenna gains, and antenna propagation patterns. In the case of directional antennas especially, the antenna gain at each compass point is not uniform, and close alignment should be achieved between the physical and graphical antenna orientations used by the location engine.
Figure 49 Antenna Orientation
Note that WCS allows only for the adjustment of orientation in the horizontal (or azimuth) plane of the antenna. Vertical orientation is assumed to be as indicated in the antenna pictorial shown in WCS, which usually is vertical at 0° for omni-directional antennas and horizontal at 90° for directional and semi-directional antennas. There is no adjustment for either electrical or mechanical down tilt.
For optimum accuracy, antennas on a floor should be installed at or near the same height throughout the floor whenever possible. This should match the height specified for the floor when it was defined in WCS under “Edit Floor Area”.
Site Calibration
The Cisco WCS and the location appliance are shipped with default environment models that facilitate setup under two of the most common environments for which the product was designed. One of these models is intended to represent a typical corporate office environment with both cubicles and drywall offices, and the other represents an environment with drywall offices only. These models provide good approximations of the typical path losses found in each of these environments. In many typical indoor office installations, these pre-packaged models sufficiently represent the environment at hand, especially when there is a need to get a location tracking system operational as quickly as possible. However, some
72Wi-Fi Location-Based Services—Design and Deployment Considerations
OL-11612-01
Deployment Best Practices
indoor environments may possess more attenuation than is found in a typical office environment. In properly designed indoor installations where increased attenuation may be contributing to poor accuracy and precision, a site calibration can in many cases help restore lost performance. When an on-site calibration is performed, the system is provided with a better understanding of the propagation characteristics specific to the target environment. In some cases, by using this information instead of the default models, the degree of error between reported and observed client location can be reduced with overall system accuracy being improved.
Calibration is actually a multi-step process that begins with defining a new calibration model via Monitor > Maps > RF Calibration Models > Create New Model. Next, data points must be added to the calibration model using a calibration client that is associated to the WLAN infrastructure and accessing Monitor > Maps > RF Calibration Model > model name > Add Data Points. During the data point collection process, the calibration client repeatedly broadcasts probe requests on all channels that are responded to by the access points in the area. If the calibration client is a CCXv2 or greater client and CCX Location Measurements have been enabled in the controllers, the CCXv2 calibration client responds with probe requests on command whenever location measurement broadcasts are received.
The client repeats sending probe requests several times, giving WCS and the location appliance ample opportunity to collect RSSI information from the controllers for input into the calibration database. Calibration data collection should be performed after the system has been installed, basic coverage checks are completed, and the recommended RSSI cutoff (typically -75 dB or better) to a minimum of three (preferably four or more) access points has been verified throughout. All WLAN access points should be in place and registered to their respective controllers with WCS and the location appliance fully operational.
During the calibration data collection process, WCS suggests locations on the floor map where samples should be taken (shown in Figure 50) with an indication of the degree of progress achieved thus far. The process can be completed in one session, or the session can be stopped and returned to at a later time.
73Wi-Fi Location-Based Services—Design and Deployment Considerations
OL-11612-01
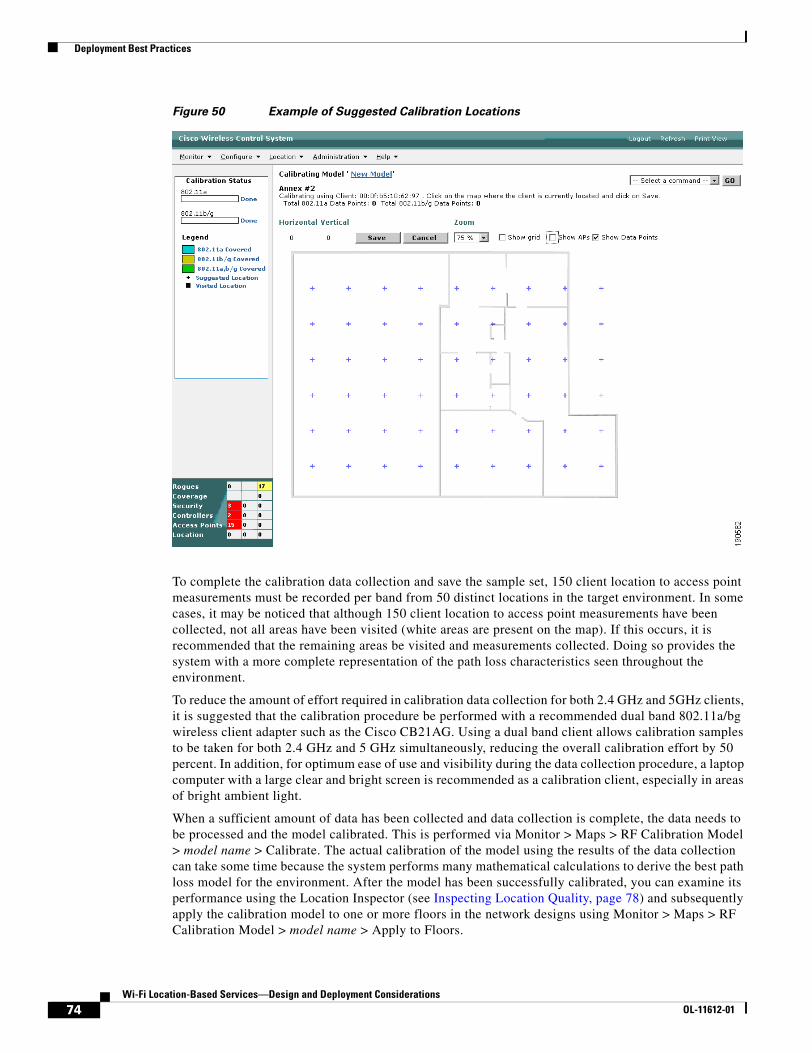
Deployment Best Practices
Figure 50 Example of Suggested Calibration Locations
To complete the calibration data collection and save the sample set, 150 client location to access point measurements must be recorded per band from 50 distinct locations in the target environment. In some cases, it may be noticed that although 150 client location to access point measurements have been collected, not all areas have been visited (white areas are present on the map). If this occurs, it is recommended that the remaining areas be visited and measurements collected. Doing so provides the system with a more complete representation of the path loss characteristics seen throughout the environment.
To reduce the amount of effort required in calibration data collection for both 2.4 GHz and 5GHz clients, it is suggested that the calibration procedure be performed with a recommended dual band 802.11a/bg wireless client adapter such as the Cisco CB21AG. Using a dual band client allows calibration samples to be taken for both 2.4 GHz and 5 GHz simultaneously, reducing the overall calibration effort by 50 percent. In addition, for optimum ease of use and visibility during the data collection procedure, a laptop computer with a large clear and bright screen is recommended as a calibration client, especially in areas of bright ambient light.
When a sufficient amount of data has been collected and data collection is complete, the data needs to be processed and the model calibrated. This is performed via Monitor > Maps > RF Calibration Model > model name > Calibrate. The actual calibration of the model using the results of the data collection can take some time because the system performs many mathematical calculations to derive the best path loss model for the environment. After the model has been successfully calibrated, you can examine its performance using the Location Inspector (see Inspecting Location Quality, page 78) and subsequently apply the calibration model to one or more floors in the network designs using Monitor > Maps > RF Calibration Model > model name > Apply to Floors.
74Wi-Fi Location-Based Services—Design and Deployment Considerations
OL-11612-01
Deployment Best Practices
Detailed procedures covering the steps involved in performing a RF calibration can be found in the Cisco Wireless Location Appliance: Deployment Guide at the following URL: http://www.cisco.com/en/US/products/ps6386/prod_technical_reference09186a008059ce31.html.
Calibration Validity
A properly performed site calibration is considered valid as long as the fundamental environmental factors affecting RF propagation (such as attenuation, path loss, and so on) in the target environment have not deviated significantly from the state under which the original calibration was performed. For example, significant changes in the material contents of the target environment may have impact on the path losses experienced. Unless accounted for with an updated calibration, such changes may cause inaccuracies when using calibrations and path loss models that were formulated in the past.
Whenever there are significant changes in factors affecting RF propagation in this manner, calibration should be repeated. This allows the system to better understand the level of attenuation and fading present in the current environment and allow it to re-calculate the path loss model. In many cases, this aids in restoring lost performance to the system under the conditions found in the new environment.
Examples of the types of changes where a re-calibration might be recommended if a significant drop in performance is noticed include but are not limited to the following cases:
• Changes in material—A storeroom that once contained paper products has been converted to a food storeroom stocking canned goods (that is, canned peaches in heavy syrup).
• Changes in interior walls—A newly re-modeled hospital now has interior walls and metal swinging doors installed where none existed before. The composition of some existing walls has changed from drywall construction to another material to meet new health and safety codes.
• Changes in stocking density—A large storeroom was originally calibrated when racks contained only six shelves of equipment. But now, density has increased to ten shelves per rack.
• Changes in stocking levels—A large stockroom that was calibrated when it was less than fifteen percent stocked, but now is filled to capacity.
Keep in mind that not every environmental change requires a re-calibration. Assuming that the original installation followed recommended best practices, one or more of the following changes occurring within the environment would normally not necessitate a re-calibration:
• Changes in the number or location of access points installed
• Changes in the type or gain of antennas
• Changes in the compass orientation of antennas
Note Note, however, that the re-positioning of current access points or the addition of new ones will require the updated network designs to be re-synchronized between WCS and the location appliance.
It has been noticed that in cases where Cisco Aironet 1230 LWAPP access points are deployed in location-aware designs, inconsistencies in reported client signal strength levels may occur at times. Therefore, Cisco recommends that when Cisco 1230 Aironet access points are deployed, a site calibration should always be performed.
75Wi-Fi Location-Based Services—Design and Deployment Considerations
OL-11612-01
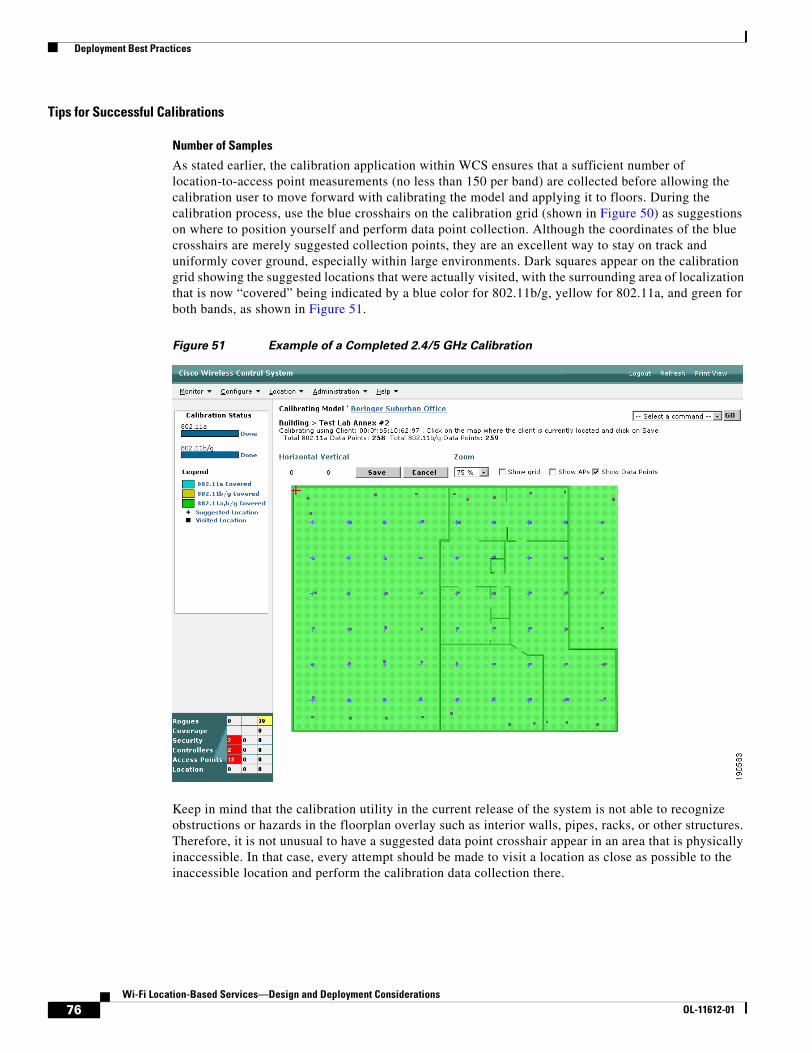
Deployment Best Practices
Tips for Successful Calibrations
Number of Samples
As stated earlier, the calibration application within WCS ensures that a sufficient number of location-to-access point measurements (no less than 150 per band) are collected before allowing the calibration user to move forward with calibrating the model and applying it to floors. During the calibration process, use the blue crosshairs on the calibration grid (shown in Figure 50) as suggestions on where to position yourself and perform data point collection. Although the coordinates of the blue crosshairs are merely suggested collection points, they are an excellent way to stay on track and uniformly cover ground, especially within large environments. Dark squares appear on the calibration grid showing the suggested locations that were actually visited, with the surrounding area of localization that is now “covered” being indicated by a blue color for 802.11b/g, yellow for 802.11a, and green for both bands, as shown in Figure 51.
Figure 51 Example of a Completed 2.4/5 GHz Calibration
Keep in mind that the calibration utility in the current release of the system is not able to recognize obstructions or hazards in the floorplan overlay such as interior walls, pipes, racks, or other structures. Therefore, it is not unusual to have a suggested data point crosshair appear in an area that is physically inaccessible. In that case, every attempt should be made to visit a location as close as possible to the inaccessible location and perform the calibration data collection there.
76Wi-Fi Location-Based Services—Design and Deployment Considerations
OL-11612-01
Deployment Best Practices
Calibrating Under Representative Conditions
As mentioned previously, the location appliance and the Cisco WCS use the information gathered during a site calibration to better understand the propagation characteristics present within the environment. This information is culled from the aggregate of all data collection performed during the calibration. To facilitate an accurate calibration, Cisco recommends that the environment in which the calibration is performed be representative of the daily production environment to the greatest extent possible.
For example, the calibration should be performed during business hours when the facility contains a representative population of people (human attenuation) as well as material on shelves (material attenuation). If carts, racks, beds, or other large metallic objects are normally used in this environment, these should also be present during calibration. If large doors are present in the environment, they should be positioned as they would normally be during business hours. In many (but certainly not all) cases, calibration done during the normal business hours are more representative of the actual daily environment than off-hours calibration.
In some cases, the most convenient time to perform a calibration might be before people and contents are moved in. Cisco recommends that the temptation to perform a site calibration of such “empty rooms” be avoided to not create a path loss model that has little relation to the actual production environment. Such cases are typical of facilities after they are first built but before personnel and material have been fully moved in.
If it cannot be determined from prior conversations with site personnel, one way to determine a good time to perform a calibration is to visit the site beforehand and observe the activity pattern of both the facility and the personnel present. Observing the activity patterns beforehand in many cases allows the designer to plan for the optimum time to perform the calibration, so as to yield the most representative results and also to not excessively inconvenience the personnel employed at the facility.
Keep in mind that when faced with a site that possesses constantly changing environmental conditions, results are typically better when the calibration is performed in an environment that contains more attenuation and path loss than is seen during normal use rather than less path loss.
Recommended Calibration Clients and Transmit Power
Cisco recommends using the Cisco Aironet 802.11 a/b/g Wireless Cardbus Adapter Client (AIR-CB21AG) with recent drivers and firmware (CCX version 2 or better) as a calibration data collection client. Versions of CCX earlier than version 2 are not ideal for calibration usage.
When performing the calibration data collection, ensure that your calibration client is being detected by access points on the floor where you wish to perform the calibration. For best results during calibration, perform one of the following:
• Disable automatic power assignment on all applicable access point radios within the calibration environment
• Ensure that TX Power assignment mode for each access point radio is set to a “custom” value
For best results with either of these alternatives, set the transmit power of each access point to a known fixed level that is as close as possible to the default transmit power of the calibration client. At the completion of calibration, all these values can be returned to their original settings.
As mentioned in Minimum Signal Level Thresholds, page 51 and Access Point Density Considerations, page 55, Cisco highly recommends that at least three (and preferably four or more) access points be able to detect mobile client devices and asset tags at signal levels that are at the RSSI cutoff value (typically -75 dB) or better. When verifying this, it is important to ensure not only that all installed access points and antennas are representative of the final installation but to be mindful as well of maximum transmitter power output of the mobile device being used to verify signal thresholds. Remember, you are interested in the signal level of the client as it is detected by the access points, not vice-versa.
77Wi-Fi Location-Based Services—Design and Deployment Considerations
OL-11612-01
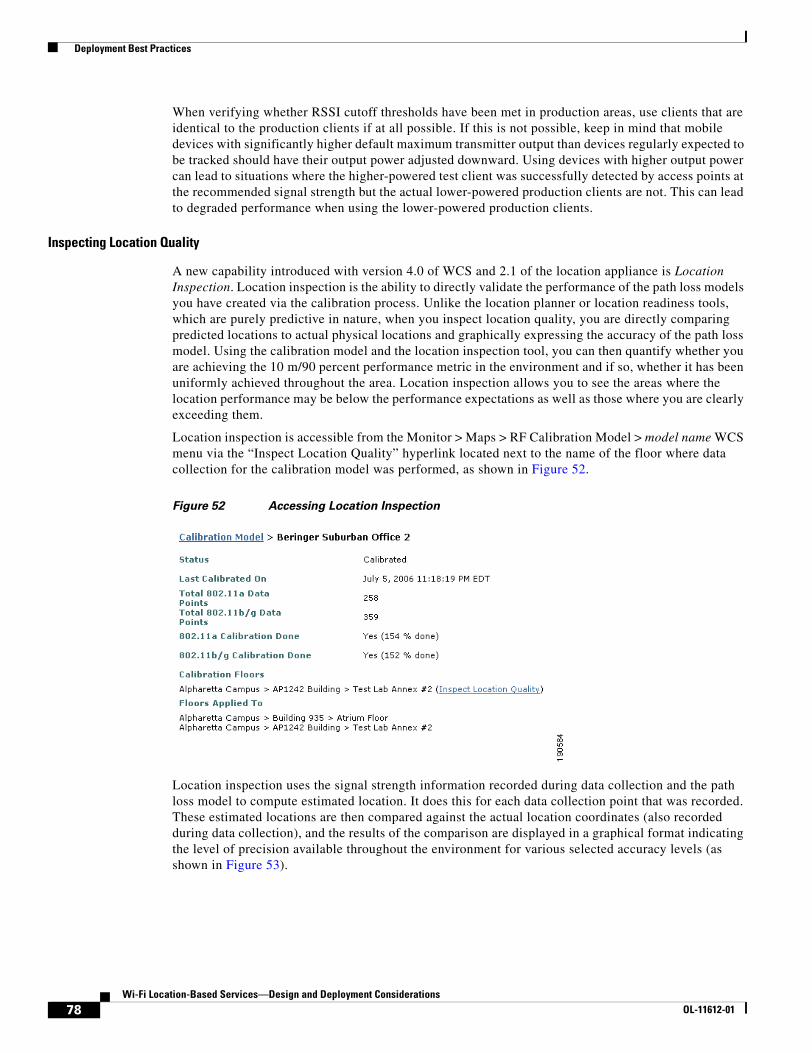
Deployment Best Practices
When verifying whether RSSI cutoff thresholds have been met in production areas, use clients that are identical to the production clients if at all possible. If this is not possible, keep in mind that mobile devices with significantly higher default maximum transmitter output than devices regularly expected to be tracked should have their output power adjusted downward. Using devices with higher output power can lead to situations where the higher-powered test client was successfully detected by access points at the recommended signal strength but the actual lower-powered production clients are not. This can lead to degraded performance when using the lower-powered production clients.
Inspecting Location Quality
A new capability introduced with version 4.0 of WCS and 2.1 of the location appliance is Location Inspection. Location inspection is the ability to directly validate the performance of the path loss models you have created via the calibration process. Unlike the location planner or location readiness tools, which are purely predictive in nature, when you inspect location quality, you are directly comparing predicted locations to actual physical locations and graphically expressing the accuracy of the path loss model. Using the calibration model and the location inspection tool, you can then quantify whether you are achieving the 10 m/90 percent performance metric in the environment and if so, whether it has been uniformly achieved throughout the area. Location inspection allows you to see the areas where the location performance may be below the performance expectations as well as those where you are clearly exceeding them.
Location inspection is accessible from the Monitor > Maps > RF Calibration Model > model name WCS menu via the “Inspect Location Quality” hyperlink located next to the name of the floor where data collection for the calibration model was performed, as shown in Figure 52.
Figure 52 Accessing Location Inspection
Location inspection uses the signal strength information recorded during data collection and the path loss model to compute estimated location. It does this for each data collection point that was recorded. These estimated locations are then compared against the actual location coordinates (also recorded during data collection), and the results of the comparison are displayed in a graphical format indicating the level of precision available throughout the environment for various selected accuracy levels (as shown in Figure 53).
78Wi-Fi Location-Based Services—Design and Deployment Considerations
OL-11612-01
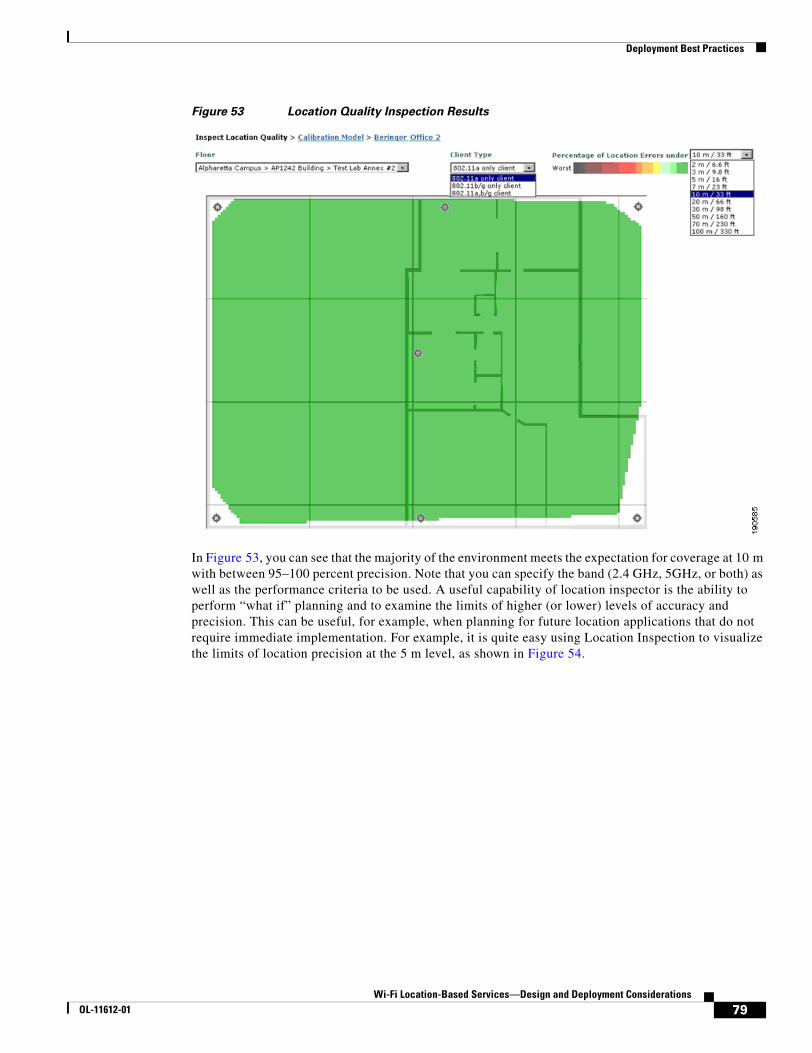
Deployment Best Practices
Figure 53 Location Quality Inspection Results
In Figure 53, you can see that the majority of the environment meets the expectation for coverage at 10 m with between 95–100 percent precision. Note that you can specify the band (2.4 GHz, 5GHz, or both) as well as the performance criteria to be used. A useful capability of location inspector is the ability to perform “what if” planning and to examine the limits of higher (or lower) levels of accuracy and precision. This can be useful, for example, when planning for future location applications that do not require immediate implementation. For example, it is quite easy using Location Inspection to visualize the limits of location precision at the 5 m level, as shown in Figure 54.
79Wi-Fi Location-Based Services—Design and Deployment Considerations
OL-11612-01
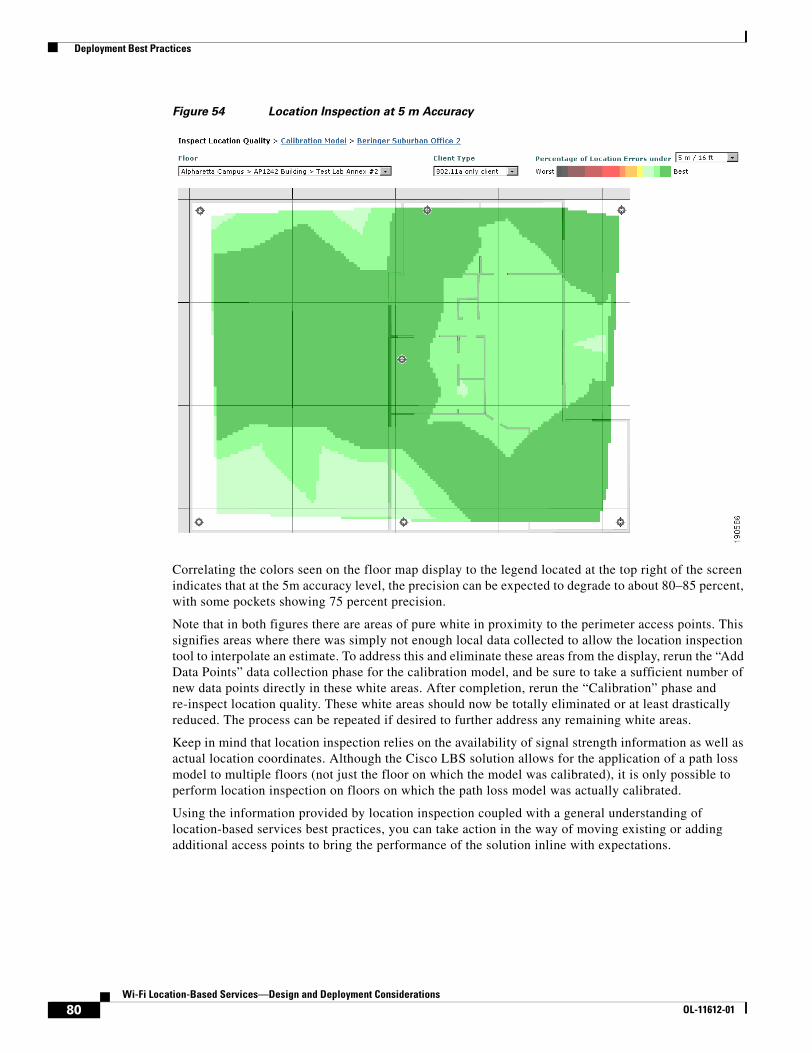
Deployment Best Practices
Figure 54 Location Inspection at 5 m Accuracy
Correlating the colors seen on the floor map display to the legend located at the top right of the screen indicates that at the 5m accuracy level, the precision can be expected to degrade to about 80–85 percent, with some pockets showing 75 percent precision.
Note that in both figures there are areas of pure white in proximity to the perimeter access points. This signifies areas where there was simply not enough local data collected to allow the location inspection tool to interpolate an estimate. To address this and eliminate these areas from the display, rerun the “Add Data Points” data collection phase for the calibration model, and be sure to take a sufficient number of new data points directly in these white areas. After completion, rerun the “Calibration” phase and re-inspect location quality. These white areas should now be totally eliminated or at least drastically reduced. The process can be repeated if desired to further address any remaining white areas.
Keep in mind that location inspection relies on the availability of signal strength information as well as actual location coordinates. Although the Cisco LBS solution allows for the application of a path loss model to multiple floors (not just the floor on which the model was calibrated), it is only possible to perform location inspection on floors on which the path loss model was actually calibrated.
Using the information provided by location inspection coupled with a general understanding of location-based services best practices, you can take action in the way of moving existing or adding additional access points to bring the performance of the solution inline with expectations.
80Wi-Fi Location-Based Services—Design and Deployment Considerations
OL-11612-01
Deployment Best Practices
Location Tracking Challenges
Outdoor Environments
Outdoor wireless deployments tend to be much different from the types of indoor deployments that have been described thus far. The deployment best practices described in this document do not readily lend themselves to easy deployment outdoors. The access point densities, inter-access point spacing, and antenna heights discussed, although acceptable for indoor deployments, tend to make outdoor location deployment less than optimal.
Because of this as well as other factors, the use of the location appliance for location tracking of mobile devices or RFID tags in an outdoor environment is not recommended at this time. The performance specifications noted in Accuracy and Precision of the Cisco LBS Solution, page 25, apply only to usage of the product within indoor environments.
Non-Uniform Environments
When an RF calibration is performed, the information gathered is used to make certain assumptions about the overall attenuation present in the environment. These assumptions are applied to internal distance calculations using a path loss model that is applied to the entire floor. With proper design and deployment in environments with uniform construction throughout, this approach performs rather well. However, in some cases the network designer is faced with challenges because of an environment that is of non-uniform construction. An example is a single floor consisting of cubicles in one area, metal racking and electronic equipment in a second area, and a large group of individual offices with concrete block walls in a third. The application of an overall path loss model to a floor with clearly non-uniform attenuation characteristics poses challenges to obtaining optimum location accuracy and precision. This is primarily because each of the three areas exhibit different degrees of attenuation and other propagation anomalies.
The network designer facing this type of environmental challenge may choose to do one of the following:
• Option One—If location performance is of equal concern in all concerned areas, perform a calibration on the entire floor as usual, with the understanding that the resulting overall path loss model may not be optimally tuned to the particular characteristics of any individual floor area. This approach “averages out” the differences between the various areas on the floor and computes a path loss model for the overall floor.
• Option Two—If location performance is of more concern in one of the areas as opposed to the others, perform the calibration focusing only on the area of primary concern but applying the resulting calibration model to the floor as a whole. An example of this type of deployment might be a location that combines a very large stockroom with an office environment, where the emphasis on location performance is in the stockroom.
• Option Three—Define each of the areas of the floor as individual “sub-floors” and define each of these sub-floors to WCS and the location appliance as if they were physically separate floors. A separate calibration is then performed on each of these floors and a customized calibration model is applied to the floor. The end result is that each sub-floor area is treated as a separate floor for the purpose of location tracking.
Each of these choices has its advantages and disadvantages. The first and second options offer more easily manageable and recognizable alternatives, especially when dealing with multi-story facilities. Under the first option, the path loss model computed is less than optimal as it relates to any particular area of the floor in general; however, the level of variation should be less than in the second option. The second option, although potentially offering more variation in performance between different areas of the floor, does present the capability for superior performance in areas of the floor that are of the most
81Wi-Fi Location-Based Services—Design and Deployment Considerations
OL-11612-01

Deployment Best Practices
concern. Although the overall path loss model may not be generally optimized, performance may still be acceptable, depending on the application requirements. Both these two options are fairly straightforward and follow the standard procedure for calibration and deployment.
The third option offers the ability to calibrate for separate path loss models, each attuned to the individual floor areas and with that, the potential for improved location performance in each sub-floor area. However, this requires additional management on the part of the WCS administrator to assign a naming convention to floors and sub-floors such that they are easily recognizable by users of the system and able to be considered as a group. Each floor should be considered as an independent location area subject to the location-aware design recommendations in “Location-Aware” WLAN Design Considerations, page 51. This is especially important given the fact that when performing localization for a device on any given floor, the location appliance positioning engine does not consider signal strength readings from access points that are resident on a different floor. Thus, as devices approach the edges of the “sub-floors”, location accuracy may be less.
Small Sites
Access Point Density Considerations, page 55 described recommended practices for deploying access points in a location-aware design in terms of both access point density and inter-access point spacing. In some cases, the designer may be faced with a small environment that allows for the recommended inter-access point spacing but still does not provide satisfactory performance. This type of situation may be found in the suburban branch offices of some corporations or in some suburban healthcare clinics, where monitoring the location of key assets may be desirable across a number of smaller enterprise locations.
In lab testing for this white paper, this behavior has been confirmed, and it has been observed that attempting to deploy a location-aware design in small areas may result in less than optimal performance. Further testing and investigation indicates that the use of low-gain external antennas (such as AIR-ANT4941 and AIR-ANT5135) has a positive effect in such cases by mitigating this situation to some degree and restoring at least a portion of lost location fidelity. This was especially evident when testing in small environments. Location-aware designs in small-scale environments using s access points equipped with low-gain external antennas consistently outperformed designs using access points with the higher gain internal antennas in terms of delivered location accuracy and precision.
Antenna Installation Height
The positioning algorithms used within the location appliance assume that all antennae are situated at heights where the apparent gain is mainly because of the azimuth and not the elevation pattern of the antenna. Laboratory testing performed with the AP-1000 and AIR-ANT1000 antennae confirms that when located at heights above floor level of 10 feet or less, a very steep and monotonic relationship is present between measured signal strength and distance.
Except at very close horizontal distances of 12–15 feet or less from the access point, the curve representing this relationship tends to be single-valued with a steep slope, which is very conducive to good location performance because a high degree of differentiation in signal strength is apparent as horizontal distance varies. When antennas are mounted at heights of 20 feet or beyond, the steep slope degrades and the curve tends to be multi-valued at horizontal distances out to about 40 feet from the access point.
To be conducive to good location fidelity, the location-aware design must do the following:
• Minimize the amount of exposure to those areas of the signal strength versus distance curve exhibiting a lack of monotonicity
82Wi-Fi Location-Based Services—Design and Deployment Considerations
OL-11612-01
Deployment Best Practices
• Minimize the amount of exposure to those “flattened” areas of the signal strength versus distance curve where there is little change in signal strength as distance increases
Therefore, in general, Cisco recommends the following:
• Antenna installation be performed at heights of 10 feet or less for optimum location fidelity. Antenna heights in this range have been found to be most conducive to good location fidelity.
• Antenna installations above 20 feet be avoided.
Traffic ConsiderationsAs shown in Figure 8, the Cisco Location Appliance and the Cisco WCS are members of the Cisco Unified Wireless Network, with each deployed as a separate hardware component for optimum scalability and maximum flexibility. This section discusses the traffic considerations to keep in mind when deciding where to place each of these components in a network design.
In most cases, when all components are deployed via a well-designed 10/100/1000 infrastructure (a large healthcare campus facility, for example), wired LAN bandwidth is normally sufficient for proper operation of the LBS solution. It is definitely good practice, however, to reduce the demands on controller CPU by avoiding excessive and unproductive polling of controllers for as described in Traffic Between the Location Appliance and WLAN Controllers, page 83.
In deployments supporting a large number of geographically distributed locations across a WAN, further consideration regarding data traffic load may be required. This depends on the polling categories and intervals selected along with the overall usage and capacity of any WAN links involved. Every effort should be made to assure sufficient WAN bandwidth is available to accommodate added SNMP traffic from routine location server polling of controllers, as discussed in Traffic Between the Location Appliance and WLAN Controllers, page 83. In addition, location appliance and WCS placement should be chosen to ensure that the traffic considerations discussed in Traffic Between the Location Appliance and WCS, page 86 are properly accommodated. This is typically achieved using LAN or high-speed WAN technology with sufficient available bandwidth.
Traffic Between the Location Appliance and WLAN Controllers
When first installed, all polling between the location appliance and the WLAN controller is disabled by default (shown in Figure 55); that is, the location appliance does not poll the controllers for information regarding clients, rogues, active RFID tags, or statistics. Consequently, WCS does not display this information in floor maps until polling is enabled and data is collected from the controllers. Polling must be enabled via the checkboxes on Locate > Location Servers > Administration > Polling Parameters, as shown in Figure 55.
83Wi-Fi Location-Based Services—Design and Deployment Considerations
OL-11612-01
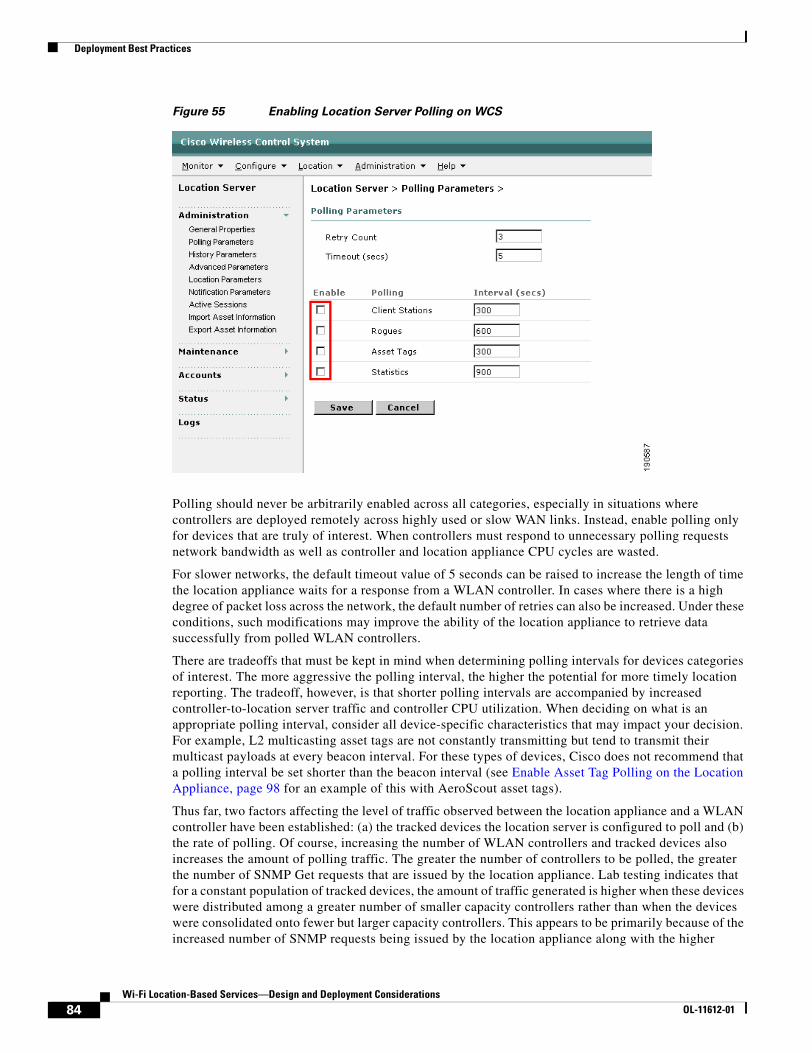
Deployment Best Practices
Figure 55 Enabling Location Server Polling on WCS
Polling should never be arbitrarily enabled across all categories, especially in situations where controllers are deployed remotely across highly used or slow WAN links. Instead, enable polling only for devices that are truly of interest. When controllers must respond to unnecessary polling requests network bandwidth as well as controller and location appliance CPU cycles are wasted.
For slower networks, the default timeout value of 5 seconds can be raised to increase the length of time the location appliance waits for a response from a WLAN controller. In cases where there is a high degree of packet loss across the network, the default number of retries can also be increased. Under these conditions, such modifications may improve the ability of the location appliance to retrieve data successfully from polled WLAN controllers.
There are tradeoffs that must be kept in mind when determining polling intervals for devices categories of interest. The more aggressive the polling interval, the higher the potential for more timely location reporting. The tradeoff, however, is that shorter polling intervals are accompanied by increased controller-to-location server traffic and controller CPU utilization. When deciding on what is an appropriate polling interval, consider all device-specific characteristics that may impact your decision. For example, L2 multicasting asset tags are not constantly transmitting but tend to transmit their multicast payloads at every beacon interval. For these types of devices, Cisco does not recommend that a polling interval be set shorter than the beacon interval (see Enable Asset Tag Polling on the Location Appliance, page 98 for an example of this with AeroScout asset tags).
Thus far, two factors affecting the level of traffic observed between the location appliance and a WLAN controller have been established: (a) the tracked devices the location server is configured to poll and (b) the rate of polling. Of course, increasing the number of WLAN controllers and tracked devices also increases the amount of polling traffic. The greater the number of controllers to be polled, the greater the number of SNMP Get requests that are issued by the location appliance. Lab testing indicates that for a constant population of tracked devices, the amount of traffic generated is higher when these devices were distributed among a greater number of smaller capacity controllers rather than when the devices were consolidated onto fewer but larger capacity controllers. This appears to be primarily because of the increased number of SNMP requests being issued by the location appliance along with the higher
84Wi-Fi Location-Based Services—Design and Deployment Considerations
OL-11612-01
Deployment Best Practices
number of received responses associated with a larger controller population. Use of a few centrally located large capacity WLAN controllers (such as the WiSM) would therefore appear to be advantageous over the use of many distributed smaller capacity WLAN controllers for the same number of tracked devices.
The impact of these polling activities can be seen quantitatively by examining the protocol analysis shown in Appendix A—Polling Traffic 2700 <-> 4400 WLAN Controller, page 111. Here you see the UDP packet exchange between the location appliance and a single 4400 WLAN Controller. To better illustrate the combined impact of enabling all polling categories, the test controller has been configured to poll for client, asset tag, rogue, and statistical information every 60 seconds. Seven access points were active in the test environment being serviced by this controller, with 1 mobile device, 5 asset tags, 22 rogue access points, and 7 rogue clients present. The trace in Appendix A—Polling Traffic 2700 <-> 4400 WLAN Controller, page 111 shows one 60-second polling window where all polling was completed in just under 11 seconds via a 100BaseT switched LAN. As can be seen, 39 SNMP “Get” commands were issued to the WLAN controller with 39 responses returned to the location appliance. Careful analysis indicates that for this polling cycle, 10,243 bytes were transmitted from the location appliance to the 4402 via 39 frames, while 153,083 bytes in 117 frames (fragmented responses) were received by the location appliance as responses.
To examine what traffic volume might be in a larger, more active environment, Appendix C—Large Site Traffic Analysis, page 118, contains an analysis of the traffic flow between the location appliance and WLAN controllers in a large scale, multi-floor building with a very busy WLAN. The test infrastructure is 10/100/1000 Ethernet and includes the following:
• Single WCS and Location Appliance
• Two Cisco WLC4400-100 WLAN Controllers (controller #1, controller #2)
• 41 access points (15 on controller #1, 26 on controller #2)
• 245 clients (114 on controller #1, 131 on controller #2)
• 172 asset tags (103 on controller #1, 69 on controller #2)
• 517 rogue access points
• 27 rogue clients (4 on controller #1, 23 on controller #2)
• Location Server running for 14 days
To gain a better understanding of not only the aggregate polling traffic flow but also what can be expected when enabling each individual polling category in this environment, trace information and traffic statistics were gathered as follows:
• Location appliance polling asset tags only
• Clients only
• Rogues only
• Statistics only
This was accomplished by disabling all polling on the location appliance except for the specific category under test. Multiple polling cycles were captured at clearly distinguishable intervals to ensure that valid data was obtained. The data was then carefully groomed so that the traffic analysis included only the SNMP commands and responses from a single polling cycle. For comparison, Appendix C—Large Site Traffic Analysis, page 118, contains an analysis of the aggregate traffic flow between the location appliance and WLAN controllers when all four polling categories are enabled simultaneously for a 120-second polling interval.
When reviewing the data in Appendix C—Large Site Traffic Analysis, page 118, keep in mind that a large amount of the traffic occurring between the location appliance and the WLAN controllers is because of an unusually high number of rogue access points being present. Although this may be
85Wi-Fi Location-Based Services—Design and Deployment Considerations
OL-11612-01
Deployment Best Practices
considered normal for the test environment (an internal WLAN development facility where there are many access points and clients being tested independently of one another), such an incredibly high level of rogue activity is certainly not what one would expect in a routine business environment.
Notwithstanding the unusually high level of rogue traffic, Appendix C—Large Site Traffic Analysis, page 118 clearly shows why configuring too short a polling interval would not be recommended via overburdened or slow WAN links. Enabling polling for only asset tag and wireless clients shows that the amount of traffic being transmitted back to the location appliance from each controller per polling cycle is on the order of ~300,000 bytes. Polling for statistical information as well in this test environment would add ~125,000 bytes from each controller per polling cycle. This would amount to approximately 425,000 bytes of traffic from each controller to the location appliance per polling cycle.
Discounting the high amount of rogue traffic detected by a factor of 75 percent, it is reasonable to anticipate that polling for more typical volumes of rogue information would add between 100,000 and 200,000 bytes per controller per polling cycle for a total traffic volume of approximately 500,000–600,000 bytes per controller per polling cycle. With reasonable polling intervals on modern-day high speed WAN links and campus LANs, more than ample bandwidth would be available to handle this amount of polling traffic in addition to servicing other traffic.
Traffic Between the Location Appliance and WCS
Although the location appliance and the WCS are in routine communication with one another, peak traffic flows tend to occur during the synchronization (Location > Location Servers > Synchronize) and backup/restore processes. Traffic during network design synchronization can also be a concern if the WCS and the location appliance are separated by slow or congested WAN links. Delays resulting from such congested links may result in very long synchronization times or in extreme cases, the inability to propagate updated network designs and calibration models between WCS and the location appliance. Thus, whenever possible the location appliance and WCS should be co-located on a high-speed LAN. Keep in mind as well that unlike polling, the synchronization process can be initiated either on-demand or scheduled as a routinely occurring event. Thus, for example, synchronization can be scheduled to occur during an off-peak period on a daily basis. This allows the administrator of the LBS system to better take advantage of periods where there is a lull in traffic from other network users.
During the network design synchronization process, the more up-to-date partner (either WCS or the location appliance) shares updated network design and calibration model information with the other partner. In the typical case of WCS possessing a more recent version of a network design or calibration model, WCS issues commands to the location appliance via SOAP/XML to verify the network designs and calibration models it contains. After WCS confirms its knowledge of what is contained within the location appliance, it issues the appropriate commands via the API interface to update it.
Lab testing was performed for a relatively simple configuration consisting of a single campus network design (two buildings, single floor each, 14 access points total) and four calibration models (two site calibrations plus the two simple default calibration models). TCP traffic between WCS and the location appliance was observed during network synchronization of an updated network design and two calibration maps. This analysis indicated 840 packets being transmitted from the WCS to the location appliance totaling 790,144 bytes and 879 packets transmitted from the location appliance to WCS totaling 895,367 bytes for a grand total of 1719 packets and 1,685,511 bytes.
In larger location-aware deployments, it is logical to expect the traffic levels between WCS and the location appliance to increase because of the potential for an increased number of buildings, floors, and access points present per floor. Other factors that increase the amount of data exchanged during a synchronization are the presence of any walls or other obstacles defined within network designs, or if any coverage areas are defined via the Map Editor. All these constitute additional information that is contained within the network design that is exchanged between partners during synchronization.
86Wi-Fi Location-Based Services—Design and Deployment Considerations
OL-11612-01
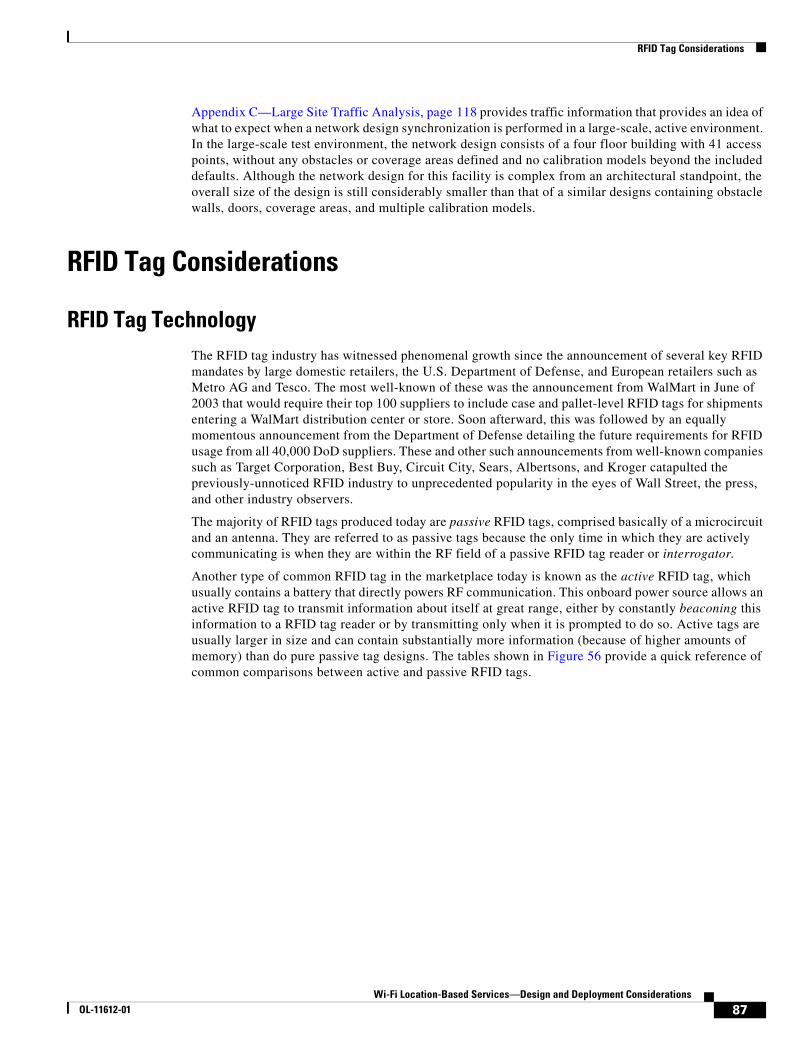
RFID Tag Considerations
Appendix C—Large Site Traffic Analysis, page 118 provides traffic information that provides an idea of what to expect when a network design synchronization is performed in a large-scale, active environment. In the large-scale test environment, the network design consists of a four floor building with 41 access points, without any obstacles or coverage areas defined and no calibration models beyond the included defaults. Although the network design for this facility is complex from an architectural standpoint, the overall size of the design is still considerably smaller than that of a similar designs containing obstacle walls, doors, coverage areas, and multiple calibration models.
RFID Tag Considerations
RFID Tag TechnologyThe RFID tag industry has witnessed phenomenal growth since the announcement of several key RFID mandates by large domestic retailers, the U.S. Department of Defense, and European retailers such as Metro AG and Tesco. The most well-known of these was the announcement from WalMart in June of 2003 that would require their top 100 suppliers to include case and pallet-level RFID tags for shipments entering a WalMart distribution center or store. Soon afterward, this was followed by an equally momentous announcement from the Department of Defense detailing the future requirements for RFID usage from all 40,000 DoD suppliers. These and other such announcements from well-known companies such as Target Corporation, Best Buy, Circuit City, Sears, Albertsons, and Kroger catapulted the previously-unnoticed RFID industry to unprecedented popularity in the eyes of Wall Street, the press, and other industry observers.
The majority of RFID tags produced today are passive RFID tags, comprised basically of a microcircuit and an antenna. They are referred to as passive tags because the only time in which they are actively communicating is when they are within the RF field of a passive RFID tag reader or interrogator.
Another type of common RFID tag in the marketplace today is known as the active RFID tag, which usually contains a battery that directly powers RF communication. This onboard power source allows an active RFID tag to transmit information about itself at great range, either by constantly beaconing this information to a RFID tag reader or by transmitting only when it is prompted to do so. Active tags are usually larger in size and can contain substantially more information (because of higher amounts of memory) than do pure passive tag designs. The tables shown in Figure 56 provide a quick reference of common comparisons between active and passive RFID tags.
87Wi-Fi Location-Based Services—Design and Deployment Considerations
OL-11612-01
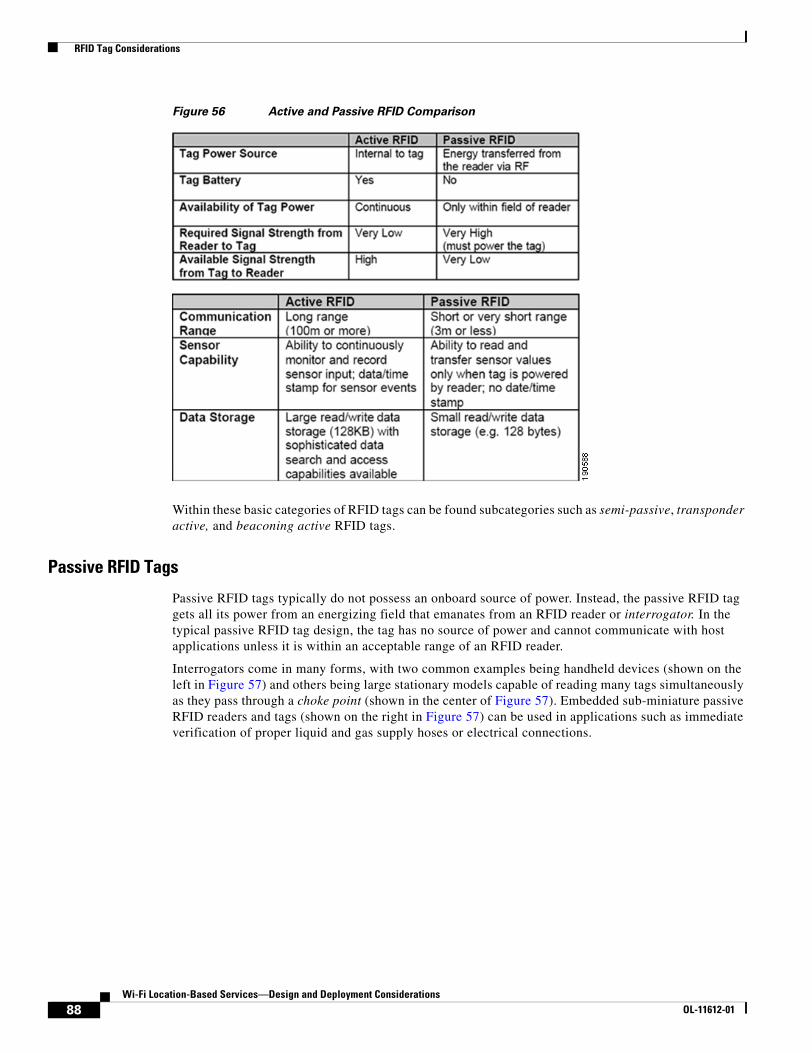
RFID Tag Considerations
Figure 56 Active and Passive RFID Comparison
Within these basic categories of RFID tags can be found subcategories such as semi-passive, transponder active, and beaconing active RFID tags.
Passive RFID Tags
Passive RFID tags typically do not possess an onboard source of power. Instead, the passive RFID tag gets all its power from an energizing field that emanates from an RFID reader or interrogator. In the typical passive RFID tag design, the tag has no source of power and cannot communicate with host applications unless it is within an acceptable range of an RFID reader.
Interrogators come in many forms, with two common examples being handheld devices (shown on the left in Figure 57) and others being large stationary models capable of reading many tags simultaneously as they pass through a choke point (shown in the center of Figure 57). Embedded sub-miniature passive RFID readers and tags (shown on the right in Figure 57) can be used in applications such as immediate verification of proper liquid and gas supply hoses or electrical connections.
88Wi-Fi Location-Based Services—Design and Deployment Considerations
OL-11612-01
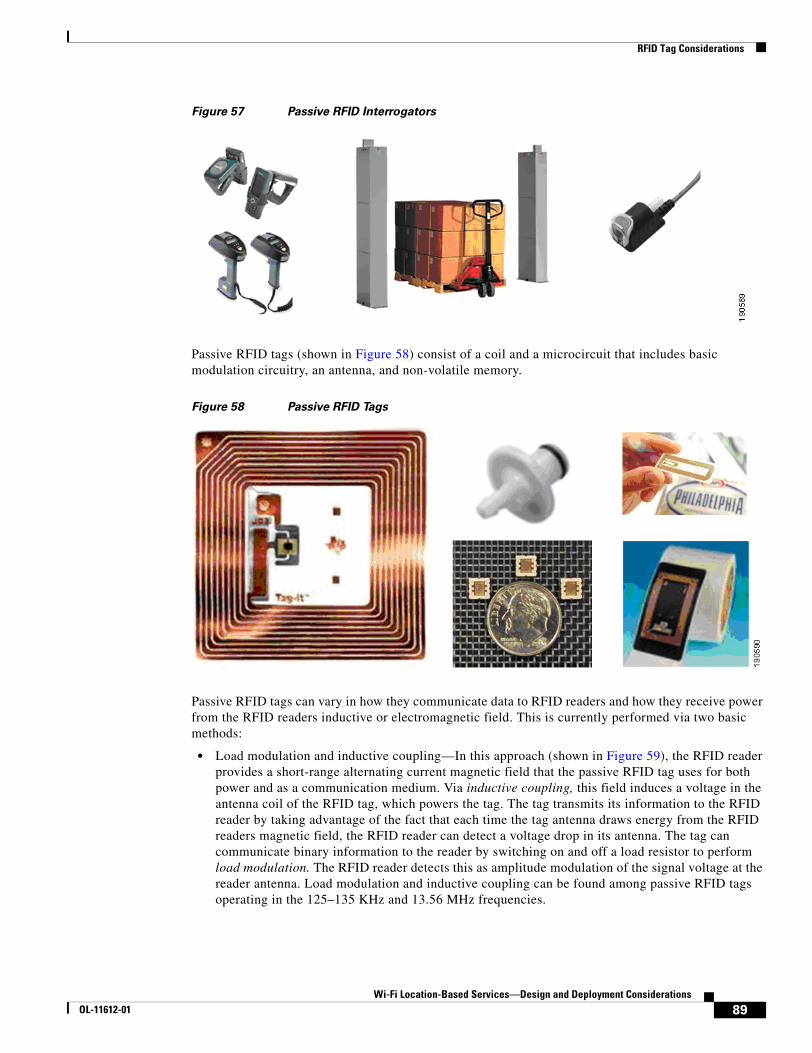
RFID Tag Considerations
Figure 57 Passive RFID Interrogators
Passive RFID tags (shown in Figure 58) consist of a coil and a microcircuit that includes basic modulation circuitry, an antenna, and non-volatile memory.
Figure 58 Passive RFID Tags
Passive RFID tags can vary in how they communicate data to RFID readers and how they receive power from the RFID readers inductive or electromagnetic field. This is currently performed via two basic methods:
• Load modulation and inductive coupling—In this approach (shown in Figure 59), the RFID reader provides a short-range alternating current magnetic field that the passive RFID tag uses for both power and as a communication medium. Via inductive coupling, this field induces a voltage in the antenna coil of the RFID tag, which powers the tag. The tag transmits its information to the RFID reader by taking advantage of the fact that each time the tag antenna draws energy from the RFID readers magnetic field, the RFID reader can detect a voltage drop in its antenna. The tag can communicate binary information to the reader by switching on and off a load resistor to perform load modulation. The RFID reader detects this as amplitude modulation of the signal voltage at the reader antenna. Load modulation and inductive coupling can be found among passive RFID tags operating in the 125–135 KHz and 13.56 MHz frequencies.
89Wi-Fi Location-Based Services—Design and Deployment Considerations
OL-11612-01
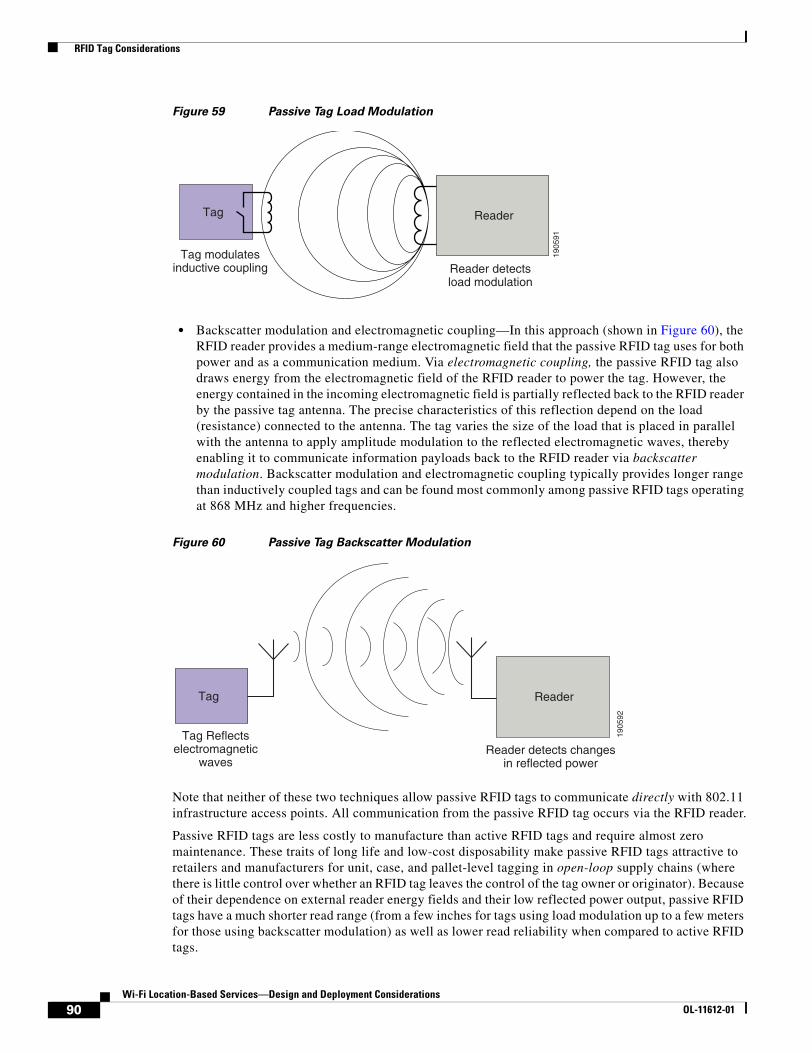
RFID Tag Considerations
Figure 59 Passive Tag Load Modulation
• Backscatter modulation and electromagnetic coupling—In this approach (shown in Figure 60), the RFID reader provides a medium-range electromagnetic field that the passive RFID tag uses for both power and as a communication medium. Via electromagnetic coupling, the passive RFID tag also draws energy from the electromagnetic field of the RFID reader to power the tag. However, the energy contained in the incoming electromagnetic field is partially reflected back to the RFID reader by the passive tag antenna. The precise characteristics of this reflection depend on the load (resistance) connected to the antenna. The tag varies the size of the load that is placed in parallel with the antenna to apply amplitude modulation to the reflected electromagnetic waves, thereby enabling it to communicate information payloads back to the RFID reader via backscatter modulation. Backscatter modulation and electromagnetic coupling typically provides longer range than inductively coupled tags and can be found most commonly among passive RFID tags operating at 868 MHz and higher frequencies.
Figure 60 Passive Tag Backscatter Modulation
Note that neither of these two techniques allow passive RFID tags to communicate directly with 802.11 infrastructure access points. All communication from the passive RFID tag occurs via the RFID reader.
Passive RFID tags are less costly to manufacture than active RFID tags and require almost zero maintenance. These traits of long life and low-cost disposability make passive RFID tags attractive to retailers and manufacturers for unit, case, and pallet-level tagging in open-loop supply chains (where there is little control over whether an RFID tag leaves the control of the tag owner or originator). Because of their dependence on external reader energy fields and their low reflected power output, passive RFID tags have a much shorter read range (from a few inches for tags using load modulation up to a few meters for those using backscatter modulation) as well as lower read reliability when compared to active RFID tags.
1905
91
Tag Reader
Tag modulatesinductive coupling Reader detects
load modulation
1905
92
Tag Reader
Tag Reflectselectromagnetic
wavesReader detects changes
in reflected power
90Wi-Fi Location-Based Services—Design and Deployment Considerations
OL-11612-01
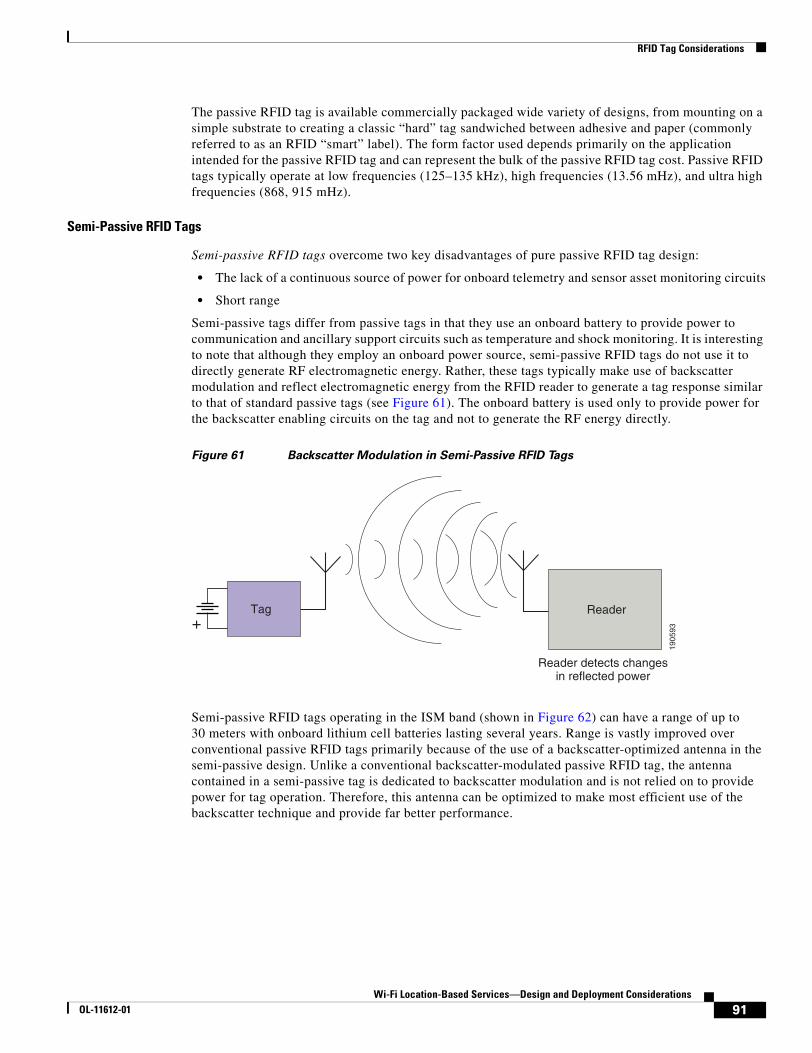
RFID Tag Considerations
The passive RFID tag is available commercially packaged wide variety of designs, from mounting on a simple substrate to creating a classic “hard” tag sandwiched between adhesive and paper (commonly referred to as an RFID “smart” label). The form factor used depends primarily on the application intended for the passive RFID tag and can represent the bulk of the passive RFID tag cost. Passive RFID tags typically operate at low frequencies (125–135 kHz), high frequencies (13.56 mHz), and ultra high frequencies (868, 915 mHz).
Semi-Passive RFID Tags
Semi-passive RFID tags overcome two key disadvantages of pure passive RFID tag design:
• The lack of a continuous source of power for onboard telemetry and sensor asset monitoring circuits
• Short range
Semi-passive tags differ from passive tags in that they use an onboard battery to provide power to communication and ancillary support circuits such as temperature and shock monitoring. It is interesting to note that although they employ an onboard power source, semi-passive RFID tags do not use it to directly generate RF electromagnetic energy. Rather, these tags typically make use of backscatter modulation and reflect electromagnetic energy from the RFID reader to generate a tag response similar to that of standard passive tags (see Figure 61). The onboard battery is used only to provide power for the backscatter enabling circuits on the tag and not to generate the RF energy directly.
Figure 61 Backscatter Modulation in Semi-Passive RFID Tags
Semi-passive RFID tags operating in the ISM band (shown in Figure 62) can have a range of up to 30 meters with onboard lithium cell batteries lasting several years. Range is vastly improved over conventional passive RFID tags primarily because of the use of a backscatter-optimized antenna in the semi-passive design. Unlike a conventional backscatter-modulated passive RFID tag, the antenna contained in a semi-passive tag is dedicated to backscatter modulation and is not relied on to provide power for tag operation. Therefore, this antenna can be optimized to make most efficient use of the backscatter technique and provide far better performance.
1905
93
Tag Reader
Reader detects changesin reflected power
+
91Wi-Fi Location-Based Services—Design and Deployment Considerations
OL-11612-01
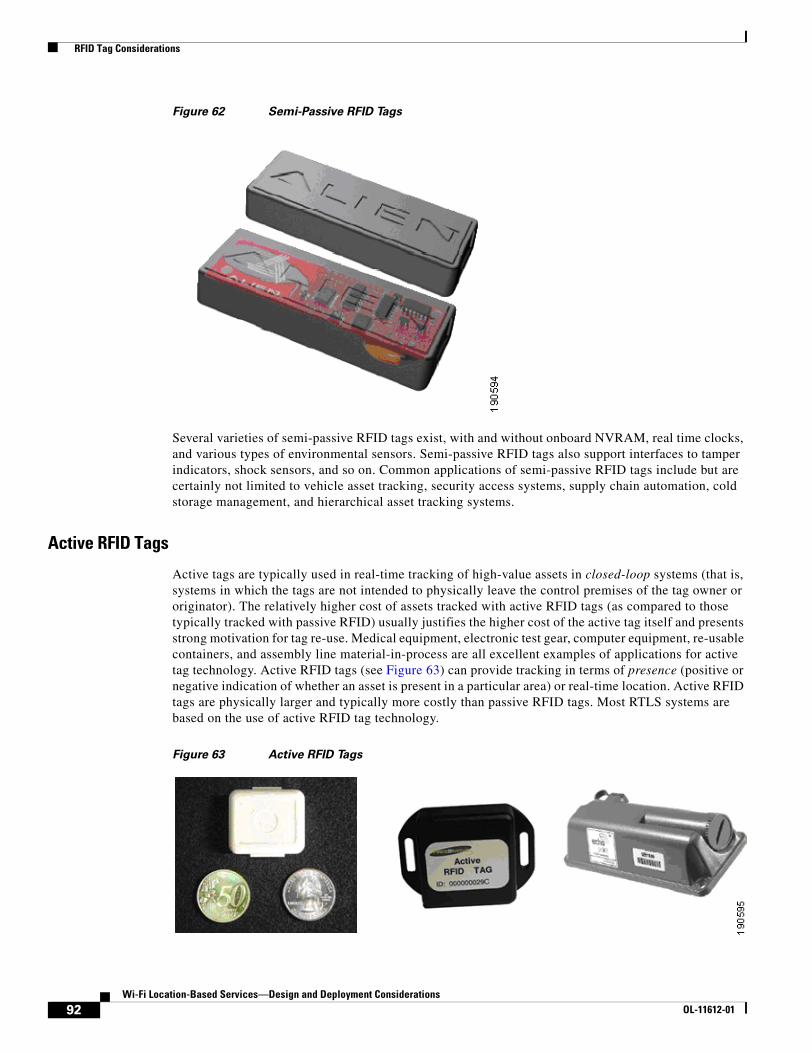
RFID Tag Considerations
Figure 62 Semi-Passive RFID Tags
Several varieties of semi-passive RFID tags exist, with and without onboard NVRAM, real time clocks, and various types of environmental sensors. Semi-passive RFID tags also support interfaces to tamper indicators, shock sensors, and so on. Common applications of semi-passive RFID tags include but are certainly not limited to vehicle asset tracking, security access systems, supply chain automation, cold storage management, and hierarchical asset tracking systems.
Active RFID Tags
Active tags are typically used in real-time tracking of high-value assets in closed-loop systems (that is, systems in which the tags are not intended to physically leave the control premises of the tag owner or originator). The relatively higher cost of assets tracked with active RFID tags (as compared to those typically tracked with passive RFID) usually justifies the higher cost of the active tag itself and presents strong motivation for tag re-use. Medical equipment, electronic test gear, computer equipment, re-usable containers, and assembly line material-in-process are all excellent examples of applications for active tag technology. Active RFID tags (see Figure 63) can provide tracking in terms of presence (positive or negative indication of whether an asset is present in a particular area) or real-time location. Active RFID tags are physically larger and typically more costly than passive RFID tags. Most RTLS systems are based on the use of active RFID tag technology.
Figure 63 Active RFID Tags
92Wi-Fi Location-Based Services—Design and Deployment Considerations
OL-11612-01
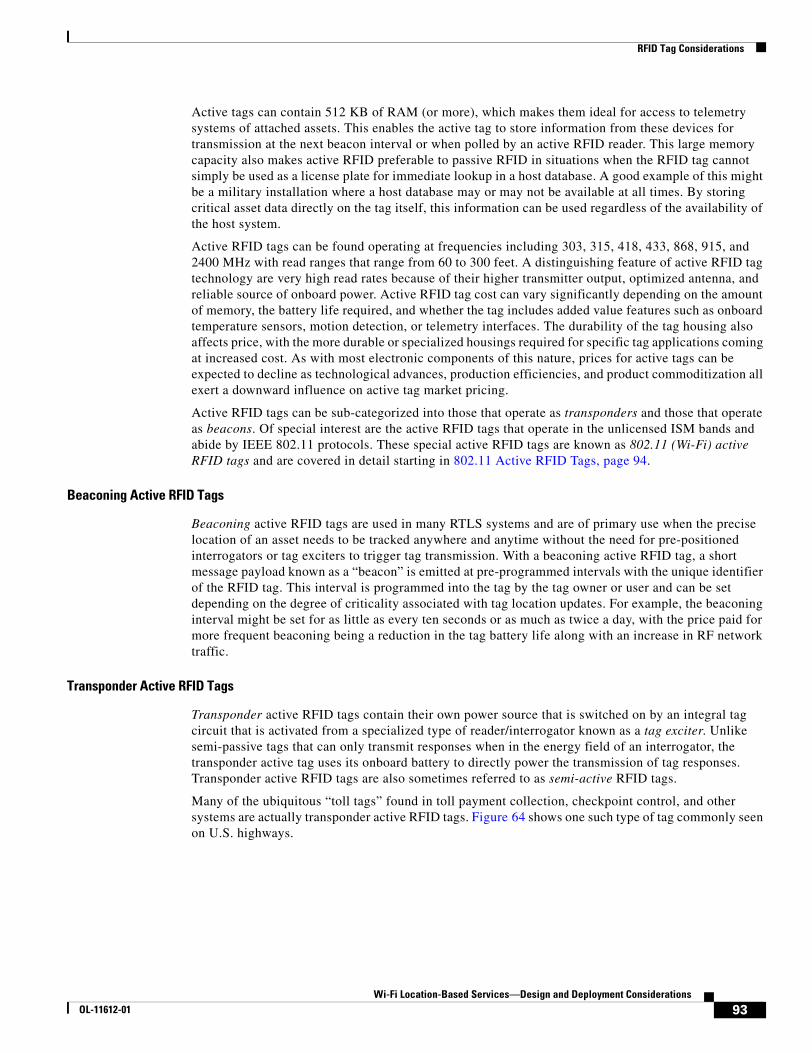
RFID Tag Considerations
Active tags can contain 512 KB of RAM (or more), which makes them ideal for access to telemetry systems of attached assets. This enables the active tag to store information from these devices for transmission at the next beacon interval or when polled by an active RFID reader. This large memory capacity also makes active RFID preferable to passive RFID in situations when the RFID tag cannot simply be used as a license plate for immediate lookup in a host database. A good example of this might be a military installation where a host database may or may not be available at all times. By storing critical asset data directly on the tag itself, this information can be used regardless of the availability of the host system.
Active RFID tags can be found operating at frequencies including 303, 315, 418, 433, 868, 915, and 2400 MHz with read ranges that range from 60 to 300 feet. A distinguishing feature of active RFID tag technology are very high read rates because of their higher transmitter output, optimized antenna, and reliable source of onboard power. Active RFID tag cost can vary significantly depending on the amount of memory, the battery life required, and whether the tag includes added value features such as onboard temperature sensors, motion detection, or telemetry interfaces. The durability of the tag housing also affects price, with the more durable or specialized housings required for specific tag applications coming at increased cost. As with most electronic components of this nature, prices for active tags can be expected to decline as technological advances, production efficiencies, and product commoditization all exert a downward influence on active tag market pricing.
Active RFID tags can be sub-categorized into those that operate as transponders and those that operate as beacons. Of special interest are the active RFID tags that operate in the unlicensed ISM bands and abide by IEEE 802.11 protocols. These special active RFID tags are known as 802.11 (Wi-Fi) active RFID tags and are covered in detail starting in 802.11 Active RFID Tags, page 94.
Beaconing Active RFID Tags
Beaconing active RFID tags are used in many RTLS systems and are of primary use when the precise location of an asset needs to be tracked anywhere and anytime without the need for pre-positioned interrogators or tag exciters to trigger tag transmission. With a beaconing active RFID tag, a short message payload known as a “beacon” is emitted at pre-programmed intervals with the unique identifier of the RFID tag. This interval is programmed into the tag by the tag owner or user and can be set depending on the degree of criticality associated with tag location updates. For example, the beaconing interval might be set for as little as every ten seconds or as much as twice a day, with the price paid for more frequent beaconing being a reduction in the tag battery life along with an increase in RF network traffic.
Transponder Active RFID Tags
Transponder active RFID tags contain their own power source that is switched on by an integral tag circuit that is activated from a specialized type of reader/interrogator known as a tag exciter. Unlike semi-passive tags that can only transmit responses when in the energy field of an interrogator, the transponder active tag uses its onboard battery to directly power the transmission of tag responses. Transponder active RFID tags are also sometimes referred to as semi-active RFID tags.
Many of the ubiquitous “toll tags” found in toll payment collection, checkpoint control, and other systems are actually transponder active RFID tags. Figure 64 shows one such type of tag commonly seen on U.S. highways.
93Wi-Fi Location-Based Services—Design and Deployment Considerations
OL-11612-01
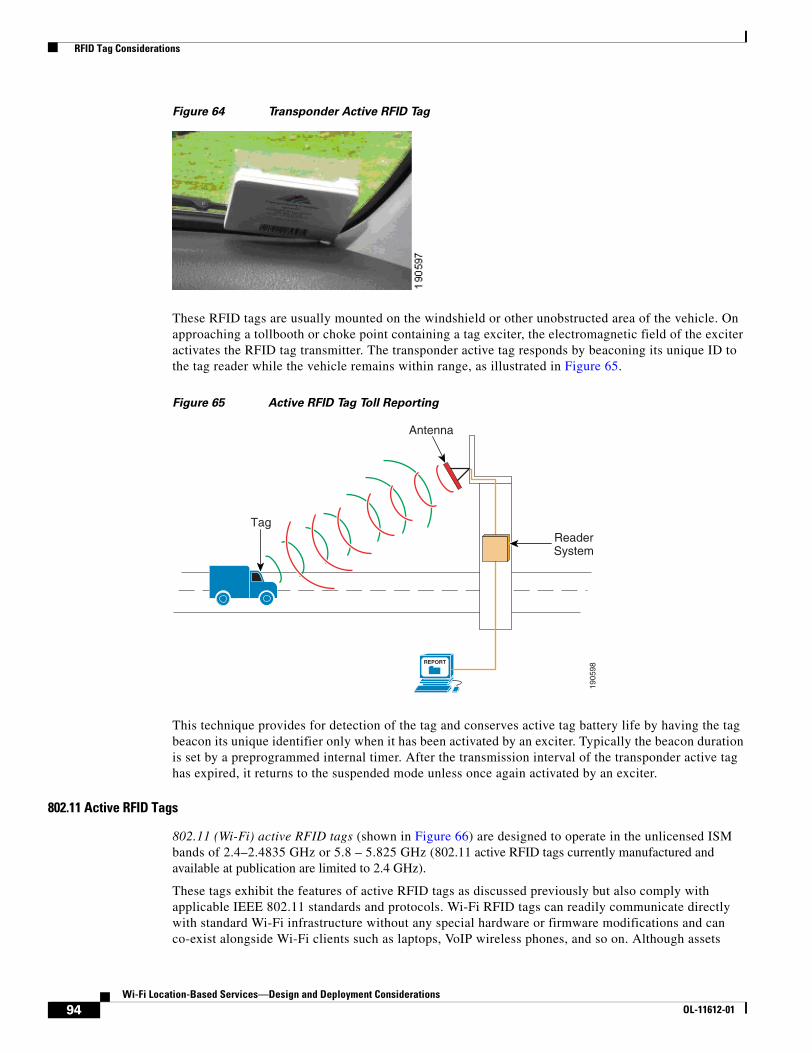
RFID Tag Considerations
Figure 64 Transponder Active RFID Tag
These RFID tags are usually mounted on the windshield or other unobstructed area of the vehicle. On approaching a tollbooth or choke point containing a tag exciter, the electromagnetic field of the exciter activates the RFID tag transmitter. The transponder active tag responds by beaconing its unique ID to the tag reader while the vehicle remains within range, as illustrated in Figure 65.
Figure 65 Active RFID Tag Toll Reporting
This technique provides for detection of the tag and conserves active tag battery life by having the tag beacon its unique identifier only when it has been activated by an exciter. Typically the beacon duration is set by a preprogrammed internal timer. After the transmission interval of the transponder active tag has expired, it returns to the suspended mode unless once again activated by an exciter.
802.11 Active RFID Tags
802.11 (Wi-Fi) active RFID tags (shown in Figure 66) are designed to operate in the unlicensed ISM bands of 2.4–2.4835 GHz or 5.8 – 5.825 GHz (802.11 active RFID tags currently manufactured and available at publication are limited to 2.4 GHz).
These tags exhibit the features of active RFID tags as discussed previously but also comply with applicable IEEE 802.11 standards and protocols. Wi-Fi RFID tags can readily communicate directly with standard Wi-Fi infrastructure without any special hardware or firmware modifications and can co-exist alongside Wi-Fi clients such as laptops, VoIP wireless phones, and so on. Although assets
1905
98
REPORT
ReaderSystem
Tag
Antenna
94Wi-Fi Location-Based Services—Design and Deployment Considerations
OL-11612-01
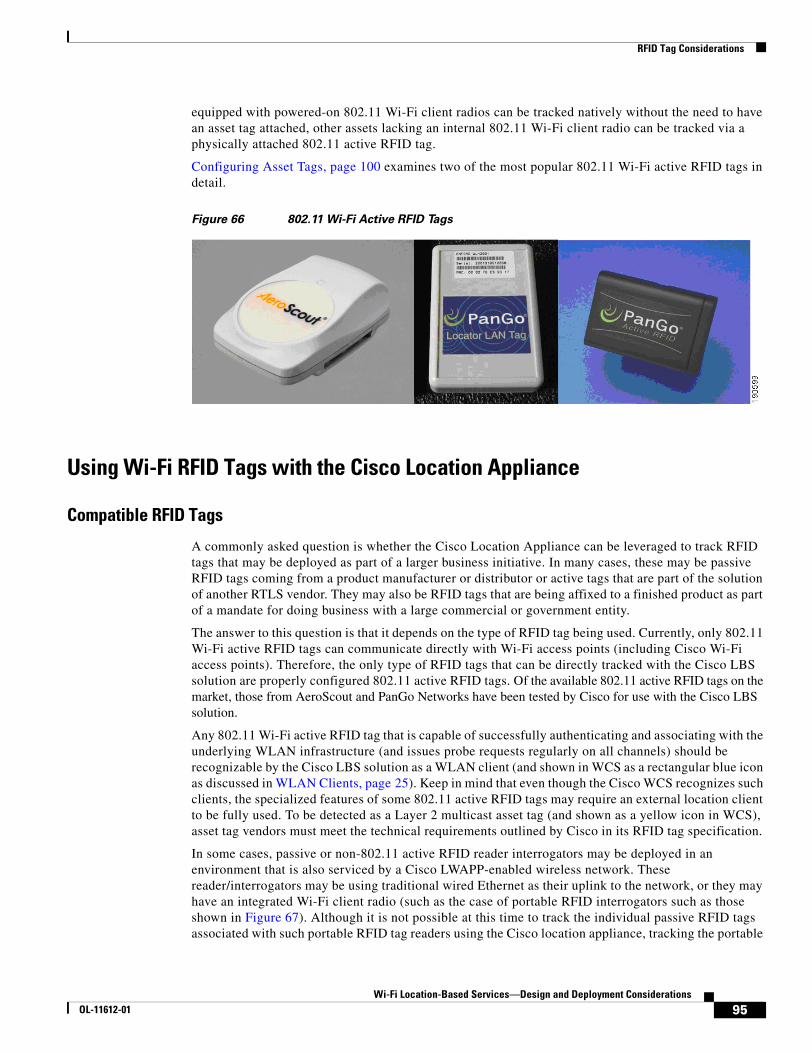
RFID Tag Considerations
equipped with powered-on 802.11 Wi-Fi client radios can be tracked natively without the need to have an asset tag attached, other assets lacking an internal 802.11 Wi-Fi client radio can be tracked via a physically attached 802.11 active RFID tag.
Configuring Asset Tags, page 100 examines two of the most popular 802.11 Wi-Fi active RFID tags in detail.
Figure 66 802.11 Wi-Fi Active RFID Tags
Using Wi-Fi RFID Tags with the Cisco Location Appliance
Compatible RFID Tags
A commonly asked question is whether the Cisco Location Appliance can be leveraged to track RFID tags that may be deployed as part of a larger business initiative. In many cases, these may be passive RFID tags coming from a product manufacturer or distributor or active tags that are part of the solution of another RTLS vendor. They may also be RFID tags that are being affixed to a finished product as part of a mandate for doing business with a large commercial or government entity.
The answer to this question is that it depends on the type of RFID tag being used. Currently, only 802.11 Wi-Fi active RFID tags can communicate directly with Wi-Fi access points (including Cisco Wi-Fi access points). Therefore, the only type of RFID tags that can be directly tracked with the Cisco LBS solution are properly configured 802.11 active RFID tags. Of the available 802.11 active RFID tags on the market, those from AeroScout and PanGo Networks have been tested by Cisco for use with the Cisco LBS solution.
Any 802.11 Wi-Fi active RFID tag that is capable of successfully authenticating and associating with the underlying WLAN infrastructure (and issues probe requests regularly on all channels) should be recognizable by the Cisco LBS solution as a WLAN client (and shown in WCS as a rectangular blue icon as discussed in WLAN Clients, page 25). Keep in mind that even though the Cisco WCS recognizes such clients, the specialized features of some 802.11 active RFID tags may require an external location client to be fully used. To be detected as a Layer 2 multicast asset tag (and shown as a yellow icon in WCS), asset tag vendors must meet the technical requirements outlined by Cisco in its RFID tag specification.
In some cases, passive or non-802.11 active RFID reader interrogators may be deployed in an environment that is also serviced by a Cisco LWAPP-enabled wireless network. These reader/interrogators may be using traditional wired Ethernet as their uplink to the network, or they may have an integrated Wi-Fi client radio (such as the case of portable RFID interrogators such as those shown in Figure 67). Although it is not possible at this time to track the individual passive RFID tags associated with such portable RFID tag readers using the Cisco location appliance, tracking the portable
95Wi-Fi Location-Based Services—Design and Deployment Considerations
OL-11612-01
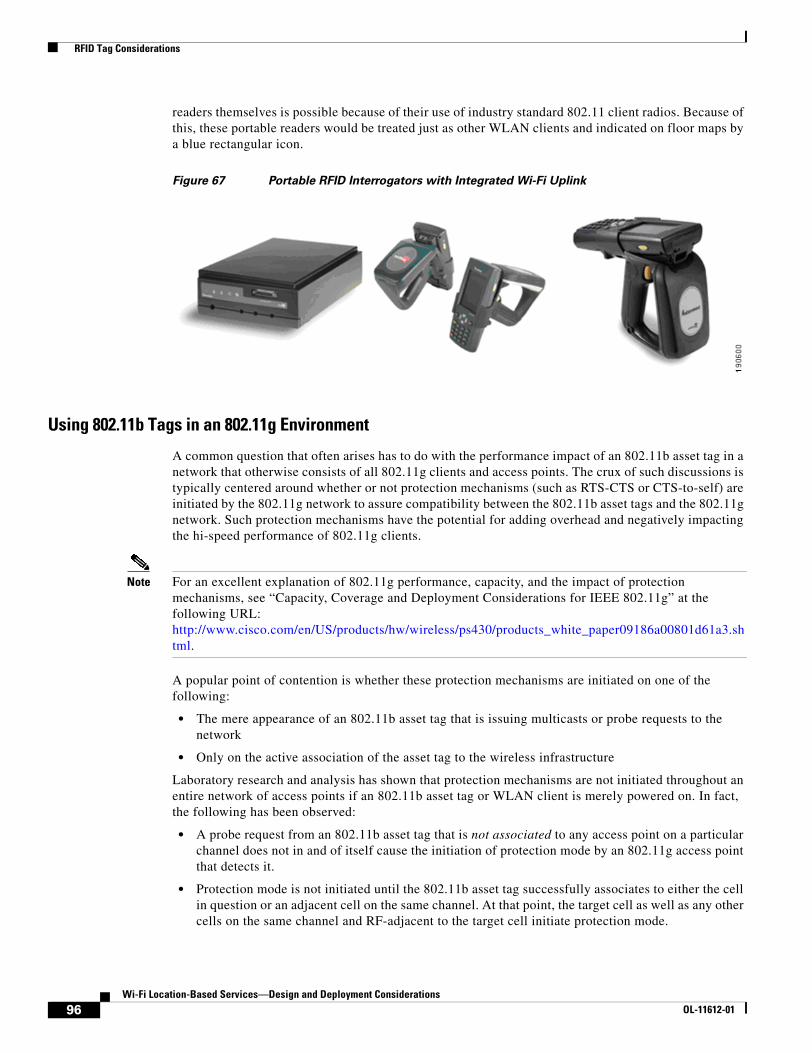
RFID Tag Considerations
readers themselves is possible because of their use of industry standard 802.11 client radios. Because of this, these portable readers would be treated just as other WLAN clients and indicated on floor maps by a blue rectangular icon.
Figure 67 Portable RFID Interrogators with Integrated Wi-Fi Uplink
Using 802.11b Tags in an 802.11g Environment
A common question that often arises has to do with the performance impact of an 802.11b asset tag in a network that otherwise consists of all 802.11g clients and access points. The crux of such discussions is typically centered around whether or not protection mechanisms (such as RTS-CTS or CTS-to-self) are initiated by the 802.11g network to assure compatibility between the 802.11b asset tags and the 802.11g network. Such protection mechanisms have the potential for adding overhead and negatively impacting the hi-speed performance of 802.11g clients.
Note For an excellent explanation of 802.11g performance, capacity, and the impact of protection mechanisms, see “Capacity, Coverage and Deployment Considerations for IEEE 802.11g” at the following URL: http://www.cisco.com/en/US/products/hw/wireless/ps430/products_white_paper09186a00801d61a3.shtml.
A popular point of contention is whether these protection mechanisms are initiated on one of the following:
• Τhe mere appearance of an 802.11b asset tag that is issuing multicasts or probe requests to the network
• Only on the active association of the asset tag to the wireless infrastructure
Laboratory research and analysis has shown that protection mechanisms are not initiated throughout an entire network of access points if an 802.11b asset tag or WLAN client is merely powered on. In fact, the following has been observed:
• A probe request from an 802.11b asset tag that is not associated to any access point on a particular channel does not in and of itself cause the initiation of protection mode by an 802.11g access point that detects it.
• Protection mode is not initiated until the 802.11b asset tag successfully associates to either the cell in question or an adjacent cell on the same channel. At that point, the target cell as well as any other cells on the same channel and RF-adjacent to the target cell initiate protection mode.
96Wi-Fi Location-Based Services—Design and Deployment Considerations
OL-11612-01
RFID Tag Considerations
• Access points not on the same channel as the 802.11b asset tag or not RF-adjacent do not initiate protection mode.
Some asset tags with motion detection can be configured to be almost completely RF silent when assets are not in motion. They associate and transmit information only when they have something to report (that is, movement); otherwise, they are “sleeping” for very long periods. The relatively small payload of the tag along with the number of tags that are in use and their frequency of movement can often mitigate the impact of protection mechanisms on throughput.
For those designers wishing to avoid the issue altogether in environments that are otherwise 100 percent 802.11g, there are two good ways to accomplish this:
• Consider the use of asset tags with 802.11g client radios such as the new PanGo version 2 LAN Locator asset tag.
• Use a Layer 2 multicasting 802.11b RFID tag such as the AeroScout T2. Layer 2 multicasting asset tags that are configured for the same channel as 802.11g access points do not cause the target access point, adjacent access points, or any detecting access points to initiate protection mode. These types of asset tags do not associate to access points at all.
Enabling Asset Tag Tracking for L2 Multicasting Asset Tags
Tracking of Layer 2 multicasting asset tags is disabled by default in the location appliance, WLAN controllers, and WCS. To track such asset tags successfully, follow the steps outlined in the subsections below.
Note The steps described in this section are necessary only when using AeroScout 802.11 active RFID asset tags or other L2 asset tags that do not associate to the WLAN infrastructure. These steps are not necessary when using asset tags that associate/authenticate to the WLAN infrastructure as a full WLAN client (such as those from PanGo Networks).
Enable Asset Tag Tracking in WLAN Controllers
For Cisco WLAN Controllers, connect to the controller via Telnet, SSH, or the console port and issue the following commands:
(Cisco Controller) >show rfid configRFID Tag data Collection......................... DisabledRFID Tag Auto-Timeout............................ DisabledRFID Client data Collection...................... DisabledRFID data timeout................................ 1200 seconds
Note that “RFID Tag data collection” is disabled by default. To enable it, issue the following command:
(Cisco Controller) >config rfid status enable(cisco Controller) >
(Cisco Controller) >show rfid configRFID Tag data Collection......................... EnabledRFID Tag Auto-Timeout............................ DisabledRFID Client data Collection...................... DisabledRFID data timeout................................ 1200 seconds
Asset tag data collection is now enabled in the WLAN controller, and asset tag signal strength information is aggregated and forwarded to the location appliance when the controller is polled.
97Wi-Fi Location-Based Services—Design and Deployment Considerations
OL-11612-01
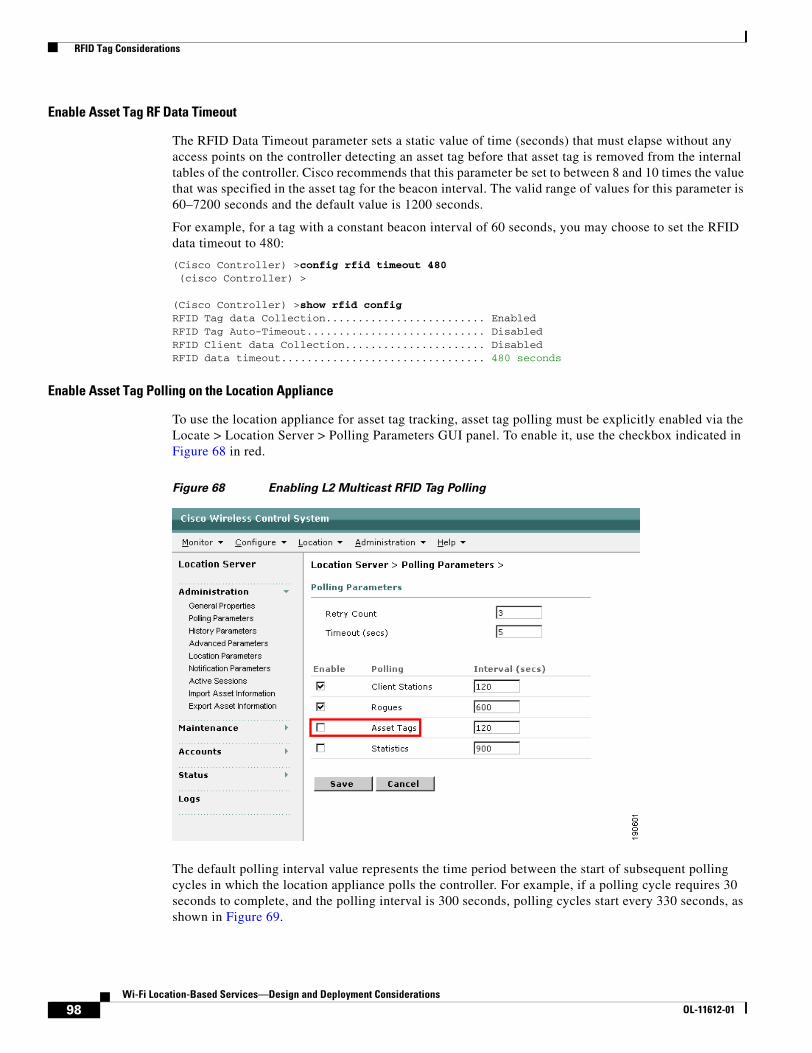
RFID Tag Considerations
Enable Asset Tag RF Data Timeout
The RFID Data Timeout parameter sets a static value of time (seconds) that must elapse without any access points on the controller detecting an asset tag before that asset tag is removed from the internal tables of the controller. Cisco recommends that this parameter be set to between 8 and 10 times the value that was specified in the asset tag for the beacon interval. The valid range of values for this parameter is 60–7200 seconds and the default value is 1200 seconds.
For example, for a tag with a constant beacon interval of 60 seconds, you may choose to set the RFID data timeout to 480:
(Cisco Controller) >config rfid timeout 480 (cisco Controller) >
(Cisco Controller) >show rfid configRFID Tag data Collection......................... EnabledRFID Tag Auto-Timeout............................ DisabledRFID Client data Collection...................... DisabledRFID data timeout................................ 480 seconds
Enable Asset Tag Polling on the Location Appliance
To use the location appliance for asset tag tracking, asset tag polling must be explicitly enabled via the Locate > Location Server > Polling Parameters GUI panel. To enable it, use the checkbox indicated in Figure 68 in red.
Figure 68 Enabling L2 Multicast RFID Tag Polling
The default polling interval value represents the time period between the start of subsequent polling cycles in which the location appliance polls the controller. For example, if a polling cycle requires 30 seconds to complete, and the polling interval is 300 seconds, polling cycles start every 330 seconds, as shown in Figure 69.
98Wi-Fi Location-Based Services—Design and Deployment Considerations
OL-11612-01
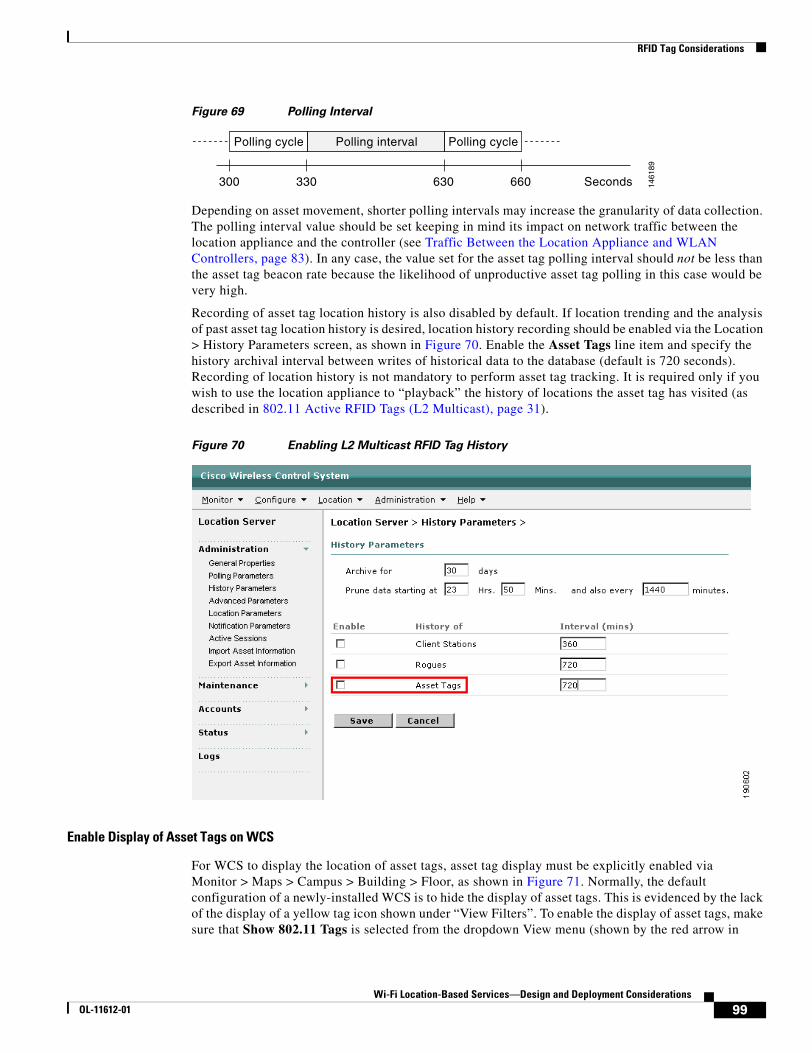
RFID Tag Considerations
Figure 69 Polling Interval
Depending on asset movement, shorter polling intervals may increase the granularity of data collection. The polling interval value should be set keeping in mind its impact on network traffic between the location appliance and the controller (see Traffic Between the Location Appliance and WLAN Controllers, page 83). In any case, the value set for the asset tag polling interval should not be less than the asset tag beacon rate because the likelihood of unproductive asset tag polling in this case would be very high.
Recording of asset tag location history is also disabled by default. If location trending and the analysis of past asset tag location history is desired, location history recording should be enabled via the Location > History Parameters screen, as shown in Figure 70. Enable the Asset Tags line item and specify the history archival interval between writes of historical data to the database (default is 720 seconds). Recording of location history is not mandatory to perform asset tag tracking. It is required only if you wish to use the location appliance to “playback” the history of locations the asset tag has visited (as described in 802.11 Active RFID Tags (L2 Multicast), page 31).
Figure 70 Enabling L2 Multicast RFID Tag History
Enable Display of Asset Tags on WCS
For WCS to display the location of asset tags, asset tag display must be explicitly enabled via Monitor > Maps > Campus > Building > Floor, as shown in Figure 71. Normally, the default configuration of a newly-installed WCS is to hide the display of asset tags. This is evidenced by the lack of the display of a yellow tag icon shown under “View Filters”. To enable the display of asset tags, make sure that Show 802.11 Tags is selected from the dropdown View menu (shown by the red arrow in
300
Polling cycle Polling interval Polling cycle
330 630 660 Seconds 1461
89
99Wi-Fi Location-Based Services—Design and Deployment Considerations
OL-11612-01
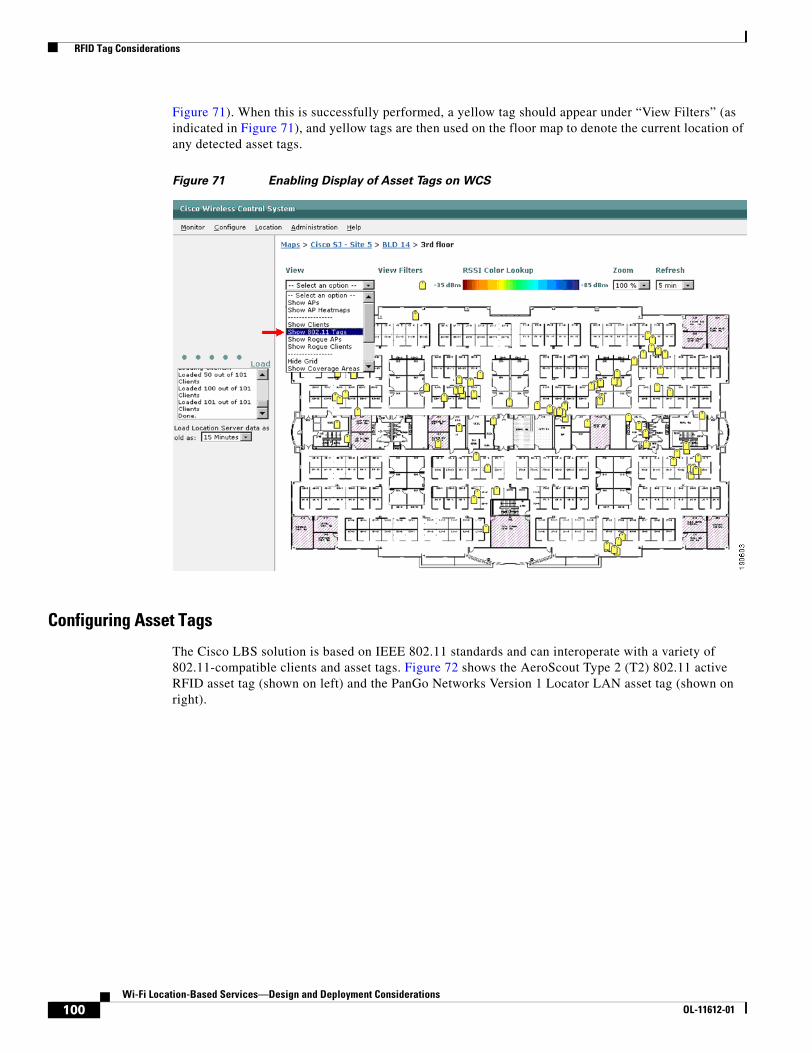
RFID Tag Considerations
Figure 71). When this is successfully performed, a yellow tag should appear under “View Filters” (as indicated in Figure 71), and yellow tags are then used on the floor map to denote the current location of any detected asset tags.
Figure 71 Enabling Display of Asset Tags on WCS
Configuring Asset Tags
The Cisco LBS solution is based on IEEE 802.11 standards and can interoperate with a variety of 802.11-compatible clients and asset tags. Figure 72 shows the AeroScout Type 2 (T2) 802.11 active RFID asset tag (shown on left) and the PanGo Networks Version 1 Locator LAN asset tag (shown on right).
100Wi-Fi Location-Based Services—Design and Deployment Considerations
OL-11612-01
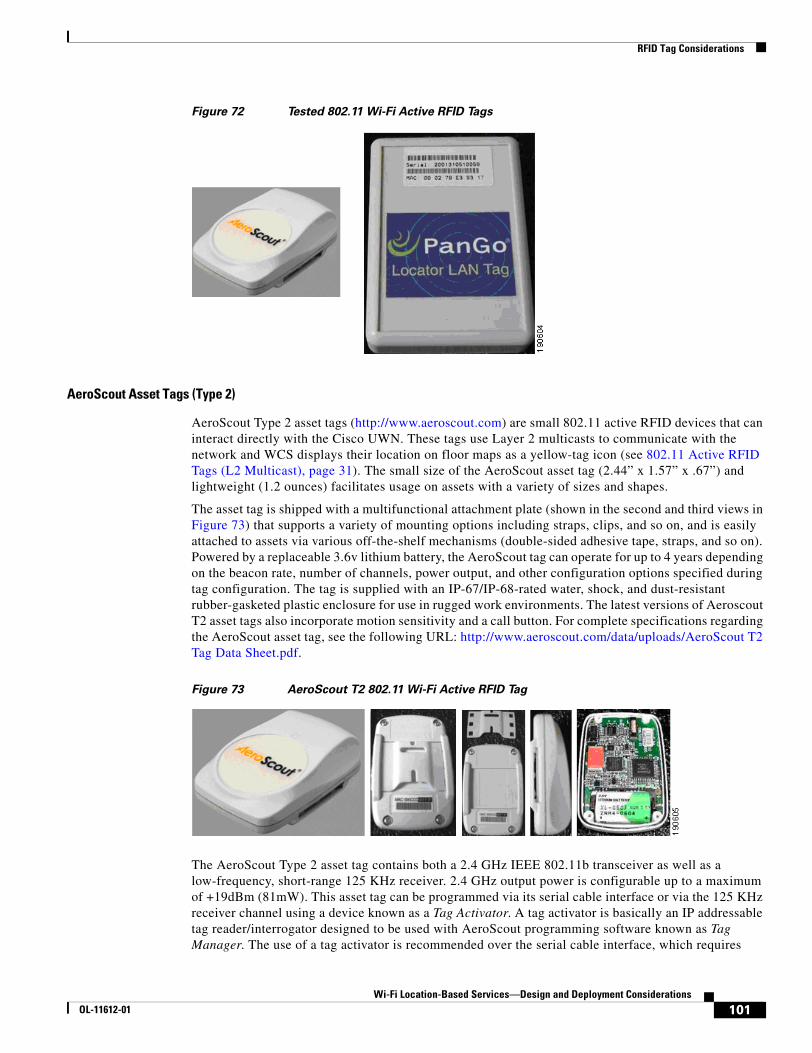
RFID Tag Considerations
Figure 72 Tested 802.11 Wi-Fi Active RFID Tags
AeroScout Asset Tags (Type 2)
AeroScout Type 2 asset tags (http://www.aeroscout.com) are small 802.11 active RFID devices that can interact directly with the Cisco UWN. These tags use Layer 2 multicasts to communicate with the network and WCS displays their location on floor maps as a yellow-tag icon (see 802.11 Active RFID Tags (L2 Multicast), page 31). The small size of the AeroScout asset tag (2.44” x 1.57” x .67”) and lightweight (1.2 ounces) facilitates usage on assets with a variety of sizes and shapes.
The asset tag is shipped with a multifunctional attachment plate (shown in the second and third views in Figure 73) that supports a variety of mounting options including straps, clips, and so on, and is easily attached to assets via various off-the-shelf mechanisms (double-sided adhesive tape, straps, and so on). Powered by a replaceable 3.6v lithium battery, the AeroScout tag can operate for up to 4 years depending on the beacon rate, number of channels, power output, and other configuration options specified during tag configuration. The tag is supplied with an IP-67/IP-68-rated water, shock, and dust-resistant rubber-gasketed plastic enclosure for use in rugged work environments. The latest versions of Aeroscout T2 asset tags also incorporate motion sensitivity and a call button. For complete specifications regarding the AeroScout asset tag, see the following URL: http://www.aeroscout.com/data/uploads/AeroScout T2 Tag Data Sheet.pdf.
Figure 73 AeroScout T2 802.11 Wi-Fi Active RFID Tag
The AeroScout Type 2 asset tag contains both a 2.4 GHz IEEE 802.11b transceiver as well as a low-frequency, short-range 125 KHz receiver. 2.4 GHz output power is configurable up to a maximum of +19dBm (81mW). This asset tag can be programmed via its serial cable interface or via the 125 KHz receiver channel using a device known as a Tag Activator. A tag activator is basically an IP addressable tag reader/interrogator designed to be used with AeroScout programming software known as Tag Manager. The use of a tag activator is recommended over the serial cable interface, which requires
101Wi-Fi Location-Based Services—Design and Deployment Considerations
OL-11612-01
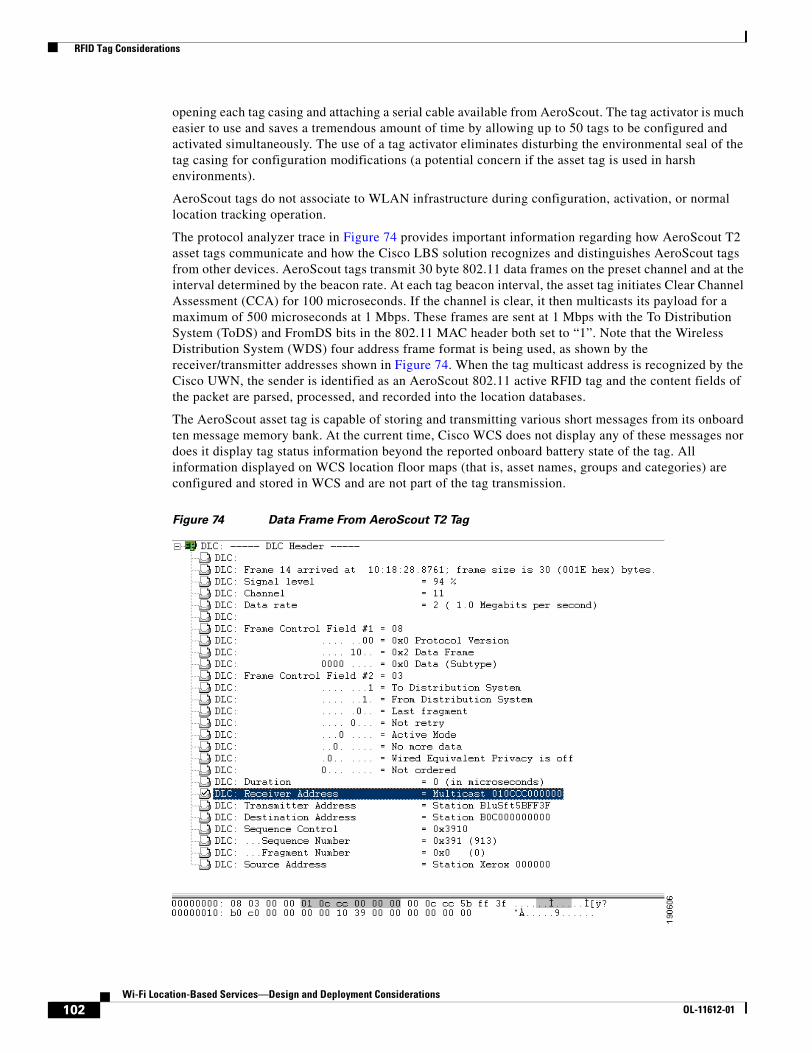
RFID Tag Considerations
opening each tag casing and attaching a serial cable available from AeroScout. The tag activator is much easier to use and saves a tremendous amount of time by allowing up to 50 tags to be configured and activated simultaneously. The use of a tag activator eliminates disturbing the environmental seal of the tag casing for configuration modifications (a potential concern if the asset tag is used in harsh environments).
AeroScout tags do not associate to WLAN infrastructure during configuration, activation, or normal location tracking operation.
The protocol analyzer trace in Figure 74 provides important information regarding how AeroScout T2 asset tags communicate and how the Cisco LBS solution recognizes and distinguishes AeroScout tags from other devices. AeroScout tags transmit 30 byte 802.11 data frames on the preset channel and at the interval determined by the beacon rate. At each tag beacon interval, the asset tag initiates Clear Channel Assessment (CCA) for 100 microseconds. If the channel is clear, it then multicasts its payload for a maximum of 500 microseconds at 1 Mbps. These frames are sent at 1 Mbps with the To Distribution System (ToDS) and FromDS bits in the 802.11 MAC header both set to “1”. Note that the Wireless Distribution System (WDS) four address frame format is being used, as shown by the receiver/transmitter addresses shown in Figure 74. When the tag multicast address is recognized by the Cisco UWN, the sender is identified as an AeroScout 802.11 active RFID tag and the content fields of the packet are parsed, processed, and recorded into the location databases.
The AeroScout asset tag is capable of storing and transmitting various short messages from its onboard ten message memory bank. At the current time, Cisco WCS does not display any of these messages nor does it display tag status information beyond the reported onboard battery state of the tag. All information displayed on WCS location floor maps (that is, asset names, groups and categories) are configured and stored in WCS and are not part of the tag transmission.
Figure 74 Data Frame From AeroScout T2 Tag
102Wi-Fi Location-Based Services—Design and Deployment Considerations
OL-11612-01
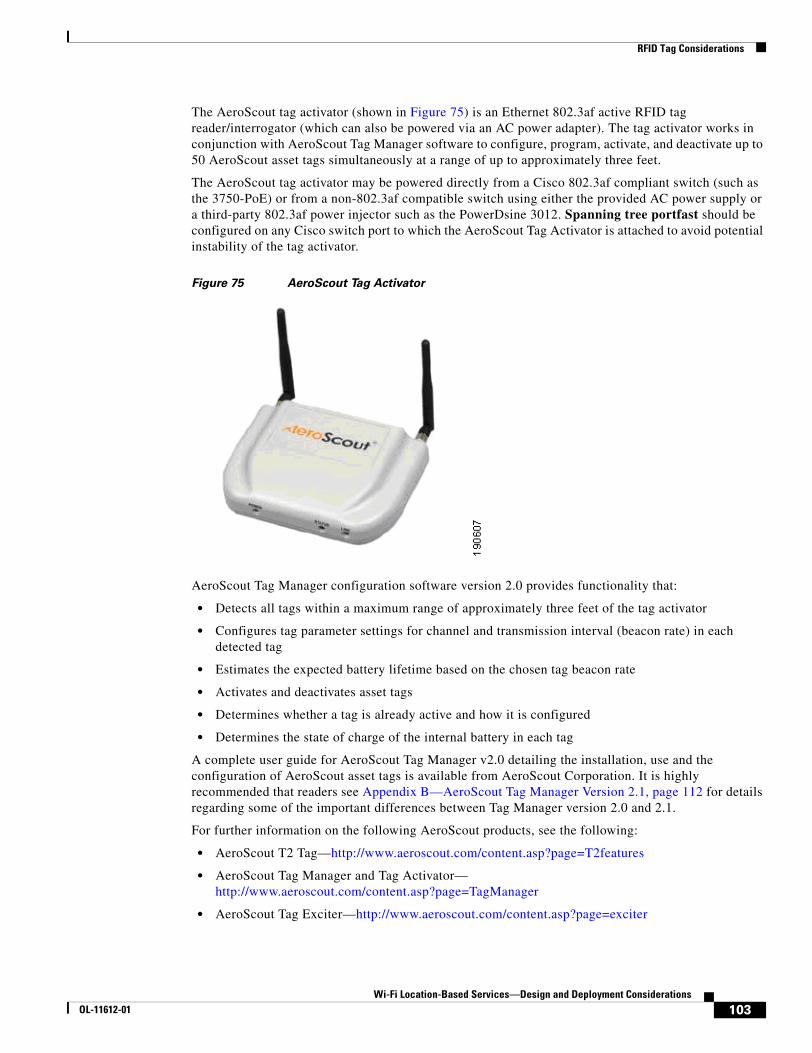
RFID Tag Considerations
The AeroScout tag activator (shown in Figure 75) is an Ethernet 802.3af active RFID tag reader/interrogator (which can also be powered via an AC power adapter). The tag activator works in conjunction with AeroScout Tag Manager software to configure, program, activate, and deactivate up to 50 AeroScout asset tags simultaneously at a range of up to approximately three feet.
The AeroScout tag activator may be powered directly from a Cisco 802.3af compliant switch (such as the 3750-PoE) or from a non-802.3af compatible switch using either the provided AC power supply or a third-party 802.3af power injector such as the PowerDsine 3012. Spanning tree portfast should be configured on any Cisco switch port to which the AeroScout Tag Activator is attached to avoid potential instability of the tag activator.
Figure 75 AeroScout Tag Activator
AeroScout Tag Manager configuration software version 2.0 provides functionality that:
• Detects all tags within a maximum range of approximately three feet of the tag activator
• Configures tag parameter settings for channel and transmission interval (beacon rate) in each detected tag
• Estimates the expected battery lifetime based on the chosen tag beacon rate
• Activates and deactivates asset tags
• Determines whether a tag is already active and how it is configured
• Determines the state of charge of the internal battery in each tag
A complete user guide for AeroScout Tag Manager v2.0 detailing the installation, use and the configuration of AeroScout asset tags is available from AeroScout Corporation. It is highly recommended that readers see Appendix B—AeroScout Tag Manager Version 2.1, page 112 for details regarding some of the important differences between Tag Manager version 2.0 and 2.1.
For further information on the following AeroScout products, see the following:
• AeroScout T2 Tag—http://www.aeroscout.com/content.asp?page=T2features
• AeroScout Tag Manager and Tag Activator— http://www.aeroscout.com/content.asp?page=TagManager
• AeroScout Tag Exciter—http://www.aeroscout.com/content.asp?page=exciter
103Wi-Fi Location-Based Services—Design and Deployment Considerations
OL-11612-01
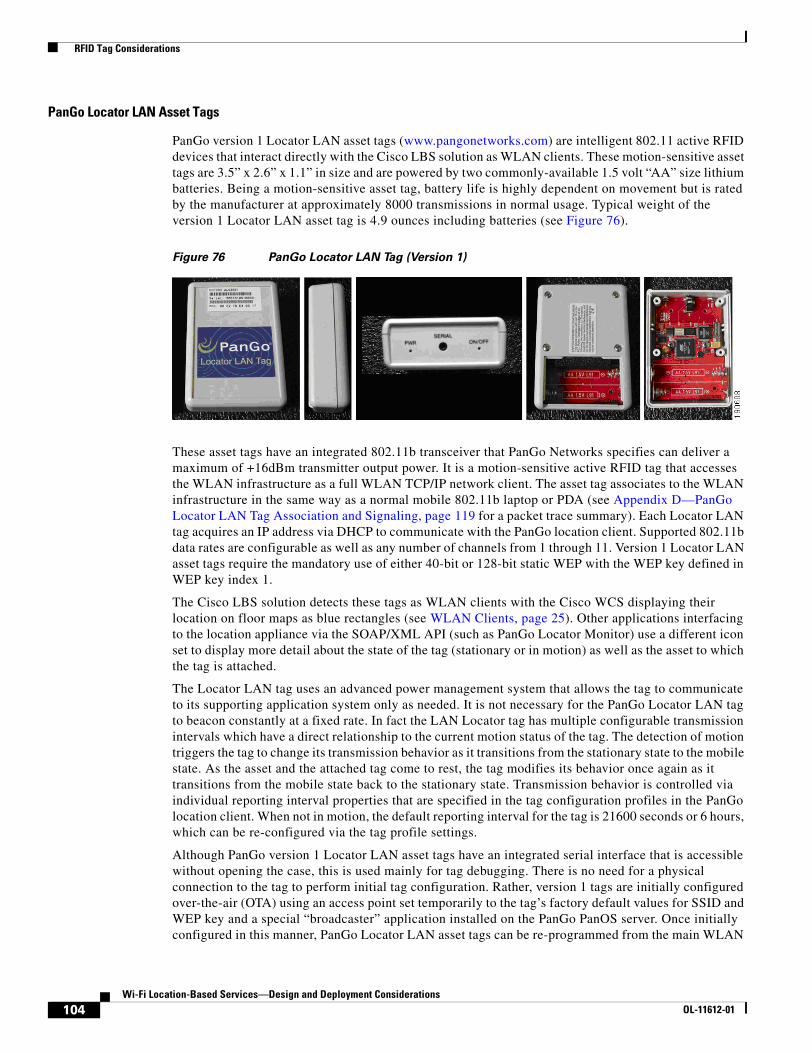
RFID Tag Considerations
PanGo Locator LAN Asset Tags
PanGo version 1 Locator LAN asset tags (www.pangonetworks.com) are intelligent 802.11 active RFID devices that interact directly with the Cisco LBS solution as WLAN clients. These motion-sensitive asset tags are 3.5” x 2.6” x 1.1” in size and are powered by two commonly-available 1.5 volt “AA” size lithium batteries. Being a motion-sensitive asset tag, battery life is highly dependent on movement but is rated by the manufacturer at approximately 8000 transmissions in normal usage. Typical weight of the version 1 Locator LAN asset tag is 4.9 ounces including batteries (see Figure 76).
Figure 76 PanGo Locator LAN Tag (Version 1)
These asset tags have an integrated 802.11b transceiver that PanGo Networks specifies can deliver a maximum of +16dBm transmitter output power. It is a motion-sensitive active RFID tag that accesses the WLAN infrastructure as a full WLAN TCP/IP network client. The asset tag associates to the WLAN infrastructure in the same way as a normal mobile 802.11b laptop or PDA (see Appendix D—PanGo Locator LAN Tag Association and Signaling, page 119 for a packet trace summary). Each Locator LAN tag acquires an IP address via DHCP to communicate with the PanGo location client. Supported 802.11b data rates are configurable as well as any number of channels from 1 through 11. Version 1 Locator LAN asset tags require the mandatory use of either 40-bit or 128-bit static WEP with the WEP key defined in WEP key index 1.
The Cisco LBS solution detects these tags as WLAN clients with the Cisco WCS displaying their location on floor maps as blue rectangles (see WLAN Clients, page 25). Other applications interfacing to the location appliance via the SOAP/XML API (such as PanGo Locator Monitor) use a different icon set to display more detail about the state of the tag (stationary or in motion) as well as the asset to which the tag is attached.
The Locator LAN tag uses an advanced power management system that allows the tag to communicate to its supporting application system only as needed. It is not necessary for the PanGo Locator LAN tag to beacon constantly at a fixed rate. In fact the LAN Locator tag has multiple configurable transmission intervals which have a direct relationship to the current motion status of the tag. The detection of motion triggers the tag to change its transmission behavior as it transitions from the stationary state to the mobile state. As the asset and the attached tag come to rest, the tag modifies its behavior once again as it transitions from the mobile state back to the stationary state. Transmission behavior is controlled via individual reporting interval properties that are specified in the tag configuration profiles in the PanGo location client. When not in motion, the default reporting interval for the tag is 21600 seconds or 6 hours, which can be re-configured via the tag profile settings.
Although PanGo version 1 Locator LAN asset tags have an integrated serial interface that is accessible without opening the case, this is used mainly for tag debugging. There is no need for a physical connection to the tag to perform initial tag configuration. Rather, version 1 tags are initially configured over-the-air (OTA) using an access point set temporarily to the tag’s factory default values for SSID and WEP key and a special “broadcaster” application installed on the PanGo PanOS server. Once initially configured in this manner, PanGo Locator LAN asset tags can be re-programmed from the main WLAN
104Wi-Fi Location-Based Services—Design and Deployment Considerations
OL-11612-01
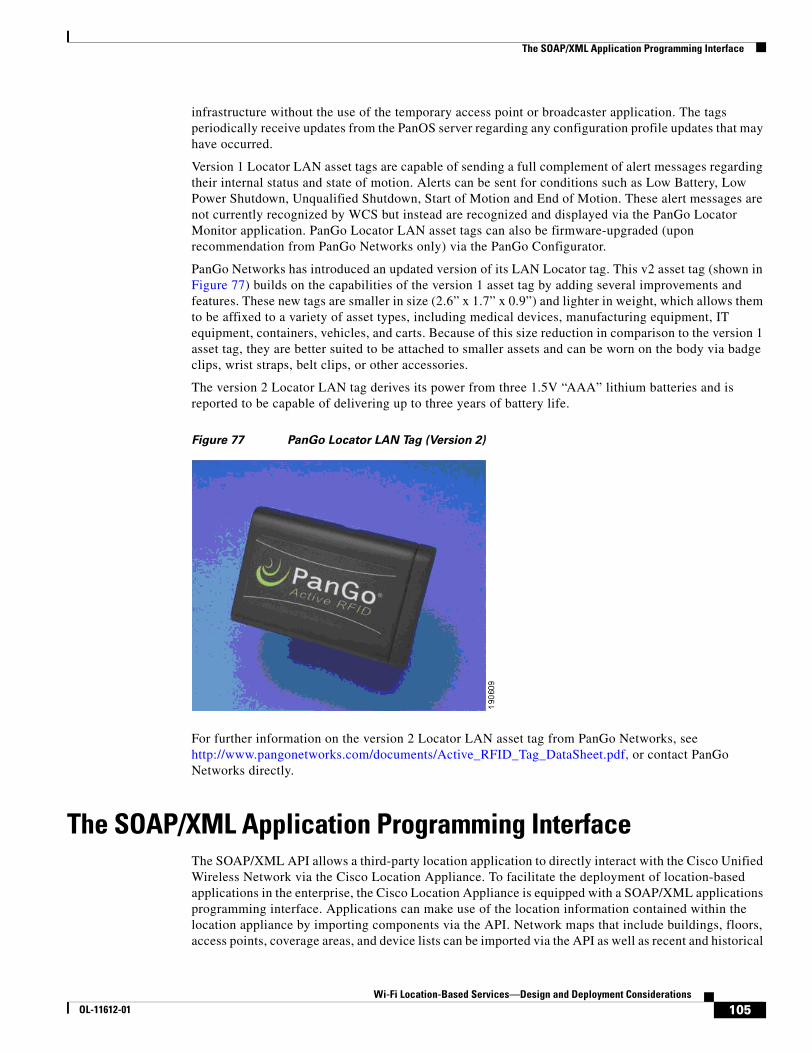
The SOAP/XML Application Programming Interface
infrastructure without the use of the temporary access point or broadcaster application. The tags periodically receive updates from the PanOS server regarding any configuration profile updates that may have occurred.
Version 1 Locator LAN asset tags are capable of sending a full complement of alert messages regarding their internal status and state of motion. Alerts can be sent for conditions such as Low Battery, Low Power Shutdown, Unqualified Shutdown, Start of Motion and End of Motion. These alert messages are not currently recognized by WCS but instead are recognized and displayed via the PanGo Locator Monitor application. PanGo Locator LAN asset tags can also be firmware-upgraded (upon recommendation from PanGo Networks only) via the PanGo Configurator.
PanGo Networks has introduced an updated version of its LAN Locator tag. This v2 asset tag (shown in Figure 77) builds on the capabilities of the version 1 asset tag by adding several improvements and features. These new tags are smaller in size (2.6” x 1.7” x 0.9”) and lighter in weight, which allows them to be affixed to a variety of asset types, including medical devices, manufacturing equipment, IT equipment, containers, vehicles, and carts. Because of this size reduction in comparison to the version 1 asset tag, they are better suited to be attached to smaller assets and can be worn on the body via badge clips, wrist straps, belt clips, or other accessories.
The version 2 Locator LAN tag derives its power from three 1.5V “AAA” lithium batteries and is reported to be capable of delivering up to three years of battery life.
Figure 77 PanGo Locator LAN Tag (Version 2)
For further information on the version 2 Locator LAN asset tag from PanGo Networks, see http://www.pangonetworks.com/documents/Active_RFID_Tag_DataSheet.pdf, or contact PanGo Networks directly.
The SOAP/XML Application Programming InterfaceThe SOAP/XML API allows a third-party location application to directly interact with the Cisco Unified Wireless Network via the Cisco Location Appliance. To facilitate the deployment of location-based applications in the enterprise, the Cisco Location Appliance is equipped with a SOAP/XML applications programming interface. Applications can make use of the location information contained within the location appliance by importing components via the API. Network maps that include buildings, floors, access points, coverage areas, and device lists can be imported via the API as well as recent and historical
105Wi-Fi Location-Based Services—Design and Deployment Considerations
OL-11612-01
The SOAP/XML Application Programming Interface
location and device statistical information. Location-based alarms and notifications can be triggered in applications through area boundary definitions, allowed areas, and distances. All these capabilities allow the SOAP/XML API interface to the Cisco Location Appliance to be used for integration with external software applications such as E911, asset management, enterprise-resource-planning (ERP) tools, and workflow automation systems.
From the perspective of a third-party location-enabled application, the Cisco UWN consists of four basic components:
• Location client—The location client is the recipient (or “user”) of location data that is processed and stored by the location server. This is the role that most third-party location applications assume when interfacing to the Cisco Location Appliance. The primary role of the location client is to serve as the interface for an application or system requiring access to the location and asset information contained on the location server. Location clients may receive information on a request basis (“pull” mode) or they may opt to assume a listening role (“push” mode). In push mode, the location client awaits regular transmissions of location data from the location server based on pre-defined notification criteria (“push” mode).
• Control client—The control client can administer the location server as well as write/read all location data contained on the server. In many cases, this role may be undertaken by the location-enabled Cisco WCS itself. The primary role of the control client is to populate the server with information about the physical environment (network designs, floors maps, calibration models, access point locations, and so on) and the network elements that should be monitored. In some implementations, the control and location clients may be combined into a single integrated physical or logical entity.
• Location server—The location server provides location services for a network or part of a network. Multiple location servers can be deployed. A location server can communicate with multiple client applications in either a monitoring or configuration capacity. In the Cisco LBS solution, the location appliance fulfills the role of the location server.
• Wireless LAN system—The wireless LAN system is comprised of (a) embedded software contained within WLAN controllers that serves as a aggregation point for station/tag/rogue discovery, device tracking, and statistical information, and (b) all the mobile devices (tags, mobile stations, rogue clients, and access points) that serve as key components of the monitored wireless network.
The location appliance API is available and licensable to the Cisco development community along with tools to facilitate solution development. Integration support is available via the Cisco Developer Services Program, a subscription-based service.
Note For complete details, see the following URL: http://www.cisco.com/go/developersupport.
SOAP/XML Partner Location Client Example—PanGo LocatorAn example of a third-party value-added location application that can interface to the Cisco LBS solution is PanGo Locator. PanGo Locator is an asset-tracking client software application that enables enterprise asset visibility via a user interface that is attuned to the needs of the business asset owner and user. It provides a visual display of real-time asset location and related device mobility intelligence, including not only where assets currently are located and where they have been, but their status as they transition from being at rest to being in motion and returning to the at rest state. PanGo Locator includes a rules-based notification component that sends event-triggered alerts to users based on asset location, presence/absence duration, and status. Locator also integrates with workflow automation and business
106Wi-Fi Location-Based Services—Design and Deployment Considerations
OL-11612-01
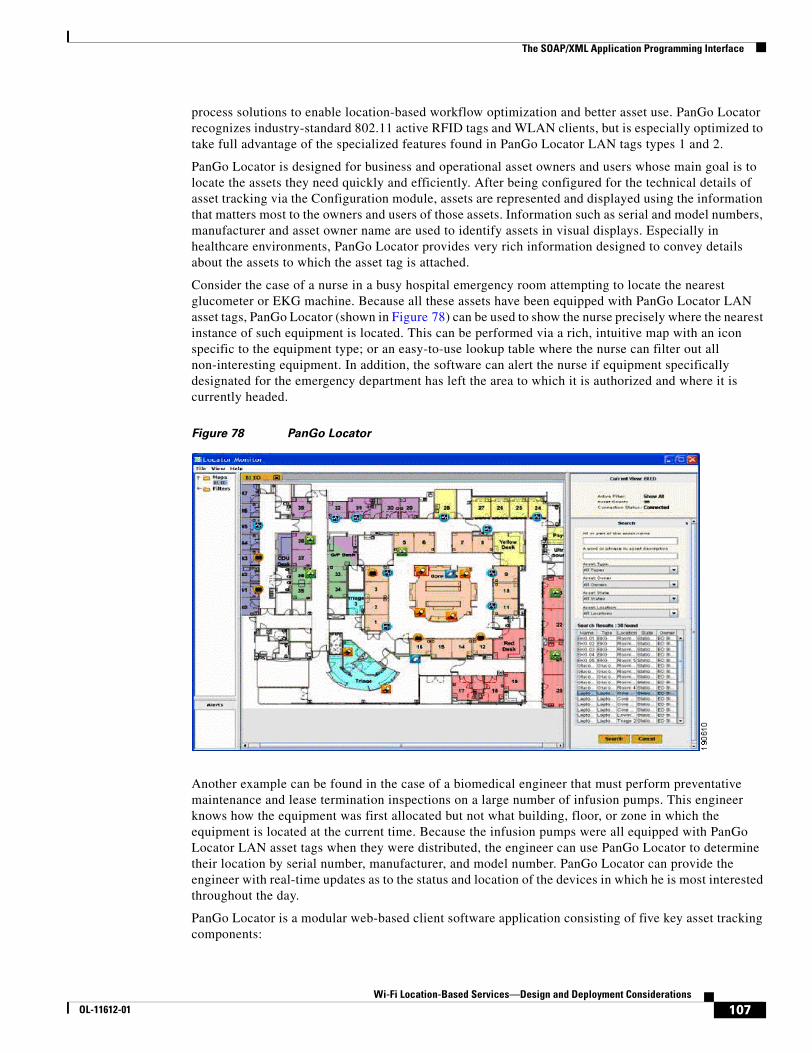
The SOAP/XML Application Programming Interface
process solutions to enable location-based workflow optimization and better asset use. PanGo Locator recognizes industry-standard 802.11 active RFID tags and WLAN clients, but is especially optimized to take full advantage of the specialized features found in PanGo Locator LAN tags types 1 and 2.
PanGo Locator is designed for business and operational asset owners and users whose main goal is to locate the assets they need quickly and efficiently. After being configured for the technical details of asset tracking via the Configuration module, assets are represented and displayed using the information that matters most to the owners and users of those assets. Information such as serial and model numbers, manufacturer and asset owner name are used to identify assets in visual displays. Especially in healthcare environments, PanGo Locator provides very rich information designed to convey details about the assets to which the asset tag is attached.
Consider the case of a nurse in a busy hospital emergency room attempting to locate the nearest glucometer or EKG machine. Because all these assets have been equipped with PanGo Locator LAN asset tags, PanGo Locator (shown in Figure 78) can be used to show the nurse precisely where the nearest instance of such equipment is located. This can be performed via a rich, intuitive map with an icon specific to the equipment type; or an easy-to-use lookup table where the nurse can filter out all non-interesting equipment. In addition, the software can alert the nurse if equipment specifically designated for the emergency department has left the area to which it is authorized and where it is currently headed.
Figure 78 PanGo Locator
Another example can be found in the case of a biomedical engineer that must perform preventative maintenance and lease termination inspections on a large number of infusion pumps. This engineer knows how the equipment was first allocated but not what building, floor, or zone in which the equipment is located at the current time. Because the infusion pumps were all equipped with PanGo Locator LAN asset tags when they were distributed, the engineer can use PanGo Locator to determine their location by serial number, manufacturer, and model number. PanGo Locator can provide the engineer with real-time updates as to the status and location of the devices in which he is most interested throughout the day.
PanGo Locator is a modular web-based client software application consisting of five key asset tracking components:
107Wi-Fi Location-Based Services—Design and Deployment Considerations
OL-11612-01
The SOAP/XML Application Programming Interface
• PanGo Locator Configuration—Define, configure, and manage assets, tags and spaces.
• PanGo Locator Monitor—Visualize, search, and filter assets in maps/floorplans or tabular views.
• PanGo Locator Notifier—Automatically send notifications and alerts based on user-defined, event-driven business rules, including asset location, presence/absence duration, and status.
• PanGo Locator Reporting—Current or historical asset intelligence reports, including location, duration, alerts, and movement.
• PanOS Platform—PanOS Platform is a open, web-based development framework that accepts location data into the PanGo system from the Cisco Location Appliance.
One or more of these modules may be co-resident on a single system or can reside on separate systems.
Cisco and PanGo Networks have worked very closely on the integration of PanGo Locator with the Cisco LBS Solution using the SOAP/XML API facility described previously. These efforts have produced a rich extended-value asset tracking solution for Cisco WLAN environments combining the advantages of a robust and cost-effective location tracking system with a powerful location-tracking software application designed to appeal to the business user.
The solution consists of four key component groups, as shown in Figure 79:
• The Cisco Location Appliance (location server)
• The Cisco Wireless Control System (WCS) licensed for location usage (control client)
• PanGo Locator/PanOS (location client)
• Cisco WLAN controllers and access points, PanGo Locator LAN asset tags, and industry standard 802.11 Wi-Fi WLAN clients
108Wi-Fi Location-Based Services—Design and Deployment Considerations
OL-11612-01
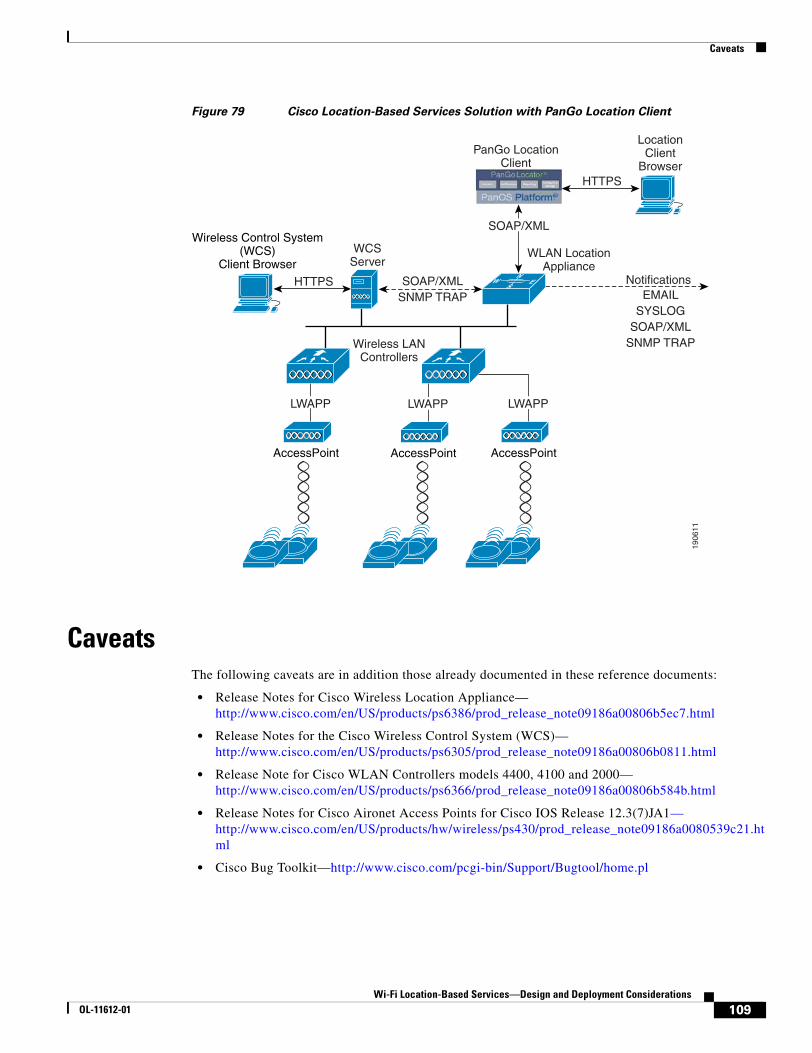
Caveats
Figure 79 Cisco Location-Based Services Solution with PanGo Location Client
CaveatsThe following caveats are in addition those already documented in these reference documents:
• Release Notes for Cisco Wireless Location Appliance— http://www.cisco.com/en/US/products/ps6386/prod_release_note09186a00806b5ec7.html
• Release Notes for the Cisco Wireless Control System (WCS)— http://www.cisco.com/en/US/products/ps6305/prod_release_note09186a00806b0811.html
• Release Note for Cisco WLAN Controllers models 4400, 4100 and 2000— http://www.cisco.com/en/US/products/ps6366/prod_release_note09186a00806b584b.html
• Release Notes for Cisco Aironet Access Points for Cisco IOS Release 12.3(7)JA1— http://www.cisco.com/en/US/products/hw/wireless/ps430/prod_release_note09186a0080539c21.html
• Cisco Bug Toolkit—http://www.cisco.com/pcgi-bin/Support/Bugtool/home.pl
1906
11
Wireless Control System(WCS)
Client Browser
AccessPoint
LocationClient
Browser
WCSServer
WLAN LocationAppliance
SOAP/XMLSNMP TRAP
NotificationsEMAIL
SYSLOGSOAP/XML
SNMP TRAP
AccessPoint AccessPoint
HTTPS
SOAP/XML
LWAPP LWAPP LWAPP
Wireless LANControllers
HTTPSN
W ES
PanGo LocationClient
109Wi-Fi Location-Based Services—Design and Deployment Considerations
OL-11612-01
Caveats
CSCse14724—Degraded Location Accuracy with Monitor Mode APsDegraded accuracy has been observed in lab testing of monitor mode access points when compared to local mode.
CSCse15237—Calibration Data Point Locations Mismatched with Cross-Hair Locations
The calibration model is calibrated after taken all suggested samples at crosshair locations. After “Add Data Points” is used to add additional data points, it is noticed that the pre-existing data points no longer match up with the cross-hair locations (this appears to be a scaling offset error in both the X and Y directions).
110Wi-Fi Location-Based Services—Design and Deployment Considerations
OL-11612-01
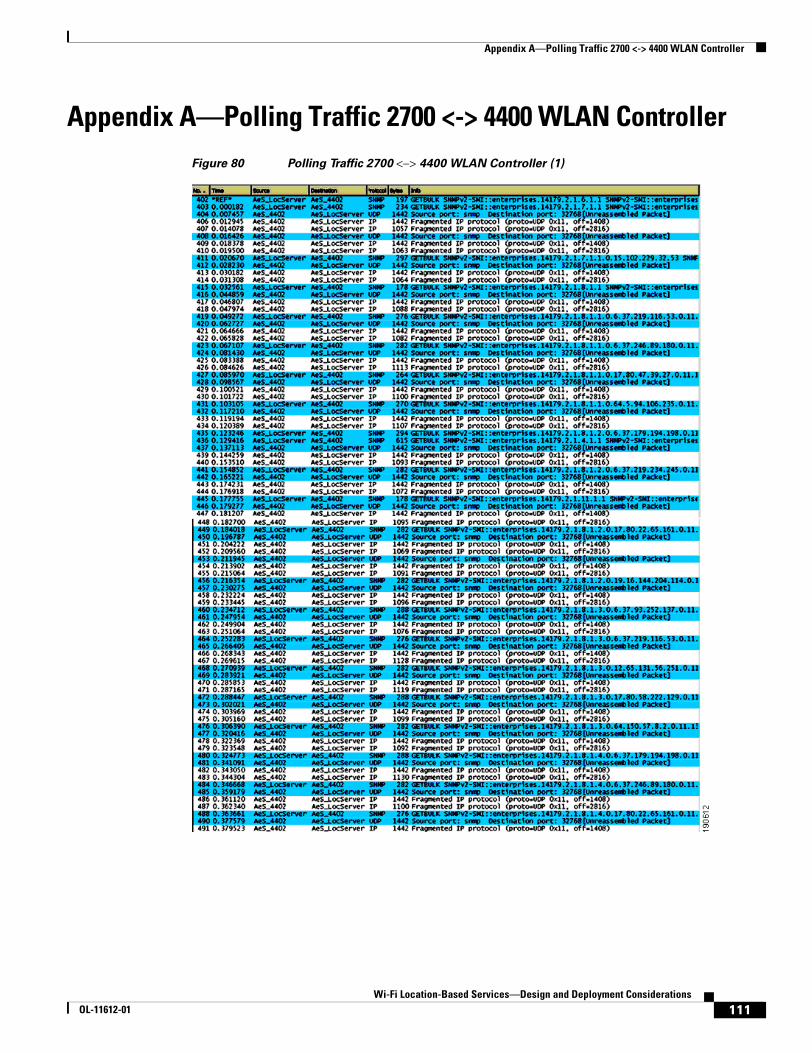
Appendix A—Polling Traffic 2700 <-> 4400 WLAN Controller
Appendix A—Polling Traffic 2700 <-> 4400 WLAN ControllerFigure 80 Polling Traffic 2700 <−> 4400 WLAN Controller (1)
111Wi-Fi Location-Based Services—Design and Deployment Considerations
OL-11612-01
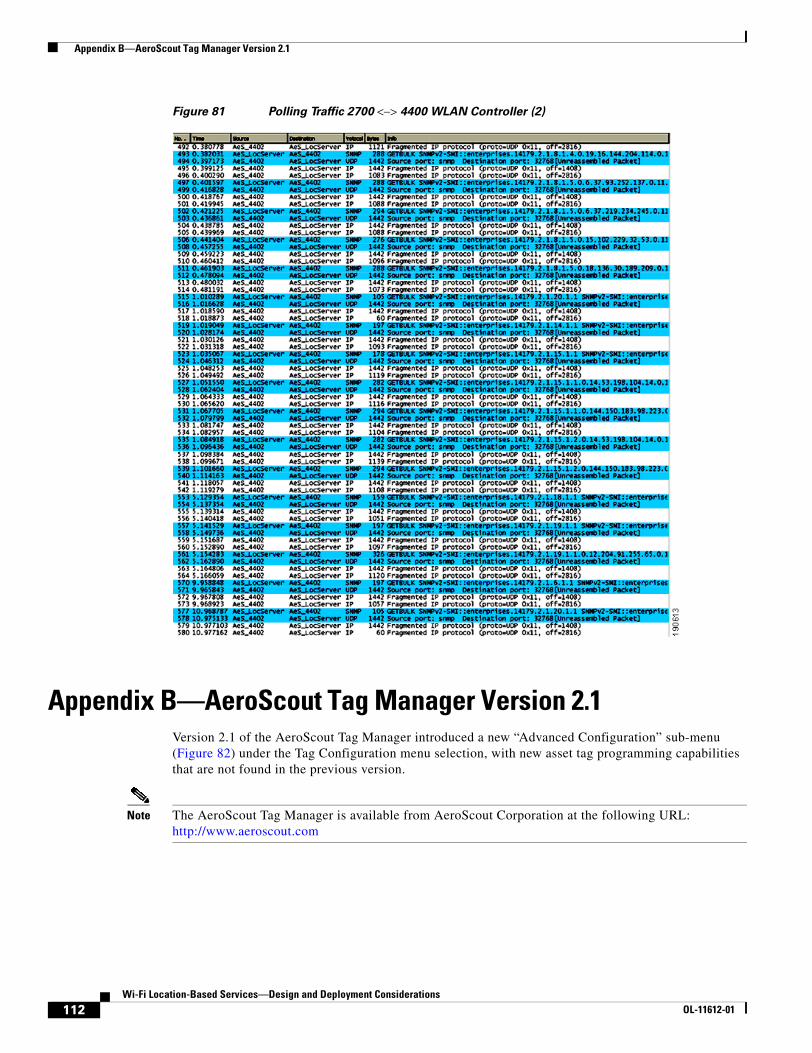
Appendix B—AeroScout Tag Manager Version 2.1
Figure 81 Polling Traffic 2700 <−> 4400 WLAN Controller (2)
Appendix B—AeroScout Tag Manager Version 2.1Version 2.1 of the AeroScout Tag Manager introduced a new “Advanced Configuration” sub-menu (Figure 82) under the Tag Configuration menu selection, with new asset tag programming capabilities that are not found in the previous version.
Note The AeroScout Tag Manager is available from AeroScout Corporation at the following URL: http://www.aeroscout.com
112Wi-Fi Location-Based Services—Design and Deployment Considerations
OL-11612-01
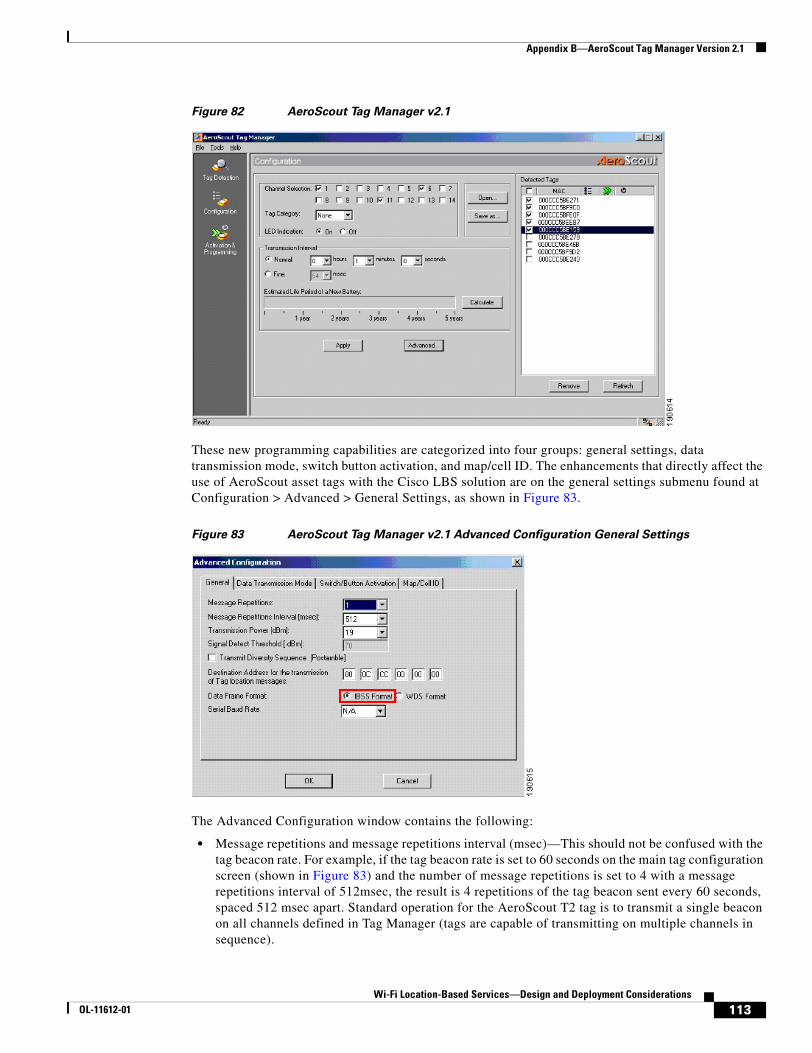
Appendix B—AeroScout Tag Manager Version 2.1
Figure 82 AeroScout Tag Manager v2.1
These new programming capabilities are categorized into four groups: general settings, data transmission mode, switch button activation, and map/cell ID. The enhancements that directly affect the use of AeroScout asset tags with the Cisco LBS solution are on the general settings submenu found at Configuration > Advanced > General Settings, as shown in Figure 83.
Figure 83 AeroScout Tag Manager v2.1 Advanced Configuration General Settings
The Advanced Configuration window contains the following:
• Message repetitions and message repetitions interval (msec)—This should not be confused with the tag beacon rate. For example, if the tag beacon rate is set to 60 seconds on the main tag configuration screen (shown in Figure 83) and the number of message repetitions is set to 4 with a message repetitions interval of 512msec, the result is 4 repetitions of the tag beacon sent every 60 seconds, spaced 512 msec apart. Standard operation for the AeroScout T2 tag is to transmit a single beacon on all channels defined in Tag Manager (tags are capable of transmitting on multiple channels in sequence).
113Wi-Fi Location-Based Services—Design and Deployment Considerations
OL-11612-01
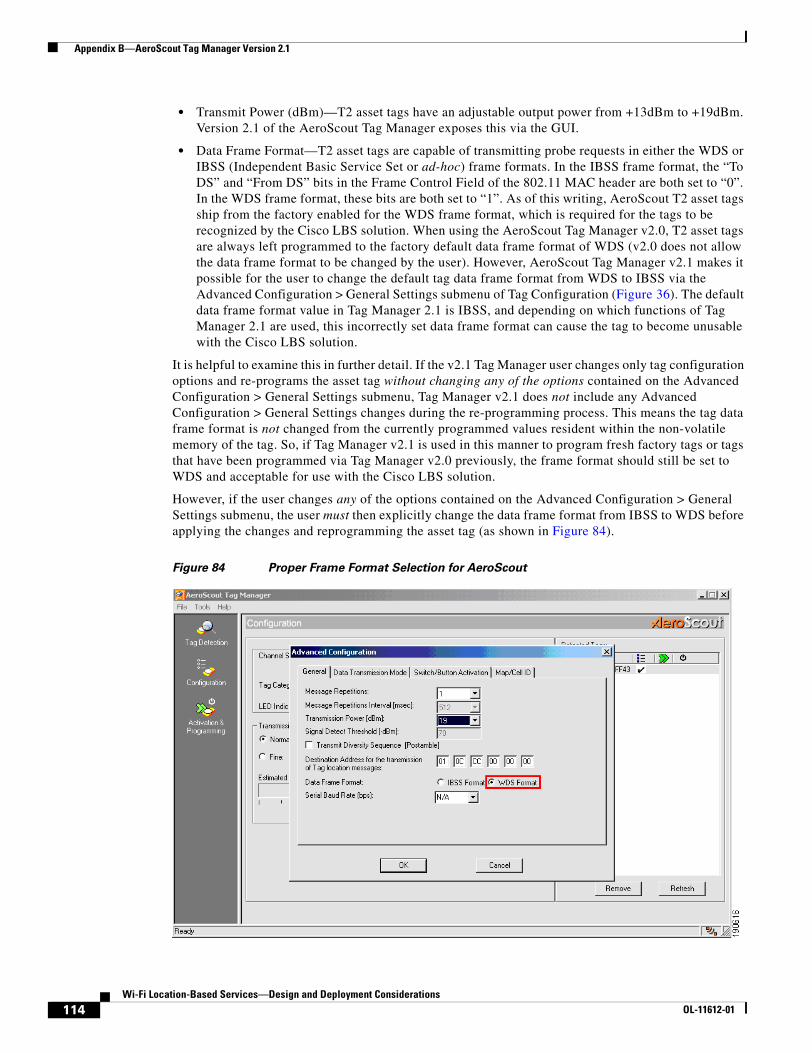
Appendix B—AeroScout Tag Manager Version 2.1
• Transmit Power (dBm)—T2 asset tags have an adjustable output power from +13dBm to +19dBm. Version 2.1 of the AeroScout Tag Manager exposes this via the GUI.
• Data Frame Format—T2 asset tags are capable of transmitting probe requests in either the WDS or IBSS (Independent Basic Service Set or ad-hoc) frame formats. In the IBSS frame format, the “To DS” and “From DS” bits in the Frame Control Field of the 802.11 MAC header are both set to “0”. In the WDS frame format, these bits are both set to “1”. As of this writing, AeroScout T2 asset tags ship from the factory enabled for the WDS frame format, which is required for the tags to be recognized by the Cisco LBS solution. When using the AeroScout Tag Manager v2.0, T2 asset tags are always left programmed to the factory default data frame format of WDS (v2.0 does not allow the data frame format to be changed by the user). However, AeroScout Tag Manager v2.1 makes it possible for the user to change the default tag data frame format from WDS to IBSS via the Advanced Configuration > General Settings submenu of Tag Configuration (Figure 36). The default data frame format value in Tag Manager 2.1 is IBSS, and depending on which functions of Tag Manager 2.1 are used, this incorrectly set data frame format can cause the tag to become unusable with the Cisco LBS solution.
It is helpful to examine this in further detail. If the v2.1 Tag Manager user changes only tag configuration options and re-programs the asset tag without changing any of the options contained on the Advanced Configuration > General Settings submenu, Tag Manager v2.1 does not include any Advanced Configuration > General Settings changes during the re-programming process. This means the tag data frame format is not changed from the currently programmed values resident within the non-volatile memory of the tag. So, if Tag Manager v2.1 is used in this manner to program fresh factory tags or tags that have been programmed via Tag Manager v2.0 previously, the frame format should still be set to WDS and acceptable for use with the Cisco LBS solution.
However, if the user changes any of the options contained on the Advanced Configuration > General Settings submenu, the user must then explicitly change the data frame format from IBSS to WDS before applying the changes and reprogramming the asset tag (as shown in Figure 84).
Figure 84 Proper Frame Format Selection for AeroScout
114Wi-Fi Location-Based Services—Design and Deployment Considerations
OL-11612-01
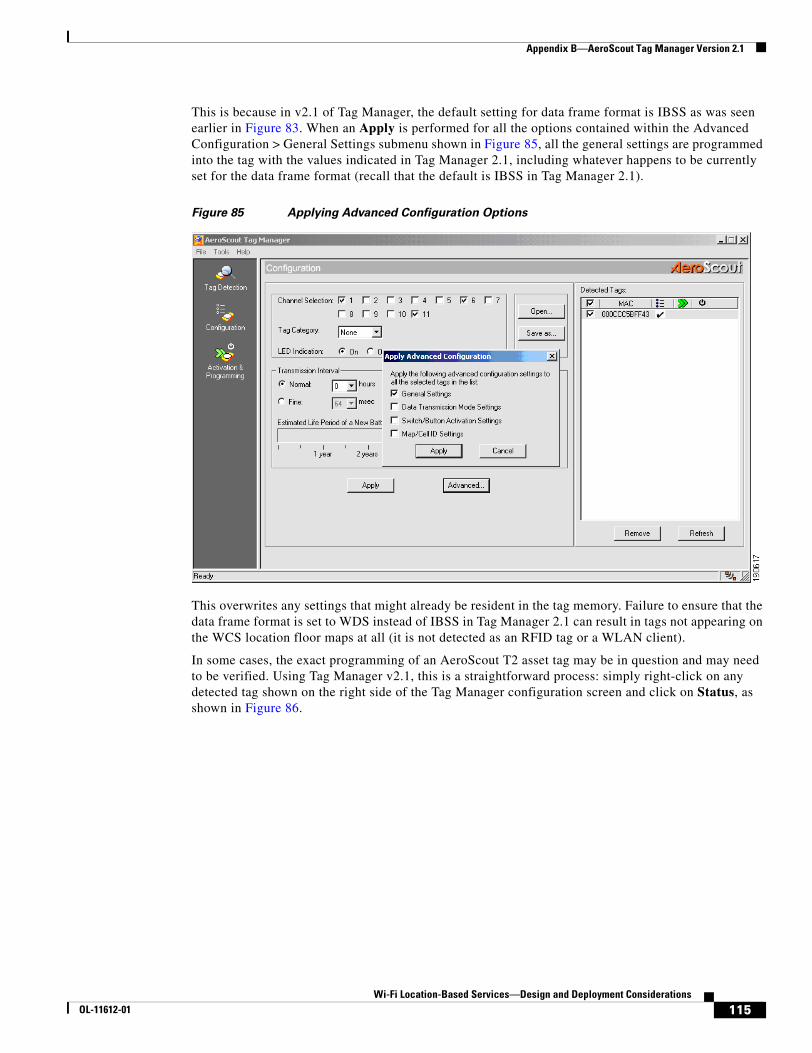
Appendix B—AeroScout Tag Manager Version 2.1
This is because in v2.1 of Tag Manager, the default setting for data frame format is IBSS as was seen earlier in Figure 83. When an Apply is performed for all the options contained within the Advanced Configuration > General Settings submenu shown in Figure 85, all the general settings are programmed into the tag with the values indicated in Tag Manager 2.1, including whatever happens to be currently set for the data frame format (recall that the default is IBSS in Tag Manager 2.1).
Figure 85 Applying Advanced Configuration Options
This overwrites any settings that might already be resident in the tag memory. Failure to ensure that the data frame format is set to WDS instead of IBSS in Tag Manager 2.1 can result in tags not appearing on the WCS location floor maps at all (it is not detected as an RFID tag or a WLAN client).
In some cases, the exact programming of an AeroScout T2 asset tag may be in question and may need to be verified. Using Tag Manager v2.1, this is a straightforward process: simply right-click on any detected tag shown on the right side of the Tag Manager configuration screen and click on Status, as shown in Figure 86.
115Wi-Fi Location-Based Services—Design and Deployment Considerations
OL-11612-01
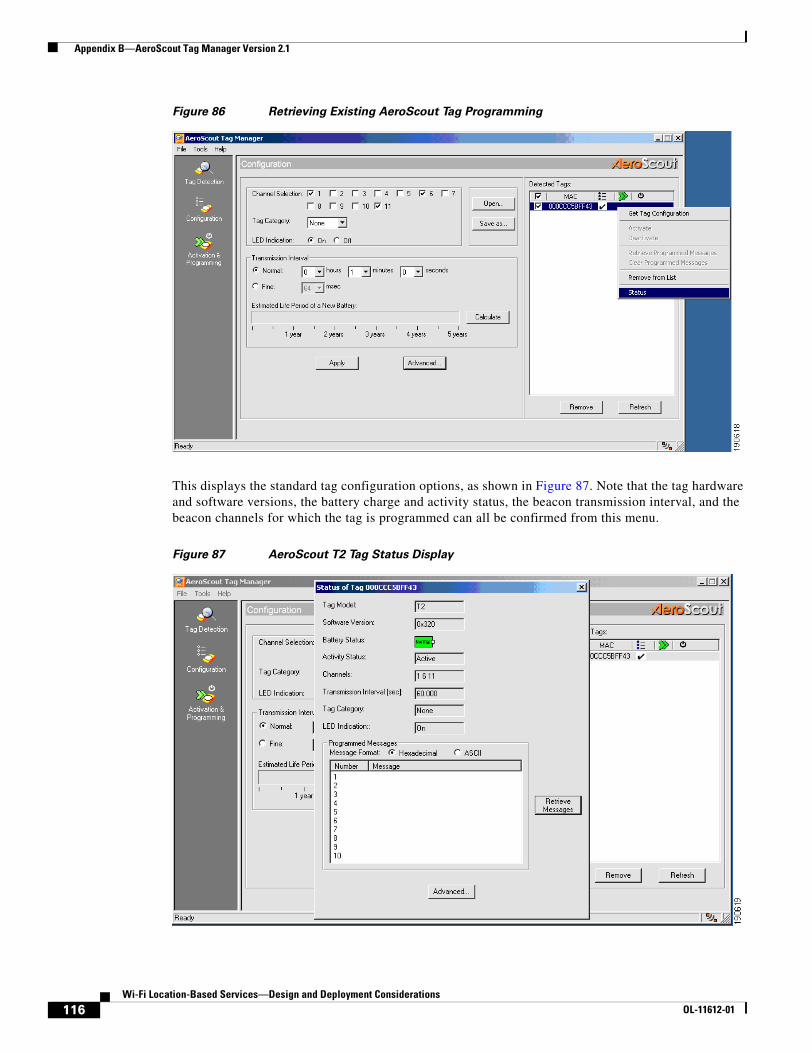
Appendix B—AeroScout Tag Manager Version 2.1
Figure 86 Retrieving Existing AeroScout Tag Programming
This displays the standard tag configuration options, as shown in Figure 87. Note that the tag hardware and software versions, the battery charge and activity status, the beacon transmission interval, and the beacon channels for which the tag is programmed can all be confirmed from this menu.
Figure 87 AeroScout T2 Tag Status Display
116Wi-Fi Location-Based Services—Design and Deployment Considerations
OL-11612-01
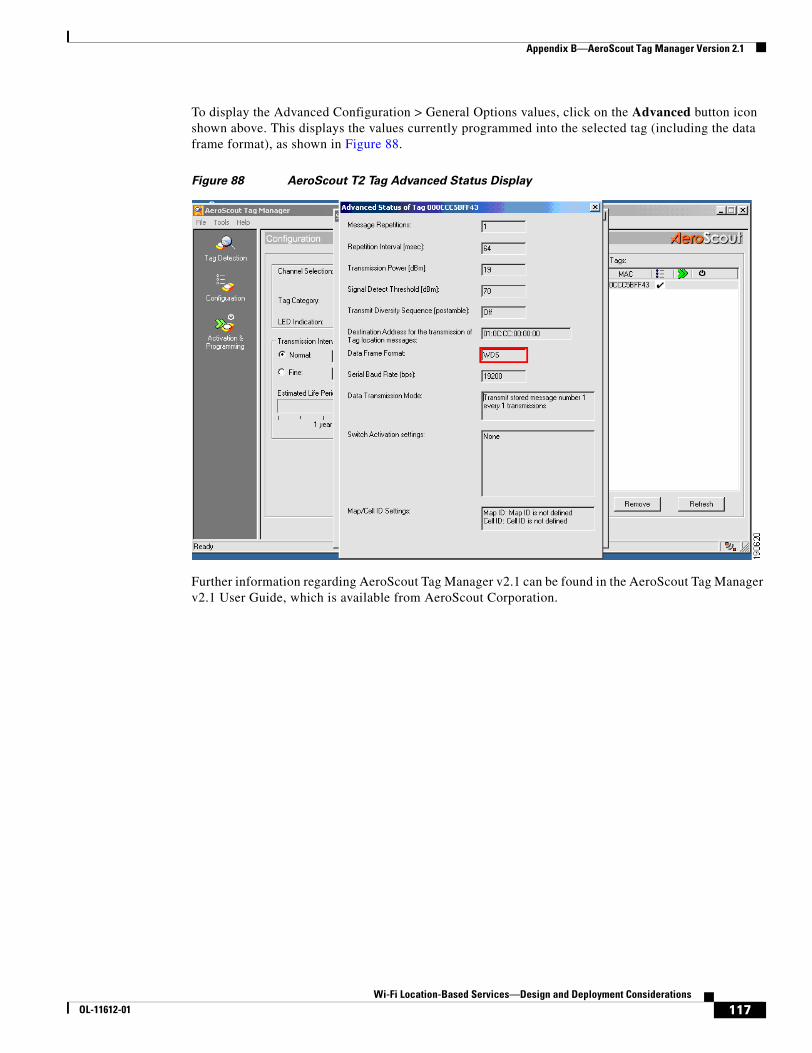
Appendix B—AeroScout Tag Manager Version 2.1
To display the Advanced Configuration > General Options values, click on the Advanced button icon shown above. This displays the values currently programmed into the selected tag (including the data frame format), as shown in Figure 88.
Figure 88 AeroScout T2 Tag Advanced Status Display
Further information regarding AeroScout Tag Manager v2.1 can be found in the AeroScout Tag Manager v2.1 User Guide, which is available from AeroScout Corporation.
117Wi-Fi Location-Based Services—Design and Deployment Considerations
OL-11612-01
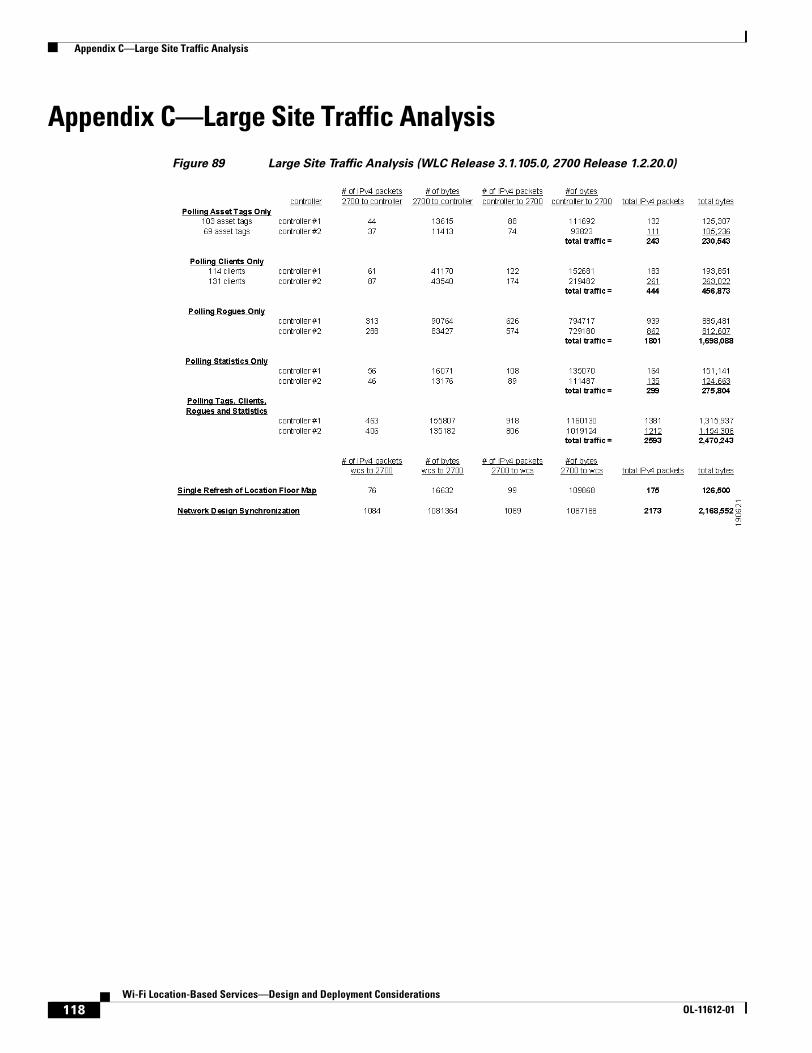
Appendix C—Large Site Traffic Analysis
Appendix C—Large Site Traffic Analysis Figure 89 Large Site Traffic Analysis (WLC Release 3.1.105.0, 2700 Release 1.2.20.0)
118Wi-Fi Location-Based Services—Design and Deployment Considerations
OL-11612-01
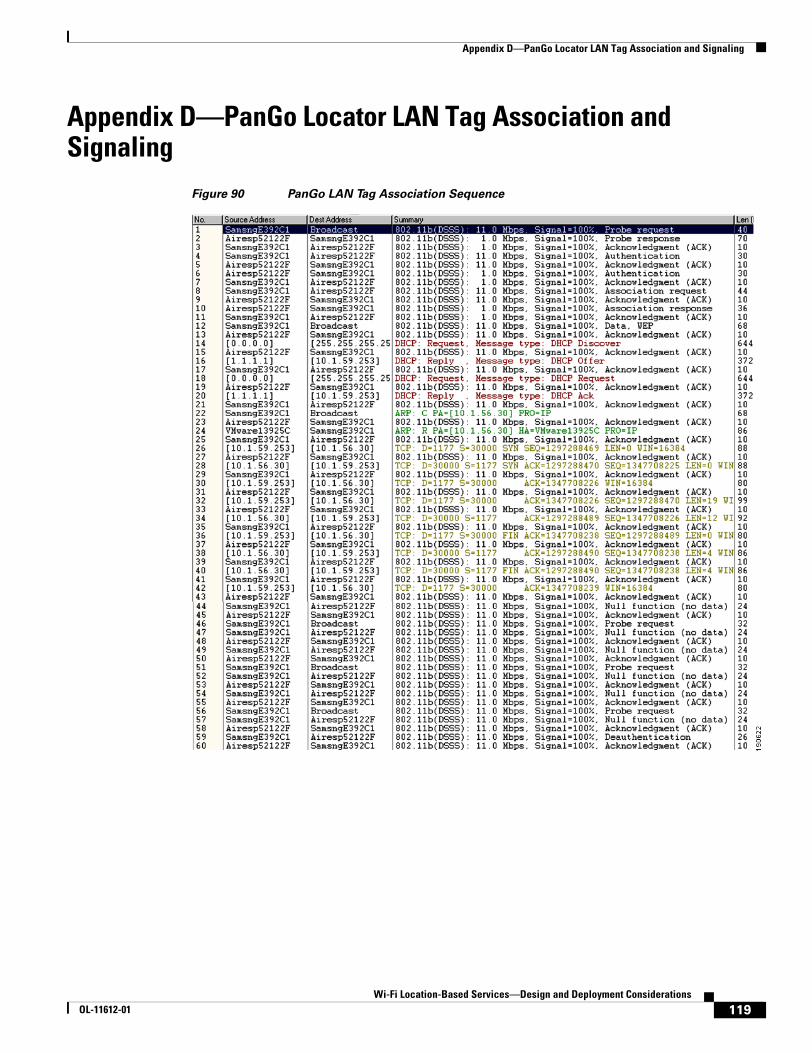
Appendix D—PanGo Locator LAN Tag Association and Signaling
Appendix D—PanGo Locator LAN Tag Association and Signaling
Figure 90 PanGo LAN Tag Association Sequence
119Wi-Fi Location-Based Services—Design and Deployment Considerations
OL-11612-01

Appendix D—PanGo Locator LAN Tag Association and Signaling
120Wi-Fi Location-Based Services—Design and Deployment Considerations
OL-11612-01